


Abstract
The brown planthopper (BPH, Nilaparvata lugens) and white-backed planthopper (WBPH, Sogatella furcifera) are major rice pests, yet WBPH resistance and its overlap with BPH resistance remain poorly defined. Using the Rice Diversity Panel 1 (RDP1), screened against laboratory colonies, we mapped resistance to both pests across three panels and three models (MLM, FarmCPU, BLINK), examined leading loci with the High-Density Rice Array, and mined 3000-genome candidate-gene haplotypes. Resistance correlated weakly between pests (r = 0.26). We identified six BPH and five WBPH candidate loci, all ≥2.38 Mb from cloned Bph genes; correspondence with uncloned QTL cannot be excluded, and the WBPH chromosome 9 locus is the strongest novel candidate. Top signals did not co-locate and candidates shared most defense modules, but neither pattern exceeded chance in permutation testing, and the cross-trait genomic correlation was non-significant (rg = 0.38, SE ≈ 0.33). These loci sit on a background of low genomic heritability; we can neither demonstrate pest-specificity nor exclude a shared polygenic background. Resistance-allele sources were subspecies-differentiated but locus-specific. This is the first parallel diversity-panel genome-wide association study of the two planthoppers and the first for WBPH host resistance. It provides positional candidates and candidate donor haplotypes as a validation-pending breeding resource.
1. Introduction
The brown planthopper (BPH, Nilaparvata lugens) and the white-backed planthopper (WBPH, Sogatella furcifera) are among the most destructive insect pests of rice across Asia. Both are phloem-feeding hemipterans that cause direct feeding damage and “hopperburn,” and WBPH additionally transmits Southern rice black-streaked dwarf virus [1]. Because heavy reliance on insecticides has driven the evolution of metabolic insecticide resistance in these pests [2,3,4,5], host-plant resistance remains the most sustainable component of integrated planthopper management [6,7].
The genetics of BPH resistance is comparatively well developed. Roughly 70–80 resistance loci have been cataloged, depending on the census date [8,9]; these have been mapped to chromosomes 1–4, 6, 8, and 10–12, with the densest clustering on chromosomes 3, 4, 6, and 12 [8], and 17 have so far been cloned [8,9]. These cloned genes span only a few structural families, predominantly coiled-coil nucleotide-binding leucine-rich-repeat (CC-NB-LRR) proteins and lectin receptor kinases (LecRK), together with B3 DNA-binding and other atypical resistance proteins. Functionally they converge on a conserved defense program (signaling through jasmonic acid, salicylic acid and ethylene, Ca2+ and MAPK cascades, and downstream transcriptional reprogramming) that reinforces the cell wall and deposits callose to impede stylet-based phloem feeding [8,10]. Two are especially informative for cross-pest resistance: the Bph3 locus, a tandem array of three lectin receptor kinases effective against both BPH and WBPH [11], and Bph6, an exocyst-associated protein conferring resistance to all tested BPH biotypes and to WBPH without a yield cost [12]. These examples establish that a single resistance gene can act against both planthoppers; that is, resistance mechanisms can be molecularly shared.
In contrast, the host-resistance genetics of WBPH is far less developed. Classical genetic analyses identified several WBPH-resistance genes (Wbph1–Wbph6(t), plus Wbph7(t) and Wbph8(t) introgressed from wild Oryza officinalis, a species that has likewise yielded BPH-resistance introgression lines [13]), and biparental studies have mapped WBPH-resistance QTL to most rice chromosomes, including 2, 3, 4, 5, 6, 11 and 12 [14,15,16,17]. Cross-pest overlap is also evident on the WBPH side: Wbph7(t) and Wbph8(t) co-locate with the BPH loci Qbp1 and Qbp2 on chromosomes 3 and 4 [14]. Nonetheless, most WBPH loci remain uncloned and defined only at linkage resolution, and much of the recent WBPH literature concerns the insect’s own insecticide resistance, virus transmission and induced-defense chemistry [1,2,3,18,19]. WBPH host resistance has not been dissected by genome-wide association studies (GWAS) in a worldwide diversity panel, leaving open whether the two pests share or use distinct loci.
GWAS in diverse germplasm are well suited to dissecting such natural variation, and have been applied to BPH resistance [20,21,22]. Combining a structure-controlling mixed model with multi-locus models (FarmCPU, BLINK) and stratifying by subpopulation reduces the confounding effects of indica–japonica structure that are pronounced in worldwide panels such as the Rice Diversity Panel 1 (RDP1) [23]. At the same time, the 3000 Rice Genomes Project (3K RGP) and its allele-mining resources now enable candidate resistance haplotypes to be traced across subspecies and converted into candidate donors for marker-assisted selection [24,25,26].
Here, we use RDP1 to map resistance to BPH and WBPH in parallel across three panels (whole, indica, and japonica) and three models (MLM, FarmCPU, and BLINK), examine the leading loci at higher marker density with the 700 K High-Density Rice Array, and mine candidate-gene haplotypes in the 3K RGP. We ask whether the two resistances map to overlapping or distinct loci, whether their candidate genes draw on shared defense-mechanism modules, and whether resistance is enriched in indica and can therefore supply candidate breeding donors. Rather than asserting locus- and mechanism-level patterns, we test them against explicit permutation nulls calibrated to the number of loci and the available mapping power. This approach yields six BPH and five WBPH candidate loci, sub-megabase support intervals at two BPH loci, and locus-specific candidate donor haplotypes.
2. Materials and Methods
2.1. Plant Materials and Subpopulation Grouping
The Rice Diversity Panel 1 (RDP1), an open-access collection representing worldwide Oryza sativa diversity [23,27], was used for association mapping. RDP1 accessions are classified into indica, aus, temperate japonica, tropical japonica and aromatic subpopulations, with accessions not assigned to any subpopulation defined as admixed [23]. Following genetic relatedness [28] and to control for the strong indica–japonica differentiation of RDP1 while retaining subgroup-level mapping power, association analyses were performed on three panels: the whole panel (all accessions), the indica subgroup (indica + aus), and the japonica subgroup (temperate + tropical japonica). BPH resistance was scored for 372 accessions and WBPH resistance for 365 accessions (365 accessions scored for both; 364 with both phenotypes and genotype, the set used for the cross-trait and association analyses; Table S1).
2.2. Evaluation of Planthopper Resistance
Resistance of RDP1 accessions to BPH and WBPH was evaluated using a Modified Seedbox Screening Test (MSST) scored on the Standard Evaluation System (SES) scale (0–9), where lower scores indicate greater resistance [29]. Both pests were evaluated in 2016 in a single greenhouse screening, with the BPH and WBPH tests conducted concurrently on the same panel. Screening was carried out in seedboxes measuring 130 × 100 × 10 cm (L × W × H), filled with paddy soil to just under the rim. For each accession, twenty pre-germinated seeds were sown as a single row running in from the box edge, and every accession was represented by three such rows across the experiment. Row positions for the accessions were assigned by randomization within every seedbox, and this randomization was carried out independently for each replicate. To monitor infestation pressure, the susceptible check TN1 was included both as a strip crossing the center of the box at right angles to the rows and as border rows at either end. The seedlings were left to grow for seven days, after which each row was thinned to ten plants. Seven days later, they were infested with first- to second-instar planthopper nymphs at a rate of eight nymphs per seedling. The experiment was terminated once the susceptible checks in the MSST had wilted completely from planthopper feeding, and the seedlings were then scored on the SES scale, where 0 = no damage, 1 = slight damage to a few plants within a row, 3 = first and second leaves of each plant partially yellowing, 5 = pronounced yellowing or stunting of the plants or between 10 and 25% of plants wilted within a row, 7 = more than 50% of the plants wilted or dead and the remaining plants severely stunted or dying, and 9 = all plants wilted or dead.
The BPH population (biotype 1) and the WBPH population were originally obtained from Chiayi Agricultural Experiment Station, TARI, COA (now Ministry of Agriculture), Taiwan; the biotype-1 designation follows the bioassay-based characterization of Taiwanese BPH populations [7]. Laboratory colonies of a defined biotype were used rather than field-collected insects because field populations of N. lugens comprise a mixture of biotypes and are therefore unsuitable for screening resistance genes. These planthoppers were mass-reared on TN1 seedlings in fine-meshed cages at 25 ± 2 °C under a 12 h light/12 h dark photoperiod.
2.3. Genotypic Data
The 44 K single nucleotide polymorphism (SNP) dataset for RDP1 (MSU7/IRGSP-1.0 coordinates) was obtained from https://www.ricediversity.org [23]. SNPs with a call rate < 0.90 or minor allele frequency (MAF) < 0.05 were excluded, leaving 35,527 and 35,588 SNPs for the BPH and WBPH whole panels, respectively. For regional association mapping, high-density genotypes from the High-Density Rice Array (HDRA, ~700 K SNPs) [30] were used. For haplotype analysis of candidate genes, whole-genome variant calls from the 3000 Rice Genomes Project (3K RGP) [31] were queried.
2.4. Genome-Wide Association Mapping
Association mapping was conducted in GAPIT [32] (v4.1.0) using three complementary models: a mixed linear model (MLM) with kinship (K) and the first four principal components as covariates (Q + K) to control population structure [33], and the multi-locus models FarmCPU [34] and BLINK [35] for improved detection power. Principal components and the VanRaden kinship matrix were computed within GAPIT from the 44 K genotypes. Each of the two traits (BPH, WBPH) was analyzed across the three panels with the three models. Genomic inflation was assessed by the genomic control factor (λGC) from the MLM. Marker–trait associations were declared significant at a false discovery rate (FDR) < 0.05 (Benjamini–Hochberg); a suggestive threshold of −log10p = 2.8 was additionally used only to nominate loci for follow-up in the smaller subgroup panels (every locus reported in Section 3.3 meets FDR < 0.05; none rests on the suggestive threshold alone). The FDR was controlled within each of the 18 panel × model × trait analyses rather than study-wide, so a locus significant in a single scan carries a higher study-wide false discovery rate than its within-scan FDR implies. Single-scan loci (identified in Section 3.3) are therefore treated as suggestive pending independent confirmation, whereas the WBPH chromosome 9 locus, recovered concordantly by all three models, is the most robust. Lead SNPs on the same chromosome were merged into a single locus when they lay within 0.3 Mb of one another or were in high linkage disequilibrium (r2 ≥ 0.8) in the 44 K panel; the latter criterion merged the two chromosome 4 WBPH lead SNPs 570 kb apart (r2 = 1.00, with no recombinants among the 377 accessions genotyped at both). Manhattan and quantile–quantile (Q–Q) plots were generated in R.
2.5. Candidate Gene Identification
For each significant or suggestive lead SNP, a ±200 kb window was scanned against the IRGSP-1.0 gene models (Rice Annotation Project Database; RAP-DB) [36,37]. Genes were annotated for defense-related function using a keyword classifier that assigned each gene to one of nine mechanism modules (recognition: NB-LRR; recognition: receptor-like kinase/Pti; signaling: kinase/Ca2+; signaling: transcription factor; phytohormone; secondary metabolism; oxidative/cell-wall; anti-feeding: protease inhibitor; detoxification/transport). Lead loci were compared with the map positions of cloned Bph genes compiled from recent reviews [8,9], verified against IRGSP-1.0 where a RAP-DB identifier was available.
2.6. Regional Association Mapping with the HDRA Array
Broad 44 K peaks were re-examined at higher marker density using HDRA genotypes. SNPs within each candidate region were extracted with PLINK v1.9 [38] (--recode A), and each SNP dosage was tested against the phenotype by linear regression including the first four principal components as covariates (y ~ PC1–PC4 + dosage). Support intervals were defined by an approximate 1-LOD drop from the regional peak.
2.7. Heritability
Each accession was scored in three seedbox replicates within a single screening, and the replicate-level scores were retained for both pests; these are provided in Table S1B. Broad-sense heritability was estimated for each trait from a one-way random-effects analysis of variance of SES on accession as H2 = Vg/(Vg + Ve) on a single-observation basis and as Vg/(Vg + Ve/r) on the accession-mean basis used for mapping (r = 3); exact 95% confidence intervals were derived from the F distribution, and the variance components were cross-checked by REML (lme4 v2.0-1 [39]). Because the three replicates were seedboxes within one screening rather than independent environments, this quantity is a within-screening broad-sense heritability (that is, a repeatability) and does not include genotype-by-environment interaction. For both pests the replicate means reproduced the accession-level phenotypes used for mapping exactly (372 of 372 accessions for BPH and 365 of 365 for WBPH), confirming that the retained replicate scores are the source of the mapped phenotypes. Association mapping used the accession-level mean for both traits. Genomic (SNP-based) heritability was computed for both traits: a genomic relationship matrix was built from the QC-filtered 44 K markers with the A.mat function of rrBLUP v4.6.3 [40], and variance components were estimated by REML with mixed.solve; genomic heritability was calculated as h2g = Vu/(Vu + Ve). Standard errors and 95% confidence intervals for h2g were obtained by parametric bootstrap (B = 200), simulating phenotypes from the fitted variance components under the genomic relationship matrix and re-estimating h2g in each replicate.
2.8. Candidate-Gene Haplotype Analysis in the 3K Rice Genomes
Gene-level haplotypes (combinations of variants across the gene body and flanking regulatory regions, with no functional effect implied) of selected candidate genes were reconstructed from 3K RGP variants using geneHapR v1.2.5 [41]. Haplotypes were cross-tabulated against 3K subspecies groups to describe the subpopulation distribution of resistance-associated haplotypes and to compile lists of accessions carrying each haplotype as a candidate, validation-pending donor resource. Per-accession haplotype assignments at the candidate loci can be reproduced from, or queried directly in, the public 3K RGP genotypes (Rice SNP-Seek Database, IRRI; https://snp-seek.irri.org).
2.9. Permutation Tests of Locus Non-Overlap and Mechanism-Module Sharing and Cross-Trait Power
Two resampling analyses evaluated whether the observed patterns exceeded chance. First, to test whether the genome-wide non-overlap of BPH and WBPH loci was greater than expected at random, the six BPH and five WBPH lead loci were placed at random positions 20,000 times, with probability proportional to IRGSP-1.0 chromosome length. This placement ignores within-chromosome heterogeneity in gene density and recombination and is therefore mildly anti-conservative for collision probability, a direction that does not affect the “no excess overlap” conclusion. For each permutation, the number of cross-trait locus pairs falling on the same chromosome within a collision window (0.5, 1 and 2 Mb) was counted, and the resulting empirical distribution was compared with the observed value (zero) and with the analytic expectation nBPH·nWBPH·2D/L. Cross-trait detection power was approximated for each locus from its discovery effect size (a) and minor allele frequency (p) as a non-central χ2 test (1 d.f.; non-centrality N·PVE/(1 − PVE), with PVE = 2p(1 − p)a2/σ2 and σ the trait SES standard deviation) at a genome-wide Bonferroni threshold (0.05/35,588), using the other trait’s whole-panel sample size; because discovery effect sizes are upward-biased (winner’s curse), these powers are upper bounds. Second, to test whether the sharing of defense-mechanism modules exceeded background, matched random locus sets (the same number of loci per trait, placed as above) were analyzed through the identical ±200 kb extraction and nine-module classifier 2000 times. The observed number of shared modules, the cosine similarity of the two pests’ module-count profiles, and the total number of defense-annotated genes were each compared with the null distribution to obtain empirical p-values.
2.10. Statistical Analysis
Phenotypic differences among subpopulations were summarized by descriptive statistics. The relationship between BPH and WBPH resistance was assessed by Pearson and Spearman correlation among the accessions with both phenotypes and 44 K genotype data (n = 364). Allele-effect boxplots of SES by lead-SNP genotype at the lead candidate loci and genome-wide linkage-disequilibrium decay by subpopulation (r2 versus distance, 25 kb bins) were computed from the 44 K genotypes. The cross-trait genomic correlation between BPH and WBPH resistance was estimated by bivariate REML (sommer v4.4.5 [42]) from a 44 K genomic relationship matrix on the 364 accessions with both phenotypes, and is reported with the significance of its underlying genetic covariance and a delta-method standard error. Allele-effect plots (Figure S1) were corrected for population structure by residualizing SES on the first four principal components, and the resistance allele’s subpopulation frequencies were tabulated. Analyses were performed in R.
2.11. Software and Reproducibility
All analyses were performed in R 4.6.0 [43] with Bioconductor 3.23; data handling, annotation, and visualization were performed using standard R/Bioconductor packages. Full software versions and the complete package inventory are archived with the analysis scripts (see Data Availability Statement).
3. Results
3.1. Phenotypic Variation in BPH and WBPH Resistance Across RDP1
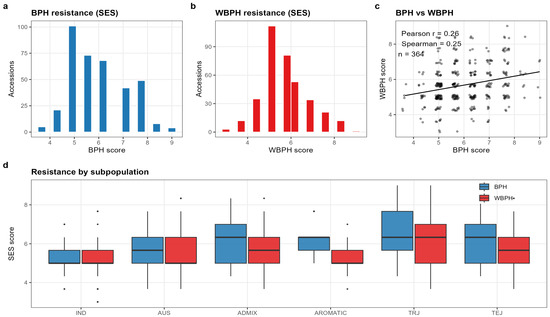
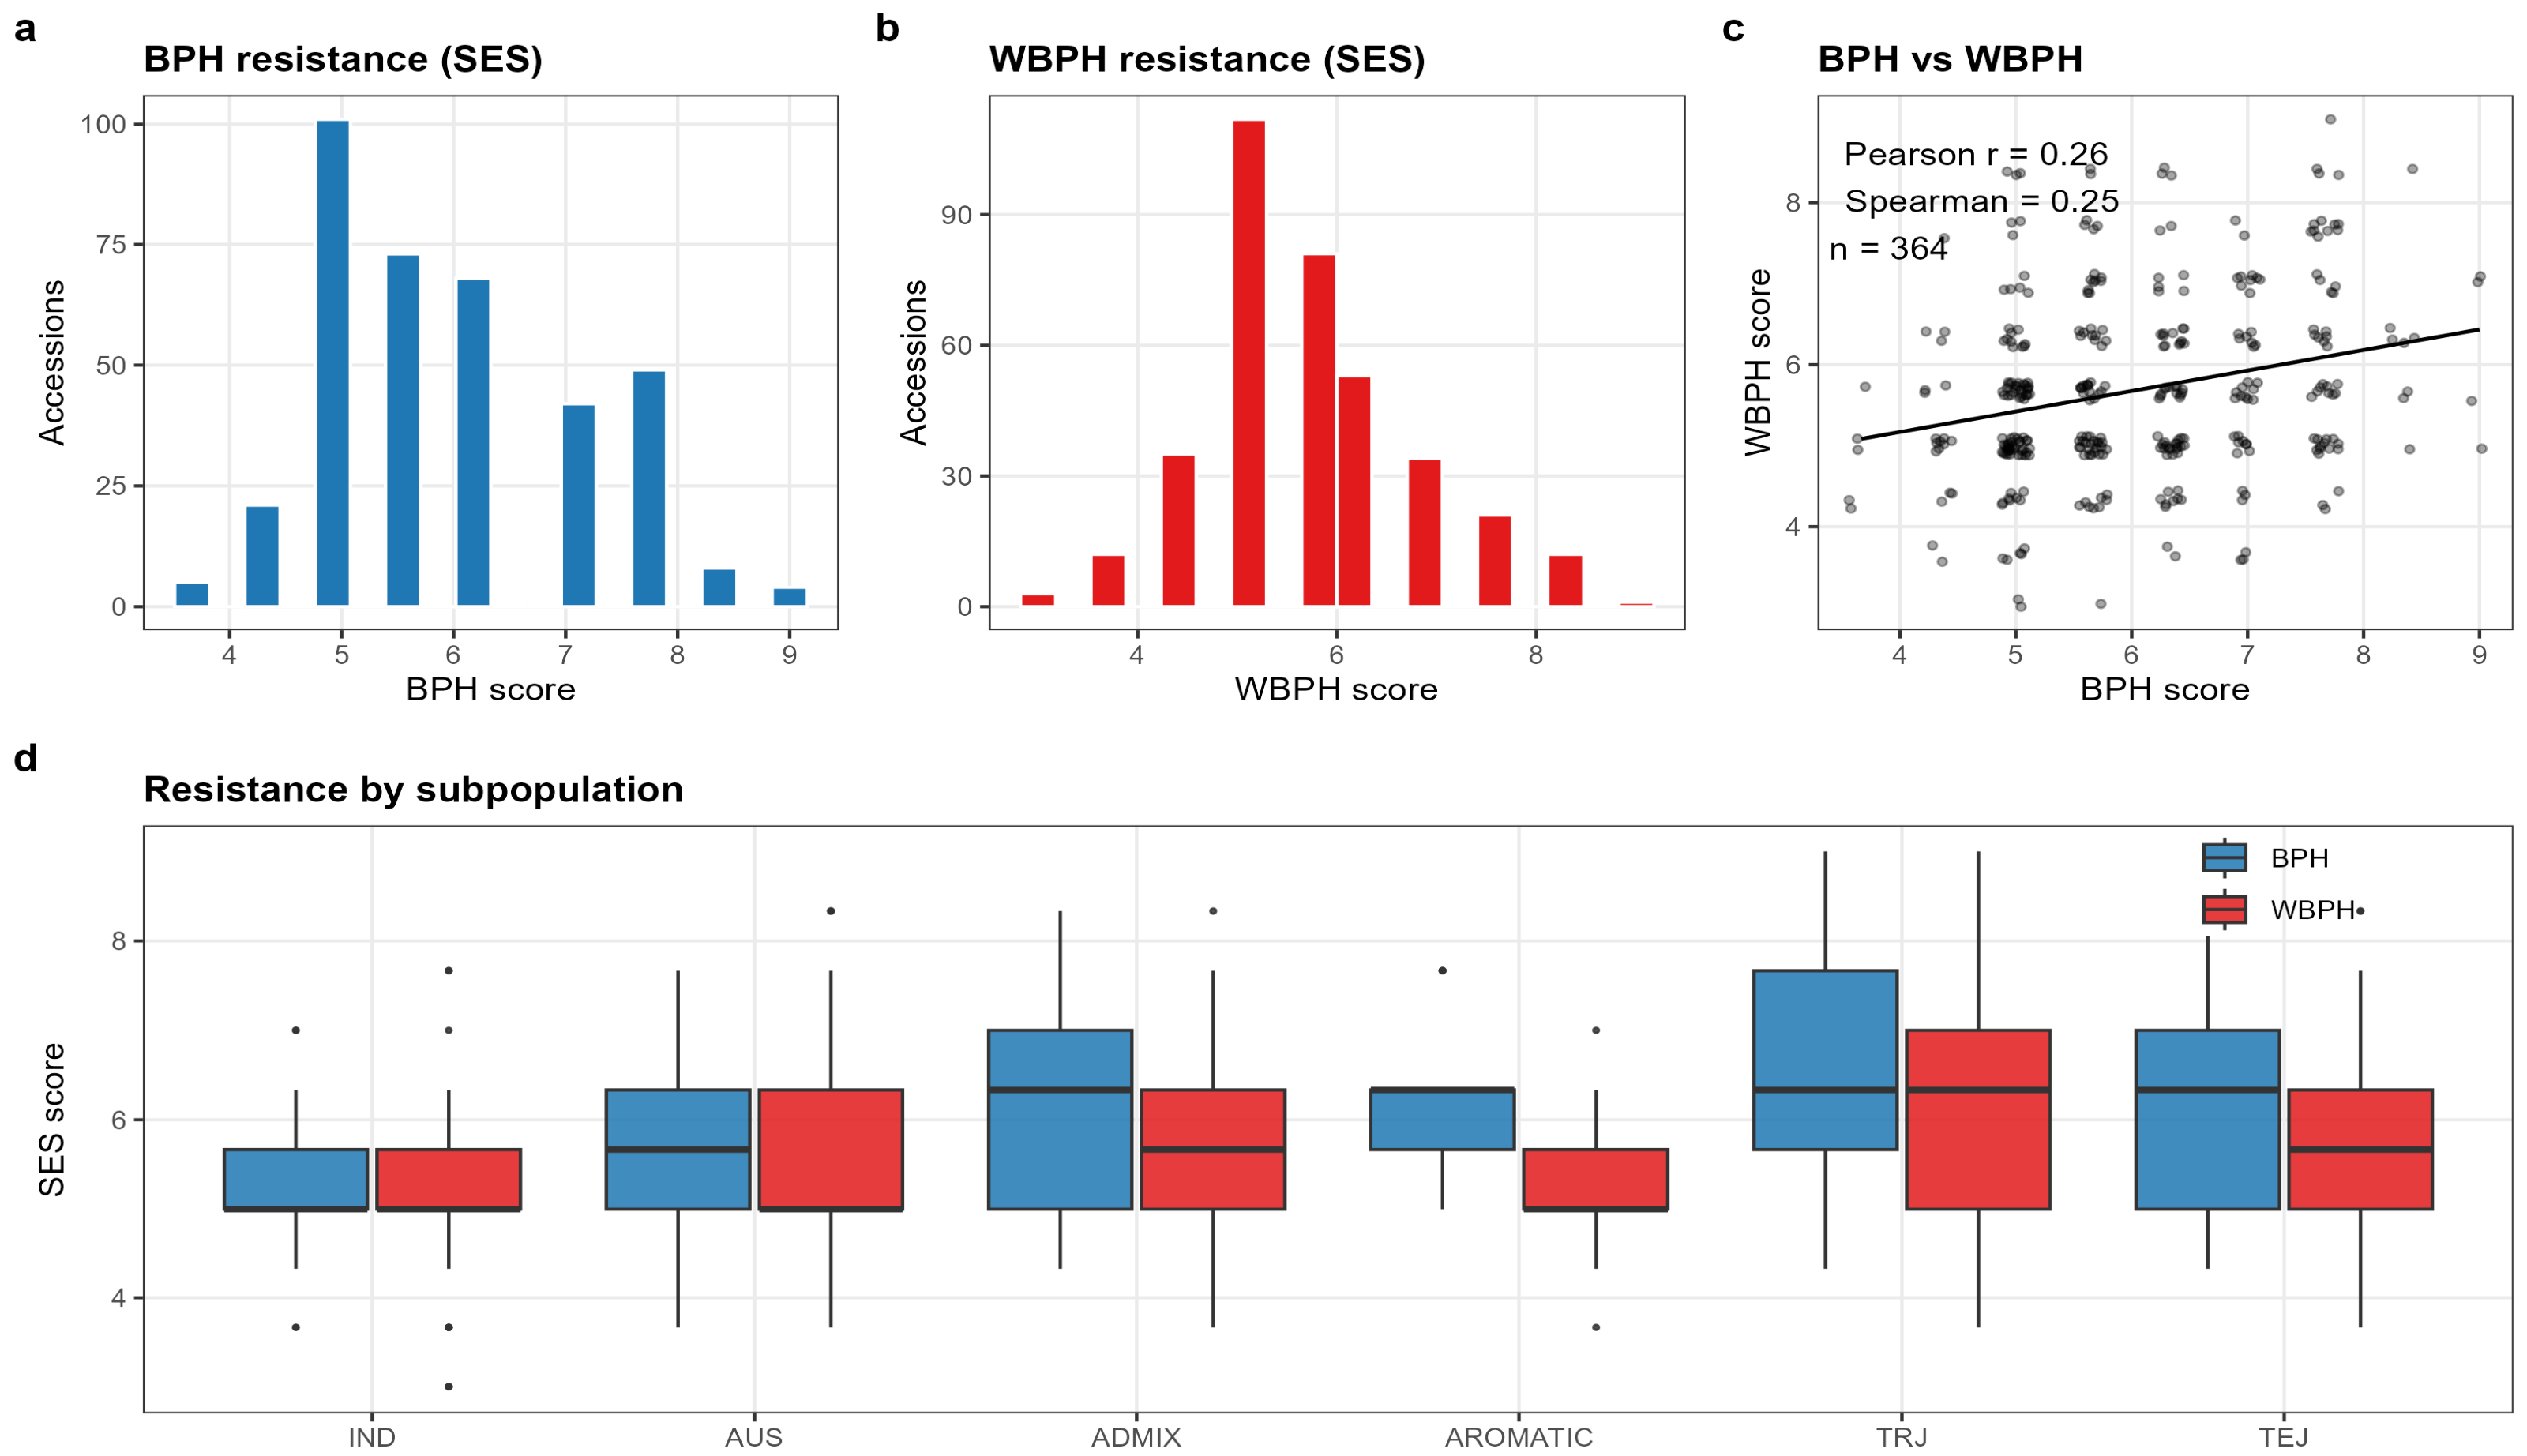
Both traits varied continuously across RDP1 with sufficient range for mapping (Figure 1a,b). BPH resistance scores averaged 6.01 ± 1.11 SES (range 3.7–9.0; CV 18.5%; n = 372) and WBPH scores averaged 5.67 ± 1.11 SES (range 3.0–9.0; CV 19.6%; n = 365) (Tables S1 and S2A). Resistance to the two planthoppers was weakly but significantly correlated (Pearson r = 0.255, p = 8.0 × 10⁻⁷; Spearman ρ = 0.246; n = 364; Figure 1c); the two traits thus share a modest common component while remaining substantially distinct in this panel. Resistance was strongly structured by subpopulation (Figure 1d): indica was the most resistant subpopulation to BPH (mean SES 5.26) and among the most resistant to WBPH (5.15; only the small aromatic group, n = 14, scored lower, at 5.05), whereas tropical japonica was the most susceptible (6.56 and 6.19, respectively). Differences among accessions were highly significant for both pests (BPH F371,744 = 4.05, p = 3.4 × 10−59; WBPH F364,730 = 2.80, p = 2.1 × 10⁻³²), and the within-screening broad-sense heritability was H2 = 0.50 (95% CI 0.44–0.56) for BPH and 0.38 (0.31–0.44) for WBPH on a single-observation basis, rising to 0.75 (0.71–0.79) and 0.64 (0.58–0.70) respectively on the accession-mean basis used for mapping (Table S2B). Genomic heritability was substantially lower (h2g = 0.10 ± 0.06 for BPH and 0.22 ± 0.08 for WBPH, univariate genomic-REML estimates ± SE; Table S2C), with the BPH estimate only marginally distinguishable from zero. For both pests the gap between H2 and h2g (0.75 versus 0.10 for BPH and 0.64 versus 0.22 for WBPH) indicates that much of the repeatable genotypic variance is not captured by additive effects tagged by the 44 K array; the low genomic heritability therefore reflects limited marker-based capture rather than an absence of phenotypic signal.
Figure 1.
Phenotypic distributions of BPH and WBPH resistance and resistance by subpopulation. (a,b) Distributions of BPH (a) and WBPH (b) SES scores across RDP1 accessions; (c) BPH × WBPH correlation (Pearson r = 0.255, Spearman ρ = 0.246, n = 364; line = linear fit); (d) SES by subpopulation for BPH (blue) and WBPH (red). Lower SES = more resistant; indica is most resistant to BPH and among the most resistant to WBPH.
3.2. Population Structure Supports a Three-Panel Stratified Design
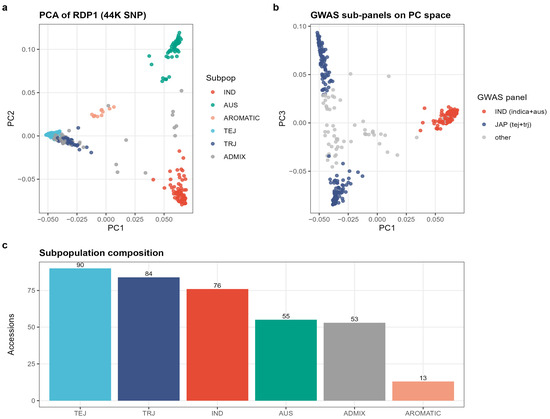
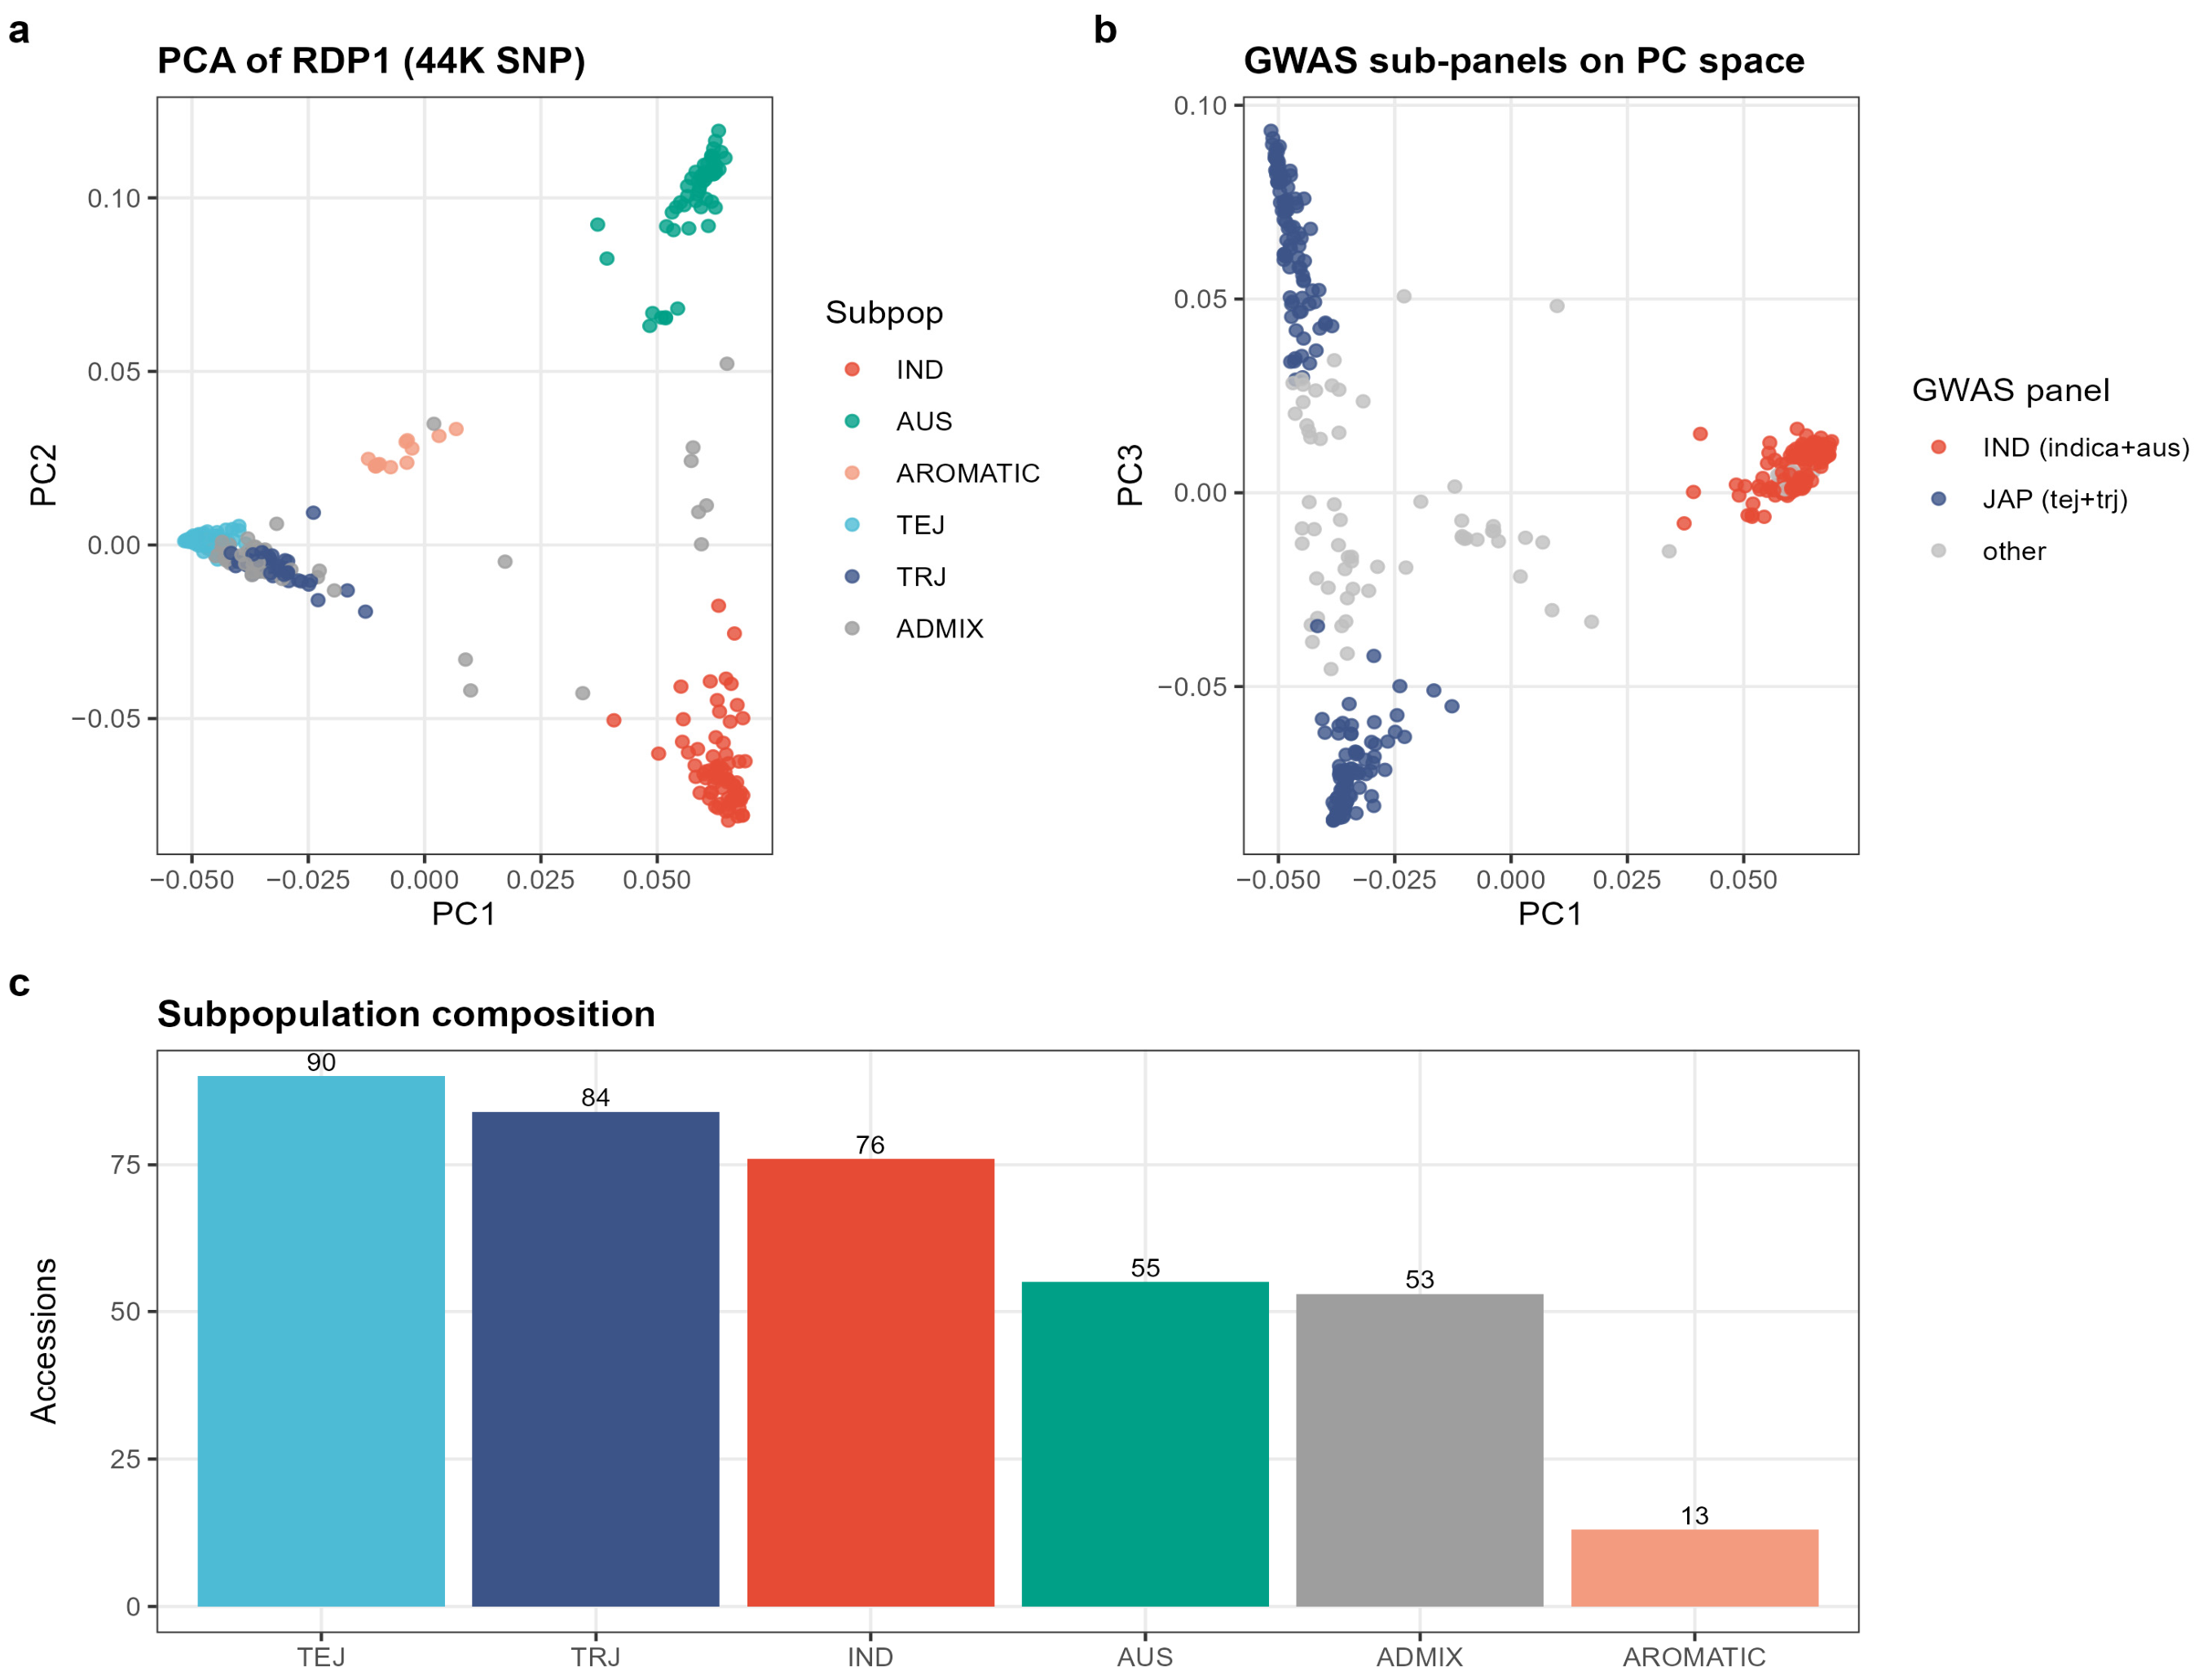
Principal component analysis of the 44 K genotypes recovered the expected strong indica–japonica differentiation of RDP1 (Figure 2a,b), with PC1 separating the indica and japonica lineages. This structure motivated the stratified analysis into whole, indica and japonica panels (Figure 2b,c) to limit spurious associations while recovering subgroup-specific signals. Linkage disequilibrium decayed fastest in indica (half-decay ~162 kb) and most slowly in temperate/tropical japonica (~412 kb), with aus intermediate (~238 kb) (Figure S2), consistent with earlier rice diversity panels [30] and supporting both the ±200 kb candidate-gene windows and the collision windows used in the non-overlap test.
Figure 2.
Population structure of RDP1 from 44 K SNPs. (a) PC1 vs. PC2 colored by subpopulation; (b) PC1 vs. PC3 colored by GWAS panel; (c) subpopulation composition (n = 371 genotyped accessions).
3.3. Genome-Wide Association Mapping Identifies Candidate Resistance Loci
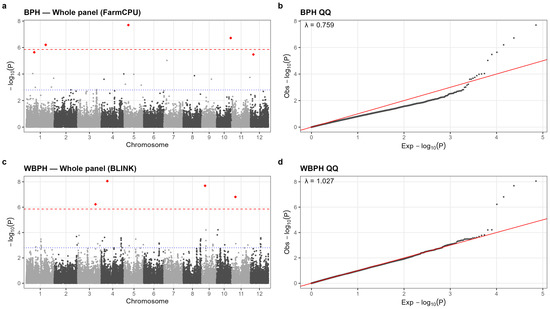
Across the three panels and three models, genomic inflation was largely controlled (MLM λGC = 0.88–1.15 across the six panel–trait combinations; the multi-locus models spanned λGC 0.75–1.25 for FarmCPU and 0.89–1.25 for BLINK, although these models absorb structure differently so their λGC is not directly comparable to that of the mixed model; Table S3). The extremes warrant comment in both directions: the low end of the whole-panel MLM range (0.88) indicates mild over-correction in that panel, whereas the japonica panel shows mild residual inflation in the multi-locus models (λGC up to 1.25), most pronounced for WBPH (MLM λGC = 1.15), which we interpret cautiously given that panel’s smaller size and its internal temperate/tropical differentiation. At FDR < 0.05, six loci were significantly associated with BPH resistance and five with WBPH resistance (Table 1; Figure 3). These loci differ in the strength of their support. Six were detected in more than one panel × model scan (BPH chromosome 5 at 6.30 Mb and chromosome 1 at 12.34 Mb; WBPH chromosomes 3, 4, 9 and 11), and the WBPH chromosome 9 locus was the only one detected by all three models. The other five were each detected in a single scan (BPH chromosome 10 at 21.74 Mb, chromosome 1 at 30.00 and 42.01 Mb, and chromosome 12 at 4.44 Mb; WBPH chromosome 5 at 28.04 Mb). Because the FDR was controlled within each of the 18 scans, these single-scan loci carry a higher study-wide false-positive risk and are treated as suggestive pending independent confirmation. Agreement between BLINK and FarmCPU is also not fully independent evidence, because both are multi-locus models.
Table 1.
FDR-significant (FDR < 0.05) loci for brown planthopper (BPH) and white-backed planthopper (WBPH) resistance in RDP1. Distance is to the nearest cloned Bph gene on the same chromosome. The Status column grades novelty (see footnote 1): “novel (strict)”, “candidate” (a WBPH locus on a chromosome that already carries a mapped, uncloned WBPH QTL), or “novel candidate (vs. cloned Bph)” for BPH loci, i.e., novel relative to cloned Bph genes only, with correspondence to uncloned BPH QTL not excluded.
Figure 3.
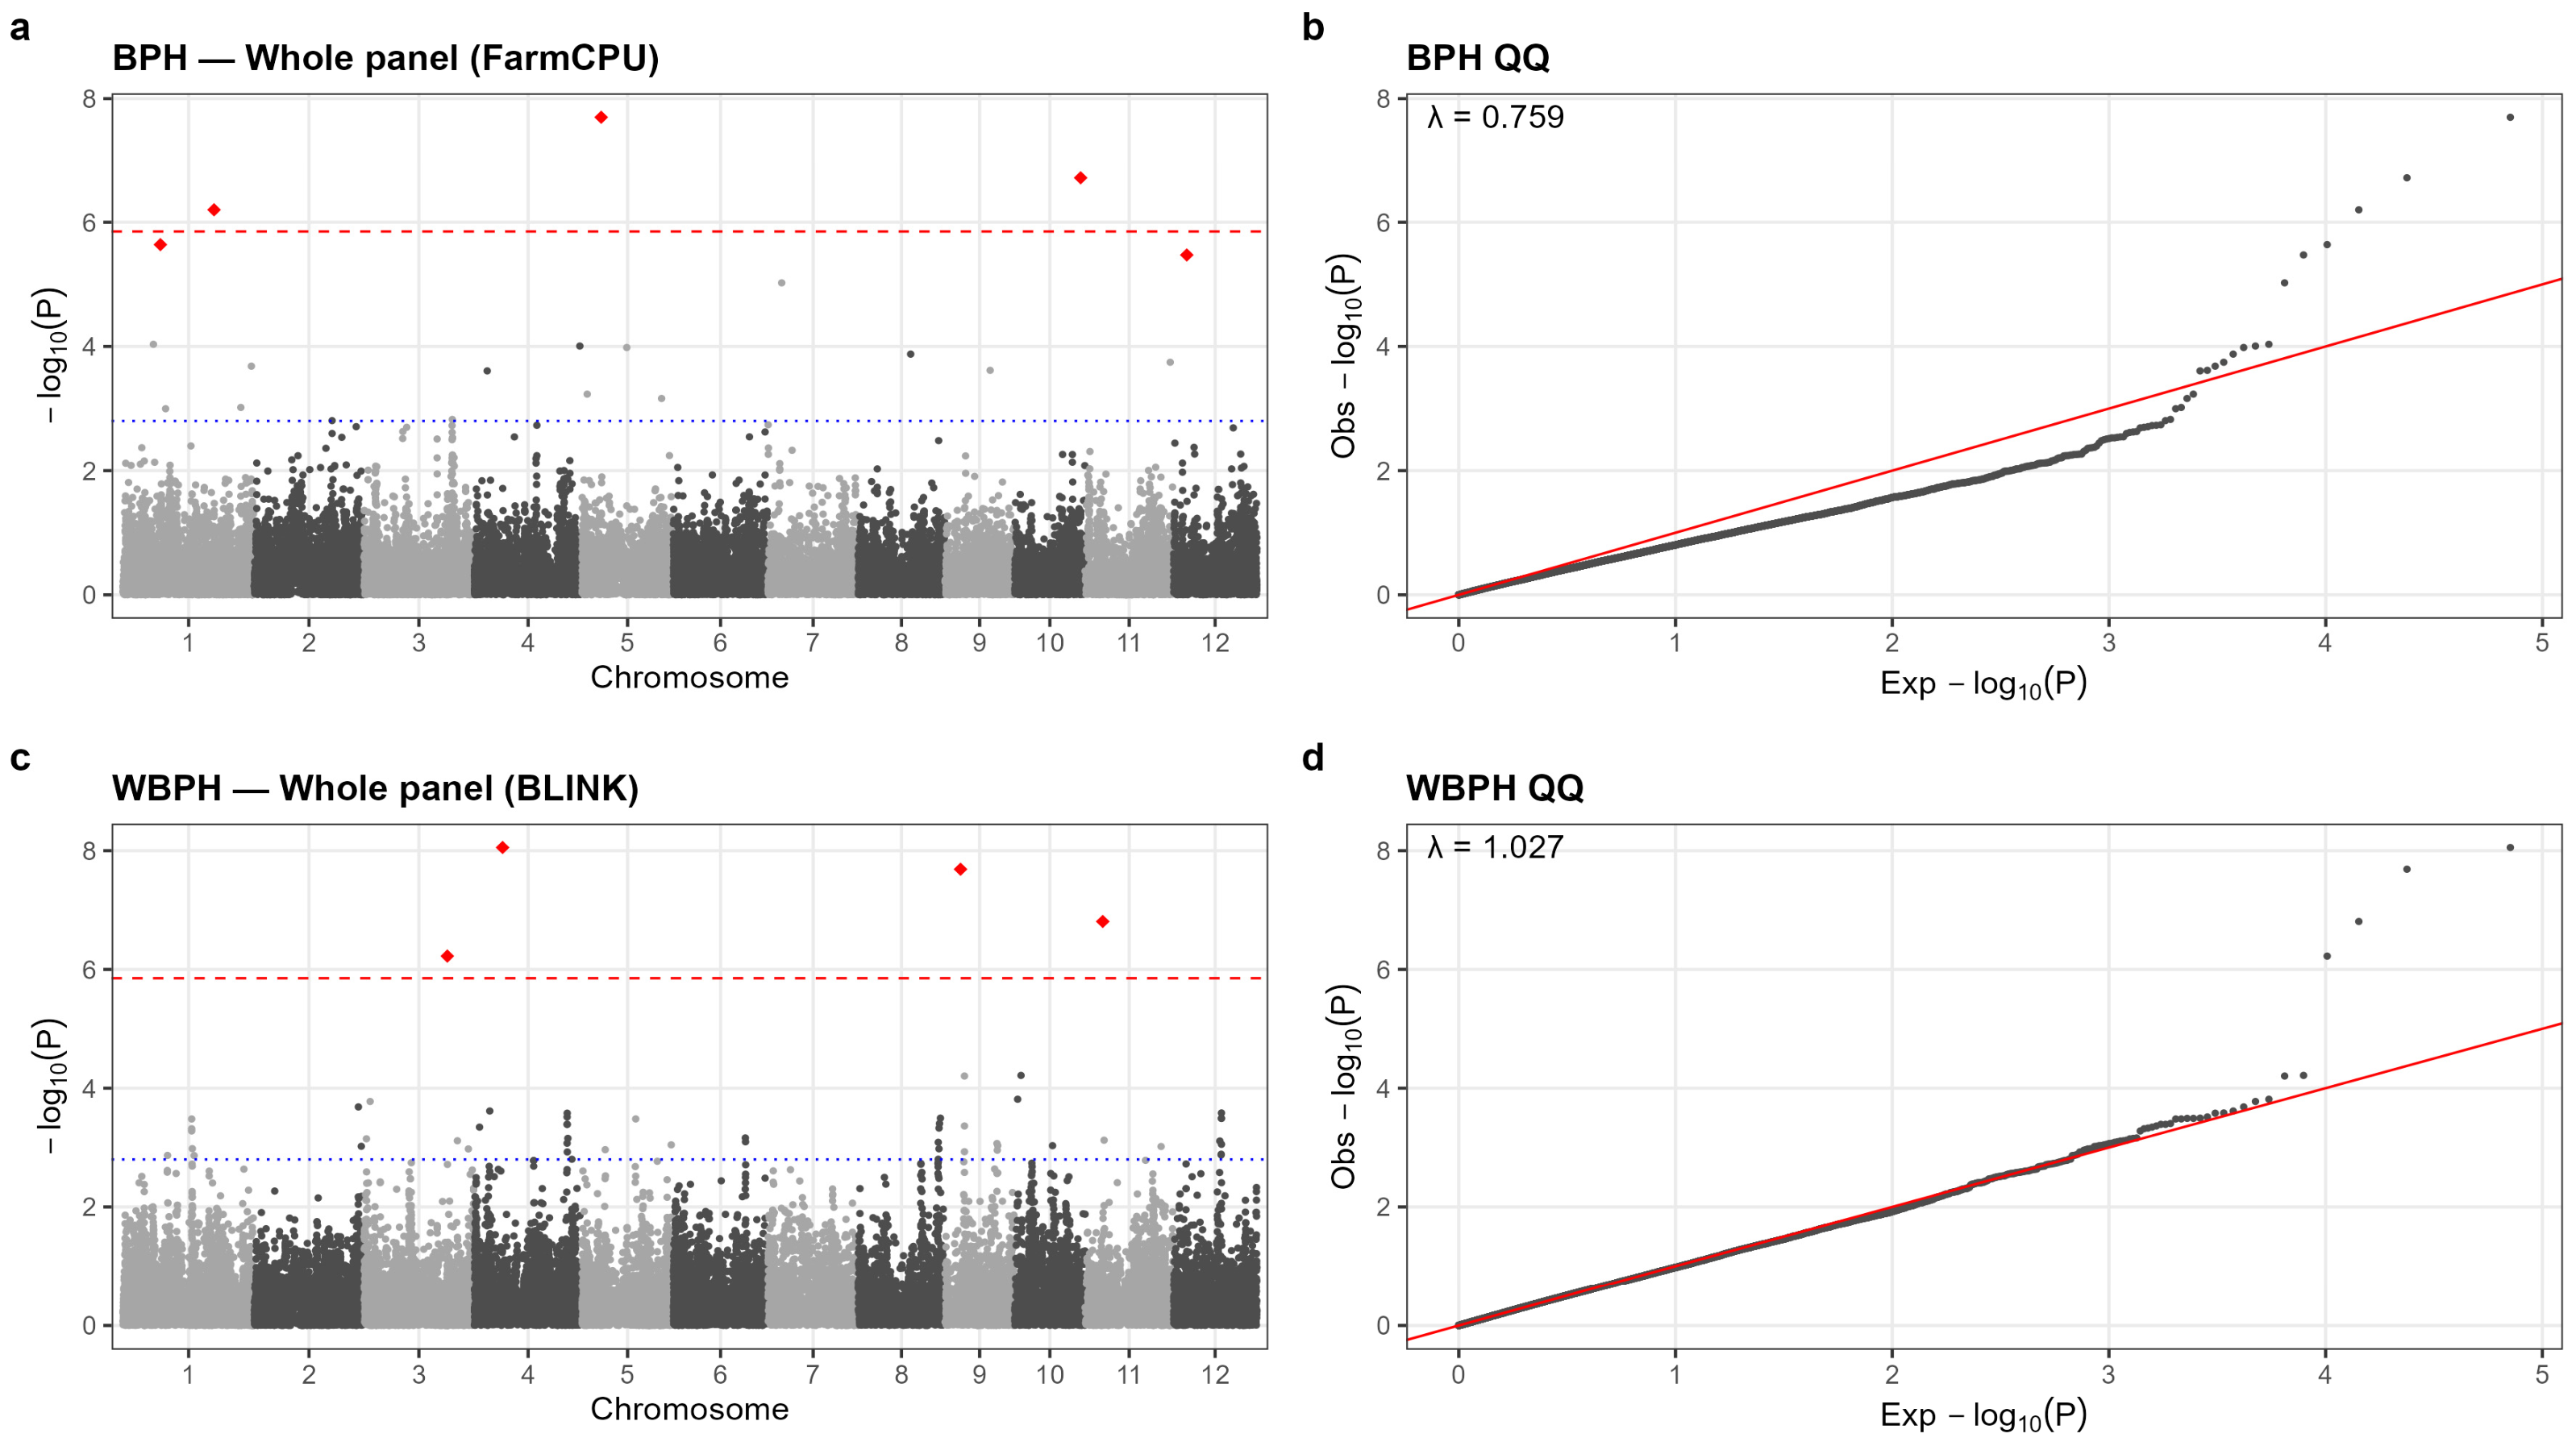
Manhattan and quantile–quantile (Q–Q) plots for the whole-panel lead models. (a) BPH Manhattan plot (FarmCPU); (b) BPH Q–Q plot; (c) WBPH Manhattan plot (BLINK); (d) WBPH Q–Q plot. In (a,c), red dashed lines = per-panel Bonferroni threshold; blue dotted lines = suggestive threshold; red diamonds = FDR < 0.05 markers. In (b,d), black dots = observed −log10p of each SNP plotted against its expected value; red solid line = the y = x expectation under no association; λ = genomic inflation factor. Complete Manhattan grids for all 18 panel × model analyses are in Figure S3.
For BPH, the strongest associations were on chromosome 5 at 6.30 Mb (id5003206; p = 1.99 × 10⁻⁸; whole panel, FarmCPU) and chromosome 1 at 12.34 Mb (id1008482; p = 9.07 × 10⁻⁸; japonica panel, BLINK), with additional loci on chromosomes 1 (30.00, 42.01 Mb), 10 (21.74 Mb) and 12 (4.44 Mb). For WBPH, the strongest signal genome-wide was on chromosome 4 at 9.34 Mb (id4003121; p = 8.84 × 10⁻⁹; whole panel, BLINK), followed by chromosome 9 at 5.22 Mb (p = 2.06 × 10⁻⁸); the chromosome 9 locus was the most robust, being detected by all three models. Further WBPH loci were detected on chromosomes 11 (5.80 Mb), 3 (27.56 Mb) and 5 (28.04 Mb) (Table 1; Figure 3). A second chromosome 4 lead SNP 570 kb distal (id4003250, 9.91 Mb) was in complete linkage disequilibrium with id4003121 (r2 = 1.00) and is therefore reported as the same locus rather than as an independent signal.
Per-locus variance explained was modest (PVE 2.4–8.4%; Table 1). These single-marker estimates are upward-biased (Beavis effect): their per-trait sum (~33% for BPH, ~29% for WBPH) exceeds the corresponding genomic heritability (0.10 and 0.22), so the true additive contributions are substantially smaller, and the PVE column should be read only as a relative ranking of the discovered loci, not as absolute variance explained. No lead locus for either pest lies closer than 2.38 Mb to a cloned Bph gene; the closest, the WBPH chromosome 4 locus at 9.34 Mb, lies 2.38 Mb from Bph3/Bph15 (Os04g0202300, 6.96 Mb), beyond the LD decay distance in rice, indicating that the mapped loci are not re-detections of cloned Bph genes. The BPH loci are therefore novel candidate loci relative to cloned Bph genes only; they were not benchmarked against the many uncloned BPH QTL, and correspondence with such QTL cannot be excluded. Their relationship to previously mapped, uncloned WBPH QTL is examined in the Discussion (Table S4). Complete Manhattan plots for all 18 analyses (both pests × three panels × three models), with per-panel Bonferroni thresholds and FDR-significant markers, are provided as a composite grid in Figure S3.
3.4. Shared vs. Distinct Architecture: Locus- and Mechanism-Level Tests
Because the two resistances are weakly but significantly correlated, we asked whether they share genetic control at two levels: the loci themselves and the defense mechanisms their candidate genes represent, benchmarking each observation against an explicit random-placement null. At the locus level, no BPH and WBPH top-association locus was co-located anywhere in the genome (Figure S4). Although loci for the two pests shared a chromosome in one instance (chromosome 5), the nearest BPH–WBPH locus pair was 21.74 Mb apart (BPH at 6.30 Mb vs. WBPH at 28.04 Mb), far exceeding rice LD. This non-overlap is, however, close to the random expectation for so few loci. In 20,000 permutations that placed the six BPH and five WBPH loci at random along the genome (collision window 1 Mb, ~2× LD), no cross-trait coincidence occurred in 85.0% of permutations; the expected number of coincidences was 0.16 (matching the analytic value nBPH·nWBPH·2D/L = 0.16), and the probability of at least one coincidence was 0.15 (Figure S4). Cross-trait detection power was also limited: using the (upward-biased) discovery effect sizes, the median power to recover a given locus in the other trait, had it acted there with the same effect, was only 0.48, exceeding 0.8 for just 2 of the 11 loci (Table S5).
At the mechanism level, many genes within the ±200 kb candidate intervals belonged to defense-related families (68 defense-annotated genes for BPH loci and 65 for WBPH loci; 133 in total); when these genes were classified into nine mechanism modules, eight were represented and all eight were shared by both pests, with the remaining module (anti-feeding protease inhibitors) being absent from both (Figure S5; Table S6). This sharing likewise did not exceed a random-placement background. Across 2000 permutations of matched random locus sets analyzed through the identical extraction and classification pipeline, the observed number of shared modules (8; null mean 7.6; empirical p = 0.61), the cosine similarity of the two pests’ module-count profiles (0.84; null mean 0.85; p = 0.63), and the total number of defense-annotated genes (133; null mean 116; p = 0.18) all fell within the null distribution (Figure S6). Neither test, therefore, supports pest-specificity at the locus level or convergent mechanism at the gene level: the distinct top signals are best read as the loci that each scan was powered to detect, and the shared modules as the genome-wide ubiquity of defense-related gene families rather than a locus-set-specific convergence. The significant positive phenotypic correlation (r = 0.26) nonetheless points to a shared genetic component that remains largely below the detection threshold in these panels, and the candidate genes, nominated on positional and annotation evidence, await functional validation.
3.5. Regional Association Mapping with the HDRA 700 K Array
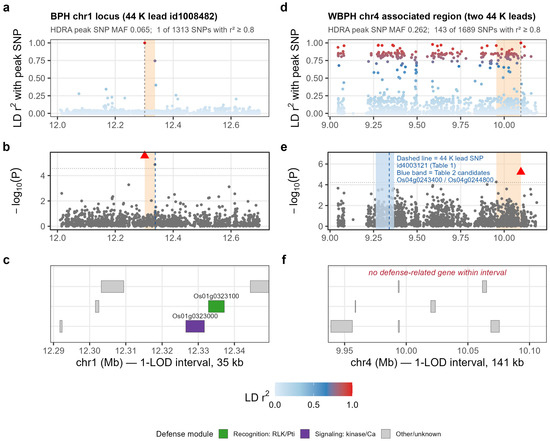
Regional association with HDRA genotypes narrowed the broad 44 K peaks at the two BPH loci to sub-megabase support intervals (Figure 4; Table S7) but did not resolve the WBPH chromosome 4 locus. The BPH chromosome 1 locus resolved most cleanly, converging to a ~35 kb 1-LOD statistical support interval (not a causal interval, well below the indica LD half-decay of ~162 kb) containing four genes, including a Pti1-like kinase (Os01g0323100) and an adjacent receptor-like kinase (Os01g0323000). The BPH chromosome 5 locus converged to ~289 kb spanning a CYP90D5 cytochrome P450 (Os05g0200400). For WBPH, the chromosome 9 and chromosome 11 intervals could not be further resolved, and the chromosome 4 locus was not resolved either; we therefore describe it as an extended associated region rather than as a fine-mapped interval. In the 44 K panel, the two chromosome 4 lead SNPs (id4003121 at 9.34 Mb and id4003250 at 9.91 Mb) are in complete linkage disequilibrium (r2 = 1.00). HDRA regression in a window centered on the 44 K lead SNP gave only a weak peak at 9.59 Mb (−log10p = 3.94) with a broad support interval of about 590 kb (9.05–9.64 Mb) that spans essentially the entire analysis window and contains the two candidate genes listed in Table 2. A second window centered on 9.91 Mb gave a stronger peak at 10.10 Mb (−log10p = 5.23); its 141 kb 1-LOD interval (9.95–10.10 Mb) is defined by only two SNPs, does not include the 44 K lead SNP and contains no defense-related gene (Figure 4). The chromosome 4 signal therefore marks an associated region of about 1 Mb (9.0–10.2 Mb) whose causal variant and gene remain unresolved, and the genes listed for this locus are positional candidates only. Candidate genes in these support intervals, flagged as refined (near the lead SNP) or broader-interval, are listed in Table S7.
Figure 4.
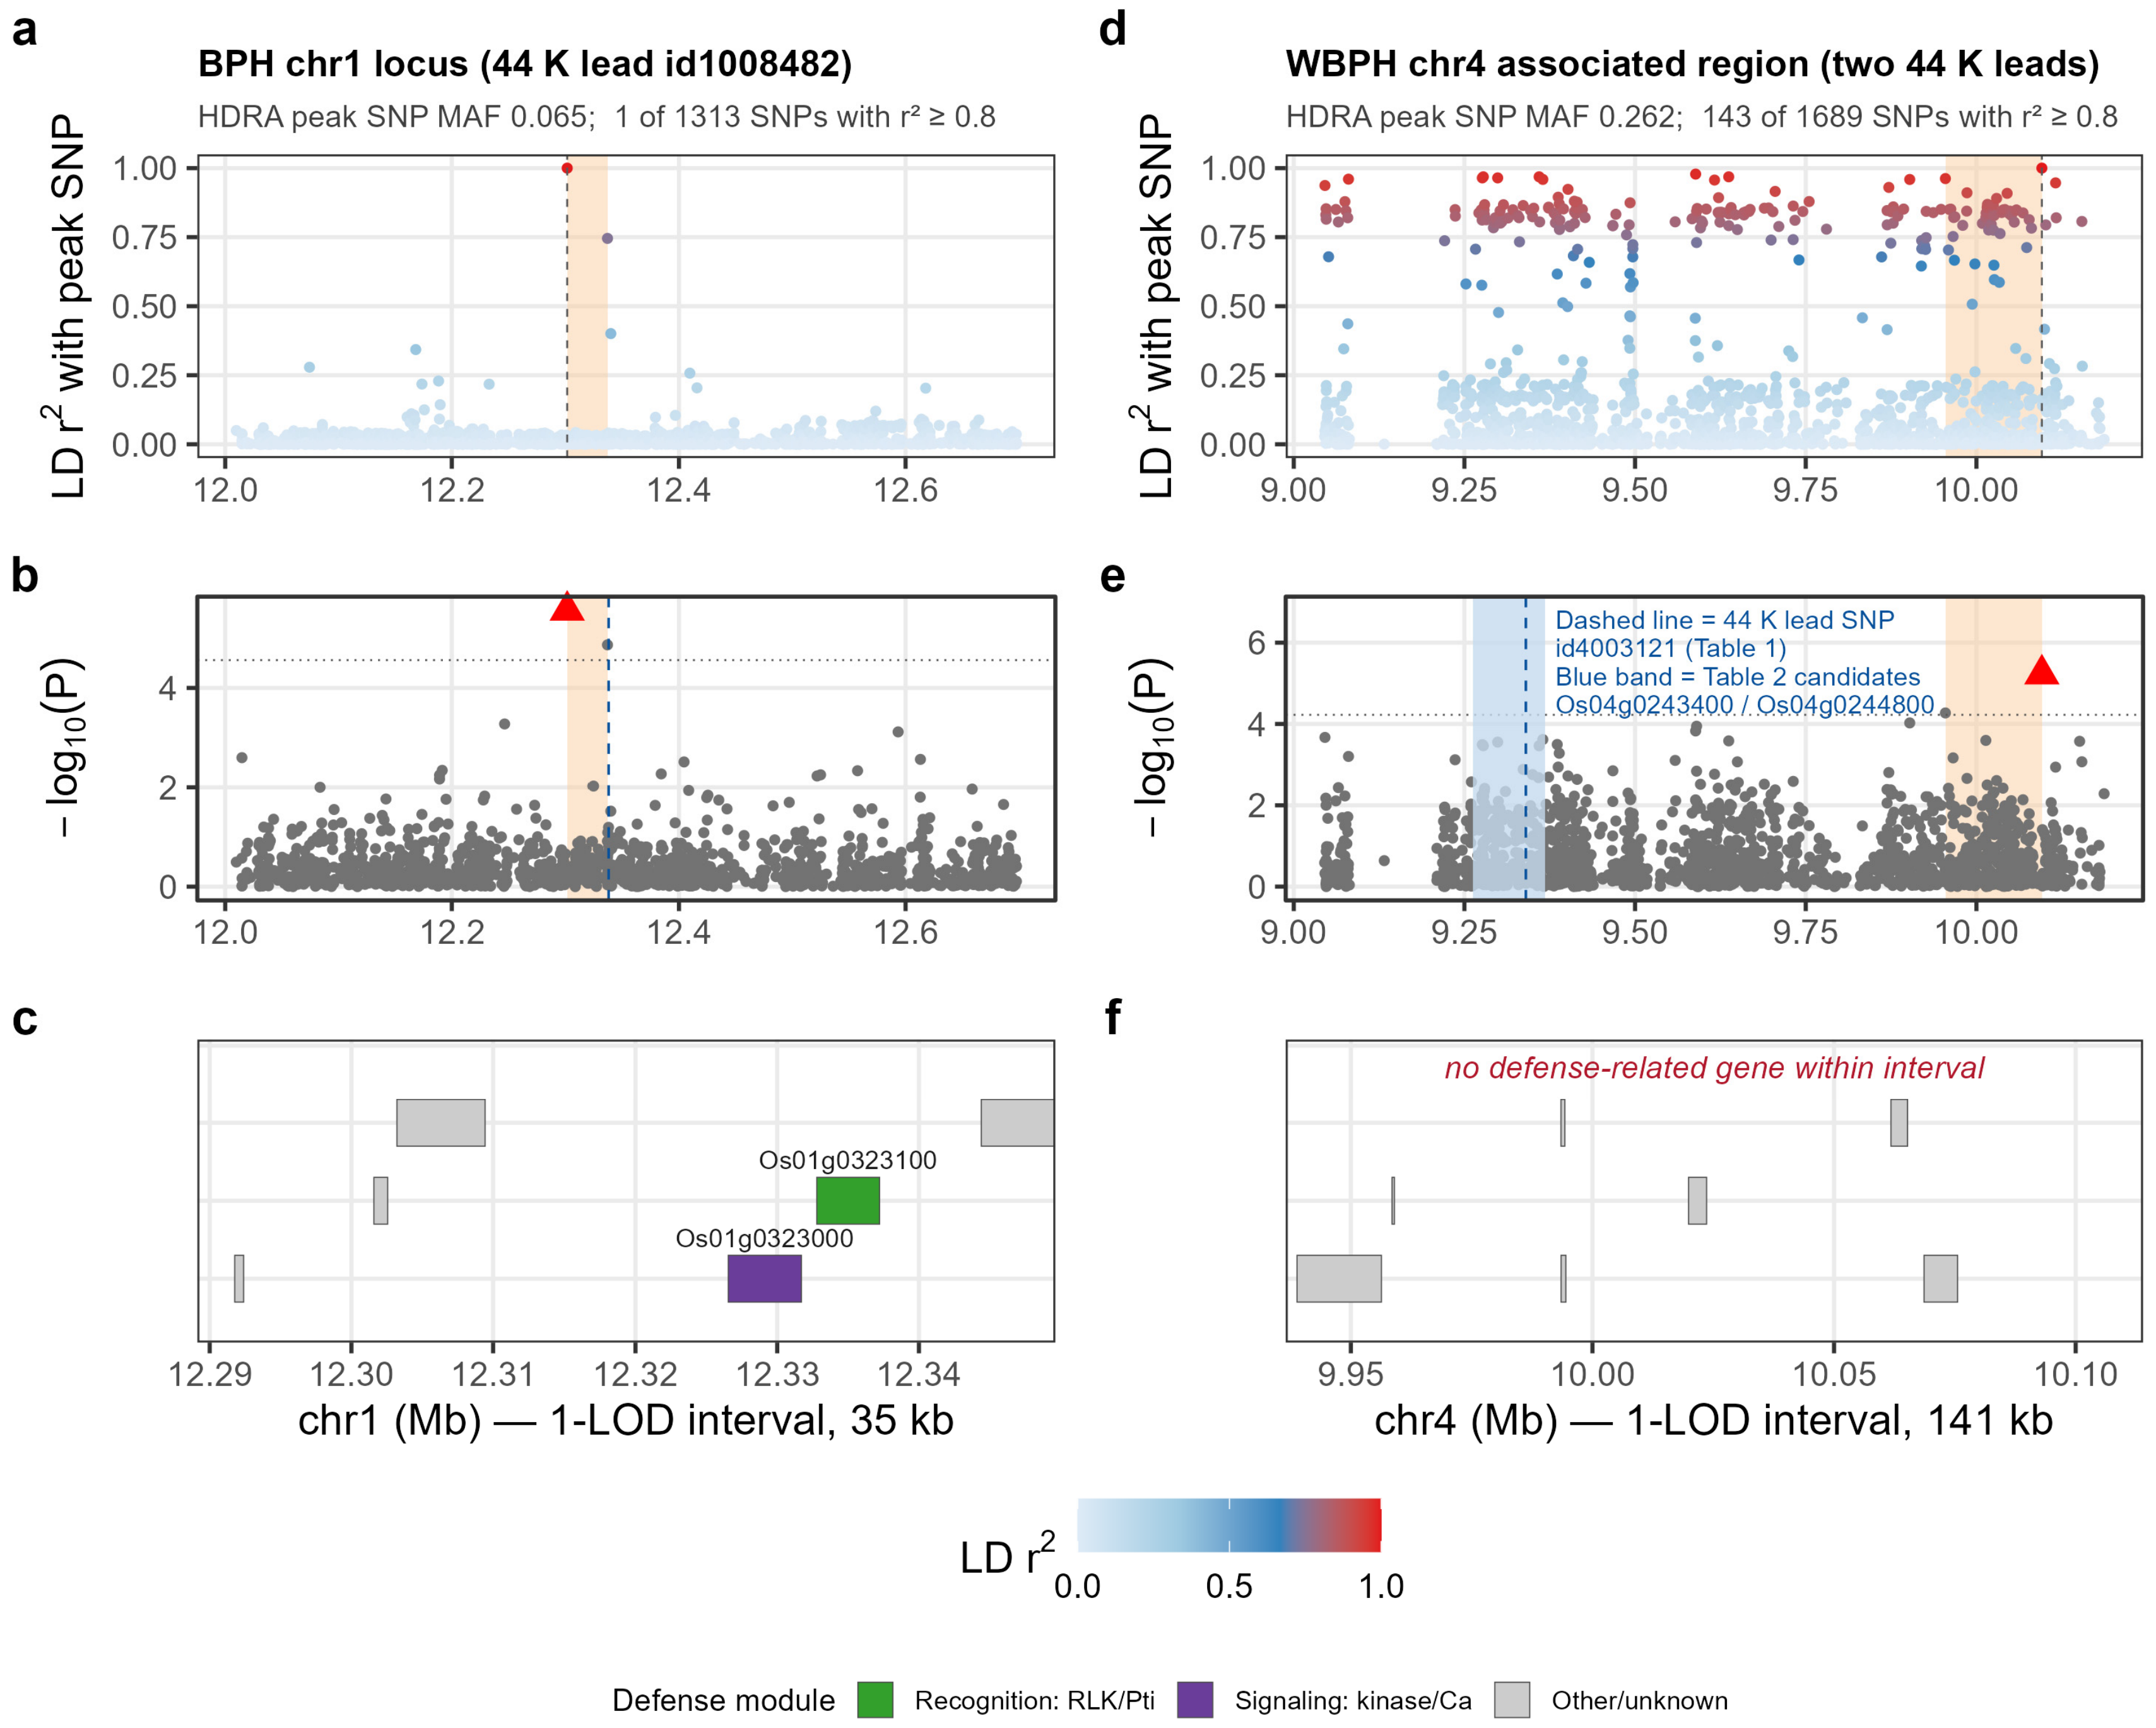
Integrated view of the two lead candidate loci: linkage disequilibrium, association signal, and gene content. Left (a–c), the BPH chromosome 1 locus; right (d–f), the WBPH chromosome 4 associated region. (a,d) LD (r2) between each HDRA SNP and the HDRA peak SNP, computed on the accessions used for that regression; (b,e) per-SNP −log10p (red triangle = peak; dotted line = 1-LOD threshold); (c,f) gene models within the 1-LOD interval ±10 kb, colored by defense module (gray = no defense annotation), defense-related genes labeled. Orange shading = HDRA 1-LOD support interval around the peak; blue dashed line (b,e) = 44 K lead SNP (Table 1); blue band (e) = Table 2 candidate genes. In (b) the 44 K lead lies at the edge of the HDRA interval; in (e) the lead and candidate genes lie 0.6–0.8 Mb proximal to it, so the interval is not a refinement of the lead but one segment of an extended associated region whose causal gene is unresolved (Section 3.5). The weak first-window peak at 9.59 Mb falls below the plotted 1-LOD threshold and is not marked. Gene lists are given in Table S7.
Table 2.
Subpopulation source of the resistance allele at lead candidate loci in RDP1, as a guide for donor selection. The resistance allele is the allele of the lower-SES genotype; frequencies are from the 44 K panel; the structure-corrected effect is from a linear model of SES on PC1–4 plus genotype and is shown as dResid (as in Table S8). The donor pool is locus-specific, and these are candidate leads requiring phenotypic validation, not validated donors. For the chromosome 4 locus, the listed genes are positional candidates within an unresolved associated region (Section 3.5).
3.6. Haplotype Distribution of Candidate Genes in the 3K Rice Genomes
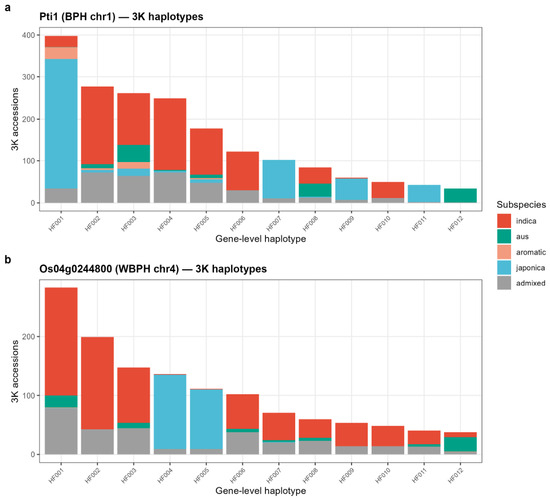
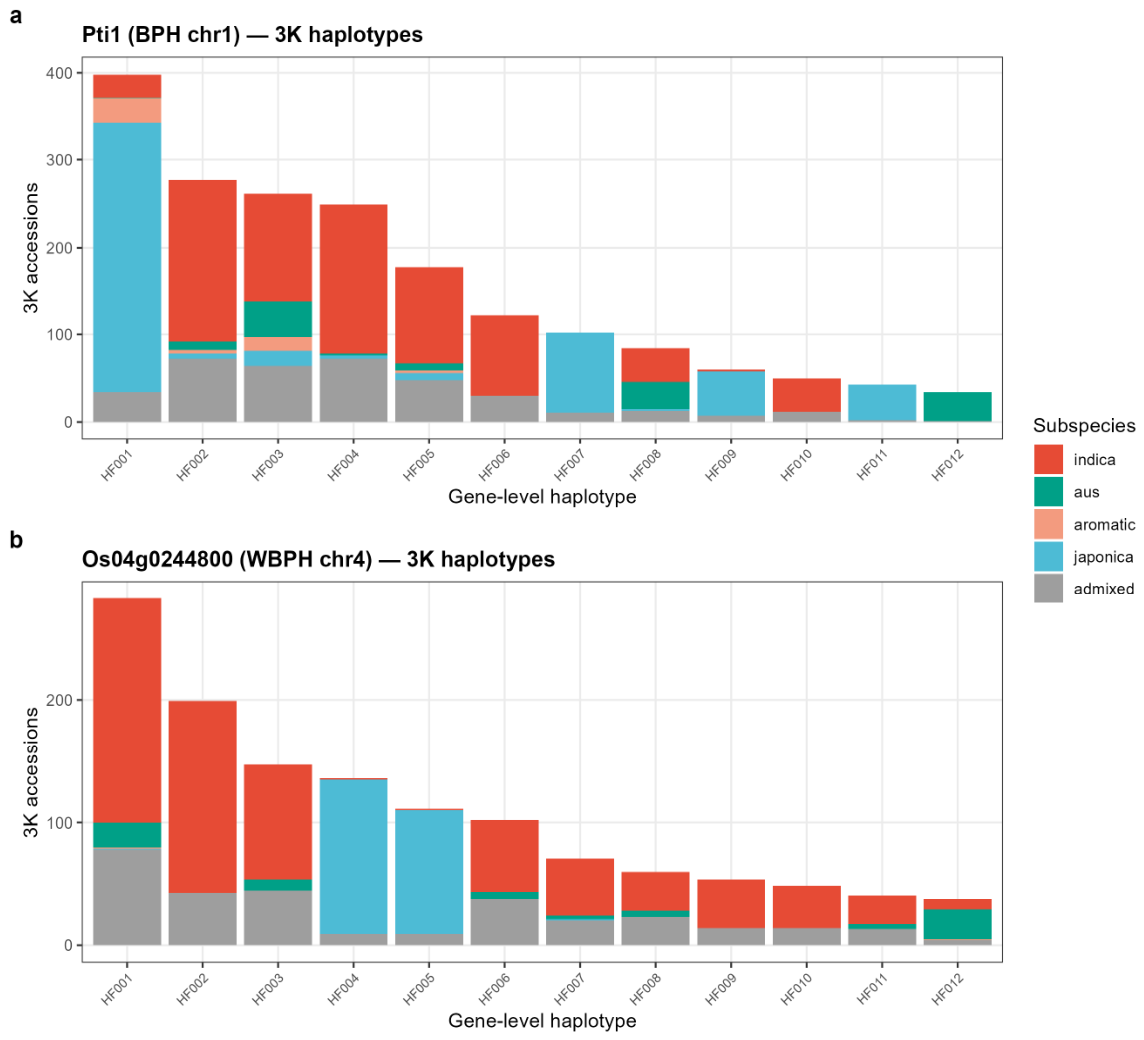
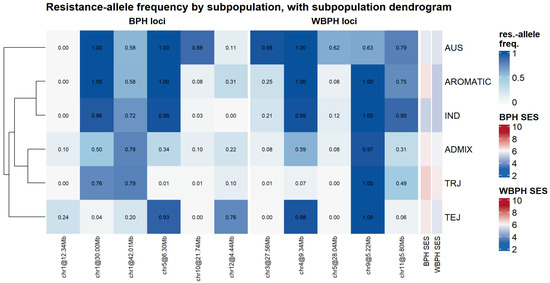
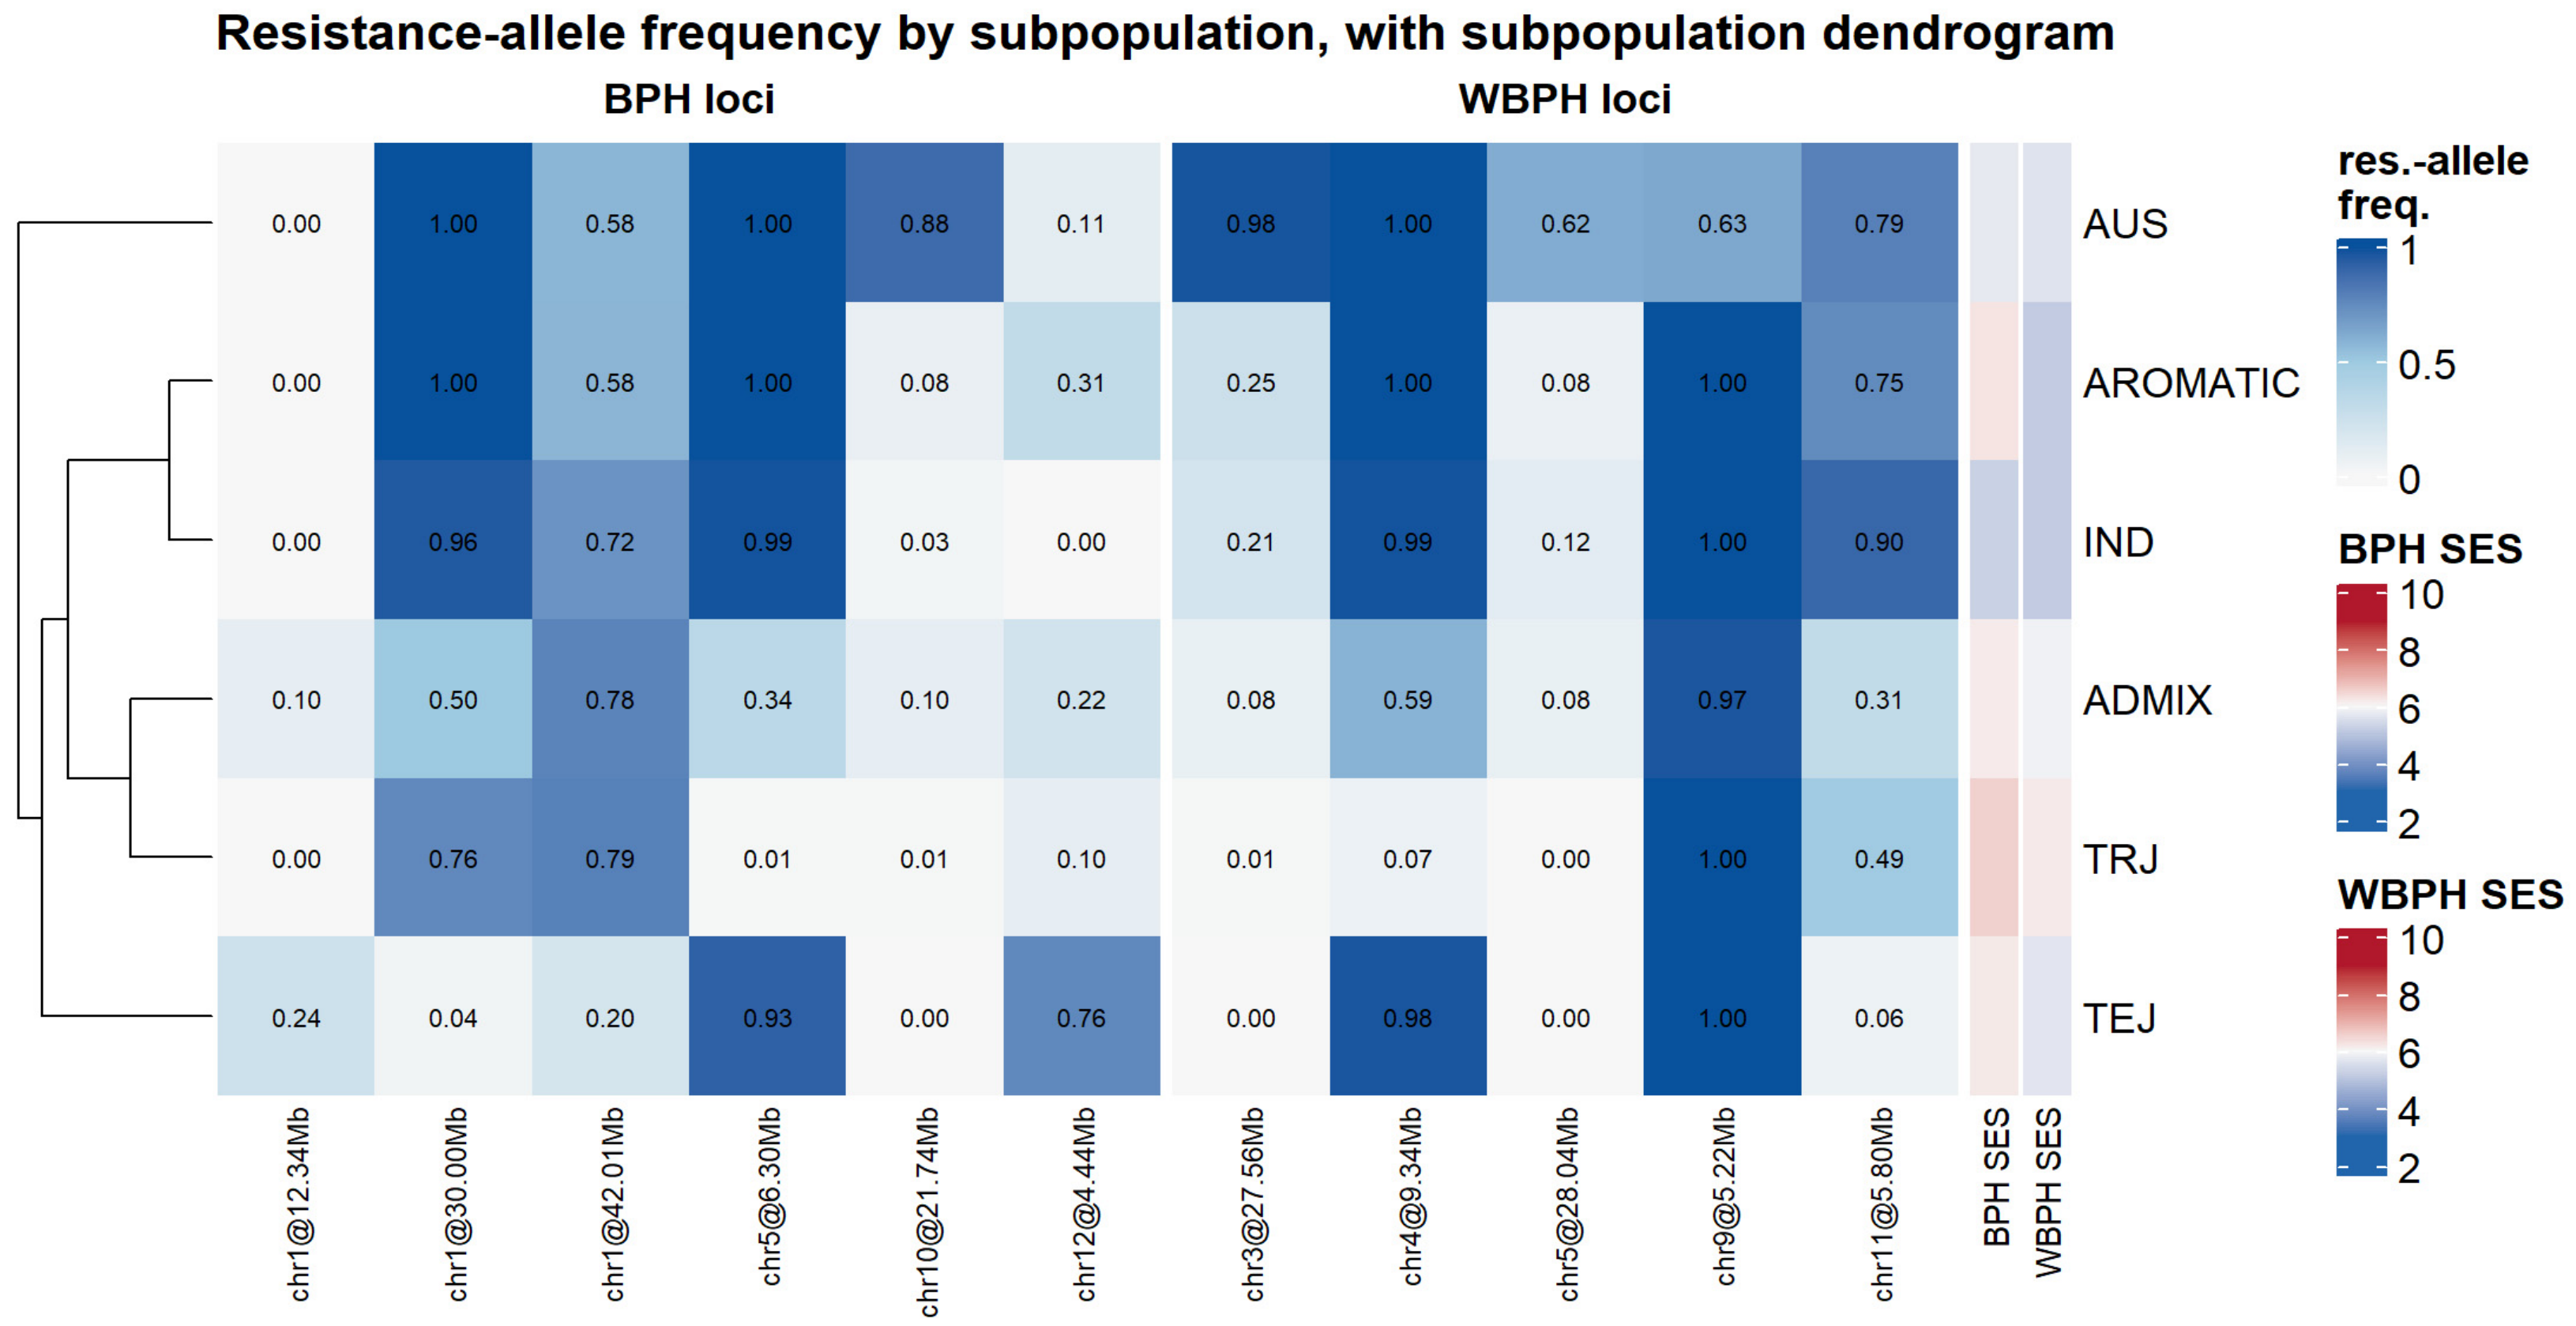
Gene-level haplotypes of the candidate genes reconstructed from the 3K RGP were clearly differentiated by subspecies (Figure 5). For example, at the BPH chromosome 1 candidate Pti1 (Os01g0323100) and the adjacent receptor-like kinase (Os01g0323000), one haplotype predominated in japonica accessions while alternative haplotypes were enriched in indica. Because indica was among the most resistant subpopulations of RDP1, the indica-enriched haplotypes could be considered as candidate donors, but only as validation-pending resources: the 3K accessions carrying them were not phenotyped for either planthopper, and the direction of resistance is inferred from the RDP1 allele-effect estimates (Table 2 and Table S8) rather than from 3K haplotype frequency. Accession lists can be retrieved from the public 3K RGP genotypes (SNP-Seek) for such validation. The subpopulation source of the resistance allele at each lead candidate locus, however, is locus-specific in RDP1 (Table 2). After correction for population structure (PC1–4; Figure S1) the resistance allele lowered SES clearly at the BPH chromosome 1 (Pti1) and WBPH chromosome 9 loci (structure-corrected Δ = 0.86 and 1.09) but only weakly at the BPH chromosome 5 and WBPH chromosome 4 loci (Δ = 0.15 and 0.25), so part of the raw allele effect at the latter reflects subpopulation structure (Figure S1; Table S8). Aggregating the resistance-allele dosage across all 11 FDR loci summarizes this at the subpopulation level (Figure 6): clustering subpopulations on their resistance-allele composition groups the more resistant aus, aromatic and indica subgroups together and separates the more susceptible temperate and tropical japonica subgroups, and the mean SES of each subpopulation tracks its resistance-allele composition. Because the resistance allele at each locus is defined as the lower-SES allele from the same RDP1 discovery SNPs, both the per-locus effects (Figure S1) and this subpopulation composition summary (Figure 6) are descriptive by construction rather than independent validation, and should be read as hypothesis-ordering summaries.
Figure 5.
Distribution of gene-level haplotypes (HF001–HF012, the 12 most frequent haplotypes) of two lead candidate genes across 3000 Rice Genomes subspecies groups: (a) the Pti1-like kinase Os01g0323100 at the BPH chromosome 1 locus; (b) Os04g0244800 at the WBPH chromosome 4 locus. Both are positional candidates, not functionally validated.
Figure 6.
Subpopulation resistance-allele composition across the 11 FDR loci: resistance-allele frequency per subpopulation (columns split by pest), a subpopulation dendrogram clustered on resistance composition, and mean BPH/WBPH SES per subpopulation are shown. Descriptive by construction, not independent validation (see Section 3.6).
4. Discussion
4.1. Genetic Architecture: Distinct Detectable Signals on a Background of Low Genomic Heritability
The central quantitative result of this study concerns the genetic architecture of resistance to the two planthoppers. The top-association loci for BPH and WBPH did not co-locate anywhere in the genome (Figure S4), and the candidate genes at these loci drew from a largely common set of defense-mechanism modules (Figure S5). We do not read either pattern as strong biological evidence, because permutation testing showed that both lie close to random expectation. Given only six and five loci in a ~373 Mb genome, non-overlap of the top signals is the majority outcome under random placement (no cross-trait coincidence in ~85% of permutations; Figure S4), and cross-trait detection power for the discovered loci was low (median 0.48). Likewise, the sharing of eight of nine mechanism modules did not exceed the sharing produced by matched random locus sets (empirical p = 0.61; Figure S6), because defense-related gene families are distributed densely throughout the rice genome. Whether the two resistances share any polygenic background is, however, not resolved by these data. The cross-trait genomic correlation was rg = 0.38 (bivariate REML), but the underlying genetic covariance was not significantly different from zero (Vg = 0.059, SE = 0.059, Z = 1.00, p = 0.32), so rg = 0.38 (SE ≈ 0.33) cannot be distinguished from either 0 or 1. Likewise, the phenotypic correlation is weak (r = 0.26) and, at genomic heritabilities of only 0.10 and 0.22, its genetic component is small (≈rg·√(h21h22) ≈ 0.06). We therefore do not claim a demonstrated shared genetic background. The most defensible reading is that BPH and WBPH resistance in RDP1 are associated with distinct, individually detectable candidate loci on a background of low genomic heritability, and that any cross-trait sharing remains below the resolution of this panel. This reading is more conservative than either strict locus-level pest-specificity or mechanism-level convergence. It does not require invoking pest-specific selection or convergence beyond what defense-gene density alone predicts. It remains compatible with the established single-gene, cross-pest resistance of Bph3 and Bph6 [11,12], which act at loci not sampled among our top signals, and with the observation that WBPH feeding induces phenolamide biosynthesis [18].
For resistance breeding, the practical implication is that no single mapped locus was associated with resistance to both pests in this panel. Assembling resistance to both planthoppers will therefore likely require combining several of the candidate loci reported here rather than relying on any one of them. This also addresses the well-recognized risk that planthopper biotypes can overcome single major resistance genes [9].
4.2. Novelty Relative to Known Loci and the WBPH Mapping Gap
None of the loci mapped here co-localizes with a cloned Bph gene (Section 3.3; Table 1). Benchmarking the WBPH loci against previously mapped, uncloned WBPH loci, however, provides a more nuanced picture (Table S4). Four of the five WBPH loci fall on chromosomes carrying reported WBPH resistance loci (3, 4, 5 and 11), chr9 being the sole exception. For three of these (on chromosomes 3, 4 and 11), co-location can be assessed only at chromosome level: chromosome 4 (Wbph8(t)/Qbp2 [14]), chromosome 3 (Wbph7(t)/Qbp1 [14]; qWBPH3.1/3.2 [16]), chromosome 11 (Wbph6(t) [48]; qWBPH11 [16] and qWBPH11Y11 [17]). Because those earlier loci were defined only at linkage (cM/RFLP) resolution, direct physical overlap cannot be resolved; these loci are therefore best regarded as candidates whose co-location with a known WBPH locus cannot be excluded, rather than as unambiguously new. The fourth, the chromosome 5 locus, is the clearest case, and the only one for which a physical interval was reported: its lead SNP at 28.04 Mb lies only ~20 kb distal to RM3170, the distal flanking marker of the ovicidal-resistance QTL qWL5 (chr5 25.4–28.0 Mb [15]; marker positions determined by in silico PCR against IRGSP-1.0). Although the two map to the same chromosome 5 region, they concern different resistance mechanisms: seedling antibiosis here versus ovicidal (watery-lesion) resistance for qWL5. Co-location therefore cannot be positively confirmed, and this region may simply contribute to more than one mode of WBPH resistance.
The BPH loci, by contrast, were benchmarked only against the ~17 cloned Bph genes and not against the ~70 reported BPH loci/QTL. Because three of the six BPH loci lie on chromosome 1, which carries mapped BPH QTL, including a major chromosome 1 locus reported in the indica variety IR64 [49], the “novel candidate (vs. cloned Bph)” label denotes novelty relative to cloned genes only, and co-location of the BPH chromosome 1 loci with an uncloned BPH QTL cannot be excluded. By contrast, the WBPH chromosome 9 locus lies on a chromosome for which we found no previously reported WBPH resistance gene or QTL, and it was the most robust signal across all three models; it is therefore the strongest candidate novel WBPH locus and a priority for follow-up.
The resistance allele at the chromosome 9 locus is, however, already fixed in the indica, aromatic, temperate-japonica and tropical-japonica accessions of RDP1 (frequency = 1.00 in each) and segregates only within aus (0.65), so the entire phenotypic contrast at this locus rests on the aus subgroup (Table 2). Although it passes structure correction (Δ = 1.09) and is model-robust, variation that is narrowly confined to one subgroup warrants explicit confirmation that the signal is not a residual-structure artifact. The same distribution also limits the breeding value of this locus. Where the resistance allele is already fixed, marker selection can deliver no gain; its practical relevance lies instead in guarding against inadvertent loss of that allele in wide crosses to aus or to wild relatives. The same caution applies to novelty. In recent blast-resistance work, GWAS peaks adjacent to the known Ptr and Pia loci proved to be new alleles of those genes rather than new loci [26]. We therefore reserve “novel” for the chromosome 9 WBPH signal and treat the chromosome 3, 4, 5 and 11 loci as candidates whose co-location with mapped WBPH QTL cannot be excluded (Table 1). Where the earlier locus carries positional information, for example Wbph6(t) on the chromosome 11 short arm near RM167, the same arm as our chromosome 11 locus at 5.80 Mb, co-location is more plausible. More broadly, whereas classical WBPH genetics rests on biparental populations, this study contributes the first diversity-panel GWAS view of WBPH host resistance, complementing rather than duplicating the earlier linkage maps.
4.3. Candidate Genes (Interpreted with Caution)
Regional association mapping nominated several defense-plausible candidate genes, which we interpret conservatively because none have been functionally validated. The narrow BPH chromosome 1 support interval (~35 kb) contains a Pti1-like kinase (Os01g0323100) and an adjacent receptor-like kinase (Os01g0323000), genes of the recognition/signaling modules that feature prominently among cloned planthopper resistance genes [8] (noting that Pti1-family kinases can act as negative regulators of basal defense, so the sign of any resistance effect requires functional confirmation). The narrowness of that interval should not be read as strength of evidence: the lead variant is low-frequency and is in high linkage disequilibrium with essentially none of the surrounding common SNPs (Figure 4a), so the interval is narrow partly because the association is carried by a poorly tagged variant. The BPH chromosome 5 interval spans a cytochrome P450 (CYP90D5, Os05g0200400); although P450s participate broadly in secondary metabolism and detoxification, the canonical role of the CYP90D subfamily is in brassinosteroid metabolism, so its link to resistance remains hypothetical. No mechanism module was specific to either pest: all eight modules represented among the candidate genes were shared, consistent with the permutation result that module sharing does not exceed a random-placement background. Consistent with a supporting rather than confirmatory role, candidate-gene haplotypes showed subspecies structure in the 3K RGP; the 3K accessions themselves were not phenotyped for planthopper resistance.
4.4. Breeding Implications
The breeding value of these loci must be judged against the heritability estimates. Within the single screening, repeatability was high (H2 = 0.75 for BPH and 0.64 for WBPH on an accession-mean basis), but genomic heritability was much lower (h2g = 0.10 ± 0.06 and 0.22 ± 0.08), so most of the repeatable variation is not captured by additive 44 K marker effects. Selection on the individual loci reported here is therefore expected to give only modest gains, particularly for BPH. With these limits in mind, indica, which was among the most resistant subpopulations, is a likely broad source of candidate resistance donors. Candidate-gene haplotypes are strongly partitioned by subspecies (Figure 5), so haplotype identity can be used to track candidate alleles across the 3K RGP; the direction of the resistance effect, however, is taken from the RDP1 allele-effect estimates (Table 2) rather than from haplotype frequency alone. The 3K RGP accession lists for each haplotype, retrievable from the public 3K RGP genotypes, are unphenotyped candidate resources that provide a starting point for developing marker-assisted selection (MAS) assays, for example, KASP or CAPS conversion of the lead or flanking SNPs followed by validation, in the same haplotype-to-donor framework recently applied to drought and blast resistance [25,26]. The lead SNPs themselves are 44 K-array probes rather than deployable diagnostic markers. Combined with the pyramiding rationale above, these resources point toward assembling dual BPH/WBPH resistance by stacking several candidate alleles, which are indica-derived at most WBPH loci but japonica-derived at the BPH chromosome 1 locus (Table 2).
Unlike the uniformly indica/aus superior haplotypes reported for drought-yield genes [25], the source of resistance alleles in RDP1 is locus-specific (Table 2), and the two strongest loci are close to mirror images of each other. At the BPH chromosome 1 (Pti1) locus the resistance allele is absent from indica and aus (frequency = 0.00 in both) and is confined to temperate japonica (0.24; it is absent from tropical japonica as well), whereas at the WBPH chromosome 4 locus it is essentially fixed in indica (0.99) and aus (1.00) but only intermediate in japonica (0.54); the chromosome 9 allele, as noted above, is fixed outside aus. Comprehensive dual resistance therefore cannot be assembled within the indica gene pool alone. It would require inter-subspecific pyramiding, that is, introgressing the temperate-japonica-restricted chromosome 1 allele into an indica background that already carries the chromosome 4 and chromosome 11 (0.90 in indica) alleles. Donor selection must therefore be made per locus rather than from a single subpopulation, even though indica is among the most resistant subgroups overall.
To make per-locus donor selection operational, we rank every RDP1 accession by its resistance-allele load across the BPH and WBPH loci alongside its measured SES, and summarize these values at the subpopulation level (Figure 6; Table S9); the highest-ranking accessions are listed as a working shortlist in Table 3. The accessions that combine the most resistance alleles at both pests with low SES, predominantly aus and indica, are candidate parents for dual-resistance pyramiding, pending bioassay validation, and, unlike the 3K RGP haplotype lists, every accession in Table 3 was itself phenotyped for both pests in this study. Because this ranking is built from the discovery lead SNPs, whose effects are upward-biased, and because the 3K donor accessions were not themselves phenotyped for either planthopper, it is a prioritized, validation-pending shortlist rather than a validated donor set. Independent bioassay confirmation of the selected accessions against geographically diverse planthopper populations and biotypes, together with validation of converted markers, is required before deployment. A further, quantitative caution follows from the heritability estimates: the BPH genomic heritability (0.10 ± 0.06) is barely distinguishable from zero, so the phenotypic gain realized by selecting on these markers in a breeding population is likely to fall short of what the per-locus effect estimates alone would imply. Our HDRA regional association analysis also extends the open High-Density Rice Array, shown to resolve causal variants and to distinguish candidate genes only 2 Mb apart [30], from grain and agronomic traits to insect-resistance loci, although here it yielded sub-megabase intervals only at the two BPH loci.
Table 3.
Validation-pending candidate donor accessions for dual BPH/WBPH resistance in the RDP1 panel. Accessions are those carrying complete genotypes at all 11 FDR loci and scoring SES ≤ 5.0 against both pests, ranked by total resistance-allele load and then by mean SES; the 15 highest-ranking are shown. “BPH alleles” and “WBPH alleles” count the loci (of six and five respectively) at which the accession carries the resistance allele.
One further interpretation of these loci deserves to be stated explicitly: they may be specific to the planthopper lineages used for screening. Both colonies were laboratory populations of a characterized biotype, biotype 1 in the case of BPH, chosen deliberately because field populations comprise a mixture of biotypes and would confound a resistance-gene screen (Section 2.2). The mapped loci should therefore initially be regarded as associated with resistance to these specific laboratory populations. The candidate alleles, including the chromosome 9 WBPH and chromosome 1 BPH signals, may reflect defenses effective against them in particular. Because planthopper populations carry substantial standing virulence variation and have repeatedly adapted to deployed resistance genes [9], these alleles should be re-evaluated against geographically diverse populations and biotypes before any breeding or deployment recommendation; conversely, a locus that looks modest against biotype 1 might behave differently against another lineage. This bounds the generality of the results rather than their internal validity. The single 2016 screening bounds it further, because genotype × environment interaction and year-to-year reproducibility could not be assessed.
In the context of sustainable planthopper management, host-plant resistance reduces reliance on insecticides, whose overuse has driven the metabolic insecticide resistance and resurgence problems noted above [2,3]. The value of a dual BPH/WBPH resource is that a single cultivar background could carry resistance to both pests; but two cautions apply. First, single major resistance genes are repeatedly overcome by adapting planthopper biotypes [9], yet the candidate loci reported here are of modest effect, and their per-locus PVE values are upward-biased relative rankings rather than absolute variance explained, so a pyramid of them may confer partial rather than qualitative resistance, and its durability would need to be monitored across biotypes and seasons. Second, the resources here define a prioritized entry point into an integrated pest-management breeding pipeline, not a finished set of deployable donors.
4.5. Limitations
Several limitations temper these conclusions. First, phenotypes came from a single screening. The three seedbox replicates gave within-screening broad-sense heritabilities of 0.75 (BPH) and 0.64 (WBPH) on the accession-mean basis (Table S2B), confirming that both traits are substantially repeatable; because the replicates were seedboxes within one screening rather than independent environments, however, these estimates exclude genotype-by-environment interaction. The much lower genomic heritabilities (h2g = 0.10 for BPH, 0.22 for WBPH) indicate limited marker-based capture rather than an absent signal. We interpret this as a few detectable loci of modest effect superimposed on a weak polygenic background, a pattern reminiscent of the oligogenic architecture of cloned planthopper resistance, although the per-locus effects here are smaller. Second, all candidate genes await functional validation. Relatedly, with only six and five loci and limited cross-trait power (median 0.48), the locus non-overlap and module-sharing patterns are descriptive rather than evidence of a pest-specific or convergent architecture (Section 4.1). Third, mapping power in the indica and japonica panels is limited by their sizes, and the 44 K marker density was only partly offset by HDRA regional association, which did not resolve the WBPH chromosome 4 locus; the 3K haplotype analysis was restricted to candidates with clear coordinate correspondence. These caveats define concrete priorities for follow-up: multi-environment phenotyping, functional validation of the chromosome 1 candidates, higher-resolution mapping of the chromosome 4 associated region, and expanded haplotype–phenotype validation in the 3K RGP.
5. Conclusions
Parallel association mapping in RDP1 identified six BPH and five WBPH candidate loci. All lie at least 2.38 Mb from cloned Bph genes and are therefore novel candidate loci relative to cloned Bph genes; correspondence with previously reported but uncloned BPH or WBPH QTL cannot be excluded. Six loci were detected in more than one scan, whereas five were detected in a single scan and are regarded as suggestive. The WBPH chromosome 9 locus, detected by all three models on a chromosome without known WBPH loci, is the strongest novel candidate. The top-association signals for the two pests did not co-locate, and their candidate genes shared most defense-mechanism modules; however, neither pattern exceeded random expectation, and the cross-trait genomic correlation was not significant. The data are therefore most consistent with distinct candidate loci on a background of low genomic heritability, without establishing a shared polygenic background. The loci were mapped in a single 2016 greenhouse screening against laboratory colonies, including BPH biotype 1, and should first be regarded as associated with resistance to these populations. Validation with geographically diverse populations and biotypes, and across environments, is needed before broader breeding or deployment recommendations are made. Because genomic heritability was low (0.10 for BPH and 0.22 for WBPH) despite high within-screening repeatability, and because per-locus PVE values indicate only a relative ranking, the expected gain from selecting on individual loci is modest. To our knowledge, this is the first diversity-panel dissection of WBPH host resistance alongside a matched BPH analysis. Its deliverables are candidate resources rather than validated tools: a narrow BPH support interval on chromosome 1, an unresolved WBPH associated region on chromosome 4, the WBPH chromosome 9 locus, and candidate donor accessions and 3K RGP haplotypes. These resources require independent bioassay, marker and functional validation before use in planthopper resistance breeding.
Supplementary Materials
The following supporting information can be downloaded at https://www.mdpi.com/article/10.3390/agronomy16181856/s1: Figure S1: Structure-corrected resistance-allele effects (SES residualized on PC1–4) at the four lead candidate loci; Figure S2: Genome-wide linkage-disequilibrium decay across RDP1; Figure S3: Complete Manhattan and threshold plots for all 18 panel × model analyses (BPH and WBPH); Figure S4: Null distribution of cross-trait locus coincidences under random genomic placement (permutation); Figure S5: Defense-mechanism module composition of the candidate genes, BPH versus WBPH; Figure S6: Null distribution of shared defense modules from matched random locus sets (permutation); Table S1: Accession-level phenotype means (S1A) and replicate-level SES scores (S1B) for BPH and WBPH in RDP1; Table S2: Phenotype descriptive statistics by subspecies group (S2A), replicate-based broad-sense heritability (S2B), and genomic heritability (S2C); Table S3: Genomic-inflation factors for all panel × model analyses; Table S4: Previously reported (uncloned) WBPH resistance genes/QTL and their co-location with the WBPH loci mapped in this study; Table S5: Cross-trait detection power for each FDR-significant locus; Table S6: Defense-mechanism module counts per locus; Table S7: Positional candidate genes within the HDRA support intervals (refined and broader-interval sets; for the chromosome 4 locus, the 590 kb window-1 and 141 kb window-2 intervals are listed separately); Table S8: Per-locus resistance-allele effects, raw (dSES) and structure-corrected (dResid); Table S9: Per-accession resistance-allele load and candidate-donor ranking matrix for RDP1 (validation pending). References [50,51,52,53] are cited in the Supplementary Materials.
Author Contributions
Conceptualization, L.-Y.C., S.-H.H., C.-P.L. and D.-H.W.; methodology, L.-Y.C., S.-H.H. and D.-H.W.; investigation, L.-Y.C. and D.-H.W.; resources, S.-H.H. and C.-P.L.; formal analysis, L.-Y.C. and D.-H.W.; validation, L.-Y.C. and D.-H.W.; writing—original draft preparation, L.-Y.C. and D.-H.W.; writing—review and editing, L.-Y.C. and D.-H.W.; supervision, D.-H.W.; funding acquisition, D.-H.W. All authors have read and agreed to the published version of the manuscript.
Funding
This research was funded by the National Science and Technology Council of Taiwan, grant numbers MOST 109-2321-B-005-023; MOST 110-2321-B-005-011; NSTC 114-2313-B-005-051 and NSTC 115-2923-B-005-003.
Institutional Review Board Statement
Not applicable.
Informed Consent Statement
Not applicable.
Data Availability Statement
The brown planthopper and white-backed planthopper resistance phenotypes generated in this study are provided in Table S1. All analysis scripts, a figure/table-to-script reproducibility map, and the R-package inventory (REPRODUCIBILITY.md) are archived at Zenodo (DOI: 10.5281/zenodo.21931626). The genotype data analyzed are publicly available: RDP1 44 K genotypes at http://www.ricediversity.org, and the HDRA (~700 K) and 3000 Rice Genomes Project variant data from the sources cited in Section 2.3 [30,31].
Acknowledgments
We gratefully acknowledge the members of the Crop Science Division, Taiwan Agricultural Research Institute, Ministry of Agriculture (MOA), for their help in conducting the experiments. During the preparation of this manuscript, the authors used Claude Code (v2.1) for the purposes of checking grammar, assisting with data analysis, and figure-generation code. The authors have reviewed and edited the output and take full responsibility for the content of this publication.
Conflicts of Interest
The authors declare no conflicts of interest.
Abbreviations
The following abbreviations are used in this manuscript:
| BPH | brown planthopper |
| WBPH | white-backed planthopper |
| RDP1 | Rice Diversity Panel 1 |
| GWAS | genome-wide association study |
| MSST | Modified Seedbox Screening Test |
| SES | Standard Evaluation System |
| SNP | single nucleotide polymorphism |
| MAF | minor allele frequency |
| RGP | Rice Genomes Project |
| FDR | false discovery rate |
References
- Liu, D.; Zhong, Y.; Li, Z.; Hou, M. Rice Varietal Resistance to the Vector Sogatella furcifera Hinders Transmission of Southern Rice Black-Streaked Dwarf Virus. Pest Manag. Sci. 2024, 80, 3684–3690. [Google Scholar] [CrossRef] [Scilit] [PubMed]
- Mu, X.; Zhang, W.; Wang, L.; Zhang, S.; Zhang, K.; Gao, C.; Wu, S. Resistance Monitoring and Cross-Resistance Patterns of Three Rice Planthoppers, Nilaparvata lugens, Sogatella furcifera and Laodelphax striatellus, to Dinotefuran in China. Pestic. Biochem. Physiol. 2016, 134, 8–13. [Google Scholar] [CrossRef] [Scilit] [PubMed]
- Wang, X.-G.; Ruan, Y.-W.; Gong, C.-W.; Xiang, X.; Xu, X.; Zhang, Y.-M.; Shen, L.-T. Transcriptome Analysis of Sogatella furcifera (Homoptera: Delphacidae) in Response to Sulfoxaflor and Functional Verification of Resistance-Related P450 Genes. Int. J. Mol. Sci. 2019, 20, 4573. [Google Scholar] [CrossRef] [Scilit] [PubMed]
- Lai, P.-Y.; Huang, S.-H. Laboratory Evaluation of the Effect of Insecticides for Controlling Brown Planthopper [Nilaparvata lugens (Stål)] and Whitebacked Planthopper [Sogatella furcifera (Horváth)] in Chiayi Region. J. Taiwan Agric. Res. 2021, 70, 285–297. [Google Scholar] [CrossRef]
- Matsumura, M.; Sanada-Morimura, S.; Otuka, A.; Sonoda, S.; Van Thanh, D.; Van Chien, H.; Van Tuong, P.; Loc, P.M.; Liu, Z.-W.; Zhu, Z.-R.; et al. Insecticide Susceptibilities of the Two Rice Planthoppers Nilaparvata lugens and Sogatella furcifera in East Asia, the Red River Delta, and the Mekong Delta. Pest Manag. Sci. 2018, 74, 456–464. [Google Scholar] [CrossRef] [Scilit] [PubMed]
- Wang, C.-L.; Luo, P.-Q.; Hu, F.-Y.; Li, Y.; Sung, C.-L.; Kuang, Y.-H.; Lin, S.-C.; Yang, Z.-W.; Li, C.-P.; Huang, S.-H.; et al. Pyramiding BPH Genes in Rice Maintains Resistance against the Brown Planthopper under Climate Change. Pest Manag. Sci. 2024, 80, 1740–1750. [Google Scholar] [CrossRef] [Scilit] [PubMed]
- Huang, S.-H.; Cheng, C.-H.; Chen, C.-N.; Wu, W.-J. Bioassay of the Biotypes of Brown Planthopper in Taiwan. J. Taiwan Agric. Res. 2016, 65, 84–91. [Google Scholar] [CrossRef]
- Yan, L.; Luo, T.; Huang, D.; Wei, M.; Ma, Z.; Liu, C.; Qin, Y.; Zhou, X.; Lu, Y.; Li, R.; et al. Recent Advances in Molecular Mechanism and Breeding Utilization of Brown Planthopper Resistance Genes in Rice: An Integrated Review. Int. J. Mol. Sci. 2023, 24, 12061. [Google Scholar] [CrossRef] [Scilit] [PubMed]
- Ye, Y.; Xiong, S.; Guan, X.; Tang, T.; Zhu, Z.; Zhu, X.; Hu, J.; Wu, J.; Zhang, S. Insight into Rice Resistance to the Brown Planthopper: Gene Cloning, Functional Analysis, and Breeding Applications. Int. J. Mol. Sci. 2024, 25, 13397. [Google Scholar] [CrossRef] [Scilit] [PubMed]
- Mishra, A.; Barik, S.R.; Pandit, E.; Yadav, S.S.; Das, S.R.; Pradhan, S.K. Genetics, Mechanisms and Deployment of Brown Planthopper Resistance Genes in Rice. Crit. Rev. Plant Sci. 2022, 41, 91–127. [Google Scholar] [CrossRef] [Scilit]
- Liu, Y.; Wu, H.; Chen, H.; Liu, Y.; He, J.; Kang, H.; Sun, Z.; Pan, G.; Wang, Q.; Hu, J.; et al. A Gene Cluster Encoding Lectin Receptor Kinases Confers Broad-Spectrum and Durable Insect Resistance in Rice. Nat. Biotechnol. 2014, 33, 301–305. [Google Scholar] [CrossRef] [Scilit] [PubMed]
- Guo, J.; Xu, C.; Wu, D.; Zhao, Y.; Qiu, Y.; Wang, X.; Ouyang, Y.; Cai, B.; Liu, X.; Jing, S.; et al. Bph6 Encodes an Exocyst-Localized Protein and Confers Broad Resistance to Planthoppers in Rice. Nat. Genet. 2018, 50, 297–306. [Google Scholar] [CrossRef] [Scilit] [PubMed]
- Li, C.-P.; Huang, S.-H.; Chen, J.-R.; Tseng, T.-H.; Lai, M.-H.; Ku, H.-M. Molecular Characterization of Introgression Lines from a Wild Rice, Oryza officinalis, with Resistance to Brown Planthopper. J. Taiwan Agric. Res. 2011, 60, 263–278. [Google Scholar]
- Tan, G.X.; Weng, Q.M.; Ren, X.; Huang, Z.; Zhu, L.L.; He, G.C. Two Whitebacked Planthopper Resistance Genes in Rice Share the Same Loci with Those for Brown Planthopper Resistance. Heredity 2004, 92, 212–217. [Google Scholar] [CrossRef] [Scilit] [PubMed]
- Yang, Y.; Xu, J.; Leng, Y.; Xiong, G.; Hu, J.; Zhang, G.; Huang, L.; Wang, L.; Guo, L.; Li, J.; et al. Quantitative Trait Loci Identification, Fine Mapping and Gene Expression Profiling for Ovicidal Response to Whitebacked Planthopper (Sogatella furcifera Horvath) in Rice (Oryza sativa L.). BMC Plant Biol. 2014, 14, 145. [Google Scholar] [CrossRef] [Scilit] [PubMed]
- Fan, D.; Liu, Y.; Zhang, H.; He, J.; Huang, F.; Huang, S.; Wu, B.; Liu, D.; Wen, P.; Liu, L.; et al. Identification and Fine Mapping of qWBPH11 Conferring Resistance to Whitebacked Planthopper (Sogatella furcifera Horvath) in Rice (Oryza sativa L.). Mol. Breed. 2018, 38, 96. [Google Scholar] [CrossRef] [Scilit]
- Yang, M.; Li, D.-T.; Fan, S.-J.; Cheng, X.-N.; Liu, Y.-Q.; Wan, J.-M. Mapping of QTLs for Resistance to White-Backed Planthopper in Guangxi Wild Rice Y11. Acta Agron. Sin. 2022, 48, 2715–2723. [Google Scholar] [CrossRef] [Scilit]
- Wang, W.; Yu, Z.; Meng, J.; Zhou, P.; Luo, T.; Zhang, J.; Wu, J.; Lou, Y. Rice Phenolamindes Reduce the Survival of Female Adults of the White-Backed Planthoppers (Sogatella furcifera). Sci. Rep. 2020, 10, 5789. [Google Scholar] [CrossRef] [Scilit] [PubMed]
- Jan, R.; Asif, S.; Asaf, S.; Lubna; Khan, Z.; Khan, W.; Kim, K. Gamma-Aminobutyric Acid Treatment Promotes Resistance against Sogatella furcifera in Rice. Front. Plant Sci. 2024, 15, 1419999. [Google Scholar] [CrossRef] [Scilit] [PubMed]
- Shi, L.; Dong, M.; Lian, L.; Zhang, J.; Zhu, Y.; Kong, W.; Qiu, L.; Liu, D.; Xie, Z.; Zhan, Z.; et al. Genome-Wide Association Study Reveals a New Quantitative Trait Locus in Rice Related to Resistance to Brown Planthopper Nilaparvata lugens (Stål). Insects 2021, 12, 836. [Google Scholar] [CrossRef] [Scilit] [PubMed]
- Zhou, C.; Zhang, Q.; Chen, Y.; Huang, J.; Guo, Q.; Li, Y.; Wang, W.; Qiu, Y.; Guan, W.; Zhang, J.; et al. Balancing Selection and Wild Gene Pool Contribute to Resistance in Global Rice Germplasm against Planthopper. J. Integr. Plant Biol. 2021, 63, 1695–1711. [Google Scholar] [CrossRef] [Scilit] [PubMed]
- Zhou, C.; Jiang, W.; Guo, J.; Zhu, L.; Liu, L.; Liu, S.; Chen, R.; Du, B.; Huang, J. Genome-Wide Association Study and Genomic Prediction for Resistance to Brown Planthopper in Rice. Front. Plant Sci. 2024, 15, 1373081. [Google Scholar] [CrossRef] [Scilit] [PubMed]
- Zhao, K.; Tung, C.; Eizenga, G.; Wright, M.; Ali, M.; Price, A.; Norton, G.; Islam, M.; Reynolds, A.; Mezey, J.; et al. Genome-Wide Association Mapping Reveals a Rich Genetic Architecture of Complex Traits in Oryza sativa. Nat. Commun. 2011, 2, 467. [Google Scholar] [CrossRef] [Scilit] [PubMed]
- Leung, H.; Raghavan, C.; Zhou, B.; Oliva, R.; Choi, I.; Lacorte, V.; Jubay, M.; Cruz, C.; Gregorio, G.; Singh, R.; et al. Allele Mining and Enhanced Genetic Recombination for Rice Breeding. Rice 2015, 8, 34. [Google Scholar] [CrossRef] [Scilit] [PubMed]
- Singh, P.; Sundaram, K.; Vinukonda, V.; Venkateshwarlu, C.; Paul, P.; Pahi, B.; Gurjar, A.; Singh, U.; Kalia, S.; Kumar, A.; et al. Superior Haplotypes of Key Drought-Responsive Genes Reveal Opportunities for the Development of Climate-Resilient Rice Varieties. Commun. Biol. 2024, 7, 89. [Google Scholar] [CrossRef] [Scilit] [PubMed]
- Greenwood, J.; Lacorte-Apostol, V.; Kroj, T.; Padilla, J.; Telebanco-Yanoria, M.; Glaus, A.; Roulin, A.; Padilla, A.; Zhou, B.; Keller, B.; et al. A Genome-Wide Association Analysis Uncovers Rice Blast Resistance Alleles of Ptr and Pia. Commun. Biol. 2024, 7, 607. [Google Scholar] [CrossRef] [Scilit] [PubMed]
- Eizenga, G.; Ali, M.; Bryant, R.; Yeater, K.; McClung, A.; McCouch, S. Registration of the Rice Diversity Panel 1 for Genomewide Association Studies. J. Plant Regist. 2014, 8, 109–116. [Google Scholar] [CrossRef] [Scilit]
- Kovach, M.; Sweeney, M.; McCouch, S. New Insights into the History of Rice Domestication. Trends Genet. 2007, 23, 578–587. [Google Scholar] [CrossRef] [Scilit] [PubMed]
- International Rice Research Institute (IRRI). Standard Evaluation System (SES) for Rice, 5th ed.; IRRI: Los Baños, Philippines, 2013. [Google Scholar]
- McCouch, S.; Wright, M.; Tung, C.; Maron, L.; McNally, K.; Fitzgerald, M.; Singh, N.; DeClerck, G.; Agosto-Perez, F.; Korniliev, P.; et al. Open Access Resources for Genome-Wide Association Mapping in Rice. Nat. Commun. 2016, 7, 10532. [Google Scholar] [CrossRef] [Scilit] [PubMed]
- Wang, W.; Mauleon, R.; Hu, Z.; Chebotarov, D.; Tai, S.; Wu, Z.; Li, M.; Zheng, T.; Fuentes, R.R.; Zhang, F.; et al. Genomic Variation in 3,010 Diverse Accessions of Asian Cultivated Rice. Nature 2018, 557, 43–49. [Google Scholar] [CrossRef] [Scilit] [PubMed]
- Wang, J.; Zhang, Z. GAPIT Version 3: Boosting Power and Accuracy for Genomic Association and Prediction. Genom. Proteom. Bioinform. 2021, 19, 629–640. [Google Scholar] [CrossRef] [Scilit] [PubMed]
- Yu, J.; Pressoir, G.; Briggs, W.; Vroh Bi, I.; Yamasaki, M.; Doebley, J.; McMullen, M.; Gaut, B.; Nielsen, D.; Holland, J.; et al. A Unified Mixed-Model Method for Association Mapping That Accounts for Multiple Levels of Relatedness. Nat. Genet. 2006, 38, 203–208. [Google Scholar] [CrossRef] [Scilit] [PubMed]
- Liu, X.; Huang, M.; Fan, B.; Buckler, E.S.; Zhang, Z. Iterative Usage of Fixed and Random Effect Models for Powerful and Efficient Genome-Wide Association Studies. PLoS Genet. 2016, 12, e1005767. [Google Scholar] [CrossRef] [Scilit] [PubMed]
- Huang, M.; Liu, X.; Zhou, Y.; Summers, R.M.; Zhang, Z. BLINK: A Package for the Next Level of Genome-Wide Association Studies with Both Individuals and Markers in the Millions. GigaScience 2019, 8, giy154. [Google Scholar] [CrossRef] [Scilit] [PubMed]
- Sakai, H.; Lee, S.S.; Tanaka, T.; Numa, H.; Kim, J.; Kawahara, Y.; Wakimoto, H.; Yang, C.; Iwamoto, M.; Abe, T.; et al. Rice Annotation Project Database (RAP-DB): An Integrative and Interactive Database for Rice Genomics. Plant Cell Physiol. 2013, 54, e6. [Google Scholar] [CrossRef] [Scilit] [PubMed]
- Kawahara, Y.; de la Bastide, M.; Hamilton, J.P.; Kanamori, H.; McCombie, W.R.; Ouyang, S.; Schwartz, D.C.; Tanaka, T.; Wu, J.; Zhou, S.; et al. Improvement of the Oryza sativa Nipponbare Reference Genome Using Next Generation Sequence and Optical Map Data. Rice 2013, 6, 4. [Google Scholar] [CrossRef] [Scilit] [PubMed]
- Purcell, S.; Neale, B.; Todd-Brown, K.; Thomas, L.; Ferreira, M.; Bender, D.; Maller, J.; Sklar, P.; de Bakker, P.; Daly, M.; et al. PLINK: A Tool Set for Whole-Genome Association and Population-Based Linkage Analyses. Am. J. Hum. Genet. 2007, 81, 559–575. [Google Scholar] [CrossRef] [Scilit] [PubMed]
- Bates, D.; Mächler, M.; Bolker, B.; Walker, S. Fitting Linear Mixed-Effects Models Using lme4. J. Stat. Softw. 2015, 67, 1–48. [Google Scholar] [CrossRef] [Scilit]
- Endelman, J. Ridge Regression and Other Kernels for Genomic Selection with R Package rrBLUP. Plant Genome 2011, 4, 250–255. [Google Scholar] [CrossRef] [Scilit]
- Zhang, R.; Jia, G.; Diao, X. geneHapR: An R Package for Gene Haplotypic Statistics and Visualization. BMC Bioinform. 2023, 24, 199. [Google Scholar] [CrossRef] [Scilit] [PubMed]
- Covarrubias-Pazaran, G. Genome-Assisted Prediction of Quantitative Traits Using the R Package sommer. PLoS ONE 2016, 11, e0156744. [Google Scholar] [CrossRef] [Scilit] [PubMed]
- R Core Team. R: A Language and Environment for Statistical Computing; Version 4.6.0; R Foundation for Statistical Computing: Vienna, Austria, 2026. [Google Scholar]
- Du, B.; Zhang, W.; Liu, B.; Hu, J.; Wei, Z.; Shi, Z.; He, R.; Zhu, L.; Chen, R.; Han, B.; et al. Identification and Characterization of Bph14, a Gene Conferring Resistance to Brown Planthopper in Rice. Proc. Natl. Acad. Sci. USA 2009, 106, 22163–22168. [Google Scholar] [CrossRef] [Scilit] [PubMed]
- Zhao, Y.; Huang, J.; Wang, Z.; Jing, S.; Wang, Y.; Ouyang, Y.; Cai, B.; Xin, X.-F.; Liu, X.; Zhang, C.; et al. Allelic Diversity in an NLR Gene BPH9 Enables Rice to Combat Planthopper Variation. Proc. Natl. Acad. Sci. USA 2016, 113, 12850–12855. [Google Scholar] [CrossRef] [Scilit] [PubMed]
- Ren, J.; Gao, F.; Wu, X.; Lu, X.; Zeng, L.; Lv, J.; Su, X.; Luo, H.; Ren, G. Bph32, a Novel Gene Encoding an Unknown SCR Domain-Containing Protein, Confers Resistance against the Brown Planthopper in Rice. Sci. Rep. 2016, 6, 37645. [Google Scholar] [CrossRef] [Scilit] [PubMed]
- Wang, Y.; Cao, L.; Zhang, Y.; Cao, C.; Liu, F.; Huang, F.; Qiu, Y.; Li, R.; Lou, X. Map-Based Cloning and Characterization of BPH29, a B3 Domain-Containing Recessive Gene Conferring Brown Planthopper Resistance in Rice. J. Exp. Bot. 2015, 66, 6035–6045. [Google Scholar] [CrossRef] [Scilit] [PubMed]
- Li, X.; Zhai, H.; Wan, J. Preliminary Mapping of Wbph6(t), a New Gene Resistant to Whitebacked Planthopper in Rice. Rice Sci. 2004, 11, 86–90. [Google Scholar]
- Yang, M.; Cheng, L.; Yan, L.; Shu, W.; Wang, X.; Qiu, Y. Mapping and Characterization of a Quantitative Trait Locus Resistance to the Brown Planthopper in the Rice Variety IR64. Hereditas 2019, 156, 22. [Google Scholar] [CrossRef] [Scilit] [PubMed]
- Kim, E.-G.; Yun, S.; Park, J.-R.; Kim, K.-M. Identification of F3H, Major Secondary Metabolite-Related Gene That Confers Resistance against Whitebacked Planthopper through QTL Mapping in Rice. Plants 2021, 10, 81. [Google Scholar] [CrossRef] [Scilit] [PubMed]
- Geethanjali, S.; Kadirvel, P.; Gunathilagaraj, K.; Maheswaran, M. Detection of Quantitative Trait Loci (QTL) Associated with Resistance to Whitebacked Planthopper (Sogatella furcifera) in Rice (Oryza sativa). Plant Breed. 2009, 128, 130–136. [Google Scholar] [CrossRef] [Scilit]
- Khush, G.S.; Brar, D.S. Genetics of Resistance to Insects in Crop Plants. Adv. Agron. 1991, 45, 223–274. [Google Scholar] [CrossRef] [Scilit]
- Yamasaki, M.; Tsunematsu, H.; Yoshimura, A.; Iwata, N.; Yasui, H. Quantitative Trait Locus Mapping of Ovicidal Response in Rice (Oryza sativa L.) against Whitebacked Planthopper (Sogatella furcifera Horváth). Crop Sci. 1999, 39, 1178–1183. [Google Scholar] [CrossRef] [Scilit]

Disclaimer/Publisher’s Note: The statements, opinions and data contained in all publications are solely those of the individual author(s) and contributor(s) and not of MDPI and/or the editor(s). MDPI and/or the editor(s) disclaim responsibility for any injury to people or property resulting from any ideas, methods, instructions or products referred to in the content. |
© 2026 by the authors. Licensee MDPI, Basel, Switzerland. This article is an open access article distributed under the terms and conditions of the Creative Commons Attribution (CC BY) license.