


Abstract
This laboratory-scale study examined how soil particle-size distribution (PSD), especially the median diameter d50, affects slope runoff and sediment yield, and evaluated d50 as a simplified indicator for erosion prediction. Simulated-rainfall experiments were performed using a rainfall simulator and an adjustable steel flume. Five soils with contrasting PSDs (sandy loam to silty clay; d50 = 0.00524–0.06105 mm) were tested under three rainfall intensities (60, 90, and 120 mm h−1) for 45 min events, with two replicates per treatment (30 events total). Runoff rates increased with clay content: sandy loam < mixed sandy loam < loam < mixed silty clay < silty clay. Partial correlation analysis showed strong associations between runoff rates and d10, d30, d50, d60, and Cc, with a partial correlation coefficient of −0.78 for d50. Sediment yield rates showed the opposite trend, decreasing as clay content increased. Cumulative sediment yield increased with d50 via a positive power-law relationship, with calibration R2 values of 0.91–0.95 across rainfall intensities. The proposed d50-based erosion model achieved a calibration R2 of 0.97 with two fitted parameters (k1 and b) and inputs of rainfall erosivity, slope length, and slope steepness. These laboratory-scale results provide a preliminary basis for incorporating d50 into erosion-prediction models for production and construction projects; however, field validation is required before engineering application.
1. Introduction
Soil erodibility is governed by a suite of properties, including soil particle-size distribution (PSD), aggregate stability, bulk density, and organic matter content [1]. Among these, PSD is a fundamental property that is closely linked to soil porosity, permeability, and aggregate stability, and it thereby influences soil responses to external erosive forces. The PSD of eroded sediment largely mirrors that of the source soil [2,3]. Fine particles are preferentially detached and enriched in sediment early on, but as erosion proceeds, the transported sediment coarsens and approaches the original composition. Under concentrated flow, however, a “bimodal” pattern can emerge, with both fine and coarse particles transported preferentially over medium ones [4,5]. Particle size strongly influences the hydrodynamic conditions required for entrainment and deposition. Coarser particles generally resist detachment under low-energy runoff, whereas fine particles can be selectively removed; as energy increases, coarser particles become transportable, leading to sorting of eroded sediment [6,7]. The particle composition of eroded sediment is jointly influenced by soil structure and slope erosive dynamics, and the size discrepancy between eroded sediment and parent soil is affected by factors such as soil texture, clay content, aggregate characteristics, water content, rainfall intensity, raindrop diameter, and kinetic energy [8,9,10,11,12]. While the PSD of eroded sediment has been widely documented, the quantitative links between the median size of the original soil (after full dispersion) and slope runoff–sediment processes remain unclear. Although effective PSD (i.e., before chemical dispersion) may more realistically reflect sediment transport processes, this study uses the fully dispersed PSD as a simplified and reproducible indicator for model development, because it characterizes the intrinsic soil texture and can be readily measured and compared across soils. This study focuses primarily on interrill and sheet erosion; the relatively short slope length (1.0 m) and moderate rainfall duration (45 min) were designed to minimize rill development and capture the initial stages of slope erosion.
Soil erosion arising from production and construction projects has become one of the primary sources of newly induced soil loss [13,14]. Previous studies have characterized erosion patterns and driving factors in production and construction projects [15,16,17,18,19], and evaluated the erosion reduction performance of different conservation measures [20,21,22,23,24]. In terms of soil erosion prediction, slope erosion for different soil types in such projects has primarily been studied by categorizing soils into broad textural classes—namely clay, loam, and sand. For instance, Wang et al. [25] replaced the conventional soil erodibility factor with a soil–rock factor and developed separate soil erosion prediction models for clay, loam, and sand spoil heaps in production and construction projects. Cheng et al. [26], focusing on engineering cut slopes, estimated soil erodibility from silt content and bulk density, and successfully constructed a soil erosion model for cut slopes. While general guidelines for estimating soil loss from production and construction projects exist, often categorizing spoil heaps by textural classes and calculating equivalent slope gradients and lengths, a truly unified and universally applicable standard for soil erosion prediction models in these projects remains elusive. Even within the same textural class, PSD can vary considerably; such oversimplification undermines the scientific basis of erosion predictions in soil and water conservation plans. Soil PSD has been widely recognized as a key factor influencing erosion processes [27,28]. Existing prediction models for production and construction projects commonly adjust the soil erodibility factor within the USLE/RUSLE framework to reflect disturbed soil conditions [25,26]. These approaches, however, typically require multiple soil properties (clay, silt, sand, and organic matter), limiting their practical use. This study therefore explores d50 as a simplified indicator of PSD effects on erodibility.
We conducted simulated rainfall experiments on slope soils with different PSDs to quantify the relationships between characteristic particle sizes and erosion intensity, and to evaluate d50 as a simplified indicator for soil erodibility, providing a practical alternative to conventional complex evaluation methods. Based on the median particle size (d50), a preliminary soil erosion prediction model for production and construction projects was then developed and calibrated. The results may support the design of soil and water conservation schemes for production and construction projects, though further validation under broader conditions is needed.
2. Materials and Methods
2.1. Experimental Design
2.1.1. Experimental Equipment
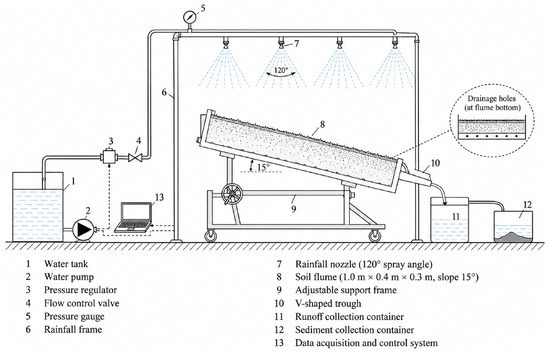
This experiment was carried out at the High and Steep Slope Hydraulic Erosion Observatory (107°59′36.10″ E, 34°19′24.83″ N) in Machaoling, Yangling District, Shaanxi, China. The downward-spraying artificial rainfall system (Figure 1) relies on water pressure to drive internal helical-blade nozzles, generating raindrops across a 120° spray angle. It produces rainfall intensities ranging from 0 to 200 mm·h−1 with spatial uniformity greater than 80%. Raindrop sizes range from 0.1 to 6 mm (median diameter: 1.09–2.25 mm), with fall velocities of 2.0–2.9 m·s−1. Rainfall intensity is tuned by adjusting water pressure (0.04–0.20 MPa) and nozzle specifications, and was calibrated to within ±5% of the target value prior to each experimental run.
Figure 1.
Schematic diagram of the experimental apparatus. Numbered components (1–13) are described in Section 2.1.1.
The complete experimental setup is shown schematically in Figure 1. A 1.0 m × 0.4 m × 0.3 m adjustable-slope steel soil flume (No. 8 in Figure 1) was used for all tests, with the slope fixed at 15°. Its bottom contained evenly spaced drainage holes (Figure 1 inset) for free internal drainage. A V-shaped trough (No. 10) at the flume outlet guided surface runoff and sediment into the runoff collection container (No. 11) and the sediment collection container (No. 12), respectively. The flume provided an effective plot area of 0.4 m2 (1.0 m × 0.4 m) with a 0.3 m soil depth. The water supply and rainfall simulation system consisted of a water tank (No. 1), water pump (No. 2), pressure regulator (No. 3), flow control valve (No. 4), pressure gauge (No. 5), rainfall frame (No. 6), and rainfall nozzles with a 120° spray angle (No. 7). Rainfall intensity was regulated via the pressure regulator and flow control valve, and monitored by the data acquisition and control system (No. 13).
2.1.2. Soil Samples
The three original soils (TYA, TYC, and TYE) were collected from the High and Steep Slope Hydraulic Erosion Observatory in Yangling District, Shaanxi Province, China. Sampling was conducted on abandoned farmland with no vegetation cover at the time of collection. Within the observatory area, three spatially independent sampling sites were selected to represent the range of soil textures present. At each site, a composite sample was prepared by collecting five subsamples from the surface layer (0–20 cm depth) along a 10 m transect using a stainless-steel spade. The five subsamples from each site were thoroughly homogenized in situ to form one composite sample per site, and visible plant residues and stones were removed. Soil samples were air-dried at room temperature, gently crushed, and passed through a 2 mm sieve before use. The sampling design was intended to ensure that each composite sample is representative of the respective soil type within the observatory area.
The soil texture classification follows the International System (IS) of soil texture classification. In the IS system, the silt–sand boundary is set at 0.02 mm, with sand defined as 2–0.02 mm, silt as 0.02–0.002 mm, and clay as <0.002 mm. This differs from the USDA system, in which the silt–sand boundary is 0.05 mm. The IS classification was used in this study because it is the conventional system for soil texture determination in China and is consistent with the 0.02 mm silt–sand boundary adopted by the laser diffraction measurements. The resulting texture classes (sandy loam, loam, silty clay loam, and silty clay) therefore follow the IS nomenclature. To facilitate international comparison, the equivalent USDA texture classes are approximately similar for the sandy loam and loam samples, but the silty clay loam and silty clay samples may shift toward silt loam or silty clay under the USDA system due to the different silt–sand boundary.
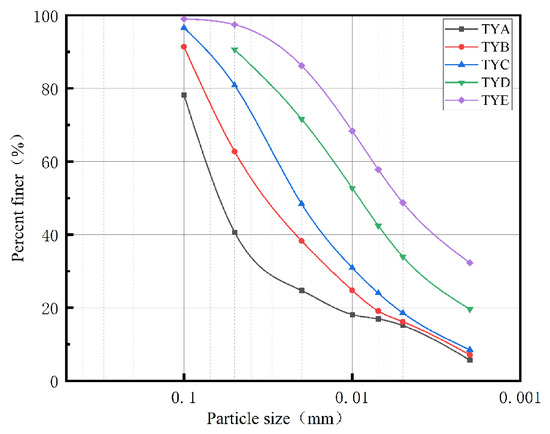
The test soils were obtained by collecting three original soils (TYA, TYC, and TYE) and determining their PSDs. TYA and TYC, as well as TYC and TYE, were then mixed at a mass ratio of 1:1, respectively. The mixing was performed on a dry-mass basis: equal dry masses of the two parent soils were thoroughly homogenized by manual stirring and repeated sieving (passing through a 2 mm sieve three times) to ensure uniform distribution of particles. TYB and TYD are therefore artificial mixtures rather than natural soils. The five soils showed a continuous gradation trend in particle composition, with detailed PSD characteristics shown in Figure 2 and Table 1.
Figure 2.
Cumulative particle-size distribution curves of the five soils.
Table 1.
Particle-size composition and characteristic diameters of the tested soils.
Particle-size distribution was determined using the Mastersizer 2000 laser diffraction analyzer (Malvern Instruments, Malvern, UK). Prior to measurement, soil samples were pretreated with 10% hydrogen peroxide to remove organic matter, followed by ultrasonic dispersion for 3 min. Sodium hexametaphosphate was used as the dispersing agent. Each sample was measured in triplicate, and the average value was reported.
The measured PSD values of TYB and TYD are not arithmetic means of their parent soils, as they were obtained from direct measurement of the mixed samples. The deviations from the theoretical means (Table 1) reflect the inherent variability in the mixing and measurement processes; triplicate measurements showed coefficients of variation < 5% for all particle-size fractions.
It should be noted that the PSD reported in Table 1 refers to the fully dispersed PSD of the original soil (i.e., after chemical dispersion), which is used here as a fundamental physical property to characterize soil texture. This is distinct from the effective PSD (before dispersion), which reflects the actual transport state of the sediment particles. While effective PSD may more realistically represent sediment transport behavior, the present study focuses on the fully dispersed PSD as a simplified and reproducible indicator for model development.
The 0.02 mm silt-sand boundary used in this study follows the convention commonly adopted in Chinese soil science research. The curvature coefficient (Cc) and uniformity coefficient (Cu) are standard shape descriptors derived directly from the cumulative particle-size distribution (PSD) curve. Mathematically, they are defined by three characteristic diameters (d10, d30, d60) on the PSD curve and can be computed for any soil type as long as a continuous gradation curve is available; hence their descriptive scope inherently covers textures from sandy loam to silty clay, rather than being restricted to coarse-grained soils. It should be noted that the classic USCS well-graded criteria (1 < Cc < 3, Cu ≥ 6) apply only to sands and gravels, but this does not invalidate the use of Cc and Cu as general PSD morphological metrics for fine-textured soils. This approach is well supported by published literature. Zha et al. [29] investigated the shear strength characteristics of muddy interlayers—typical fine-grained soils—and found that Cc and Cu exerted a dominant control on shear strength parameters, far exceeding the influence of water content. Li and Zhang [30] similarly employed Cc and Cu to characterize the PSD of slip zone soils and linked these parameters to mechanical behaviors. Wang et al. [31] further confirmed the descriptive value of gradation parameters across nine texture classes, including clayey and silty soils. In this study, Cc and Cu are employed purely as descriptive statistical measures of PSD shape across all five soils, consistent with this broader framework of application.
2.1.3. Rainfall Treatments and Experimental Design
According to the criteria for short-duration, high-intensity erosive rainfall on the Loess Plateau (I5 = 1.52 mm/min, I10 = 1.05 mm/min) [32], three rainfall intensities (60, 90, and 120 mm·h−1) were selected to represent a gradient from moderate to extreme erosive events. The I5 and I10 criteria denote the rainfall intensities at 5 min and 10 min durations, respectively, that are capable of initiating runoff and soil erosion on Loess Plateau slopes, as established by Zhou and Wang [32]. The lowest intensity (60 mm·h−1 = 1.0 mm·min−1) corresponds to a 45 min rainfall depth of 45 mm, which is within the range of local erosive storm rainfall amounts; the intermediate intensity (90 mm·h−1 = 1.5 mm·min−1) provides a transition between moderate and extreme events; and the highest intensity (120 mm·h−1 = 2.0 mm·min−1) represents an extreme erosive scenario. All three intensities are capable of generating surface runoff under the experimental conditions. All three intensities are capable of generating surface runoff under the experimental conditions. The highest intensity (120 mm·h−1 = 2.0 mm·min−1) represents an extreme erosive scenario that substantially exceeds all short-duration rainfall thresholds. The intermediate intensity (90 mm·h−1 = 1.5 mm·min−1) provides a transition between moderate and extreme events. Given that most natural erosive rainfall events last tens of minutes to less than one hour, each simulated rainfall duration was set to 45 min, excluding the runoff initiation time [33].
The selected rainfall intensities and durations are consistent with the characteristics of local erosive storms in the southern Loess Plateau. Wu et al. [34] analyzed natural rainfall in Yangling and reported that erosive events in this region are typically short-duration, high-intensity storms, with rainfall intensities commonly exceeding 60 mm h−1. Records from the Changwu station further show that short-duration events prevail among local erosive rainstorms; although nearly 30% of erosive events last less than 30 min, most high-intensity erosive rainfall phases are concentrated within one hour [35]. Therefore, the 45 min rainfall duration adopted in this study represents a conservative upper bound for the high-intensity phase of typical erosive events in the study area.
The rainfall duration after runoff initiation was 45 min; runoff initiation occurred 3–8 min after simulator start. The total rainfall duration from simulator start therefore ranged from 48 to 53 min. Because the same soil type was exposed to the same rainfall duration after runoff initiation, the effective rainfall duration was consistent across treatments. The corresponding rainfall depths after runoff initiation were 45, 67.5, and 90 mm for the 60, 90, and 120 mm·h−1 treatments, respectively. These depths fall within the range of local erosive storm rainfall amounts reported for the southern Loess Plateau.
Each treatment was replicated twice, giving a total of 30 rainfall events. Paired-samples t-tests confirmed that there were no significant differences in runoff or sediment yield between the two replicates for each treatment (p > 0.05). While two replicates permit basic statistical comparison, this replication level is consistent with common practice in simulated rainfall erosion studies [36], where experimental constraints such as the time required for soil preparation, pre-wetting, and sediment processing often limit the number of replicates. We acknowledge that two replicates provide limited statistical power and that a larger number of replicates would be desirable.
2.1.4. Experimental Procedure
We used custom-built steel flumes with adjustable slopes for the experiment. A 5 cm layer of natural fine sand was placed at the flume bottom as a permeable base, separated from test soil by gauze to prevent particle mixing. Soils were packed into the flumes to a total depth of 30 cm (six layers of 5 cm each) to a target bulk density of 1.34 g·cm−3. The mass of dry soil added per layer was 26.8 kg, calculated as the product of the target bulk density (1.34 g·cm−3) and the layer volume (1.0 m × 0.4 m × 0.05 m = 0.02 m3). Prior to packing, the air-dried soils were adjusted to a gravimetric moisture content of 8–10% (approximately 20–25% of field capacity) by spraying a predetermined amount of deionized water and equilibrating in sealed containers for 24 h. This moisture content helped facilitate uniform compaction and minimize dust generation during packing. Each layer was weighed and uniformly spread before compaction. A hand compactor was used to achieve the target density, and the actual bulk density of each layer was verified by the core sampling method (three replicates per layer) with a tolerance of ±0.05 g·cm−3. Between layers, the surface was lightly scarified with a rake to ensure interlayer bonding. Extra compaction was applied along the flume walls using a standardized procedure: a 5 cm wide manual roller was passed three times along each wall edge. The applied force was controlled at 100 ± 10 N by attaching a calibrated spring scale to the roller handle and monitoring the reading during each pass. The force was maintained constant across all passes and all flumes to ensure consistency. To verify that compaction was uniform along the wall edges, additional core samples (three replicates per layer, taken at 10 cm from each wall) were collected and compared with the core samples taken at the flume center. The results showed that the bulk density near the walls (1.32–1.36 g·cm−3) did not differ significantly from the center values (p > 0.05), confirming that the wall-compaction procedure effectively minimized boundary effects and produced uniform soil conditions across the flume cross-section.
A newly prepared soil bed was used for each rainfall event. The treatment order was randomized within each replicate to avoid any systematic bias due to environmental changes over time.
Before each run, rainfall intensity was calibrated to within ±5% of the target value. Field capacity was determined in the laboratory using the pressure plate method at 33 kPa (n = 3 per soil type). Pre-wetting was performed by applying a fine mist spray (approximately 5 mm equivalent rainfall) over 30 min until the surface soil moisture reached approximately 80% of field capacity. The actual soil moisture content before each rainfall event was measured gravimetrically (three samples per flume) immediately before rainfall initiation. The mean pre-rainfall gravimetric moisture contents were 18.6%, 19.3%, 20.2%, 21.4%, and 22.1% for TYA, TYB, TYC, TYD, and TYE, respectively, corresponding to 78–82% of the respective field capacity values for each soil. These values confirm that the pre-wetting procedure achieved consistent initial moisture conditions across all treatments and replicates. After pre-wetting, the flume was covered with plastic sheeting and left for 24 h to allow moisture redistribution.
Rainfall was initiated at the preset intensity, and the time to runoff initiation was recorded as the elapsed time between the start of rainfall and the moment when continuous surface flow reached the flume outlet. Runoff initiation time was collected solely as a quality-control indicator to confirm that each experimental run generated surface runoff under the prescribed conditions. Since this variable was not intended for hypothesis testing and varied primarily as a function of soil type and antecedent moisture rather than as a treatment effect, it is not reported or analyzed in the Results. The recorded values (3–8 min across all treatments) confirm that all runs successfully generated runoff within a reasonable timeframe. Runoff and sediment samples were collected at 1 min intervals for the first 3 min of runoff, and at 3 min intervals thereafter, yielding 17 samples per run. Total runoff volume for each interval was measured by collecting the entire outflow in pre-weighed containers and recording the water volume. The collected samples represent the full interval runoff rather than grab samples, ensuring accurate mass balance calculations.
Following each event, the collected sediment samples were settled for 24 h. The supernatant was carefully decanted, and the residual sediment was transferred to aluminum boxes, oven-dried at 105 °C to a constant mass (weight variation < 0.02 g between consecutive measurements), and weighed using an electronic balance (precision = 0.01 g) for sediment yield calculation.
Notably, the 24 h settling and decantation procedure may lose fine suspended particles, especially for clay-rich soils, potentially underestimating total sediment yield. According to Stokes’ law, particles larger than approximately 1.1 μm fully settle within 24 h under the experimental conditions (water column height = 10 cm, water temperature = 20 °C). For the five tested soils, particles finer than 1.1 μm account for less than 10–15% of the total soil mass, as inferred from the d10 values in Table 1; a fraction of these fine particles can also settle in aggregated forms. Therefore, the resultant underestimation of sediment yield is limited, although it is not entirely negligible. Future studies can eliminate this bias by filtering supernatants through 0.45 μm membranes or directly drying the entire runoff-sediment mixture.
2.2. Data Analysis
The runoff rate (Vq), defined as the runoff volume per unit area per unit time, was calculated using the following formula [24]:
where Vq is the runoff rate; Q is the runoff volume (mL) collected during time T; T is the measurement time (s); b is the flow width (m); and L is the slope length of the experimental plot (m).
The sediment yield rate (Sv), defined as the sediment yield per unit area per unit time, was calculated using the following formula [24]:
where G is the sediment mass (g) collected during time T.
Cumulative runoff and cumulative sediment yield were calculated by integrating the runoff rate and sediment yield rate over the sampling intervals. Because the sampling intervals varied (1 min intervals for the first 3 min of runoff, followed by 3 min intervals thereafter), the cumulative values were obtained by summing the products of each measured rate and its corresponding sampling duration. Specifically, cumulative runoff was computed as
and cumulative sediment yield as
where Vq,i is the runoff rate for sampling interval i (L min−1 m−2), Sv,i is the sediment yield rate for sampling interval i (g min−1 m−2), Ti is the duration of the i-th sampling interval (min), and n is the total number of samples (n = 17 per rainfall event). Because Vq,i and Sv,i are normalized by plot area, Qcum is expressed in L m−2 (numerically equivalent to mm of runoff depth) and Gcum is expressed in g m−2. To express cumulative runoff as total volume (m3) or cumulative sediment yield as total mass (g) over the 0.4 m2 plot, the following conversions apply:
where A = 0.4 m2 is the effective plot area. Throughout this manuscript, cumulative runoff is reported in mm (equivalent to L m−2) and cumulative sediment yield in g m−2, unless otherwise stated.
Building on existing erosion models for engineering cut slopes [26] and spoil heaps [25], we developed a slope erosion prediction model for production and construction projects using characteristic particle-size parameters.
where M is the soil loss (g·m−2); R is the event rainfall erosivity factor (MJ·mm·m−2·h−1); K is the soil erodibility factor (g·h·MJ−1·mm−1); L is the slope length factor (dimensionless); and G is the slope steepness factor (dimensionless).
The event rainfall erosivity (R) is calculated as
where I30 is the maximum 30 min rainfall intensity (mm·h−1); E is the total kinetic energy of the rainfall (MJ·m−2), which is calculated as
where gi is the rainfall kinetic energy per unit rainfall depth for time interval i (MJ·m−2·mm−1); pri is the rainfall amount for time interval i (mm); hi is the breakpoint rainfall intensity (mm·h−1); i = 1, 2, …, n, where n is the number of segments into which the rainfall event is divided according to rainfall intensity.
The soil erodibility (K) is calculated as
where k1 and b are empirical model parameters calibrated from the experimental data. This simplification is justified by the strong correlation observed between d50 and cumulative sediment yield, and allows the model to operate with a single, easily measurable textural parameter.
The slope length factor (L) and slope gradient factor (S) were calculated using the method for engineering spoil heaps proposed by Wang et al. [25]:
where λ is the projected slope length (m).
where θ is the slope gradient.
For comparison, we also applied the erodibility estimation method of Cheng et al. [26], which uses the silt mass fraction (Z) and bulk density (ρ) to estimate the soil erodibility factor:
where k2 is an empirical coefficient. To ensure a fair comparison, k2 was calibrated using the same dataset and the same nonlinear least-squares procedure (Levenberg–Marquardt algorithm) as the proposed d50-based model. The calibrated value of k2 was 0.3624. Both models were calibrated and evaluated on the complete experimental dataset (n = 15 treatments). We acknowledge that using the same dataset for calibration and evaluation does not constitute independent model testing; therefore, the reported R2 values represent calibration goodness of fit rather than predictive performance. Independent validation with external datasets is needed in future work.
Nonlinear regression was applied to characterize the power-law relationships between cumulative sediment yield or cumulative runoff and median particle size d50, following the model (, where Q denotes cumulative sediment yield (g·m−2) or cumulative runoff (m3), and a and b are empirically fitted parameters. Parameter estimation was performed via least-squares minimization using the Levenberg–Marquardt algorithm within the Curve Estimation (POWER) module of SPSS 26.0. The coefficient of determination (R2) and F-statistic were used as goodness of fit metrics. For each rainfall intensity level, the regression was based on five soil types (i.e., one d50 per soil), and the results are reported separately by intensity.
Correlation and partial correlation analyses (Pearson) were conducted to examine associations between erosion variables and soil texture indicators, with rainfall intensity controlled as a covariate in partial correlation. Because only five distinct PSD values were available (one per soil type), and these five soils constitute the full set of contrasting textures examined in this study rather than independent random samples from a population, the effective sample size for soil-texture-based inference is five. Treating temporally repeated observations or treatment combinations as independent replicates would constitute pseudoreplication. Accordingly, all correlations between erosion variables and soil texture parameters are reported as descriptive measures of association. The p-values associated with these correlations are not used to support inferential conclusions about PSD effects. The five particle-size parameters d10, d30, d50, d60, and Cc are also highly intercorrelated (r > 0.85) because they are derived from the same underlying PSD curve; partial correlation coefficients should therefore be interpreted as descriptive measures of association rather than indicators of independent causal effects.
The factorial design (5 soils × 3 rainfall intensities) and temporally repeated observations include between-subject factors (soil type, rainfall intensity) and a within-subject factor (time). Because each treatment combination (soil × rainfall intensity) had only one experimental unit (one soil flume) with 17 temporal observations, the 17 time points cannot be treated as independent replicates. To avoid pseudoreplication, we first computed the mean of the 17 time points for each treatment combination, yielding 15 independent treatment means (5 soils × 3 rainfall intensities). A two-way ANOVA was then performed on these treatment means with soil type and rainfall intensity as fixed factors. Because each cell had only one observation, the soil × intensity interaction could not be estimated and was therefore treated as the error term (df = 8). Tukey’s HSD test was used for post hoc comparisons. Linear mixed-effects models would be the appropriate method for handling the random effect of soil and temporal autocorrelation if a larger number of independent soil samples were available; this is recommended for future work. For correlations involving soil texture parameters (Table 2), we continue to report them as descriptive measures of association without formal significance tests, because only five independent PSD values were available.
Table 2.
Descriptive Correlations and Partial Correlations of Runoff and Sediment Yield Rates with Soil Characteristic Particle-Size Parameters.
The proposed erosion prediction model was calibrated against the complete experimental dataset without separate data for external validation. Accordingly, the reported model performance reflects calibration goodness of fit rather than verified predictive ability; independent laboratory or field datasets are needed in future work to evaluate its real-world prediction capacity.
All statistical analyses were performed using SPSS 26.0, and all figures were produced in Origin 2024.
3. Results
3.1. Effects of Soil Particle-Size Distribution on Slope Runoff Generation Processes
The target rainfall intensities were 60, 90, and 120 mm·h−1; the actual measured intensities were within ±5% of the target values for all runs (mean ± SD: 60.2 ± 2.1, 89.5 ± 3.2, and 119.8 ± 4.3 mm·h−1, respectively). The initial gravimetric soil moisture content before each rainfall event ranged from 18.5% to 22.3% across soils, depending on soil texture and pre-wetting conditions. The target bulk density was 1.34 g·cm−3; actual measured bulk densities ranged from 1.31 to 1.36 g·cm−3 (mean ± SD: 1.34 ± 0.02 g·cm−3) across all treatments. These values confirm the consistency of experimental conditions across runs.
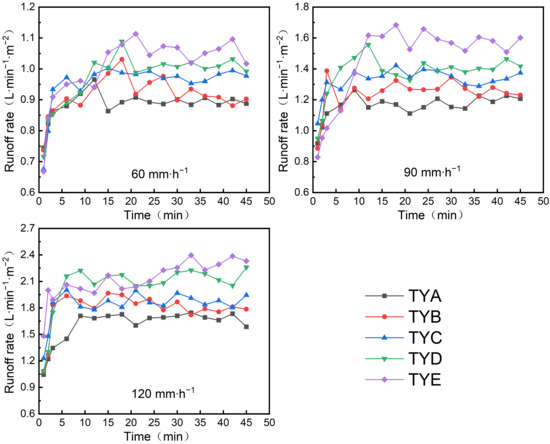
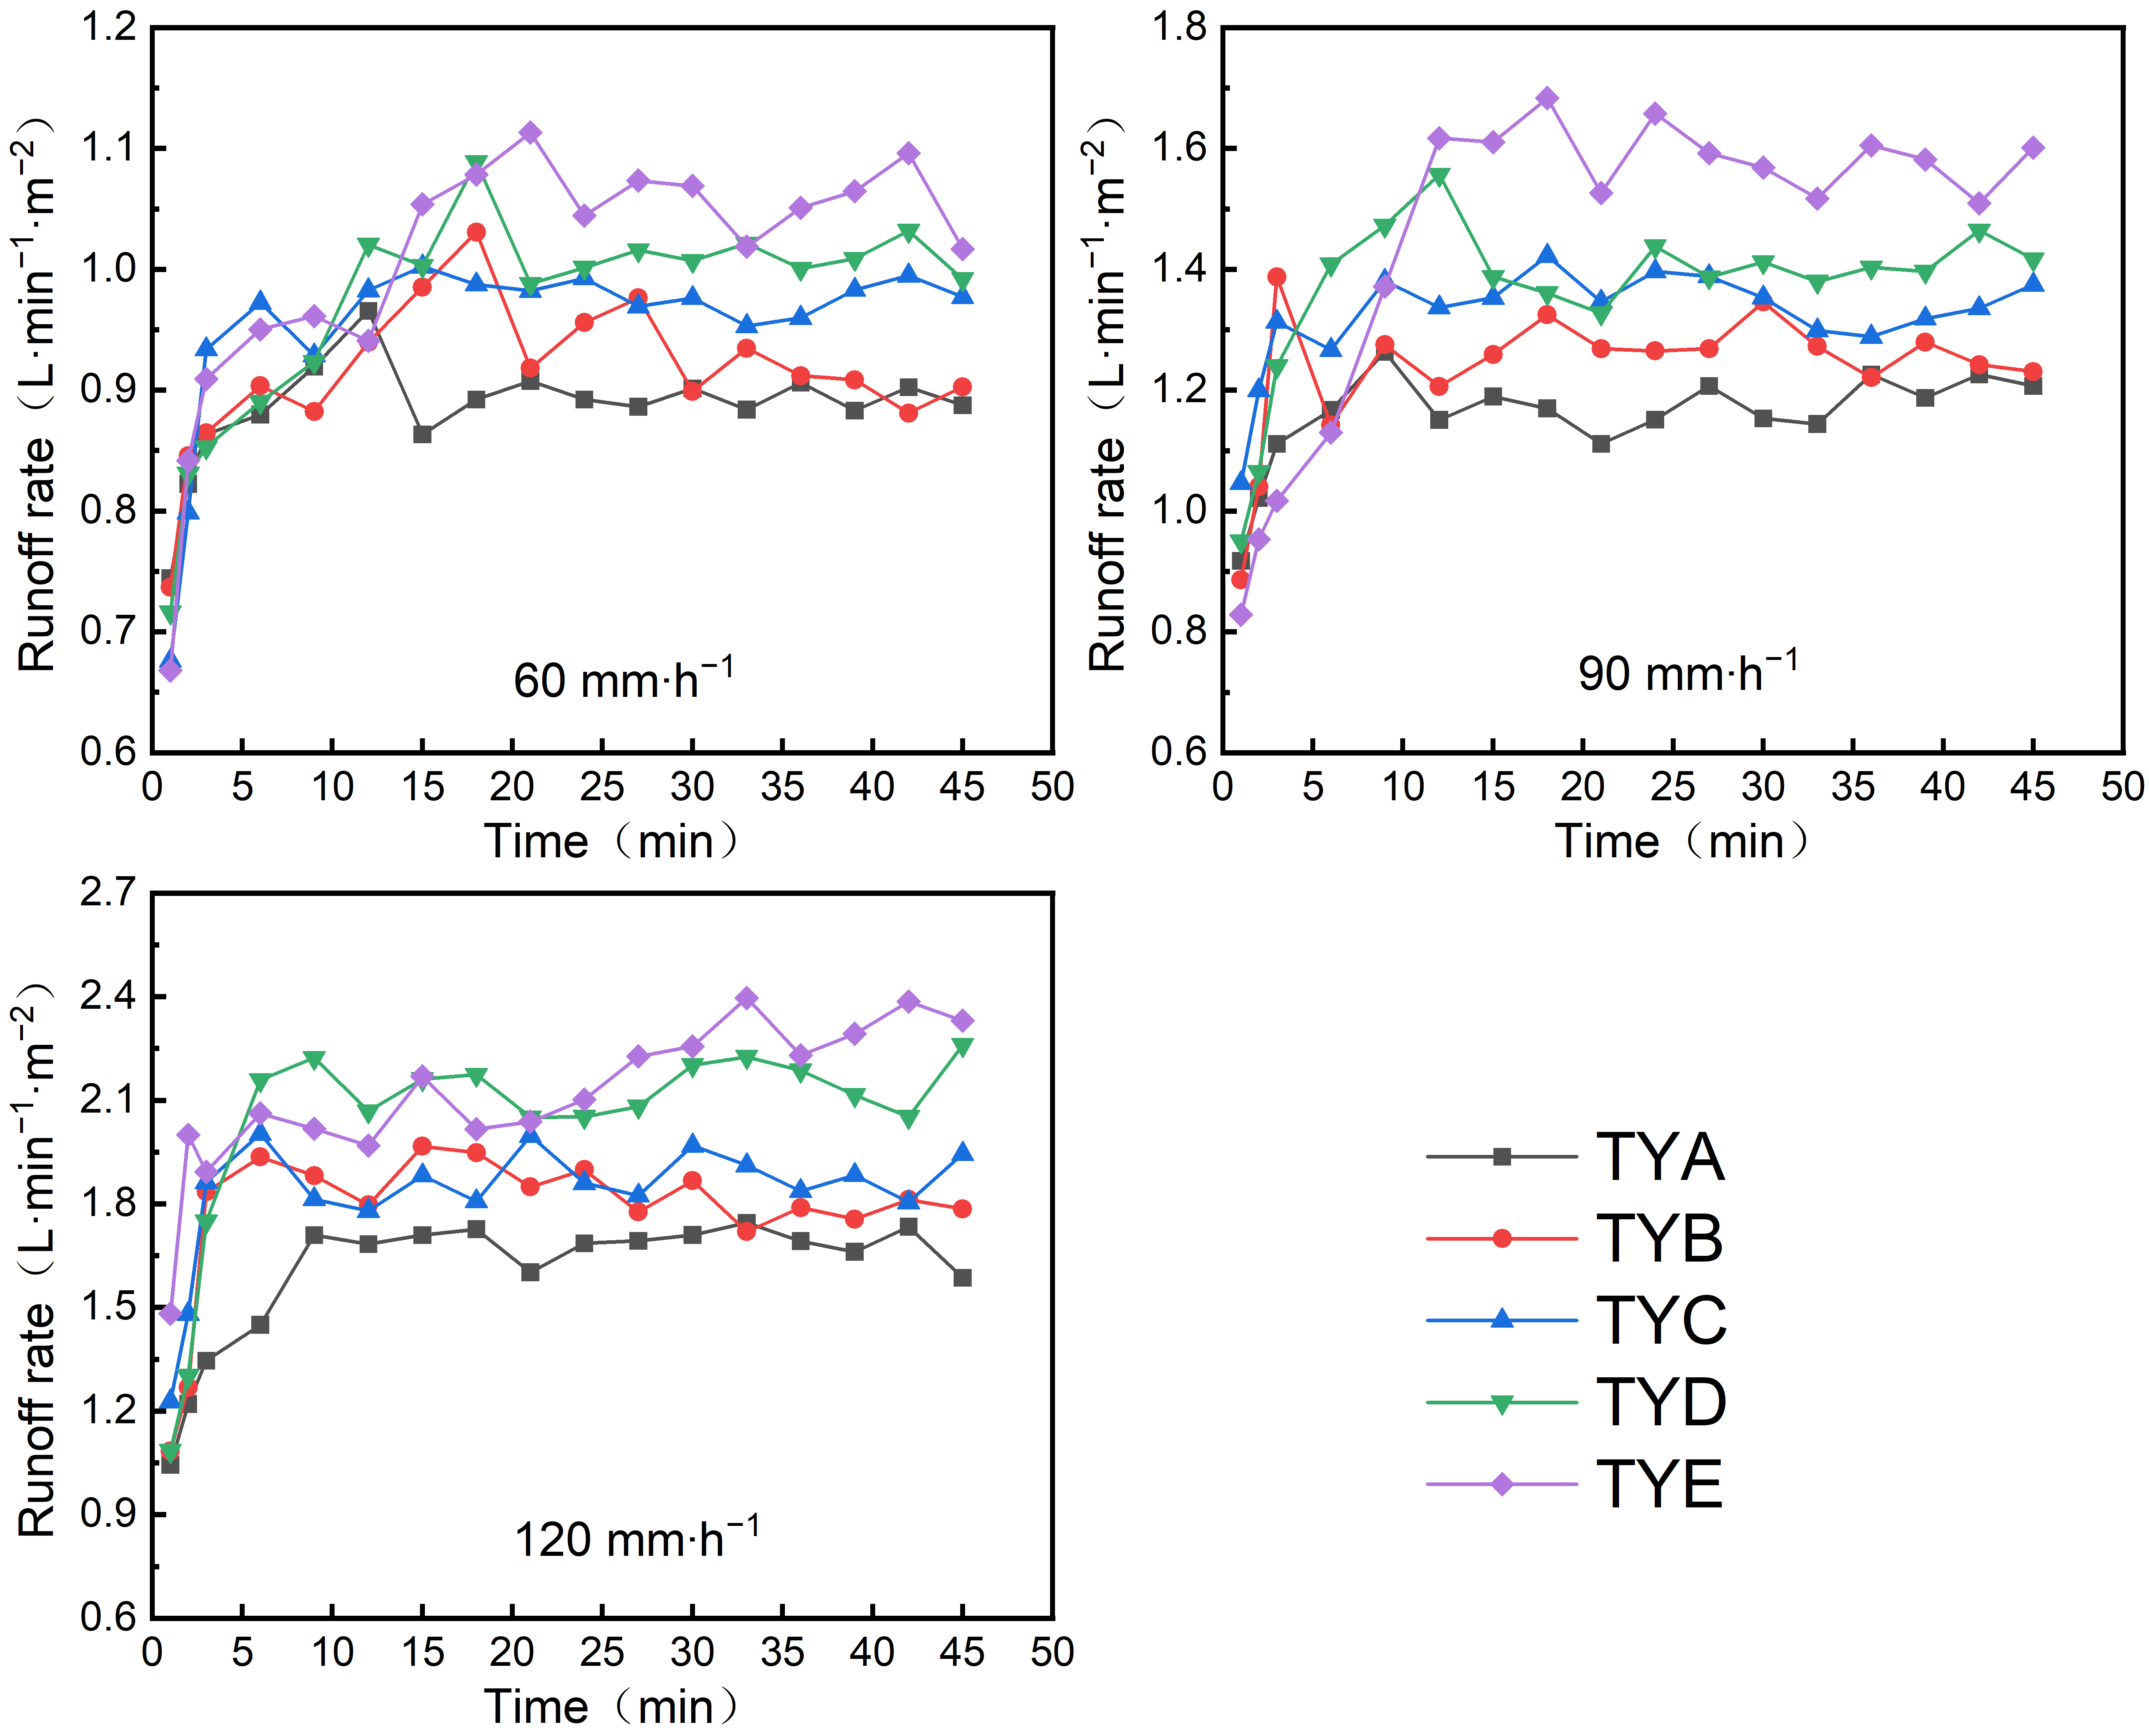
Runoff generation processes followed consistent temporal patterns across all five soils under three rainfall intensities (Figure 3). A consistent textural sequence emerged for runoff rate, with TYA registering the lowest and TYE the highest values. Runoff rate was moderately related to characteristic particle size parameters (Cc, d10, d30, d50, d60) (Table 2), with partial correlations ranging from −0.67 to −0.79. Soils with higher clay content were associated with higher runoff rates in this study. Previous studies have attributed such patterns to stronger interparticle cohesion, a denser structure, greater water-holding capacity, and lower infiltration rates [11], which would favor surface runoff generation. Surface sealing and crust formation have also been reported to reduce infiltration capacity and promote surface runoff. Rainfall intensity, however, showed a stronger correlation with runoff rate (r = 0.87) than any soil texture parameter (partial correlations of −0.67 to −0.79). Soil texture should therefore be regarded as a secondary or associated factor rather than the dominant driver of runoff generation, with rainfall intensity exerting the primary control. Two-way ANOVA on treatment means (n = 15) confirmed that rainfall intensity had a significant effect on runoff rate (F(2, 8) = 134.02, p < 0.001, partial η2 = 0.971), and soil type also had a significant effect (F(4, 8) = 4.69, p = 0.030, partial η2 = 0.701). Tukey’s HSD test showed that runoff rate differed significantly between TYA and TYE (p = 0.028); other soil pairs did not differ significantly (p > 0.05). All rainfall intensity pairs differed significantly (p ≤ 0.001). Because each treatment combination had only one experimental unit, the soil × intensity interaction could not be estimated and was used as the error term (df = 8). The mechanisms linking texture to runoff—such as interparticle cohesion, pore structure, infiltration capacity, surface sealing, and crust formation—were not measured in this study and are discussed below only as plausible explanations for the observed patterns.
Figure 3.
Temporal variations in slope runoff rate for soils under different rainfall intensities.
It should be noted that the characteristic particle-size parameters (d10, d30, d50, d60) are highly intercorrelated, with correlation coefficients exceeding 0.85. This multicollinearity arises because these parameters are derived from the same underlying PSD curve. Therefore, the partial correlation coefficients reported in Table 2 should be interpreted as descriptive measures of association rather than as indicators of independent effects. The selection of d50 as the representative indicator for model development was based on its common usage in soil erosion studies and its practical significance as the median particle size, acknowledging that its effects may reflect the broader influence of the entire PSD rather than a uniquely identifiable causal factor.
Under controlled rainfall intensity, partial correlation analysis was performed between runoff rate and the soil characteristic particle sizes (d10, d30, d50, d60), curvature coefficient (Cc), and uniformity coefficient (Cu). The partial correlations with runoff rate were moderate and negative for d10, d30, d50, d60, and Cc (|r| = 0.67–0.79), and weak and negative for Cu (r = −0.23). For sediment yield rate, the partial correlations were moderate and positive for d10, d30, d50, d60, and Cc (|r| = 0.39–0.48), and weak and positive for Cu (r = 0.12). The simple correlations were weak for all parameters (|r| ≤ 0.24). Because only five independent PSD values were available, these coefficients are interpreted as descriptive measures of association rather than formal significance tests. These results indicate that soil texture was significantly associated with slope runoff generation, although rainfall intensity exerted a stronger control. Differences in particle composition and pore structure may influence soil permeability and runoff characteristics, but these properties were not directly measured in this study. The curvature coefficient (Cc) describes the shape of the particle-size distribution curve. A larger Cc is conventionally associated with well-graded soils and stable pore architecture, which has been reported to restrict infiltration and favor surface runoff. However, Cc effects may be texture-dependent. For sandy soils, high Cc may coincide with abundant coarse particles and large intergranular pores, which could enhance infiltration and limit runoff under low-to-moderate rainfall intensities. In our dataset, the observed negative correlation between Cc and runoff rate may arise because high-Cc samples were predominantly sandy; however, infiltration capacity and pore architecture were not measured in this study, so this interpretation remains speculative. By contrast, low-Cc clay-rich soils produced greater runoff, which is consistent with the expected effect of surface crusting reported in previous studies [11], although crust formation was not directly observed here. Under high rainfall intensity, surface runoff increased sharply across all particle gradations, consistent with the infiltration-excess runoff mechanism [31]; however, infiltration rates were not measured in this study. The infiltration-excess mechanism is therefore presented as a possible interpretation supported by general hydrological theory, rather than as a demonstrated mechanism in the present experiment. Runoff rate thus increases progressively as soil texture shifts from sandy loam to silty clay, driven by the combined effects of particle-size composition, soil physical properties, rainfall intensity and duration. The runoff generation process represents an interaction between soil texture and rainfall conditions.
3.2. Effects of Soil Particle-Size Distribution on Cumulative Slope Runoff
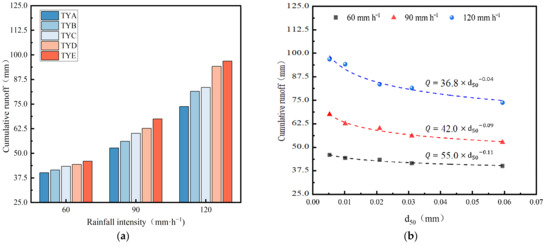
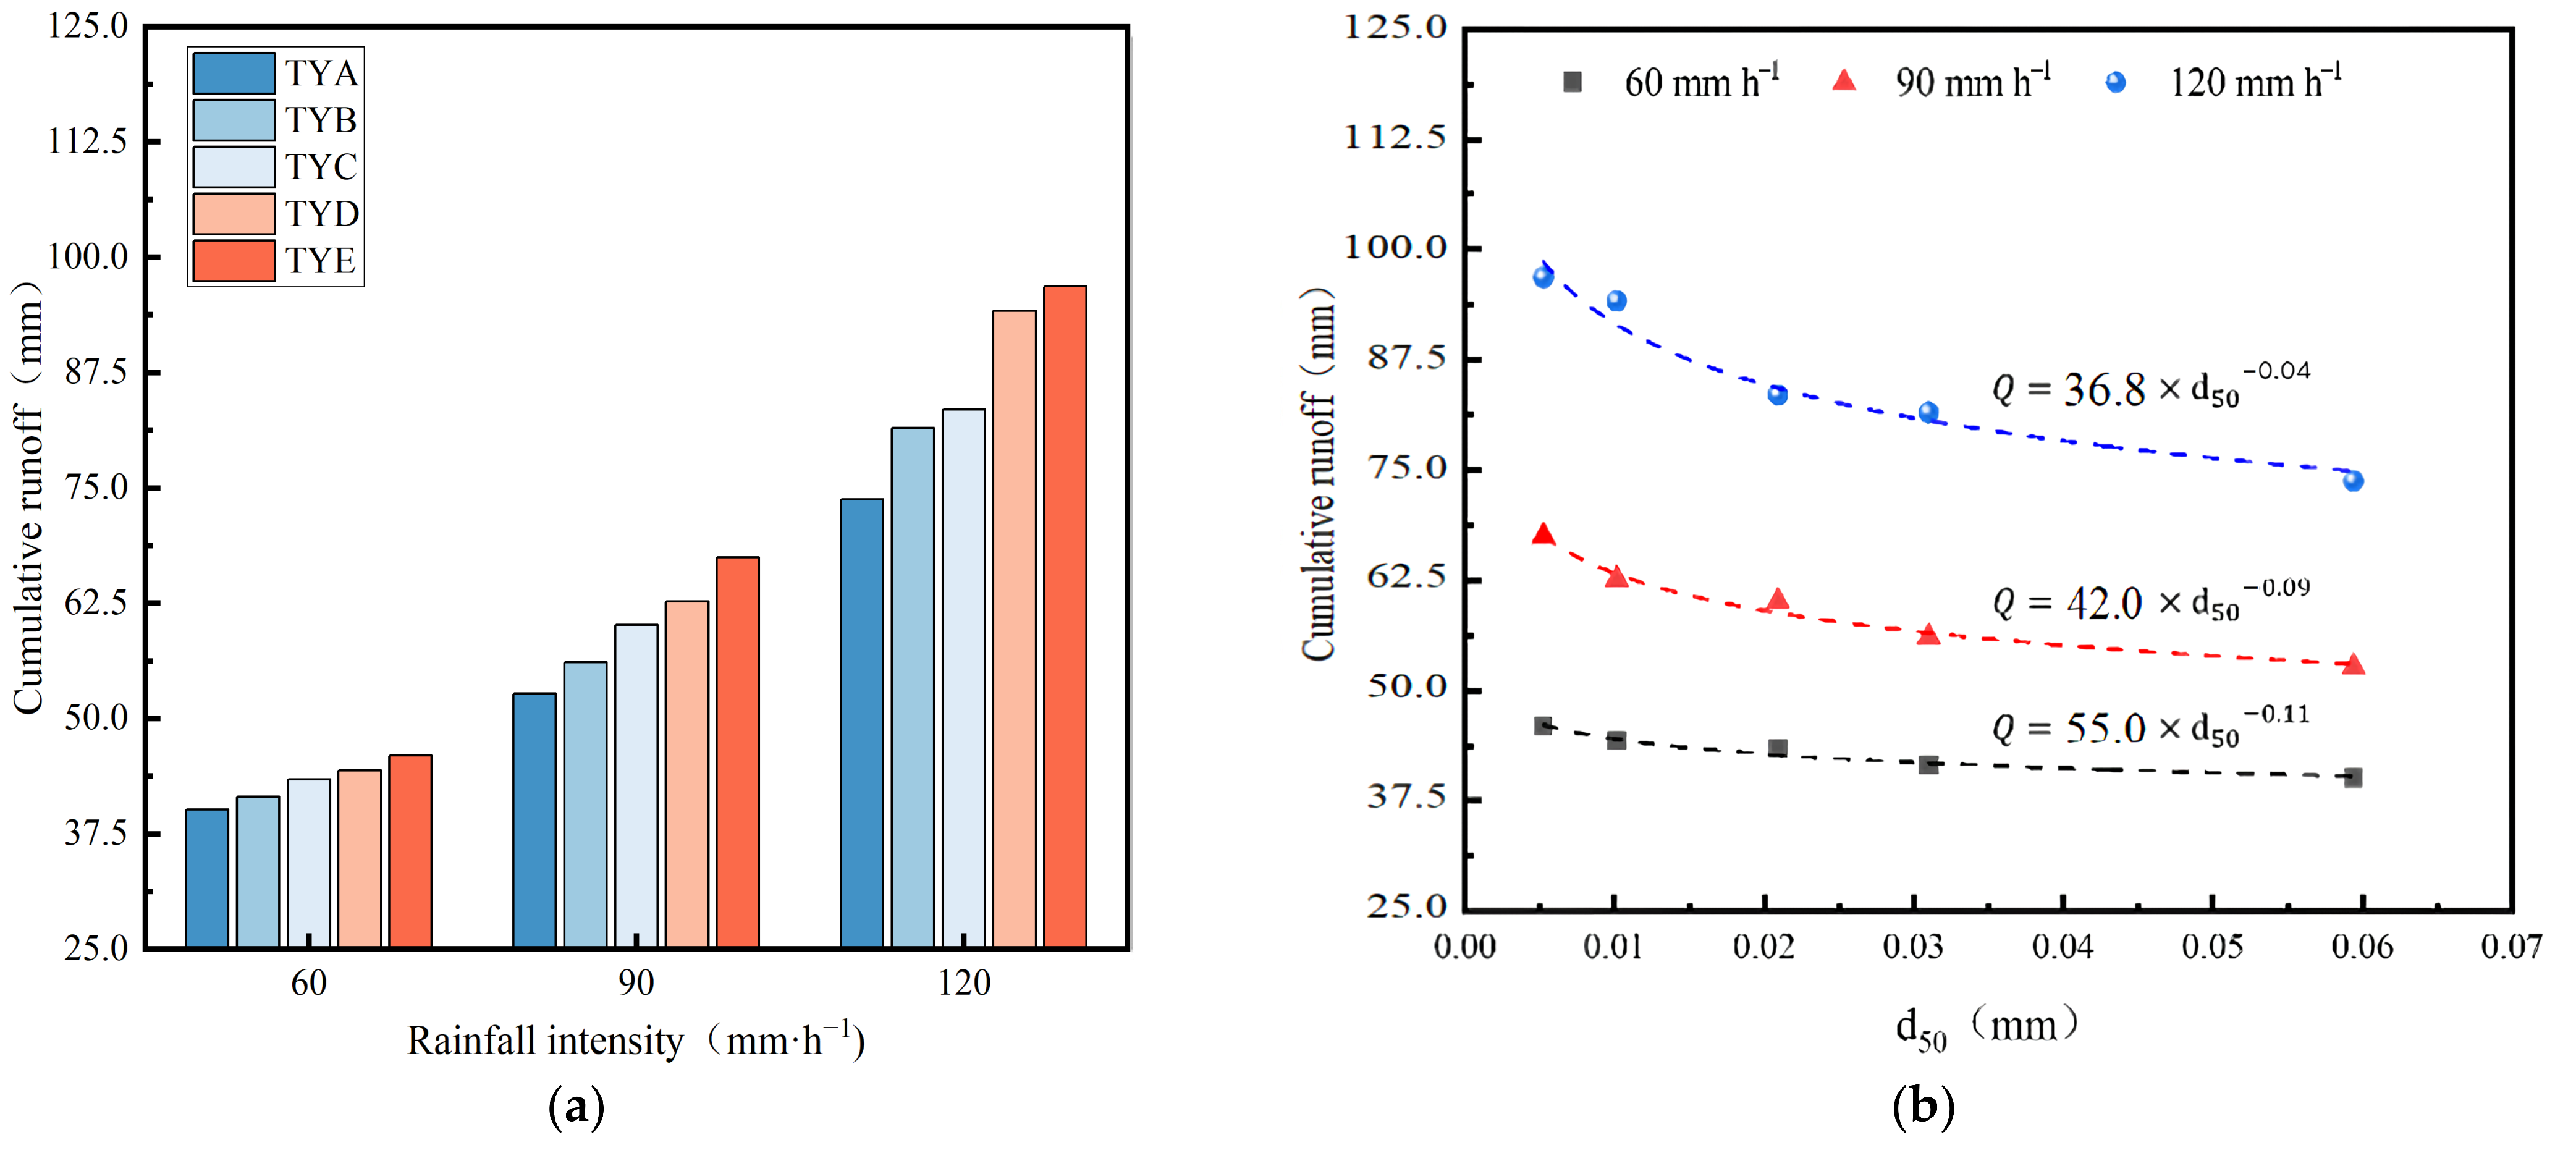
Cumulative runoff increased significantly with rising rainfall intensity for all soils (Figure 4a). Under rainfall intensities of 60, 90, and 120 mm·h−1, the cumulative runoff ranged from 40.3 to 46.0 mm, 52.8 to 67.5 mm, and 73.8 to 96.8 mm, respectively. These values correspond to total runoff volumes of 1.61 × 10⁻² to 1.84 × 10⁻² m3, 2.11 × 10⁻² to 2.70 × 10⁻² m3, and 2.95 × 10⁻² to 3.87 × 10⁻² m3 over the 0.4 m2 plot. Compared with the cumulative runoff at 60 mm·h−1, the values at 90 and 120 mm·h−1 were 1.31–1.47 and 1.84–2.12 times higher, respectively.
Figure 4.
Effects of Soil Particle-Size Distribution on Cumulative Slope Runoff: (a) Cumulative Slope Runoff by Soil. (b) Variation in Cumulative Runoff with d50. The power-law equations are shown with R2 values from the log-linearized fits; full fit statistics (adjusted R2, F, df, p, standard errors, and 95% confidence intervals) are reported in Section 3.2. Because the regressions are based on five independent d50 values, these statistics are descriptive only.
As shown in Figure 4b, the relationship between cumulative runoff and the median particle size d50 was described by a power function (). The fitted equations were Q = 36.8 × d50−0.04, Q = 42.0 × d50−0.09, and Q = 55.0 × d50−0.11 for 60, 90, and 120 mm·h−1, respectively. Because the power-law model was fitted by linear regression on log-transformed data, the following statistics refer to the log-linearized fit. For 60 mm h−1, R2 = 0.931, adjusted R2 = 0.908, F(1, 3) = 40.70, p = 0.008; the standard error of the exponent b was 0.007, with a 95% confidence interval of [−0.063, −0.021]. For 90 mm·h−1, R2 = 0.958, adjusted R2 = 0.944, F(1, 3) = 68.46, p = 0.004; the standard error of b was 0.011, with a 95% confidence interval of [−0.122, −0.054]. For 120 mm·h−1, R2 = 0.959, adjusted R2 = 0.945, F(1, 3) = 69.60, p = 0.004; the standard error of b was 0.013, with a 95% confidence interval of [−0.150, −0.067]. These regressions are based on five independent d50 values (one per soil type); therefore, the reported statistics are descriptive measures of fit for the five soils examined and should not be interpreted as inferential estimates for a broader population. A negative exponent b indicates that cumulative runoff decreased as d50 increased across the five soils. This pattern may be associated with higher proportions of coarse particles and greater pore connectivity. However, pore connectivity and infiltration rate were not measured in this study, so this interpretation remains speculative. Conversely, for more clayey soils, infiltration may be restricted by finer particles and surface sealing, which could contribute to greater runoff, although these processes were not directly observed here. Under different rainfall intensities, the cumulative runoff from the different soils consistently followed the order: TYA < TYB < TYC < TYD < TYE.
The temporal variations in runoff rate and sediment yield rate were fitted using cubic polynomial functions. The coefficients of determination (R2) for the fitted erosion rate–time relationships ranged from 0.67 to 0.97 across all soils and rainfall intensities. The fitted parameters showed that both soil type and rainfall intensity substantially influenced the temporal dynamics of erosion, with higher rainfall intensities generally yielding larger initial erosion rates and more rapid declines over time. These results indicate that the combined effects of rainfall intensity and soil particle-size distribution jointly determine the temporal patterns of slope erosion.
These power-law relationships were derived from only five d50 values (including two artificially mixed soils); therefore, their general predictive capacity should be interpreted with caution and requires further validation with a broader range of soils.
3.3. Effects of Soil Particle-Size Distribution on Slope Sediment Yield
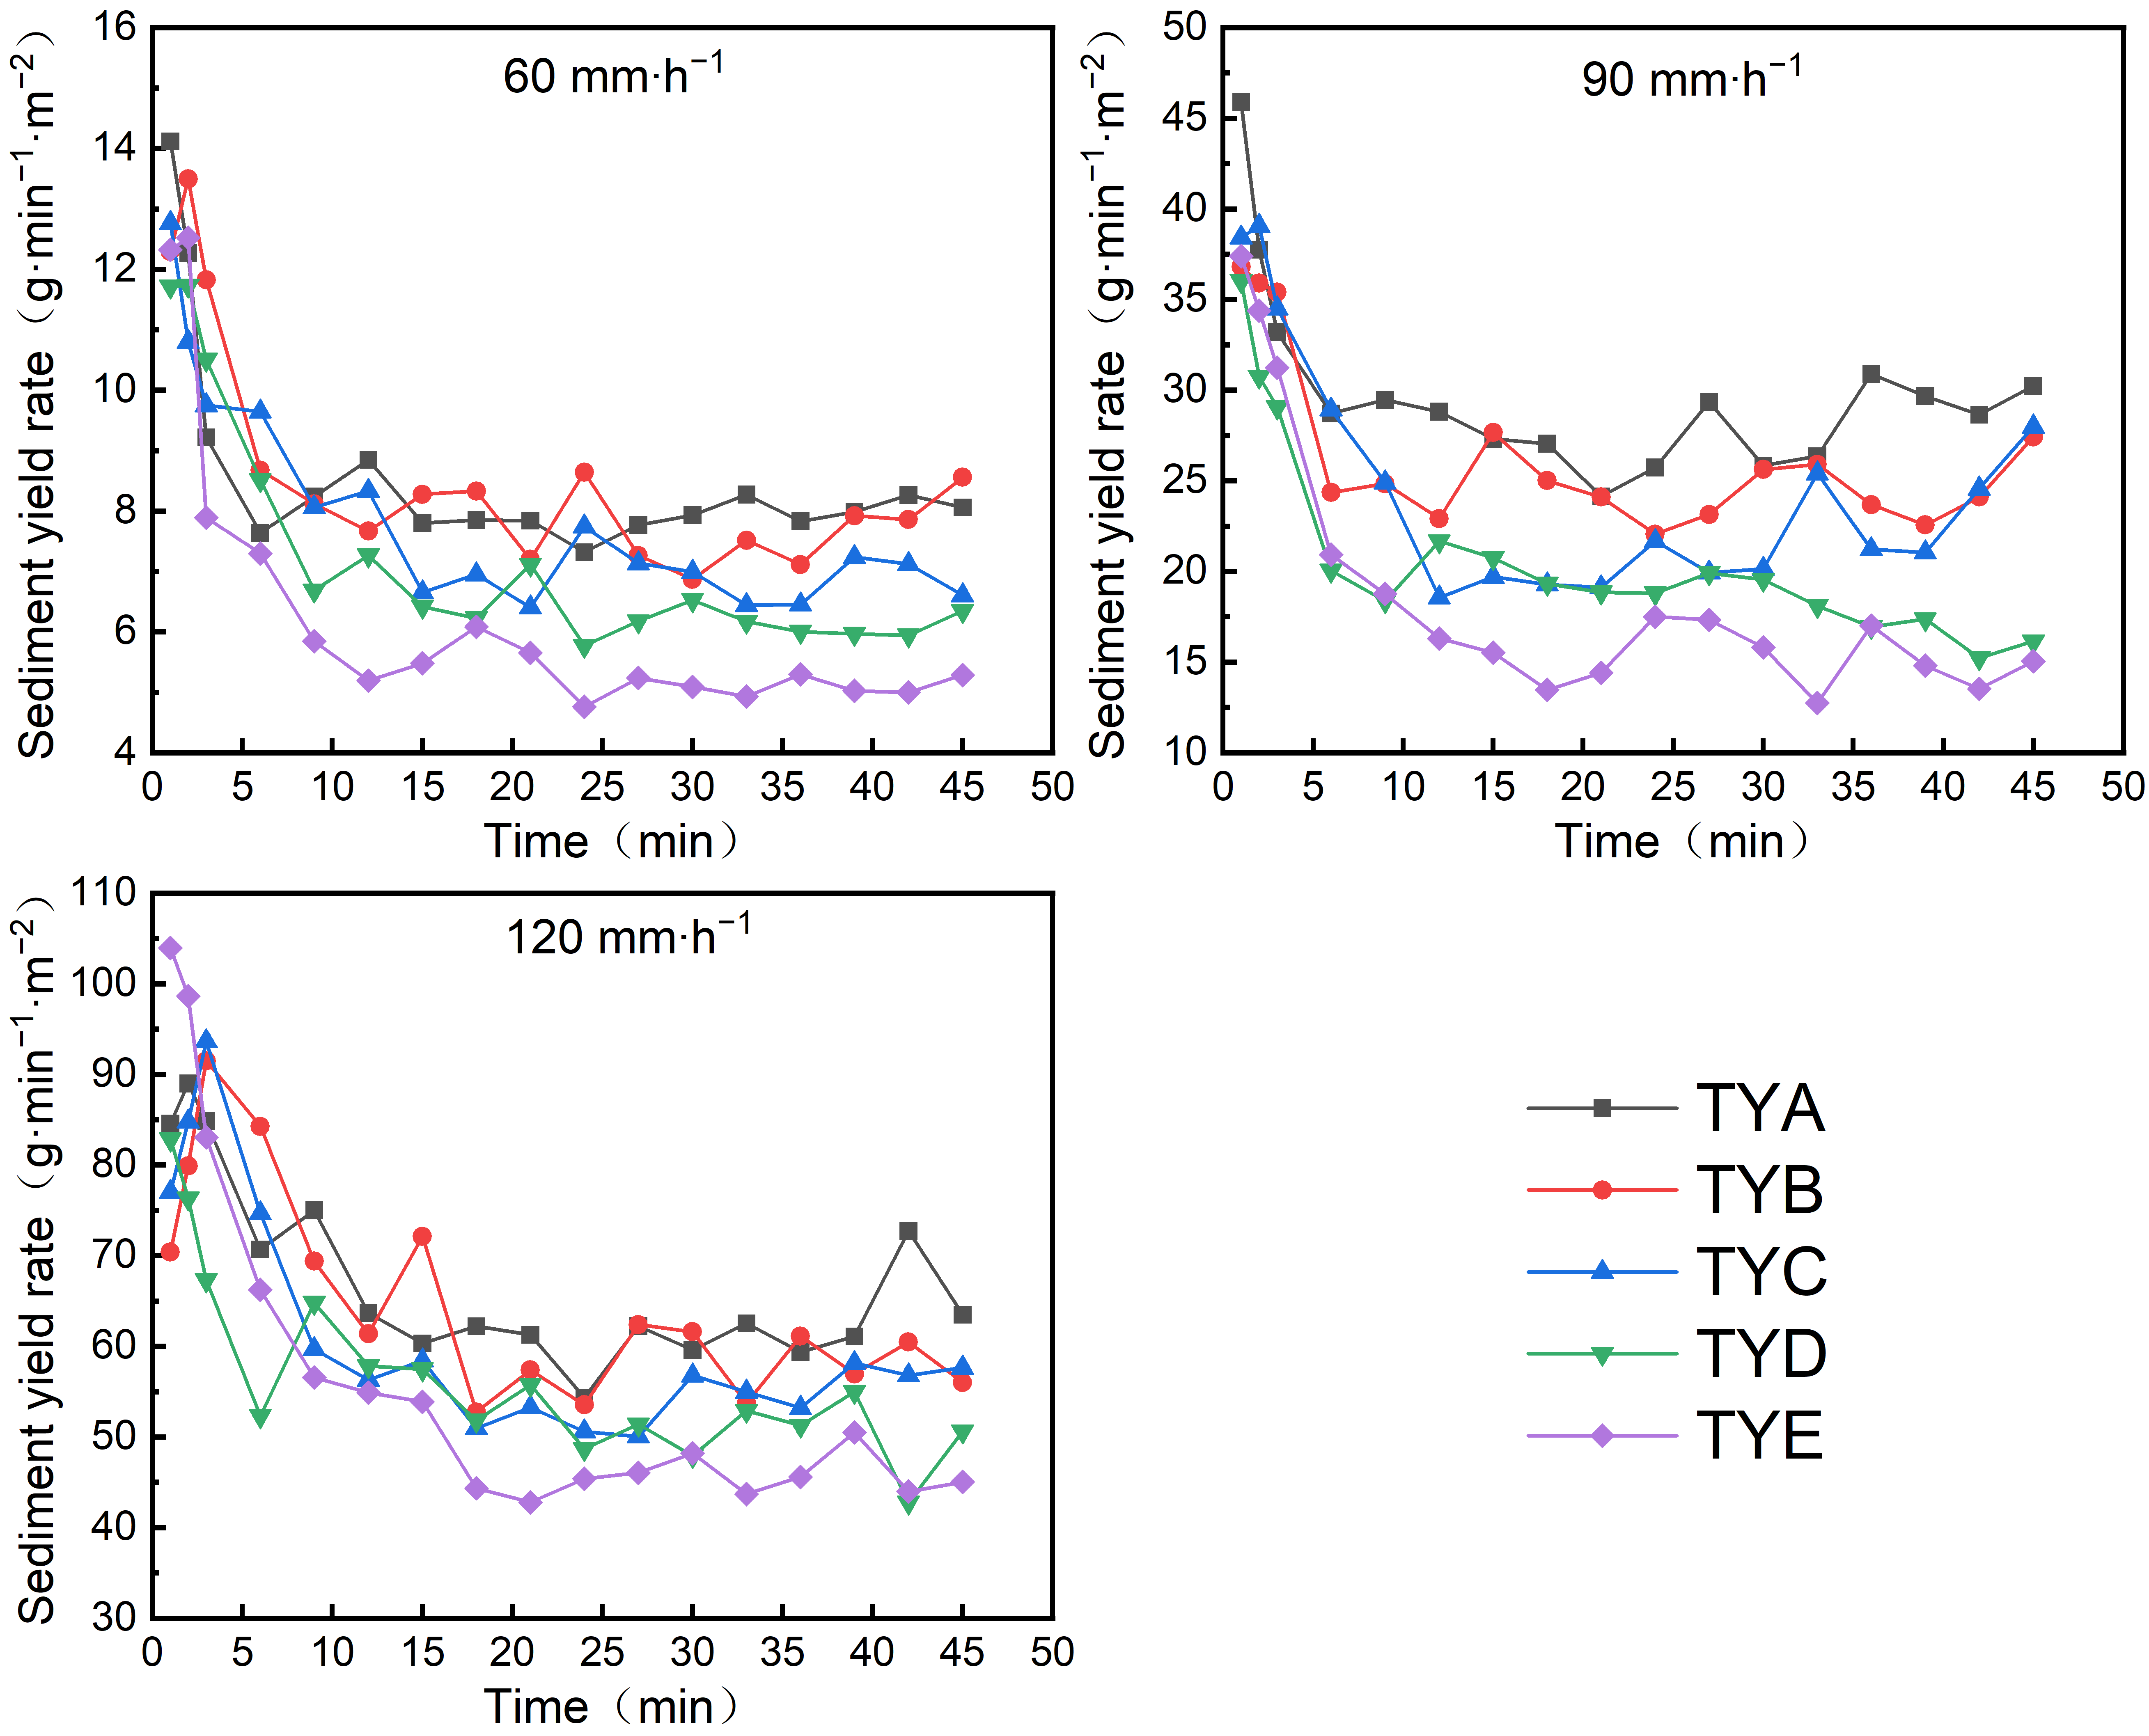
Sediment yield rates differed markedly among soil types (Figure 5). In general, the sediment yield rates of all soils followed similar temporal trends, yet the sediment yield rates differed significantly in magnitude, following the order: TYA > TYB > TYC > TYD > TYE. Soils with higher clay content (e.g., TYE) showed lower sediment yield rates in this study. This pattern has been attributed in previous studies to surface crust formation under rainfall [11], which may enhance surface stability and reduce particle detachment and transport; however, crust formation and aggregate stability were not measured here, so this interpretation remains speculative. Clayey soils may generate more surface runoff because of lower permeability, while a dense surface crust could limit the erosive capacity of runoff and thereby reduce soil loss. Sandy loam soils (e.g., TYA), by contrast, have coarser particles and a looser structure, which may lower erosion resistance and allow runoff to detach surface particles more readily, resulting in higher sediment yield rates. Although sandy soils may have higher permeability, surface runoff can increase substantially under high-intensity rainfall, potentially intensifying erosion. Crust formation, aggregate stability, permeability, infiltration, and particle detachment were not measured in this study; these mechanisms are therefore presented as possible explanations reported in the literature rather than as demonstrated findings.
Figure 5.
Temporal variations in slope sediment yield rates for different soils under different rainfall intensities.
Rainfall intensity was strongly correlated with sediment yield variation (r = 0.91). In simple correlations, neither Cc nor characteristic particle sizes showed strong associations with sediment yield (|r| ≤ 0.12). After controlling for rainfall intensity, partial correlations for Cc and characteristic particle sizes increased to moderate levels (0.39–0.48), suggesting that PSD may exert a secondary influence on erosion [11,12,14,19]. Two-way ANOVA on treatment means (n = 15) confirmed that rainfall intensity had a significant effect on sediment yield rate (F(2, 8) = 809.14, p < 0.001, partial η2 = 0.995), and soil type also had a significant effect (F(4, 8) = 7.59, p = 0.008, partial η2 = 0.791). Tukey’s HSD test showed significant differences between TYA and TYD (p = 0.024), TYA and TYE (p = 0.010), and TYB and TYE (p = 0.042); other soil pairs did not differ significantly (p > 0.05). All rainfall intensity pairs differed significantly (p < 0.001). Because each treatment combination had only one experimental unit, the soil × intensity interaction could not be estimated and was used as the error term (df = 8). These coefficients are descriptive, and no formal significance tests are claimed because only five independent PSD values were available. Soils with a larger Cc may have a broader PSD, and fine particles may fill interstitial pores, potentially reducing pore connectivity and infiltration and thereby increasing surface runoff and erosive capacity; however, pore connectivity and infiltration were not measured in this study, so this interpretation remains speculative. For clay-rich soils, rainfall-induced surface crusting may inhibit particle detachment despite high runoff, which could explain why TYE exhibited low sediment yield even with its high clay content, although crust formation was not directly observed here.
3.4. Effects of Soil Particle-Size Distribution on Cumulative Slope Sediment Yield
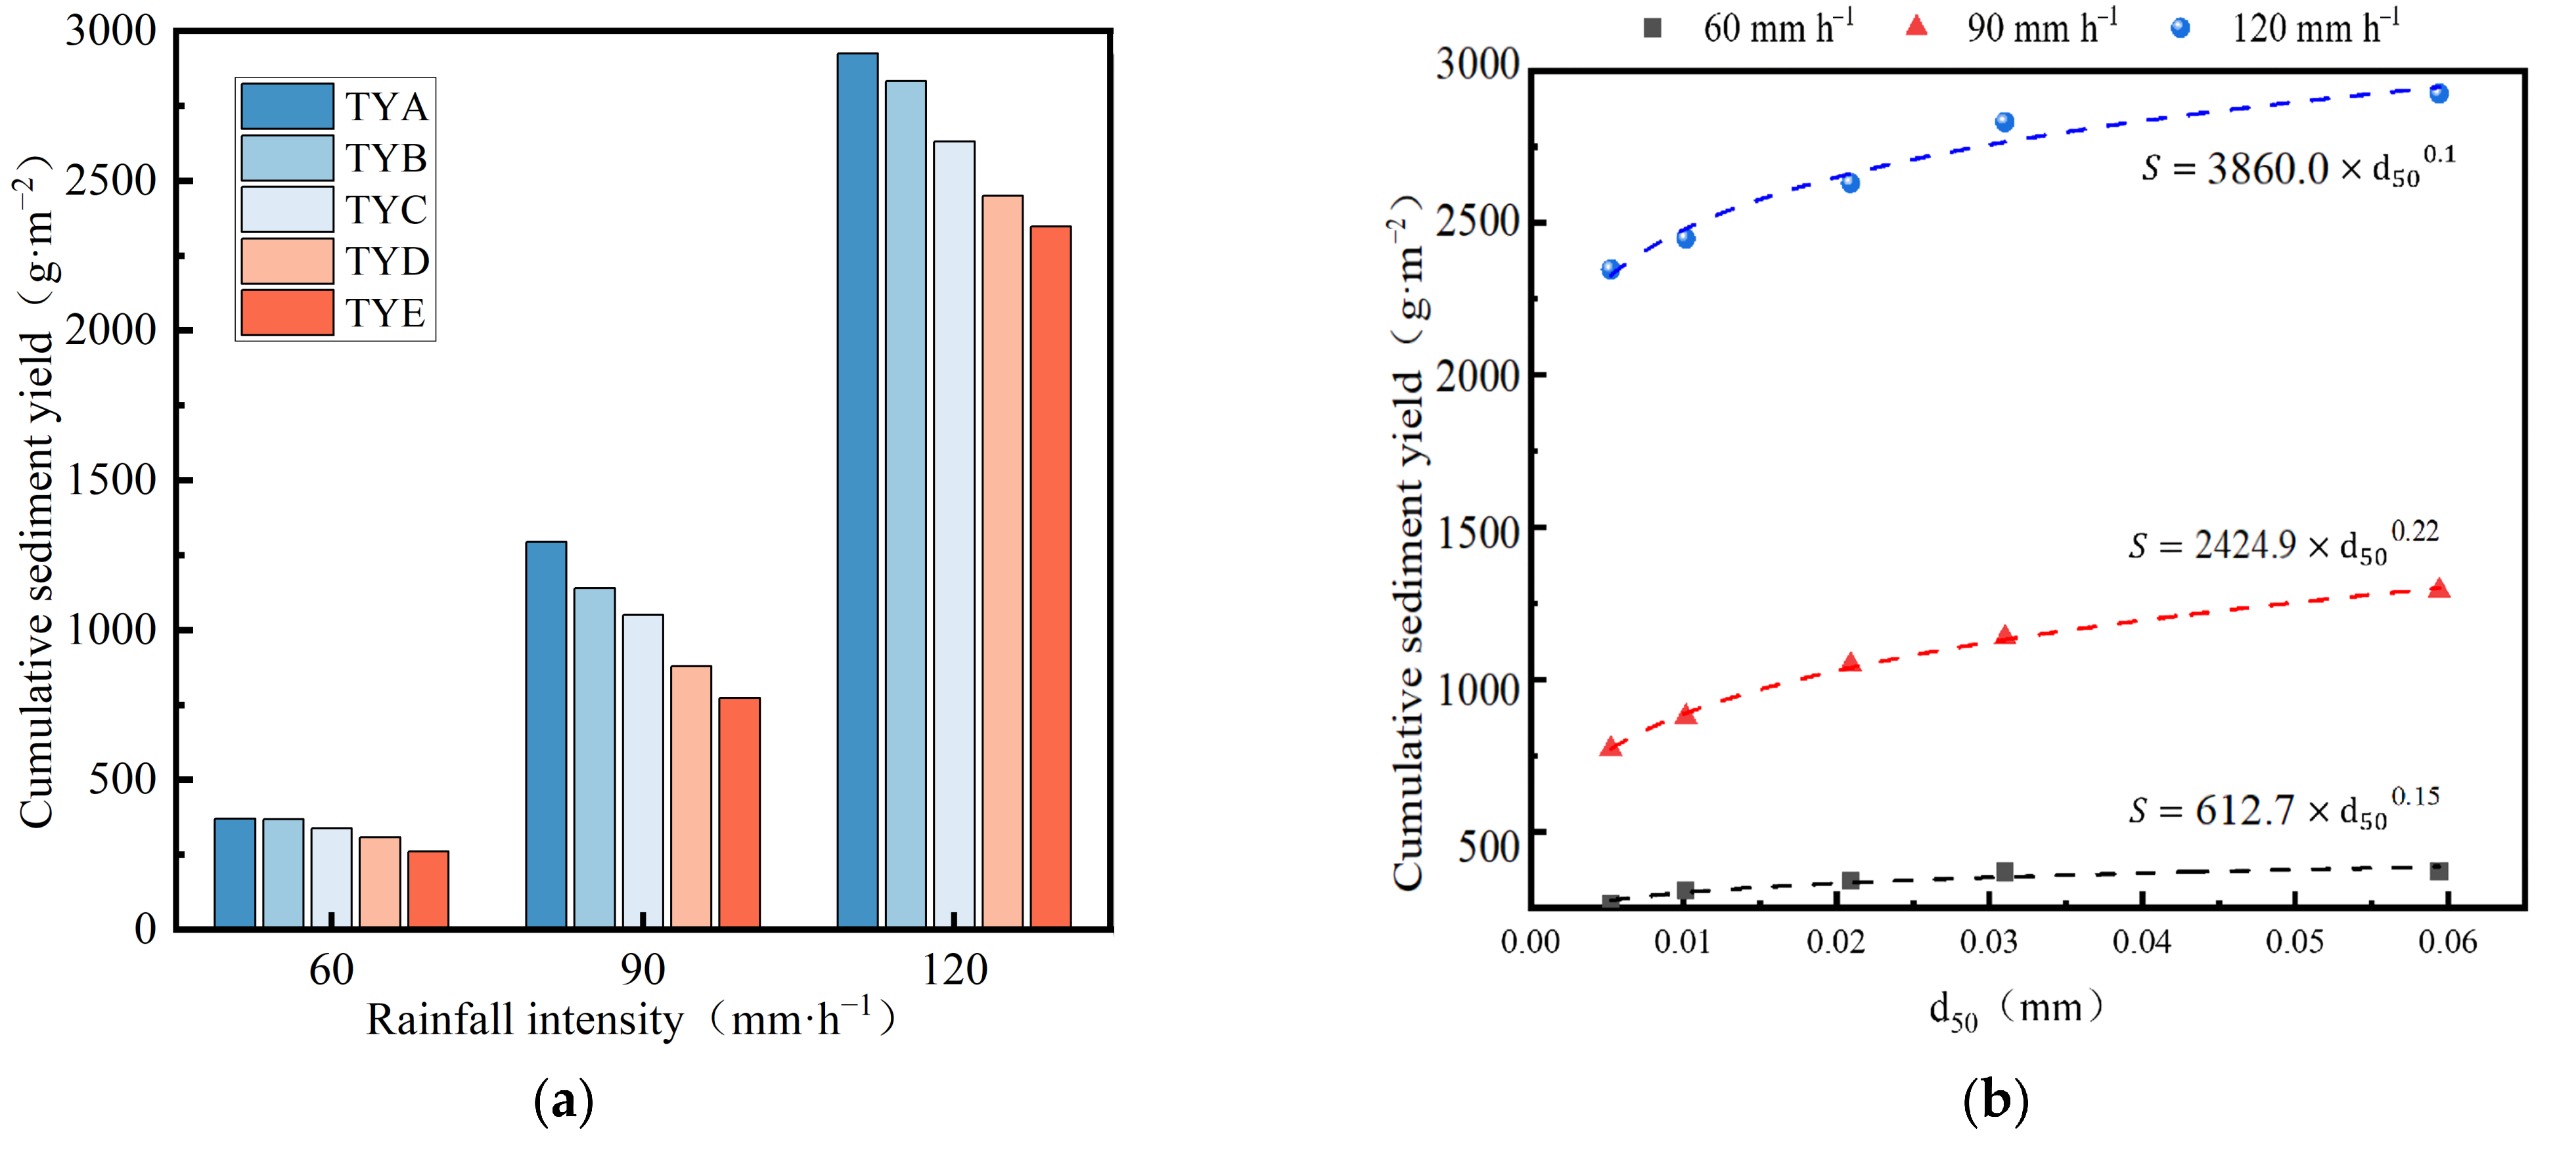
Cumulative sediment yield rose with increasing rainfall intensity across all five soils (Figure 6). The cumulative sediment yields under rainfall intensities of 60, 90, and 120 mm·h−1 ranged from 262.3 to 385.7 g·m−2, 754.8 to 1301.2 g·m−2, and 2311.9 to 2908.6 g·m−2, respectively (equivalent to total sediment masses of 104.9–154.3 g, 301.9–520.5 g, and 924.8–1163.5 g over the 0.4 m2 plot); relative to the 60 mm·h−1 baseline, the cumulative sediment yield increased by 185–237% at 90 mm·h−1 and by 654–781% at 120 mm·h−1. Under rainfall intensities of 60, 90, and 120 mm·h−1, the power-law relationships between cumulative sediment yield and d50 were fitted by linear regression on log-transformed data. For 60 mm h−1, R2 = 0.949, adjusted R2 = 0.933, F(1, 3) = 56.31, p = 0.005; the standard error of the exponent b was 0.020, with a 95% confidence interval of [0.089, 0.219]. For 90 mm h−1, R2 = 0.995, adjusted R2 = 0.994, F(1, 3) = 612.53, p < 0.001; the standard error of b was 0.009, with a 95% confidence interval of [0.191, 0.247]. For 120 mm·h−1, R2 = 0.973, adjusted R2 = 0.964, F(1, 3) = 107.08, p = 0.002; the standard error of b was 0.009, with a 95% confidence interval of [0.068, 0.128]. Because n = 5, these statistics are descriptive only. Across all rainfall intensities, cumulative sediment yield consistently exhibited a sequence of TYA > TYB > TYC > TYD > TYE (Figure 6). Further analysis revealed that, under a given rainfall intensity, cumulative sediment yield exhibited a significant positive power-law relationship with the median particle size d50, indicating that a greater proportion of coarse particles led to higher slope sediment yield. This finding is consistent with Zhang [37], who reported that the relationship between erosion rate and the effective mean weight diameter of sediment could be described by a power function. Cumulative sediment yield was negatively associated with the clay content of the source soils, with higher clay content corresponding to lower sediment yield. This pattern may be attributable to the cohesion and stability of clay-rich soils, which could resist raindrop impact and runoff shear, although these properties were not measured in this study. The coefficient a in the power function increased monotonically with rainfall intensity across the three levels (612.7, 2424.9, and 3860.0 for 60, 90, and 120 mm·h−1, respectively), whereas the exponent b did not show a consistent trend (0.15, 0.22, and 0.10). However, because only five independent d50 values were available, the relationships between a, b, and rainfall intensity were not formally tested, and no significance claims are made for these parameters. This analysis is recommended in future work with a larger number of independent soil samples.
Figure 6.
Effects of Soil Particle-Size Distribution on Cumulative Slope Sediment Yield: (a) Cumulative Slope Sediment Yield by Soil. (b) Variation in Cumulative Sediment Yield with d50. The power-law equations are shown with R2 values from the log-linearized fits; full fit statistics (adjusted R2, F, df, p, standard errors, and 95% confidence intervals) are reported in Section 3.4. Because the regressions are based on five independent d50 values, these statistics are descriptive only.
To examine whether the effect of d50 on cumulative sediment yield varied with rainfall intensity, a model including rainfall intensity, d50, and their interaction term was considered. However, because only five independent d50 values were available (one per soil type), fitting a model with an interaction term would involve estimating three parameters from five independent observations, leaving insufficient degrees of freedom for reliable parameter estimation and uncertainty quantification. The interaction between rainfall intensity and d50 was therefore not tested in this study. This analysis is recommended in future work with a larger number of independent soil samples and a broader range of PSDs.
3.5. Calibration of a Slope Soil Erosion Prediction Model Based on Median Particle Size for Production and Construction Projects
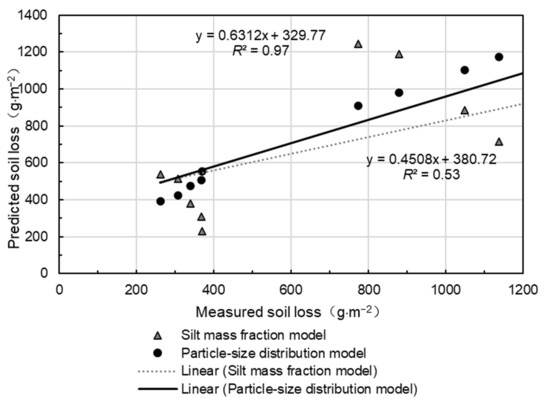
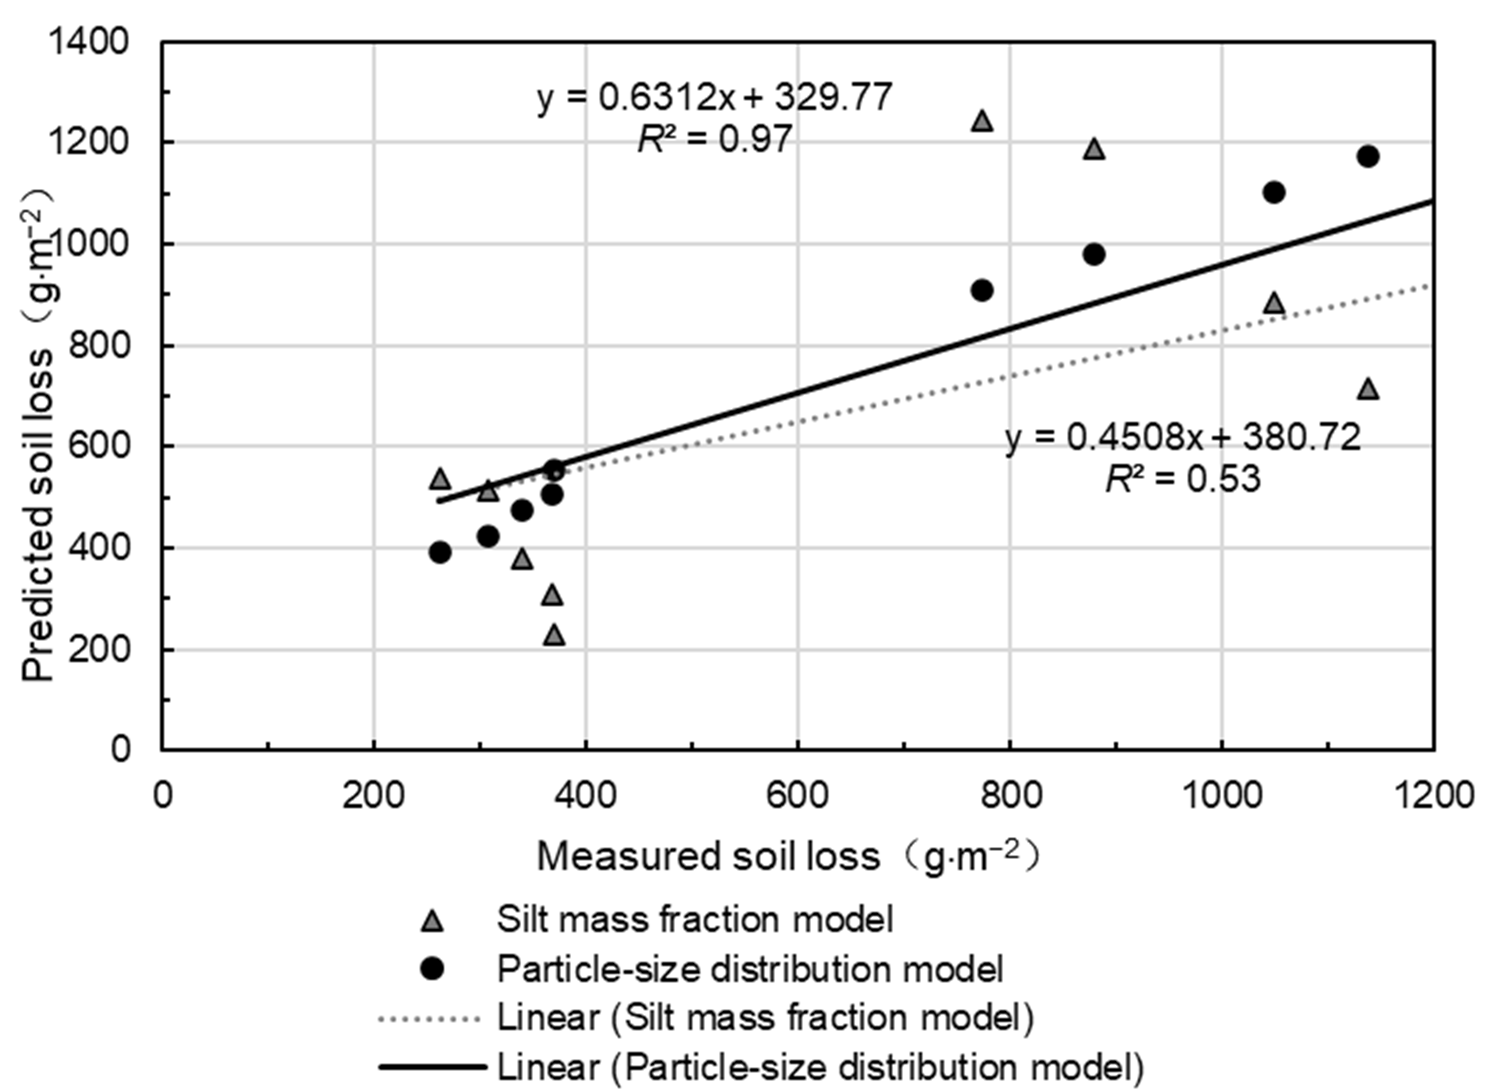
The proposed model, built on characteristic particle-size parameters, requires only two calibrated parameters: k1 and b. Model calibration against the experimental data yielded k1 = 2.15 and b = 0.14. Each point represents the mean of two replicates for each treatment; n = 15 treatments (5 soils × 3 rainfall intensities). As shown in Figure 7, both the proposed d50-based model and the method of Cheng et al. [26] were calibrated and evaluated using the same dataset. The proposed model achieved a calibration R2 of 0.97, indicating good agreement between predicted and measured soil loss. However, because the model was calibrated and evaluated using the same dataset, this R2 value represents calibration goodness of fit rather than independent predictive performance. The method of Cheng et al. yielded a calibration R2 of 0.53 under identical conditions. These results suggest that soil PSD should be incorporated into erosion prediction for production and construction projects, but independent validation with external datasets is required before operational application.
Figure 7.
Comparison between predicted and measured soil loss.
4. Discussion
Soil particle-size distribution (PSD) exerts moderate control on slope runoff and sediment dynamics. Two-way ANOVA on treatment means (n = 15) showed that rainfall intensity and soil type both had significant effects on runoff rate and sediment yield rate, with rainfall intensity explaining a larger proportion of variance (partial η2 = 0.971–0.995) than soil type (partial η2 = 0.701–0.791). Runoff rate increased with clay content (sandy loam < mixed sandy loam < loam < mixed silty clay < silty clay) and was moderately correlated with d10, d30, d50, d60, and Cc. Cumulative runoff followed the same textural sequence and was well described by a power function of d50: larger d50 was associated with greater infiltration and lower runoff, consistent with existing texture-related hydrological evidence [11,38]. Nonetheless, co-varying soil properties including organic matter and aggregate stability also shape these responses [1]. Even after accounting for rainfall intensity, correlations were only moderate-to-strong, indicating that PSD exerts important but not exclusive control over runoff-sediment behavior.
Sediment yield exhibited the reverse trend, decreasing as clay content rose (sandy loam > mixed sandy loam > loam > mixed silty clay > silty clay). Beyond runoff volume, PSD modulates erosion via infiltration and surface crusting. Finer soils produce more runoff owing to low permeability, yet greater particle cohesion and aggregate stability reduce particle detachability. Together with crust formation, this yields lower sediment loss relative to coarser, more easily erodible soils [11]. Cumulative sediment yield negatively correlated with soil clay content and exhibited a positive power-law relationship with d50 under fixed rainfall intensity, showing that higher coarse-particle fractions increase sediment export. Future tests should explore how rainfall intensity modifies PSD-driven runoff and sediment responses, since heavy rain may overcome cohesive forces in fine-textured soils.
The high R2 (0.97) represents calibration fit rather than predictive performance, as all data were used for model fitting. Leave-one-out cross-validation (LOOCV) is advised for subsequent analyses. Systematic bias is evident (slope = 0.631, intercept = 131.91) despite the high R2. Once independent datasets become available, 1:1 comparison and metrics including RMSE, MAE, and mean bias should be reported. This model remains preliminary and requires cautious practical interpretation.
Several experimental caveats deserve attention. Our sediment-processing approach (24 h settling plus supernatant decantation) may lose fine suspended particles and underestimate sediment yield, especially for clay-rich soils; filtration or full-sample drying is recommended for future work, although it was not feasible in the present study due to large sample volumes. Rainfall kinetic energy was not quantified for the simulator [39]; calibrated intensity and uniformity alone cannot fully address potential bias in rainfall erosivity calculations. The five parent soils may also differ in organic matter content, mineralogy, aggregate stability, and other properties that were not measured in this study. Because these unmeasured properties may influence runoff generation and sediment detachment, the observed differences in runoff and sediment yield among the five soils cannot be attributed exclusively to PSD. The small set of five independent soil samples further limits the sample size for soil-texture-related analyses; thus, correlations and regressions for soil texture are presented only as descriptive associations without formal significance testing. Low statistical power is further constrained by two replicates per treatment; a fixed-dimension constant-slope flume, which prevented independent validation of the L and S factors; and potential deviations from natural conditions introduced by simulated rainfall and pre-wetting.
5. Conclusions
This study investigated the influence of soil particle-size distribution (PSD), particularly d50, on slope runoff and sediment yield under simulated rainfall conditions. Two-way ANOVA on treatment means (n = 15) showed that rainfall intensity and soil type both had significant effects on runoff and sediment yield rates. Runoff rates increased with clay content, while sediment yield rates showed an inverse trend. A positive power-law relationship was observed between cumulative sediment yield and d50, with calibration R2 values of 0.91–0.95 across rainfall intensities. Building on existing modeling frameworks for cut slopes and spoil heaps, the proposed d50-based prediction model, requiring only two calibrated parameters, achieved a calibration R2 of 0.97 against the experimental data. This value represents calibration goodness of fit rather than independent predictive performance, because no independent validation dataset was used. However, the restricted number of soil types and replicates, fixed slope geometry, and lack of independent field validation mean that further testing is required before this model can be applied to real-world scenarios.
Author Contributions
Conceptualization, Y.L., G.S., M.Z., Z.G., M.L., S.L. and X.Z.; investigation, Y.L., G.S., M.Z. and Z.G.; data curation, Y.L., G.S., M.L., S.L. and X.Z.; formal analysis, Y.L., G.S., M.L., S.L. and X.Z.; writing—original draft preparation, Y.L. and G.S.; writing—review and editing, Y.L., G.S., M.Z., Z.G., M.L., S.L. and X.Z. All authors have read and agreed to the published version of the manuscript.
Funding
This research was funded by the National Key R&D Program of China, grant number 2024YFE0213400, Natural Science Foundation of China, grant number 42307449, and Sanmenxia City Major Science and Technology Special Project, grant number 2023L01002.
Data Availability Statement
The raw data supporting the conclusions of this article will be made available by the authors on request.
Conflicts of Interest
Author Shuangjiang Li was employed by the company Henan Water Environment Survey and Design Co., Ltd. The remaining authors declare that the research was conducted in the absence of any commercial or financial relationships that could be construed as a potential conflict of interest.
Abbreviations
The following abbreviations are used in this manuscript:
| d50 | median diameter |
| PSD | particle-size distribution |
| C c | curvature coefficient |
| Cu | coefficient of uniformity |
References
- Wang, Z.L. Analyses of Affecting Factors of Soil Erosion and Its Harms in China. Trans. Chin. Soc. Agric. Eng. 2000, 16, 32–36. [Google Scholar] [CrossRef]
- Asadi, H.; Moussavi, A.; Ghadiri, H.; Rose, C.W. Flow-Driven Soil Erosion Processes and the Size Selectivity of Sediment. J. Hydrol. 2011, 406, 73–81. [Google Scholar] [CrossRef] [Scilit]
- Ding, W.F.; Huang, C.H. Effects of Soil Surface Roughness on Interrill Erosion Processes and Sediment Particle Size Distribution. Geomorphology 2017, 295, 801–810. [Google Scholar] [CrossRef] [Scilit]
- Asadi, H.; Ghadiri, H.; Rose, C.W.; Yu, B.; Hussein, J. An Investigation of Flow-Driven Soil Erosion Processes at Low Streampowers. J. Hydrol. 2007, 342, 134–142. [Google Scholar] [CrossRef] [Scilit]
- Shi, Z.H.; Fang, N.F.; Wu, F.Z.; Wang, L.; Yue, B.J.; Wu, G.L. Soil Erosion Processes and Sediment Sorting Associated with Transport Mechanisms on Steep Slopes. J. Hydrol. 2012, 454–455, 123–130. [Google Scholar] [CrossRef] [Scilit]
- Wang, L. Water Erosion Processes and Sediment Sorting Associated with Transport Mechanisms on Steep Slopes. Ph.D. Dissertation, University of Chinese Academy of Sciences, Beijing, China, 2017. [Google Scholar]
- Hao, Y.F.; Tong, F. Research Progress of the Particle-Size Characteristics of Eroded Sediments. J. Soil Water Conserv. 2020, 34, 1–7. [Google Scholar] [CrossRef]
- Wu, X.L.; Wei, Y.J.; Li, Z.X.; Cai, C.F.; Yang, W. Composition of Sediments of Erosion from Different Red Soil Slopes in Subtropical Area. Acta Pedol. Sin. 2014, 51, 1223–1233. [Google Scholar] [CrossRef]
- Tang, S.S.; Li, P.; Ren, Z.P.; Tang, H.; Wang, T. Particle Size Composition of Sediment from Sand-Covered Slope under Simulated Rainfall. Acta Pedol. Sin. 2016, 53, 39–47. [Google Scholar] [CrossRef]
- Shi, Z.H.; Song, C.Q. Water Erosion Processes: A Historical Review. J. Soil Water Conserv. 2016, 30, 1–10. [Google Scholar] [CrossRef]
- Zhang, X.Y.; Xu, J.Z.; Yang, Q.N.; Lei, H.Z.; Zhao, Y.K.; Li, Y.; Zhang, Y.P.; Fu, Y. Sorting Characteristics of Black Soil Splash Erosion Aggregates Under Intermittent Rainfall Conditions. J. Soil Water Conserv. 2024, 38, 31–39. [Google Scholar] [CrossRef]
- Liu, Z.Z.; He, J.J.; Duan, G.Y.; Sun, L.Y.; Cai, Q.G.; Li, X.Q. Study on the particle characteristic of slope erosion sediment on loess under varied rainfall-slope conditions. Acta Ecol. Sin. 2025, 45, 6427–6436. [Google Scholar] [CrossRef]
- Li, J.M.; Niu, J.; Wang, W.L.; Zhang, P.C.; Cheng, D.B.; Wang, Y.F.; Zhang, G.H.; Guo, M.M. Differences in characteristics of runoff and sediment yielding from engineering accumulations with different soil textures. Trans. Chin. Soc. Agric. Eng. 2016, 32, 187–194. [Google Scholar] [CrossRef]
- Niu, Y.B.; Wu, X.; Gao, Z.L.; Li, Y.H. Characteristics of soil erosion on engineering accumulation slope under the rainfall and inflow conditions. Trans. Chin. Soc. Agric. Eng. 2020, 36, 69–77. [Google Scholar] [CrossRef]
- Fu, Z.Y.; Li, Z.X.; Cai, C.F.; Shi, Z.H.; Xu, Q.X.; Wang, X.Y. Soil Thickness Effect on Hydrological and Erosion Characteristics under Sloping Lands: A Hydropedological Perspective. Geoderma 2011, 167–168, 41–53. [Google Scholar] [CrossRef] [Scilit]
- Shen, H.O.; Zheng, F.L.; Wen, L.L.; Han, Y.; Hu, W. Impacts of Rainfall Intensity and Slope Gradient on Rill Erosion Processes at Loessial Hillslope. Soil Tillage Res. 2016, 155, 429–436. [Google Scholar] [CrossRef] [Scilit]
- Liu, C.; Cao, B.Z.; Wang, J.; Ren, Y. Study on soil erosion effect of different stacking methods of engineering accumulation based on WEPP model. J. Nat. Disasters 2022, 31, 261–270. [Google Scholar] [CrossRef]
- Ye, S.; Liu, L.; Li, J.Y.; Pan, H.L.; Li, W.; Ran, Q.H. From Rainfall to Runoff: The Role of Soil Moisture in a Mountainous Catchment. J. Hydrol. 2023, 625, 130060. [Google Scholar] [CrossRef] [Scilit]
- Tong, X.X.; Cui, Y.L.; Shao, D.G.; Li, J.M.; Zhang, G.H.; Lu, L.W.; Liu, J.G. Hydrodynamic characteristics of runoff and sediment yield on the slopes in typical mountainous areas under incremental and continuous rainfall conditions. Trans. Chin. Soc. Agric. Eng. 2024, 40, 88–97. [Google Scholar] [CrossRef]
- Yang, S.; Gao, Z.L.; Li, Y.H.; Niu, Y.B.; Wang, K.; Hao, B.; Qi, X.Y.; Li, Y.T.T. Erosion resistance effects and mechanism of hedgerows in slope of engineering accumulation. Trans. Chin. Soc. Agric. Eng. 2017, 33, 147–154. [Google Scholar] [CrossRef]
- Zhang, L.T.; Dong, J.W.; Yuan, L.; Zhu, Y.Q.; Huang, Z.Y.; Li, W.L.; Wang, H.H.; Tang, L.H.; Tian, H.W.; Gao, Z.L. Sediment-reducing benefits by runoff regulation under engineering measures in steep slope of abandoned soil deposits in Chinese loessial region. Trans. Chin. Soc. Agric. Eng. 2019, 35, 101–109. [Google Scholar] [CrossRef]
- Lou, Y.C.; Gao, Z.L.; Li, Y.H.; Qi, X.Y.; Zhang, H.; Chen, Z.; Cu, Y.; Feng, Z.Q. Vegetation regulation on slopes of engineering accumulation under different upslope runoff patterns. Trans. Chin. Soc. Agric. Eng. 2019, 35, 144–153. [Google Scholar] [CrossRef]
- Li, J.M.; Li, L.; Wang, Z.G.; Zhang, C.W.; Wang, Y.F.; Wang, W.L.; Zhang, G.H.; Huang, J.Q.; Li, H.; Lv, X.D.; et al. The Contributions of the Roots, Stems, and Leaves of Three Grass Species to Water Erosion Reduction on Spoil Heaps. J. Hydrol. 2021, 603, 127003. [Google Scholar] [CrossRef] [Scilit]
- Yang, S.Y.; Zhang, T.G.; Zhang, Z.; Sun, G.F.; Li, Y.H.; Gao, Z.L.; Lou, Y.C.; Qi, X.Y.; Zhao, C.; Wu, T. Study on Erosion Control Effect of Different Vegetation Patterns on Slope Surface of Engineering Accumulation. J. Soil Water Conserv. 2022, 36, 121–127. [Google Scholar] [CrossRef]
- Wang, W.L.; Li, J.M.; Kang, H.L.; Guo, M.M.; Li, H.W. Soil Erosion Prediction Model for Spoil Heaps in Production and Construction Projects. J. Soil Water Conserv. 2023, 37, 27–34, 42. [Google Scholar] [CrossRef]
- Cheng, D.B.; Zhang, P.C.; Zhang, C.W.; Ren, L.; Niu, J.; Cai, D.M.; Li, X. Construction of soil erosion model of engineering excavated slope. Trans. Chin. Soc. Agric. Eng. 2014, 30, 106–112. [Google Scholar] [CrossRef]
- Slattery, M.C.; Burt, T.P. Particle Size Characteristics of Suspended Sediment in Hillslope Runoff and Stream Flow. Earth Surf. Process. Landf. 2015, 22, 705–719. [Google Scholar] [CrossRef]
- Martinez-Mena, M.; Rogel, J.A.; Albaladejo, J.; Castillo, V.M. Influence of Vegetal Cover on Sediment Particle Size Distribution in Natural Rainfall Conditions in a Semiarid Environment. CATENA 2000, 38, 175–190. [Google Scholar] [CrossRef] [Scilit]
- Zha, Z.M.; Li, L.W.; Wu, Y.P.; Miao, F.S.; Xiang, X.Q.; Liao, D.W.; Wu, Z.C.; Xue, Y. Shear Strength Characteristics of Muddy Interlayers with Different Water Contents and Particle Size Distributions. PLoS ONE 2026, 21, e0349587. [Google Scholar] [CrossRef] [Scilit] [PubMed]
- Li, Z.C.; Zhang, H. Influence of Particle-Size Distribution on Shear Characteristics of Slip Zone Soil and Its Mesoscopic Mechanism. Alex. Eng. J. 2023, 67, 375–396. [Google Scholar] [CrossRef] [Scilit]
- Wang, C.; Li, S.Y.; He, X.J.; Chen, Q.; Zhang, H.; Liu, X.Y. Improved Prediction of Water Retention Characteristic Based on Soil Gradation and Clay Fraction. Geoderma 2021, 404, 115293. [Google Scholar] [CrossRef] [Scilit]
- Zhou, P.H.; Wang, Z.L. Soil Erosion Storm Rainfall Standard in the Loess plateau. Bull. Soil Water Conserv. 1987, 7, 38–44. [Google Scholar] [CrossRef]
- Zhou, P.H.; Wang, Z.L. A Study on Rainstorm Causing Soil Erosion in the Loess Plateau. J. Soil Water Conserv. 1992, 6, 1–5. [Google Scholar] [CrossRef]
- Wu, G.Y.; Zhu, Z.H.; Cheng, J.; Wu, R.N.; Zhang, Y.S.; Wu, F.Q. Preliminary Study on Rainfall Erosivity in the Southern Loess Plateau. J. Soil Water Conserv. 2011, 25, 33–38. [Google Scholar] [CrossRef]
- Chen, J.; Liu, W.Z.; Wang, W.L.; Li, Z. Characteristics of precipitation and soil erosive rainfall in Changwu Loess Plateau-gully Region. Sci. Soil Water Conserv. 2009, 7, 27–31. [Google Scholar] [CrossRef]
- Hu, Y.X.; Fister, W.; Kuhn, N.J. Inherent Interreplicate Variability during Small-Scale Rainfall Simulations. J. Soils Sediments 2016, 16, 1809–1814. [Google Scholar] [CrossRef] [Scilit]
- Zhang, Q.W. Experimental Study on the Dynamic Process of Particle Size Selectivity in Interrill Erosion on the Loess Hillslope. Ph.D. Dissertation, Northwest A&F University, Yangling, China, 2021. [Google Scholar]
- Chen, C.; Liu, X.Q.; Luo, Z.D.; Ning, Z.Q. Study of Strength and Deformation Characteristic of Unbound Granual Material with Different Grain Composition. J. Eng. Geol. 2016, 24, 1191–1198. [Google Scholar] [CrossRef]
- Rončević, V.; Živanović, N.; Radulović, L.; Ristić, R.; Sadeghi, S.H.; Fernández-Raga, M.; Prats, S.A. Design, Calibration, and Performance Evaluation of a High-Fidelity Spraying Rainfall Simulator for Soil Erosion Research. Water 2025, 17, 1863. [Google Scholar] [CrossRef] [Scilit]

Disclaimer/Publisher’s Note: The statements, opinions and data contained in all publications are solely those of the individual author(s) and contributor(s) and not of MDPI and/or the editor(s). MDPI and/or the editor(s) disclaim responsibility for any injury to people or property resulting from any ideas, methods, instructions or products referred to in the content. |
© 2026 by the authors. Licensee MDPI, Basel, Switzerland. This article is an open access article distributed under the terms and conditions of the Creative Commons Attribution (CC BY) license.