


Abstract
This study presents a kinetic evaluation of anaerobic co-digestion of pulsed electric field (PEF)-pretreated corn stover using three models: the Modified Gompertz (MG), Logistic, and Reaction Curve (RC). The objective was to assess model performance and improve the interpretation of biogas production dynamics beyond cumulative biogas yield analysis. Experimental data were obtained from batch mesophilic digestion of fine and coarse corn stover fractions subjected to PEF pretreatment with applied voltages of 350 V and 1 kV. All models achieved high coefficients of determination (R2 ≥ 0.97), indicating good agreement between experimental and modeled biogas production curves. However, error metrics and information criteria revealed clear differences in predictive performance. The MG model provided the closest agreement with experimentally determined biogas production potential (Bmax), whereas the Logistic model consistently underestimated both Bmax and the maximum biogas production rate (Rmax). The RC model yielded the lowest prediction errors and favorable information criteria values but showed greater sensitivity to the initial phase of biogas production, occasionally overestimating Bmax and Rmax. Moderate PEF pretreatment increased both Bmax and Rmax, particularly in the fine fractions, without substantially prolonging the lag phase. In contrast, pretreatment at the higher applied voltage resulted in more heterogeneous kinetic responses, including prolonged lag phases and increased variability of kinetic parameters.
1. Introduction
Anaerobic digestion is a widely applied technology that converts organic wastes and residues into renewable energy and valuable byproducts, contributing to the principles of a circular economy. By reducing the amount of waste sent to landfills, anaerobic digestion mitigates environmental pollution and greenhouse gas emissions, while simultaneously producing nutrient-rich digestate suitable for use as a fertilizer, thereby improving soil health. In addition, this process reduces reliance on fossil fuels and enhances energy security by recovering value from organic residuals and using it in a sustainable way. Consequently, anaerobic digestion is increasingly recognized worldwide as a strategic technology supporting circular economy implementation and long-term sustainability goals [1,2].
Anaerobic digestion comprises four essential stages: hydrolysis, acidogenesis, acetogenesis, and methanogenesis. Each of these stages is closely linked, while the balance of the microbial communities is crucial for the efficient degradation of organic matter and a stable process [1]. However, the composition and characteristics of organic residuals can also greatly impact the performance and conversion efficiency of the process. Lignocellulosic feedstocks are characterized by a complex structure composed primarily of cellulose, hemicellulose and lignin, which limits their biodegradability and often necessitates pretreatment before anaerobic digestion [3]. Among the various pretreatment methods, pulsed electric field (PEF) technology has attracted growing attention due to its potential to enhance biogas production efficiency. PEF is widely applied in the food industry as a non-thermal alternative to conventional pasteurization because it enables effective microbial inactivation while preserving product quality and nutritional properties. As an environmentally friendly physical technique for the pretreatment of lignocellulose, PEF offers several advantages over other pretreatment methods, such as low energy demand, short treatment times, and no chemical usage. These characteristics provide a robust technological basis for integrating PEF into anaerobic digestion systems, thereby enhancing bioconversion processes.
Previous studies demonstrate that PEF technology has been widely investigated as a pretreatment method to enhance anaerobic digestion of various organic substrates, including manure, sewage sludge, lignocellulosic biomass, algae, and food waste. Across these studies, PEF has been shown to improve substrate solubilization and biodegradability by inducing electroporation, thereby facilitating hydrolysis of the feedstock and increasing methane yields. Beyond substrate effects, growing evidence suggests that PEF can also impact microbial community structure and activity, thereby contributing to enhanced process efficiency and stability. While most investigations have been conducted at the batch scale, several pilot- and full-scale studies have reported promising increases in biogas production and favorable energy balances, highlighting the potential scalability of the technology. Nevertheless, despite more than two decades of research and these encouraging results, the broader industrial implementation of PEF remains limited due to the lack of standardized operating parameters for different substrates, challenges associated with scale-up and uniform electric field distribution, insufficient long-term industrial validation, and the need for improved process integration and optimization of energy efficiency [4]. In the original experimental study on which the present kinetic analysis is based [5], PEF pretreatment of corn stover increased biogas yields by up to 18% and methane yields by up to 13%, while positive net energy balance values ranging from +0.35 to +13.30 kWh t−1 were also achieved, depending on the pretreatment conditions. Scanning Electron Microscopy (SEM) analysis further confirmed structural disruption of the biomass following PEF pretreatment. However, existing research also emphasizes the need for further optimization of operating parameters and systematic evaluation of energy efficiency to support broader industrial implementation. A recent comprehensive review [4] confirmed that PEF pretreatment generally enhances methane production by promoting substrate disintegration, improving solubilization, and facilitating hydrolysis. The review also emphasizes that treatment efficiency strongly depends on substrate characteristics and PEF operating parameters. Although promising results have been reported, most studies have been conducted at the laboratory scale, highlighting the need for optimization of operating conditions, standardized experimental protocols, and validation under pilot- and full-scale conditions. Despite the growing number of studies reporting improved biogas yields following PEF pretreatment, a detailed kinetic interpretation of biogas production dynamics remains limited. Kinetic modeling provides valuable insight into the rate and extent of biogas formation beyond cumulative yields, enabling interpretation of process dynamics and identification of rate-limiting steps, and thereby supporting a more mechanistic understanding of anaerobic digestion performance [6]. In batch anaerobic digestion assays, results are often reported solely as final methane yields, while the information captured by production curves, which describe substrate degradation kinetics, remains insufficiently explored. Utilizing this information has been recognized as an important step toward improving the interpretation and comparison of anaerobic digestion performance. A wide range of kinetic models has been proposed to describe cumulative biogas production in batch anaerobic digestion, ranging from mechanistic models based on microbial growth kinetics to simplified empirical approaches. For batch assays and comparative studies, simplified kinetic models are often preferred, as they capture the overall dynamics of biogas production while allowing robust parameter estimation with limited experimental data [7]. In batch anaerobic digestion, cumulative biogas production curves typically exhibit a sigmoidal shape, reflecting the successive phases of microbial growth, which provides the theoretical basis for applying sigmoidal kinetic models to describe biogas production dynamics [8]. To obtain meaningful kinetic information from batch anaerobic digestion assays, several simplified mathematical models have been proposed and widely applied to describe cumulative biogas production curves [9]. In this study, three different models were utilized—the Modified Gompertz (MG), the Logistic, and the Reaction Curve models. These models have been frequently applied to describe cumulative biogas production in batch anaerobic digestion experiments. Accordingly, their application and comparison can provide complementary insights into biogas production dynamics, thereby improving the robustness of parameter interpretation.
To the best of our knowledge, only two studies have investigated methane production kinetics following PEF pretreatment [10,11]. These studies applied a first-order kinetic model to describe methane production from PEF-pretreated rapeseed straw and chicken manure, respectively, and demonstrated that PEF pretreatment enhanced substrate degradation by increasing the apparent degradation rate constant. However, no previous study has evaluated or compared the performance of alternative kinetic models for describing methane production after PEF pretreatment. This lack of comparative kinetic analyses represents an important knowledge gap in the current literature.
The MG model is a three-parameter sigmoidal function, originally developed to describe bacterial growth. When applied to batch anaerobic digestion, cumulative biogas production is assumed to reflect the growth rate of methanogenic microorganisms in the biodigester. The MG model is particularly suitable for lignocellulosic substrates exhibiting a pronounced lag phase, as it provides estimates of both the maximum methane production rate and the lag-phase duration [12,13]. The MG model has been widely applied to describe methane production kinetics in batch anaerobic digestion of a broad range of substrates, including lignocellulosic biomass [14,15,16,17]. However, its applicability depends on the characteristics of the cumulative biogas production curve, as it is generally more suitable for reverse L-shaped curves, whereas more flexible sigmoidal models may provide a better description of elongated S-shaped curves associated with heterogeneous substrates [18]. Similar to the MG model, the Logistic model is a three-parameter sigmoidal function commonly applied to describe cumulative biogas production in batch anaerobic digestion [1]. Owing to its simplicity and robustness, it has been widely used for comparative kinetic analysis across different substrates and operating conditions [1,8,19,20]. However, the Logistic model assumes a symmetrical sigmoidal curve with the inflection point located midway between the two asymptotes, which may limit its ability to accurately represent asymmetric biogas production profiles commonly observed during anaerobic digestion [21]. Furthermore, the Logistic model is empirical and does not provide mechanistic insight into the complex biochemical and microbial processes occurring during anaerobic digestion, limiting its usefulness for understanding the underlying mechanisms and predicting process behavior under different operating conditions [22].
The RC model (also referred to as the Transference model) is a simplified mathematical approach originally derived from control systems engineering, in which anaerobic digestion is treated as an input–output system to describe cumulative biogas production. Rather than describing microbial growth, it is used to fit cumulative biogas production curves and capture the overall process dynamics. Due to its simplicity, the RC model is commonly applied alongside the MG and Logistic models for comparative kinetic analysis [18]. However, the RC model may be particularly sensitive to the early-stage dynamics of biogas production, which can lead to deviations in the estimation of kinetic parameters, especially when the initial phase is characterized by delays or stepwise increases in biogas generation.
Although these three models are widely used for describing cumulative biogas production in batch anaerobic digestion, they are empirical models based on experimental data. Consequently, they do not explicitly describe the biochemical processes and microbial interactions involved in anaerobic digestion, and their applicability may be limited outside the range of experimental conditions used for model development [1].
The objective of this study was to conduct a comprehensive kinetic analysis of anaerobic digestion data obtained after corn stover PEF pretreatment, to enhance the understanding of biogas production dynamics beyond evaluation focused solely on final yields. Specifically, model performance, the comparability of kinetic parameters across models, and the ability of each model to capture differences in process behavior were assessed by describing cumulative biogas production curves using three different kinetic models: the MG, Logistic, and RC models. While previous studies have primarily focused on evaluating the effects of PEF pretreatment on methane yield and overall process performance, kinetic research has been limited to the application of a first-order model. To the best of our knowledge, no published study has systematically compared empirical kinetic models for describing methane production from PEF-pretreated substrates. Therefore, the present study addresses this research gap through a comprehensive comparative evaluation integrating goodness-of-fit indicators, error metrics, information criteria, and kinetic parameter interpretation.
2. Materials and Methods
2.1. Experimental Procedure
The experimental data used for kinetic modeling in this study were obtained from a previously published study by [5], in which the PEF pretreatment of corn stover and its subsequent anaerobic co-digestion with dairy cow manure were experimentally investigated. The original study included batch anaerobic digestion experiments and statistical evaluation of biogas production performance. In contrast, the present study specifically focuses on comparative kinetic modeling and evaluation of model performance using the experimental dataset generated in the previous study.
Pretreatment of lignocellulosic substrates was performed using a custom-built parallel-plate PEF system designed to generate a homogeneous electric field. The system was operated in both parallel impulse (γ = 0.198) and parallel continuous (γ = 0.033) field modes. For each treatment, 60 g of corn stover was manually distributed within a plastic bag to obtain a relatively uniform layer before the bag was sealed and placed between two copper capacitor plates insulated with plastic foil. The average distance between the plates (d = 2.03–2.99 mm) was used to calculate the electric field strength for each pretreatment condition.
Corn stover used in this study originated from a local agricultural farm (northeastern Croatia). After collection, the material was cut into 3–5 cm pieces, oven-dried at 60 °C for 24 h to achieve a moisture content below 10%, and stored at 4 °C until use. Before the PEF pretreatment, corn stover was ground using a laboratory knife mill (Retsch SM 100, GmbH, Haan, Germany) and separated into two particle size fractions: fine (screened through a 1 mm mesh) and coarse (screened through a 2 mm mesh). Dairy cow manure, used both as the inoculum and co-substrate for anaerobic co-digestion with corn stover, was collected from a local dairy cattle farm (northeastern Croatia). Fresh manure was then transported to the laboratory and used immediately for the experiment.
The PEF pretreatment parameters and experimental setup are summarized in Table 1, while a detailed description of the pretreatment procedure and the physicochemical characterization of the substrates and inoculum (including pH, total solids, volatile solids, total organic carbon, total nitrogen, chemical oxygen demand, lignocellulosic composition and soluble sugars) is provided in Kovačić et al. [5]. The co-digestion experiments were conducted in batch mode under mesophilic conditions (37 ± 1 °C) using 1000 cm3 reactor bottles with a working volume of 500 cm3. Dairy cow manure was co-digested with PEF-pretreated corn stover at a volatile solids (VS)-based ratio of 1:4. Biogas production was monitored throughout the 26-day digestion process, and cumulative biogas yield data were used for kinetic modeling in the present study. Each experiment was performed in triplicate and the mean cumulative biogas yields obtained from these assays were used for kinetic modeling. The produced biogas contained approximately 60–66% methane, depending on pretreatment conditions, which served as the basis for the previously reported energy balance evaluation [5].
Table 1.
Experimental design and PEF pretreatment conditions.
In addition to the main pretreatment conditions, preliminary assays were performed at a higher applied voltage of 3 kV. Under these conditions, anaerobic digestion did not reach completion. After a short initial phase of limited biogas formation, microbial activity ceased, and no further biogas accumulation was observed. Final pH values ranged between 5.3 and 5.6, indicating inhibitory conditions for methanogenic activity [23,24]. Therefore, these treatments were excluded from further kinetic analysis.
2.2. Kinetic Modelling of Biogas Production
Kinetic modeling of biogas production provides insight into the biodegradation characteristics of substrates and enables the estimation of process performance parameters. In this study, three commonly used models were applied to describe the cumulative biogas production curves obtained from batch anaerobic co-digestion experiments: the MG, Logistic, and RC models. These models were selected to evaluate their performance in describing biogas production kinetics and estimating the characteristic parameters of the process. Parameter estimation was performed using the Solver optimization tool in Microsoft Excel™ 2021 (Microsoft Corp., Redmond, WA, USA) through nonlinear regression, minimizing the residual sum of squares (RSS) to obtain the best agreement between experimental and model-predicted values.
The MG kinetic model (Equation (1)) is commonly used to describe cumulative biogas production in batch anaerobic digestion [21]. The model assumes that the biogas production rate is proportional to the growth rate and metabolic activity of the active microbial population in the digester [25] and can be expressed as:
The Logistic kinetic model (Equation (2)) is also widely used to describe cumulative biogas production in batch anaerobic digestion systems. It assumes that the rate of biogas production follows a symmetrical sigmoidal pattern, with the maximum rate occurring at the midpoint of the cumulative production curve [1,26]. The model can be expressed as:
The RC model (Equation (3)), also known as the Transference model, was employed to describe the cumulative biogas production as a function of digestion time. This model assumes that the methane generation is only dependent on microbial growth rates [27]. The model is expressed as:
In all three models, B(t) represents the cumulative biogas yield (mL g−1 VS) at digestion time t (days), Bmax is the biogas production potential (mL g−1 VS), Rmax is the maximum biogas production rate (mL g−1 VS day−1), λ is the lag-phase duration (days), and e is Euler’s number (2.718). These three models were selected because they are widely used and biologically relevant kinetic models for describing the anaerobic digestion process, particularly in biochemical methane potential assays. All three models successfully capture the characteristic sigmoidal shape of cumulative biogas production curves and provide parameters (Bmax, Rmax, and λ) that are directly linked to the underlying microbial dynamics. The presence of the lag-phase parameter λ in all three models makes them particularly suitable for this work, as the substrates examined in this study exhibited a clear initial adaptation period. This is especially important for lignocellulosic and pretreated substrates, where microbial communities typically require time to establish effective enzymatic activity.
To comprehensively evaluate the performance of the applied kinetic models, several goodness-of-fit indicators were determined. These include the coefficient of determination R2 (Equation (4)) and adjusted R2 (Equation (5)), the sum of squared error values SSE also known as the residual sum of squares RSS (Equation (6)), the residual standard error (RSE) (Equation (7)), the root mean square error (RMSE) (Equation (8)), which together provide insight into the deviation between experimental observations and model-predicted values.
where yi is the experimental value, is the predicted value, is the mean value, N is the number of data points, and p is the number of independent variables.
To additionally account for model complexity and minimize the risk of overfitting, the analysis also included the Akaike Information Criterion (AIC) (Equation (9)) and the Bayesian Information Criterion (BIC) (Equation (11)). These criteria provide quantitative measures for comparing the performance of different models, as both AIC and BIC penalize excessive model parameters. Lower values, therefore, indicate a better overall fit and a more parsimonious representation of the experimental data [27].
In this study, the corrected Akaike Information Criterion (AICc) [28] was calculated using two formulations, depending on the ratio of data points (N) to model parameters (k). When ≥ 40, model complexity is sufficiently low relative to the amount of available data, and the simplified AIC expression (Equation (9)) is applied:
Conversely, when < 40, the dataset is considered relatively small in relation to model complexity, and an additional correction term AICc (Equation (10)) is required to avoid overfitting:
In the present work, the ratio was consistently below 40 for all 3 evaluated kinetic models. Therefore, the second, fully corrected form of AIC was applied throughout the analysis to ensure an unbiased comparison of model performance and to penalize model complexity appropriately.
3. Results and Discussion
3.1. General Performance of Kinetic Models
The kinetic modelling results provide an integrated overview of how well the MG, Logistic, and RC models describe the biogas production dynamics of untreated and PEF-pretreated corn stover. Table 2 summarizes the experimental biogas yields and the corresponding predicted Bmax values obtained using the three models for all pretreatment conditions. These data provide the basis for evaluating differences in biogas production potential among the tested samples.
Table 2.
Experimental biogas yields and predicted Bmax values for the applied kinetic models.
The experimental biogas yields showed consistent differences among pretreatments, particle size fractions, and batch runs. Fine-milled corn stover consistently produced higher cumulative biogas yields than coarse fractions, indicating improved degradability with smaller particle size. PEF pretreatment at a moderate applied voltage (350 V) generally enhanced biogas yield relative to untreated controls, with the most notable improvement observed in fine-milled samples A2F and A3F (458 and 446 mL g−1 VS), corresponding to increases of approximately 31–35% relative to the untreated control. A clear difference was observed between batches, with Batch 2 samples consistently showing higher biogas yields than those from Batch 1, irrespective of the PEF pretreatment conditions. Such differences may reflect inherent batch-to-batch variability, including minor variations in the physicochemical and microbial characteristics of the inoculum [29,30]. In contrast, PEF pretreatment at an applied voltage of 1 kV resulted in divergent responses. While some samples (B1F and B2F) showed slightly increased biogas yields relative to the control, others (B1C and B2C) exhibited delayed responses and reduced yields, indicating slower biogas production kinetics and delayed microbial adaptation.
The MG and Logistic models yielded slightly lower Bmax estimates, whereas the RC model yielded higher estimated Bmax values. Deviations between experimental and modelled Bmax were most evident in selected samples with lower biogas yields, particularly in Batch 1, where the RC model tended to overestimate the maximum biogas production potential. In contrast, the closest agreement between experimental and predicted Bmax values was observed in Batch 2, most notably for samples B0F, B1F, and B2F.
The predictive accuracy of the three kinetic models was further evaluated by quantifying the deviation (Δ, %) between the experimental biogas yield and the model-derived Bmax. In Batch 1, the MG model showed the smallest deviations, indicating its suitability for estimating the maximum biogas production potential under these experimental conditions. Similar findings have been reported in previous studies. Ponzelli et al. [12] applied the MG model to describe methane production kinetics in BMP assays and reported excellent agreement between model-predicted and experimentally determined methane production potential, confirming the robustness of the MG model for estimating maximum biogas production potential. Similarly, Pramanik et al. [31] reported only minor deviations between experimental and model-predicted cumulative biogas yields when applying the MG model to food waste digestion.
In contrast, the Logistic model exhibited slightly higher deviations, indicating a tendency to underestimate the final biogas production potential. Similar behavior has also been reported in previous anaerobic digestion studies involving duckweed [27] and pretreated perennial energy grass [32].
The RC model showed the largest variability in predictive accuracy. While deviations in Batch 2 were relatively small (0.5–2.97%), several Batch 1 samples showed notable differences (32.58 and 20.38%, respectively). This pattern suggests that the RC model is particularly sensitive to the early-stage dynamics of biogas production, where short delays or stepwise increases during the initial phase may lead to deviations in the estimated Bmax. Qiu et al. [28] compared several kinetic models for estimating the maximum methane potential of municipal and industrial organic wastes. The authors reported that the Transference (RC) model exhibited larger deviations from experimental methane yields than the MG and Logistic models, despite providing an acceptable fit to the cumulative methane production curves.
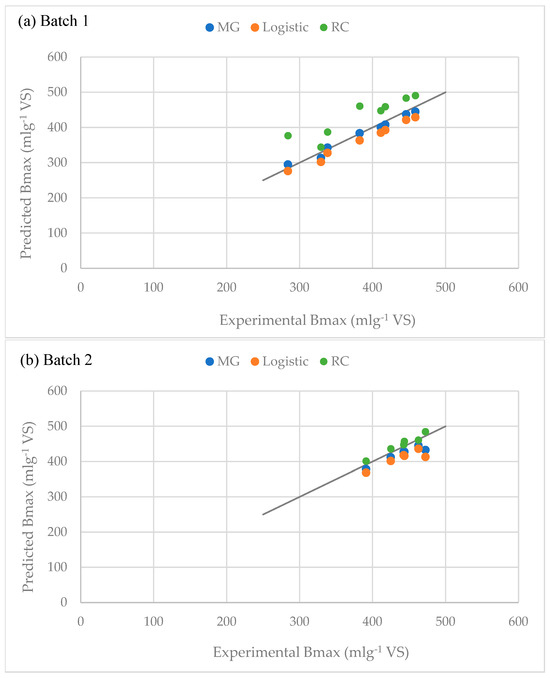
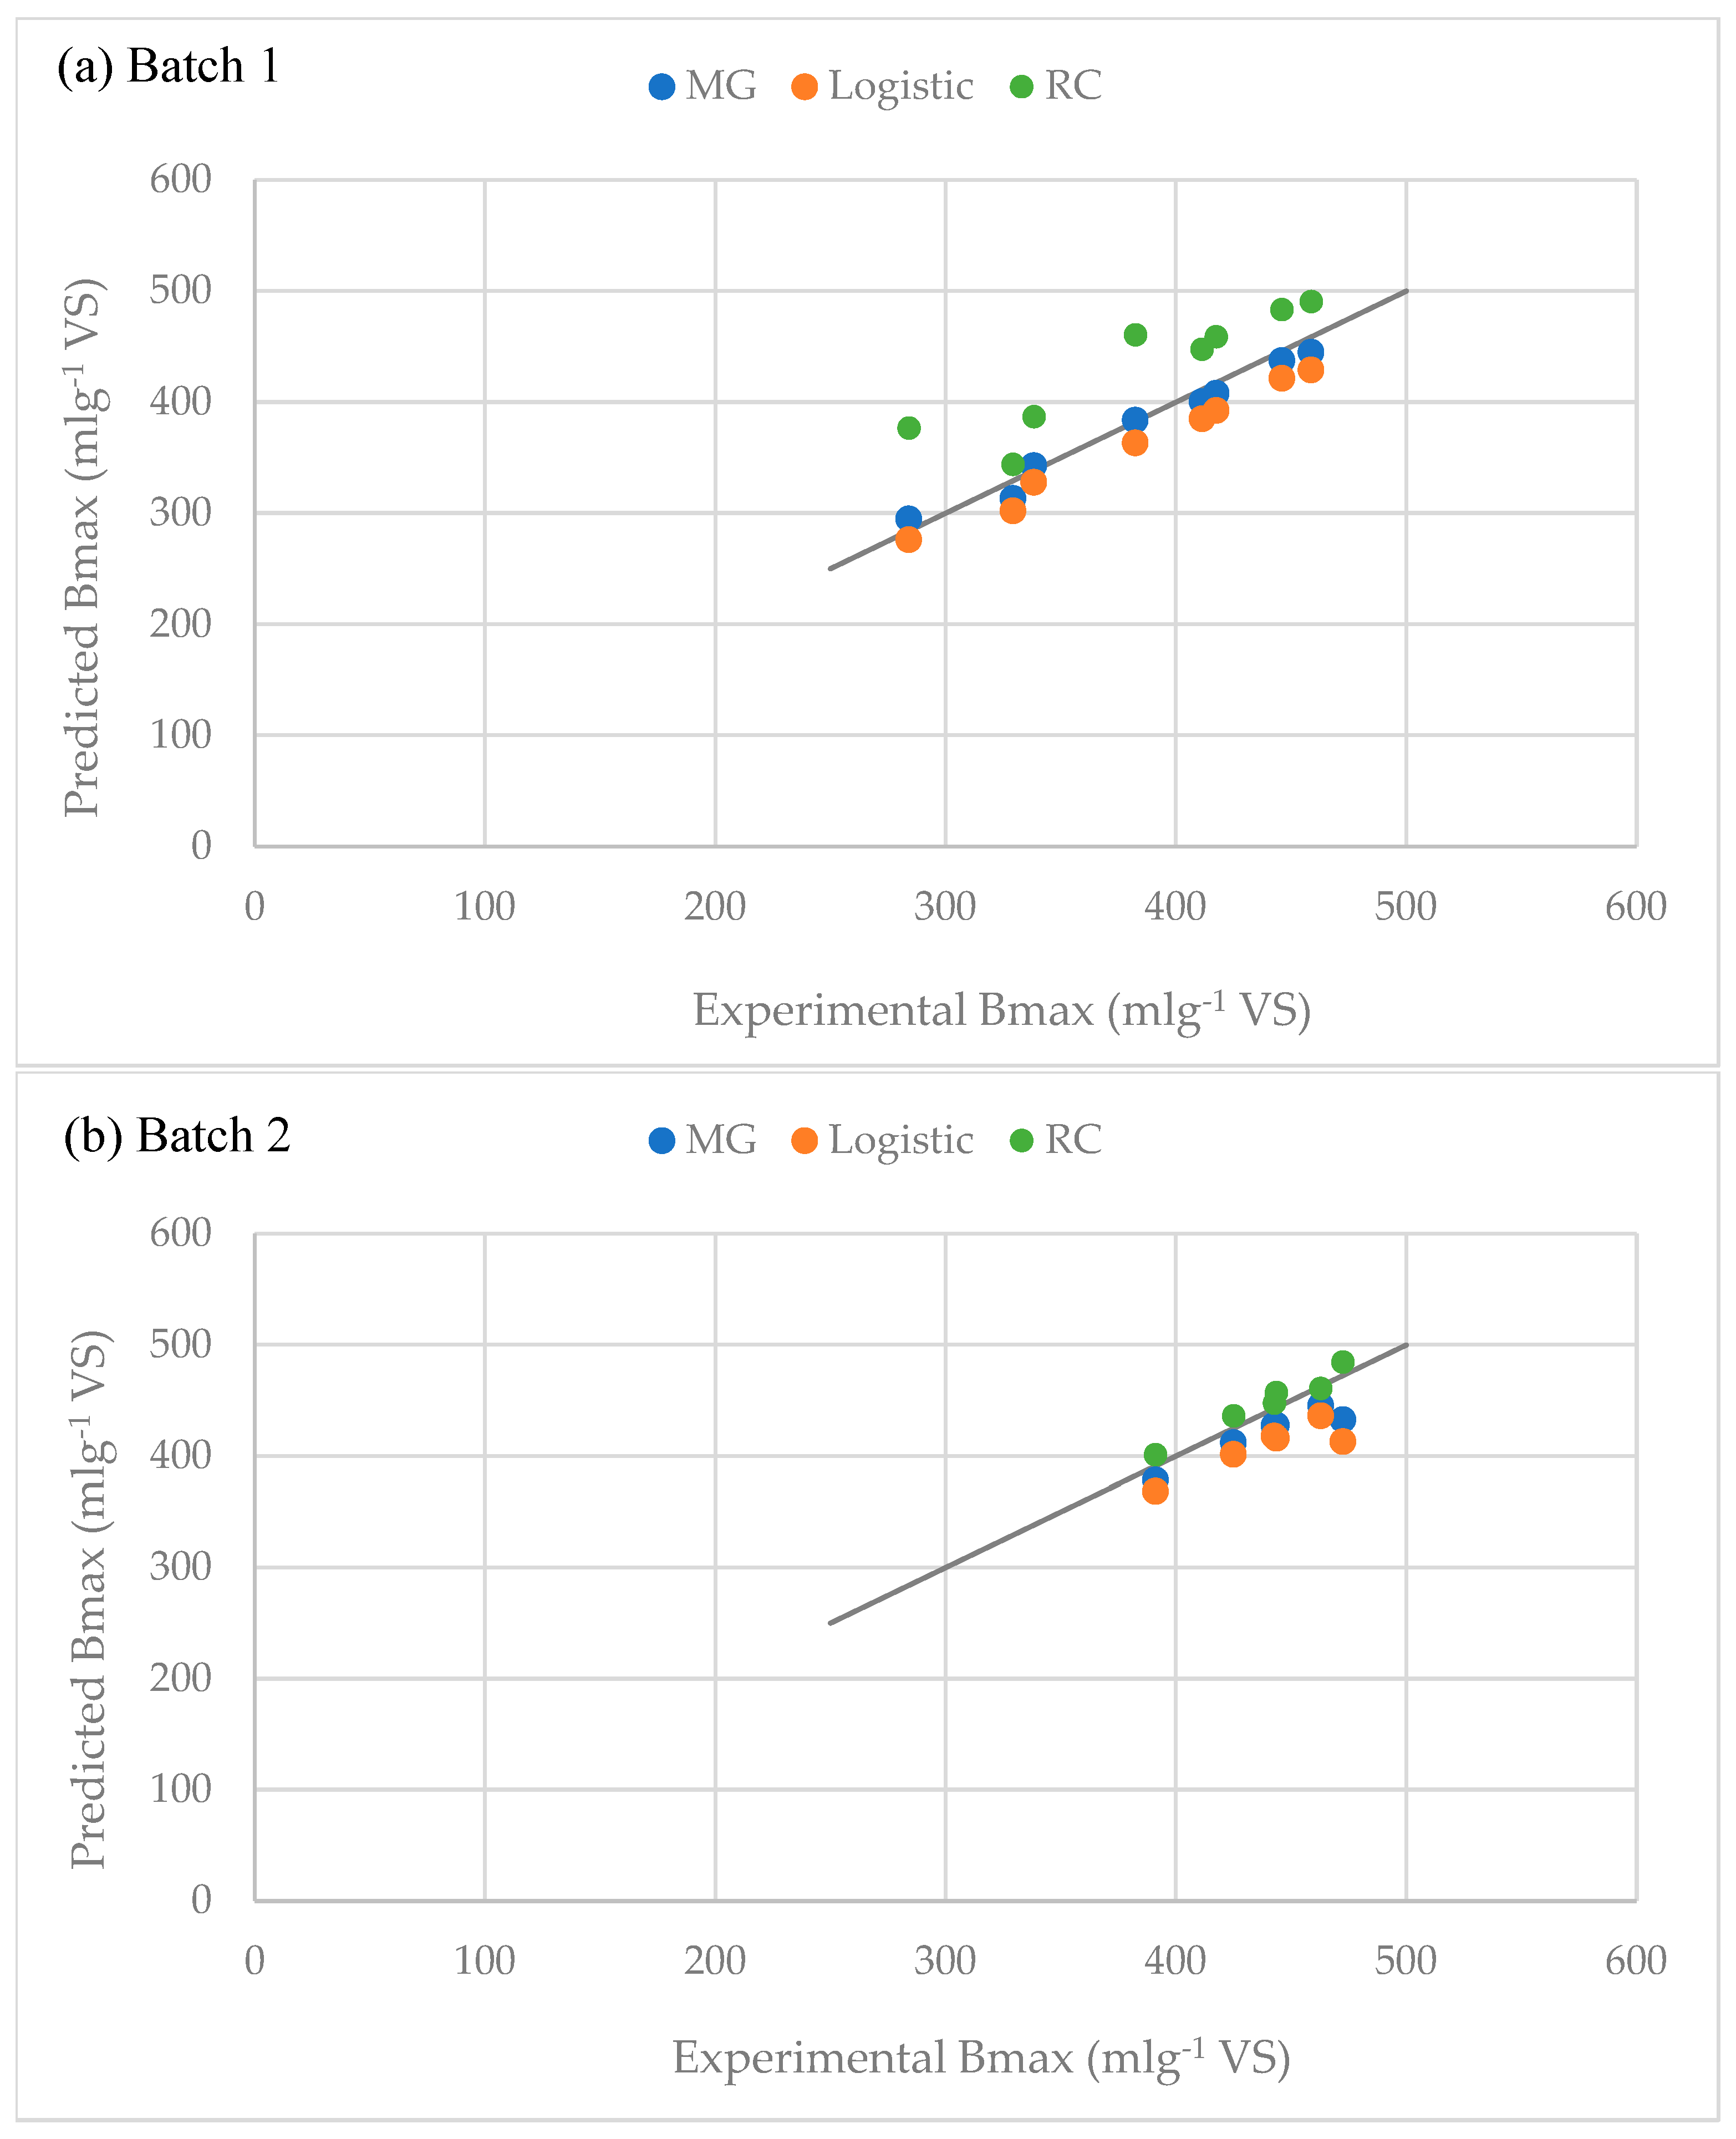
To further illustrate the relationship between experimentally determined and predicted Bmax values, predicted versus experimental Bmax plots are presented (Figure 1) for comparison for both experimental batches. In Batch 1, the MG model generally provided predictions closer to the line of perfect agreement, with deviations generally below 5%. In contrast, the RC model exhibited a wider scatter and notable deviations for several samples (up to 32%), indicating higher sensitivity to the beginning of biogas production dynamics. On the other hand, the RC model in Batch 2 showed the closest agreement with the experimental Bmax values (with deviations generally below 3%), whereas the Logistic model consistently underestimated the experimental Bmax values. These differences among batches indicate that model performance in estimating Bmax varies under different experimental conditions (e.g., differences in manure characteristics). The predicted versus experimental Bmax plots highlight clear differences in predictive behavior among the applied models.
Figure 1.
Predicted versus experimental Bmax values for: (a) Batch 1, and (b) Batch 2. The line represents the line of perfect agreement.
The response of Bmax to PEF pretreatment depended on both treatment conditions and particle size. At 350 V, extending the treatment duration beyond 5 min improved Bmax in the fine fraction, whereas no consistent trend was observed for the coarse fraction. At 1 kV, extending the treatment from 20 to 40 s had only a minor effect on the fine fraction but reduced Bmax in the coarse fraction, indicating that the relationship between PEF treatment duration and biogas production potential was not linear.
In addition to Bmax, Rmax was analyzed to provide further insight into the dynamics of biogas conversion (Table 3). Experimental Rmax was calculated as the maximum daily biogas production rate, determined from the differences between consecutive values of the mean cumulative biogas production curve. The MG and Logistic models yielded highly comparable Rmax estimates across all treatments, with differences typically ≤1 mL g−1 VS day−1. However, both models systematically underestimated the experimentally determined peak biogas formation rates, as reflected by consistently high Δ values across most samples. This indicates that these sigmoidal models capture overall production trends well but tend to smooth peak reaction rates. In contrast, the RC model frequently produced Rmax estimates closer to experimental values, particularly for fine corn stover fractions in Batch 1, resulting in substantially lower deviations in those cases. Nevertheless, its performance was more variable than that of the other models. For selected treatments, especially coarse fractions and samples from Batch 2, the RC model tended to overestimate Rmax, highlighting its sensitivity to early-stage biogas production dynamics.
Table 3.
Experimental maximum biogas production rates (Rmax) and predicted Rmax values obtained using the applied kinetic models.
Because initial biogas formation dynamics disproportionately influence RC fitting, the model may project unrealistically high conversion rates even in cases where later-stage microbial activity decreases or slows down. Similar behavior has been reported in the literature [33], where the RC model overestimated Rmax (reported as µ) for sonicated sludge, despite providing a good fit to cumulative biogas production curves. This indicates that rapid early-stage biogas formation may result in overestimated kinetic rates even when overall agreement with experimental data is good.
A clear shift in maximum biogas formation rates was observed between the experimental batches. While Batch 1 samples generally exhibited lower maximum biogas formation rates, Batch 2 showed substantially higher Rmax values, particularly in pretreated fine fractions. Relative to untreated controls, Rmax increased by approximately 14–42% for pretreated fine fractions in Batch 1, and by 21–35% in Batch 2, reflecting accelerated biogas conversion kinetics. In contrast, coarse fractions showed reduced or negligible kinetic responses, suggesting that pretreatment was more effective in enhancing reaction rates in substrates with a smaller particle size. Overall, the effect of treatment duration on Rmax depended on particle size. While longer PEF treatments generally increased Rmax in the fine fraction, the coarse fraction showed no consistent response. Overall, these results indicate that pretreatment effects were also clearly reflected in reaction rates (Rmax), particularly for fine corn stover fractions in Batch 2, where faster microbial activation and enhanced substrate accessibility likely contributed to accelerated biogas formation. From a practical perspective, these kinetic improvements should be interpreted together with the previously reported positive net energy balance previously reported [5]. The earlier experimental study demonstrated that the increase in methane production was sufficient to compensate for the electrical energy consumed during pretreatment. However, the present kinetic analysis indicates that PEF pretreatment at 350 V provided more stable and consistent kinetic improvements, whereas pretreatment at 1 kV resulted in more variable kinetic responses. Therefore, the observed increases in Bmax and Rmax may have practical relevance not only for process kinetics but also for the overall energy efficiency and operational reliability of anaerobic digestion systems.
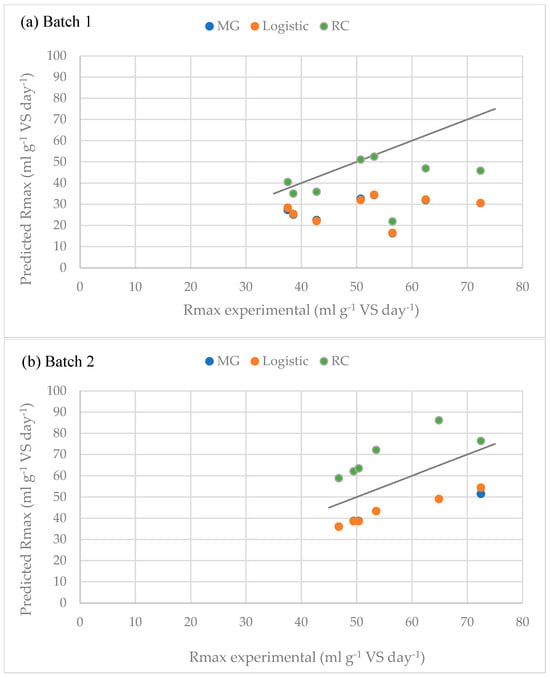
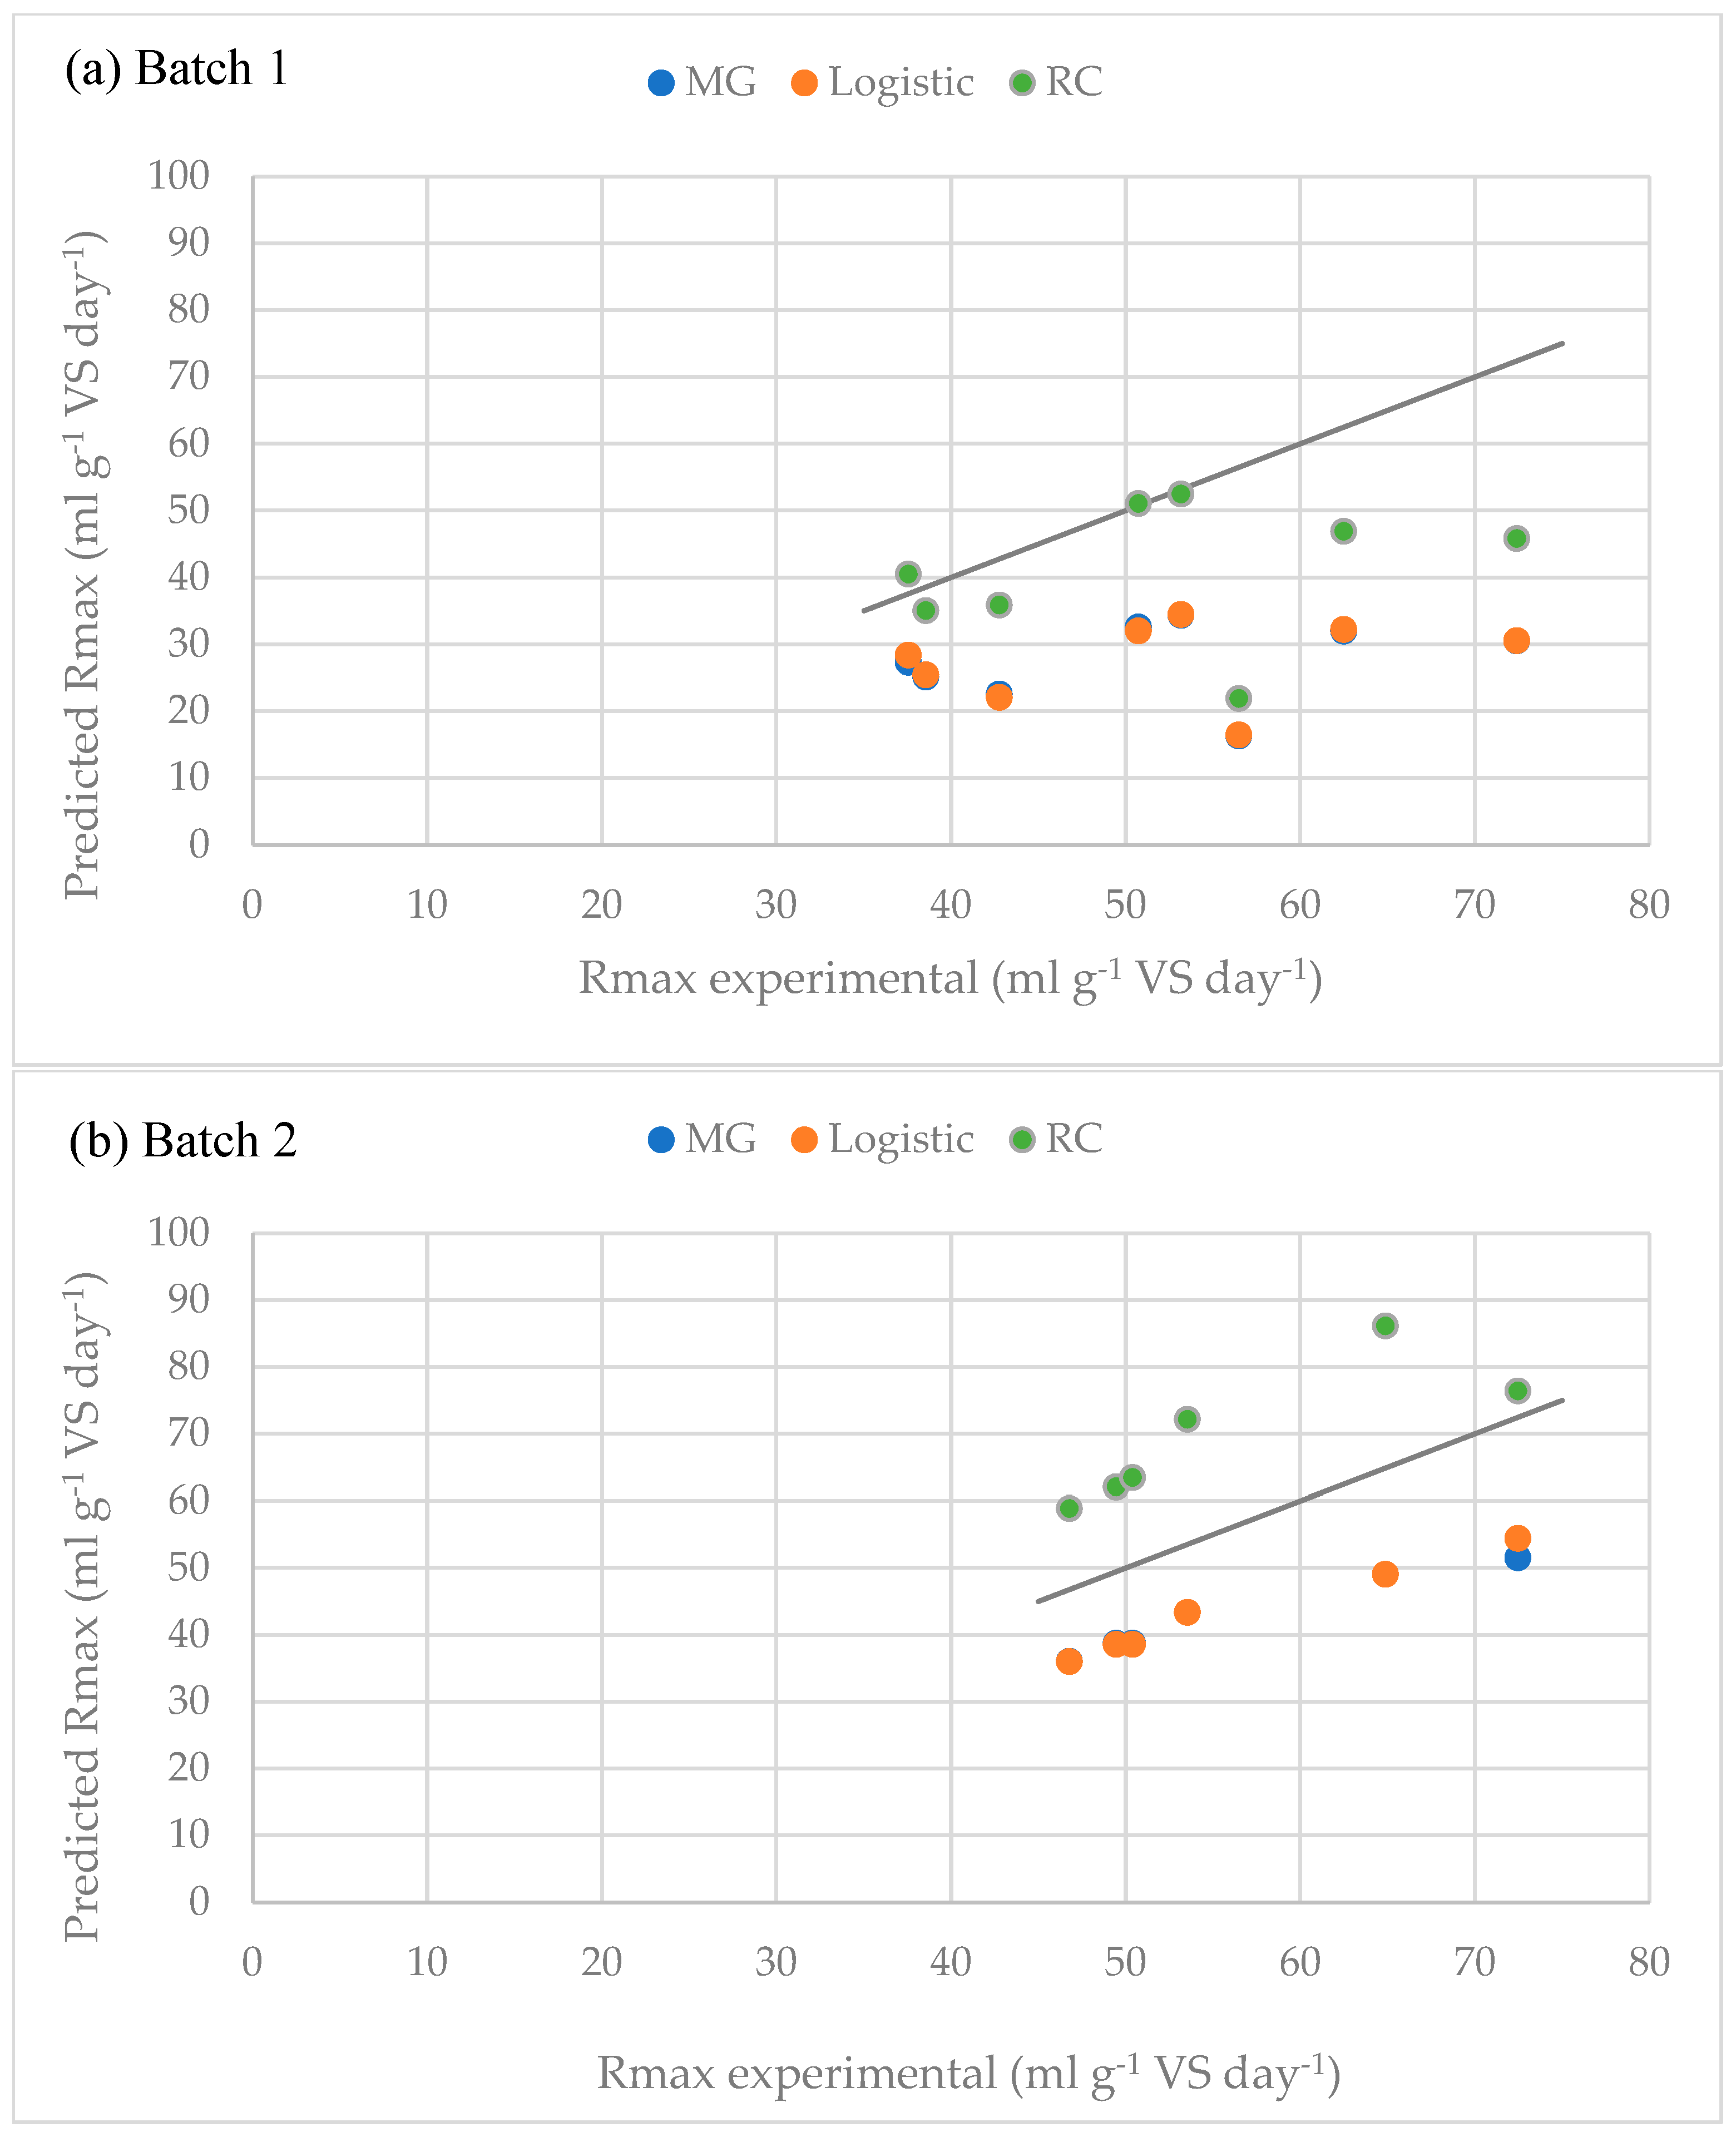
To visually assess the agreement between experimentally determined and predicted Rmax values, predicted versus experimental Rmax plots are presented in Figure 2 for both experimental batches. In Batch 1, the RC model provided predictions closer to the line of perfect agreement for several samples, particularly fine corn stover fractions. In contrast, the MG and Logistic models were consistently positioned below the line of perfect agreement, indicating systematic underestimation of the experimental Rmax values. However, the RC model also showed larger deviations for selected coarse fractions, confirming its variable performance in estimating peak biogas formation rates. In Batch 2, the RC model generally overestimated the experimental Rmax values, with deviations up to approximately 35%, whereas the MG and Logistic models consistently underestimated Rmax across all samples, with deviations of approximately 19–29%. These results indicate that none of the models achieved close agreement with the experimental Rmax values in Batch 2, highlighting the greater difficulty of accurately predicting peak biogas formation rates compared with final cumulative biogas yield.
Figure 2.
Predicted versus experimental Rmax values for: (a) Batch 1, and (b) Batch 2. The line represents the line of perfect agreement.
While differences in Rmax describe how rapidly biogas was formed during the active conversion stage, the lag-phase parameter λ provides additional insight into how fast the beginning of biogas production was initiated. The model-derived λ values obtained using the MG, Logistic, and RC models are summarized in Table 4. Although the cumulative biogas production data indicated an initial delay in biogas formation, the estimated lag phase differed markedly among models and treatments. In untreated samples, model-estimated λ values ranged from 0.95 to 5.34 days. This wider distribution was particularly evident in the fine corn stover fraction, whereas the coarse fractions showed a narrower and less dispersed range of 2.21–2.99 days. In pretreated samples, λ values for most fine fractions ranged from approximately 1.41 to 3.22 days, comparable to or slightly longer than those observed in untreated samples. Notably, sample B2F exhibited an exceptionally long lag phase of approximately 10.5 days, consistently estimated by all three models. This indicates that prolonged λ reflected the experimentally observed delay in net biogas formation rather than a model-specific effect. Such a delay may be associated with slower hydrolysis of more recalcitrant substrate fractions and/or temporary effects related to PEF pretreatment, even though this pretreatment subsequently achieved a higher final cumulative biogas yield than the corresponding untreated control. The coarse fractions displayed lower variability in λ values, ranging from 1.75 to 3.35 days, with no clear differences among PEF pretreatment conditions. Overall, extending the treatment duration at 350 V generally maintained or slightly reduced the lag phase, whereas pretreatment at 1 kV showed a greater tendency to increase λ, particularly in the fine fraction subjected to the longest treatment.
Table 4.
Lag-phase parameters (λ) estimated using the applied kinetic models.
3.2. Goodness-of-Fit of the Applied Kinetic Models
The goodness of fit of the applied kinetic models was evaluated to assess their ability to describe the experimental biogas production data across different pretreatment conditions and particle size fractions. The coefficient of determination R2 and adjusted R2 were first used as indicators of model fit, providing insight into the proportion of explained variance while accounting for the number of model parameters. The obtained values for all pretreatments and models are summarized in Table 5.
Table 5.
Goodness-of-fit indicators for the applied kinetic models.
High coefficients of determination (R2 ≥ 0.97) and similarly high adjusted coefficients of determination (adjusted R2 ≥ 0.96) were obtained for all applied kinetic models across both batches and particle size fractions, indicating very good agreement between the experimental and modeled biogas production data. The MG model generally exhibited the highest or comparable R2 (0.996–0.999) and adjusted R2 values (0.995–0.999), with only minor differences between these two indicators. This suggests that the high R2 values were not substantially affected by the adjustment for the number of model parameters. The RC model also demonstrated consistently high R2 (0.992–0.999) and adjusted R2 values (0.991–0.999), comparable to those obtained with the MG model, indicating a robust description of the biogas production dynamics. The Logistic model exhibited the lowest R2 (0.972–0.992) and adjusted R2 values (0.969–0.991), but these values still correspond to very good agreement between the experimental and modeled biogas production data. Overall, these results confirm that all applied models were able to adequately describe the cumulative biogas production dynamics under the experimental conditions.
3.3. Evaluation of Kinetic Models Based on Error Metrics and Information Criteria
Although all applied kinetic models exhibited similarly high coefficients of determination (R2 and adjusted R2), goodness of fit alone is not sufficient for a comprehensive evaluation of model performance. Therefore, additional error-based metrics (SSE, RMSE, and RSE) and information criteria (AIC and BIC) were employed to assess the magnitude of prediction errors and to compare predictive accuracy and model complexity. For all evaluated criteria, lower values are preferred, as they reflect reduced prediction errors and more favorable model performance [27]. The results of the error-based metrics and information criteria are presented in Table 6.
Table 6.
Error metrics and information criteria for the applied kinetic models.
Across most samples, the RC model yielded the lowest SSE, RMSE, RSE, AIC, and BIC values, indicating the closest overall agreement between the modeled and experimental cumulative biogas production curves. In contrast, the Logistic model consistently exhibited the highest prediction errors and the least favorable information criteria values, while the MG model generally showed intermediate performance. These findings indicate that similarly high goodness-of-fit indicators may still mask important differences in predictive accuracy and parameter estimation behavior among kinetic models.
Despite its superior overall fitting performance, the RC model did not always provide the most accurate estimation of individual kinetic parameters. In particular, several Batch 1 samples showed notable deviations in estimated Bmax values, reflecting the sensitivity of the RC model to early-stage biogas production dynamics. In contrast, the MG model generally provided more realistic Bmax estimates for Batch 1, although its overall prediction errors were higher than those obtained with the RC model. This indicates that model ranking based on overall curve fitting does not necessarily correspond to the accuracy of individual kinetic parameter estimation. A similar discrepancy between cumulative methane yield estimation and goodness-of-fit indicators has also been reported in previous kinetic modeling studies [7,8]. It has been emphasized that high goodness-of-fit values primarily reflects the overall correlation between modeled and experimental curves, whereas deviations in cumulative methane yield may still occur due to non-ideal curve shapes and the biological complexity of anaerobic digestion.
The analysis of Rmax in the present study further supported these observations. While the MG and Logistic models yielded similar Rmax estimates, both models generally underestimated peak biogas formation rates, reflecting their tendency to smooth rapid changes in production dynamics. In contrast, the RC model more frequently produced Rmax values closer to experimental measurements, particularly for fine fractions in Batch 1, although with greater variability among pretreatments, particle size fractions, and experimental batches. Similar limitations of sigmoidal kinetic models in describing early-stage biogas production dynamics have also been reported previously [8,34].
4. Conclusions
This study provides a comparative evaluation of three widely applied sigmoidal kinetic models (MG, Logistic, and RC) for modeling and interpreting anaerobic co-digestion of corn stover pretreated by PEF and dairy cow manure. Although all models achieved high coefficients of determination (R2 ≥ 0.97), additional evaluation using error metrics (SSE, RMSE, and RSE) and information criteria (AIC and BIC) revealed clear differences in predictive performance and parameter estimation accuracy. The RC model generally provided the lowest prediction errors and the most favorable information criteria values, indicating superior overall curve fitting performance. However, its increased sensitivity to the initial phase of biogas production occasionally resulted in overestimation of Bmax and Rmax. In contrast, the MG model consistently provided the closest agreement with experimentally determined maximum biogas production potential, while the Logistic model tended to underestimate both Bmax and Rmax due to smoothing of the production curves.
PEF pretreatment conditions strongly influenced the kinetic response of anaerobic co-digestion. PEF pretreatment at an applied voltage of 350 V enhanced both Bmax and Rmax, particularly in fine corn stover fractions, without substantial prolongation of the lag phase, indicating improved substrate accessibility and accelerated microbial conversion. In contrast, PEF pretreatment at an applied voltage of 1 kV resulted in more heterogeneous responses, including prolonged lag phases and increased variability of kinetic parameters, indicating delayed biogas production kinetics and delayed microbial adaptation under certain pretreatment conditions. The greatest kinetic improvements were generally observed in fine fractions, highlighting the importance of particle size in pretreatment efficiency.
From a practical perspective, the kinetic findings obtained in this study should be interpreted together with the previously reported positive net energy balance results for PEF-pretreated corn stover. Positive net energy gains were observed under PEF pretreatment at both applied voltages (350 V and 1 kV), reaching up to +13.30 kWh t−1 of pretreated substrate [5], indicating that the enhancement in anaerobic digestion performance was sufficient to offset the electrical energy demand of the pretreatment process. Such results are particularly relevant for lignocellulosic biomass pretreatment, where increased biogas yields are often accompanied by substantial energy consumption. However, the present comparative kinetic analysis demonstrated that all three models consistently indicated more stable and consistent kinetic responses characterized by enhanced Bmax and Rmax without substantial prolongation of the lag phase. In contrast, pretreatment performed at an applied voltage of 1 kV resulted in greater variability in the estimated kinetic parameters and less consistent kinetic responses. Therefore, the selection of the optimal PEF pretreatment regime should consider not only the energy balance but also the stability and reliability of the resulting anaerobic digestion kinetics.
Supplementary Materials
The following supporting information can be downloaded at https://www.mdpi.com/article/10.3390/agronomy16151473/s1, Figure S1: Experimental cumulative biogas production curves and fitted MG, Logistic, and RC models for Batch 1 fine fractions: (a) A0F, (b) A1F, (c) A2F, (d) A3F; Figure S2: Experimental cumulative biogas production curves and fitted MG, Logistic, and RC models for Batch 1 coarse fractions: (a) A0C, (b) A1C, (c) A2C, (d) A3C; Figure S3: Experimental cumulative biogas production curves and fitted MG, Logistic, and RC models for Batch 2 fine fractions: (a) B0F, (b) B1F, (c) B2F; Figure S4: Experimental cumulative biogas production curves and fitted MG, Logistic, and RC models for Batch 2 coarse fractions: (a) B0C, (b) B1C, (c) B2C.
Author Contributions
Conceptualization, Đ.K.; methodology, Đ.K. and M.E.; validation, Đ.K. and M.E.; formal analysis, Đ.K. and D.S.; investigation, Đ.K. and S.R.; resources, S.R.; data curation, Đ.K. and S.R.; writing—original draft preparation, Đ.K.; writing—review and editing, Đ.K.; visualization, Đ.K., M.E. and D.S. All authors have read and agreed to the published version of the manuscript.
Funding
This research was funded by the European Union—Next Generation EU. Faculty of Agrobiotechnical Sciences Osijek, project: “Sustainable and Circular Development of Beef Cattle Production within the Agricultural Sector of the Republic of Croatia (BEEFLOOP)”. The project was funded through the Recovery and Resilience Facility under funding source 581. However, the views and opinions expressed are solely those of the authors and do not necessarily reflect those of the European Union or the European Commission. Neither the European Union nor the European Commission can be held responsible for them.
Data Availability Statement
The original contributions presented in this study are included in the article and its Supplementary Materials. Additional data are available from the corresponding author upon reasonable request.
Conflicts of Interest
The authors declare no conflicts of interest.
References
- Mohammadianroshanfekr, M.; Pazoki, M.; Pejman, M.B.; Ghasemzadeh, R.; Pazoki, A. Kinetic Modeling and Optimization of Biogas Production from Food Waste and Cow Manure Co-Digestion. Results Eng. 2024, 24, 103477. [Google Scholar] [CrossRef] [Scilit]
- Alkhrissat, T.; Matarneh, S. Impact of Anaerobic Co-digestion of Ryegrass (RG) and Cow Manure (CM) on Methane Production and Kinetic Analysis. Results Eng. 2025, 25, 104028. [Google Scholar] [CrossRef] [Scilit]
- Karthikeyan, P.K.; Bandulasena, H.C.H.; Radu, T. A Comparative Analysis of Pre-Treatment Technologies for Enhanced Biogas Production from Anaerobic Digestion of Lignocellulosic Waste. Ind. Crops Prod. 2024, 215, 118591. [Google Scholar] [CrossRef] [Scilit]
- Kovačić, Đ. Mapping Research Trends in Pulsed Electric Field Technology Applied to Biogas Production: A Comprehensive Bibliometric Analysis. Fuels 2025, 6, 69. [Google Scholar] [CrossRef] [Scilit]
- Kovačić, Đ.; Kralik, D.; Rupčić, S.; Jovičić, D.; Spajić, R.; Tišma, M. Electroporation of Harvest Residues for Enhanced Biogas Production in Anaerobic Co-Digestion with Dairy Cow Manure. Bioresour. Technol. 2019, 274, 215–224. [Google Scholar] [CrossRef] [Scilit] [PubMed]
- Donoso-Bravo, A.; Mailier, J.; Martin, C.; Rodríguez, J.; Aceves-Lara, C.A.; Wouwer, A.V. Model Selection, Identification and Validation in Anaerobic Digestion: A Review. Water Res. 2011, 45, 5347–5364. [Google Scholar] [CrossRef] [Scilit] [PubMed]
- Brulé, M.; Oechsner, H.; Jungbluth, T. Exponential Model Describing Methane Production Kinetics in Batch Anaerobic Digestion: A Tool for Evaluation of Biochemical Methane Potential Assays. Bioprocess Biosyst. Eng. 2014, 37, 1759–1770. [Google Scholar] [CrossRef] [Scilit] [PubMed]
- Zhang, H.; An, D.; Cao, Y.; Tian, Y.; He, J. Modeling the Methane Production Kinetics of Anaerobic Co-Digestion of Agricultural Wastes Using Sigmoidal Functions. Energies 2021, 14, 258. [Google Scholar] [CrossRef] [Scilit]
- Donoso-Bravo, A.; Pérez-Elvira, S.I.; Fdz-Polanco, F. Application of Simplified Models for Anaerobic Biodegradability Tests. Evaluation of Pre-Treatment Processes. Chem. Eng. J. 2010, 160, 607–614. [Google Scholar] [CrossRef] [Scilit]
- Szwarc, D.; Głowacka, K. Increasing the Biogas Potential of Rapeseed Straw Using Pulsed Electric Field Pre-Treatment. Energies 2021, 14, 8307. [Google Scholar] [CrossRef] [Scilit]
- Szwarc, D.; Nowicka, A.; Zieliński, M. Comparison of the Effects of Pulsed Electric Field Disintegration and Ultrasound Treatment on the Efficiency of Biogas Production from Chicken Manure. Appl. Sci. 2023, 13, 8154. [Google Scholar] [CrossRef] [Scilit]
- Ponzelli, M.; Radjenovic, J.; Drewes, J.E.; Koch, K. Enhanced Methane Production Kinetics by Graphene Oxide in Fed-Batch Tests. Bioresour. Technol. 2022, 360, 127642. [Google Scholar] [CrossRef] [Scilit] [PubMed]
- Moharir, S.; Bondre, A.; Vaidya, S.; Patankar, P.; Kanaskar, Y.; Karne, H. Comparative Analysis of the Amount of Biogas Produced by Different Cultures Using the Modified Gompertz Model and Logistic Model. Eur. J. Sustain. Dev. Res. 2020, 4, em0141. [Google Scholar] [CrossRef] [Scilit] [PubMed]
- Omondi, E.A.; Ndiba, P.K.; Chepkoech, G.K.; Kegode, A.A. Modeling Anaerobic Co-Digestion of Water Hyacinth with Ruminal Slaughterhouse Waste for First Order, Modified Gompertz and Logistic Kinetic Models. Int. J. Renew. Energy Dev. 2023, 12, 627–634. [Google Scholar] [CrossRef] [Scilit]
- Hidalgo, D.; Castro, J.; Díez, D.; Martín-Marroquín, J.M.; Gómez, M.; Pérez, E. Torrefaction at Low Temperature as a Promising Pretreatment of Lignocellulosic Biomass in Anaerobic Digestion. Energy 2023, 263, 125822. [Google Scholar] [CrossRef] [Scilit]
- Olatunji, K.O.; Olugbemide, A.D.; Akerejola, R.F.; Madyira, D.M. Kinetic Modelling of the Biomethane Production Potential of Acidic Pretreated Groundnut Shells. Biomass Convers. Biorefinery 2025, 15, 17139–17153. [Google Scholar] [CrossRef] [Scilit]
- Kurt Kara, G.; Doluk, R.; Civelek Yoruklu, H.; Demir, A.; Ozkaya, B. Biomethane Production Kinetics of Rumen Pretreated Lignocellulosic Wastes. Clean Technol. Environ. Policy 2021, 23, 2941–2954. [Google Scholar] [CrossRef] [Scilit]
- Emebu, S.; Pecha, J.; Janáčová, D. Review on Anaerobic Digestion Models: Model Classification & Elaboration of Process Phenomena. Renew. Sustain. Energy Rev. 2022, 160, 112288. [Google Scholar] [CrossRef] [Scilit]
- Pan, S.; Liu, Q.; Wen, C.; Li, Z.; Du, L.; Wei, Y. Producing Biogas from Rice Straw: Kinetic Analysis and Microbial Community Dynamics. BioEnergy Res. 2021, 14, 1338–1348. [Google Scholar] [CrossRef] [Scilit]
- Tian, Y.; Yang, K.; Zheng, L.; Han, X.; Xu, Y.; Li, Y.; Li, S.; Xu, X.; Zhang, H.; Zhao, L. Modelling Biogas Production Kinetics of Various Heavy Metals Exposed Anaerobic Fermentation Process Using Sigmoidal Growth Functions. Waste Biomass Valor. 2020, 11, 4837–4848. [Google Scholar] [CrossRef] [Scilit]
- Momodu, A.S.; Adepoju, T.D. System Dynamics Kinetic Model for Predicting Biogas Production in Anaerobic Condition: Preliminary Assessment. Sci. Prog. 2021, 104, 00368504211042479. [Google Scholar] [CrossRef] [Scilit] [PubMed]
- Sheron, N.K.; Obileke, K.; Mukumba, P. Kinetic Modelling of Anaerobic Digestion of Biogas Production from Different Wastes: A Review. J. Sustain. Res. 2026, 8, e260044. [Google Scholar] [CrossRef] [Scilit]
- Richard, E.N.; Hilonga, A.; Machunda, R.L.; Njau, K.N. A Review on Strategies to Optimize Metabolic Stages of Anaerobic Digestion of Municipal Solid Wastes towards Enhanced Resources Recovery. Sustain. Environ. Res. 2019, 29, 36. [Google Scholar] [CrossRef] [Scilit]
- Lackner, N.; Wagner, A.O.; Markt, R.; Illmer, P. pH and Phosphate Induced Shifts in Carbon Flow and Microbial Community during Thermophilic Anaerobic Digestion. Microorganisms 2020, 8, 286. [Google Scholar] [CrossRef] [Scilit] [PubMed]
- Gomes, C.S.; Strangfeld, M.; Meyer, M. Diauxie Studies in Biogas Production from Gelatin and Adaptation of the Modified Gompertz Model: Two-Phase Gompertz Model. Appl. Sci. 2021, 11, 1067. [Google Scholar] [CrossRef] [Scilit]
- Gallipoli, A.; Braguglia, C.M.; Gianico, A.; Montecchio, D.; Pagliaccia, P. Kitchen Waste Valorization through a Mild-Temperature Pretreatment to Enhance Biogas Production and Fermentability: Kinetics Study in Mesophilic and Thermophilic Regimen. J. Environ. Sci. 2020, 89, 167–179. [Google Scholar] [CrossRef] [Scilit] [PubMed]
- Lower, L.; Qiu, Y.; Sartor, R.C.; Sagues, W.J.; Cheng, J.J. Kinetic Modeling of Thermophilic Anaerobic Digestion of Lemnaceae for Biogas Production. BioEnergy Res. 2025, 18, 23. [Google Scholar] [CrossRef] [Scilit]
- Qui, Y.; Lower, L.; Rondon Berrio, V.; Cunniffe, J.; Kolar, P.; Cheng, J.; Sagues, W.J. Impacts of Municipal and Industrial Organic Waste Components on the Kinetics and Potentials of Biomethane Production via Anaerobic Digestion. Waste Biomass Valor. 2025, 16, 5019–5035. [Google Scholar] [CrossRef] [Scilit]
- Xu, M.; Uludag-Demirer, S.; Liu, S.; Zheng, Y.; Liu, Y.; Leytem, A.; Liao, W. Understanding the Influence of Inoculum Pre-Conditioning on Microbial Community Dynamics during Biochemical Methane Potential Tests. Biomass Bioenergy 2026, 213, 109445. [Google Scholar] [CrossRef] [Scilit]
- De Vrieze, J.; Raport, L.; Willems, B.; Verbrugge, S.; Volcke, E.; Meers, E.; Angenent, L.T.; Boon, N. Inoculum Selection Influences the Biochemical Methane Potential of Agro-Industrial Substrates. Microb. Biotechnol. 2015, 8, 776–786. [Google Scholar] [CrossRef] [Scilit] [PubMed]
- Pramanik, S.K.; Suja, F.B.; Porhemmat, M.; Pramanik, B.K. Performance and Kinetic Model of a Single-Stage Anaerobic Digestion System Operated at Different Successive Operating Stages for the Treatment of Food Waste. Processes 2019, 7, 600. [Google Scholar] [CrossRef] [Scilit]
- Li, L.; Kong, X.; Yang, F.; Li, D.; Yuan, Z.; Sun, Y. Biogas Production Potential and Kinetics of Microwave and Conventional Thermal Pretreatment of Grass. Appl. Biochem. Biotechnol. 2012, 166, 1183–1191. [Google Scholar] [CrossRef] [Scilit] [PubMed]
- Patil, P.S.; Sharara, M.A. Impacts of Sonication on Biomethane Potential (BMP) and Degradation Kinetics of Pig Lagoon Sludge. Biosyst. Eng. 2022, 223, 129–137. [Google Scholar] [CrossRef] [Scilit]
- Leite, V.D.; Ramos, R.O.; Lopes, W.S.; de Araújo, M.C.U.; de Almeida, V.E.; da Silva Oliveira, N.M.; Viriato, C.L. Kinetic Modeling of Anaerobic Co-Digestion Of Plant Solid Waste with Sewage Sludge: Synergistic Influences of Total Solids and Substrate Particle Size in Biogas Generation. BioEnergy Res. 2024, 17, 744–755. [Google Scholar] [CrossRef] [Scilit]

Disclaimer/Publisher’s Note: The statements, opinions and data contained in all publications are solely those of the individual author(s) and contributor(s) and not of MDPI and/or the editor(s). MDPI and/or the editor(s) disclaim responsibility for any injury to people or property resulting from any ideas, methods, instructions or products referred to in the content. |
© 2026 by the authors. Licensee MDPI, Basel, Switzerland. This article is an open access article distributed under the terms and conditions of the Creative Commons Attribution (CC BY) license.