


Abstract
Uneven seed placement in nursery trays reduces seedling uniformity and can reduce the reliability of mechanical transplanting in hybrid rice, but the optimum printed seeding density remains unclear. This study evaluated the effects of printed seeding density on seed distribution, seedling quality, transplanting performance, canopy productivity and yield formation in machine-transplanted hybrid indica rice. A two-year split-plot field experiment was conducted in Xuzhou, China, using Runliangyou 313 and Yangxianyou 903. Five printed seeding densities (1400–2600 printed points tray−1) were compared with two local weight-based broadcasting controls, representing practical establishment systems rather than seed-number-matched contrasts. Moderate printed densities improved seed distribution uniformity, strengthened the seedling mat, reduced transplanting defects and supported productive tiller formation. T3 and T4 produced the highest harvested yields, increasing yield by 13.3–15.5% over the standard broadcasting control. These gains were associated with higher panicle number, greater post-anthesis dry matter accumulation and higher harvest index. The results indicate that moderate-density printed seeding can improve establishment quality and grain yield under wheat-rice rotation conditions.
1. Introduction
Rice remains a major staple crop for more than half of the world’s population, and demand is expected to stay high in Asia and other regions where cereal consumption continues to grow [1,2]. At the same time, rice production is moving towards lower labour input and more reliable field operations [3]. Mechanical transplanting is one practical response, particularly in wheat-rice rotation systems where the period between wheat harvest and rice establishment is short [4]. Its performance, however, depends heavily on the tray-raised seedling mat. This point is especially relevant for hybrid indica rice: seed is costly, and any loss of nursery uniformity can weaken both the seed-saving value and the field performance of mechanised production [5,6].
Seeding rate strongly affects seedling morphology, root development and mechanical transplanting suitability [5,7]. Seedling age and nursery substrate also influence seedling quality and yield performance in machine-transplanted rice [8]. The response is rarely linear. Low seeding rates often favour strong individual seedlings, but the seedling mat may lack cohesion. High rates can produce a dense mat, yet they also increase competition among seedlings and may aggravate transplanting defects [7,8,9]. Printed sowing and precision drill sowing approach the same problem from a different direction: they regulate where the seeds are placed, rather than only how many seeds are used [10,11]. More recently, image-based methods have made it possible to describe sowing uniformity quantitatively, reducing reliance on visual judgement alone [12].
Previous studies provide quantitative evidence that nursery management can substantially alter machine-transplanted rice establishment. For example, an appropriate seeding rate of 60 g tray−1 has been identified as favourable for maintaining seedling quality, improving mechanical transplanting quality and supporting high yield in hybrid rice [5]. Under precision drill sowing, a sowing rate of 3400 seeds tray−1 produced a high seedling plumpness value (0.18) and seedling strength index (0.42), but the empty hill rate still reached 3.05%, indicating that strong individual seedlings alone do not necessarily guarantee satisfactory field establishment [6]. Printed sowing has also been reported to reduce seed rate while increasing grain yield by about 12% compared with conventional multiple-seedling machine transplanting [10]. These quantitative findings show that seed input, seed placement and seedling-mat formation jointly affect seedling quality, transplanting defects and yield performance.
The agronomic meaning of printed seeding is still not fully resolved. Most previous work has treated seeding rate, seedling age or transplanting density as separate management factors [5,8,13], whereas the spatial arrangement of seeds within a tray has received less attention. However, yield formation in machine-transplanted rice depends on a sequence of connected processes, beginning with emergence uniformity and early seedling competition [10,11], followed by seedling-mat quality and transplanting stability [6,9], and then by tiller survival, canopy light interception and biomass production [13,14,15,16]. The final conversion of biomass into grain further depends on dry matter partitioning and harvest index [17,18]. Thus, an unresolved question remains: should the optimum printed density be defined by seedling vigour, mat strength, canopy size or harvested yield?
These studies leave three specific gaps. Most have optimized single management factors, such as seeding rate, seedling age, nursery substrate or transplanting density, rather than the complete establishment-to-yield pathway. Studies on printed or precision sowing have mainly emphasised seed saving, seedling quality or yield response, with limited linkage of EPR, MSPR and SSCV to seedling-mat strength, transplanting defects, productive tiller formation, canopy productivity, post-anthesis dry matter accumulation and harvest index. Consequently, the optimum printed seeding density remains undefined from an integrated agronomic perspective.
Printed seeding provides a useful setting in which to examine that question. Because seeds are fixed at designed positions on nursery paper before tray raising, empty points, multiple-seed points and seed-spacing variation can be controlled more directly than under broadcasting. In principle, a more orderly starting pattern should give a more uniform seedling mat and smoother delivery during mechanical transplanting. What is less certain is how far that initial advantage persists after transplanting. Few studies have followed the pathway from seed placement to seedling quality, transplanting defects, population formation, canopy productivity and grain yield within the same field experiment. Without that integrated view, printed seeding remains more a seed-saving technique than a density-optimised establishment strategy.
The present study therefore connects seed distribution uniformity, seedling quality, seedling-mat mechanical properties, transplanting quality, population development, canopy light distribution, dry matter production and yield formation within the same two-year field experiment. In this framework, printed seeding density was examined not only as a seed-saving practice, but also as a management factor linking tray-level seed placement with field establishment and yield formation.
We hypothesised that grain yield would increase only when printed seeding density balanced, rather than maximised separately, seed distribution uniformity, seedling quality, seedling mat mechanical strength, transplanting quality, productive tiller formation, canopy light interception and dry matter allocation. To test this hypothesis, we conducted a two-year field experiment in Xuzhou, Jiangsu Province, China, using two hybrid indica rice cultivars, Runliangyou 313 and Yangxianyou 903. The objectives were to: (1) evaluate the effects of printed seeding density on seed distribution uniformity and seedling quality; (2) determine how printed seeding affects seedling mat mechanical properties and transplanting quality; (3) clarify the responses of tiller dynamics, canopy structure, post-anthesis dry matter accumulation, harvest index and yield components; and (4) identify the traits most closely associated with yield improvement under printed seeding.
2. Materials and Methods
2.1. Experimental Site and Soil Conditions
The field experiments were carried out in the 2024 and 2025 rice seasons at the experimental farm of Xuzhou Vocational College of Bioengineering, Quanshan District, Xuzhou, Jiangsu Province, China. The site belongs to a warm-temperate, semi-humid monsoon region. Seasonal temperature variation is pronounced, and rainfall and heat resources generally coincide with the main rice-growing period.
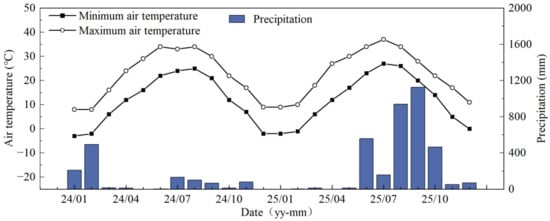
More specifically, the experimental site is located at approximately 34.262° N, 117.132° E and about 50 m above sea level. Based on long-term meteorological records for Xuzhou, the region has a mean annual air temperature of approximately 14.5 °C, annual precipitation of approximately 841.2 mm, annual sunshine duration of approximately 2268.2 h and a frost-free period of approximately 209 days. Rainfall is concentrated mainly from June to September, overlapping the main rice-growing season. Monthly air temperature and precipitation during the 2024 and 2025 rice-growing seasons are shown in Figure 1.
Figure 1.
Monthly air temperature and precipitation during the rice-growing season in 2024 and 2025.
Before transplanting, soil was sampled from the 0–20 cm plough layer across the experimental field and mixed into one composite sample. The soil was sandy loam, with 18.5 g kg−1 organic matter, 1.42 g kg−1 total nitrogen, 78.35 mg kg−1 available nitrogen, 18.62 mg kg−1 available phosphorus and 88.47 mg kg−1 available potassium.
Seeds were sown on 20 May 2024 and 21 May 2025. Mechanical transplanting was performed on 9 June 2024 and 10 June 2025. Heading-stage measurements were taken on 10 August 2024 and 12 August 2025, and grain yield was harvested on 28 September 2024 and 30 September 2025.
2.2. Plant Materials and Experimental Design
Two commercial hybrid indica rice cultivars were selected: Runliangyou 313 (RLY313) and Yangxianyou 903 (YXY903). Their 1000-grain weights were 22.7 g and 26.9 g, respectively. Seeds were supplied by Xuzhou Dahua Seed Co., Ltd., Xuzhou, China.
The experiment used a split-plot design with four field replicates. Cultivar served as the main-plot factor; seeding treatment was assigned to the subplot. Each subplot measured 50 m2. Seven seeding treatments were included: five printed seeding densities and two conventional mechanical broadcasting controls. The printed treatments were 1400, 1700, 2000, 2300 and 2600 printed points tray−1, hereafter T1, T2, T3, T4 and T5. CK1 represented a reduced broadcasting rate of 50 g seeds tray−1, and CK2 represented the local standard broadcasting rate of 70 g seeds tray−1. The treatment settings are given in Table 1.
Table 1.
Description of seeding treatments, estimated seed numbers and estimated seed weights per tray for the two rice cultivars.
The five printed seeding densities were selected to represent a practical gradient from low seed-saving input to high nursery loading in machine-transplanted hybrid indica rice. The 1400–2600 printed points tray−1 range, with 300-point intervals, covered low, moderate and high inputs relative to local broadcasting rates. CK1 and CK2 were local weight-based broadcasting practices, not seed-number-matched controls; thus, the comparison represents practical establishment systems, with seed number and spatial arrangement partly confounded. The 300-point interval was chosen to capture a moderate-density optimum while keeping the treatment number manageable.
Seedling trays were 60 cm × 30 cm. For each cultivar × seeding treatment × replicate combination, four trays were prepared, giving 16 trays per cultivar-treatment combination in each year. In the printed treatments, each printed point was designed to hold one seed. To compare printed point density with the conventional seed-weight rate, seed weight per tray was estimated from the 1000-grain weight of each cultivar. In the broadcasting controls, 50 and 70 g seeds tray−1 corresponded to approximately 2203 and 3084 seeds tray−1 for RLY313 and 1859 and 2602 seeds tray−1 for YXY903.
For nursery-related measurements, the experimental unit was the field replicate/subplot. Within each Year × Cultivar × Treatment × field-replicate combination, the four trays were treated as subsamples rather than independent biological replicates. Tray-level observations were first averaged within each field replicate, and this field-replicate mean was used as one biological replicate in the statistical analysis (n = 4 for each Year × Cultivar × Treatment panel).
2.3. Printed Seeding, Nursery Management, and Field Crop Management
Printed seeding was carried out with a rice printed seeding machine (HDBZ-600, Huai’an Hande Agricultural Technology Co., Ltd., Huai’an, Jiangsu, China). A food-grade starch-based adhesive was applied to the nursery paper, and seeds were fixed at the designed printed points. After printing, the paper carrying the seeds was inverted into seedling trays, covered with nursery substrate and managed under standard nursery conditions until transplanting.
Seedlings were transplanted mechanically at 20 cm × 25 cm hill spacing, equivalent to approximately 200,000 hills ha−1. Fertiliser and water management followed local high-yield rice practices. Nitrogen was supplied at 225 kg N ha−1 and split among basal, tillering and panicle fertilisers at a ratio of 3.5:3.0:3.5. Basal fertiliser was applied one day before transplanting; tillering fertiliser was applied 7 days after transplanting; and panicle fertiliser was applied at panicle initiation and spikelet differentiation. Phosphorus and potassium were applied at 120 kg P2O5 ha−1 and 120 kg K2O ha−1, respectively. All phosphorus was applied as basal fertiliser, whereas potassium was split between basal and panicle fertilisation. Alternate wetting and drying irrigation was used, and weeds, diseases and insects were controlled according to local recommendations.
2.4. Evaluation of Seed Distribution Uniformity
Before the nursery substrate was added, each seeded tray was photographed under uniform illumination using a vertically mounted Canon EOS 90D digital camera (Canon Inc., Tokyo, Japan; 6960 × 4640 pixels). The camera was fixed approximately 80 cm above the tray surface. Shooting distance, light source, camera angle, background and exposure settings were kept constant for all trays.
For each replicate, images from the four trays were analysed, and their mean was taken as one biological replicate. Tray images were processed in ImageJ/Fiji with ImageJ version 1.54i (National Institutes of Health, Bethesda, MD, USA). Images were first calibrated with the known tray dimensions and converted to binary masks after background correction. The same thresholding, particle-size filtering and manual correction rules were established before batch processing and then applied to all images. Centroid coordinates were extracted for individual seeds. Touching or overlapping seeds were checked against the original images and corrected manually when necessary; all image processing was completed by the same operator to avoid operator-dependent differences. Specifically, the four tray images within each field replicate were treated as subsamples, and their mean value was used as one field-replicate value.
For image segmentation, background-corrected images were converted to binary masks using a fixed thresholding protocol established from representative tray images before batch processing. Particle-size filtering was then applied to remove background noise, tray edges and non-seed particles, while retaining particles consistent with the projected seed size. Manual correction was limited to predefined cases, including touching seeds, overlapping seeds, edge seeds and particles incorrectly separated or merged by the automatic segmentation. All corrections were made by checking the binary masks against the original colour images.
To validate the ImageJ/Fiji workflow, 20 tray images covering both cultivars, both years, printed seeding treatments and broadcasting controls were randomly selected and manually counted as reference images. Automatic ImageJ/Fiji counts showed high agreement with manual counts, with R2 ≥ 0.98, a mean absolute percentage error ≤ 3%, and a mean bias < 2%. In addition, 10 randomly selected images were reprocessed by the same operator, and the coefficient of variation between repeated analyses was <3%. These results indicate that the workflow provided reliable and repeatable seed-count and seed-position data for calculating seed-distribution indices (Supplementary Table S4).
In the printed treatments, each adhesive point was treated as one detection unit. A point without a seed was classified as empty; a point with two or more seeds was classified as a multiple-seed point. In the broadcasting controls, the tray area was divided into virtual detection cells according to the theoretical seed density of each control, and each cell was classified as empty, normally seeded or multiple-seeded.
For the broadcasting controls, no predefined physical seed positions were present. Therefore, the tray surface (60 cm × 30 cm) was divided into equal-area virtual detection cells according to the theoretical seed number of each cultivar-specific broadcasting treatment. The number of virtual cells (Nt) was set equal to the estimated seed number per tray for that control treatment, and the cell area was calculated as tray area divided by Nt. Each cell was then classified as empty, normally seeded or multiple-seeded according to the number of seed centroids falling within the cell. We recognise that these virtual cells are not physically identical to the adhesive points used in printed seeding. Thus, EPR and MSPR in the broadcasting treatments were interpreted as density-standardised indicators of local seed aggregation rather than direct physical equivalents of printed points. The SSCV, calculated from nearest-neighbour distances among seed centroids, was independent of the virtual-cell definition and was used as a complementary index of spatial variation.
Seed distribution was described by empty-point rate (EPR), multiple-seed point rate (MSPR) and seed spacing coefficient of variation (SSCV):
where Nt denotes the total number of detection units, Ne the number of empty units and Nm the number of units containing two or more seeds.
EPR (%) = (Ne/Nt) × 100
MSPR (%) = (Nm/Nt) × 100
SSCV was calculated from nearest-neighbour distances among seed centroids:
where dij is the Euclidean distance between seeds i and j, di is the nearest-neighbour distance for seed i, and SD(d) and Mean(d) are the standard deviation and mean of all nearest-neighbour distances within a tray.
dij = sqrt[(xi − xj)2 + (yi − yj)2]
di = min(dij), j ! = i
SSCV (%) = [SD(d)/Mean(d)] × 100
2.5. Seedling Morphological Traits
Seedling traits were measured one day before transplanting. For each field replicate, the four trays were measured as subsamples. From each tray, 100 representative seedlings were sampled at random; tray means were first calculated, and the mean of the four trays within the same field replicate was used as one biological replicate for statistical analysis.
The measured seedling traits were stem base width (SBW), number of roots (NR) and dry weight per 100 seedlings (DW100). SBW was measured with a digital calliper, and NR was counted manually. For dry weight, seedlings were heated at 105 °C for 30 min and then dried at 80 °C to constant weight.
2.6. Root Traits and Physiological Measurements
For root and physiological measurements, 30 seedlings from each replicate were combined into one biological sample. Three technical subsamples of 10 g fresh weight were taken from this sample, and their average was used in the statistical analysis. The seedlings were sampled within each field replicate, and technical subsamples were averaged before the field-replicate value entered the statistical model.
Root activity (RA) was measured using the triphenyl tetrazolium chloride reduction method, and root volume (RV) by water displacement [19]. Root surface area (RSA) was determined from scanned root images with WinRHIZO Pro 2024 software (Regent Instruments Inc., Quebec City, QC, Canada). Stem-sheath nonstructural carbohydrate content (SSNSC) was measured by the anthrone-sulfuric acid colorimetric method [20]. Absorbance was recorded with a UV-visible spectrophotometer.
For the integrated radar-plot evaluation, each seedling quality variable was scaled by min-max normalisation within the corresponding cultivar-year panel before plotting: X’ = (X − Xmin)/(Xmax − Xmin), where X is the observed value and Xmin and Xmax are the minimum and maximum values of that variable among treatments in the same panel.
2.7. Seedling Mat Mechanical Properties
Seedling mat mechanical properties were measured one day before transplanting. For each field replicate, four trays were measured as subsamples under the same moist seedling-mat condition immediately after removal from the nursery, and the tray means were averaged to obtain one field-replicate value. Pulling force (PF), tensile force (TF) and shear force (SF) were determined with a digital force gauge (HP-50, Yueqing Edberg Instruments Co., Ltd., Yueqing, China) after zero calibration before each measurement batch.
For PF, ten seedlings were selected from the central region of each tray and pulled vertically from the mat at a constant speed; the maximum force required for separation was recorded. For TF, three rectangular strips of identical width and length were cut from the central part of each seedling mat, clamped at both ends and pulled horizontally until rupture. For SF, three standard-sized mat blocks were subjected to lateral shearing with the same fixture. The mean value of the subsamples within each tray was used as the replicate value. This protocol kept the cutting position, loading direction and moisture condition consistent among treatments.
2.8. Mechanical Transplanting Quality
Mechanical transplanting quality was assessed 3 days after transplanting. In each subplot, five 2 m row segments were selected from central rows using an S-shaped sampling route after border rows were excluded, giving a total investigated row length of 10 m per subplot. Missing-planting rate (MPR), seedling injury rate (SIR), floating-seedling rate (FSR) and seedlings per hill (SPH) were recorded, and the five segments were averaged for the subplot value.
The indices were calculated as:
where Nmh is the number of missing hills, Nth the theoretical number of hills in the sampled row segments, Nis the number of injured seedlings, Nfs the number of floating seedlings, Nts the total number of transplanted seedlings and Nh the total number of investigated hills.
MPR (%) = (Nmh/Nth) × 100
SIR (%) = (Nis/Nts) × 100
FSR (%) = (Nfs/Nts) × 100
SPH = Nts/Nh
2.9. Tiller Dynamics and Productive Tiller Percentage
Population development was monitored using 20 fixed hills selected from central rows after border plants were excluded. Tiller number was recorded every 7 days from 10 days after transplanting until maturity. Maximum tiller number (MTN) and final panicle number (PN) were converted to ×104 ha−1 for presentation; values initially recorded on a mu basis were multiplied by 15. PN used in yield-component analysis was determined independently by unit-area investigation at maturity.
Productive tiller percentage (PTP) was calculated as:
where PN is the final panicle number and MTN is the maximum tiller number recorded during the growth period.
PTP (%) = (PN/MTN) × 100
2.10. Measurement of Canopy Structure and Light Distribution
Canopy structure and light distribution were measured at heading on clear days between 10:00 and 14:00. Leaf area index (LAI), canopy light transmittance (CLT), canopy light reflectance (CLR) and canopy light interception rate (CLIR) were measured with a portable canopy analysis system under consistent field conditions. Five positions were measured in each subplot using an S-shaped sampling route after border rows were excluded, and the mean value was used for analysis.
CLT was calculated as transmitted photosynthetically active radiation below the canopy relative to incident radiation above the canopy. CLR was calculated as reflected radiation relative to incident radiation. CLIR was then obtained as:
CLIR (%) = 100 − CLT − CLR
2.11. Dry Matter Accumulation and Harvest Index
At heading and physiological maturity, 15 hills were collected from central rows of each subplot using an S-shaped sampling route after border plants had been removed. The sampled hills were taken from several positions within the subplot to better represent within-plot variation. Plants were separated into leaves, stems plus sheaths, and panicles. All organs were heated at 105 °C for 30 min and dried at 80 °C to constant weight. Dry matter accumulation was converted to t ha−1 using the field planting density.
Post-anthesis dry matter accumulation (PDMA) was calculated as:
where DMA_maturity and DMA_heading are aboveground dry matter accumulation at maturity and heading, respectively.
PDMA = DMAmaturity − DMAheading
Harvest index (HI) was calculated as:
HI = Harvested grain yield/Aboveground biomass at maturity
2.12. Measurement of Grain Yield and Yield Components
At maturity, grain yield was measured from a representative 5 m2 harvest area in the central part of each subplot after border rows were removed. Plants were harvested, threshed, cleaned and air-dried. Grain moisture was measured with a digital moisture metre and adjusted to the standard moisture content of 13.5%. Harvested grain yield (HGY) was expressed as t ha−1.
For yield-component measurements, 30 panicles were collected from the central rows of each subplot using a fixed-interval sampling route. PN was determined from unit-area investigation and expressed as ×104 ha−1. Spikelets per panicle (SPP), seed-setting rate (SSR) and 1000-grain weight (TGW) were measured after threshing and grain separation.
Theoretical grain yield (TGY) was calculated as:
where PN is expressed as ×104 ha−1, SPP as spikelets per panicle, SSR as percentage and TGW as g.
TGY (t ha−1) = (PN × SPP × SSR × TGW)/10,000,000
2.13. Statistical Analysis
The split-plot structure was analysed with a linear mixed-effects model [21,22,23,24]. Year, cultivar, seeding treatment and their interactions were treated as fixed effects. Block nested within year was fitted as a random effect, and the block × cultivar interaction within year served as the main-plot error term for testing cultivar effects. The model was fitted as: trait~Year * Cultivar * Treatment + (1|Year:Block) + (1|Year:Block:Cultivar). Seeding treatment and cultivar × seeding treatment effects were tested against the subplot residual error. When treatment effects were significant, estimated marginal means were obtained from the fitted mixed model and compared within each year and cultivar using Tukey–Kramer-adjusted pairwise contrasts (p < 0.05) in the emmeans package [24]. The fixed-effect structure and random-effect structure were reported explicitly to clarify the experimental error terms used for the split-plot design.
Normality and variance homogeneity were checked separately for each trait using residual diagnostics, Shapiro–Wilk tests and Levene tests before model interpretation. Mixed-model analyses were performed in R version 4.3.1 using lme4, lmerTest and emmeans [22,23,24]. Compact letter displays were generated from the adjusted pairwise comparisons of estimated marginal means. Global fixed-effect tests from the mixed models, including the main effects and interactions of Year, Cultivar and Treatment, are reported in Supplementary Table S1 together with F-statistics, p-values and model-level variance-explained metrics. Marginal and conditional R2 values were calculated for each trait to describe the variance explained by fixed effects alone and by the full mixed model, respectively. For percentage variables bounded between 0 and 100%, including EPR, MSPR, MPR, SIR, FSR, PTP and SSR, model assumptions were evaluated for each variable individually. Arcsine square-root transformed analyses [asin(sqrt(y/100))] were also performed as robustness checks. Because the transformed analyses did not change the treatment conclusions, original percentage values are presented in the figures and tables for biological interpretability. Pearson correlations were calculated separately for each cultivar to explore associations between harvested grain yield and key establishment, seedling quality, seedling-mat mechanical, transplanting quality, canopy, dry matter accumulation and harvest-index traits. Key correlations with harvested grain yield are reported in Supplementary Table S3. These correlations were interpreted as exploratory associations rather than direct evidence of causality. Figures were prepared in OriginPro 2021 (OriginLab Corp., Northampton, MA, USA).
3. Results
3.1. Grain Yield and Yield Components
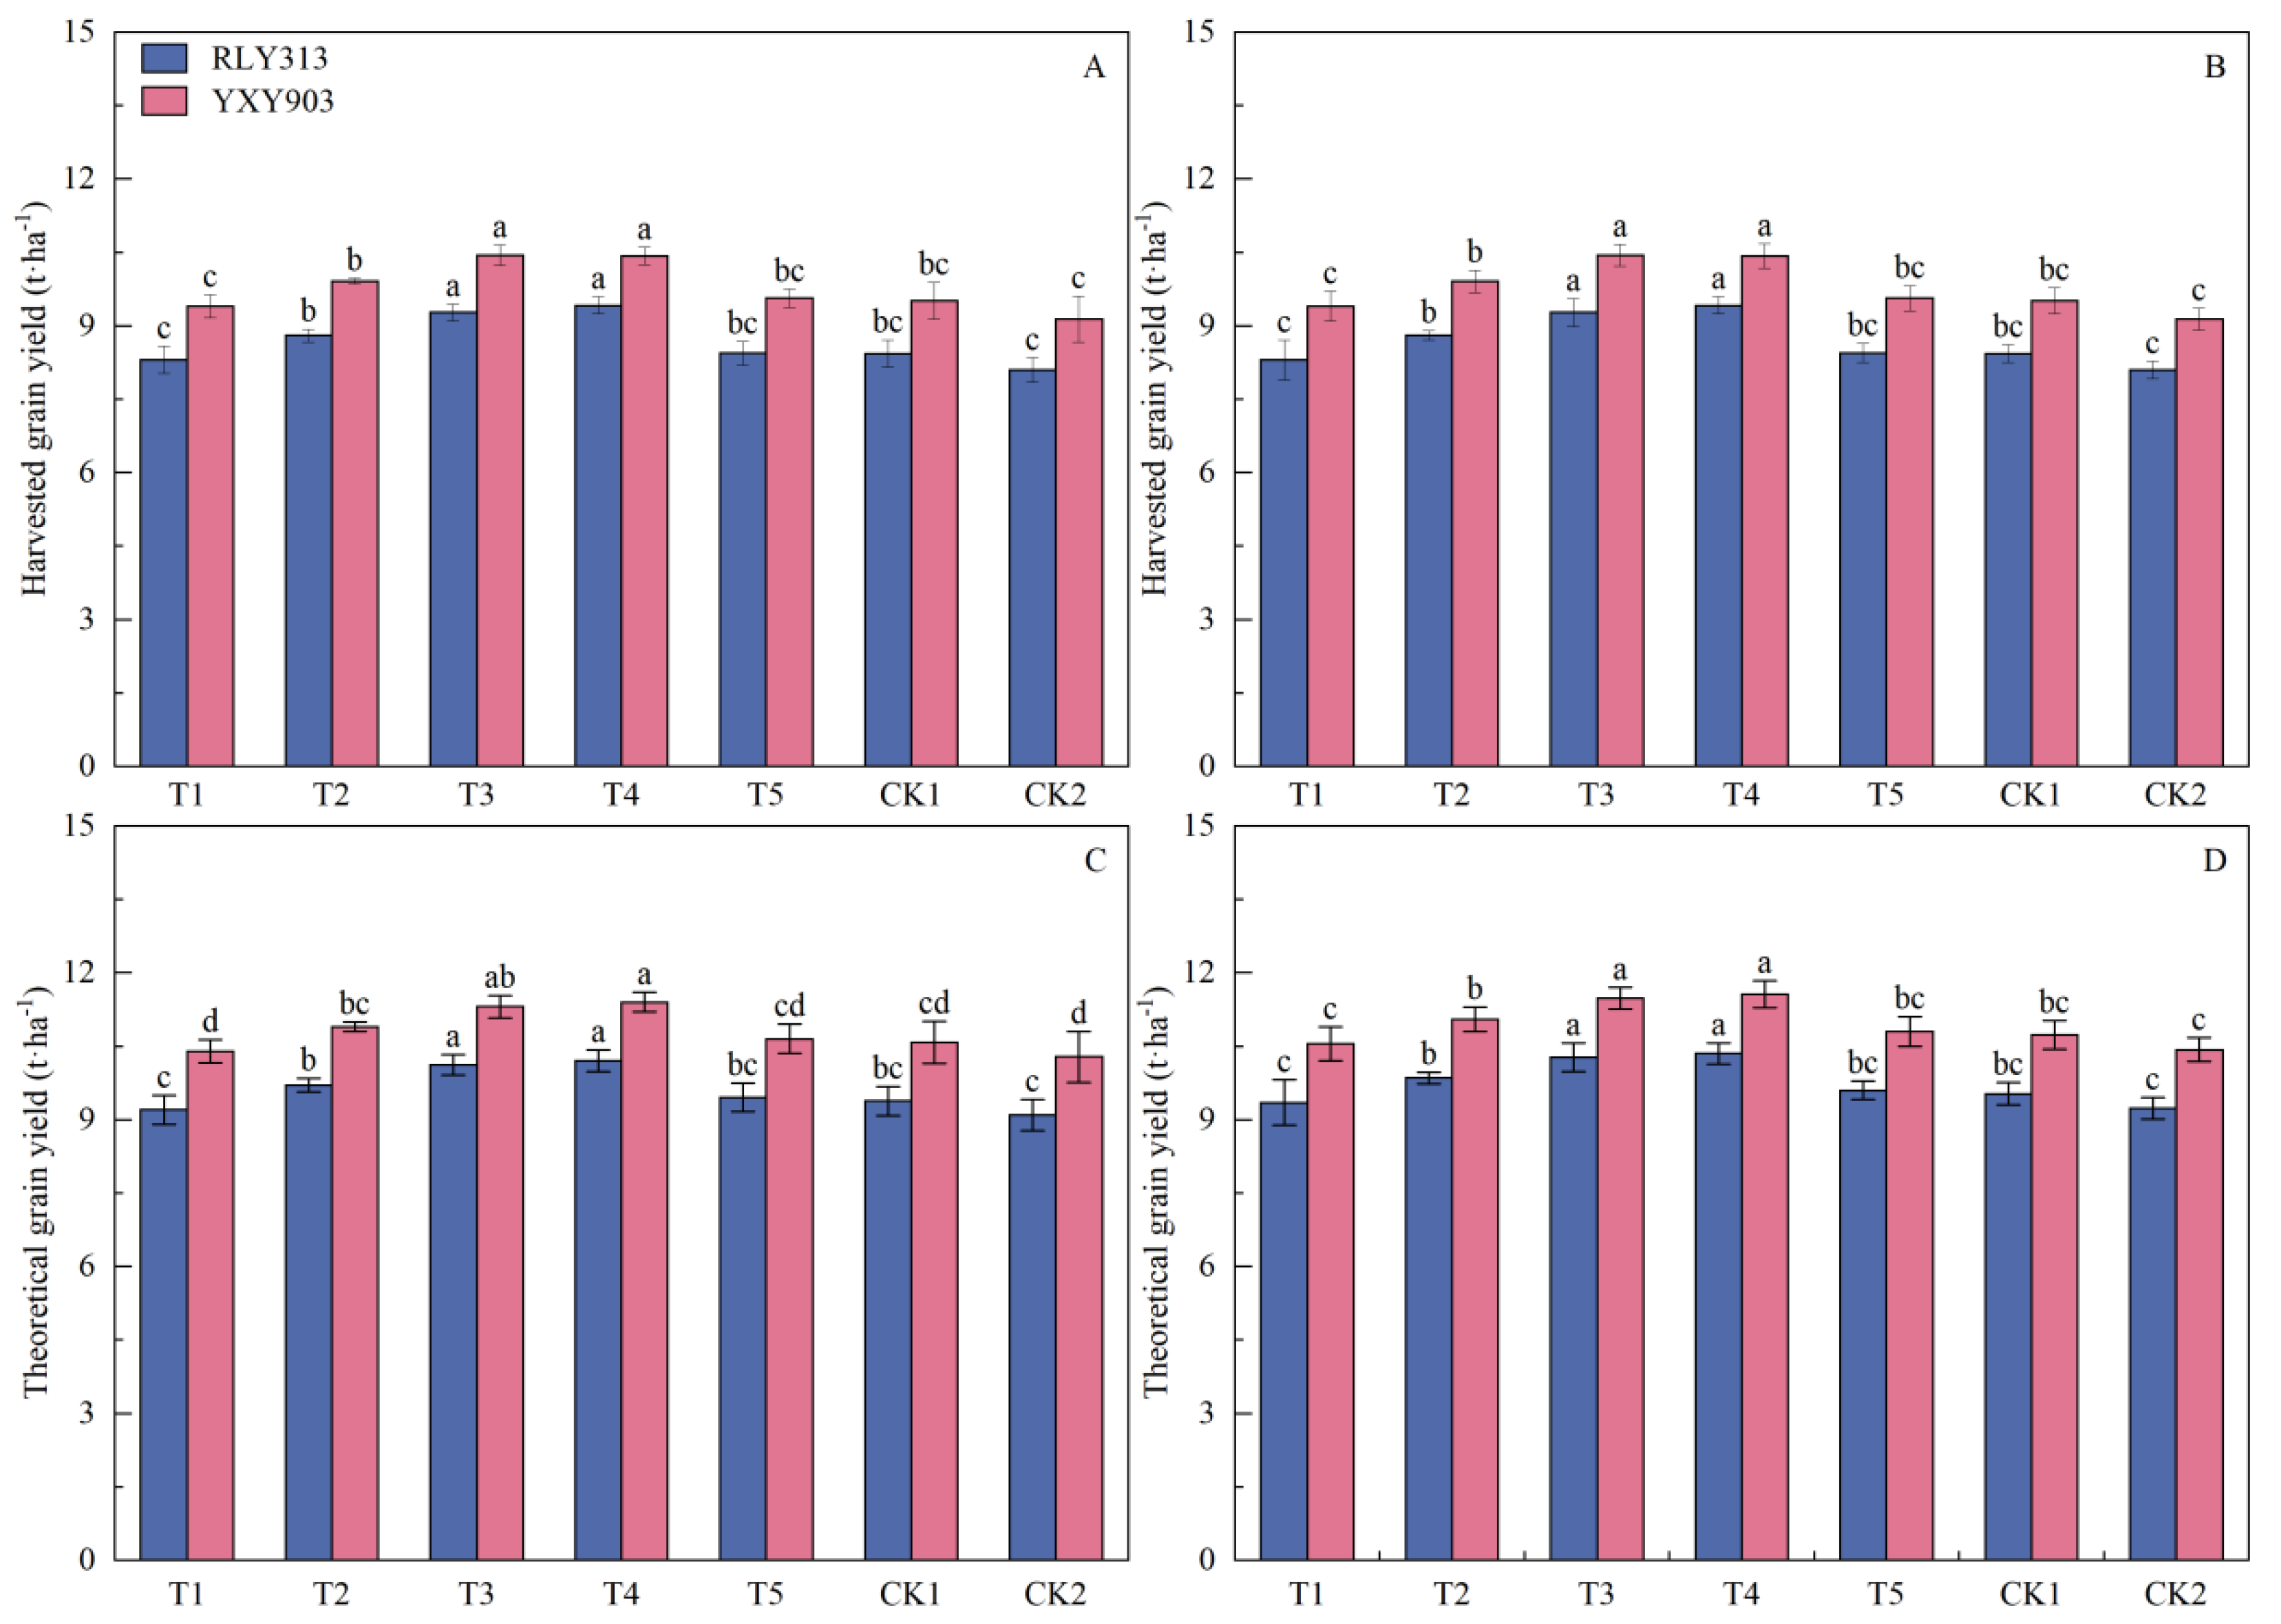
Printed seeding density affected both harvested grain yield (HGY) and theoretical grain yield (TGY) in the two cultivars (Figure 2; Supplementary Table S1). Treatment effects were significant for HGY and for most establishment, mechanical, population and dry matter traits, while treatment × year interactions were generally weak for yield and mechanical traits. Across the two seasons, HGY followed an inverted-U pattern. It increased from T1 to the T3/T4 range and declined when density became excessive at T5. Compared with the local standard broadcasting control (CK2), T3/T4 increased HGY by 14.5–15.5% in RLY313 and by 13.3–13.7% in YXY903. Conversion from TGY to HGY was also higher under T3/T4 than under T5 and CK2. Thus, the yield advantage of moderate printed seeding was associated with both higher yield potential and a greater realised proportion of that potential.
Figure 2.
Effects of printed seeding density on harvested and theoretical grain yield of RLY313 and YXY903 in 2024 and 2025. Note: (A,C), 2024; (B,D), 2025. RLY313, Runliangyou 313; YXY903, Yangxianyou 903. Bars represent means ± SD (n = 4). Different lowercase letters indicate significant differences among treatments within the same year and cultivar based on Tukey–Kramer-adjusted pairwise comparisons of estimated marginal means from the mixed-effects model at p < 0.05. The same notation applies to subsequent bar charts unless otherwise stated.
The yield-component data point to panicle population as the main contributor to this response (Table 2). Panicle number increased as printed seeding density rose and generally reached its maximum around T4. At the higher end of the density range, spikelets per panicle and seed-setting rate tended to decrease. Thousand-grain weight changed little within each cultivar. The pattern therefore reflects a familiar trade-off in rice populations: more panicles are needed for high yield, but excessive population pressure can weaken single-panicle productivity.
Table 2.
Effects of printed seeding density on yield components of RLY313 and YXY903 in 2024 and 2025.
3.2. Seed Distribution Uniformity
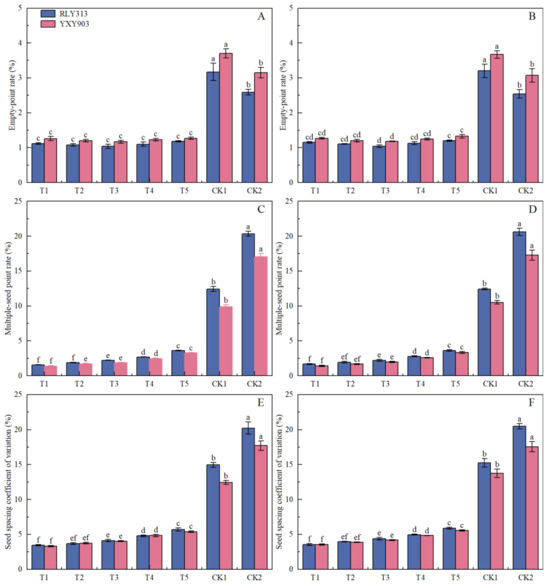
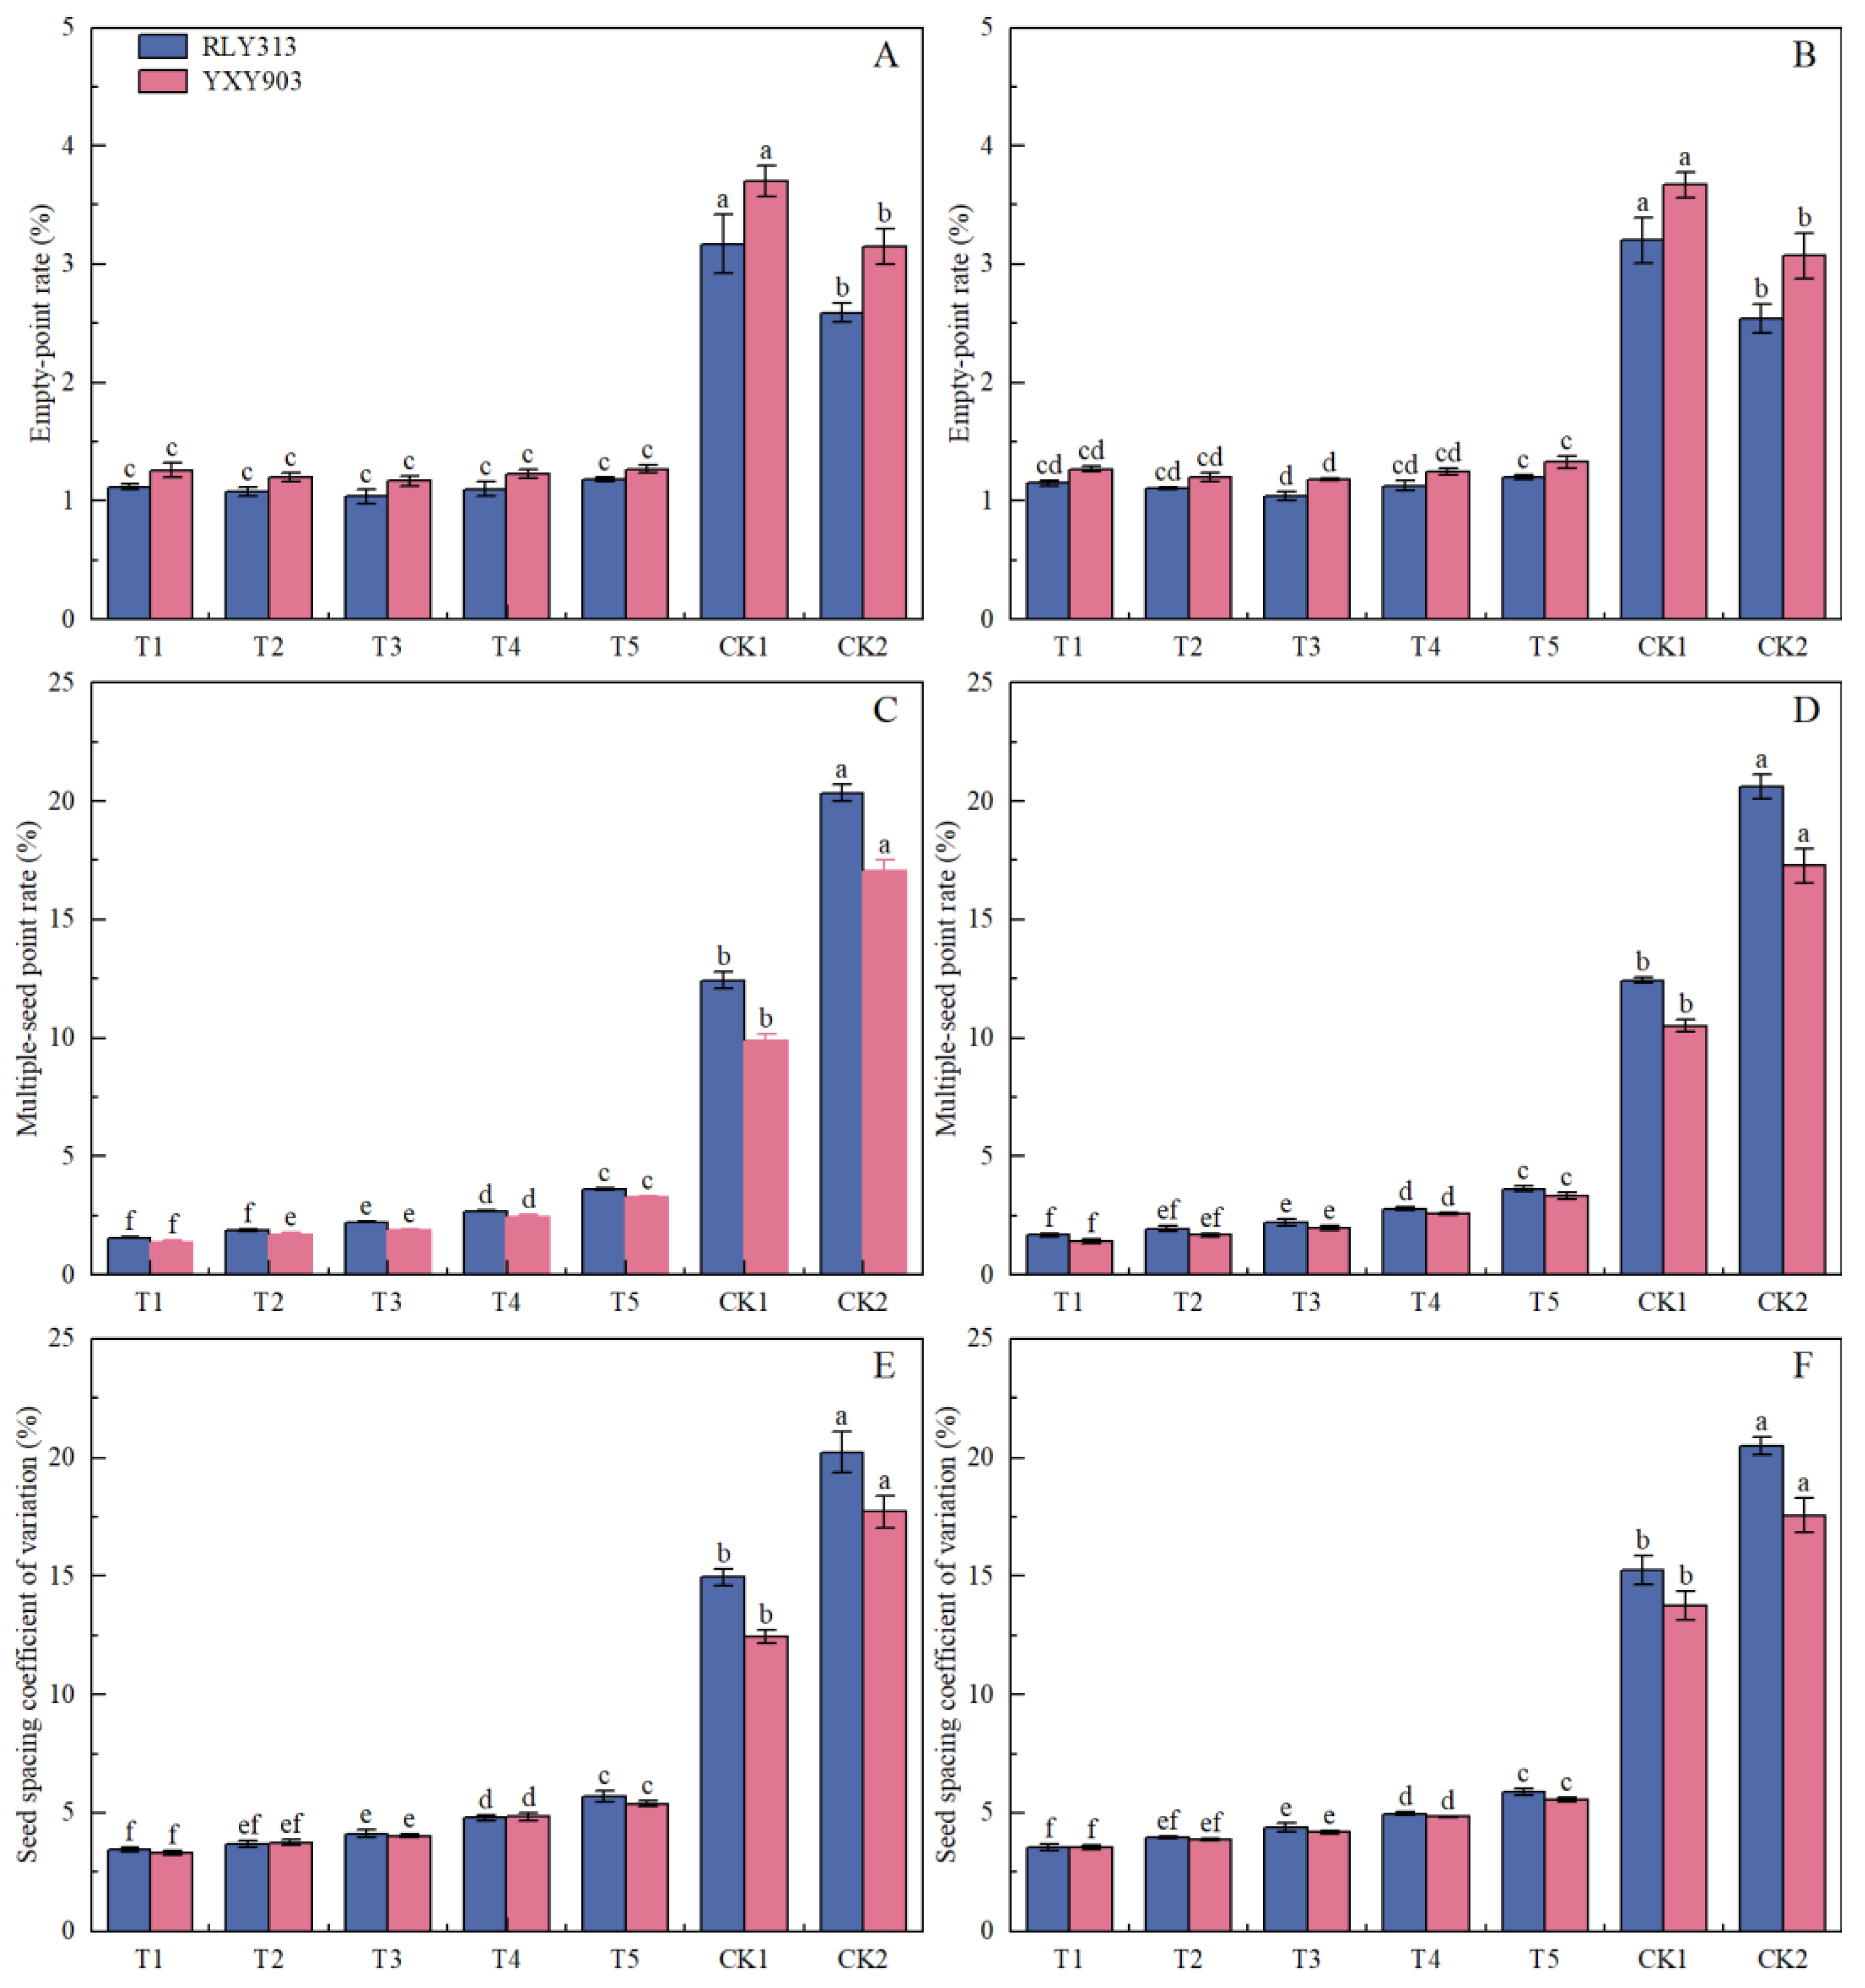
Printed seeding produced a more orderly seed distribution than conventional broadcasting (Figure 3). The difference was relatively small for EPR, but it was much clearer for MSPR and SSCV, the two indices that most directly reflect local seed clustering and spacing irregularity. Under printed seeding, empty points and multiple-seed points remained low and spacing variation was narrow in both years and both cultivars. The broadcasting controls showed the opposite pattern, with more local aggregation and greater spatial variation. The main distinction created by printed seeding was therefore not simply a change in seed input, but a reduction in uneven seed clustering within the tray. Because EPR and MSPR were calculated from physical printed points in the printed treatments but from density-standardised virtual cells in the broadcasting controls, these indices were interpreted together with SSCV rather than as strictly identical physical measurements across seeding systems.
Figure 3.
Effects of printed seeding density on seed distribution uniformity, including empty-point rate, multiple-seed point rate, and seed spacing coefficient of variation. Note: (A,C,E), 2024; (B,D,F), 2025. Bars represent means ± SD (n = 4). Different lowercase letters indicate significant differences among treatments within the same year and cultivar at p < 0.05.
3.3. Seedling Morphological, Root, and Physiological Quality
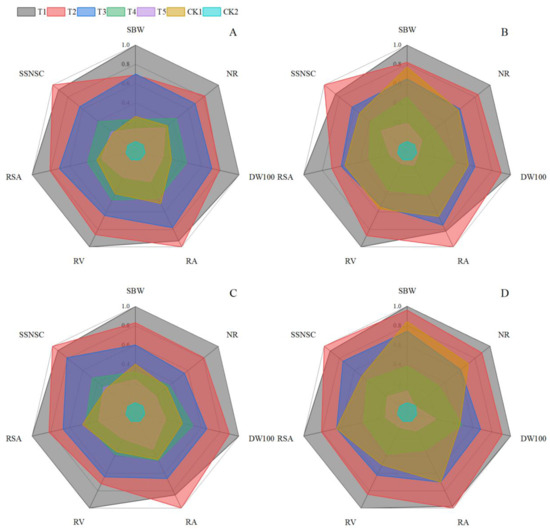
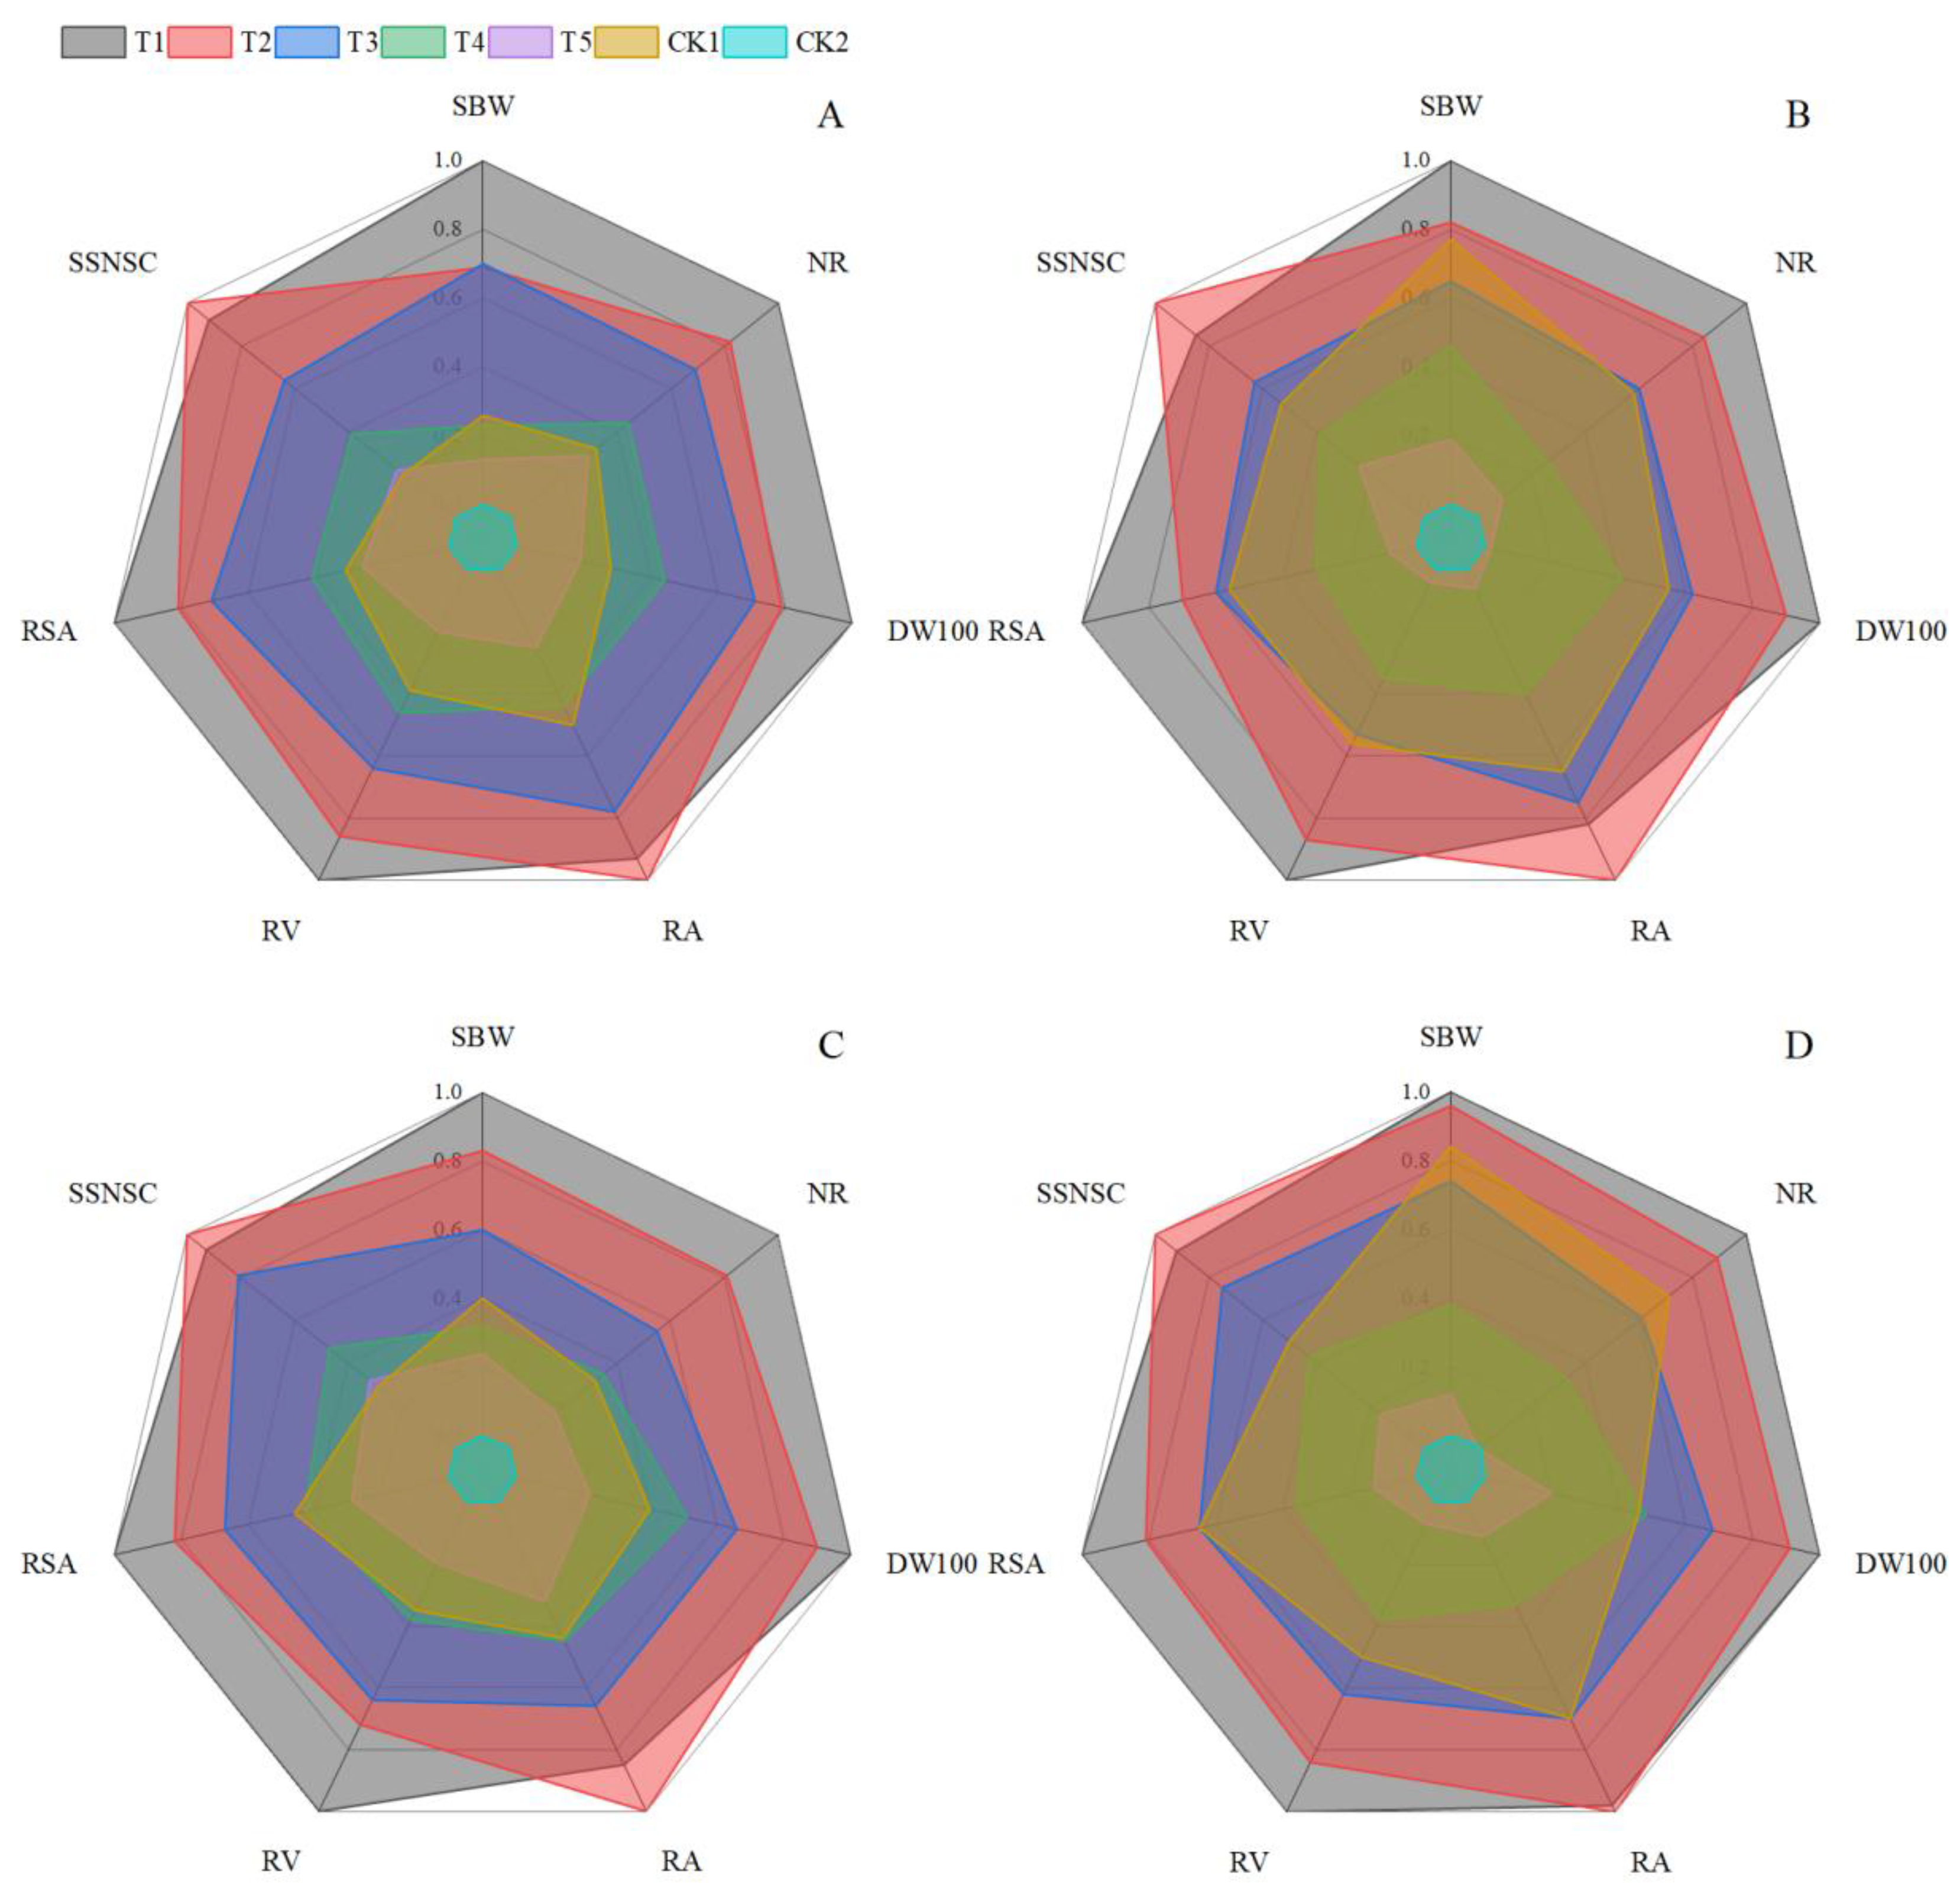
Seedling quality varied with seeding density (Figure 4). Low and moderate printed densities gave higher SBW, NR, DW100, RA, RV, RSA and SSNSC than over-dense or broadcast treatments. When density was too high, or when seeds were distributed by conventional broadcasting, individual seedling quality declined. Stronger competition in the nursery and less even seedling growth probably contributed to this decline.
Figure 4.
Integrated evaluation of seedling morphological, root, and physiological quality under different seeding density treatments. Note: (A,C), RLY313; (B,D), YXY903. SBW, stem base width; NR, number of roots; DW100, dry weight per 100 seedlings; RA, root activity; RV, root volume; RSA, root surface area; SSNSC, stem-sheath nonstructural carbohydrate content. Variables were scaled by min-max normalisation within each panel before radar plotting.
The treatment that produced the strongest individual seedlings was not necessarily the treatment that produced the highest yield. T1 and T2 favoured single-seedling growth, but they also provided a smaller population base after transplanting. T3 and T4 kept seedling quality within a favourable range while supporting better stand establishment. Yield, in this context, depended on balance rather than on seedling vigour alone.
3.4. Seedling Mat Mechanical Properties and Mechanical Transplanting Quality
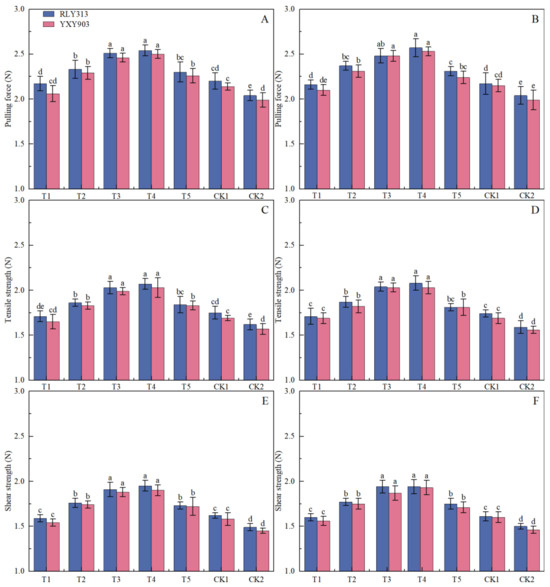
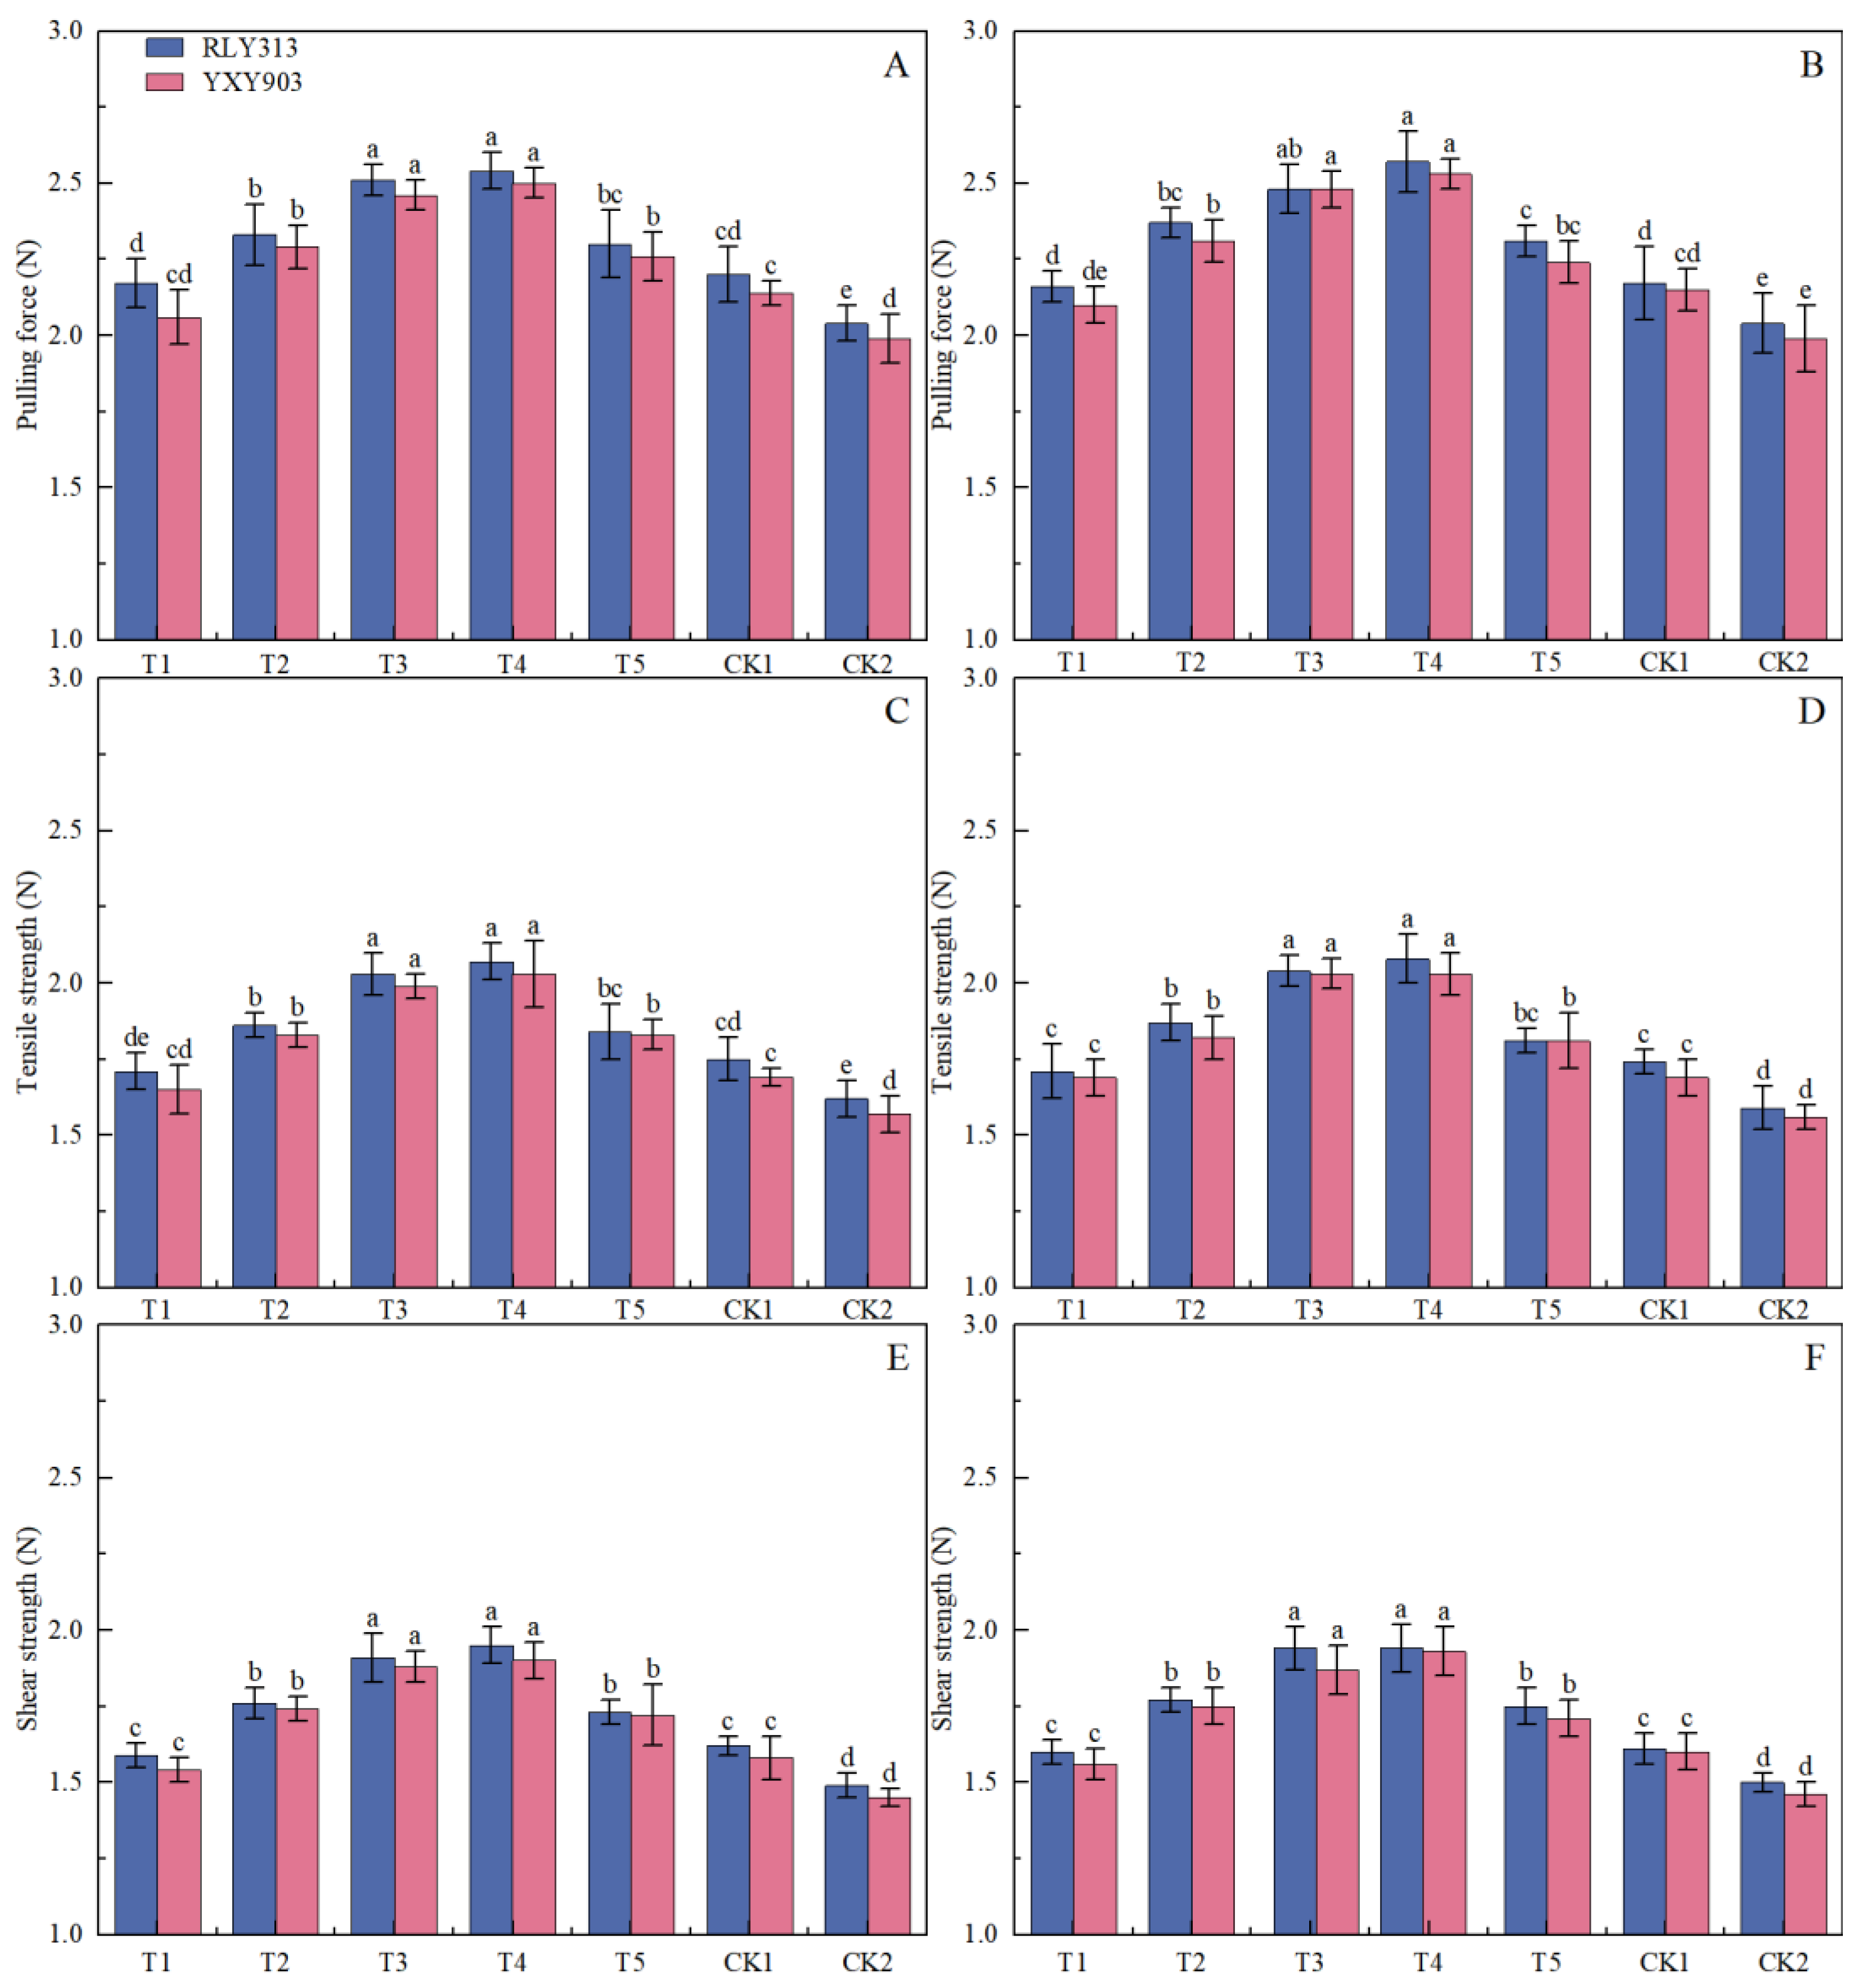
Seedling mat mechanical strength also showed a density-dependent response (Figure 5). PF, TF and SF increased from T1 to T3/T4 and then declined under T5 and CK2. Moderate printed seeding was associated with greater mat mechanical strength, probably because a more even root distribution improved mat cohesion. Sparse sowing limited mat formation even when individual seedlings were vigorous, whereas over-dense sowing and broadcasting were associated with weaker mat quality, likely through crowding and uneven seed distribution.
Figure 5.
Effects of printed seeding density on seedling mat mechanical properties, including pulling force, tensile force, and shear force. Note: (A,C,E), 2024; (B,D,F) 2025. Bars represent means ± SD (n = 4). Different lowercase letters indicate significant differences among treatments within the same year and cultivar at p < 0.05.
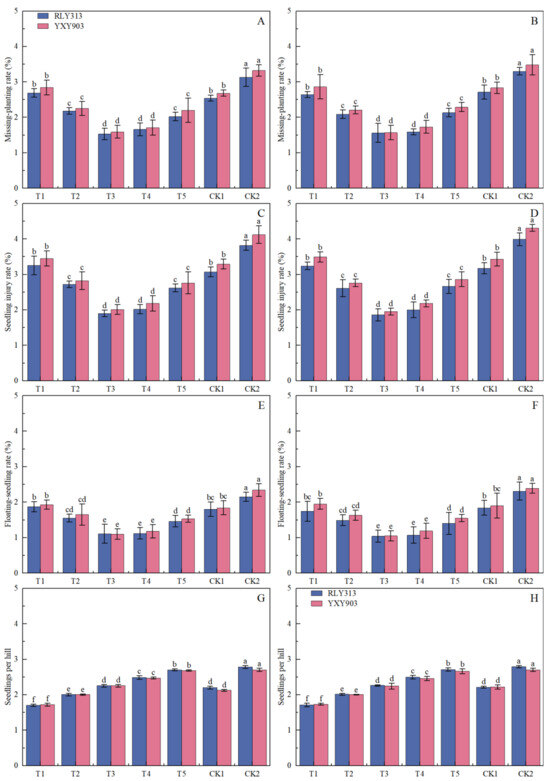
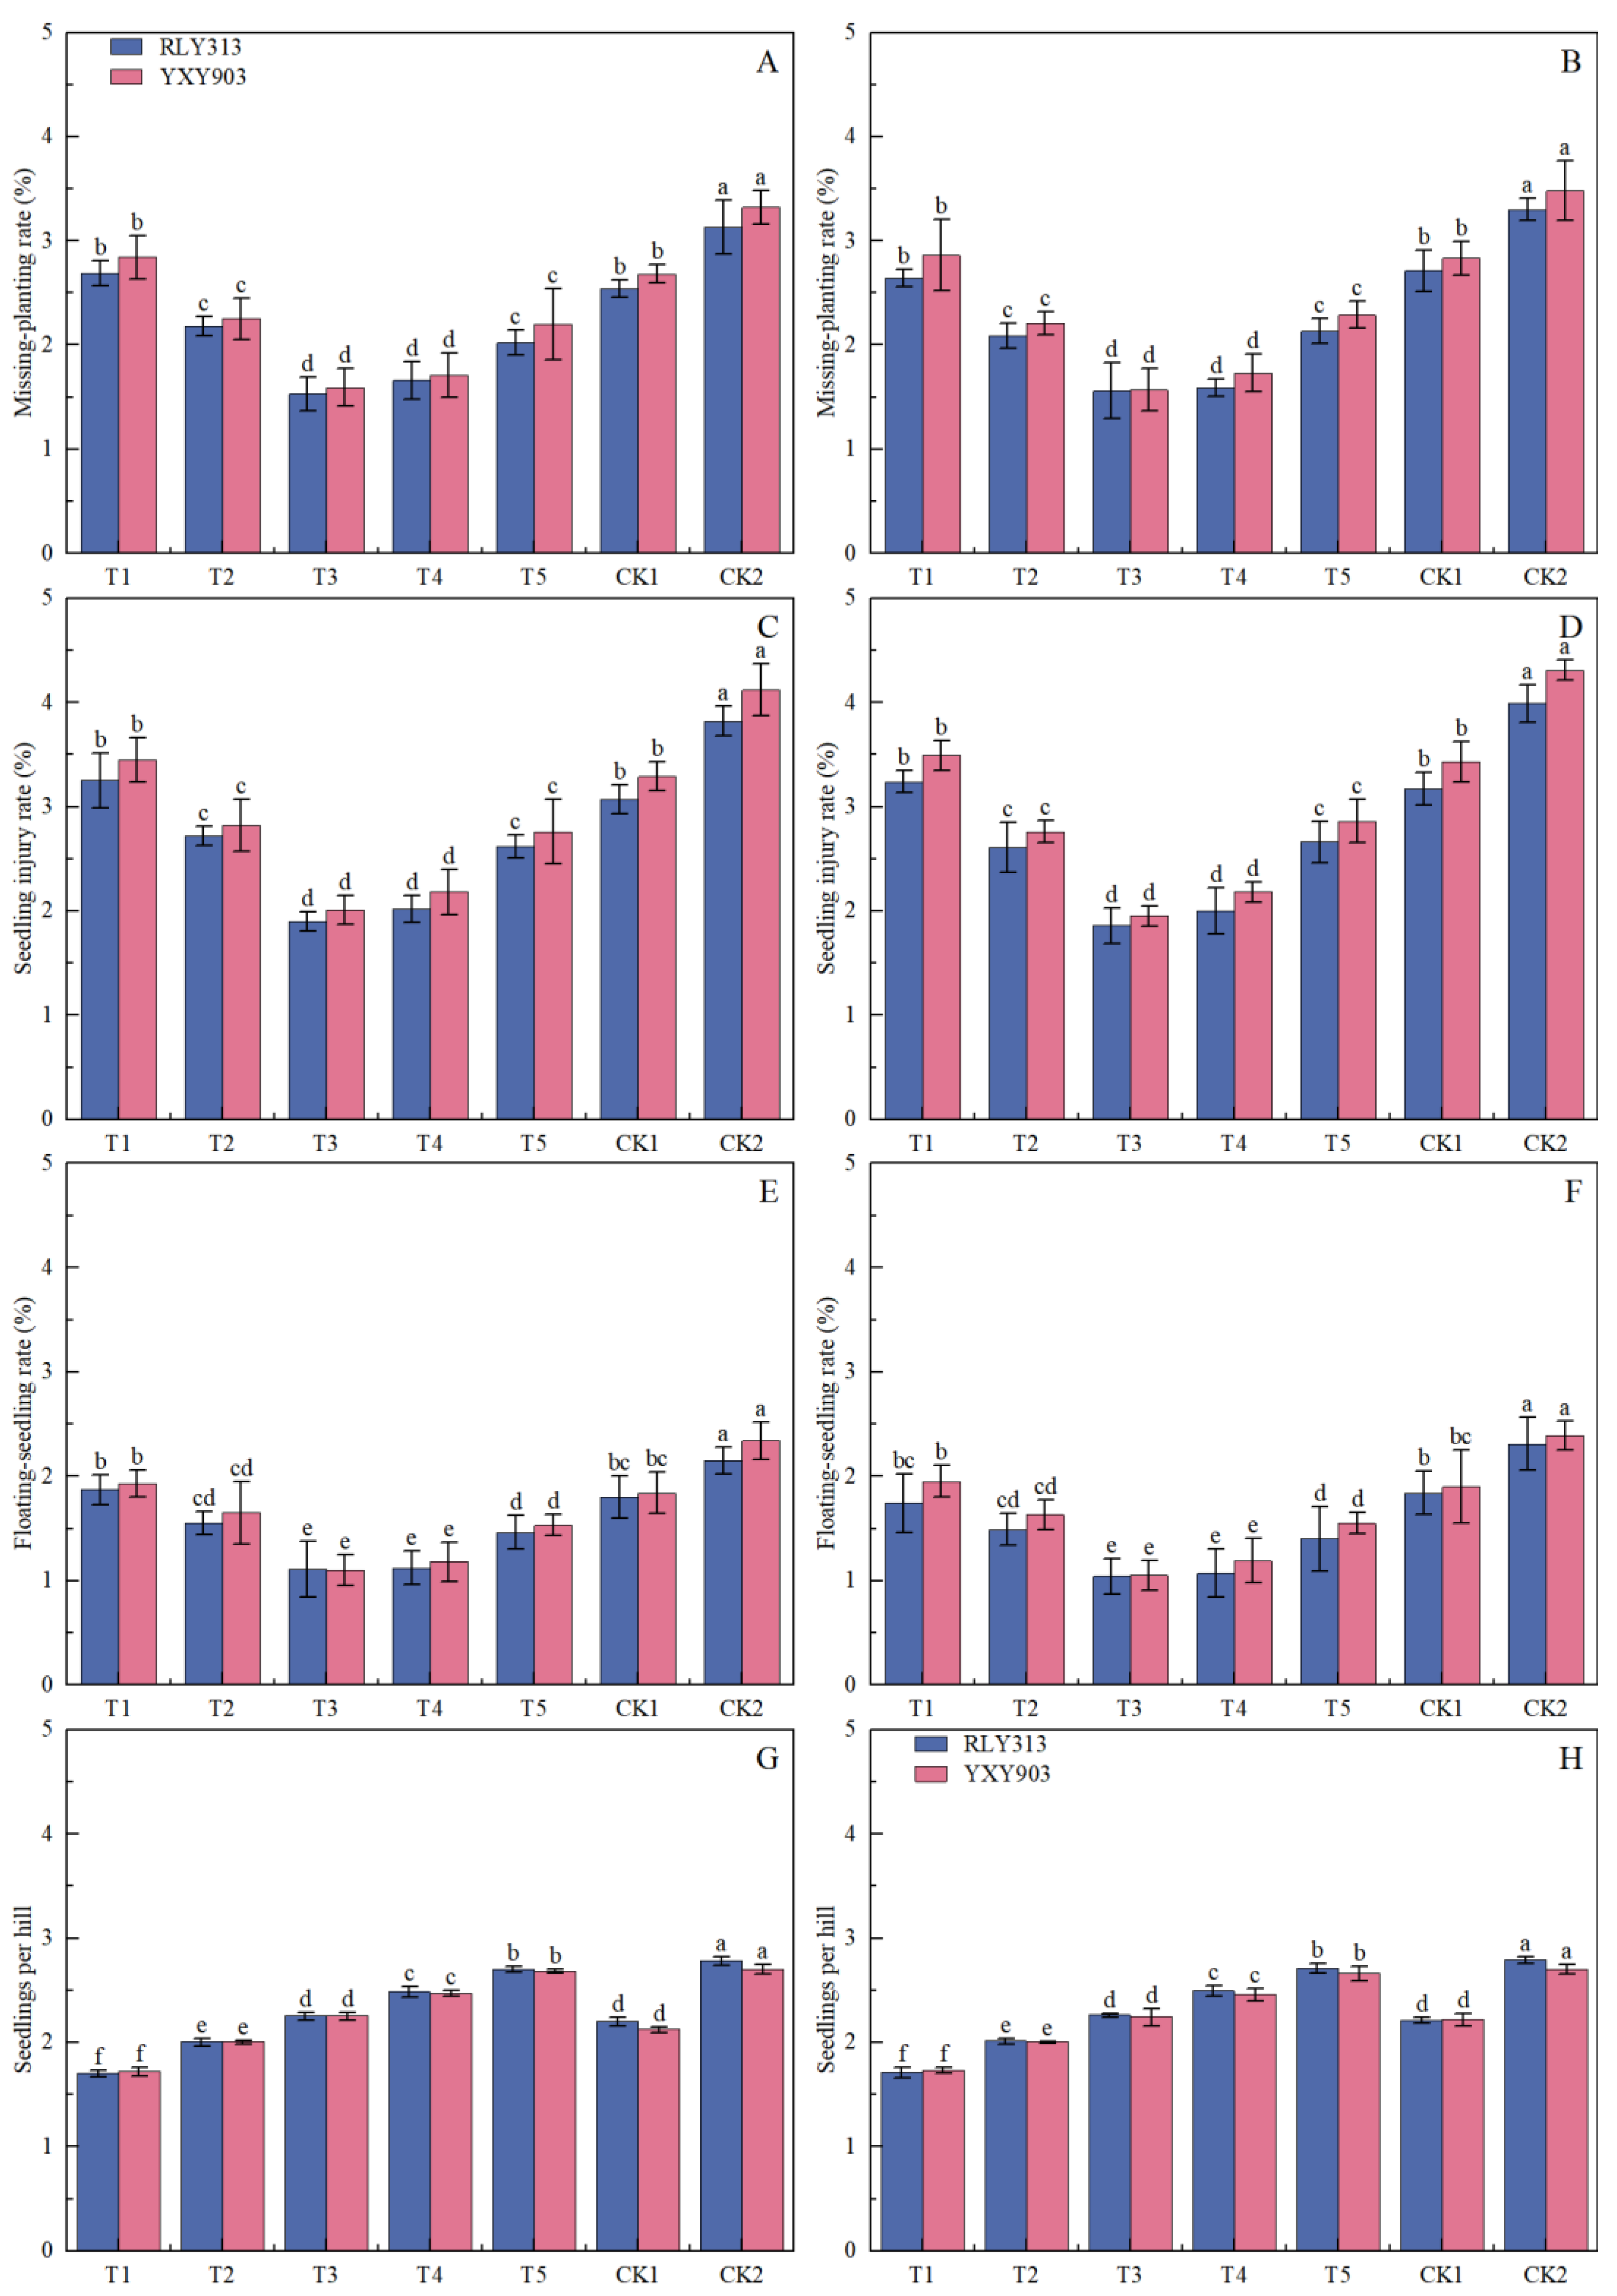
Treatments with higher mat strength also showed lower transplanting defect rates (Figure 6). MPR, SIR and FSR were consistently lower under T3/T4 than under CK2, and SPH remained within a moderate range. From an agronomic standpoint, stronger and more uniform mats were associated with fewer transplanting defects and a more stable field stand.
Figure 6.
Effects of printed seeding density on mechanical transplanting quality, including missing-planting rate, seedling injury rate, floating-seedling rate, and seedlings per hill. Note: (A,C,E,G) 2024; (B,D,F,H) 2025. Bars represent means ± SD (n = 4). Different lowercase letters indicate significant differences among treatments within the same year and cultivar at p < 0.05.
3.5. Tiller Dynamics, Panicle Formation, and Productive Tiller Percentage
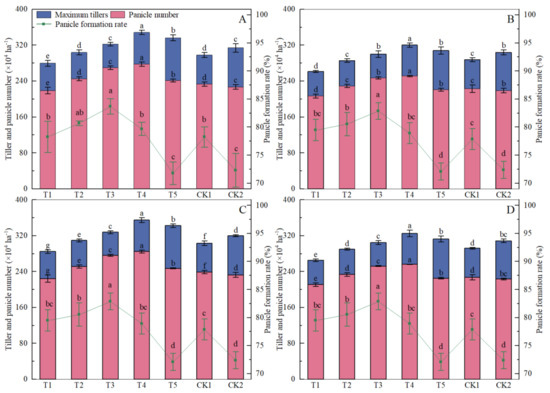
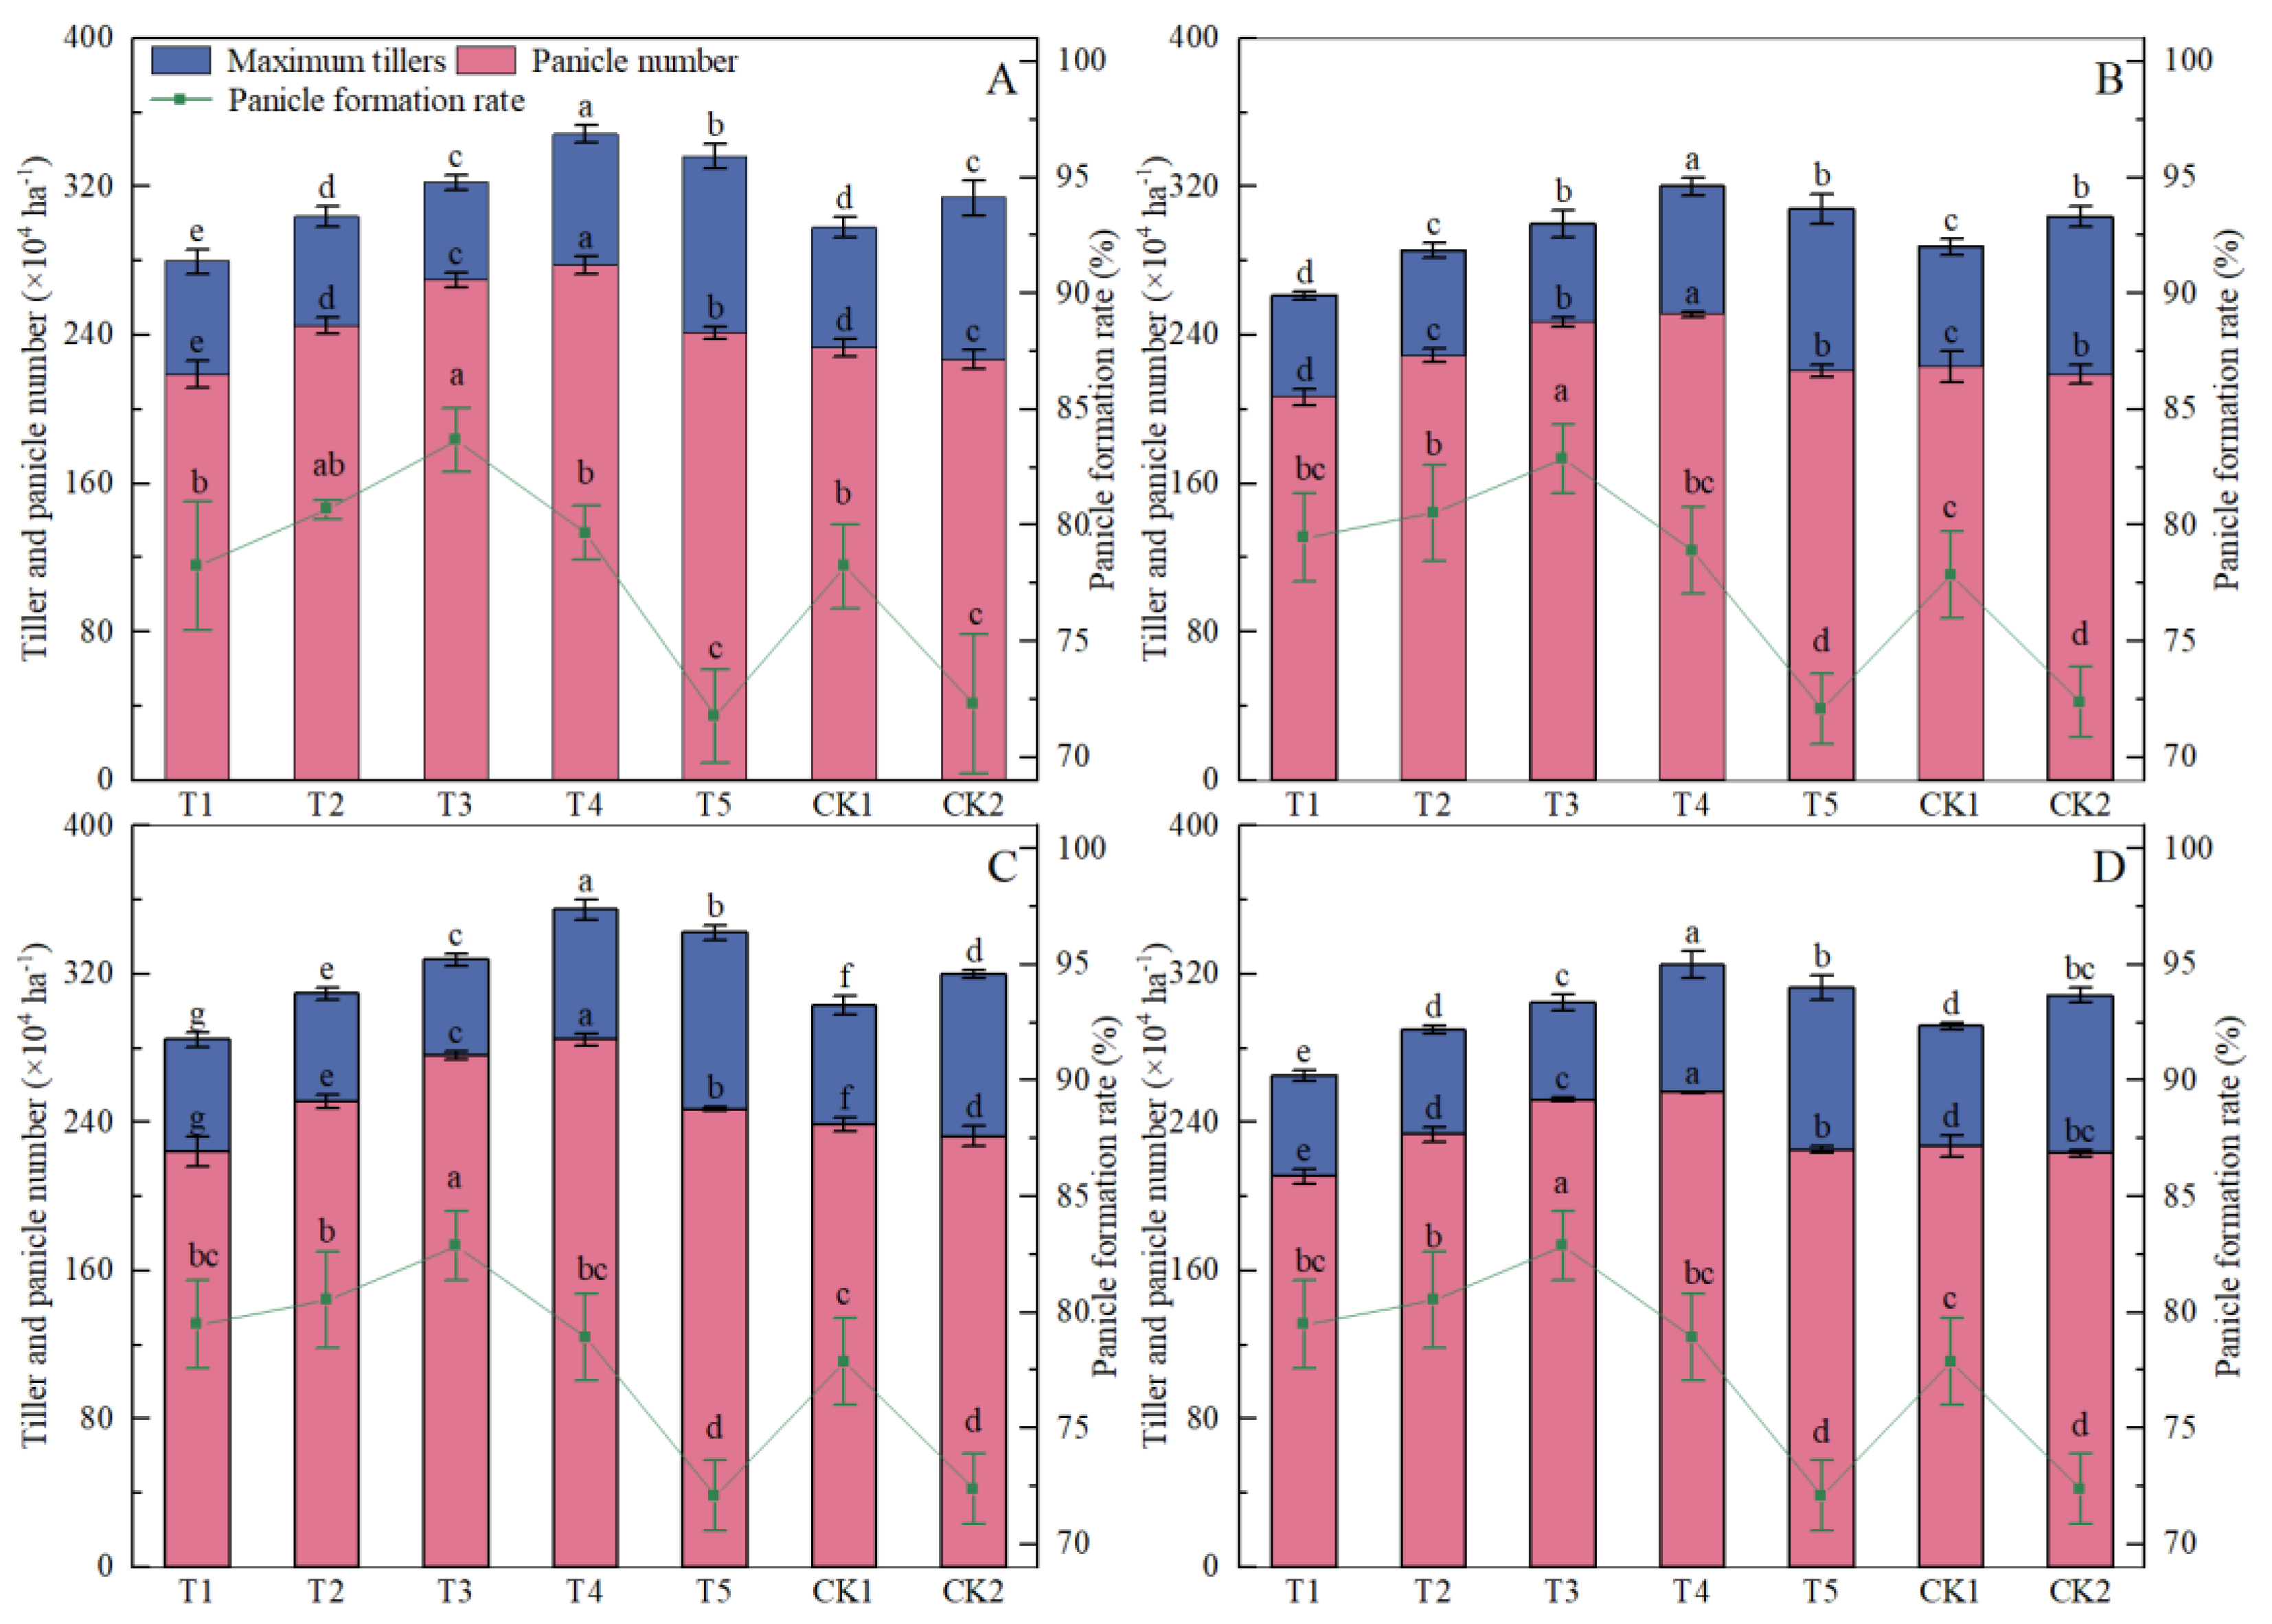
Printed seeding density altered population development after transplanting (Figure 7). MTN increased with density and was usually highest under T4 or T5. A high MTN, however, did not guarantee a high PTP. Across years and cultivars, T3 had the highest average PTP (83.31%), whereas T5 and CK2 declined to 71.94% and 72.36%, respectively. Excessive density produced more tillers, but many of these tillers were not retained as productive panicles.
Figure 7.
Effects of printed seeding density on maximum tiller number, panicle number, and productive tiller percentage. Note: (A,C) 2024; (B,D) 2025. Bars and points represent means ± SD (n = 4). Different lowercase letters indicate significant differences among treatments within the same year and cultivar at p < 0.05.
Final panicle number was most favourable in the T3/T4 range. Across all environments, PN reached 261.10 ×10⁴ ha−1 under T3 and 267.26 ×10⁴ ha−1 under T4, higher than those observed under T1, T5, CK1 and CK2. This pattern suggests that T3/T4 provided a better balance between tiller production, tiller survival and final panicle formation, whereas T5 and CK2 created early population pressure that reduced productive tiller efficiency.
3.6. Canopy Structure and Light Distribution
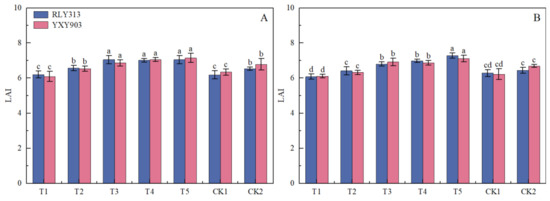
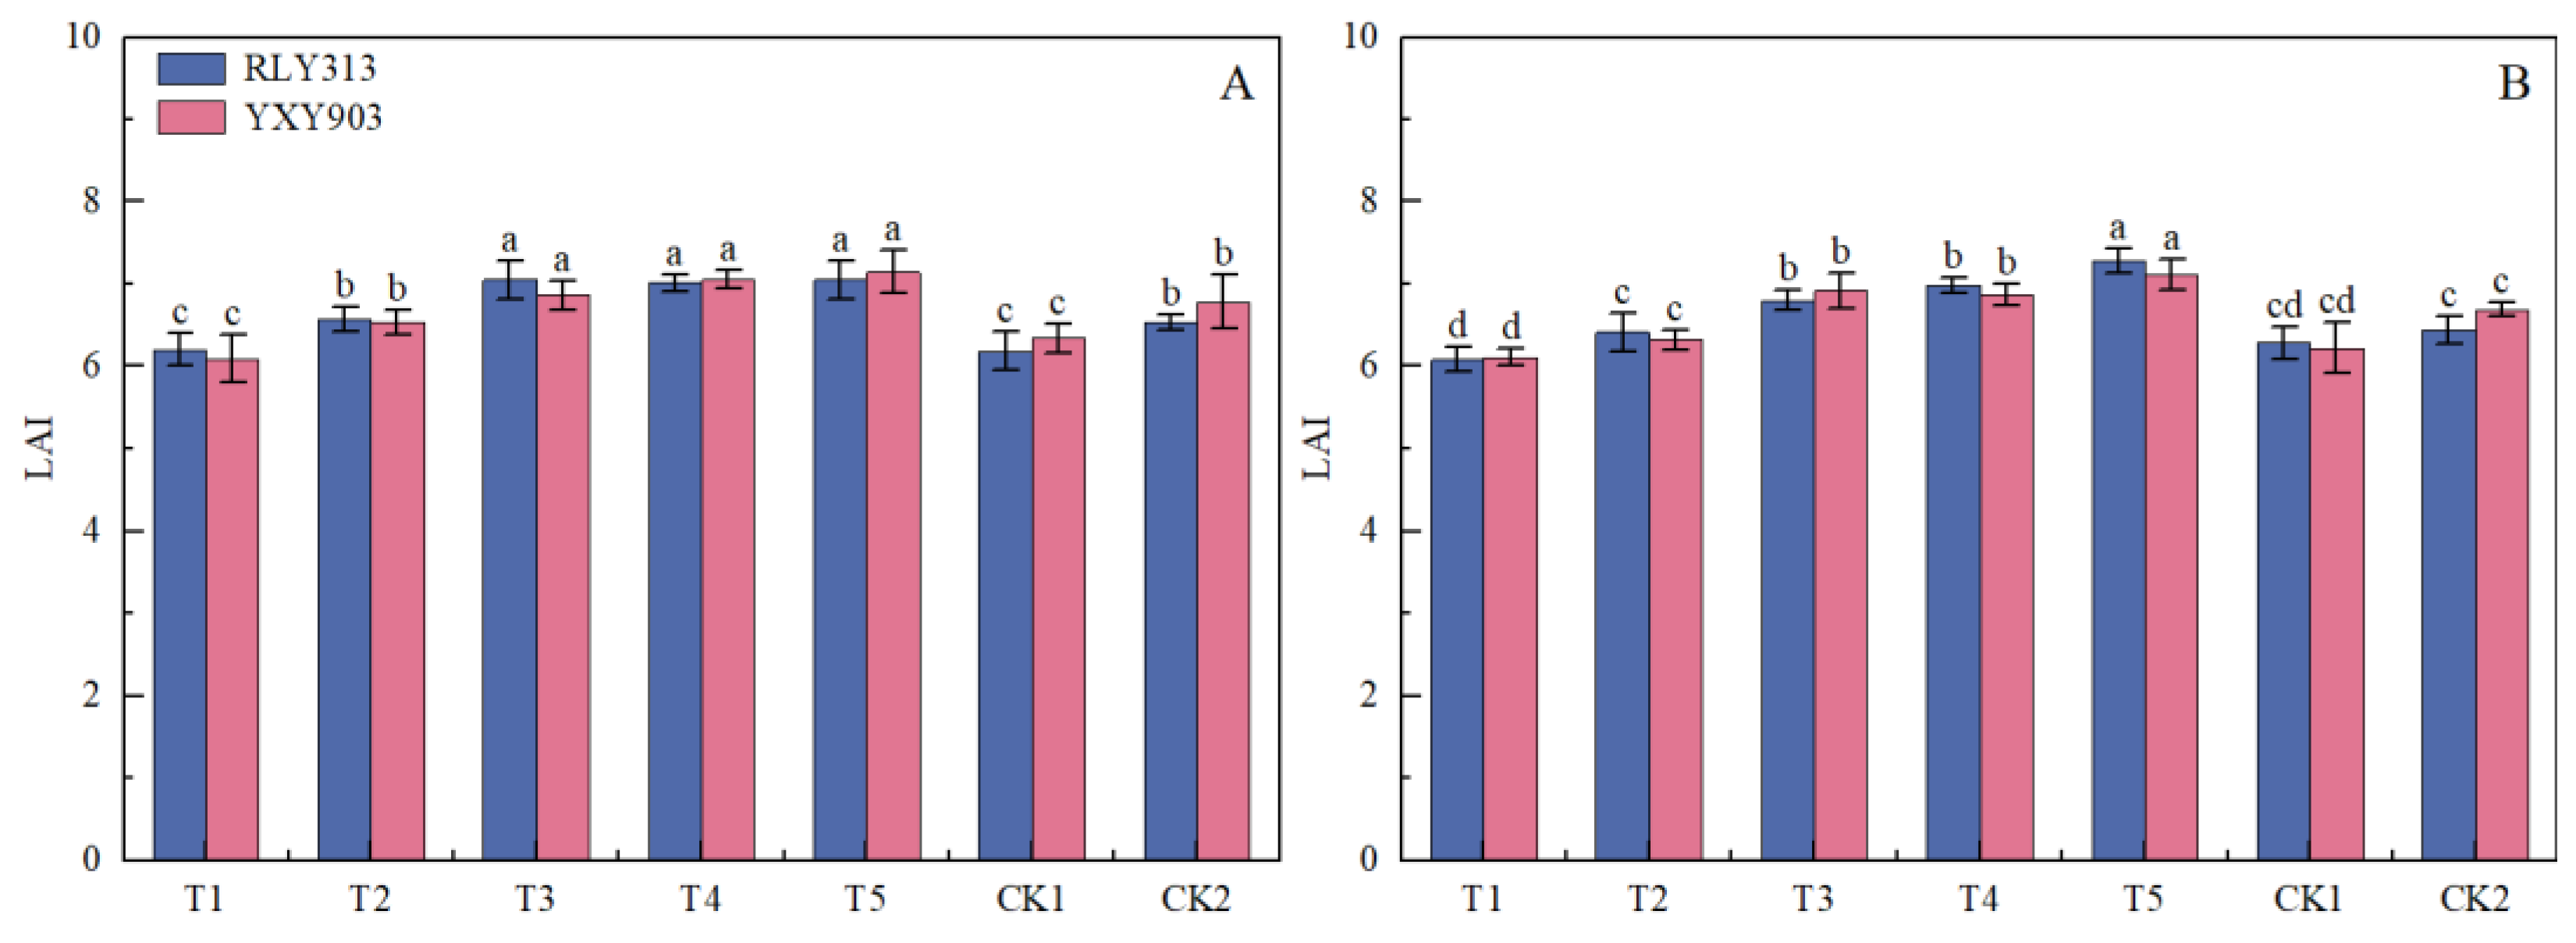
LAI increased with seeding density and was generally higher under T3-T5 than under T1 and CK1 (Figure 8). The largest canopy was not, however, the highest-yielding canopy. Leaf area alone was therefore an incomplete indicator of yield formation.
Figure 8.
Effects of printed seeding density on leaf area index (LAI) of RLY313 and YXY903 in 2024 and 2025. Note: (A) 2024; (B) 2025. Bars and points represent means ± SD (n = 4). Different lowercase letters indicate significant differences among treatments within the same year and cultivar at p < 0.05.
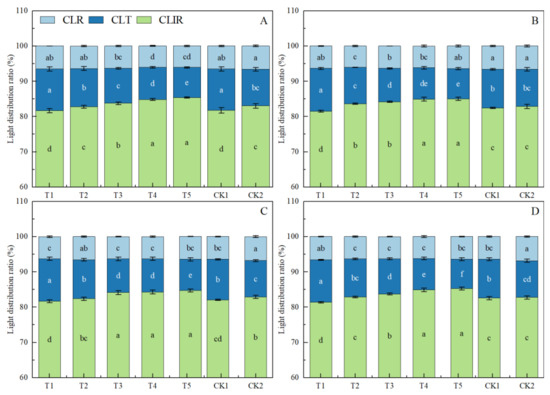
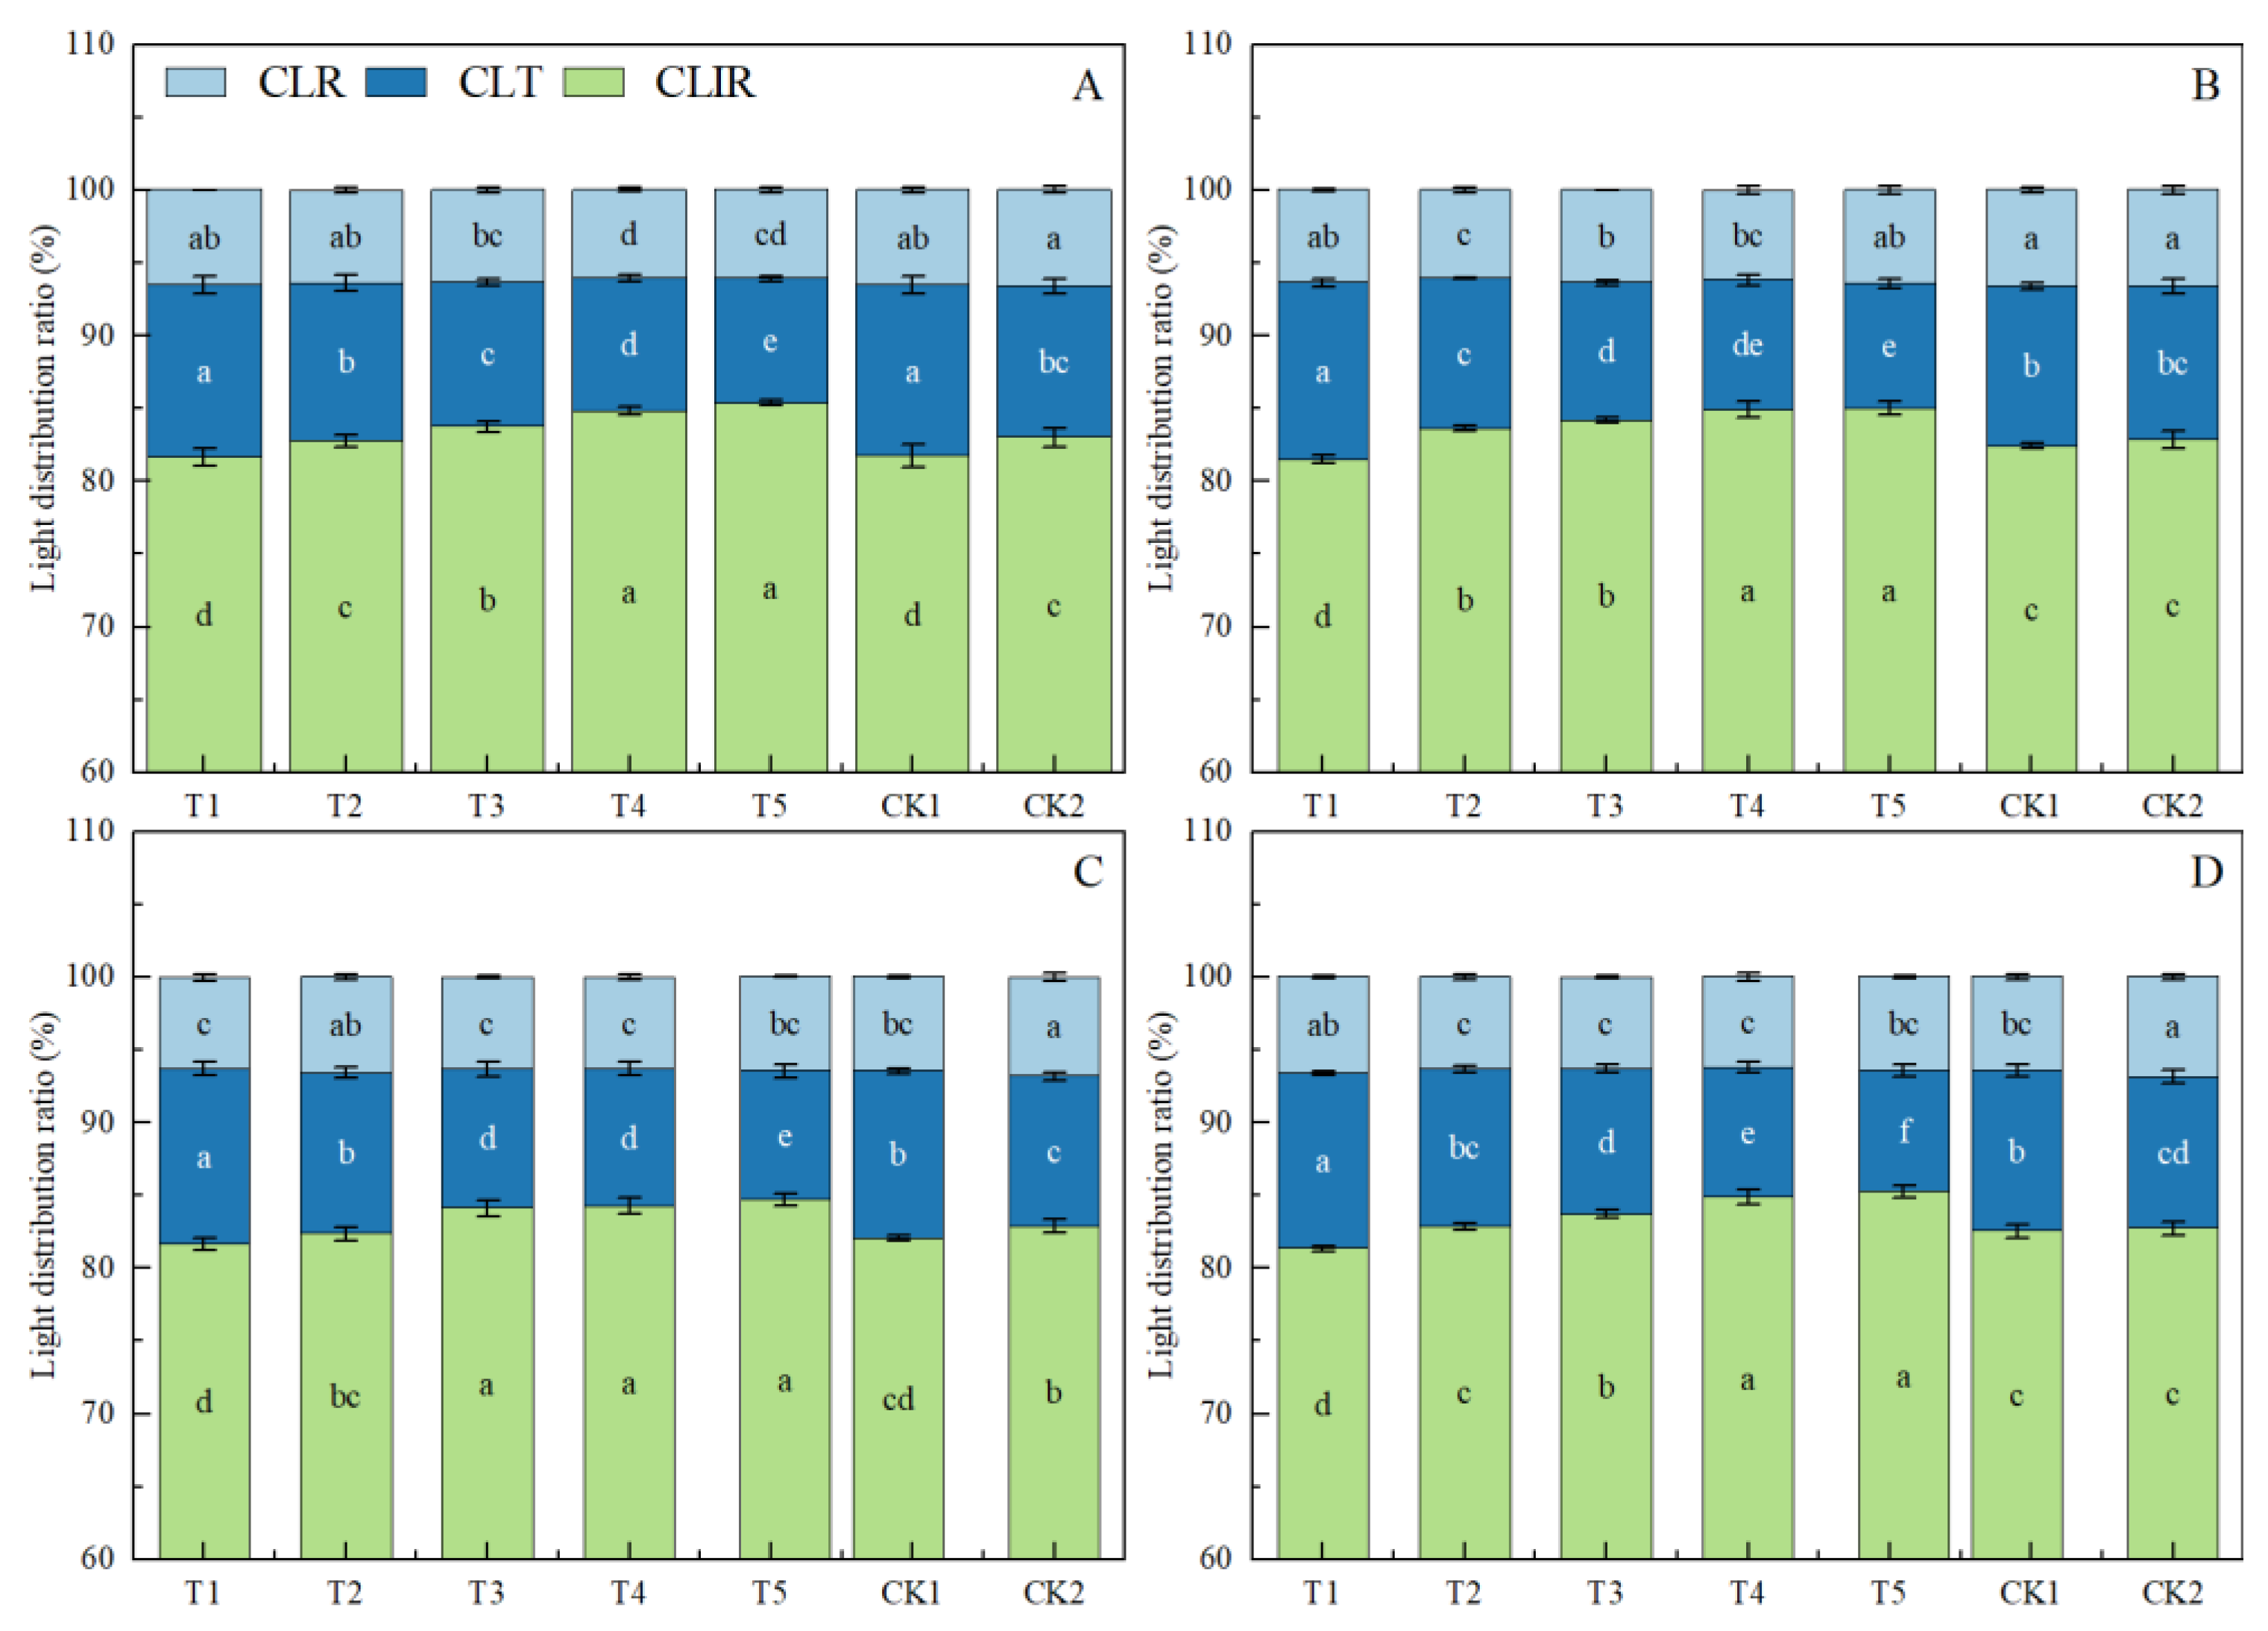
Light-distribution measurements were consistent with this interpretation (Figure 9). CLIR increased with seeding density, while light transmittance declined. Under T5, high light interception occurred together with lower PTP and weaker dry matter allocation efficiency than under T3/T4. A favourable canopy in this experiment was thus not simply the densest canopy, but one that combined adequate light capture with a productive internal structure.
Figure 9.
Effects of printed seeding density on canopy light distribution, including canopy light reflectance, canopy light transmittance, and canopy light interception rate. Note: (A,C) 2024; (B,D) 2025. CLIR, canopy light interception rate; CLT, canopy light transmittance; CLR, canopy light reflectance. CLIR was calculated as 100 − CLT − CLR. Stacked columns show the percentage distribution of incident light. Bars and points represent means ± SD (n = 4). Different lowercase letters indicate significant differences among treatments within the same year and cultivar at p < 0.05.
3.7. Post-Anthesis Dry Matter Accumulation and Harvest Index
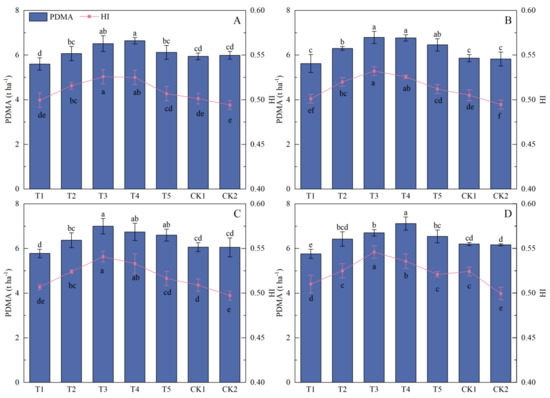
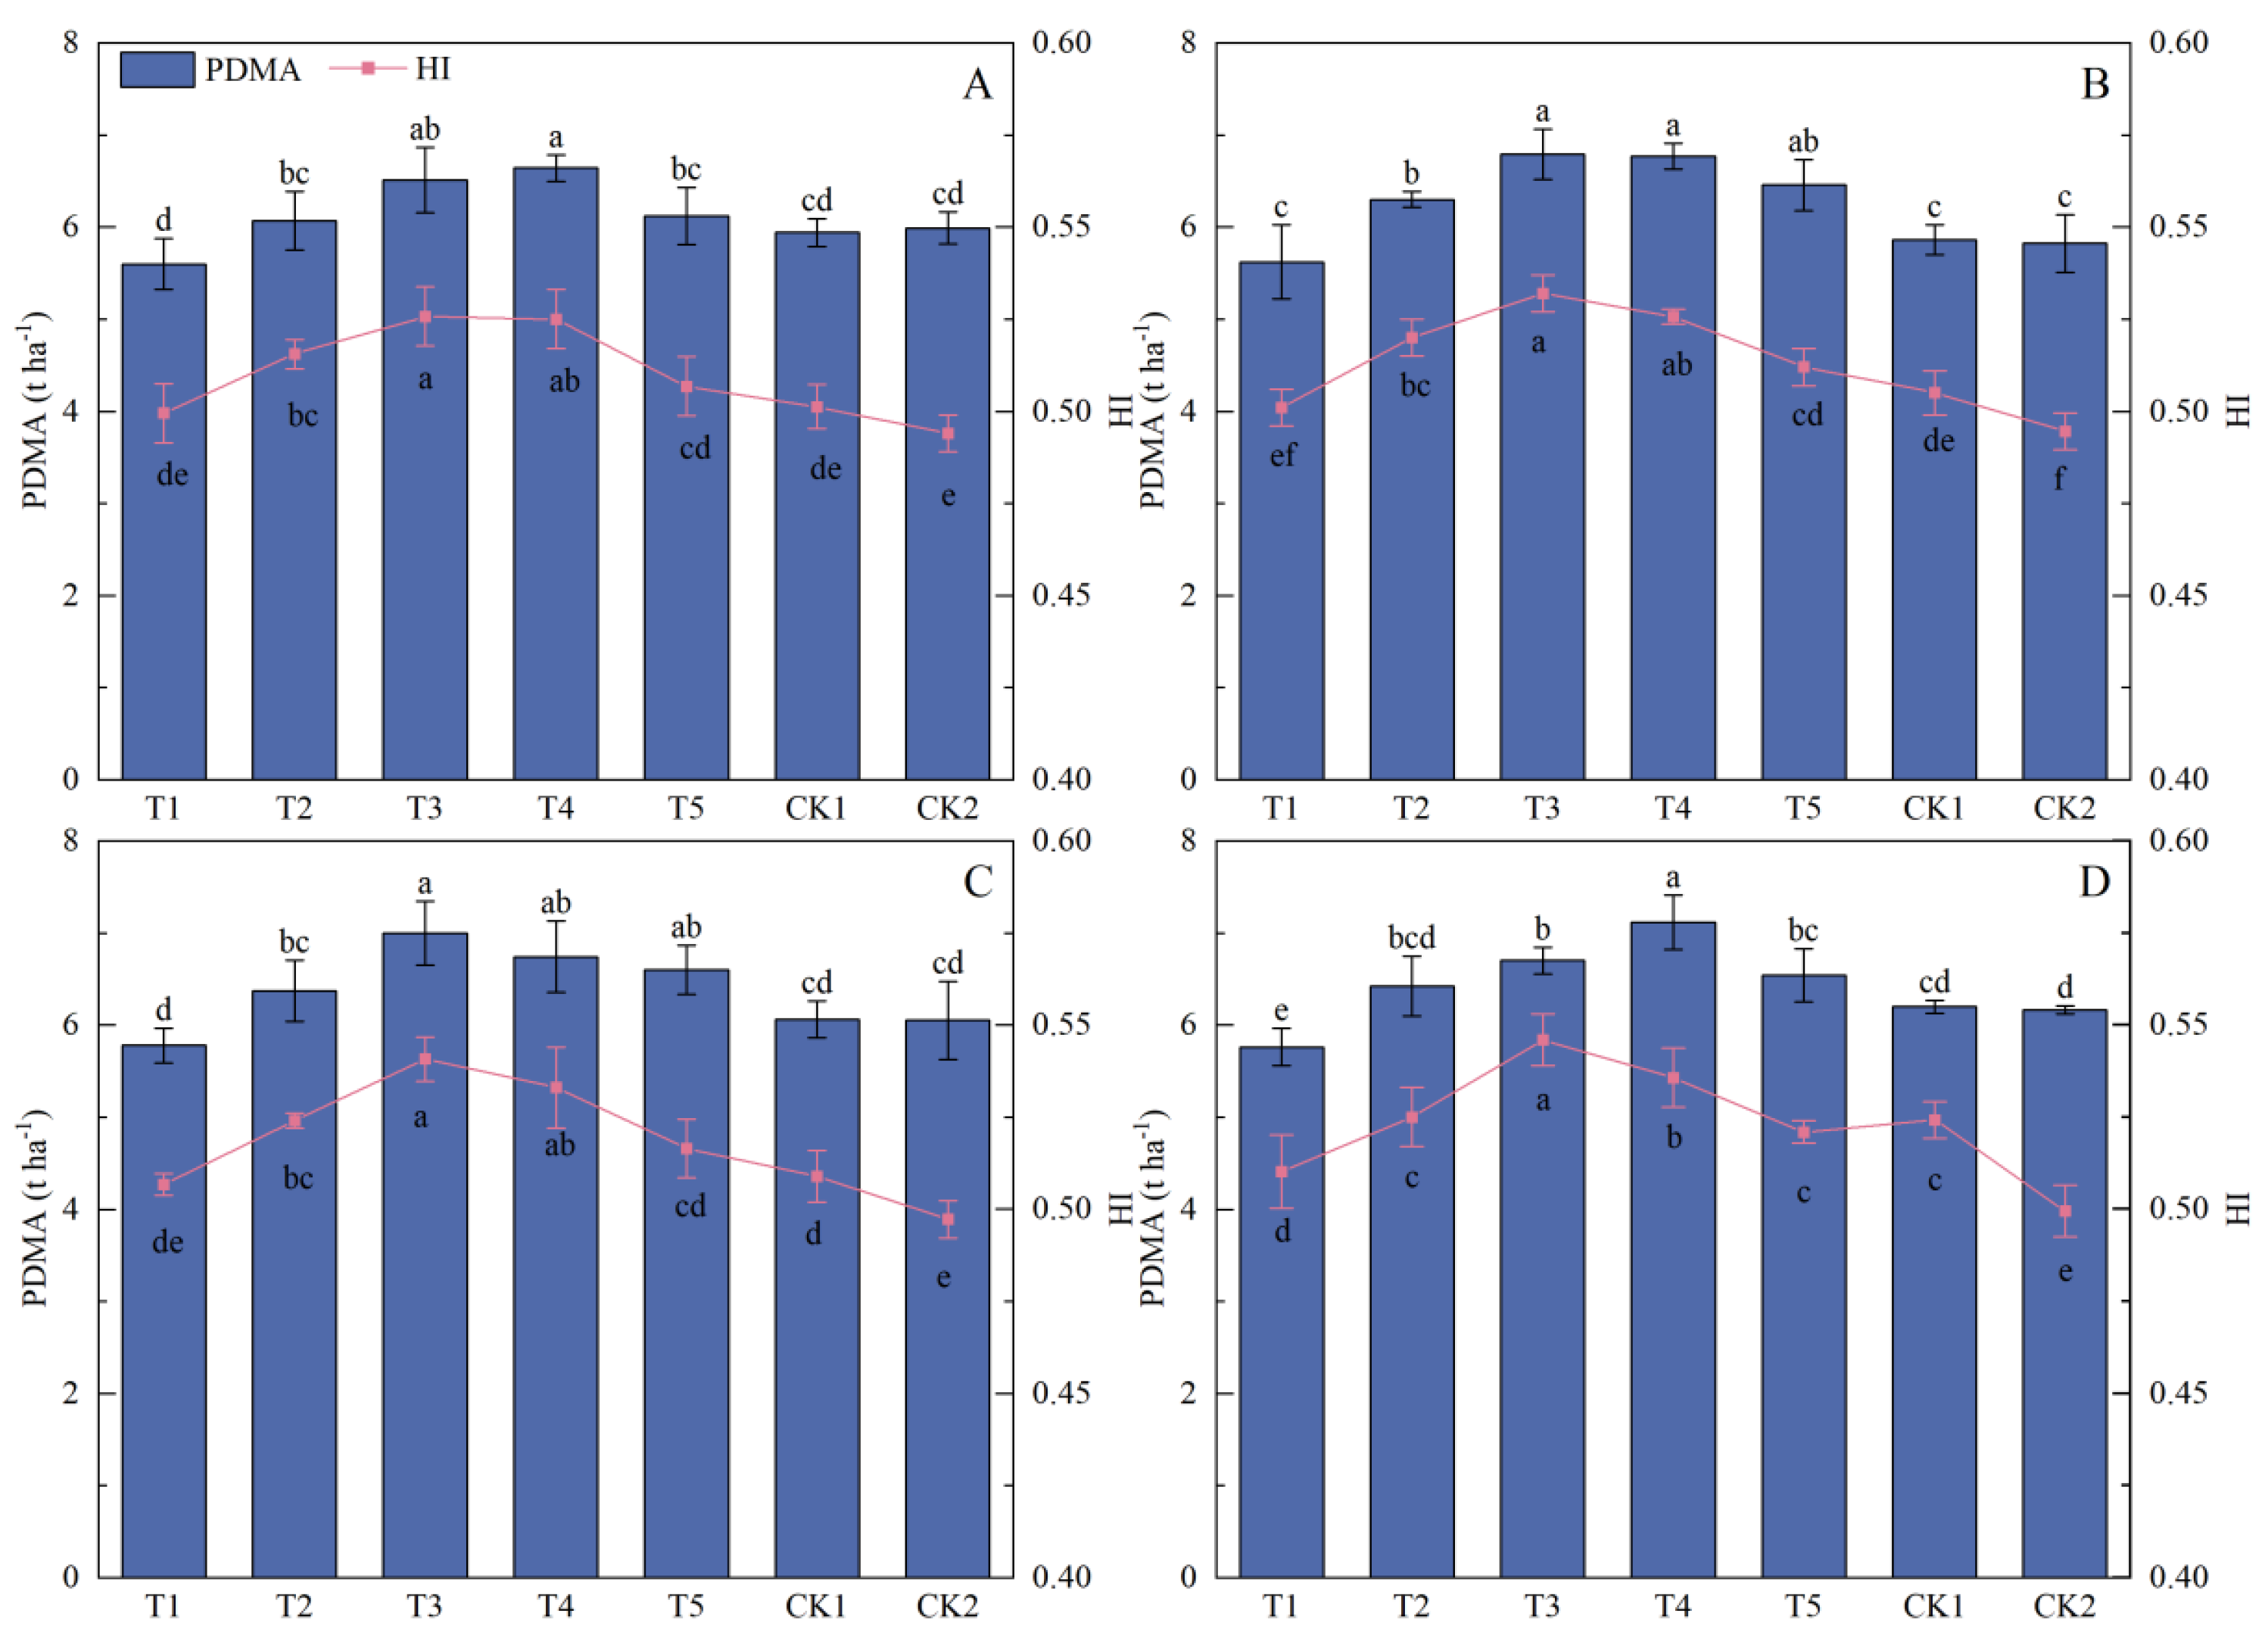
PDMA and HI followed an optimum-density response similar to that of yield (Figure 10). Both indices increased from T1 to T3/T4 and declined under T5 and the broadcasting controls. Moderate printed seeding was associated with greater biomass accumulation after heading and with more efficient allocation of biomass to grain.
Figure 10.
Effects of printed seeding density on post-anthesis dry matter accumulation and harvest index. Note: (A,C) 2024; (B,D) 2025. PDMA, post-anthesis dry matter accumulation; HI, harvest index. Bars and points represent means ± SD (n = 4). Different lowercase letters indicate significant differences among treatments within the same year and cultivar at p < 0.05.
The response under T5 illustrates the trade-off between canopy expansion and assimilate-use efficiency. Although T5 maintained relatively high LAI and CLIR, its lower PTP and HI indicate that excessive canopy development reduced the conversion of intercepted radiation and post-heading biomass into harvestable grain.
3.8. Correlation Analysis Among Key Traits and Grain Yield
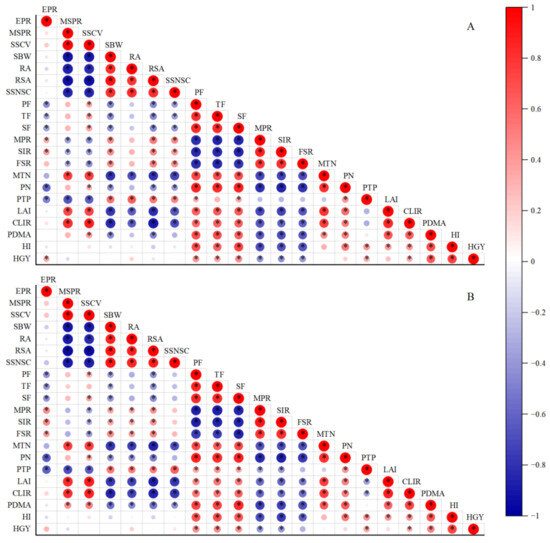
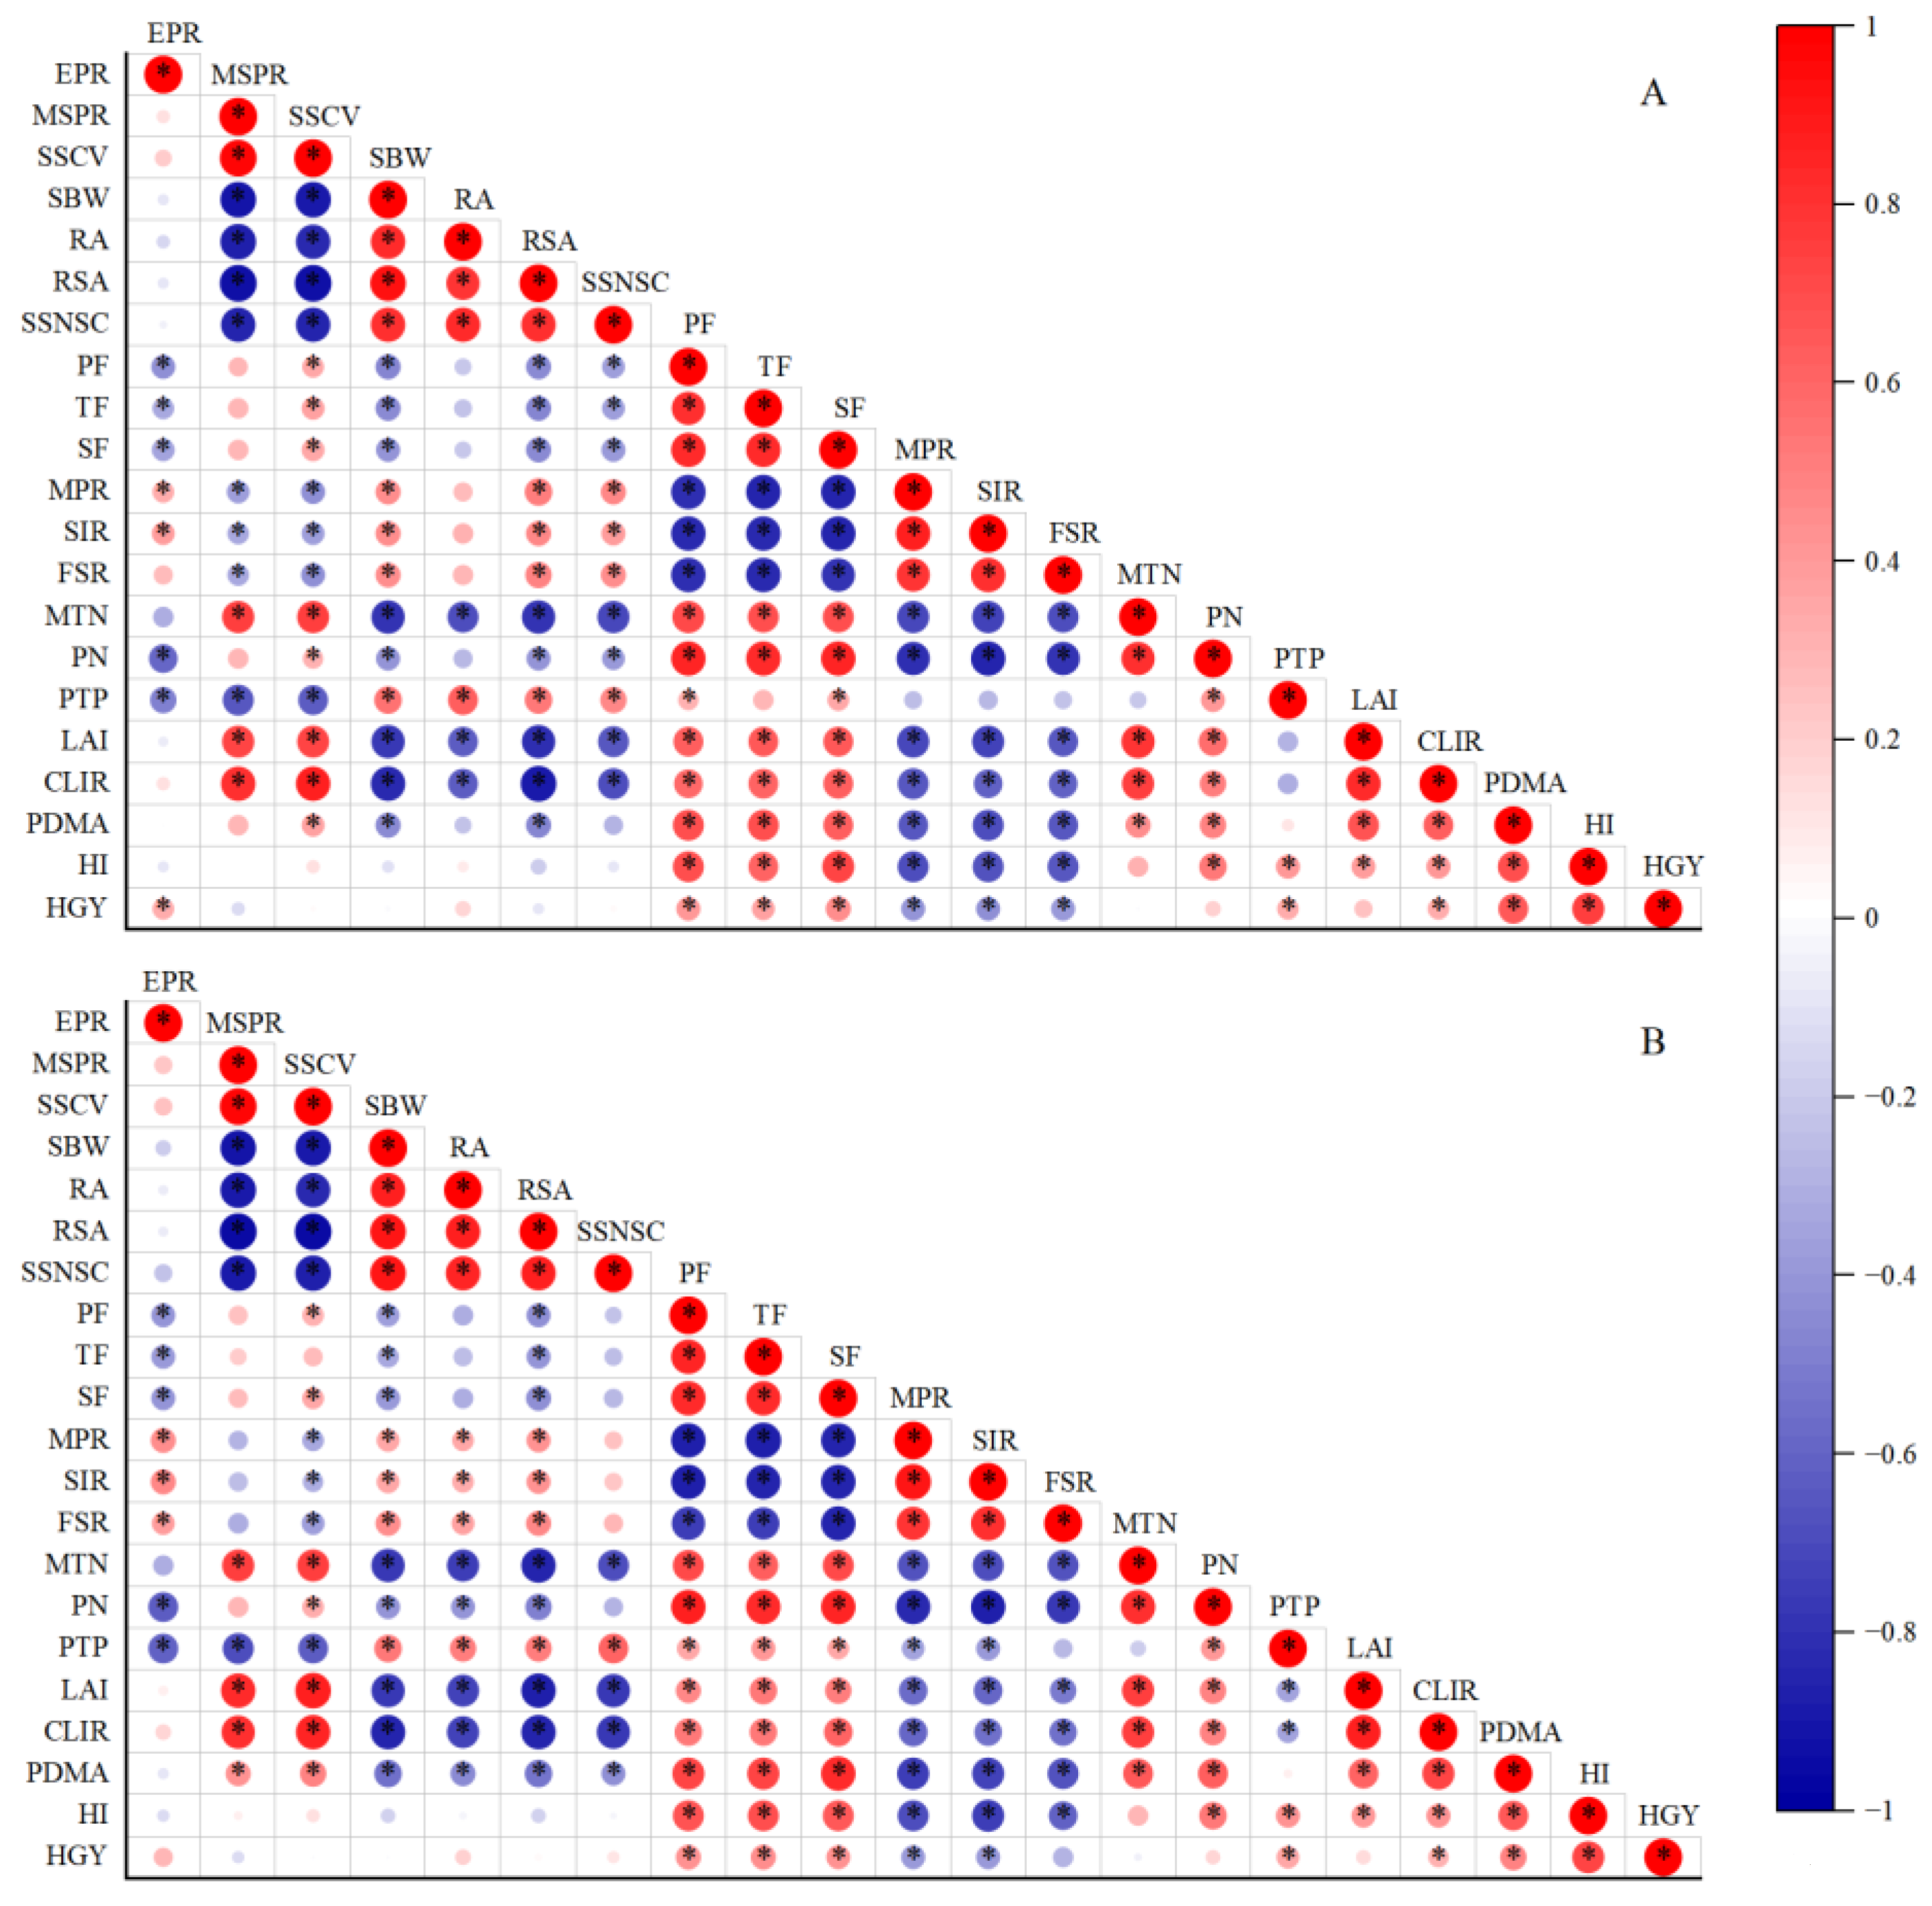
Cultivar-specific Pearson correlations were used to explore trait associations consistent with the proposed establishment-to-yield pathway (Figure 11). In RLY313, HGY was positively correlated with PN (r = 0.91), PTP (r = 0.69), PF (r = 0.86), TF (r = 0.81), SF (r = 0.86), PDMA (r = 0.68) and HI (r = 0.77), and negatively correlated with MPR (r = −0.81), SIR (r = −0.83) and FSR (r = −0.72). A similar pattern was found in YXY903: positive correlations with PN (r = 0.88), PTP (r = 0.68), PF (r = 0.83), TF (r = 0.78), SF (r = 0.82), PDMA (r = 0.62) and HI (r = 0.83), and negative correlations with MPR (r = −0.75), SIR (r = −0.78) and FSR (r = −0.76). Key correlations between HGY and selected traits are summarised in Supplementary Table S3 to keep the supplementary correlation reporting focused and interpretable.
Figure 11.
Exploratory Pearson correlation analysis among seed distribution uniformity, seedling quality, mechanical transplanting performance, canopy productivity, and grain yield in RLY313 and YXY903. Note: (A) RLY313; (B) YXY903. Pearson correlation analysis was performed separately for each cultivar to explore trait associations; the correlations should not be interpreted as direct causal evidence. * indicates significance at p < 0.05.
These associations indicate that higher yield was linked to a set of traits rather than to a single variable. Because the traits were measured along a common treatment gradient, the correlations should not be read as independent causal proof. They are still useful for identifying the trait network that accompanied higher yield: more uniform seed distribution, stronger seedling mats, fewer transplanting defects, more productive panicle formation, greater post-anthesis dry matter accumulation and higher harvest index.
4. Discussion
Printed seeding affected yield through a trade-off between individual seedling vigour and whole-tray mat integrity. Low density reduced nursery competition and favoured individual seedlings, but sparse roots were less able to form a cohesive mat. Excessive density increased crowding and uneven root overlap, weakening seedling quality and mat strength. The favourable T3/T4 range therefore represented a balance between seedling growth and mechanical integrity rather than the maximum of either trait alone.
Seedling-mat strength is the mechanical link between nursery performance and field establishment. A more continuous root network can distribute pulling, tensile and shear forces more evenly across the mat, reducing breakage during pickup and delivery. This interpretation agrees with studies showing that mat quality and seedling condition influence transplanting defects [6,9,11], but it remains mechanistic inference because root entanglement was not directly imaged.
At the tray scale, this balance can be interpreted as a root-space and anchorage effect. More regular seed placement likely reduced local clusters of seedlings, allowing roots to spread more uniformly through the substrate. Such a root network would improve mat cohesion without forcing excessive competition among neighbouring seedlings. Conversely, sparse printed points may leave discontinuities in the root mat, whereas over-dense or broadcast sowing can create local root crowding and uneven mechanical resistance. This provides a plausible link between seed-distribution uniformity and transplanting reliability, although direct measurements of root entanglement and mat pickup dynamics are still needed.
After transplanting, the advantage of moderate printed density was reflected more in tiller survival than in tiller production alone. Dense stands may produce more early tillers, but stronger competition increases tiller mortality and reduces productive tiller percentage. Moderate density supported sufficient panicle number while avoiding excessive competition, consistent with rice-density studies showing that optimal yield depends on both population size and tiller retention [13,14].
The canopy and dry-matter responses followed the same balance. High LAI improves radiation capture, but excessive canopy closure can reduce light distribution within the canopy and aggravate shade-avoidance responses [15,16,25]. Yield gains under T3/T4 were therefore associated not only with canopy size, but also with better conversion of intercepted radiation into post-anthesis dry matter and harvest index [17,18,26,27,28,29].
This source-sink interpretation helps explain why the treatment with the largest early population was not necessarily the highest-yielding treatment. A dense canopy can intercept more light early in the season, but excessive tiller density often increases mutual shading, respiratory demand and competition for assimilates. Under moderate printed density, a more stable stand likely maintained enough sink capacity through panicle formation while preserving post-heading assimilate supply for grain filling. The association between yield, post-anthesis dry matter accumulation and harvest index therefore suggests improved coordination between canopy function and grain sink activity rather than a simple density effect.
The main contribution of this study is to link stages that are often evaluated separately. Seed placement, seedling-mat formation, transplanting quality, tiller retention, canopy function, dry matter accumulation and yield were analysed within one experiment, allowing the optimum printed density to be interpreted as an establishment-to-yield balance. Because the evidence is based on treatment responses and correlations, this pathway should be interpreted as an associated agronomic sequence rather than proof of direct causality.
The two cultivars showed broadly similar optimum ranges, although their absolute yields and seed weights differed. This suggests that printed point density should be considered together with cultivar seed size and seedling growth habit. The weight-based controls also limit interpretation: CK1 and CK2 represented local broadcasting practices, not seed-number-matched treatments. Future studies should include both weight-matched and seed-number-matched controls to separate the effects of seed number, spatial pattern and nursery competition.
Commercial adoption should be evaluated from both biological and economic perspectives. Yield gains and seed savings may partly offset the costs of printed-seeding equipment, nursery paper, adhesive and machine operation, especially because hybrid rice seed is relatively expensive. However, these benefits will depend on access to printed-seeding machines and on whether nursery operators can maintain uniform adhesive application, paper handling and tray filling. In smallholder systems, service-based nurseries or cooperative machinery sharing may be more realistic than individual ownership. The economic value of printed seeding may also interact with fertiliser-saving or nitrogen-use-efficiency strategies reported in related studies [30,31]. Therefore, cost–benefit analysis under commercial nursery and field conditions should be included in future on-farm evaluations.
Regional transferability also requires caution. Xuzhou is a warm-temperate, semi-humid wheat-rice rotation region, and other rice ecologies may shift the optimum density because nursery temperature, rainfall, nursery duration and cultivar characteristics can affect emergence, adhesive or paper performance, disease pressure and mat strength.
Several limitations remain. The experiment was conducted at one site over two years with two hybrid indica cultivars, and it did not directly measure root entanglement, pickup dynamics, adhesive degradation or economic return. Wider multi-location and on-farm validation, together with cost–benefit analysis, is needed before broad extension. In addition, Pearson correlations should be viewed as exploratory because a shared treatment gradient may generate associations among traits without proving direct physiological causation. Image-based detection of seedling planting conditions could further support field-scale validation of transplanting performance [32].
5. Conclusions
Moderate printed seeding density improved yield formation in machine-transplanted hybrid indica rice by balancing seed distribution uniformity, seedling-mat strength, transplanting quality, productive tiller formation, post-anthesis dry matter accumulation and harvest index. Across two years and two cultivars, T3/T4 performed best, whereas low density limited population formation and excessive density intensified nursery and field competition. Because the broadcasting controls were weight-based local practices rather than seed-number-matched treatments, the results should be interpreted as a comparison of practical establishment systems. Further multi-location, multi-year and cultivar-specific validation, including seed-number-matched controls and cost–benefit analysis, is needed before wider extension.
Supplementary Materials
The following supporting information can be downloaded at: https://www.mdpi.com/article/10.3390/agronomy16141308/s1. Table S1. Global fixed-effect tests and model-level variance explained for the main traits from the mixed-model structure. Table S2. Compact key-trait treatment means used to support the main figures. Table S3. Pearson correlations between harvested grain yield and key establishment, seedling, mechanical, population, canopy, and dry-matter traits. Table S4. Validation and repeatability of the ImageJ/Fiji seed-counting workflow.
Author Contributions
Conceptualization, X.S., J.Z. and G.D.; methodology, X.S., T.W. and J.Z.; software, X.S. and T.W.; validation, X.S., T.W., J.Z. and G.D.; formal analysis, X.S. and T.W.; investigation, X.S., T.W., R.Z., K.L., F.G., L.Z., X.Z., X.H., C.C., E.M. and J.W.; resources, J.Z. and G.D.; data curation, X.S. and T.W.; writing—original draft preparation, X.S.; writing—review and editing, T.W., J.Z. and G.D.; visualisation, X.S. and T.W.; supervision, J.Z. and G.D.; project administration, J.Z. and G.D.; funding acquisition, J.Z. and G.D. All authors have read and agreed to the published version of the manuscript.
Funding
This research was funded by the National Key Research and Development Program of China, grant number 2024YFD2300301-01; the Jiangsu Provincial Agricultural Major Technology Collaborative Extension Program, grant number 2023-ZYXT-03-2; the Xuzhou Science and Technology Program, grant number KC25120; the General Program of Basic Science (Natural Science) Research in Higher Education Institutions of Jiangsu Province, grant number 25KJD210007; the Changzhou Rice Industry Technology Integration and Innovation Center Project, grant number CAIC(2023)005; and the Natural Science Research Project of Xuzhou Vocational College of Bioengineering, grant number XSZR202609.
Institutional Review Board Statement
Not applicable.
Informed Consent Statement
Not applicable.
Data Availability Statement
The plot-level data and R scripts used for the mixed-model analyses are available from the corresponding authors upon reasonable request. Representative tray images, ImageJ processing settings and raw mechanical-test records are also available from the corresponding authors upon reasonable request.
Acknowledgments
The authors thank Xuzhou Vocational College of Bioengineering and Yangzhou University for providing experimental facilities and technical support during the field experiment. During the preparation of this manuscript, the authors used ChatGPT based on GPT-5.5 Thinking (OpenAI, San Francisco, CA, USA) for language polishing and manuscript formatting assistance. After using this tool, the authors reviewed and edited the content as needed and take full responsibility for the content of this publication.
Conflicts of Interest
The authors declare no conflicts of interest. The funders had no role in the design of the study; in the collection, analyses, or interpretation of data; in the writing of the manuscript; or in the decision to publish the results.
Abbreviations
The following abbreviations are used in this manuscript:
| CLIR | Canopy light interception rate |
| CLR | Canopy light reflectance |
| CLT | Canopy light transmittance |
| DW100 | Dry weight per 100 seedlings |
| EPR | Empty-point rate |
| FSR | Floating-seedling rate |
| HGY | Harvested grain yield |
| HI | Harvest index |
| LAI | Leaf area index |
| MPR | Missing-planting rate |
| MSPR | Multiple-seed point rate |
| MTN | Maximum tiller number |
| NR | Number of roots |
| PDMA | Post-anthesis dry matter accumulation |
| PF | Pulling force |
| PN | Panicle number |
| PTP | Productive tiller percentage |
| RA | Root activity |
| RSA | Root surface area |
| RV | Root volume |
| SBW | Stem base width |
| SF | Shear force |
| SIR | Seedling injury rate |
| SPH | Seedlings per hill |
| SPP | Spikelets per panicle |
| SSCV | Seed spacing coefficient of variation |
| SSNSC | Stem-sheath nonstructural carbohydrate content |
| SSR | Seed-setting rate |
| TF | Tensile force |
| TGW | 1000-grain weight |
| TGY | Theoretical grain yield |
References
- Fukagawa, N.K.; Ziska, L.H. Rice: Importance for global nutrition. J. Nutr. Sci. Vitaminol. 2019, 65, S2–S3. [Google Scholar] [CrossRef] [PubMed]
- OECD/FAO. OECD-FAO Agricultural Outlook 2024–2033; OECD Publishing: Paris, France; FAO: Rome, Italy, 2024. [Google Scholar] [CrossRef]
- Wang, H.; Zhang, Y.; Chen, X.; Liu, J.; Li, M. Research on simplified nursery and labor-saving cultivation techniques for machine-transplanted rice. Agronomy 2025, 15, 2808. [Google Scholar] [CrossRef]
- Food and Agriculture Organization of the United Nations. Sustainable Agricultural Mechanization: A Framework for Africa; FAO: Rome, Italy, 2018. [Google Scholar]
- Feng, Y.; Liu, M.; Wang, K.; Ling, Y.; Hu, Q.; Zhang, H.; Zhang, H. Optimal seeding rate enhances seedling quality, mechanical transplanting quality, and yield in hybrid rice. Front. Plant Sci. 2024, 15, 1427972. [Google Scholar] [CrossRef] [PubMed]
- Dong, L.; Yang, T.; Li, R.; Ma, L.; Feng, Y.; Li, Y. Grain yield, rice seedlings and transplanting quantity in response to decreased sowing rate under precision drill sowing. Agriculture 2024, 14, 1745. [Google Scholar] [CrossRef]
- Ling, Y.; Liu, M.; Feng, Y.; Xing, Z.; Gao, H.; Wei, H.; Hu, Q.; Zhang, H. Effects of increased seeding density on seedling characteristics, mechanical transplantation quality, and yields of rice with crop straw boards for seedling cultivation. J. Integr. Agric. 2025, 24, 101–113. [Google Scholar] [CrossRef]
- Ling, Y.; Hu, Q.; Fu, D.; Zhang, K.; Xing, Z.; Gao, H.; Wei, H.; Zhang, H. Optimum seeding density and seedling age for the outstanding yield performance of Japonica rice using crop straw boards for seedling cultivation. Front. Plant Sci. 2024, 15, 1431687. [Google Scholar] [CrossRef] [PubMed]
- Ling, Y.; Hu, Q.; Xia, Y.; Zhang, K.; Fu, D.; Feng, Y.; Xu, F.; Li, G.; Xing, Z.; Gao, H.; et al. Effects of high-density seedling cultivation with crop straw boards on rice blanket seedling morpho-physiology and adaptability to mechanical transplanting. Trans. Chin. Soc. Agric. Eng. 2025, 41, 22–35. [Google Scholar] [CrossRef]
- Shan, S.; Jiang, P.; Fang, S.; Cao, F.; Zhang, H.; Chen, J.; Yin, X.; Tao, Z.; Lei, T.; Huang, M.; et al. Printed sowing improves grain yield with reduced seed rate in machine-transplanted hybrid rice. Field Crops Res. 2020, 245, 107676. [Google Scholar] [CrossRef]
- Wang, Y.; Zhu, D.; Chen, R.; Fang, W.; Wang, J.; Xiang, J.; Chen, H.; Zhang, Y.; Chen, J. Beneficial effects of precision drill sowing with low seeding rates in machine transplanting for hybrid rice to improve population uniformity and yield. Sci. Agric. Sin. 2022, 55, 666–679. [Google Scholar] [CrossRef]
- Li, Z.; Pan, Y.; Ma, X.; Lin, Y.; Wang, X.; Li, H. Evaluating sowing uniformity in hybrid rice using image processing and the OEW-YOLOv8n network. Front. Plant Sci. 2025, 16, 1473153. [Google Scholar] [CrossRef] [PubMed]
- Dou, Z.; Li, Y.; Guo, H.; Chen, L.; Jiang, J.; Zhou, Y.; Xu, Q.; Xing, Z.; Gao, H.; Zhang, H. Effects of mechanically transplanting methods and planting densities on yield and quality of Nanjing 2728 under rice-crayfish continuous production system. Agronomy 2021, 11, 488. [Google Scholar] [CrossRef]
- Huang, M.; Chen, J.; Cao, F.; Zou, Y. Increased hill density can compensate for yield loss from reduced nitrogen input in machine-transplanted double-cropped rice. Field Crops Res. 2018, 221, 333–338. [Google Scholar] [CrossRef]
- Murchie, E.H.; Pinto, M.; Horton, P. Agriculture and the new challenges for photosynthesis research. New Phytol. 2009, 181, 532–552. [Google Scholar] [CrossRef] [PubMed]
- Pan, Y.; Gao, S.; Xie, K.; Lu, Z.; Meng, X.; Wang, S.; Lu, J.; Guo, S. Higher radiation use efficiency produces greater biomass before heading and grain yield in super hybrid rice. Agronomy 2020, 10, 209. [Google Scholar] [CrossRef]
- Yang, J.; Peng, S.; Zhang, Z.; Wang, Z.; Zhu, Q. Grain and dry matter yields and partitioning of assimilates in japonica/indica hybrid rice. Crop Sci. 2002, 42, 766–772. [Google Scholar] [CrossRef]
- Wei, H.; Yang, Y.; Shao, X.; Shi, T.; Meng, T.; Lu, Y.; Tao, Y.; Li, X.; Ding, E.; Chen, Y.; et al. Higher leaf area through leaf width and lower leaf angle were the primary morphological traits for yield advantage of japonica/indica hybrids. J. Integr. Agric. 2020, 19, 483–494. [Google Scholar] [CrossRef]
- Yoshida, S.; Forno, D.A.; Cock, J.H.; Gomez, K.A. Laboratory Manual for Physiological Studies of Rice, 3rd ed.; International Rice Research Institute: Manila, Philippines, 1976. [Google Scholar]
- Yemm, E.W.; Willis, A.J. The estimation of carbohydrates in plant extracts by anthrone. Biochem. J. 1954, 57, 508–514. [Google Scholar] [CrossRef] [PubMed]
- Gomez, K.A.; Gomez, A.A. Statistical Procedures for Agricultural Research, 2nd ed.; Wiley: New York, NY, USA, 1984. [Google Scholar]
- Bates, D.; Maechler, M.; Bolker, B.; Walker, S. Fitting linear mixed-effects models using lme4. J. Stat. Softw. 2015, 67, 1–48. [Google Scholar] [CrossRef]
- Kuznetsova, A.; Brockhoff, P.B.; Christensen, R.H.B. lmerTest package: Tests in linear mixed effects models. J. Stat. Softw. 2017, 82, 1–26. [Google Scholar] [CrossRef]
- Lenth, R.V. emmeans: Estimated Marginal Means, aka Least-Squares Means. R Package Version 1.10.5. 2024. Available online: https://CRAN.R-project.org/package=emmeans (accessed on 2 June 2026).
- Ballare, C.L.; Pierik, R. The shade-avoidance syndrome: Multiple signals and ecological consequences. Plant Cell Environ. 2017, 40, 2530–2543. [Google Scholar] [CrossRef] [PubMed]
- Cheng, S.; Zhuang, J.; Fan, Y.; Du, J.; Cao, L. Progress in research and development on hybrid rice: A super-domesticate in China. Ann. Bot. 2007, 100, 959–966. [Google Scholar] [CrossRef] [PubMed]
- Peng, S.; Khush, G.S.; Virk, P.; Tang, Q.; Zou, Y. Progress in ideotype breeding to increase rice yield potential. Field Crops Res. 2008, 108, 32–38. [Google Scholar] [CrossRef]
- Huang, M.; Jiang, P.; Shan, S.; Gao, W.; Ma, G.; Zou, Y.; Uphoff, N.; Yuan, L. Higher yields of hybrid rice do not depend on nitrogen fertilization under moderate to high soil fertility conditions. Rice 2017, 10, 43. [Google Scholar] [CrossRef] [PubMed]
- Huang, L.; Yang, D.; Li, X.; Peng, S.; Wang, F. Coordination of high grain yield and high nitrogen use efficiency through large sink size and high post-heading source capacity in rice. Field Crops Res. 2019, 233, 49–58. [Google Scholar] [CrossRef]
- Shi, N.; Wen, S.; Gao, Q.; Gao, Z.; Yang, H. Printed sowing of high-density mechanical transplanted hybrid rice can reduce the amount of fertilizer needed. Agronomy 2022, 12, 2002. [Google Scholar] [CrossRef]
- Luo, Z.; Li, G.; Fang, S.; Hu, Q.; Chen, J.; Huang, M.; Zou, Y. Dense planting with reducing nitrogen rate increased grain yield and nitrogen use efficiency in double-season rice. Agronomy 2022, 12, 1090. [Google Scholar] [CrossRef]
- Zhao, B.; Zhang, X.; Liu, H.; Wang, J.; Li, Y.; Chen, Y. Detection method for rice seedling planting conditions based on image processing and improved YOLOv8 Nano. Appl. Sci. 2024, 14, 2575. [Google Scholar] [CrossRef]

Disclaimer/Publisher’s Note: The statements, opinions and data contained in all publications are solely those of the individual author(s) and contributor(s) and not of MDPI and/or the editor(s). MDPI and/or the editor(s) disclaim responsibility for any injury to people or property resulting from any ideas, methods, instructions or products referred to in the content. |
© 2026 by the authors. Licensee MDPI, Basel, Switzerland. This article is an open access article distributed under the terms and conditions of the Creative Commons Attribution (CC BY) license.