


Abstract
Accurate monitoring of substrate moisture content and electrical conductivity (EC) is essential for irrigation and nutrient management in soilless strawberry cultivation. However, conventional sensor-based approaches are limited in spatial coverage. This study developed a multimodal prediction framework integrating canopy multispectral imaging (713–920 nm) with greenhouse environmental and irrigation time-series data to estimate substrate state non-destructively. Four spectral preprocessing schemes were evaluated, and the first derivative of digital number values was adopted as the primary preprocessing condition. Five regression models, including a proposed spectrum-query cross-attention long short-term memory network (SpecAtten-LSTM), were compared across six spectral input configurations and five non-spectral baselines. Substrate EC was predicted accurately from either modality alone. Extreme gradient boosting reached R2 = 0.9710, and the environment-only baselines achieved comparable performance, suggesting that either modality contained sufficient information for EC prediction. For substrate moisture content, the highest performance was obtained when spectral and environmental information were combined. SpecAtten-LSTM achieved the highest accuracy (R2 = 0.7463) under the full multimodal configuration, and an ablation analysis confirmed that its cross-attention and fusion modules drove this gain. Permutation importance identified relative humidity as the dominant environmental variable for both targets. The results indicate that canopy-level observations can be used to estimate root-zone substrate conditions and that spectral information provides additional value primarily for substrate moisture content prediction.
1. Introduction
Increasing climatic variability and the rising demand for year-round vegetable supply have driven a rapid transition from open-field cultivation to precision-controlled protected horticulture [1,2]. Controlled-environment agriculture (CEA) provides uniform productivity and quality across seasons by precisely regulating irrigation, nutrient supply, light, and air temperature and humidity [3]. Strawberry (Fragaria × ananassa Duch.) is one of the most economically important horticultural crops, with a global production exceeding 9 million tons annually [4]. Lightweight substrate-based soilless cultivation systems have increasingly been adopted in strawberry production to secure consistent yield and fruit quality throughout the growing season [5].
In these substrate-based soilless systems, root-zone management is critical for stable productivity and quality because the substrate has limited buffering capacity for water and nutrients [6]. Accordingly, substrate volumetric water content and electrical conductivity (EC) are widely used as proxies for the root-zone water and ionic status, respectively [7]. Insufficient substrate moisture content restricts water uptake and depresses plant growth, whereas excessive moisture reduces oxygen availability in the substrate and weakens root vigor, lowering nutrient uptake efficiency [8]. Low substrate EC limits nutrient supply and impairs growth, while excessively high EC induces osmotic stress, stomatal closure, and ion-uptake antagonism, ultimately depressing growth and fruit quality [9]. Reliable monitoring and prediction of substrate moisture content and EC are therefore central to precision irrigation and nutrient management in strawberry soilless cultivation.
In commercial greenhouses, insertion-type substrate sensors are widely used for in situ monitoring of substrate moisture content and EC [10]. These sensors measure the root-zone at a single point but accumulate measurement bias from surface fouling and salt deposition during long-term operation [11]. Moreover, because they directly probe the physical and chemical state of the substrate, they cannot reflect the physiological responses of the crop, which vary with light environment, transpiration demand, and growth stage [12]. Therefore, canopy-level monitoring approaches are needed to complement insertion-type sensing by non-destructively capturing the structural and physiological responses of the plant.
By acquiring canopy reflectance across multiple wavelengths, ground-based multispectral imaging enables non-destructive assessment of chlorophyll content, mesophyll structure, and water status [13]. Within the visible–near-infrared range, the red-edge transition reflects the combined response of chlorophyll absorption and mesophyll scattering, whereas the near-infrared (NIR) plateau is governed mainly by internal light scattering within mesophyll cells [14]. These spectral characteristics can be exploited to interpret, at the canopy level, the physiological responses that variations in substrate moisture content and EC induce in the plant [15]. Along this pathway, the responses observed at the canopy are confounded with light intensity, air temperature and humidity, irrigation history, and growth stage [16]. Spectral information acquired at a single time point is therefore insufficient to recover root-zone status reliably, and a multimodal approach that integrates canopy spectra with greenhouse environmental and irrigation time-series is required.
Recently, studies combining multispectral imaging with machine learning to estimate soil and crop status have expanded, and multiple studies have reported that combining environmental variables with spectral information improves prediction performance. Ge et al. [17] combined UAV-based hyperspectral imagery with machine learning to monitor topsoil moisture content, achieving R2val = 0.907 with a random forest model. Whitney et al. reported a significant correlation (R2 = 0.73) between MODIS time-series vegetation indices and field-level soil salinity [18]. Ge et al. [19] further demonstrated that combining Sentinel-2 spectra with environmental covariates improved soil salinity prediction R2 up to 0.88 over spectra-only models.
These prior studies indicate that canopy spectral signals can reflect root-zone status and that integration with environmental covariates contributes to performance gains. However, the works above were conducted in soil-based field cultivation or in wide-area remote sensing settings. Soilless substrate cultivation differs fundamentally from soil-based systems in water-retention characteristics and in the mode of nutrient delivery, and the input configurations and model structures of these prior studies are not directly transferable to greenhouse soilless cultivation.
Therefore, this study developed a multimodal framework for predicting substrate moisture content and electrical conductivity (EC) in strawberry soilless cultivation by integrating canopy multispectral features with greenhouse environmental and irrigation data. The aims of this study were to (1) evaluate the effects of four spectral preprocessing schemes (raw digital number, relative reflectance, and their respective first derivatives)on substrate moisture content and EC prediction; (2) assess the individual and combined contributions of auxiliary greenhouse environmental and irrigation variables (air temperature, relative humidity, solar radiation, and irrigation status) to substrate moisture content and EC prediction; (3) compare the spectral input configurations with non-spectral baselines that use only the environmental and irrigation variables, to isolate the independent contribution of the spectral modality; and (4) compare extreme gradient boosting (XGBoost) and four deep learning architectures, including one-dimensional convolutional neural network (1D-CNN), long short-term memory network (LSTM), LSTM with additive attention (LSTM-Attention), and spectrum-query cross-attention LSTM (SpecAtten-LSTM), to identify the most effective model architecture for multimodal substrate moisture content and EC prediction.
By providing a methodological foundation for the non-destructive estimation of root-zone status from canopy-level observations, the proposed multimodal framework can support the development of precision irrigation and nutrient management as well as crop-response-driven environmental control in greenhouse production systems.
2. Materials and Methods
The overall experimental workflow of this study is presented in Figure 1. Canopy multispectral images, substrate moisture content and EC measurements, and greenhouse environmental and irrigation data were first acquired from a soilless strawberry cultivation system. The acquired data were then processed through spectral preprocessing and SAM-based ROI extraction, followed by multimodal input combination design and prediction model training. Finally, model performance was comparatively evaluated across input configurations and model architectures for substrate moisture content and EC prediction.
Figure 1.
Overview of the experimental framework. The framework encompasses data acquisition from a soilless strawberry cultivation system through canopy multispectral imaging and substrate and environmental sensing, followed by spectral preprocessing and multimodal input design integrating spectral features with environmental-irrigation time series, and concludes with comparative model evaluation for substrate moisture content and EC prediction.
2.1. Plant Cultivation and Experimental Design
This experiment was conducted in a multi-span Venlo-type research greenhouse at the National Institute of Horticultural and Herbal Science (NIHHS), Rural Development Administration (RDA), located in Wanju-gun, Jeollabuk-do, Republic of Korea (approximately 35.8303° N, 127.0320° E) (Figure 2a). Strawberry seedlings (Fragaria × ananassa Duch. cv. Seolhyang) were transplanted into a commercial strawberry-specific substrate mix (Shinsung Mineral Co., Ltd., Goesan-gun, Republic of Korea; coco peat 35%, perlite 35%, peat moss 20%, vermiculite 5%, zeolite 5%; pH 5.0–7.0). Five seedlings were planted per cultivation pot, and three drip emitters per pot delivered nutrient solution via a drip irrigation system (Figure 2b). The nutrient solution was prepared as separate A and B stock solutions containing calcium nitrate, potassium nitrate, magnesium sulfate, monoammonium phosphate, iron chelate, and micronutrients. During the experimental period, the mean daytime (06:00–18:00) and nighttime (18:00–06:00) greenhouse air temperatures were 14 °C and 9 °C, respectively. The mean daytime and nighttime relative humidity levels were 70% and 80%, respectively. The mean daytime and nighttime solar radiation were 229 W/m−2 and 77 W/m−2.
Figure 2.
Greenhouse facility and data acquisition setup: (a) interior view of the Venlo-type research greenhouse used for strawberry cultivation; (b) strawberry plants grown in soilless substrate with an insertion-type FDR sensor for substrate moisture content and EC measurement; (c) multispectral camera mounted for canopy image acquisition.
Data acquisition was conducted for 18 days from December 21, corresponding to 109 days after transplanting (DAT 109). The acquisition period focused on the fruiting and harvest stage of the primary truss. Nutrient uptake in strawberry is associated with phenological development and increases during fruit development [20]. This stage therefore represents an important period for irrigation and nutrient management, during which accurate estimation of root-zone substrate moisture content and EC is practically relevant. Accordingly, the present experiment focused on this stage to target the conditions under which substrate-state monitoring is important for greenhouse strawberry cultivation.
2.2. Data Acquisition
2.2.1. Multispectral Imaging
Canopy multispectral images were acquired using a 10-band near-infrared (NIR) camera (Monarch Pro, Unispectral Ltd., Hod HaSharon, Israel) (Figure 2c). The camera sequentially captures 10 spectral bands spanning 713–920 nm at approximately 23 nm intervals, producing an image cube with a spatial resolution of 1024 × 1280 pixels. All images were acquired under ambient greenhouse illumination without supplemental artificial lighting, and the camera was mounted on a tripod at a fixed imaging distance of approximately 0.3 m from the strawberry canopy.
At each imaging session, a gray reference panel was positioned within the field of view alongside the canopy to enable reflectance calibration. Image acquisition was automated through a custom Python-based system built on the manufacturer-provided SDK (Solomon Windows API). Figure 3a shows the interface of the image acquisition system.
Figure 3.
Software interfaces for multispectral image acquisition and leaf ROI extraction: (a) custom Python-based image acquisition interface built on the Solomon Windows API; (b) web-based SAM-assisted segmentation interface for extracting individual leaf ROIs from multispectral images.
2.2.2. Substrate Sensor and Greenhouse Environmental Measurements
Substrate moisture content and EC were measured using a frequency domain reflectometry (FDR) insertion-type substrate sensor (KSM-8900, SENSECUBE, Korea Digital Co., Ltd., Seoul, Republic of Korea) inserted directly into the growing substrate. The sensor simultaneously measures volumetric water content and EC, and data were logged at 1 min intervals via RS-485 serial communication using a custom Python logging system.
Greenhouse environmental variables included indoor air temperature and relative humidity, measured using a combined temperature–humidity sensor (GreenCS Co., Ltd., Damyang-gun, Republic of Korea; measurement range: −20 to 80 °C, 0–100% RH). Outdoor solar radiation was measured using a pyranometer (KR6450, DAVIS Instruments, Hayward, CA, USA; measurement range: 0–1800 W/m−2). Irrigation event logs were extracted from the nutrient solution controller to derive a binary irrigation state at each time step. All environmental variables, substrate moisture content, EC, and irrigation state were resampled and aligned to a uniform 5 min time series grid. In this study, one cultivation pot containing five strawberry plants was used as the monitored substrate unit. One insertion-type FDR substrate sensor was installed at the center of the substrate in the monitored pot. Because the five strawberry plants shared the same substrate volume and irrigation supply, the sensor readings were used as the root-zone state of this monitored cultivation unit. The sensor was operated using the manufacturer-provided calibration settings.
2.3. Spectral Preprocessing and Feature Extraction
2.3.1. Leaf ROI Extraction Using the Segment Anything Model
To extract leaf-level spectral information from the multispectral images, a semi-automated segmentation pipeline based on the Segment Anything Model (SAM) [21] was used. The pipeline was implemented as a web-based interface in which the operator designates leaf regions within each image frame, after which SAM automatically generates a binary mask for each designated leaf area (Figure 3b). Each mask was stored as an individual leaf ROI, and the band-wise mean pixel value within each ROI was computed to produce a per-ROI feature vector. In total, 1093 multispectral images were processed, from which 7762 leaf ROIs were extracted.
All leaf ROIs extracted from the same imaging session shared the substrate moisture content and EC values measured by the substrate sensor at the corresponding acquisition time. In this study, an imaging session was defined as the set of images and ROIs acquired from the same monitored cultivation pot at the same timestamp. Thus, ROIs were used as ROI-level spectral observations for model training and evaluation, whereas substrate moisture content and EC labels were assigned at the session level. Because ROIs from the same imaging session shared the same pot-level substrate label, they were not regarded as independent biological replicates.
Multiple ROIs were retained as individual spectral observations rather than being averaged into a single image-level vector because leaf position, orientation, developmental stage, and local illumination conditions within the canopy can affect spectral reflectance. To reduce leakage-induced overestimation, the data were partitioned at the imaging-session level rather than at the individual ROI level. All ROIs from the same imaging session were assigned to the same data partition and were never split across the training and test sets.
2.3.2. Spectral Preprocessing
Four spectral preprocessing conditions were compared to evaluate the effect of radiometric calibration and spectral transformation on prediction performance. First, the digital number (DN) condition used raw sensor signals without reference panel correction; each ROI was represented by band-wise mean DN values. Second, the first-derivative digital number (DN_D1) condition applied the finite-difference first derivative along the spectral axis to the DN spectra, as defined in Equation (1).
where Bi is the DN value of the -th band, is the center wavelength of the corresponding band, and denotes the band-axis first derivative value.
The first-derivative transformation suppresses baseline-offset variations across imaging sessions and emphasizes inter-band rate-of-change features, which have been shown to enhance sensitivity to subtle physiological differences in vegetation canopies. Third, the relative reflectance (Ref) condition converted DN values to relative reflectance using the gray reference panel and dark-current signals, as defined in Equation (2).
where is the leaf ROI DN signal, is the dark-current signal, and is the gray reference panel signal.
Because the gray reference panel used in this study was not a certified reflectance standard, the resulting values are interpreted as relative reflectance rather than absolute reflectance. Fourth, the first-derivative relative reflectance (Ref_D1) condition applied the same first-derivative transformation defined in Equation (1) to the Ref spectra. All four preprocessing conditions were applied identically across all input combinations and prediction models to enable a controlled comparison of spectral representations for substrate moisture content and EC prediction.
2.3.3. Band-Level Correlation Analysis
Pearson correlation coefficients (r) were computed between each band feature and substrate moisture content and EC under each preprocessing condition (Equation (3)). This analysis served as a preliminary step to examine how band-level univariate associations with the prediction targets differ across preprocessing conditions.
where is the band-wise ROI mean value, is the corresponding substrate moisture content or EC measurement, and and are their respective sample means.
2.4. Multimodal Input Combination Design
To construct each prediction sample, the timestamp of each multispectral image acquisition was defined as the reference time point t. Environmental and irrigation time-series data were extracted over a 30-min lookback window [, yielding seven-time steps at 5-min intervals . This 30-min window was selected to match the approximate multispectral imaging interval, so that the temporal context of each sample was aligned with the image acquisition interval. The multispectral feature was represented as a single spectral vector captured at time , rather than being expanded into a time series. The prediction targets were the substrate moisture content and the substrate EC measured at the same reference time point .
Six spectral input configurations (S0–S5) were constructed by combining the multispectral features with auxiliary environmental and irrigation variables, as summarized in Table 1. S0 contained only the multispectral features, S1–S4 each added a single auxiliary variable to the multispectral features, and S5 included all four auxiliary variables. To evaluate the independent contribution of the spectral modality, five non-spectral configurations (NS1–NS5) were additionally constructed by excluding the multispectral features and using only the environmental and irrigation variables (Table 2). NS1–NS4 each used a single auxiliary variable, whereas NS5 included all four variables. These configurations served as non-spectral baseline inputs for comparison with the spectral input configurations.
Table 1.
Multimodal input combinations. “√” indicates inclusion in the model input. Spectral data were used as the primary modality across all six combinations, and greenhouse environmental and irrigation variables were added incrementally.
Table 2.
Non-spectral input combinations. “√” indicates inclusion in the model input. Spectral data were excluded from all five combinations, and greenhouse environmental and irrigation variables were used either individually or in combination.
Identical training procedures and fixed hyperparameter settings were applied across all spectral and non-spectral configurations within each preprocessing condition so that observed performance differences could be attributed to input composition. In addition, to examine the sensitivity of model performance to the temporal window length, lookback windows of 15, 30, 60, and 120 min were evaluated under the DN_D1 preprocessing condition and the S5 input configuration.
2.5. Prediction Models and Training Strategy
2.5.1. Data Split
The dataset was split chronologically to evaluate prediction performance under temporally realistic conditions. The observation period was divided into training and test sets at an approximate ratio of 7:3, with a 30-min temporal buffer between them to prevent leakage from adjacent imaging sessions. The training set was further divided 8:2 along the time axis, with the latter 20% reserved as a validation set for early stopping and hyperparameter optimization.
2.5.2. Model Architectures for Substrate State Prediction
Five regression models were compared for substrate moisture content and substrate EC prediction: long short-term memory network (LSTM), LSTM with additive attention (LSTM-Attention), extreme gradient boosting (XGBoost), one-dimensional convolutional neural network (1D-CNN), and a spectrum-query cross-attention LSTM (SpecAtten-LSTM).
LSTM is a recurrent neural network with gated memory cells designed to capture long-range temporal dependencies in sequential data [22]. LSTM was applied to model the temporal dependencies of the environmental and irrigation sequences over the 30-min lookback window. The environmental sequence is processed by an LSTM encoder, and the resulting hidden states are linearly projected. The multispectral feature is processed by a two-layer multilayer perceptron (MLP) and broadcast over the time axis, concatenated with the environmental representation, and decoded through a fully connected layer.
LSTM-Attention extends the basic LSTM by introducing an additive attention mechanism over the LSTM hidden states, following the hidden-state scoring formulation used in hierarchical attention networks [23]. The attention weights are computed as in Equation (4). Unlike the original formulation, which collapses the weighted hidden states into a single context vector, this study applies the attention weights as per-timestep gates (Equation 5) to preserve the temporal dimension of the sequence.
where is the attention weight at time step t, is a learnable weight matrix, is a learnable weight vector, is the LSTM hidden state at time step t, is a bias term, and is the total number of time steps.
where is the attention-modulated hidden state at time step , is the attention weight computed in Equation (4), and is the original LSTM hidden state.
XGBoost is a gradient-boosted decision tree ensemble that sequentially fits weak learners to the residuals of the previous ensemble [24]. XGBoost was applied to capture non-linear interactions among environmental and spectral variables through tree-based threshold splits. The seven-time-step environmental sequence and the multispectral feature were flattened into a single input vector for training.
1D-CNN is a deep learning architecture that extracts local patterns through stacked convolution operations along a one-dimensional axis [25]. 1D-CNN was applied to capture local temporal patterns along the time axis and local spectral patterns along the band axis. The model consists of two parallel branches—an environmental Conv1d branch and a spectral Conv1d branch—whose representations are concatenated and decoded through a fully connected layer.
SpecAtten-LSTM is a spectrum-query cross-attention LSTM proposed in this study to model interactions between canopy multispectral features and antecedent environmental-irrigation sequences (Figure 4). The environmental branch encodes the environmental-irrigation sequence using an LSTM, adds a learnable positional embedding, and applies layer normalization to produce the key and value representations. The spectral branch processes the multispectral feature vector using an MLP and layer normalization to produce the query representation. Multi-head scaled dot-product attention was then computed following the formulation of Vaswani et al. [26], as shown in Equations (6) and (7). The resulting attended environmental context was concatenated with the spectral representation and passed through a decoder MLP to predict substrate moisture content or EC. This design is conceptually related to recent cross-modal attention approaches for image-environmental fusion in plant phenotyping [27], but was adapted here for continuous substrate state regression using canopy spectral and environmental-irrigation inputs.
where , , and denote the query, key, and value matrices, and is the dimensionality of the keys.
where , , , and are learnable projection matrices for the -th attention head and the output projection, and is the number of attention heads.
Figure 4.
Architecture of the SpecAtten-LSTM model. The environmental branch encodes the environmental-irrigation time-series through an LSTM with a learnable positional embedding and layer normalization to produce key (K) and value (V) representations. The spectral branch processes the multispectral feature vector through a two-layer MLP and layer normalization to produce the query (Q) representation. Multi-head cross-attention (h = 4) computes scaled dot-product attention between Q and K to obtain attention weights, which are applied to V to produce the attended environmental context. The attended context is concatenated with the spectral representation (dashed line) and decoded through an MLP to predict substrate moisture content or EC.
2.5.3. Hyperparameter Optimization and Training Setup
XGBoost was trained with the hist tree method and squared error loss, with hyperparameters optimized over 150 Optuna trials. Deep learning models were trained with the AdamW optimizer, ReduceLROnPlateau scheduler, and gradient clipping (max norm = 1.0) for a maximum of 200 epochs with early stopping, with hyperparameters optimized over 120 Optuna trials. Standardization was performed with StandardScaler fitted on the training set and applied identically to the validation and test sets. To account for training stochasticity, each model and input configuration was trained independently with five random seeds (2, 7, 42, 99, and 123), and all reported metrics are presented as the mean ± standard deviation across these runs.
2.6. Feature Attribution
The relative contribution of each input feature was assessed using permutation importance computed on the test set. For each feature, the feature values were randomly shuffled across test samples while all other features remained fixed, and the resulting decrease in test R2 was recorded. This procedure was repeated three times per feature with a fixed random seed. For XGBoost, each column of the flattened input vector was permuted independently. For the neural-network models, each (environmental variable, time step) pair and each spectral band were permuted separately to preserve the temporal and spectral structure of the input. Negative ΔR2 values were clipped to zero, and the remaining values were normalized to sum to 100% within environmental and spectral feature groups.
2.7. Performance Evaluation
Prediction performance for substrate moisture content and substrate EC was quantified using the coefficient of determination (R2), root mean squared error (RMSE), and mean absolute error (MAE), as defined in Equations (8)–(10).
where is the observed value, is the predicted value, is the mean of the observed values, and n is the number of test samples.
2.8. Implementation Environment
All analyses were implemented in Python 3.11. The principal libraries used were scikit-learn 1.4, XGBoost 2.0, PyTorch 2.2, and Optuna 3.6. Model training was performed in parallel by preprocessing conditions on two NVIDIA RTX 3090 GPUs (24 GB each; NVIDIA Corporation, Santa Clara, CA, USA) hosted on a workstation with 32 CPU cores and 125 GB RAM.
3. Results
3.1. Canopy Spectral Characteristics Across Preprocessing Methods
The canopy spectral signal was characterized under the four preprocessing conditions to evaluate the effect of radiometric calibration and spectral transformation on the input feature space (Figure 5). Under raw DN (Figure 5a), the mean signal exhibited the typical vegetation reflectance pattern with a sharp red-edge transition between 713 and 805 nm followed by stabilization across the NIR-plateau. The band-wise standard deviation was substantial across all bands, reflecting session-to-session variation in illumination and canopy geometry during ambient-light imaging. Under relative reflectance (Figure 5b), the spectral shape was preserved but values exceeded 1.0. The two first-derivative conditions (Figure 5c,d) converted absolute signal levels into inter-band rates of change, producing a positive slope in the 713–759 nm region that decayed toward zero across the NIR plateau. Regardless of the preprocessing method applied, the largest band-to-band variability was concentrated in the red-edge region (713–782 nm).
Figure 5.
Band-wise mean spectral response under four preprocessing conditions. The solid line indicates the mean and the shaded region represents ±1 standard deviation: (a) digital number (DN); (b) gray-panel-corrected relative reflectance (Ref); (c) first derivative of DN (DN_D1); (d) first derivative of relative reflectance (Ref_D1).
3.2. Band-Level Correlation Between Multispectral Bands and Substrate State
The univariate association between individual spectral bands and substrate state was evaluated under each preprocessing condition to assess whether specific bands carry stronger linear information about the prediction targets. The band-wise correlation results for substrate EC and substrate moisture content are summarized in Figure 6.
Figure 6.
Absolute Pearson correlation coefficients (|r|) between individual spectral bands and substrate EC under four preprocessing conditions: (a) digital number (DN); (b) gray-panel-corrected relative reflectance (Ref); (c) first derivative of DN (DN_D1); (d) first derivative of relative reflectance (Ref_D1). Solid lines indicate positive correlations and dashed lines indicate negative correlations.
Under raw DN, the absolute Pearson correlation coefficient between individual spectral bands and substrate EC increased monotonically with wavelength, reaching approximately 0.28 at 920 nm with uniformly positive correlations across all bands. Under relative reflectance, the same monotonic pattern was observed with stronger magnitudes, reaching approximately 0.38 at 920 nm. The two first-derivative conditions produced spectrally localized correlation patterns. Under DN_D1, the absolute correlation reached approximately 0.24 near 770 nm with a sharp drop across 805–874 nm, and the sign of the correlation shifted from positive in the red-edge region to negative in the NIR-plateau. Under Ref_D1, the strongest single-band correlation observed in this study appeared at 724 nm with an absolute value of approximately 0.40, and correlations decreased rapidly through the NIR-plateau. The correlation pattern with substrate moisture followed a similar shape but with consistently lower magnitudes, not exceeding 0.27 across all preprocessing conditions. This pattern was consistent across all four preprocessing methods, with no single band exceeding an absolute correlation of 0.40 for either target variable.
3.3. Substrate Moisture and EC Dynamics Around Irrigation Events
Substrate moisture content and EC dynamics around irrigation events were analyzed by aligning all imaging sessions to the irrigation onset (t = 0). Substrate moisture content rose rapidly from approximately 38.4% VWC to a post-irrigation peak of approximately 38.8% within 50 min after irrigation onset, then declined gradually toward the pre-irrigation baseline over the subsequent 5h (Figure 7a). Substrate EC exhibited a contrasting pattern, gradually decreasing from approximately 1.75 dS m−1 before irrigation to approximately 1.65 dS m−1 over 100–200 min, after which it slowly recovered (Figure 7b). Moisture content responded rapidly with a sharp positive deflection followed by gradual decay, whereas EC responded more slowly with a sustained negative deflection that recovered over a longer timescale.
Figure 7.
Event-centered temporal dynamics of substrate moisture and substrate EC relative to irrigation onset: (a) substrate moisture content (% VWC); (b) substrate EC (dS m−1). Solid lines represent the mean across all irrigation events during the observation period and shaded areas indicate ±1 SE. The dashed red line marks the irrigation onset (t = 0).
3.4. Model Performance for Substrate EC Prediction Across Spectral and Non-Spectral Inputs
Substrate EC prediction performance was compared across five models and six spectral input configurations (S0–S5) under DN_D1 preprocessing (Table 3), as well as five non-spectral baseline configurations (NS1–NS5) that used only environmental and irrigation variables (Table 4). The results for the remaining three preprocessing conditions (DN, Ref, and Ref_D1) are provided in Tables S1–S3. All values are reported as the mean ± standard deviation over five runs with different random seeds (2, 7, 42, 99, and 123).
Table 3.
Substrate EC prediction performance across five models and six spectral input configurations (S0–S5) under DN_D1 preprocessing. Values are reported as the mean ± standard deviation over five independent runs using random seeds 2, 7, 42, 99, and 123.
Table 4.
Substrate EC prediction performance across five models for the five non-spectral baseline configurations (NS1–NS5) under DN_D1 preprocessing. Values are reported as the mean ± standard deviation over five independent runs using random seeds 2, 7, 42, 99, and 123.
DN_D1 preprocessing was selected as the representative condition for the main comparison because it provided the most balanced overall performance across models and spectral input configurations. Although the highest single R2 value among all preprocessing conditions was observed under Ref preprocessing for LSTM at S1 (R2 = 0.9731 0.0034; Table S2), DN_D1 yielded consistently competitive performance across the five models and showed the highest overall average R2 across all model–input pairs. In particular, compared with DN, Ref, and Ref_D1 preprocessing, DN_D1 reduced the performance variability of LSTM-Attention and maintained high performance for XGBoost, 1D-CNN, LSTM, and SpecAtten-LSTM. Therefore, DN_D1 was used as the primary preprocessing condition in Table 3, while the results for the other preprocessing conditions are provided in Tables S1–S3 to confirm that the overall trends were not specific to a single preprocessing method.
Across the spectral configurations (Table 3), XGBoost achieved the highest R2 at S1 (R2 = 0.9710 0.0009), followed by 1D-CNN at S5 (R2 = 0.9698 0.0028), LSTM at S5 (R2 = 0.9687 0.0036), and SpecAtten-LSTM at S1 (R2 = 0.9680 0.0052), with these top values differing by less than 0.004 in R2. SpecAtten-LSTM achieved the best performance in three of the six combinations (S0, S2, and S4), XGBoost was best in S1 and S3, and 1D-CNN was best in S5. LSTM-Attention exhibited the lowest EC performance, with R2 as low as 0.9072 0.0153 at S0 and several configurations below 0.92. The transition from S0 to S5 did not uniformly improve EC prediction: 1D-CNN, LSTM, and LSTM-Attention showed marginal gains, XGBoost decreased from S0 to S5, and SpecAtten-LSTM remained essentially unchanged.
The non-spectral baselines showed a similar pattern (Table 4). The best non-spectral configurations reached R2 values similar to or slightly higher than those of the spectral configurations, with 1D-CNN at NS1 (R2 = 0.9713 0.0011) and LSTM at NS5 (R2 = 0.9713 0.0006) nearly identical to the best spectral result. For SpecAtten-LSTM, the full-input configurations that differed only in the inclusion of the spectral modality yielded R2 = 0.9642 ± 0.0024 at S5 and R2 = 0.9699 0.0021 at NS5. These results indicate that, under the present experimental conditions, adding multispectral information did not consistently improve EC prediction.
The effect of the temporal lookback window on EC prediction is summarized in Table S4. Relative to the 30-min window used in the model comparison, most models showed only small changes with window length: 1D-CNN and SpecAtten-LSTM remained nearly constant across windows, whereas LSTM declined gradually as the window lengthened. XGBoost was the most window-sensitive model, achieving its highest performance at the 15-min window (R2 = 0.9739 0.0004) and decreasing to R2 = 0.9510 0.0012 at the 30-min window. The 30-min window was retained as the representative setting because it matches the multispectral imaging interval and provides a consistent basis for comparison across models.
3.5. Model Performance for Substrate Moisture Content Prediction Across Spectral and Non-Spectral Inputs
Substrate moisture content prediction was evaluated using the same model and input-combination framework as substrate EC prediction. Under DN_D1 preprocessing, performance was compared across five models and six spectral input configurations (S0–S5; Table 5), as well as five non-spectral baseline configurations (NS1–NS5; Table 6) that used only environmental and irrigation variables. The corresponding results for the remaining three preprocessing conditions (DN, Ref, and Ref_D1) are provided in Tables S5–S7. All values are reported as the mean ± standard deviation over five runs with different random seeds (2, 7, 42, 99, and 123).
Table 5.
Substrate moisture content prediction performance across five models and six spectral input configurations (S0–S5) under DN_D1 preprocessing. Values are reported as the mean ± standard deviation over five independent runs using random seeds 2, 7, 42, 99, and 123.
Table 6.
Substrate moisture content prediction performance across five models for the five non-spectral baseline configurations (NS1–NS5) under DN_D1 preprocessing. Values are reported as the mean ± standard deviation over five independent runs using random seeds 2, 7, 42, 99, and 123.
DN_D1 preprocessing was used as the representative condition for the main moisture content comparison because it provided a common basis for evaluating both target variables under the same preprocessing setting used for substrate EC prediction. The results under DN, Ref, and Ref_D1 preprocessing are provided in Tables S5–S7 to show the corresponding model and input-combination trends under the remaining preprocessing conditions.
Compared with substrate EC prediction, substrate moisture content prediction showed substantially lower accuracy across models and input configurations. Under the spectral configurations (Table 5), mean R2 values ranged from 0.6362 to 0.7463. The highest spectral result was obtained by SpecAtten-LSTM at S5 (R2 = 0.7463 0.0182), followed by 1D-CNN at S1 (R2 = 0.7174 0.0113), 1D-CNN at S5 (R2 = 0.7069 ± 0.0428), and XGBoost at S5 (R2 = 0.7068 0.0014); these next-best values were very close to one another and overlapped within their standard deviations. Across the six spectral input configurations, XGBoost achieved the best performance at S0, 1D-CNN achieved the best performance at S1, S2, and S3, 1D-CNN and SpecAtten-LSTM showed the same mean R2 at S4, and SpecAtten-LSTM achieved the best performance at S5. LSTM-Attention did not achieve the highest performance in any spectral input configuration and showed relatively large variability in several cases.
The effect of the temporal lookback window on substrate moisture content prediction is summarized in Table S8. As with substrate EC, XGBoost was the most window-sensitive model, achieving its highest performance at the 15-min window (R2 = 0.7314 0.0035) and decreasing as the window lengthened. In contrast, SpecAtten-LSTM remained the best-performing model across all window lengths, with comparable or slightly higher accuracy at longer windows (R2 = 0.7463 0.0182 at 30 min and R2 = 0.7581 0.0130 at 120 min). The 30-min window was retained as the representative setting to remain consistent with the substrate EC analysis and to match the multispectral imaging interval.
The non-spectral baseline results showed a similar level of performance but did not exceed the best spectral configuration (Table 6). Among the non-spectral configurations, the highest R2 was obtained by 1D-CNN at NS1 (R2 = 0.7152 0.0231), followed by LSTM at NS1 (R2 = 0.7110 0.0194) and SpecAtten-LSTM at NS1 (R2 = 0.7091 0.0561). These values were lower than the best spectral result obtained by SpecAtten-LSTM at S5. For the matched full-input configurations that differed only in the inclusion of the spectral modality, SpecAtten-LSTM increased from R2 = 0.6285 0.0397 at NS5 to R2 = 0.7463 0.0182 at S5. Similar NS5-to-S5 increases were observed for XGBoost, 1D-CNN, LSTM, and LSTM-Attention, although the magnitude of the increase differed by model.
Overall, substrate moisture content was more difficult to predict than substrate EC, as indicated by the lower R2 values and larger variability across several deep learning models. Under DN_D1 preprocessing, the highest moisture content prediction performance was obtained by SpecAtten-LSTM under the full spectral input configuration S5, whereas the best non-spectral baseline was obtained by 1D-CNN under NS1. The corresponding lookback sensitivity for substrate moisture content prediction is summarized in Table S8.
3.6. Ablation Analysis of the SpecAtten-LSTM Architecture
The ablation results for SpecAtten-LSTM are summarized in Table 7. The full SpecAtten-LSTM model was compared with three reduced variants under DN_D1 preprocessing. In the -PosEmb variant, the learnable positional embedding was removed from the environmental-irrigation sequence representation. In the -CrossAtten variant, the cross-attention module was replaced with mean pooling over the environmental-irrigation LSTM sequence. In the -Fusion variant, the attention-based spectral-environmental fusion module was replaced with late concatenation of the spectral representation and the final hidden state of the environmental LSTM. The analysis was conducted for the S1 and S5 input configurations and for both substrate EC and substrate moisture content prediction using the same chronological train-test split, 30-min lookback window, frozen hyperparameter settings, and five random seeds as the main experiments. The S1 configuration was selected as a compact multimodal condition combining spectral information with a limited environmental variable set, whereas the S5 configuration was selected as the full multimodal condition including the complete spectral, environmental, and irrigation inputs. These configurations were selected to compare the architectural behavior of SpecAtten-LSTM under reduced and full multimodal settings, rather than to identify the most influential environmental variable group.
Table 7.
Ablation analysis of the SpecAtten-LSTM architecture under DN_D1 preprocessing for the S1 and S5 input configurations. The full model includes cross-attention, positional embedding, and multimodal fusion. The reduced variants remove positional embedding (-PosEmb), replace cross-attention with mean pooling (-CrossAtten), or replace the fusion module with late concatenation (-Fusion). R2, RMSE, and MAE are reported as the mean standard deviation across five random seeds (2, 7, 42, 99, and 123).
For the S1 configuration, the ablated variants showed performance comparable to the full model for both target variables. For substrate EC prediction, the full model achieved R2 = 0.9680, while the ablated variants ranged from R2 = 0.9644 to 0.9688. For substrate moisture content prediction, the full model achieved R2 = 0.6972, and the ablated variants showed similar values ranging from R2 = 0.6907 to 0.7042.
For the S5 configuration, the ablation results differed between the two target variables. For substrate EC prediction, the full model achieved R2 = 0.9642, and the ablated variants again showed comparable performance, with R2 values ranging from 0.9605 to 0.9685. In contrast, for substrate moisture content prediction, the full model achieved R2 = 0.7463. Removing the positional embedding did not reduce performance, as the -PosEmb variant showed R2 = 0.7478. However, removing the cross-attention module reduced R2 to 0.6804, and replacing the fusion module with late concatenation reduced R2 to 0.6786.
Overall, the ablation results showed that the full SpecAtten-LSTM architecture did not provide a consistent advantage for substrate EC prediction or under the compact S1 configuration. The largest performance reductions were observed for substrate moisture content prediction under the full multimodal S5 configuration when either the cross-attention module or the fusion module was removed.
3.7. Within-Modality Feature Importance for Environmental and Spectral Inputs
Permutation importance was computed on the S5 configuration to assess the relative contribution of each environmental and spectral variable. Figure 8 presents the importance shares grouped by input modality. For each model, importance values were normalized to 100% within each modality group, and the final importance values are reported as the mean standard deviation across five random seeds (2, 7, 42, 99, and 123).
Figure 8.
Model-specific permutation feature importance for environmental and spectral inputs under the S5 full-input configuration with DN_D1 preprocessing. Importance values were normalized within each modality group and are shown as the mean ± standard deviation across five random seed (2, 7, 42, 99, and 123): (a) environmental inputs for substrate moisture content prediction; (b) environmental inputs for substrate EC prediction; (c) spectral band inputs for substrate moisture content prediction; (d) spectral band inputs for substrate EC prediction.
Environmental inputs (Figure 8a,b) showed attribution patterns that were relatively stable and interpretable compared with those of the spectral inputs. For substrate moisture content prediction (Figure 8a), humidity was the largest environmental contributor in all models, although the distribution differed across model classes. The humidity share ranged from approximately 60% to 85%, while temperature also showed substantial contributions in XGBoost, 1D-CNN, and SpecAtten-LSTM. Solar radiation showed relatively low contributions in several models, and irrigation accounted for only a limited proportion of the environmental importance. For EC prediction (Figure 8b), the dominance of humidity was much more pronounced. Humidity accounted for approximately 95–97% of the environmental importance in XGBoost, LSTM, LSTM-Attention, and SpecAtten-LSTM, with relatively small standard deviations. The main exception was 1D-CNN, in which environmental importance was distributed between humidity and temperature.
Regarding the spectral band-difference inputs (Figure 8c,d), the importance patterns showed greater variability across models and random seeds. The standard deviations of some band pairs were comparable to or exceeded their mean importance values. In substrate moisture content prediction (Figure 8c), the neural-network models distributed importance across multiple band differences in the red-edge and NIR-plateau ranges. SpecAtten-LSTM showed a relatively consistent concentration of importance at across random seeds. XGBoost assigned relatively high mean importance to several band pairs including . In EC prediction (Figure 8d), a similar pattern appeared. SpecAtten-LSTM again showed consistently elevated importance at . The other neural-network models distributed attribution across adjacent band differences. XGBoost showed a relatively high mean contribution at .
4. Discussion
4.1. Spectral Preprocessing and Band–Substrate Relationships
The band-wise Pearson correlation analysis (Figure 6) showed that both the strength and spectral location of band–target correlations varied with the preprocessing condition. Gray reference panel corrected relative reflectance yielded higher absolute correlations at 920 nm than raw DN, suggesting that gray reference panel normalization partially reduced illumination-related variability inherent in ambient-light imaging. However, the relative reflectance values exceeding 1.0 (Figure 5b) indicate that the corrected values should be interpreted as gray reference panel normalized relative reflectance rather than absolute reflectance. This is likely attributable to the use of a gray reference panel that was not a certified Lambertian reflectance standard. The first-derivative transformations shifted the strongest correlations toward the short-wavelength region. Under Ref_D1, the strongest single-band correlation observed in this study appeared at 724 nm with an absolute r of approximately 0.40 in the red-edge transition zone.
The highest single-band Pearson correlation was observed under Ref_D1, yet DN_D1 yielded superior multivariate model performance and was therefore selected as the primary preprocessing condition. This discrepancy reflects the difference between univariate correlation and multivariate prediction: Ref_D1 relies on an uncertified gray reference panel that may introduce calibration noise degrading multivariate performance despite improving single-band correlation [15]. DN_D1 avoids panel-dependent calibration while suppressing baseline-offset variability through the first-derivative transformation, providing a more stable feature space for model training.
4.2. Mechanistic Interpretation of Substrate Dynamics Around Irrigation
Substrate moisture content and EC exhibited contrasting temporal patterns around irrigation events (Figure 7). Substrate moisture content rose rapidly after irrigation as water entered the substrate, then declined gradually over approximately 5 h through drainage and crop uptake. Substrate EC decreased more slowly as the incoming nutrient solution diluted the existing ions, then increased again as the crop absorbed water while the ions remained in the substrate, leading to relative ion concentration. This repeated pattern of irrigation-induced ion dilution and transpiration-driven ion concentration is consistent with the findings of Shin and Son [7], who reported similar dynamics in soilless paprika cultivation. The high contribution of relative humidity to both prediction targets (Figure 8a,b) can be related to this mechanism. When greenhouse humidity is low, atmospheric water demand increases and crop transpiration is accelerated, resulting in faster substrate moisture depletion and ion concentration simultaneously [28]. Humidity therefore functions not as a direct driver of substrate state change but as a proxy variable reflecting crop transpiration demand. Solar radiation influences substrate state indirectly through transpiration, but this pathway is already captured by humidity and temperature, which may explain its low contribution across most models. The limited contribution of irrigation status is attributed to recording only a binary on/off indicator without quantitative information such as flow rate or nutrient solution EC. Moon et al. [15] reported that incorporating quantitative fertigation information improved EC prediction in closed-loop soilless cultivation, supporting this interpretation.
4.3. Differential Predictability of Substrate EC and Moisture Content
Substrate EC was substantially more predictable than substrate moisture content across all models and input configurations, and the two targets differed markedly in how the spectral and environmental modalities contributed to prediction. For substrate EC, the spectral-only and environment-only inputs already reached comparable, high accuracy: the spectral-only configuration (S0) yielded R2 values of approximately 0.96 across most models, while the non-spectral baselines reached similar or slightly higher values, with 1D-CNN at NS1 and LSTM at NS5 both achieving R2 = 0.9713. The best spectral configuration (XGBoost at S1, R2 = 0.9710) did not exceed these baselines, and in the matched full-input comparison, SpecAtten-LSTM decreased slightly from R2 = 0.9699 at NS5 to R2 = 0.9642 at S5. These results indicate that the two modalities carry largely redundant information about substrate EC, such that either modality alone is sufficient and their fusion provides little additional benefit. Substrate moisture content showed the opposite pattern: the best non-spectral baseline (1D-CNN at NS1, R2 = 0.7152) did not reach the best spectral configuration, and the highest accuracy was obtained under the full multimodal configuration (S5, R2 = 0.7463). In the matched full-input comparison, adding the spectral modality increased performance from R2 = 0.6285 at NS5 to R2 = 0.7463 at S5, an improvement of approximately 0.12 in R2, indicating that the spectral modality contributed moisture-related information that the environmental and irrigation sequence alone did not capture.
The redundancy and high predictability of substrate EC are consistent with its slow, smoothly varying nature. EC integrates relatively long-timescale processes—nutrient supply, transpiration-driven ion concentration, and irrigation-induced dilution—forming a smooth time series that is strongly coupled to the prevailing greenhouse environmental state, particularly relative humidity [7]. The same physiological state is simultaneously expressed at the canopy level, where ion-stress- and chlorophyll-related changes produce detectable responses in the red-edge and NIR-plateau region; canopy reflectance in this region has been reported to respond to stress-induced physiological changes in greenhouse crops [12]. Because both the environmental sequence and the canopy spectrum encode this shared state, EC can be recovered from either modality. This behavior contrasts with recent UAV-based field studies in which incorporating environmental covariables with remote-sensing features improved soil salinity estimation relative to spectra-only models [29]. In the present soilless cultivation system, however, this additional benefit was not observed because either modality already provided sufficient information on its own.
Substrate moisture content nevertheless remained more difficult to predict than substrate EC in absolute terms, partly because of the spectral limitations of the camera. The 713–920 nm range did not encompass the principal leaf water absorption bands, the nearest of which lies near 970 nm, with stronger absorption features occurring at 1200 and 1450 nm [30,31]. Without these bands, the most direct spectral indicators of leaf water status were unavailable, limiting the attainable accuracy of substrate moisture estimation. Despite this limitation, the spectral modality still made a substantial and independent contribution to moisture prediction even without the 970 nm band. This demonstrates that canopy structural and physiological responses contain genuine moisture-related information beyond that provided by the environmental and irrigation sequence. This complementary benefit is consistent with previous UAV-based crop studies in which the fusion of spectral information with additional remote-sensing sources improved soil moisture estimation [32]. Because Ge et al. [17] achieved an R2 of 0.907 for topsoil moisture using hyperspectral data covering the 970 nm region, extending the spectral range to include this water absorption band would likely strengthen the contribution of spectral information and represents the most direct path toward improving substrate moisture prediction in future work.
4.4. Comparative Model Performance and Cross-Modal Attention
Despite their differing architectures, the five models showed highly comparable performance for substrate EC prediction. Because substrate EC could be recovered accurately from either the spectral or environmental modality alone (Section 4.3), all models converged to a narrow high-accuracy range, with the best R2 values differing by less than 0.004 across configurations. As a result, the additional representational capacity of the more elaborate fusion architectures had little opportunity to provide measurable gains, and model choice was largely inconsequential for this target. The notable exception was LSTM-Attention, which produced the lowest and most variable EC performance (R2 as low as 0.9072 at S0). Because its temporal self-attention mechanism operates over the relatively short environmental-irrigation sequence, the model may provide limited benefit when the sequential signal is weak and the spectral modality already contains sufficient predictive information. This observation suggests that temporal self-attention becomes advantageous primarily when the sequential input itself contains rich temporal patterns that can be selectively weighted.
For substrate moisture content, the architectural differences among models became much more important. In the spectral-only and single-variable configurations (S0–S4), simpler models with strong local or non-sequential inductive biases performed best, with XGBoost achieving the highest accuracy at S0 and 1D-CNN outperforming the other models at S1, S2, and S3. SpecAtten-LSTM achieved the highest accuracy only under the full multimodal configuration (S5), where it translated the simultaneous availability of four environmental channels and canopy spectral information into a clear performance gain (R2 = 0.7463), surpassing the tree-based, convolutional, recurrent, and temporal self-attention models. This result indicates that the proposed architecture is particularly effective when multiple complementary information sources are available.
This conditional and target-dependent benefit of cross-modal attention is consistent with recent plant phenotyping studies in which cross-attention mechanisms were used to capture complementary information from heterogeneous data sources [27]. To determine whether the S5 performance gain was specifically attributable to the cross-attention and fusion modules rather than other architectural components, we conducted the ablation analysis presented in Section 4.5.
4.5. Architectural Drivers of the SpecAtten-LSTM Performance Gain
To identify which components of SpecAtten-LSTM contributed to its performance, the full model was compared with three reduced variants. The first removed the learnable positional embedding (PosEmb). The second replaced the cross-attention module with mean pooling (CrossAtten). The third replaced the attention-based fusion module with late concatenation (Fusion). The comparison was conducted under the S1 and S5 input configurations (Table 7).
For substrate EC and for the S1 configuration, removing any of the three components had little effect. The R2 values across the variants remained close to those of the full model. The importance of the architectural components became evident only for substrate moisture content under the full multimodal configuration S5. Removing the cross-attention module reduced R2 from 0.7463 to 0.6804, and replacing attention-based fusion with late concatenation reduced R2 to 0.6786, corresponding to decreases of approximately 0.066 and 0.068, whereas removing the positional embedding produced almost no change in performance and resulted in an R2 of 0.7478.
These results strongly suggest that the performance gain observed for substrate moisture content under S5 was primarily driven by the cross-attention and fusion modules rather than by positional embedding or by the overall parameter count of the model. The result also supports the interpretation presented in Section 4.4. The benefit of the proposed architecture appears only when multiple complementary information sources must be integrated. In this study, that condition occurred only under S5, where four environmental variables and canopy spectral information were available simultaneously. The ablation study shows that the proposed architecture does not provide a consistent advantage across all targets and input configurations. However, in the one setting where multimodal fusion produced a clear improvement, the cross-attention and fusion modules were the key factors responsible for the gain.
4.6. Spectral Feature Attribution and Correspondence with Band-Level Correlations
The permutation importance analysis within each modality (Figure 8) revealed clear differences between the environmental and spectral inputs. Environmental feature importance was stable across models and random seeds. Relative humidity emerged as the dominant environmental variable for both targets. For substrate EC, humidity accounted for approximately 95 to 97% of the environmental importance in XGBoost, LSTM, LSTM-Attention, and SpecAtten-LSTM. The only exception was 1D-CNN, where importance was shared between humidity and temperature. For substrate moisture content, humidity remained the most important variable and accounted for approximately 60 to 85% of the total environmental importance. Temperature also contributed substantially to XGBoost, 1D-CNN, and SpecAtten-LSTM, whereas solar radiation and irrigation status had only minor contributions.
These patterns are consistent with the transpiration-driven mechanism discussed in Section 4.2. Relative humidity acts as a proxy for atmospheric water demand and influences both transpiration-driven ion concentration and substrate water depletion. The additional contribution of temperature to moisture prediction reflects the stronger dependence of water flux on the combined effects of temperature and humidity. The low importance of solar radiation suggests that its influence is expressed indirectly through temperature and humidity. The limited importance of irrigation status is likely related to its representation as a simple binary indicator. Because the environmental variables are correlated, permutation importance may underestimate the contribution of variables that share information with other predictors. Therefore, the importance values should be interpreted qualitatively rather than as exact quantitative contributions. Nevertheless, the dominance of relative humidity was consistently observed across models and random seeds, suggesting that this result reflects a robust signal rather than an artifact of the attribution method.
In contrast, the spectral importance patterns were considerably less stable. For several band pairs, the standard deviation was comparable to or greater than the mean importance value. This result indicates that no single spectral feature consistently dominated the prediction and that spectral attribution was sensitive to model initialization. Nevertheless, two consistent patterns emerged across the analyses. XGBoost concentrated importance on a small number of discriminative band pairs, particularly for moisture content and for EC. In contrast, the neural-network models distributed importance across multiple neighboring band differences within the red-edge and NIR plateau regions. This difference is consistent with the underlying modeling strategies. Tree-based models tend to rely on a limited number of highly discriminative features, whereas neural-network models often distribute information across many correlated inputs. SpecAtten-LSTM consistently assigned relatively high importance to within the transition region between the red-edge and NIR wavelengths for both targets. This finding suggests that the spectral query used in the cross-attention module learned a stable spectral reference point within this region. The spectral importance patterns corresponded only weakly with the single band correlations discussed in Section 4.1. This result is expected because the models rely on nonlinear relationships and interactions among bands rather than simple linear associations.
4.7. Limitations and Future Directions
This study has several limitations related to experimental coverage and validation scope. The dataset was collected from a single greenhouse, a single strawberry cultivar, and a relatively narrow phenological period using a chronological train–test split from one continuous acquisition period. Therefore, the reported performance should be interpreted as model performance under the monitored experimental conditions rather than as evidence of full cross-seasonal or site-independent generalizability. In addition, the substrate moisture content and EC labels represented the root-zone state of the monitored cultivation unit and were not independent measurements across multiple cultivation units or greenhouse environments. Future studies should include multiple cultivation pots, multiple substrate sensors, longer acquisition periods, and independent seasonal or greenhouse datasets to evaluate the spatial representativeness and generalizability of the proposed framework more rigorously.
In addition to expanding experimental validation, future work could consider recent advances in vision language models (VLMs) in precision agriculture. VLM-based approaches have introduced a complementary direction, particularly for zero-shot weed detection and visual reasoning from UAV-based RGB imagery [33]. Recent reviews have also highlighted the potential of large vision, language, and multimodal models for agricultural image analysis, remote sensing, and decision support [34]. These studies provide useful context for positioning the present framework within the broader landscape of multimodal artificial intelligence research.
The objective of the present study differs from that of VLM-based semantic perception. Whereas VLM-based approaches mainly address scene-level recognition, language-guided reasoning, and interpretable visual understanding, the present study focuses on the quantitative estimation of substrate moisture content and EC using canopy multispectral information and environmental time series data. Future studies could explore how spectral and environmental fusion models may complement VLM-based reasoning systems to provide more interpretable decision support for greenhouse crop management. Such integration remains beyond the scope of the present study and requires further validation.
5. Conclusions
This study developed a multimodal prediction framework for estimating substrate moisture content and electrical conductivity (EC) in greenhouse strawberry soilless cultivation by integrating canopy multispectral imaging with greenhouse environmental and irrigation time-series data. Among four spectral preprocessing schemes, the first derivative of digital number values (DN_D1) yielded the most balanced and informative localized spectral responses, particularly in the short-wavelength red-edge region. Therefore, DN_D1 was used as the main preprocessing condition for comparing input configurations, model architectures, and feature contributions.
Comparison of the spectral input configurations with the non-spectral baselines revealed distinct patterns for the two target variables. Substrate EC was predicted with high accuracy from either modality alone. Under DN_D1 preprocessing, the extreme gradient boosting (XGBoost) model achieved the highest substrate EC accuracy (R2 = 0.9710) using the spectral-plus-temperature input configuration (S1), and the environment-only baselines achieved comparable performance. This result suggests that both the spectral and environmental modalities contain sufficient information for EC prediction. In contrast, substrate moisture content showed the highest performance when spectral and environmental information were combined. Also under DN_D1 preprocessing, the proposed SpecAtten-LSTM model achieved the highest substrate moisture content accuracy (R2 = 0.7463) using the full multimodal input configuration (S5), outperforming all non-spectral baselines. The ablation analysis showed that this improvement was associated with the cross-attention and fusion modules and appeared only when all environmental variables and canopy spectral information were available simultaneously. Overall, the results suggest that canopy spectral information and environmental irrigation sequences contribute differently depending on the prediction target and that the most effective combination of inputs varies between substrate EC and moisture content.
Permutation importance analysis showed that relative humidity was the most influential auxiliary environmental variable for both substrate moisture content and EC prediction across most models. This result is consistent with the role of humidity as a proxy for atmospheric water demand and for transpiration-related processes associated with substrate water depletion and ion concentration. Air temperature contributed additionally to moisture content prediction, whereas solar radiation and irrigation status showed lower and more model-dependent contributions. The limited contribution of irrigation status likely reflects its representation as a binary variable that does not capture irrigation volume, flow rate, nutrient solution EC, or drainage response.
Overall, the results indicate that canopy multispectral information and environmental data can be integrated to estimate root-zone substrate conditions non-destructively, with the greatest benefit observed for substrate moisture content prediction.
Supplementary Materials
The following supporting information can be downloaded at: https://www.mdpi.com/article/10.3390/agronomy16131287/s1, Table S1: Substrate EC prediction performance across five models and six spectral input configurations (S0–S5) under Digital Number preprocessing; Table S2: Substrate EC prediction performance across five models and six spectral input configurations (S0–S5) under gray reference panel corrected relative reflectance preprocessing; Table S3: Substrate EC prediction performance across five models and six spectral input configurations (S0–S5) under the first derivative of gray reference panel corrected relative reflectance preprocessing; Table S4: Lookback sensitivity of substrate EC prediction under DN_D1 preprocessing and the S5 input combination; Table S5: Substrate moisture prediction performance across five models and six spectral input configurations (S0–S5) under Digital Number preprocessing; Table S6: Substrate moisture prediction performance across five models and six spectral input configurations (S0–S5) under gray reference panel corrected relative reflectance preprocessing; Table S7: Substrate moisture prediction performance across five models and six spectral input configurations (S0–S5) under the first derivative of gray reference panel corrected relative reflectance preprocessing; Table S8: Lookback sensitivity of substrate moisture prediction under DN_D1 preprocessing and the S5 input combination.
Author Contributions
Conceptualization, C.-W.C. and D.-H.J.; methodology, C.-W.C. and D.-H.J.; software, C.-W.C.; validation, C.-W.C. and K.-H.L.; formal analysis, C.-W.C.; investigation, C.-W.C. and S.-M.C.; resources D.-H.J.; data curation, D.-H.J. and K.-H.L. and S.-M.C.; writing—original draft preparation, C.-W.C.; writing—review and editing, D.-H.J.; visualization, C.-W.C.; supervision, D.-H.J.; project administration, D.-H.J. and K.-H.L.; funding acquisition, D.-H.J. All authors have read and agreed to the published version of the manuscript.
Funding
This research was funded by [Gyeonggi Technology Development Program by Gyeonggi Province] grant number [D2510010].
Data Availability Statement
The data presented in this study are available on request from the corresponding author. Due to the proprietary nature and research value of the dataset, data sharing will be considered on a case-by-case basis.
Acknowledgments
This research was supported by a grant(D2510010) from Gyeonggi Technology Development Program funded by Gyeonggi Province.
Conflicts of Interest
Author Kyeong-Ha Lee was employed by the company Rowain Co., Ltd. The remaining authors declare that the research was conducted in the absence of any commercial or financial relationships that could be construed as a potential conflict of interest.
References
- Fanourakis, D.; Tsaniklidis, G.; Makraki, T.; Nikoloudakis, N.; Bartzanas, T.; Sabatino, L.; Fatnassi, H.; Ntatsi, G. Climate Change Impacts on Greenhouse Horticulture in the Mediterranean Basin: Challenges and Adaptation Strategies. Plants 2025, 14, 3390. [Google Scholar] [CrossRef] [Scilit] [PubMed]
- Vatistas, C.; Avgoustaki, D.D.; Bartzanas, T. A Systematic Literature Review on Controlled-Environment Agriculture: How Vertical Farms and Greenhouses Can Influence the Sustainability and Footprint of Urban Microclimate with Local Food Production. Atmosphere 2022, 13, 1258. [Google Scholar] [CrossRef] [Scilit]
- Dsouza, A.; Newman, L.; Graham, T.; Fraser, E.D.G. Exploring the Landscape of Controlled Environment Agriculture Research: A Systematic Scoping Review of Trends and Topics. Agric. Syst. 2023, 209, 103673. [Google Scholar] [CrossRef] [Scilit]
- FAOSTAT. Crops and Livestock Products; Food and Agriculture Organization of the United Nations: Rome, Italy, 2025. [Google Scholar]
- Hutchinson, G.K.; Nguyen, L.X.; Ames, Z.R.; Nemali, K.; Ferrarezi, R.S. Substrate System Outperforms Water-Culture Systems for Hydroponic Strawberry Production. Front. Plant Sci. 2025, 16, 1469430. [Google Scholar] [CrossRef] [Scilit] [PubMed]
- Pardossi, A.; Incrocci, L.; Salas, M.C.; Gianquinto, G. Managing Mineral Nutrition in Soilless Culture. In Rooftop Urban Agriculture; Orsini, F., Dubbeling, M., de Zeeuw, H., Gianquinto, G., Eds.; Springer International Publishing: Cham, Switzerland, 2017; pp. 147–166. ISBN 978-3-319-57720-3. [Google Scholar]
- Shin, J.H.; Son, J.E. Changes in Electrical Conductivity and Moisture Content of Substrate and Their Subsequent Effects on Transpiration Rate, Water Use Efficiency, and Plant Growth in the Soilless Culture of Paprika (Capsicum annuum L.). Hortic. Environ. Biotechnol. 2015, 56, 178–185. [Google Scholar] [CrossRef] [Scilit]
- Criscione, K.S.; Owen, J.S.; Fields, J.S. Stratified Soilless Substrates Decrease the Vertical Gravitational Water Gradient Altering Helianthus Root Morphology. Plant Soil 2025, 514, 287–307. [Google Scholar] [CrossRef] [Scilit]
- Ding, X.; Jiang, Y.; Zhao, H.; Guo, D.; He, L.; Liu, F.; Zhou, Q.; Nandwani, D.; Hui, D.; Yu, J. Electrical Conductivity of Nutrient Solution Influenced Photosynthesis, Quality, and Antioxidant Enzyme Activity of Pakchoi (Brassica campestris L. Ssp. Chinensis) in a Hydroponic System. PLoS ONE 2018, 13, e0202090. [Google Scholar] [CrossRef] [Scilit] [PubMed]
- Hardie, M. Review of Novel and Emerging Proximal Soil Moisture Sensors for Use in Agriculture. Sensors 2020, 20, 6934. [Google Scholar] [CrossRef] [Scilit] [PubMed]
- Rinn, P.; Boruta, F.; Czermak, P.; Ebrahimi, M. Fouling Control of Ion-Selective Electrodes (ISEs) in Aquatic and Aquacultural Environments: A Comprehensive Review. Sensors 2025, 25, 7515. [Google Scholar] [CrossRef] [Scilit] [PubMed]
- Katsoulas, N.; Elvanidi, A.; Ferentinos, K.P.; Kacira, M.; Bartzanas, T.; Kittas, C. Crop Reflectance Monitoring as a Tool for Water Stress Detection in Greenhouses: A Review. Biosyst. Eng. 2016, 151, 374–398. [Google Scholar] [CrossRef] [Scilit]
- Mohd Asaari, M.S.; Mertens, S.; Verbraeken, L.; Dhondt, S.; Inzé, D.; Bikram, K.; Scheunders, P. Non-Destructive Analysis of Plant Physiological Traits Using Hyperspectral Imaging: A Case Study on Drought Stress. Comput. Electron. Agric. 2022, 195, 106806. [Google Scholar] [CrossRef] [Scilit]
- Xu, K.; Ye, H. Light Scattering in Stacked Mesophyll Cells Results in Similarity Characteristic of Solar Spectral Reflectance and Transmittance of Natural Leaves. Sci. Rep. 2023, 13, 4694. [Google Scholar] [CrossRef] [Scilit] [PubMed]
- Moon, T.; Ahn, T.I.; Son, J.E. Forecasting Root-Zone Electrical Conductivity of Nutrient Solutions in Closed-Loop Soilless Cultures via a Recurrent Neural Network Using Environmental and Cultivation Information. Front. Plant Sci. 2018, 9, 859. [Google Scholar] [CrossRef] [Scilit] [PubMed]
- Silva, M.; Matheny, A.M.; Pauwels, V.R.N.; Triadis, D.; Missik, J.E.; Bohrer, G.; Daly, E. Tree Hydrodynamic Modelling of the Soil–Plant–Atmosphere Continuum Using FETCH3. Geosci. Model. Dev. 2022, 15, 2619–2634. [Google Scholar] [CrossRef] [Scilit]
- Ge, X.; Wang, J.; Ding, J.; Cao, X.; Zhang, Z.; Liu, J.; Li, X. Combining UAV-Based Hyperspectral Imagery and Machine Learning Algorithms for Soil Moisture Content Monitoring. PeerJ 2019, 7, e6926. [Google Scholar] [CrossRef] [Scilit] [PubMed]
- Whitney, K.; Scudiero, E.; El-Askary, H.M.; Skaggs, T.H.; Allali, M.; Corwin, D.L. Validating the Use of MODIS Time Series for Salinity Assessment over Agricultural Soils in California, USA. Ecol. Indic. 2018, 93, 889–898. [Google Scholar] [CrossRef] [Scilit]
- Ge, X.; Ding, J.; Teng, D.; Wang, J.; Huo, T.; Jin, X.; Wang, J.; He, B.; Han, L. Updated Soil Salinity with Fine Spatial Resolution and High Accuracy: The Synergy of Sentinel-2 MSI, Environmental Covariates and Hybrid Machine Learning Approaches. Catena 2022, 212, 106054. [Google Scholar] [CrossRef] [Scilit]
- Tagliavini, M.; Baldi, E.; Lucchi, P.; Antonelli, M.; Sorrenti, G.; Baruzzi, G.; Faedi, W. Dynamics of Nutrients Uptake by Strawberry Plants (Fragaria × Ananassa Dutch.) Grown in Soil and Soilless Culture. Eur. J. Agron. 2005, 23, 15–25. [Google Scholar] [CrossRef] [Scilit]
- Kirillov, A.; Mintun, E.; Ravi, N.; Mao, H.; Rolland, C.; Gustafson, L.; Xiao, T.; Whitehead, S.; Berg, A.C.; Lo, W.-Y.; et al. Segment Anything. In Proceedings of the IEEE/CVF International Conference on Computer Vision 2023, Paris, France, 2–3 October 2023; pp. 4015–4026. [Google Scholar]
- Hochreiter, S.; Schmidhuber, J. Long Short-Term Memory. Neural Comput. 1997, 9, 1735–1780. [Google Scholar] [CrossRef] [Scilit] [PubMed]
- Yang, Z.; Yang, D.; Dyer, C.; He, X.; Smola, A.; Hovy, E. Hierarchical Attention Networks for Document Classification. In Proceedings of the 2016 Conference of the North American Chapter of the Association for Computational Linguistics: Human Language Technologies; Knight, K., Nenkova, A., Rambow, O., Eds.; Association for Computational Linguistics: San Diego, CA, USA, 2016; pp. 1480–1489. [Google Scholar]
- Chen, T.; Guestrin, C. XGBoost: A Scalable Tree Boosting System. In Proceedings of the 22nd ACM SIGKDD International Conference on Knowledge Discovery and Data Mining; Association for Computing Machinery: New York, NY, USA, 2016; Available online: https://dl.acm.org/doi/abs/10.1145/2939672.2939785 (accessed on 29 April 2026).
- Acquarelli, J.; van Laarhoven, T.; Gerretzen, J.; Tran, T.N.; Buydens, L.M.C.; Marchiori, E. Convolutional Neural Networks for Vibrational Spectroscopic Data Analysis. Anal. Chim. Acta 2017, 954, 22–31. [Google Scholar] [CrossRef] [Scilit] [PubMed]
- Vaswani, A.; Shazeer, N.; Parmar, N.; Uszkoreit, J.; Jones, L.; Gomez, A.N.; Kaiser, L.; Polosukhin, I. Attention Is All You Need. In Proceedings of the 31st Conference on Neural Information Processing Systems (NeurIPS 2017), Long Beach, CA, USA, 4–9 December 2017. [Google Scholar]
- Cheng, Z.; Cheng, Y.; Fang, T.; Zhu, M.; Liu, J.; Qi, P.; Zhang, Q. Multimodal Cross-Attention Network for Overgrowth Detection in Strawberry Seedlings. Front. Plant Sci. 2026, 16, 1706694. [Google Scholar] [CrossRef] [Scilit] [PubMed]
- Zhang, D.; Du, Q.; Zhang, Z.; Jiao, X.; Song, X.; Li, J. Vapour Pressure Deficit Control in Relation to Water Transport and Water Productivity in Greenhouse Tomato Production during Summer. Sci. Rep. 2017, 7, 43461. [Google Scholar] [CrossRef] [Scilit] [PubMed]
- Ma, W.; Han, W.; Cui, X.; Zhang, H.; Zhang, L.; Dong, Y.; Zhai, X. Soil Salinity Estimation Incorporating Environmental Covariables Using UAV Remote Sensing for Precision Field Management. Comput. Electron. Agric. 2025, 237, 110532. [Google Scholar] [CrossRef] [Scilit]
- Peñuelas, J.; Filella, I.; Biel, C.; Serrano, L.; Savé, R. The Reflectance at the 950–970 Nm Region as an Indicator of Plant Water Status. Int. J. Remote Sens. 1993, 14, 1887–1905. [Google Scholar] [CrossRef] [Scilit]
- Clevers, J.G.P.W.; Kooistra, L.; Schaepman, M.E. Using Spectral Information from the NIR Water Absorption Features for the Retrieval of Canopy Water Content. Int. J. Appl. Earth Obs. Geoinf. 2008, 10, 388–397. [Google Scholar] [CrossRef] [Scilit]
- Shi, H.; Liu, Z.; Li, S.; Jin, M.; Tang, Z.; Sun, T.; Liu, X.; Li, Z.; Zhang, F.; Xiang, Y. Monitoring Soybean Soil Moisture Content Based on UAV Multispectral and Thermal-Infrared Remote-Sensing Information Fusion. Plants 2024, 13, 2417. [Google Scholar] [CrossRef] [Scilit] [PubMed]
- Nasir, M.F.; Rehman, M.U.; Hussain, I. Vision-Language Models for Zero-Shot Weed Detection and Visual Reasoning in UAV-Based Precision Agriculture. Front. Plant Sci. 2026, 16, 1735096. [Google Scholar] [CrossRef] [Scilit] [PubMed]
- Zhu, H.; Qin, S.; Su, M.; Lin, C.; Li, A.; Gao, J. Harnessing Large Vision and Language Models in Agriculture: A Review. Front. Plant Sci. 2025, 16, 1579355. [Google Scholar] [CrossRef] [Scilit] [PubMed]
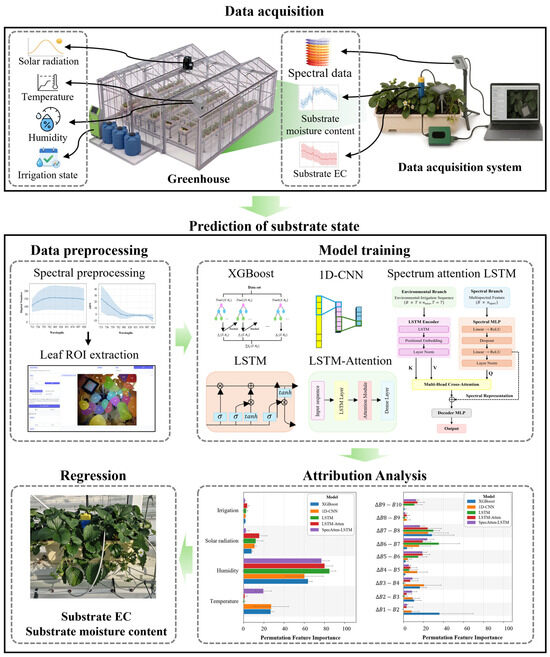
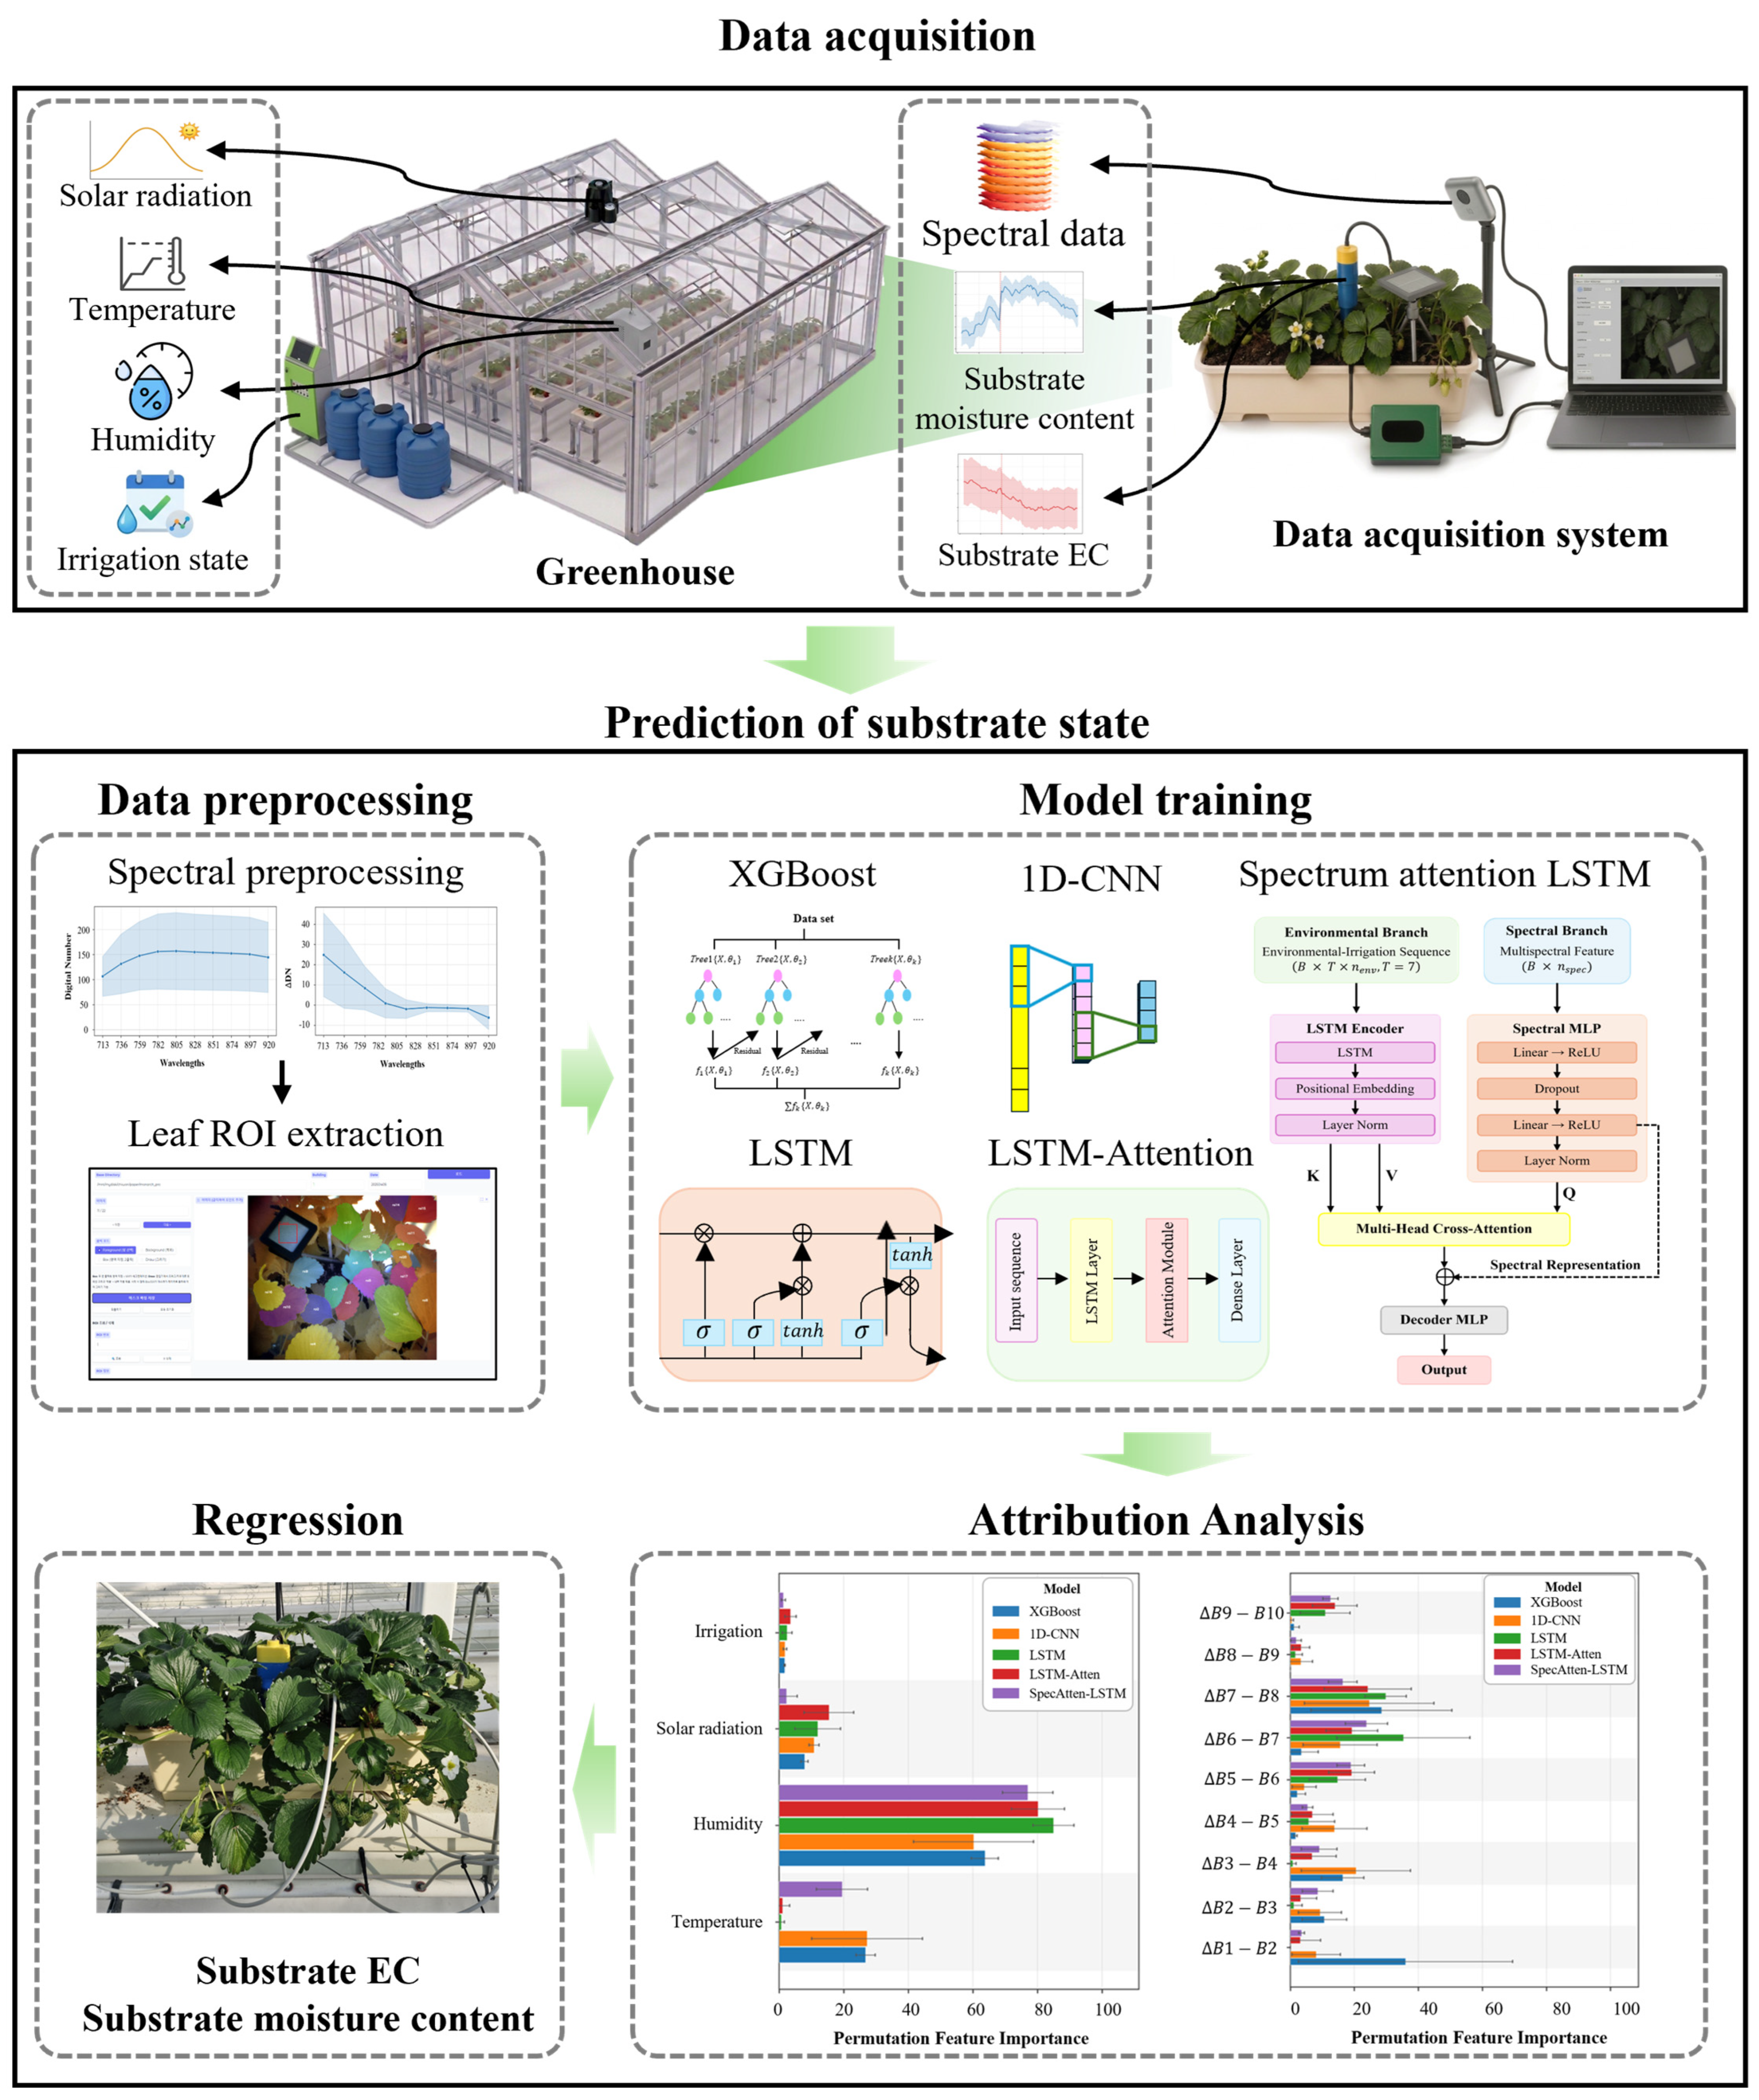
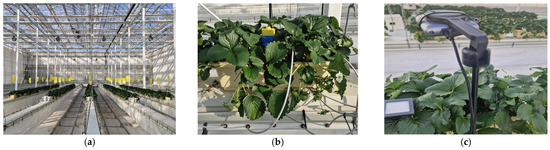
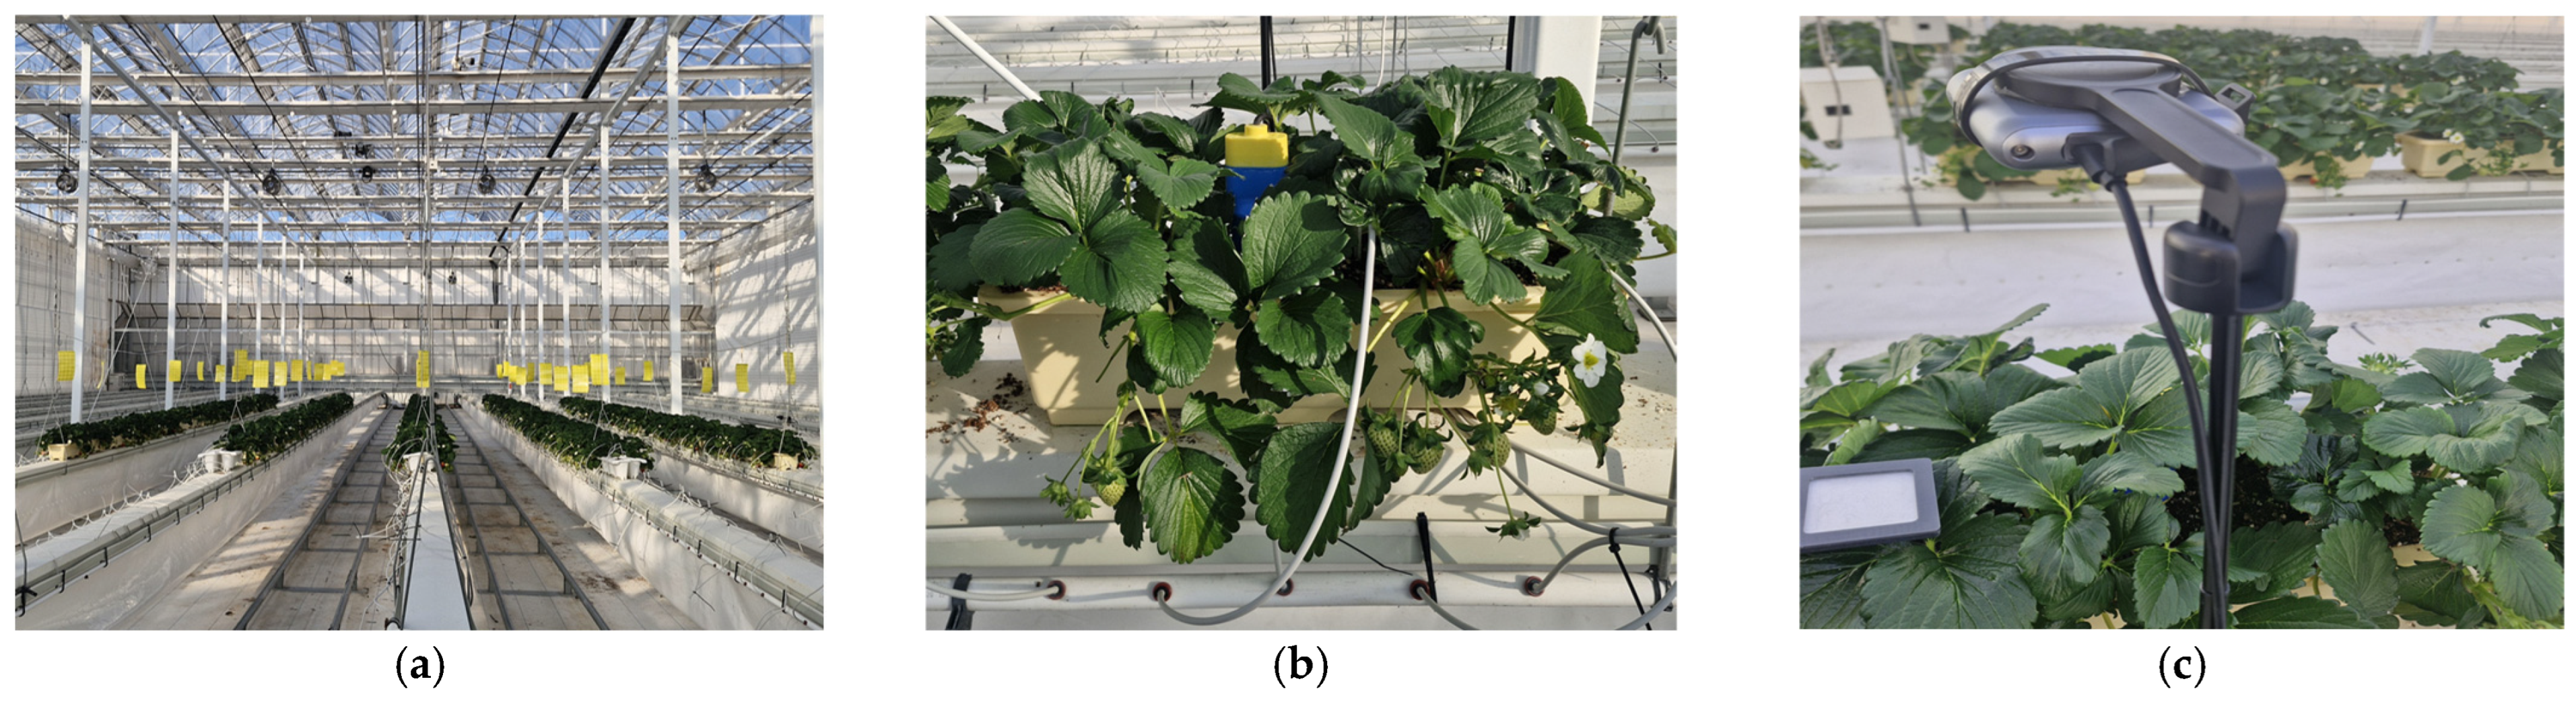
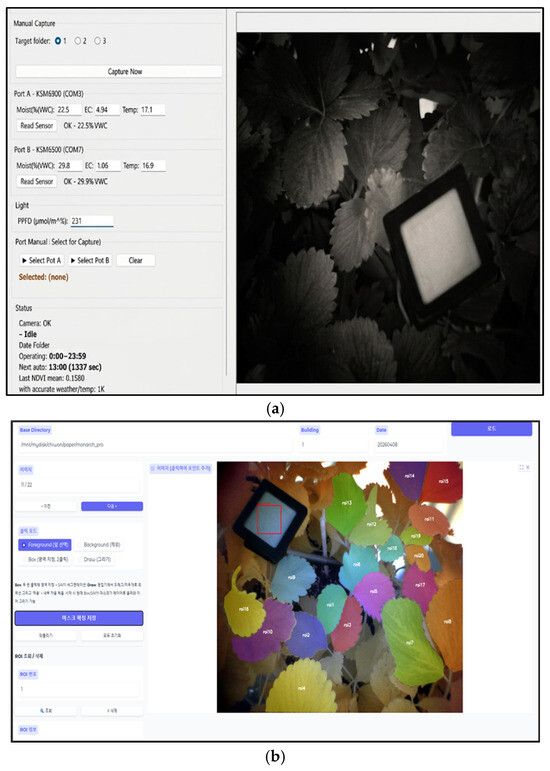
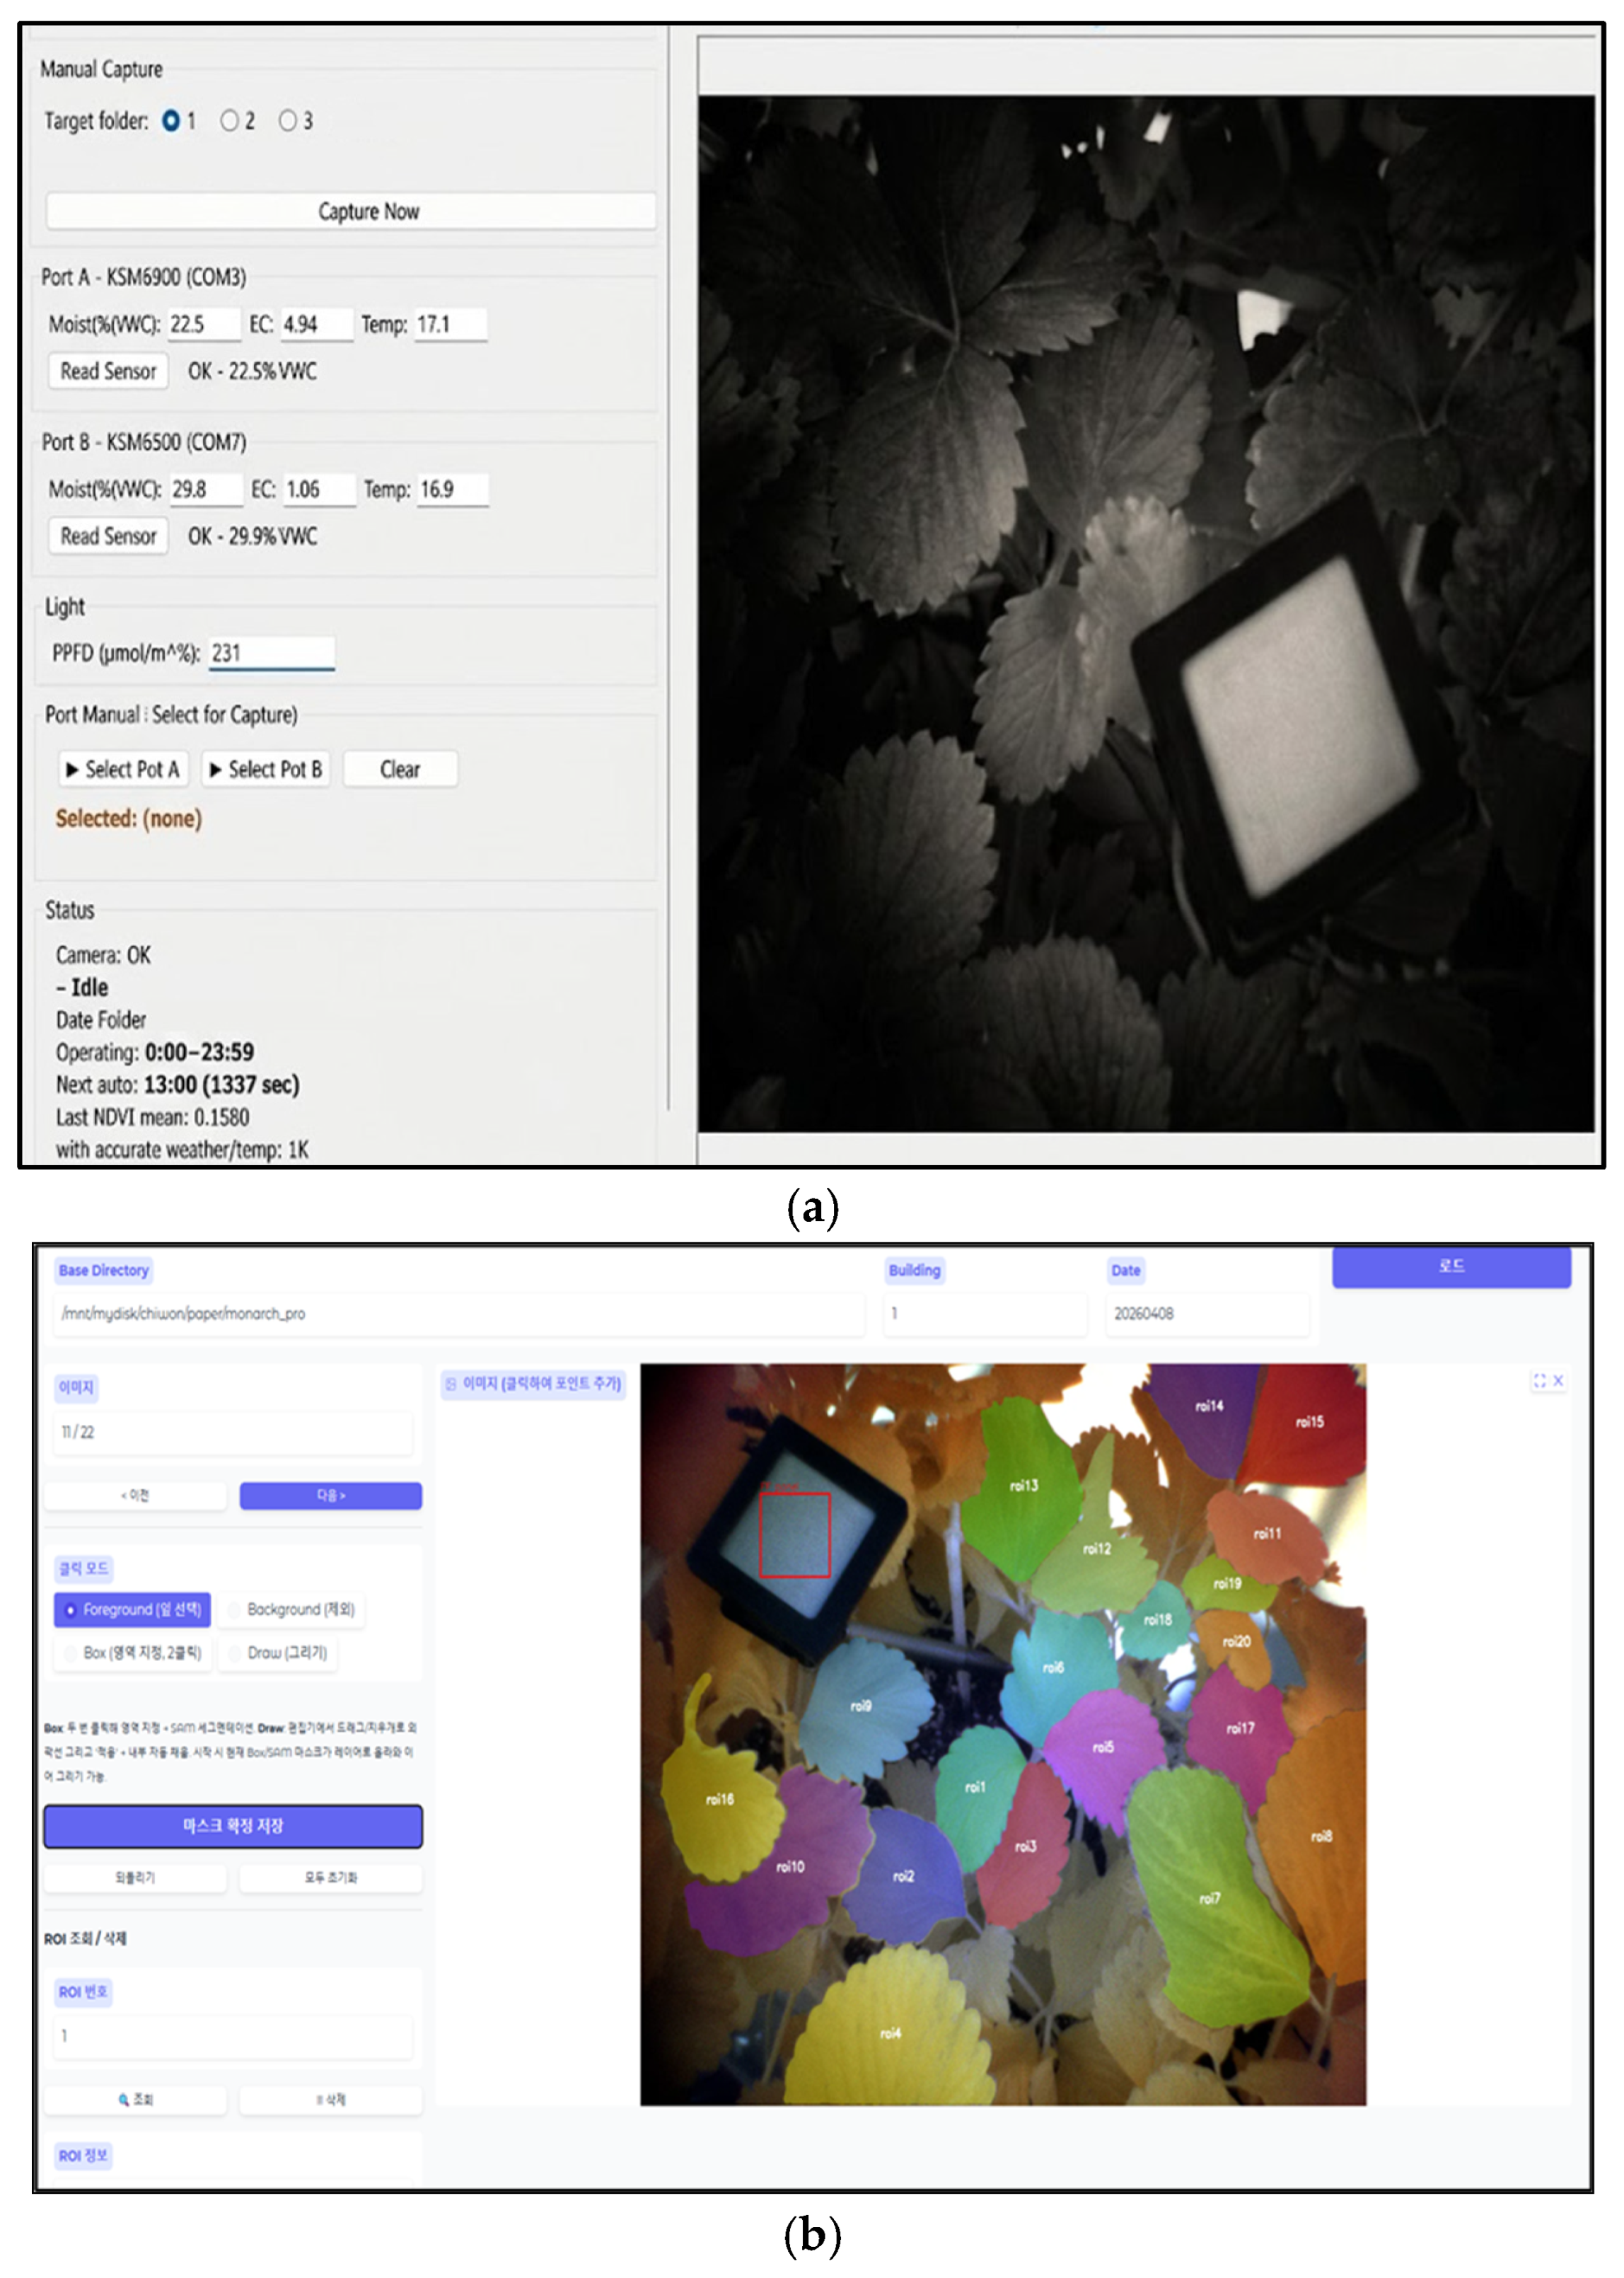
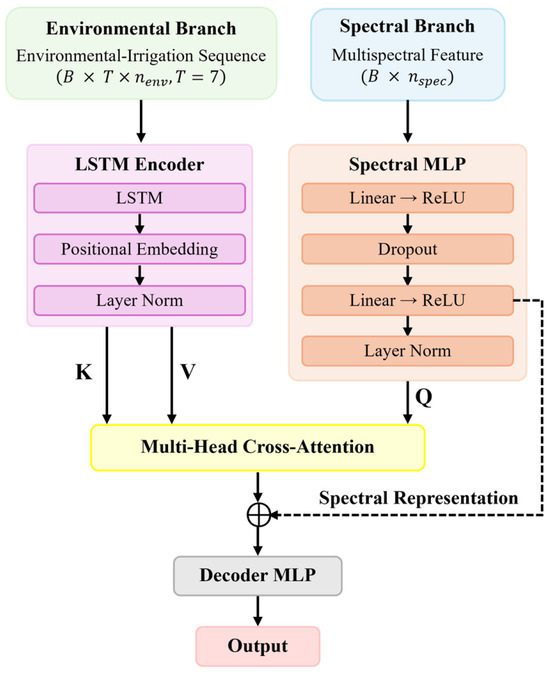
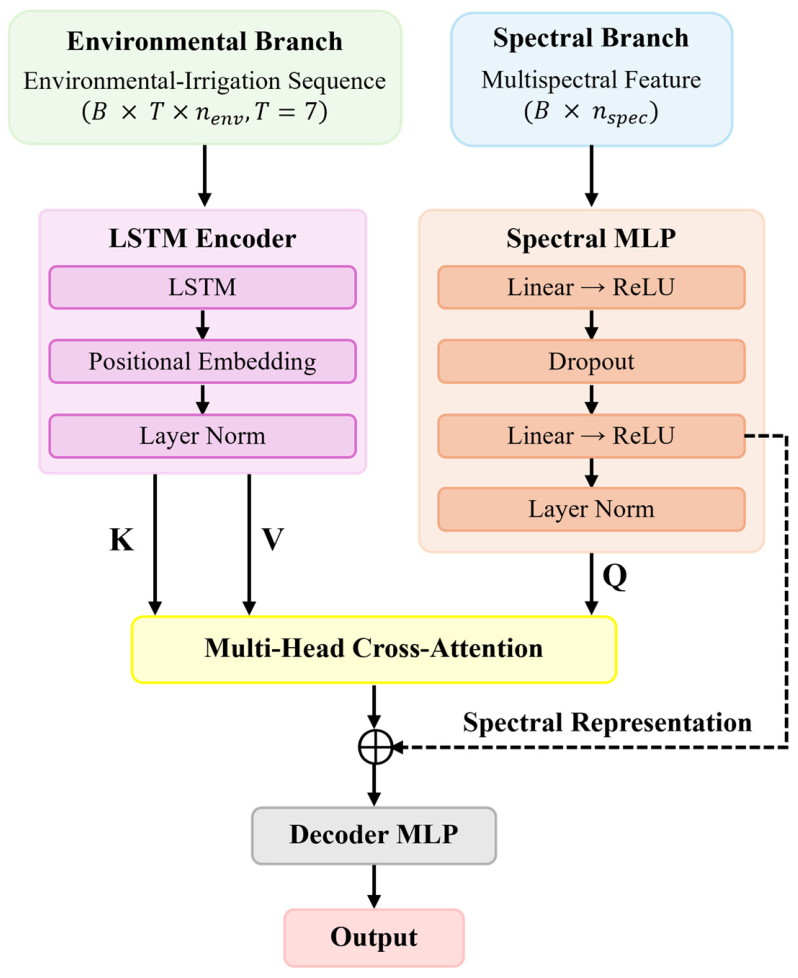
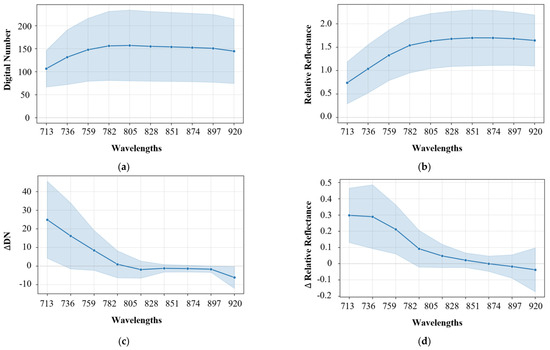
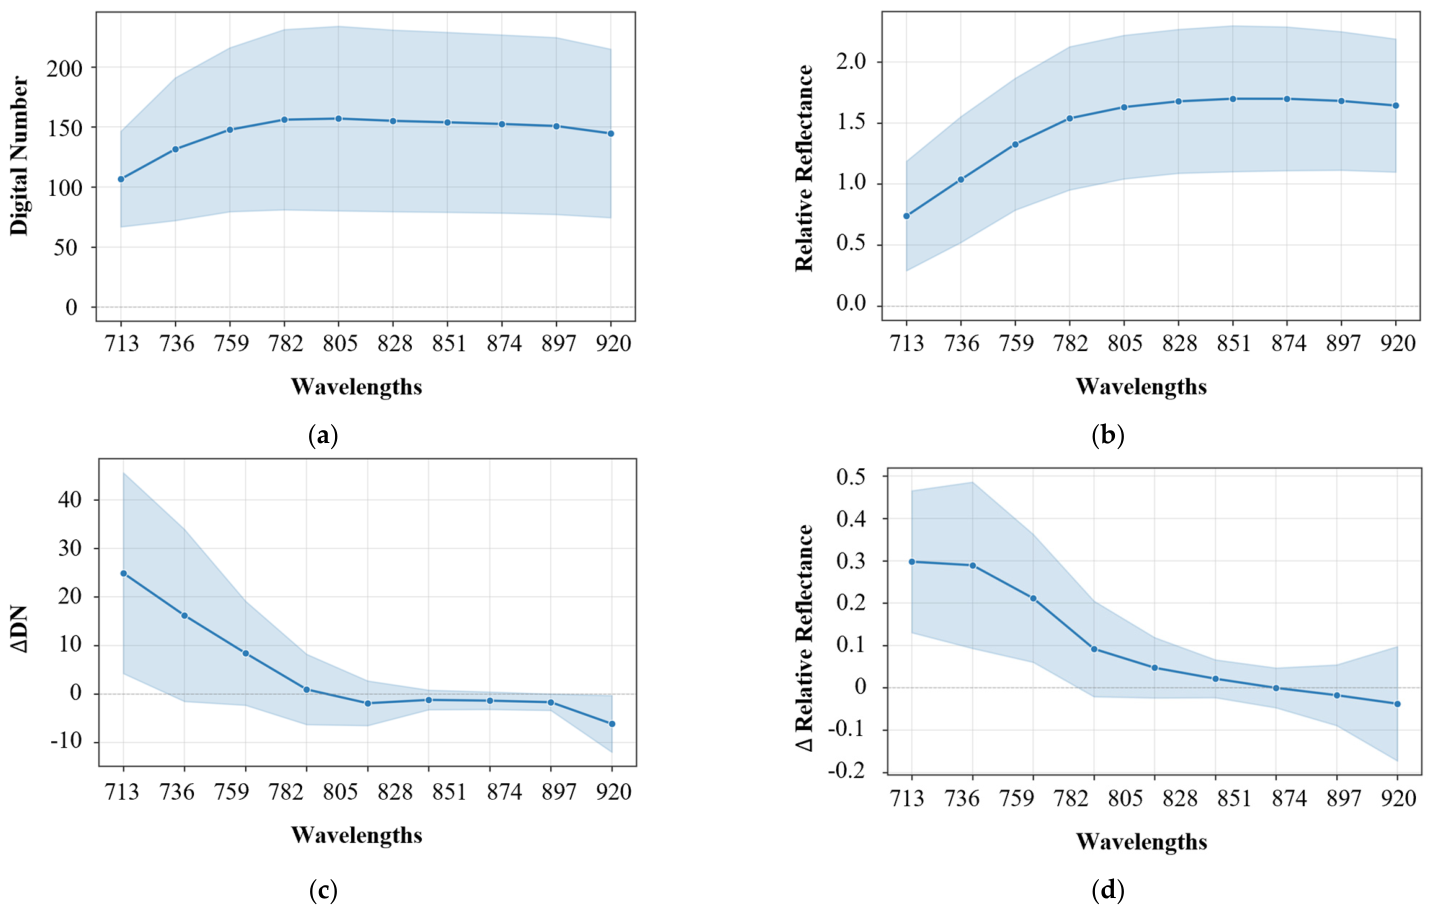
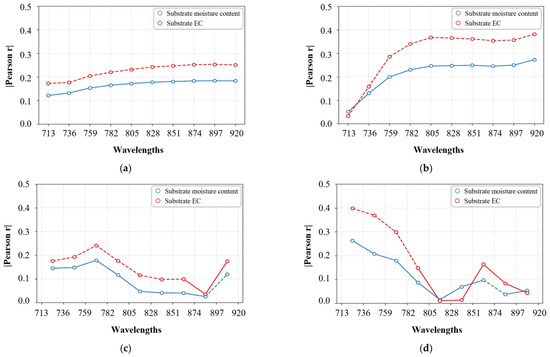
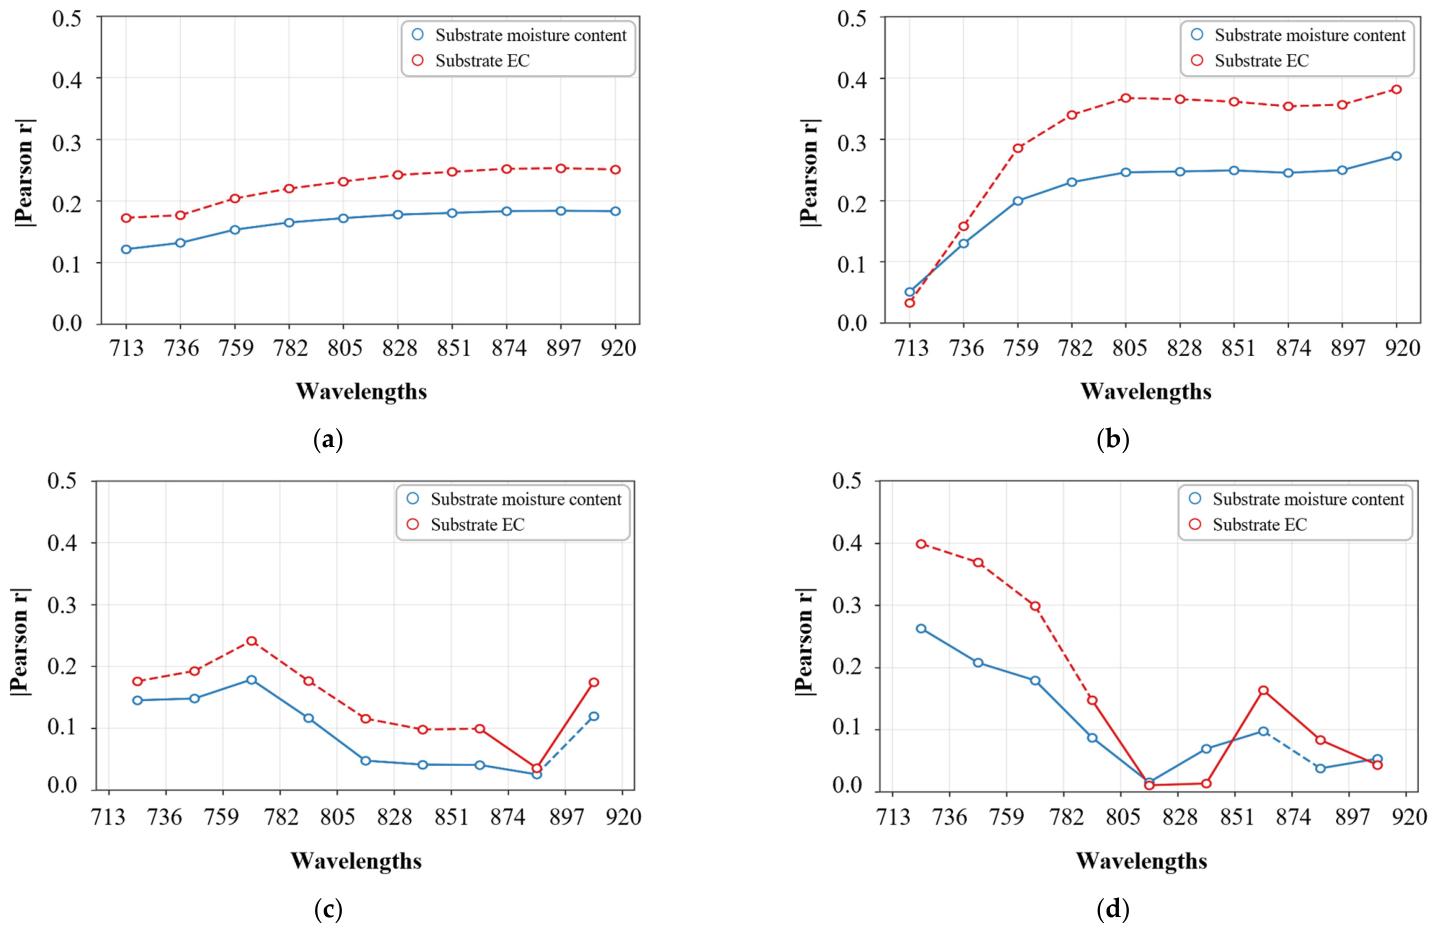
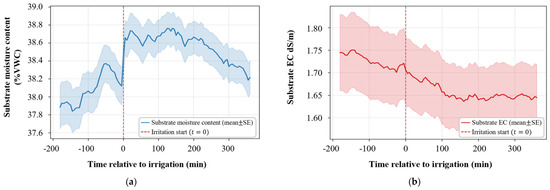
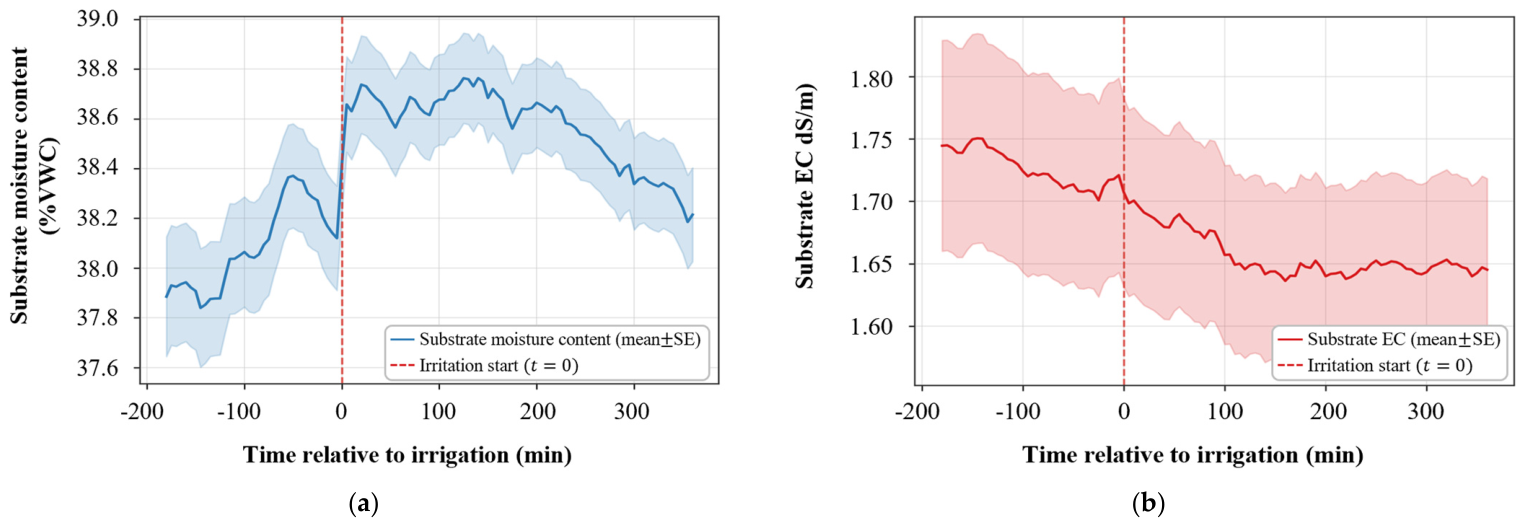
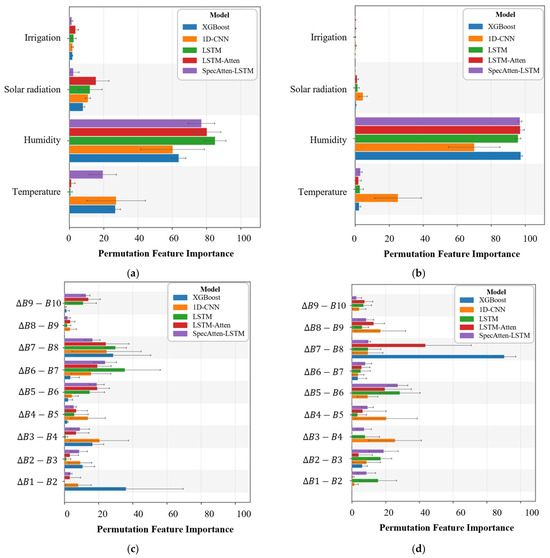
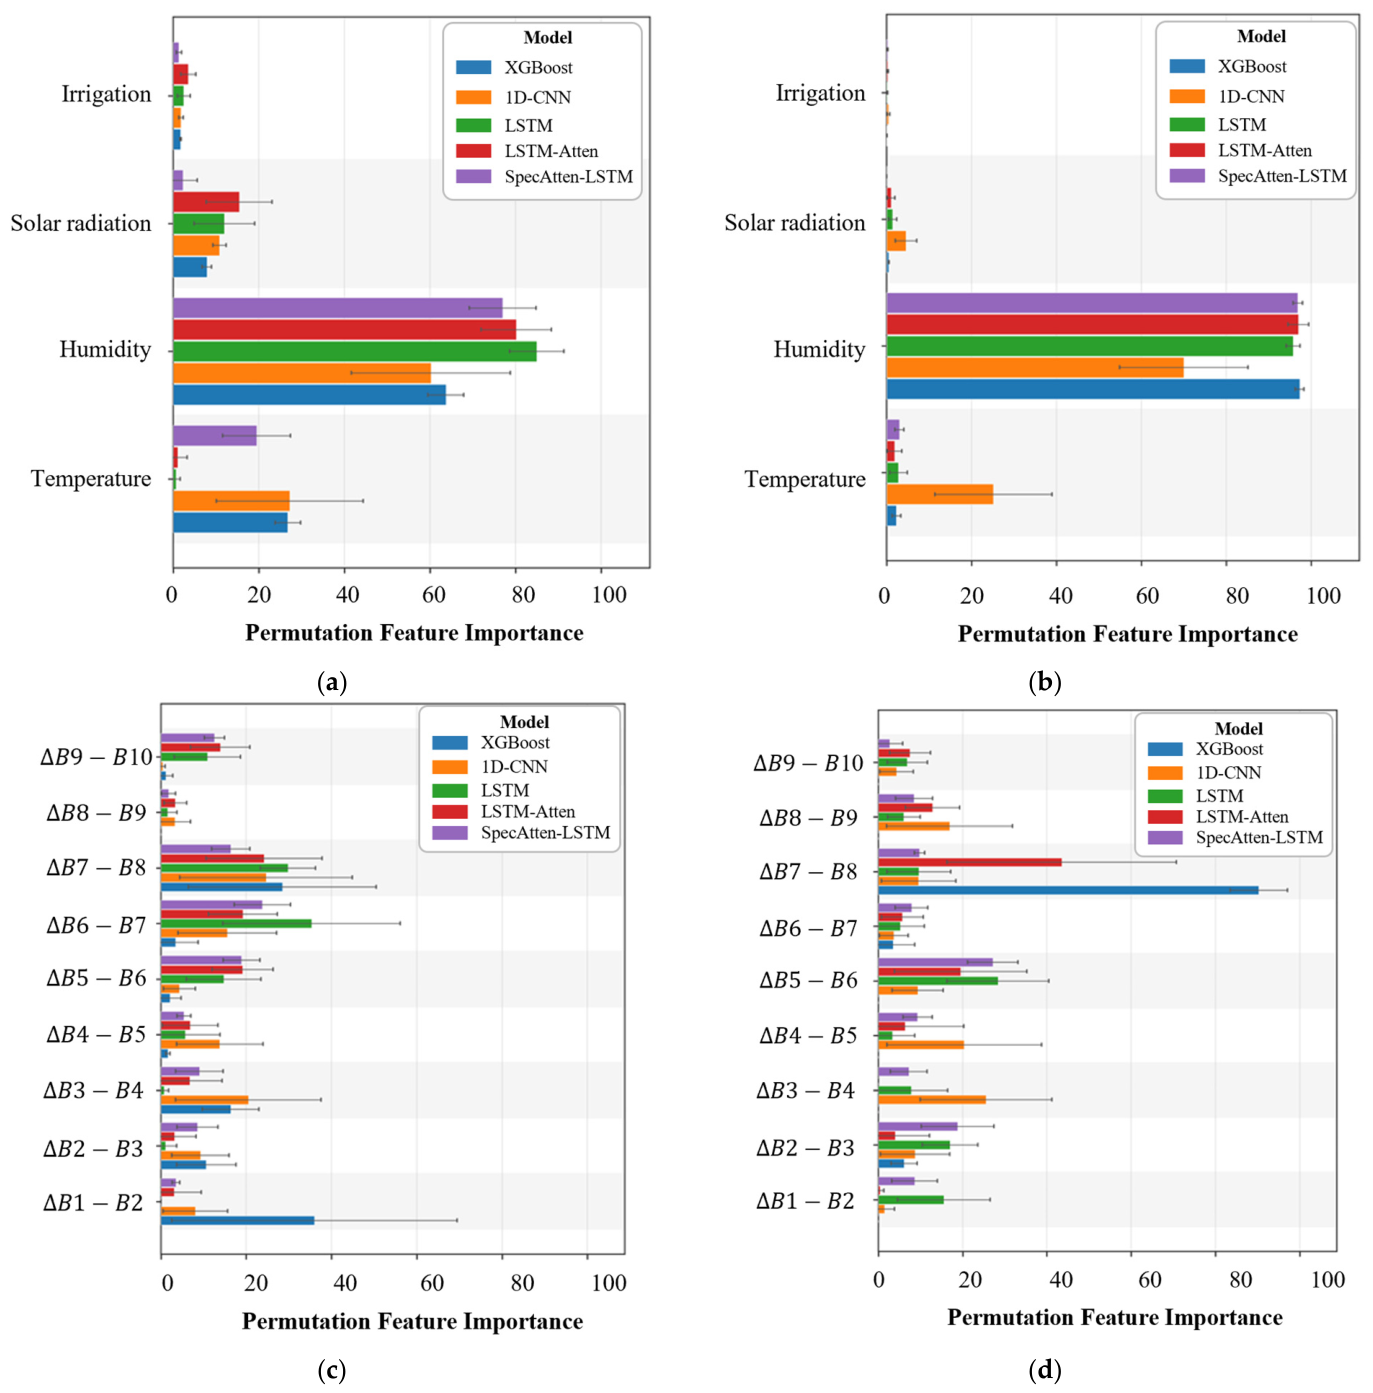

Disclaimer/Publisher’s Note: The statements, opinions and data contained in all publications are solely those of the individual author(s) and contributor(s) and not of MDPI and/or the editor(s). MDPI and/or the editor(s) disclaim responsibility for any injury to people or property resulting from any ideas, methods, instructions or products referred to in the content. |
© 2026 by the authors. Licensee MDPI, Basel, Switzerland. This article is an open access article distributed under the terms and conditions of the Creative Commons Attribution (CC BY) license.