


Abstract
To clarify the effects of biochar application on leaf photosynthesis, dry matter accumulation, and productivity in a maize–soybean intercropping system, a two-year field experiment was conducted in the Yellow River irrigation area of Inner Mongolia from 2024 to 2025. A split-plot design was adopted with two biochar application rates (0 and 5 t ha−1) and three cropping patterns, including maize monoculture, soybean monoculture, and maize–soybean 2:4 intercropping. Leaf SPAD values, photosynthetic characteristics (Pn, Tr, Gs, and Ci), yield components, and land equivalent ratio (LER) were determined. Compared with maize monoculture, intercropping significantly increased maize SPAD values at the V12 and VT stages by 12.80% and 13.39% in 2024 and by 15.41% and 20.58% in 2025, respectively, and enhanced maize Pn, Tr, and Gs at the V12 and R1 stages. Soybean showed greater sensitivity to intercropping, with reduced SPAD values, Pn, Tr, and Gs during the branching, flowering, and pod-setting stages, whereas biochar application partially alleviated these inhibitory effects. Intercropping increased maize kernel number per ear and thousand-kernel weight but reduced soybean effective plant density, grain number per plant, and grain yield. Biochar application improved the grain yield of both intercropped maize and soybean. Under biochar application, the LER values reached 1.04 in 2024 and 1.21 in 2025, indicating a clear advantage in land-use efficiency. Overall, biochar application and maize–soybean intercropping were associated with improved photosynthetic performance, higher land-use efficiency, and increased system productivity.
1. Introduction
Maize and soybean are important food and feed crops, and their stable production plays a fundamental role in ensuring food security and feed supply [1,2]. Constrained by limited arable land resources and relatively uniform cropping systems, conventional monoculture still shows considerable potential for improvement in resource use efficiency and system productivity [1,3]. In contrast, maize–soybean intercropping, through temporal and spatial niche differentiation between crop species, can substantially enhance the synergistic utilization of light, heat, water and nutrient resources [4,5] and improve system production stability by optimizing population structure [6]. Studies have demonstrated that properly configured intercropping patterns can increase output per unit area without additional resource input [7,8], representing an important pathway toward green and efficient agricultural production. This is particularly relevant in agricultural regions with strong resource constraints, where the development of highly efficient intercropping systems is of great significance for enhancing sustainable agricultural productivity [1,9].
However, the yield-increasing potential of intercropping systems is largely governed by interspecific competition. Owing to the considerable advantages of maize in plant height, leaf area expansion and canopy structure, its preferential interception of light resources can markedly deteriorate the light environment for the lower-stratum soybean [10,11]. Research has shown that in maize–soybean intercropping systems, soybean often suffers from reduced photosynthetic capacity, impaired leaf function and decreased biomass accumulation due to shading [10,12]. Meanwhile, belowground competition for soil nutrients can further intensify this asymmetric interaction, thereby compromising the overall productivity of the system [13]. Therefore, alleviating interspecific competition and strengthening resource complementarity through cultivation management is a key scientific issue for improving the production efficiency of maize–soybean intercropping systems [7].
Biochar, a carbon-rich material produced by the pyrolysis of biomass under oxygen-limited conditions, is characterized by a well-developed pore structure, large specific surface area and strong chemical stability [14,15]. Numerous studies have shown that biochar application can significantly improve soil structure and enhance water and nutrient retention capacity [16,17], while also increasing nutrient availability and crop uptake efficiency by modulating soil microbial communities and enzyme activities [18,19]. Moreover, biochar can promote crop growth, development and dry matter accumulation by ameliorating the rhizosphere microenvironment and regulating soil hydrothermal conditions [20]. In intercropping systems, the introduction of biochar is considered to help alleviate resource constraints and optimize interspecific competition relationships, thus reinforcing system production advantages [20,21].
Nevertheless, existing research has mostly focused on single crops or individual processes, and a systematic understanding is still lacking regarding how biochar coordinately regulates leaf functional traits, dry matter and nitrogen accumulation, and yield formation in maize–soybean intercropping systems [21]. In particular, the interactive effects of biochar and intercropping patterns and the potential factors associated with these responses remain unclear. Therefore, it is necessary to systematically evaluate the effects of biochar on crop ecophysiological responses, dry matter accumulation, nitrogen accumulation, and productivity in maize–soybean intercropping systems.
2. Materials and Methods
2.1. Experimental Site Description
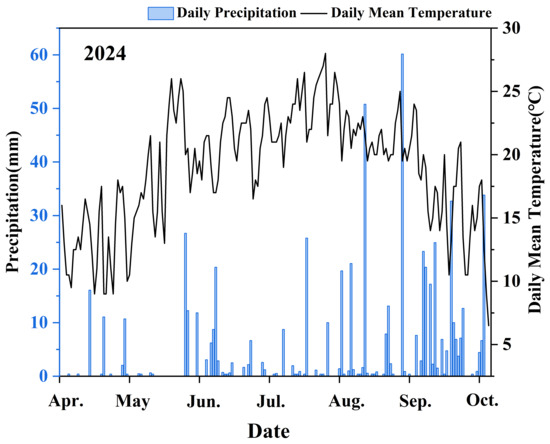
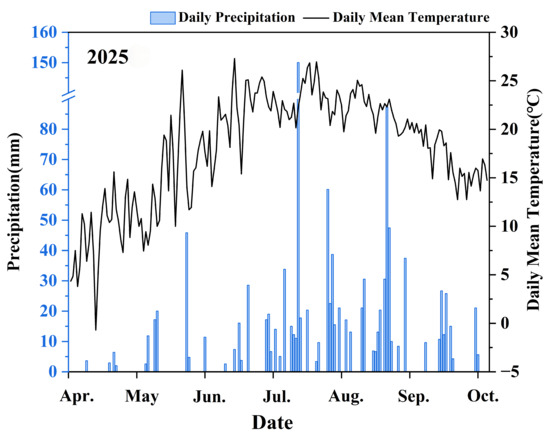
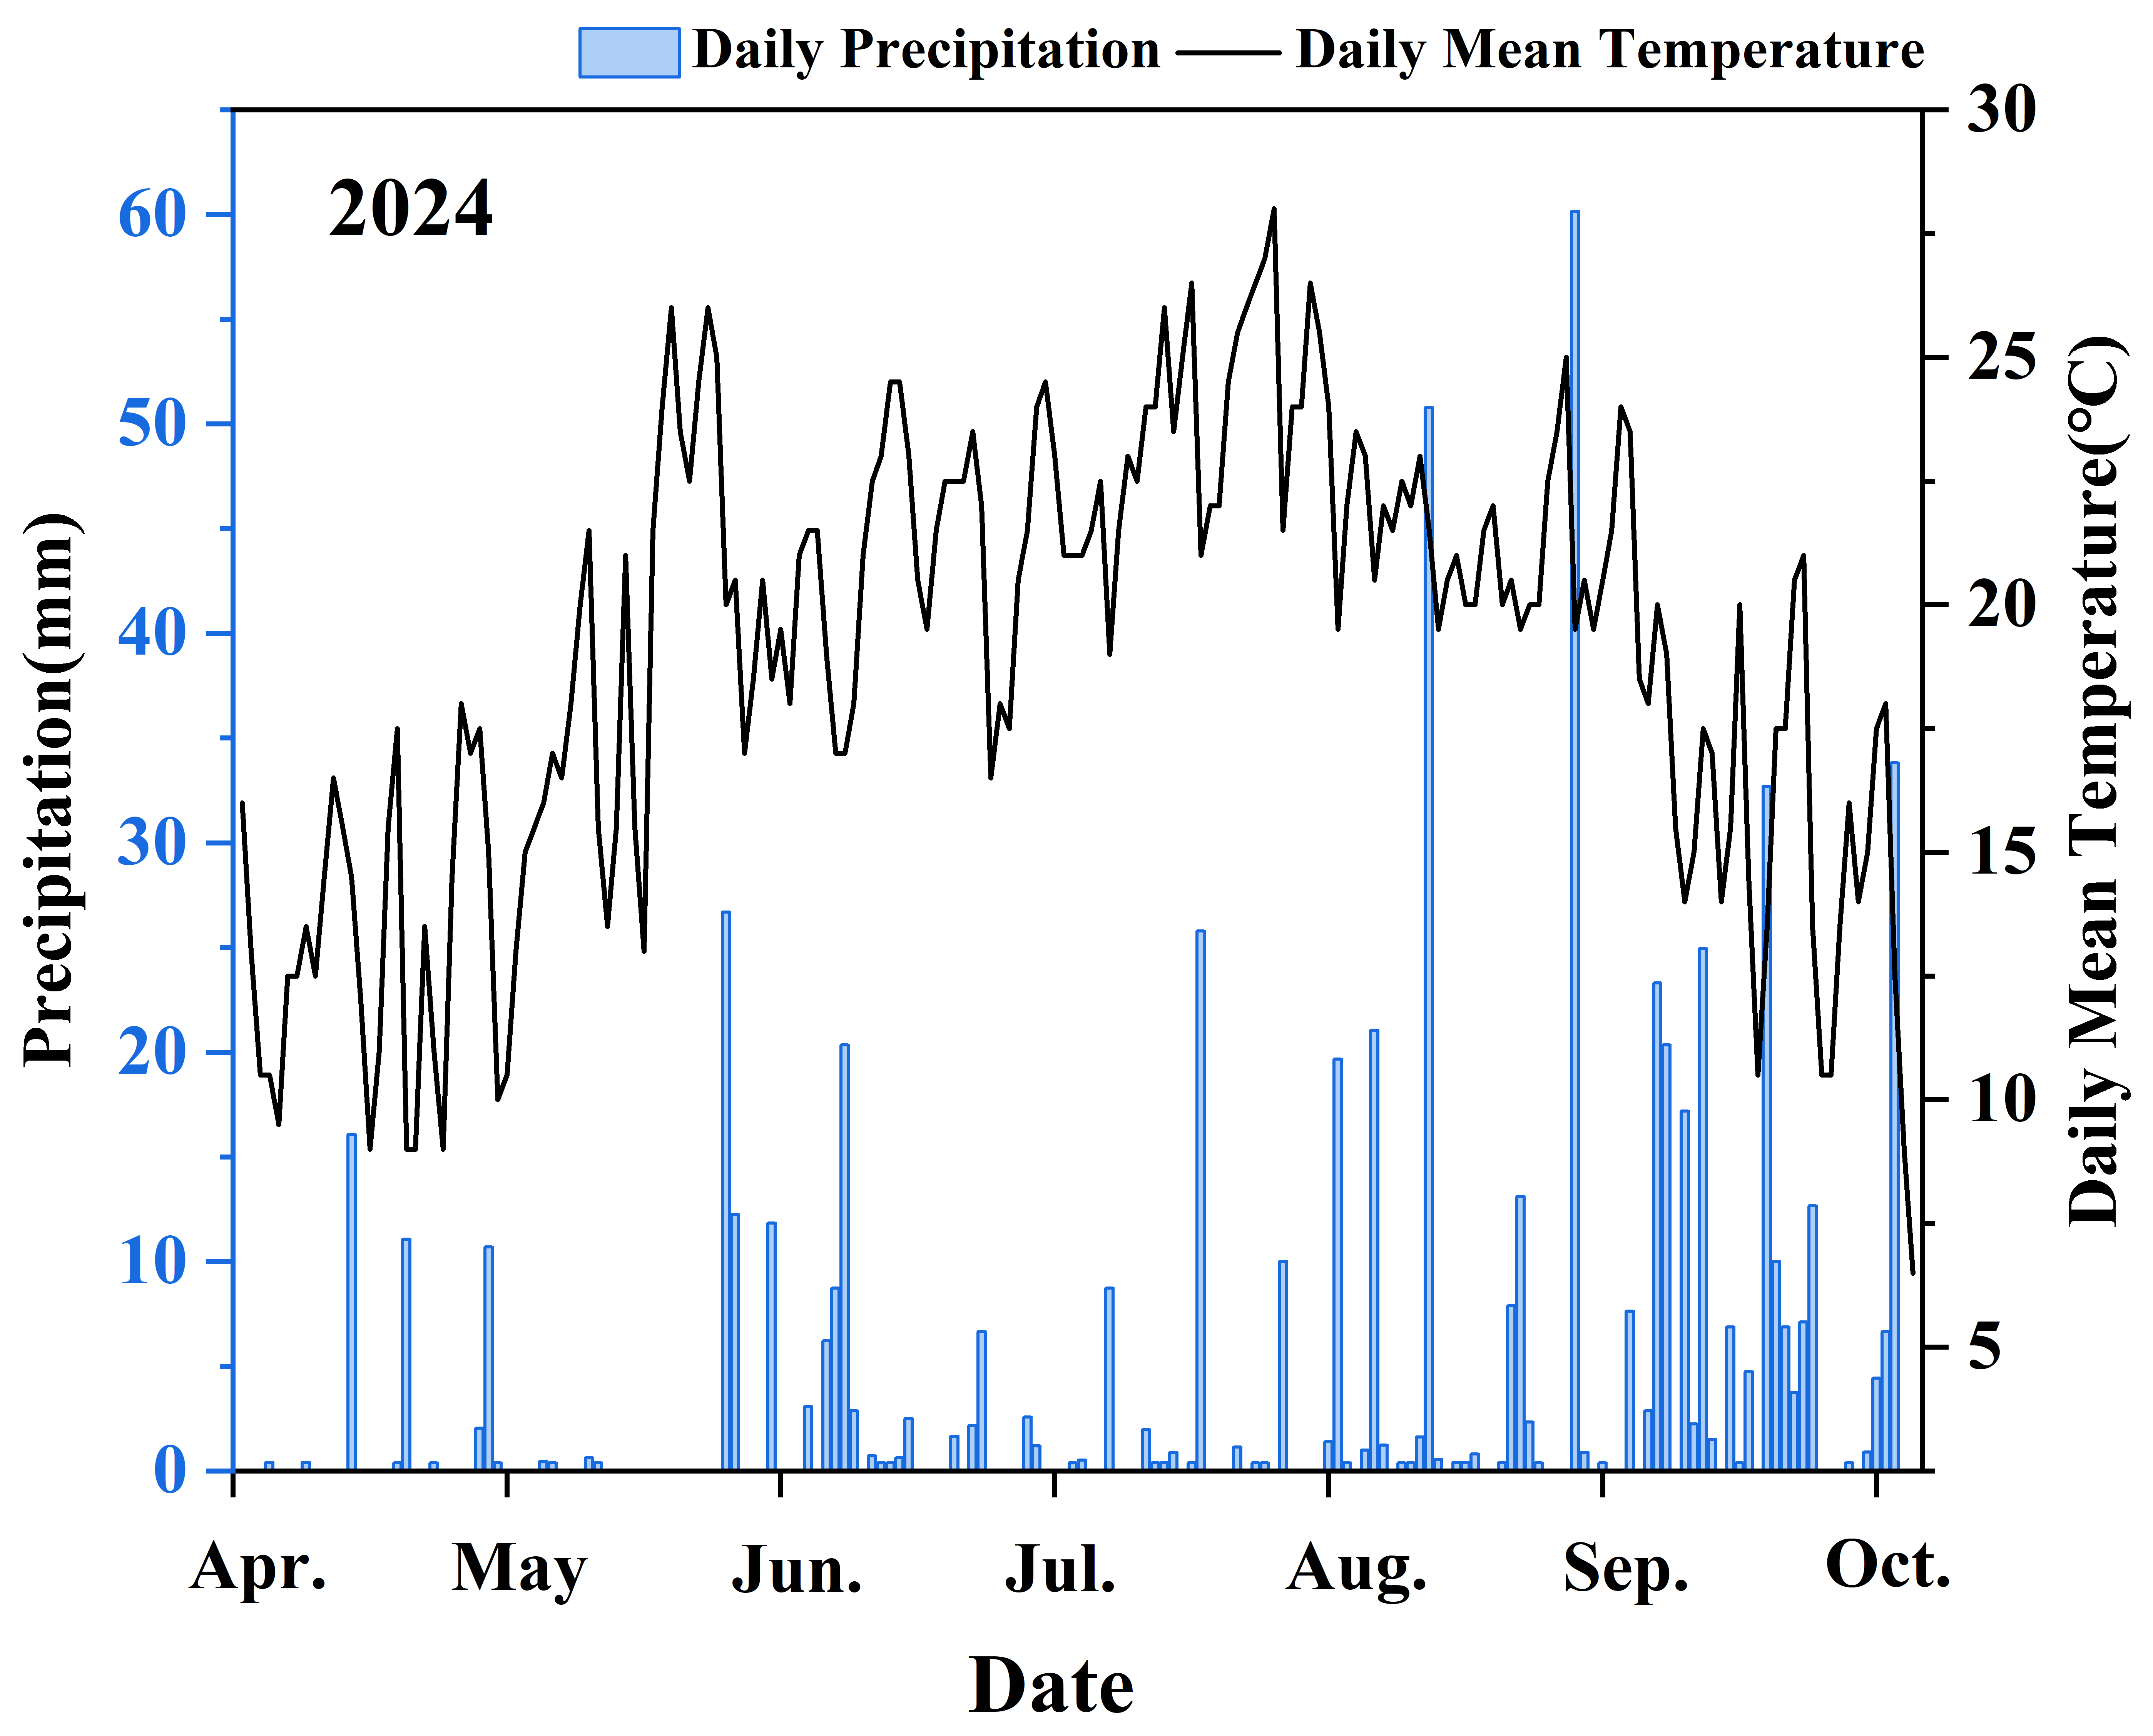
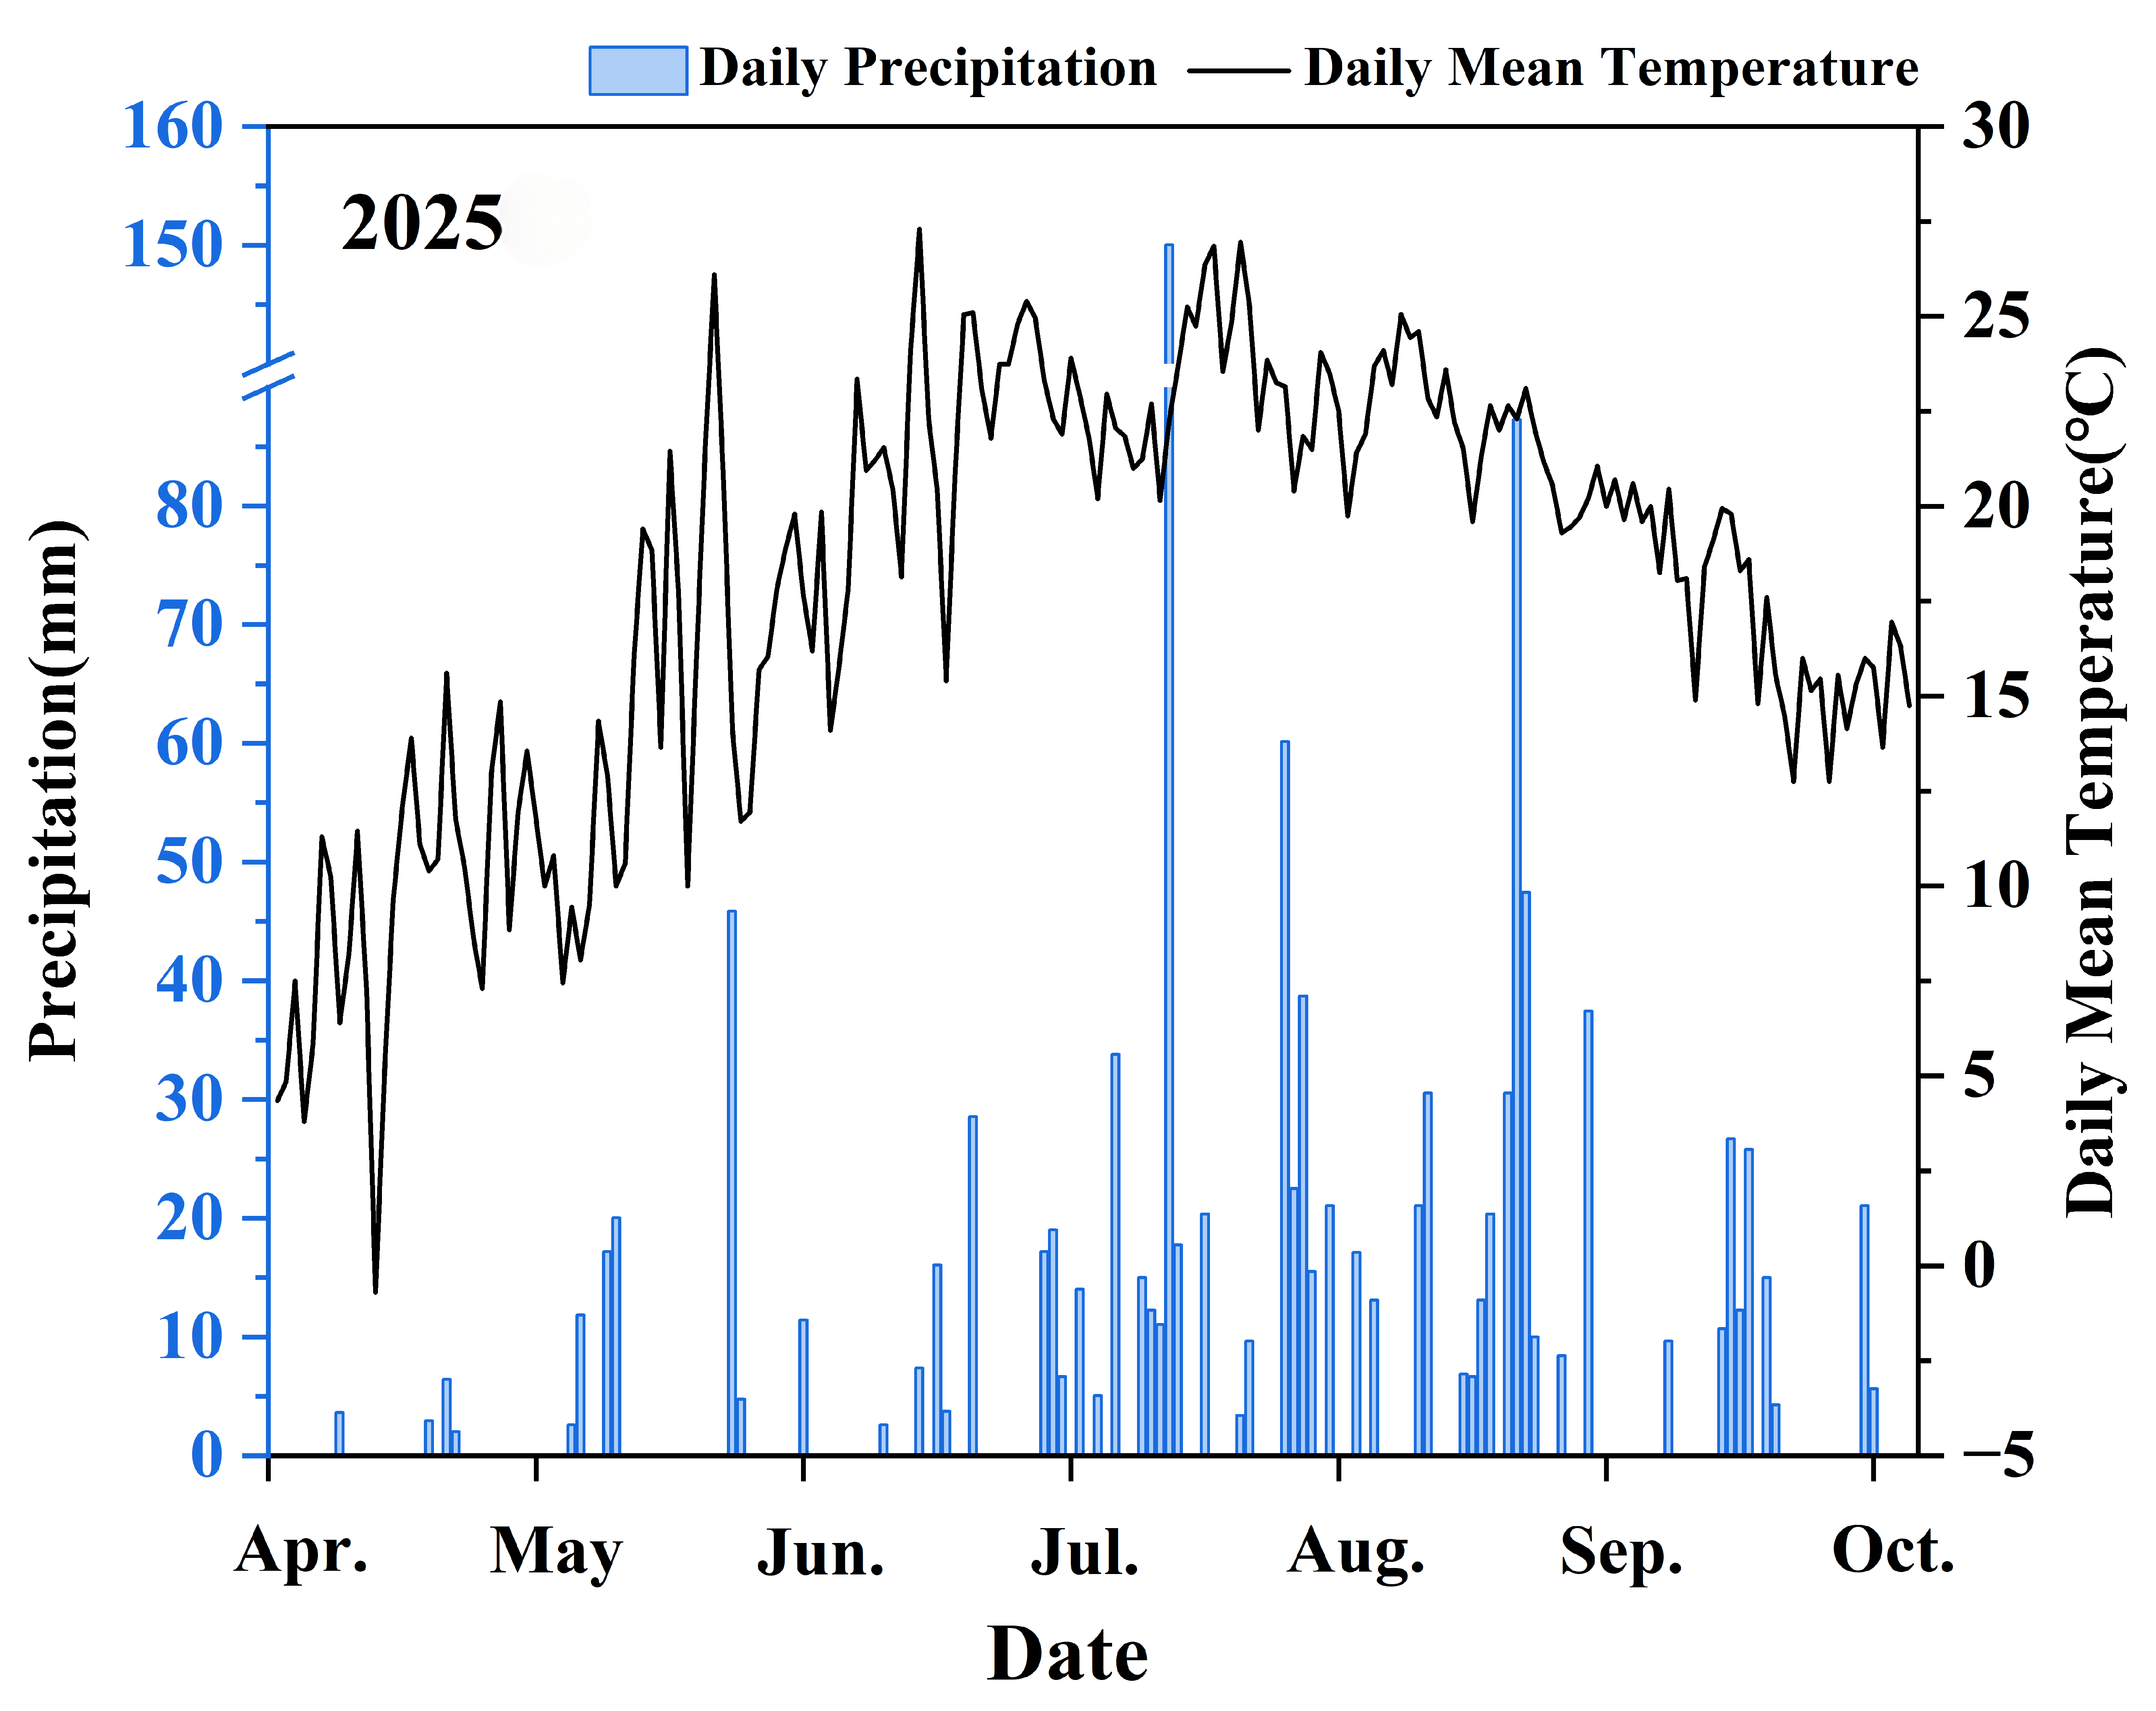
The field experiment was conducted in 2024 and 2025 at the Agricultural Expo Park of Inner Mongolia Agricultural University (Beizhitu Village, Salaqi Town, Tumed Right Banner, Inner Mongolia). The site is located at 40°56′ N, 110°58′ E, at an altitude of 1017 m. The experimental area has a temperate continental climate characterized by cold, dry winters and hot, short summers, with large seasonal temperature variations. The mean annual precipitation is 350 mm, the mean annual evaporation is 2055 mm, and the mean annual temperature is 9 °C. The precipitation distribution during the experimental period in 2024 and 2025 is shown in Figure 1. Compared with 2024, the 2025 growing season received more frequent and generally higher rainfall, particularly during the middle and late growth stages, whereas seasonal temperature patterns were broadly similar between the two years. The preceding crop was oat, and the experimental soil was classified as a loam-textured Kastanozem according to the WRB (World Reference Base for Soil Resources) classification system. The initial soil properties were as follows: pH 7.55, organic matter 23.08 g/kg, total nitrogen 1.25 g/kg, alkali-hydrolyzable nitrogen 103.6 mg/kg, available phosphorus 38.01 mg/kg, and available potassium 206.7 mg/kg.
Figure 1.
Distribution of rainfall during the maize and soybean growing seasons in the experimental area in 2024 and 2025.
2.2. Experimental Design
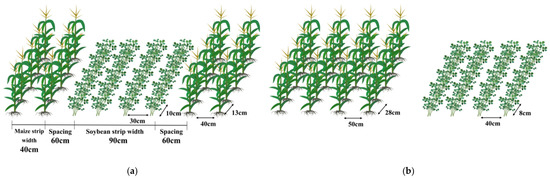
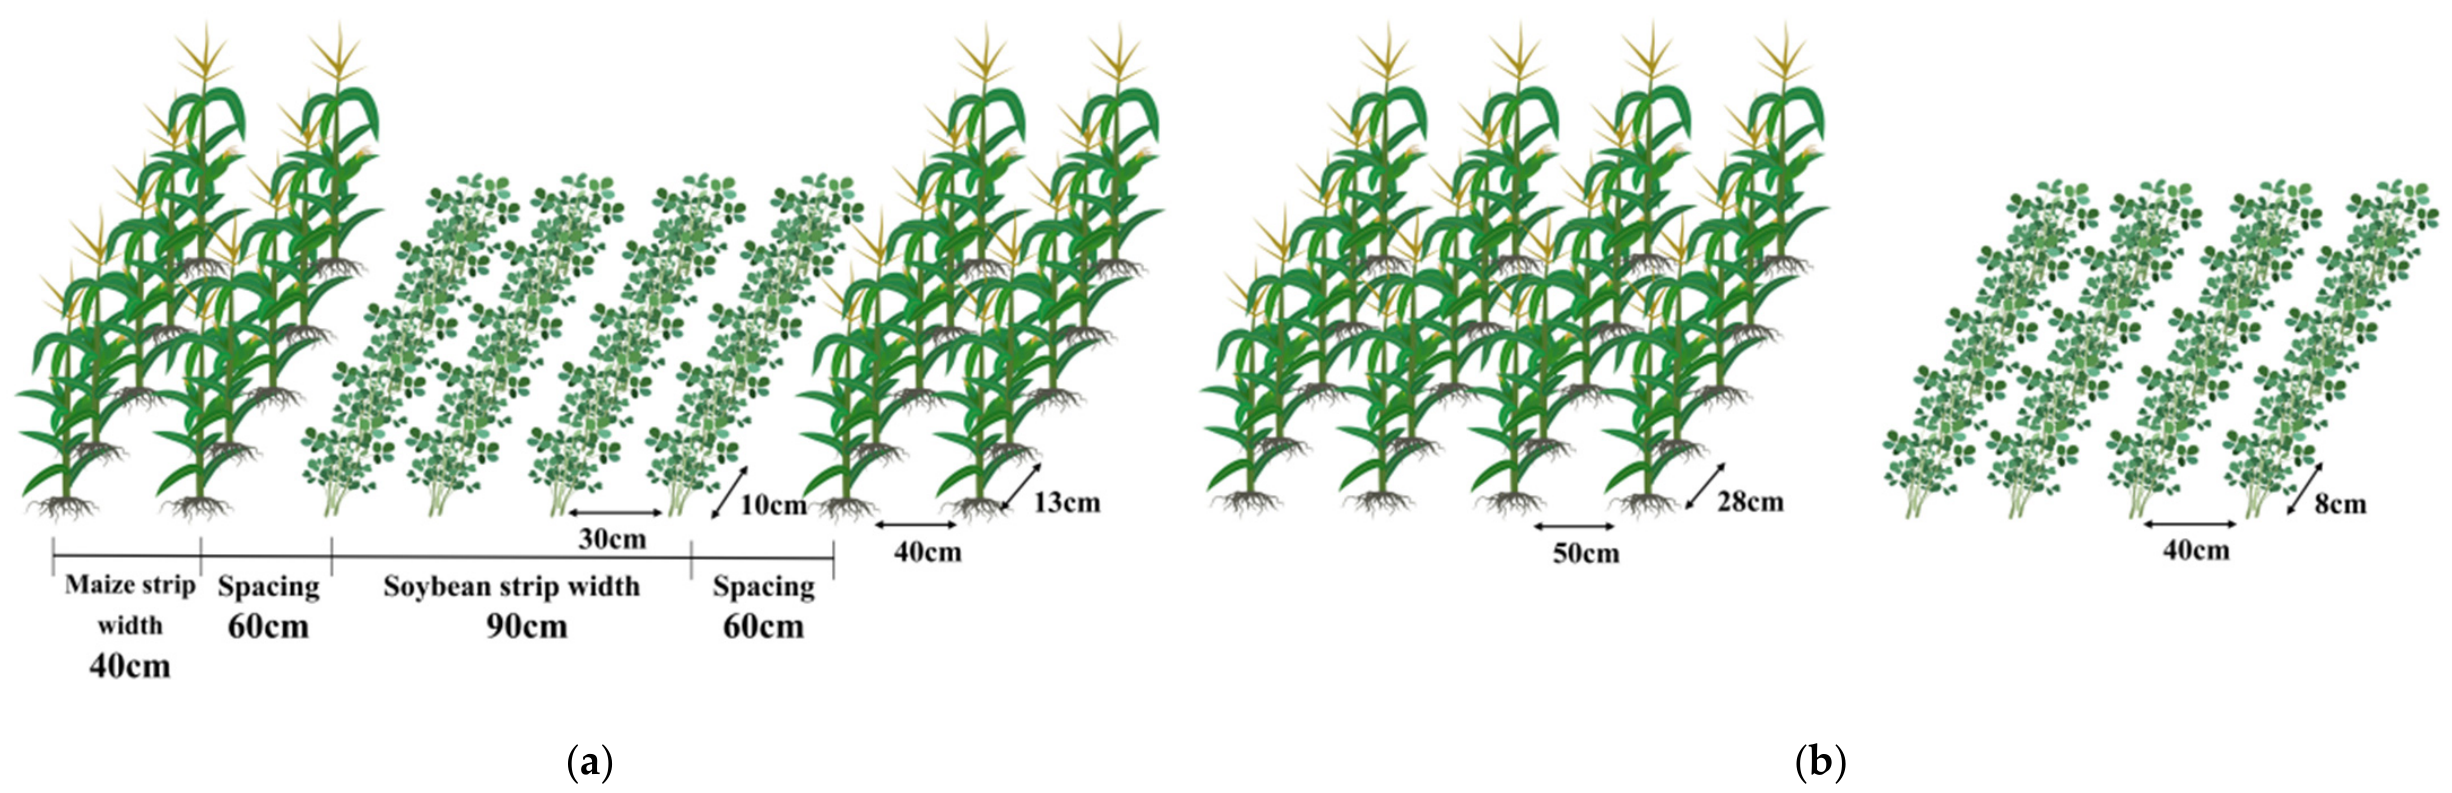
The tested crop varieties were Denghai 618 for maize and Henong 86 for soybean. A two-factor split-plot experimental design was adopted, with biochar application rate as the main plot factor and planting pattern as the subplot factor. The biochar treatments consisted of 0 and 5 t ha−1, which were applied on 25 April 2024 and 28 April 2025, respectively, with sowing conducted on the same dates immediately after biochar incorporation. The experiment was conducted on the same plots over two consecutive years, and biochar was reapplied annually before sowing; thus, the 2025 results represent the cumulative effects of repeated biochar application. The planting patterns were maize monoculture (M), soybean monoculture (S), and maize–soybean intercropping (MS) arranged in a 2:4 pattern, i.e., two rows of maize intercropped with four rows of soybean. The combination of two biochar application rates and three planting patterns resulted in six treatment combinations (2 × 3 = 6). In the intercropping treatment, maize and soybean were grown together within the same plot and were not considered separate treatments. Six treatments were established with three replications, resulting in 18 plots. Each plot measured 7 m long and 4.5 m wide, with an area of 31.5 m2, and the plots were arranged in a randomized complete block design. The specific planting pattern is shown in Figure 2, and the field experimental layout is presented in Table 1. The biochar used in this study was produced from wheat straw through oxygen-limited pyrolysis at 600 °C with a carbonization duration of 6 h. Its basic physicochemical properties are presented in Table 2.
Figure 2.
Schematic diagrams of different maize and soybean cropping patterns. (a) Intercropping of maize and soybeans in a 2:4 ratio (b) Maize and soybean were cultivated separately.
Table 1.
Field trial configuration.
Table 2.
Basic physical and chemical properties of the biochar used in the experiment.
Biochar, phosphorus and potassium fertilizers were applied as basal fertilizer. Before sowing, the fertilizers were evenly broadcast on the soil surface and incorporated to a depth of 15 cm by mechanical tillage. Phosphorus was applied at 105 kg P2O5 ha−1 in the form of diammonium phosphate, and potassium was applied at 60 kg K2O ha−1 in the form of potassium sulfate; both were incorporated into the soil as basal fertilizers on the sowing date. For soybean, nitrogen was applied as basal fertilizer at 45 kg N ha−1 in the form of urea, and no additional topdressing was applied during the entire growth period. Based on the agronomic optimum N rates determined in our previous multi-year field trials in this region, the N application rates for maize were set at 210 kg N ha−1 in monocropping and 255 kg N ha−1 in intercropping. For maize, all nitrogen fertilizer was applied as topdressing: 210 kg N ha−1 for monoculture maize and 255 kg N ha−1 for intercropped maize. Nitrogen was supplied through fertigation, with 30% applied at the V6 stage (jointing stage) and 70% at the V12 stage (large bell stage). Biochar was uniformly broadcast on the soil surface and incorporated into the 0–15 cm soil layer by rotary tillage before sowing. Irrigation and nitrogen topdressing were applied through a drip fertigation system. In the maize–soybean intercropping system, two rows of maize alternated with four rows of soybean according to the experimental design. Weeds were controlled by manual removal during the growing season.
2.3. Measurements and Methods
2.3.1. SPAD Value
SPAD measurements were conducted on all plots under clear and windless conditions between 09:00 and 11:00 a.m. using a portable chlorophyll meter (SPAD-502 Plus, Konica Minolta, Tokyo, Japan) to determine relative chlorophyll content. For maize, measurements were taken at the V6, V12, VT, R1, and R5 stages on the ear leaf (or the designated functional leaf). For soybean, measurements were conducted at the V5, R2, R4, R6, and R7 stages on the terminal leaflet of the uppermost fully expanded trifoliate leaf on the main stem, avoiding the veins. In each plot, five representative plants were selected, and the mean value was used to represent the SPAD value for that plot. (Growth Stage Definition: For maize, V6, V12, VT, R1, and R5 correspond to the jointing, large bell, tasseling, silking, and milk stages, respectively. For soybean, V5, R2, R4, R6, and R7 correspond to the branching, flowering, pod-setting, seed-filling, and maturity stages, respectively).
2.3.2. Photosynthetic Characteristics
Photosynthetic parameters, including net photosynthetic rate (Pn), transpiration rate (Tr), stomatal conductance (Gs), and intercellular CO2 concentration (Ci), were measured at the V6, V12, R1, and R5 stages of maize and at the V5, R2, R4, and R6 stages of soybean. Measurements were conducted on clear, windless days between 09:00 and 11:30 a.m. using a portable photosynthesis system (GFS-3000, Heinz Walz GmbH, Effeltrich, Germany). During measurements, the photosynthetic photon flux density (PPFD) was maintained at 1200 μmol m−2 s−1, the reference CO2 concentration was set to ambient atmospheric concentration (approximately 400 μmol mol−1), the chamber temperature was controlled at 25 °C, and the vapor pressure deficit (VPD) was maintained at 1–2 kPa.
Photosynthetic measurements were conducted in all plots. In each plot, five representative plants with uniform growth were selected. For maize, the ear leaf was selected, whereas for soybean, the terminal leaflet of the uppermost fully expanded trifoliate leaf on the main stem was used for measurement. Three measurements were taken on each selected leaf, and the mean value was used for analysis. Healthy and uniformly illuminated leaves were used for in vivo measurements. The following parameters were directly recorded by the instrument:
- Net photosynthetic rate (Pn): μmol m−2 s−1
- Transpiration rate (Tr): mmol m−2 s−1
- Stomatal conductance (Gs): mol m−2 s−1
- Intercellular CO2 concentration (Ci): μmol mol−1
2.3.3. Determination of Dry Matter Accumulation
At each key growth stage, maize plants were sampled at the V6, R1, R4, and R5 stages, whereas soybean plants were sampled at the R1, R3, R5, and R7 stages. Three representative maize plants or five soybean plants were collected from each plot. Plant samples were separated into organs (stem, leaf, and ear/pod), placed in paper bags, and heated at 105 °C for 30 min to deactivate enzymes. The samples were then oven-dried at 75 °C to constant weight, and the dry weight of each organ was determined using an electronic balance. Dry matter accumulation was determined on a per-plant basis. Plant samples were oven-dried to constant weight, and the dry matter accumulation of different organs was expressed as g plant−1.
2.3.4. Determination of Aboveground Nitrogen Accumulation
After the determination of dry matter accumulation, the dried organ samples were ground and passed through a 0.5 mm sieve. The samples were digested using the H2SO4–H2O2 method, and the total nitrogen content of the digest was determined using a fully automatic Kjeldahl apparatus. Aboveground nitrogen accumulation was calculated by multiplying the aboveground dry matter of each sampled plant organ (stem, leaf, and reproductive organ) by its corresponding nitrogen concentration, and then summing the values of all organs.
2.3.5. Determination of Grain Yield and Yield Components of Maize and Soybean
Maize
Yield measurement: At maturity (R5 stage), all ears from two representative rows (excluding border rows) in each plot were harvested. The ears were air-dried, threshed, and weighed. Grain moisture content was measured using a moisture meter, and grain yield was adjusted to a standard moisture content of 14% and expressed as kg ha−1.
Yield component analysis: Ten consecutive ears were sampled from the harvested area, air-dried, and used for laboratory analysis. The measured traits included thousand-grain weight and grain moisture content. The number of ears per unit area was calculated based on the number of effective ears per plant and actual plant density.
Soybean
Yield measurement: At maturity (R7 stage), all plants within a representative quadrat (10 m2) or strip in each plot were harvested, air-dried, threshed, and weighed. Grain moisture content was determined, and grain yield was adjusted to a standard moisture content of 13% and expressed as kg ha−1.
Yield component analysis: Twenty consecutive plants were sampled from the harvested area and used for laboratory analysis. The measured traits included number of grains per plant and 100-seed weight (g). The number of plants per unit area was determined based on plant counts within the quadrat or strip.
2.3.6. Calculation of Interspecific Relationship Indices
To quantify the interspecific interactions and resource competition in the maize–soybean intercropping system, the following indices were calculated using the grain yield data obtained from each treatment (see Section 2.3.5) and the corresponding monoculture yields.
- (1)
- Land equivalent ratio (LER)
The land equivalent ratio is used to evaluate the land use efficiency advantage of intercropping over monoculture. It represents the relative land area required under sole cropping to achieve the same yields as in the intercrop.
- Yim is the grain yield of maize in the intercropping system (kg ha−1);
- Ysm is the grain yield of sole maize (kg ha−1);
- Yib is the grain yield of soybean in the intercropping system (kg ha−1);
- Ysb is the grain yield of sole soybean (kg ha−1).
- If LER > 1, the intercropping system has a yield advantage and higher land use efficiency than monoculture.
- If LER < 1, intercropping is at a yield disadvantage relative to monoculture.
- (2)
- Aggressivity (relative competitiveness)
Aggressivity measures the competitive ability of one species relative to the other for resources in the intercropping system [22].
where:
- Amb represents the competitive ability of maize relative to soybean;
- Pm is the planting proportion of maize in the intercropping system (i.e., the actual land area proportion or plant population proportion occupied by maize);
- Pb is the planting proportion of soybean in the intercropping system;
- When Amb > 0, maize exhibits stronger competitiveness than soybean, indicating that maize is in a competitive dominant position;
- When Amb < 0, maize exhibits weaker competitiveness than soybean, indicating that maize is in a competitive inferior position.
- (3)
- Competition ratio (CR)
The competition ratio quantifies the resource acquisition ability of one species relative to the other, further reflecting the intensity of interspecific competition [23].
where:
- CRm is the competition ratio of maize relative to soybean;
- CRb is the competition ratio of soybean relative to maize;
- the meanings of the other symbols are the same as described above.
- When CRm > 1, the competitive ability of maize for resources is stronger than that of soybean;
- when CRm < 1, the competitive ability of maize for resources is weaker than that of soybean, indicating that soybean has a stronger competitive ability than maize.
2.4. Data Analysis
Field observation data were entered, organized, and processed using Microsoft Excel 2021. Because environmental conditions differed substantially between the two growing seasons, statistical analyses were conducted separately for the 2024 and 2025 datasets. For each year, data were analyzed using a split-plot ANOVA model, with biochar application rate assigned to the main plots and cropping system assigned to the subplots. Biochar application rate and cropping system were treated as fixed factors, whereas block (replication) was treated as a random factor. Two-way analysis of variance (ANOVA) was performed using SPSS Statistics 19.0 (IBM Corp., Armonk, NY, USA) to evaluate the effects of biochar application, planting pattern, and their interactions on photosynthetic characteristics, dry matter accumulation, nitrogen content, and yield indices. Since the two experimental years were analyzed independently, interactions involving year (year × biochar rate, year × cropping system, and year × biochar rate × cropping system) were not tested. Differences among treatments were compared using Duncan’s multiple range test at the p < 0.05 significance level. Figures were prepared using Origin 2024 (OriginLab Corporation, Northampton, MA, USA).
3. Results
3.1. Effects of Biochar Application and Cropping Pattern on Leaf SPAD Values of Crops
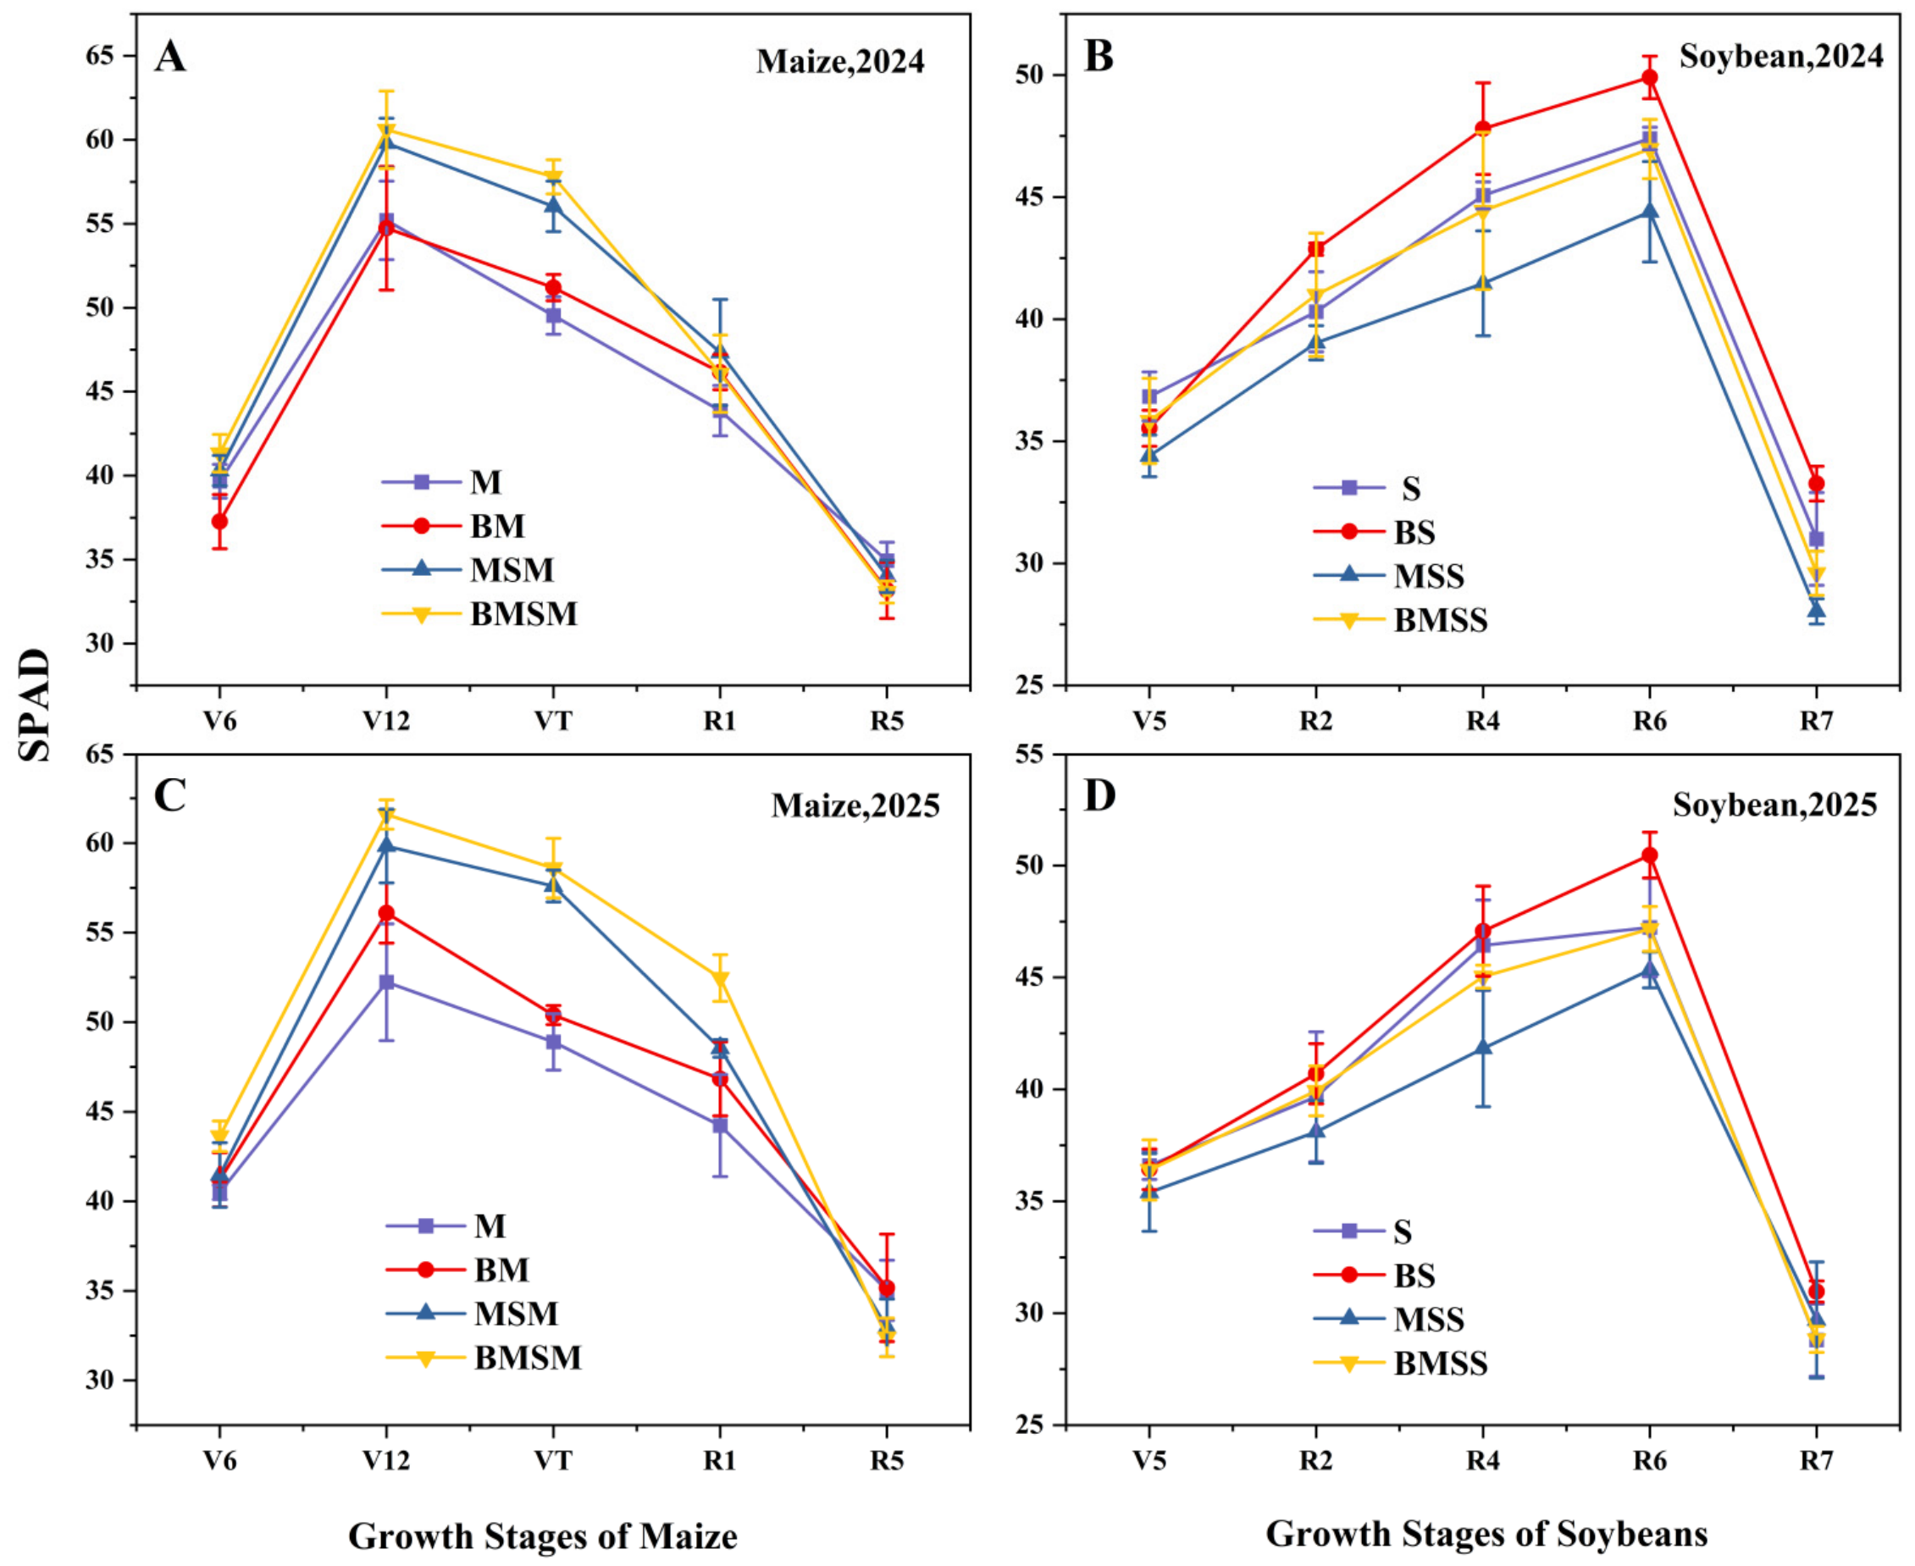
According to Figure 3, the results from the two experimental years showed that the leaf SPAD value of maize exhibited a trend of initially increasing and subsequently decreasing during the growth period, reaching the maximum at the V12 stage. Compared with the monocropping maize treatment (M), the maize–soybean intercropping treatment (MSM) significantly increased maize SPAD values during the middle and late vegetative growth stages. Specifically, SPAD values at the V12 and VT stages increased by 12.80% and 13.39% in 2024, and by 15.41% and 20.58% in 2025, respectively. On this basis, biochar application further enhanced this effect. For example, at the R1 stage in 2025, the SPAD value of BMSM was 8.49% higher than that of MSM. At the R5 stage, SPAD values decreased markedly under all treatments, and the intercropping treatments showed slightly lower values than monocropping, with reductions of 2.04% in 2024 and 5.21% in 2025.
The leaf SPAD value of soybean gradually increased throughout the growth period in both years, peaked at the R6 stage, and then declined significantly at the R7 stage. Overall, intercropping significantly reduced soybean SPAD values. At the R4 stage, SPAD values decreased by 12.28% and 11.21% in 2024 and 2025, respectively. Biochar application significantly increased soybean SPAD values at most growth stages, with a greater enhancement observed under intercropping conditions. For instance, compared with MSS, BMSS increased SPAD values at the R4 stage by 20.10% in 2024 and 15.15% in 2025. In addition, at the R7 stage, biochar application also significantly promoted SPAD values in monocropped soybean, with increases of 12.46% and 15.38% in 2024 and 2025, respectively.
Overall, intercropping significantly promoted chlorophyll accumulation in maize during the V12–VT stages, whereas it suppressed soybean SPAD values during the reproductive stages. Biochar application significantly increased SPAD values at most critical growth stages and partially alleviated the negative effects of intercropping on soybean chlorophyll status.
3.2. Effects of Biochar Application and Cropping Pattern on Leaf Photosynthetic Characteristics of Maize and Soybean
3.2.1. Photosynthetic Characteristics of Maize Leaves
Figure 4 shows that, the net photosynthetic rate (Pn), transpiration rate (Tr), and stomatal conductance (Gs) of maize leaves showed a trend of initially increasing and subsequently decreasing during the growth period, reaching relatively high levels around the V12 stage and then declining during the grain-filling stage. In contrast, the intercellular CO2 concentration (Ci) exhibited a coordinated variation pattern with Pn.
Under different treatments, maize Pn generally followed the order of BMSM > MSM > BM > M. Compared with monocropping, the MSM treatment increased Pn by 5.54–40.23% in 2024 and 9.00–80.36% in 2025, with significant differences observed at the V12 and R1 stages. On this basis, the BMSM treatment further increased Pn by 0.82–33.88% compared with MSM, among which the increases at the V6 and R1 stages in 2025 reached 19.17% and 33.88%, respectively. These results indicate that intercropping consistently enhanced the photosynthetic capacity of maize, while biochar application further strengthened this advantage and showed a cumulative effect under continuous application.
Figure 3.
Effects of biochar application and cropping pattern on leaf SPAD values of maize and soybean. (A) Maize growing season in 2024; (B) Soybean growing season in 2024; (C) Maize growing season in 2025; (D) Soybean growing season in 2025. Different lowercase letters indicate significant differences at p < 0.05. Vertical lines represent the standard error (SE) of the mean. M, maize monoculture without biochar; BM, maize monoculture with biochar (5 t ha−1); MSM, intercropped maize without biochar; BMSM, intercropped maize with biochar (5 t ha−1); S, soybean monoculture without biochar; BS, soybean monoculture with biochar (5 t ha−1); MSS, intercropped soybean without biochar; BMSS, intercropped soybean with biochar (5 t ha−1). Abbreviations: SPAD, soil–plant analysis development; SE, standard error.
The variation trend of maize Tr was generally consistent with that of Pn, with the highest values observed under the BMSM treatment. Compared with M, MSM increased Tr by 25.72–88.01% in 2024 and by 12.99–39.34% in 2025, with significant differences at most growth stages. Based on this, BMSM further increased Tr by 0.36–32.70%, particularly at the V6 stage. Overall, intercropping enhanced the transpiration intensity of maize, while biochar application further promoted water transport processes.
Regarding stomatal conductance, intercropping treatments generally showed higher Gs values than monocropping. In 2024, MSM increased Gs by 12.50–109.09% compared with M. Although slight fluctuations were observed in some stages in 2025 (−16.13% to 20.00%), significant increases were still detected at the V12 and R1 stages. After biochar application, BMSM further increased Gs by 6.98–55.56% compared with MSM, with significant improvements at the V6 and R1 stages. Relative to M, the overall increase reached 16.67–177.78%. These results suggest that intercropping promoted stomatal opening by improving canopy structure, whereas biochar application further enhanced this process.
The Ci of maize was generally lower under intercropping than under monocropping conditions. Taking 2025 as an example, MSM reduced Ci by 12.93–26.92% compared with M, with significant differences observed at the V12 and R1 stages. This trend corresponded well with the increase in Pn, indicating a more efficient assimilation and utilization of CO2. Under biochar application, Ci maintained good coordination with Pn and Gs, and no obvious accumulation of intercellular CO2 was observed despite the increase in stomatal conductance, suggesting a relatively stable and efficient operation of the photosynthetic system.
3.2.2. Photosynthetic Characteristics of Soybean Leaves
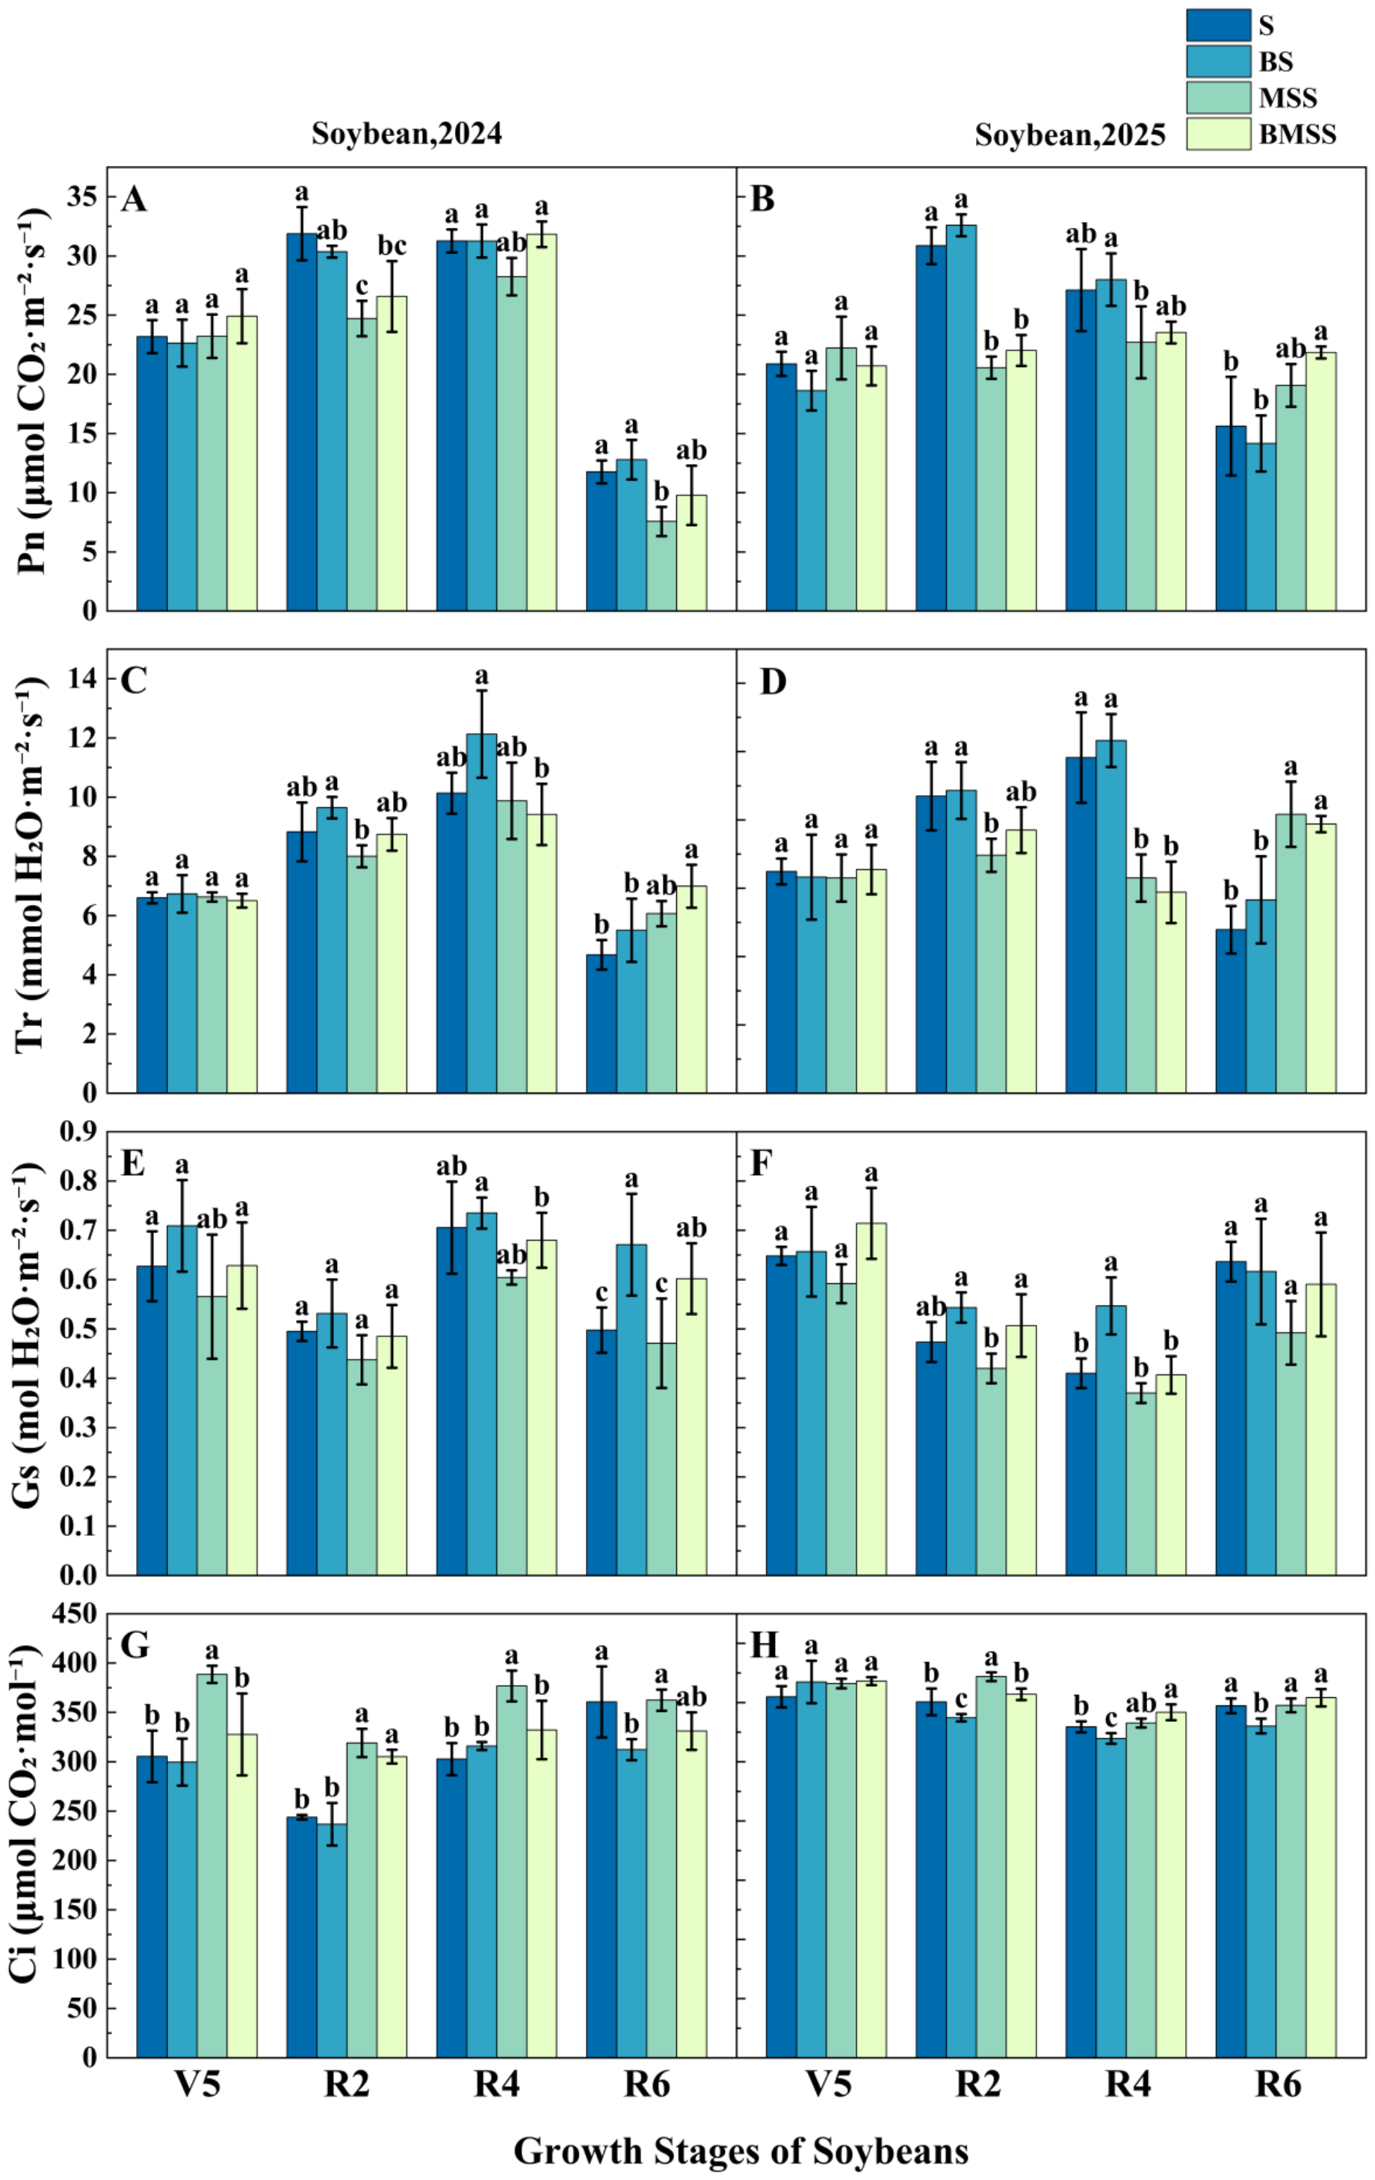
Figure 5 shows that, compared with maize, the responses of soybean photosynthetic parameters to cropping patterns exhibited more pronounced stage-dependent characteristics. Overall, Pn and Tr showed relatively small differences or even disadvantages under intercropping during the early growth stages, but gradually shifted to an advantage during the middle and late growth stages. Gs remained relatively low overall, whereas Ci was generally higher under intercropping conditions.
In terms of Pn, MSS reduced soybean Pn by 0.17–35.61% compared with monocropping soybean from V5 to R4 in 2024, with significant differences observed at R2 and R4. However, Pn exceeded that of monocropping at the seed-filling stage. A similar trend was observed in 2025, with reductions of 33.38% and 16.30% at the flowering and pod-setting stages, respectively, followed by an increase of 22.02% at the seed-filling stage. These results indicate that intercropping did not significantly enhance soybean photosynthetic capacity during the early growth stages, whereas a positive effect became evident at the seed-filling stage. The effect of biochar on soybean Pn was mainly observed during the middle and late growth stages. In 2025, BMSS tended to increase Pn by 7.05% and 14.59% at R2 and R6, respectively, compared with MSS, although the differences were not statistically significant. In contrast, the effects of biochar on monocropped soybean were relatively inconsistent.
The variation trend of soybean Tr was generally consistent with that of Pn. In 2025, MSS reduced Tr by 20.00% and 35.85% at the flowering and pod-setting stages, respectively, but significantly increased it by 70.56% at the seed-filling stage. Biochar application exhibited a promoting effect during the later growth period, with BMSS increasing Tr by 10.63% compared with MSS at the seed-filling stage, indicating that biochar contributed to improved water supply during grain formation.
In terms of Gs, soybean values were generally lower than those of maize and tended to decrease under intercropping conditions. Across the two years, MSS reduced Gs by 6.00–15.49% in 2024 and 9.23–23.44% in 2025 compared with monocropping soybean, although significant differences were observed only at certain growth stages. Biochar application showed a tendency to alleviate this reduction, with BMSS exhibiting higher Gs values than MSS; however, most differences were not statistically significant.
Ci was generally higher under intercropping than under monocropping. In 2024, MSS increased Ci by 24.48–30.90% compared with S at V5–R4, while an increase of 7.09% was observed at R2 in 2025. This increase in Ci during specific growth stages may reflect changes in stomatal regulation and photosynthetic activity under intercropping conditions. After biochar application, Ci decreased by 4.35–15.67%, indicating an improvement in CO2 utilization efficiency, which was consistent with the increasing trend of Pn observed during the later growth stages.
Figure 4.
Effects of biochar and cropping pattern on photosynthetic characteristics of maize. (A) Maize Pn in 2024; (B) Maize Pn in 2025; (C) Maize Tr in 2024; (D) Maize Tr in 2025; (E) Maize Gs in 2024; (F) Maize Gs in 2025; (G) Maize Ci in 2024; (H) Maize Ci in 2025. Different lowercase letters indicate significant differences at p < 0.05. Vertical lines represent the standard error (SE) of the mean. M, maize monoculture without biochar; BM, maize monoculture with biochar (5 t ha−1); MSM, intercropped maize without biochar; BMSM, intercropped maize with biochar (5 t ha−1). The caption format is also applicable to Figures 6 and 8. Abbreviations: Pn, net photosynthetic rate; Tr, transpiration rate; Gs, stomatal conductance; Ci, intercellular CO2 concentration; SE, standard error.
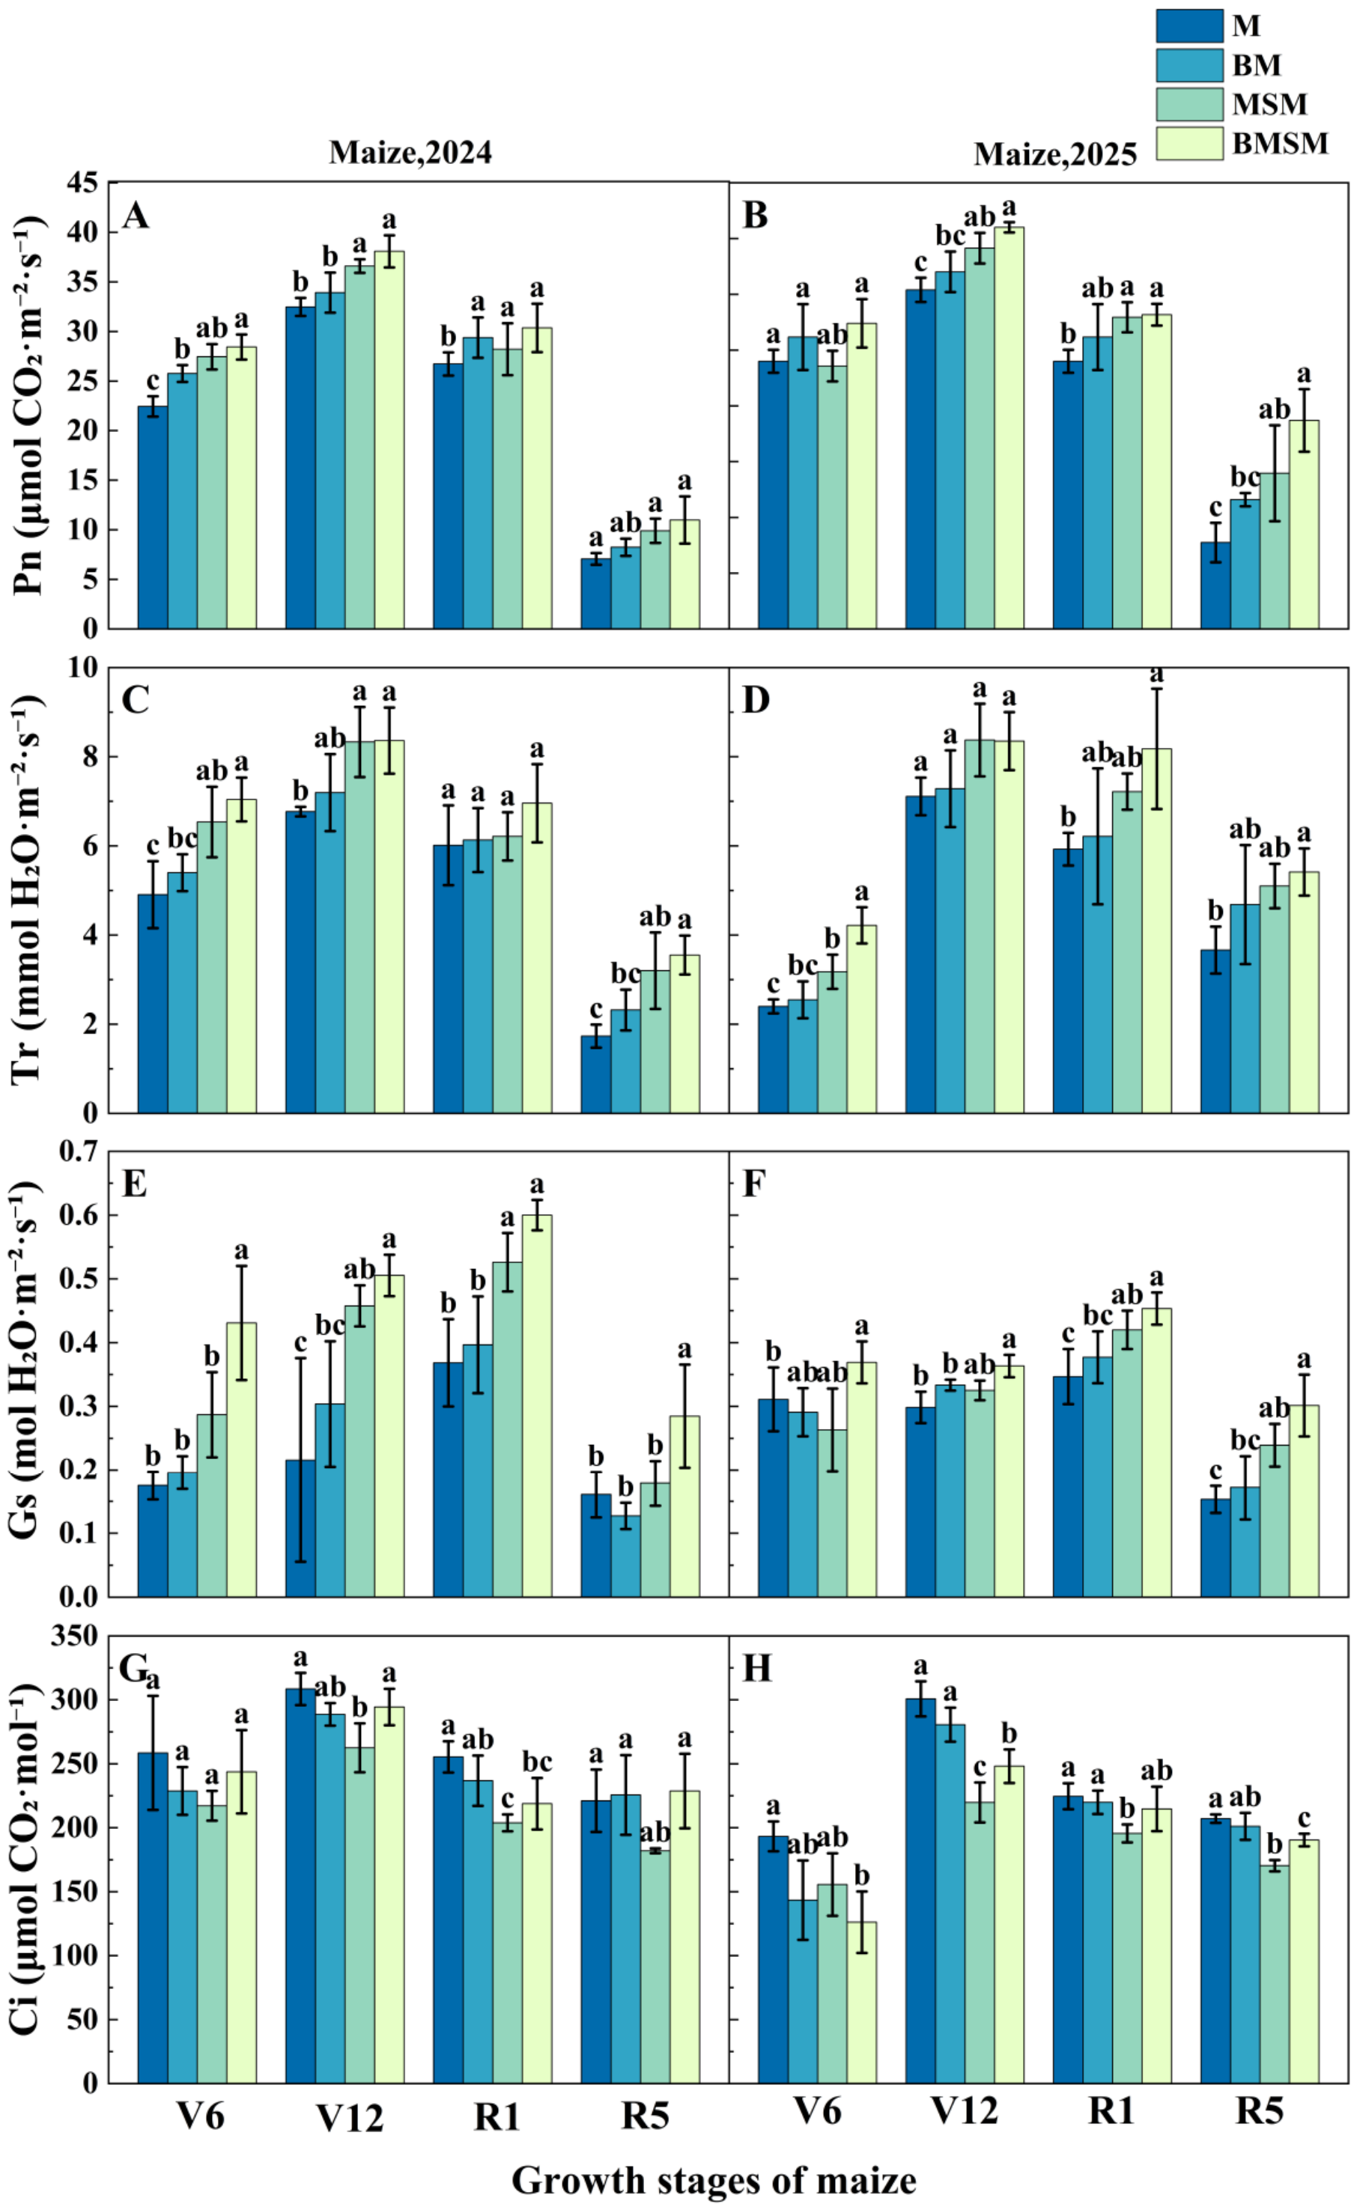
Figure 5.
Effects of biochar and cropping pattern on photosynthetic characteristics of soybean. (A) Soybean Pn in 2024; (B) Soybean Pn in 2025; (C) Soybean Tr in 2024; (D) Soybean Tr in 2025; (E) Soybean Gs in 2024; (F) Soybean Gs in 2025; (G) Soybean Ci in 2024; (H) Soybean Ci in 2025. Different lowercase letters indicate significant differences at p < 0.05. Vertical lines represent the standard error (SE) of the mean. S, soybean monoculture without biochar; BS, soybean monoculture with biochar (5 t ha−1); MSS, intercropped soybean without biochar; BMSS, intercropped soybean with biochar (5 t ha−1). The caption format is also applicable to Figures 7 and 9. Abbreviations: Pn, net photosynthetic rate; Tr, transpiration rate; Gs, stomatal conductance; Ci, intercellular CO2 concentration; SE, standard error.
3.3. Effects of Biochar Application and Cropping Pattern on Aboveground Dry Matter Accumulation in the Maize–Soybean System
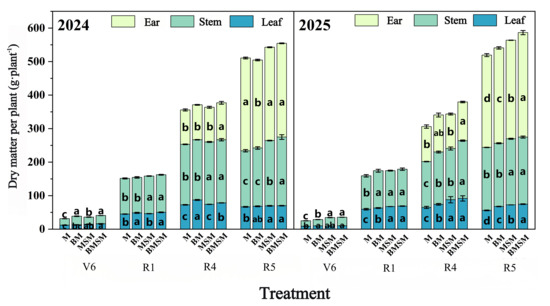
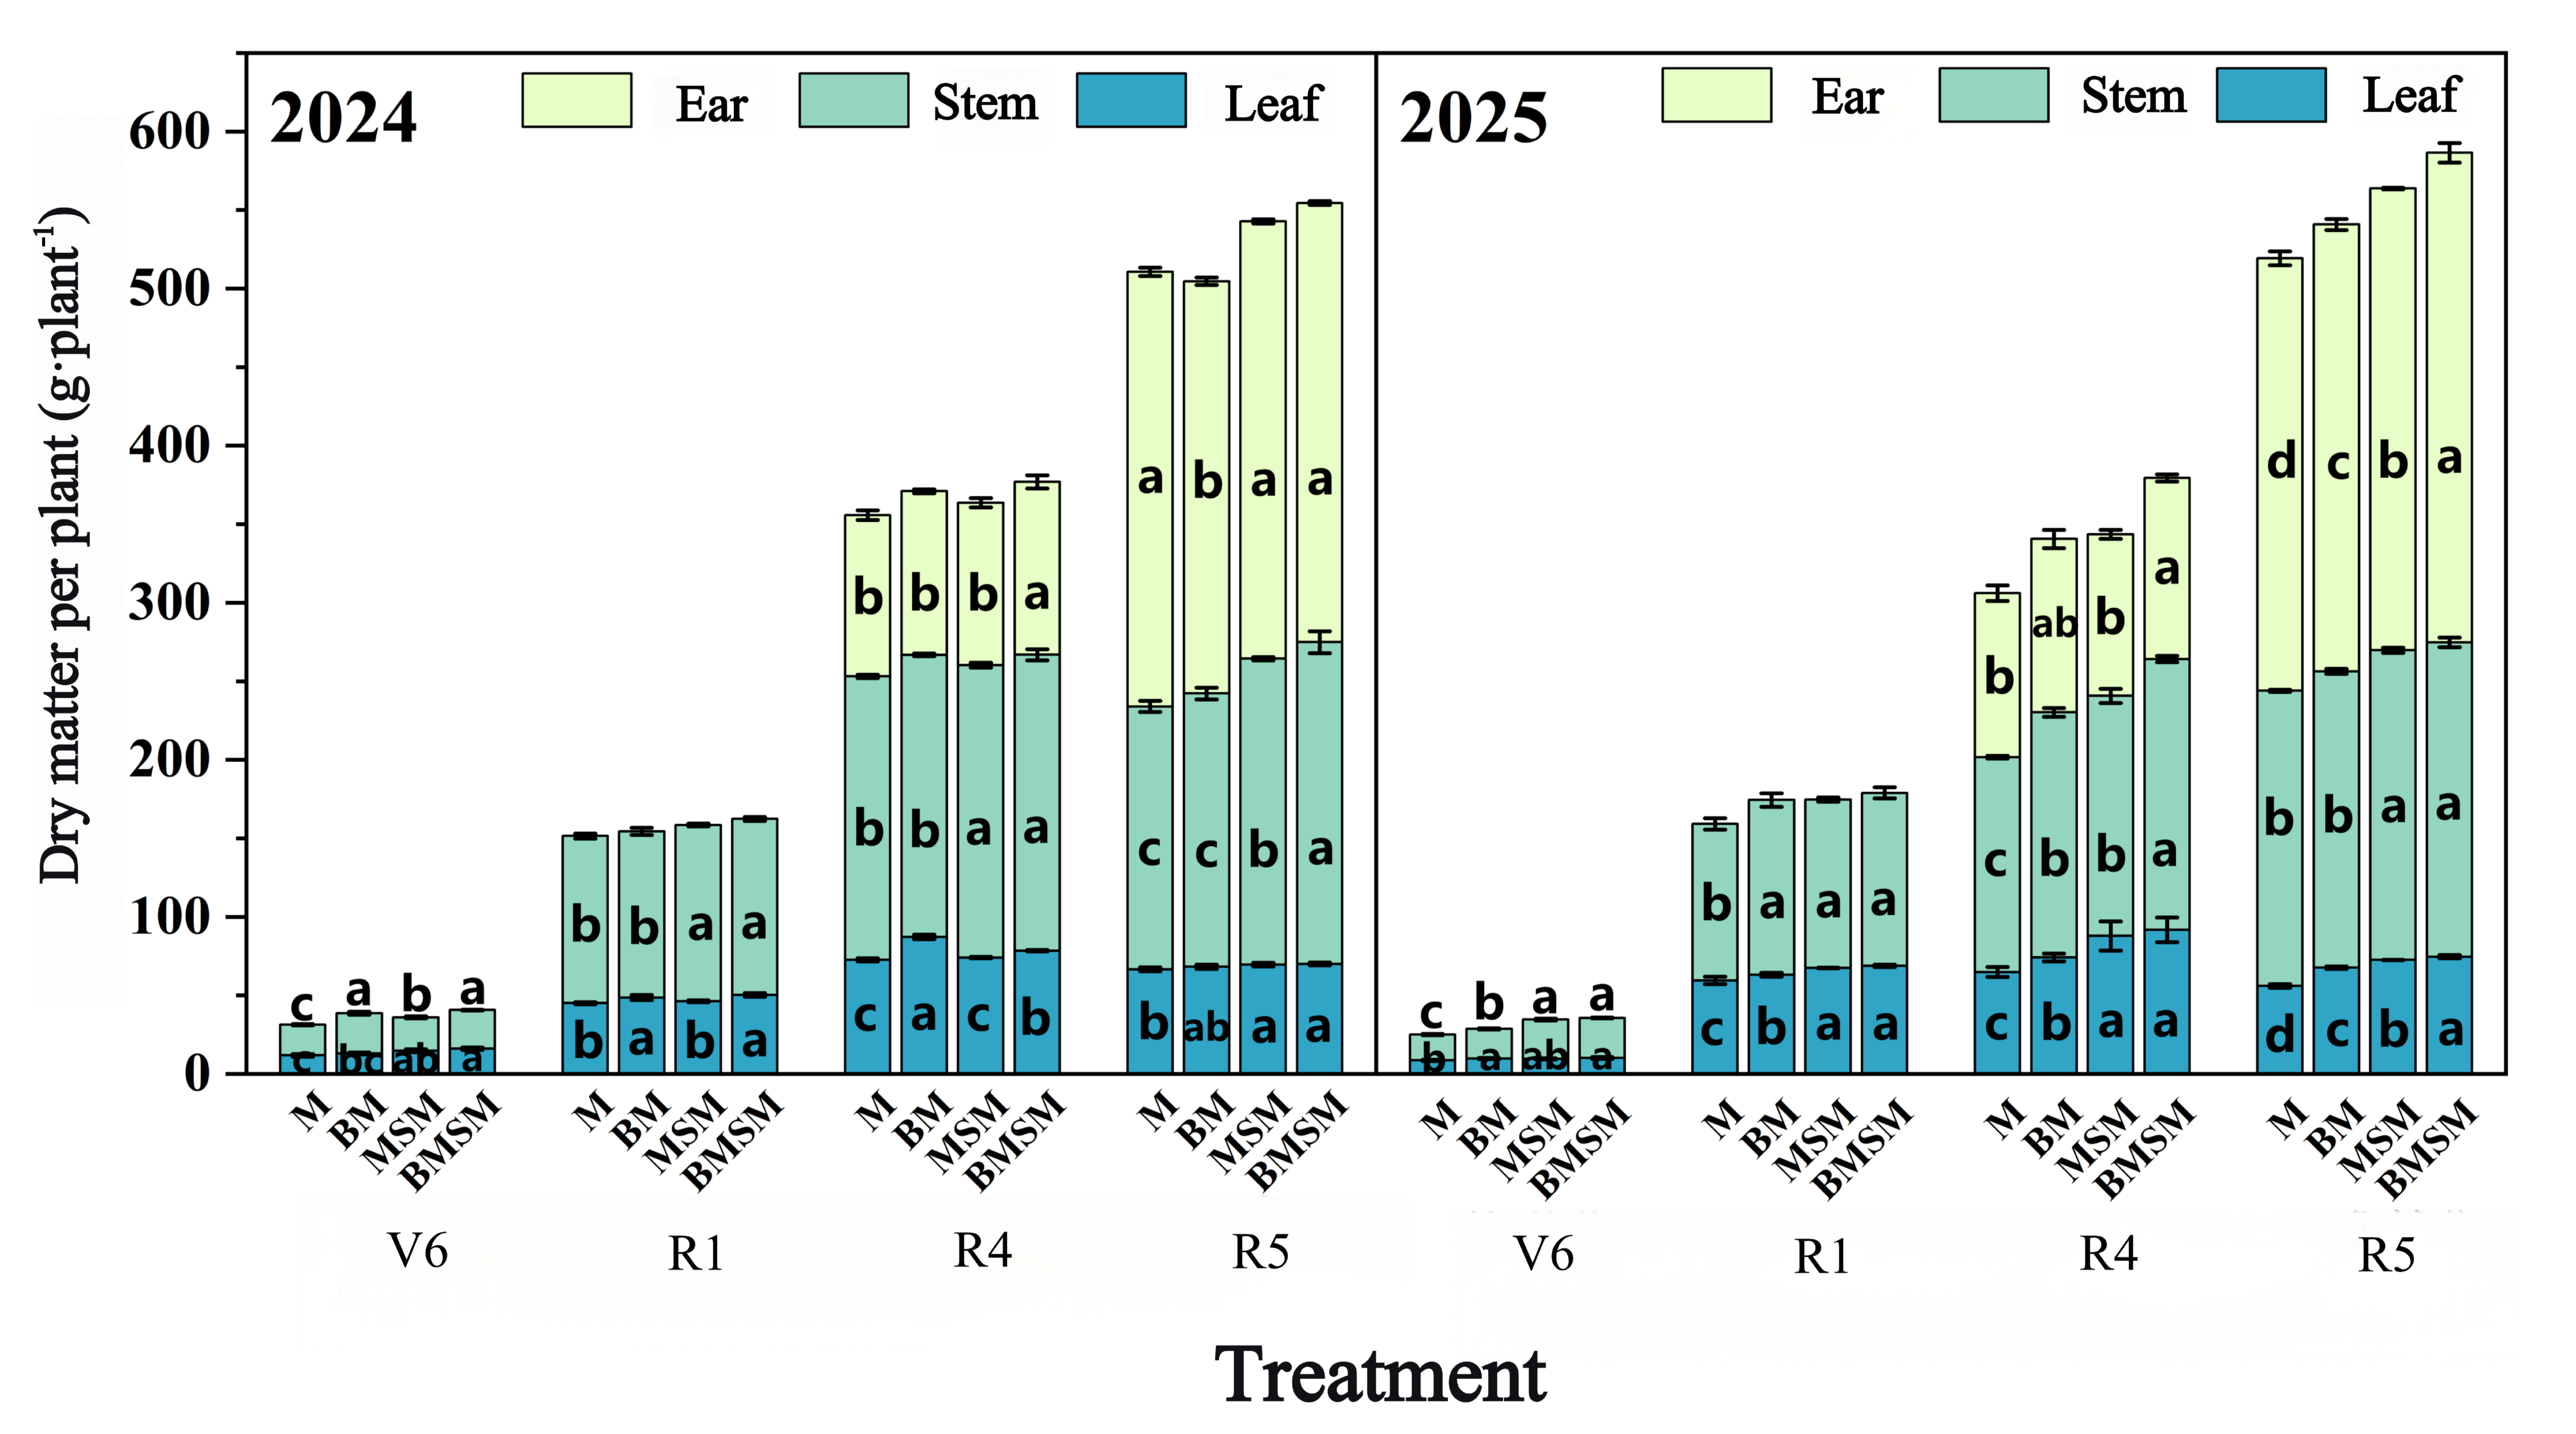
As shown in Figure 6, the aboveground dry matter accumulation of maize responded significantly to both cropping pattern and biochar application. At the V6 stage, intercropping promoted dry matter accumulation in leaves and stems. In 2024, the MSM and BMSM treatments significantly increased leaf and stem dry matter accumulation by 24.53% and 35.87%, respectively, compared with M, and a similar trend was observed in 2025. Biochar application exerted positive effects under both monocropping and intercropping systems, with BM and BMSM generally showing higher dry matter accumulation than the corresponding treatments without biochar application. After entering the R4 stage, the advantage in dry matter accumulation gradually shifted toward reproductive organs. For ear dry matter accumulation, the BMSM treatment showed varying degrees of increase in both years, particularly in 2025, when significant differences were observed compared with M, MSM, and BM. At the R5 stage, the advantages of intercropping combined with biochar application remained evident. In both 2024 and 2025, the BMSM treatment exhibited higher dry matter accumulation in leaves, stems, and ears than the other treatments, with the differences being particularly significant in 2025. These results suggest that the combined application of biochar and intercropping continuously promoted dry matter accumulation and yield formation during the R4–R5 stages of maize.
Figure 6.
Effects of biochar and cropping pattern on dry matter accumulation in aboveground organs of maize. Different lowercase letters indicate significant differences at p < 0.05. Vertical lines represent the standard error (SE) of the mean.
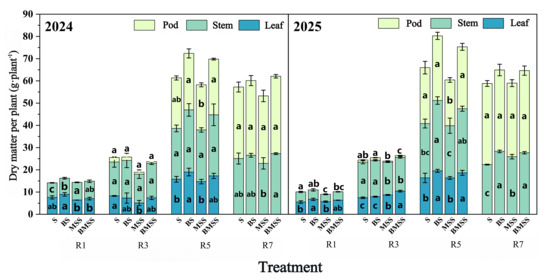
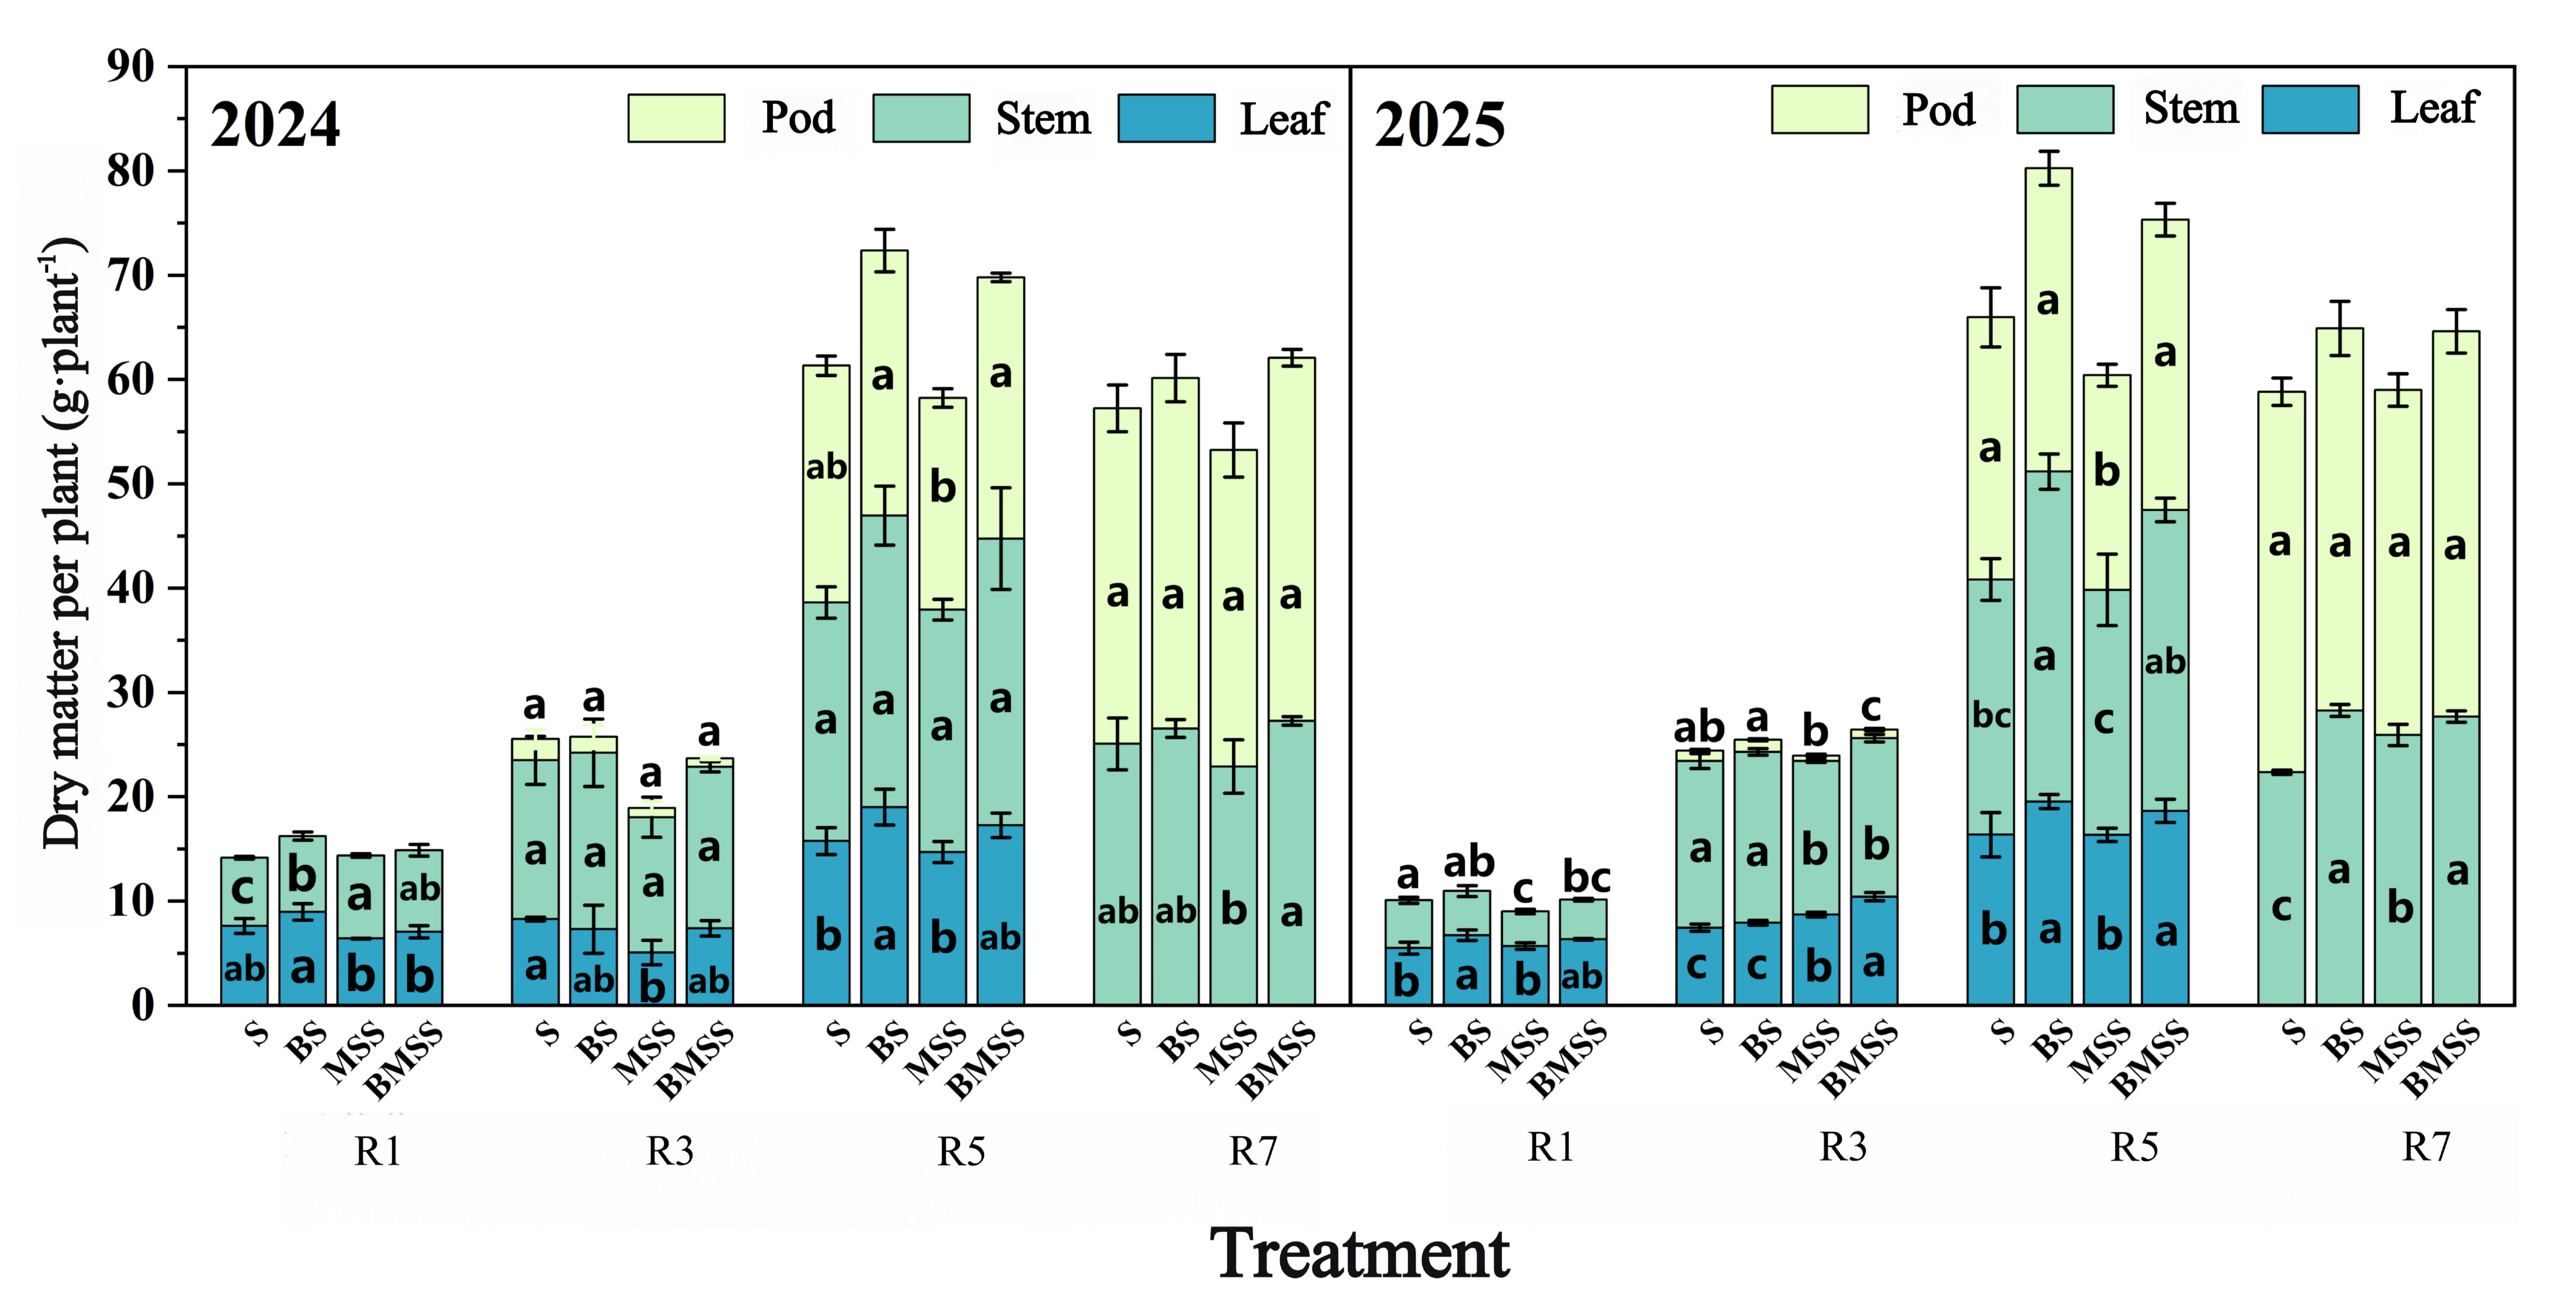
As shown in Figure 7, the response of soybean aboveground dry matter accumulation to cropping pattern was opposite to that of maize, generally showing inhibitory effects under intercropping and alleviation by biochar application. At the flowering stage, differences among treatments were relatively small overall. For leaf dry matter accumulation, MSS decreased by 18.72% in 2024, whereas BS increased by 21.35%; in 2025, BS increased by 22.48%. Regarding stem dry matter accumulation, MSS significantly increased by 23.41% in 2024 but significantly decreased by 27.86% in 2025, while BMSS showed varying degrees of increase in both years. At the pod-setting stage, differences in soybean dry matter accumulation became more pronounced. Leaf dry matter under MSS significantly decreased by 34.96% in 2024, whereas MSS and BMSS significantly increased by 14.78% and 39.62%, respectively, in 2025. Pod dry matter under MSS significantly decreased by 48.73% and 33.91% in 2024 and 2025, respectively, whereas BMSS significantly increased by 52.18% and 49.76%. In contrast, stem dry matter varied only slightly (−12.47% to 10.84%). At the seed-filling stage, differences in leaf dry matter were relatively small, with only BS showing a significant increase of 19.67% in 2024. Stem dry matter under BMSS significantly increased by 32.48% and 36.27% in the two years, respectively. For pod dry matter, MSS significantly decreased by 22.47% in 2025, whereas BMSS significantly increased by 33.18%. At maturity, differences among treatments gradually diminished, with relatively small changes observed in leaf dry matter. In stems and pods, BMSS increased dry matter accumulation by 18.96% and 26.42% in 2024 and by 12.37% and 18.55% in 2025, respectively, with significant differences observed in 2024. Overall, intercropping exerted a persistent inhibitory effect on soybean dry matter accumulation, whereas biochar application alleviated these adverse effects, particularly by promoting dry matter accumulation in reproductive organs during the later growth stages.
Figure 7.
Effects of biochar and cropping pattern on dry matter accumulation in aboveground organs of soybean. Different lowercase letters indicate significant differences at p < 0.05. Vertical lines represent the standard error (SE) of the mean.
3.4. Effects of Biochar Application and Cropping Pattern on Aboveground Nitrogen Accumulation in the Maize–Soybean System
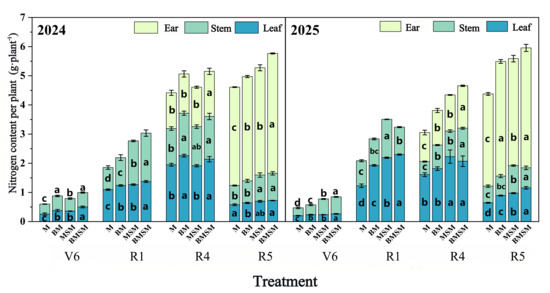
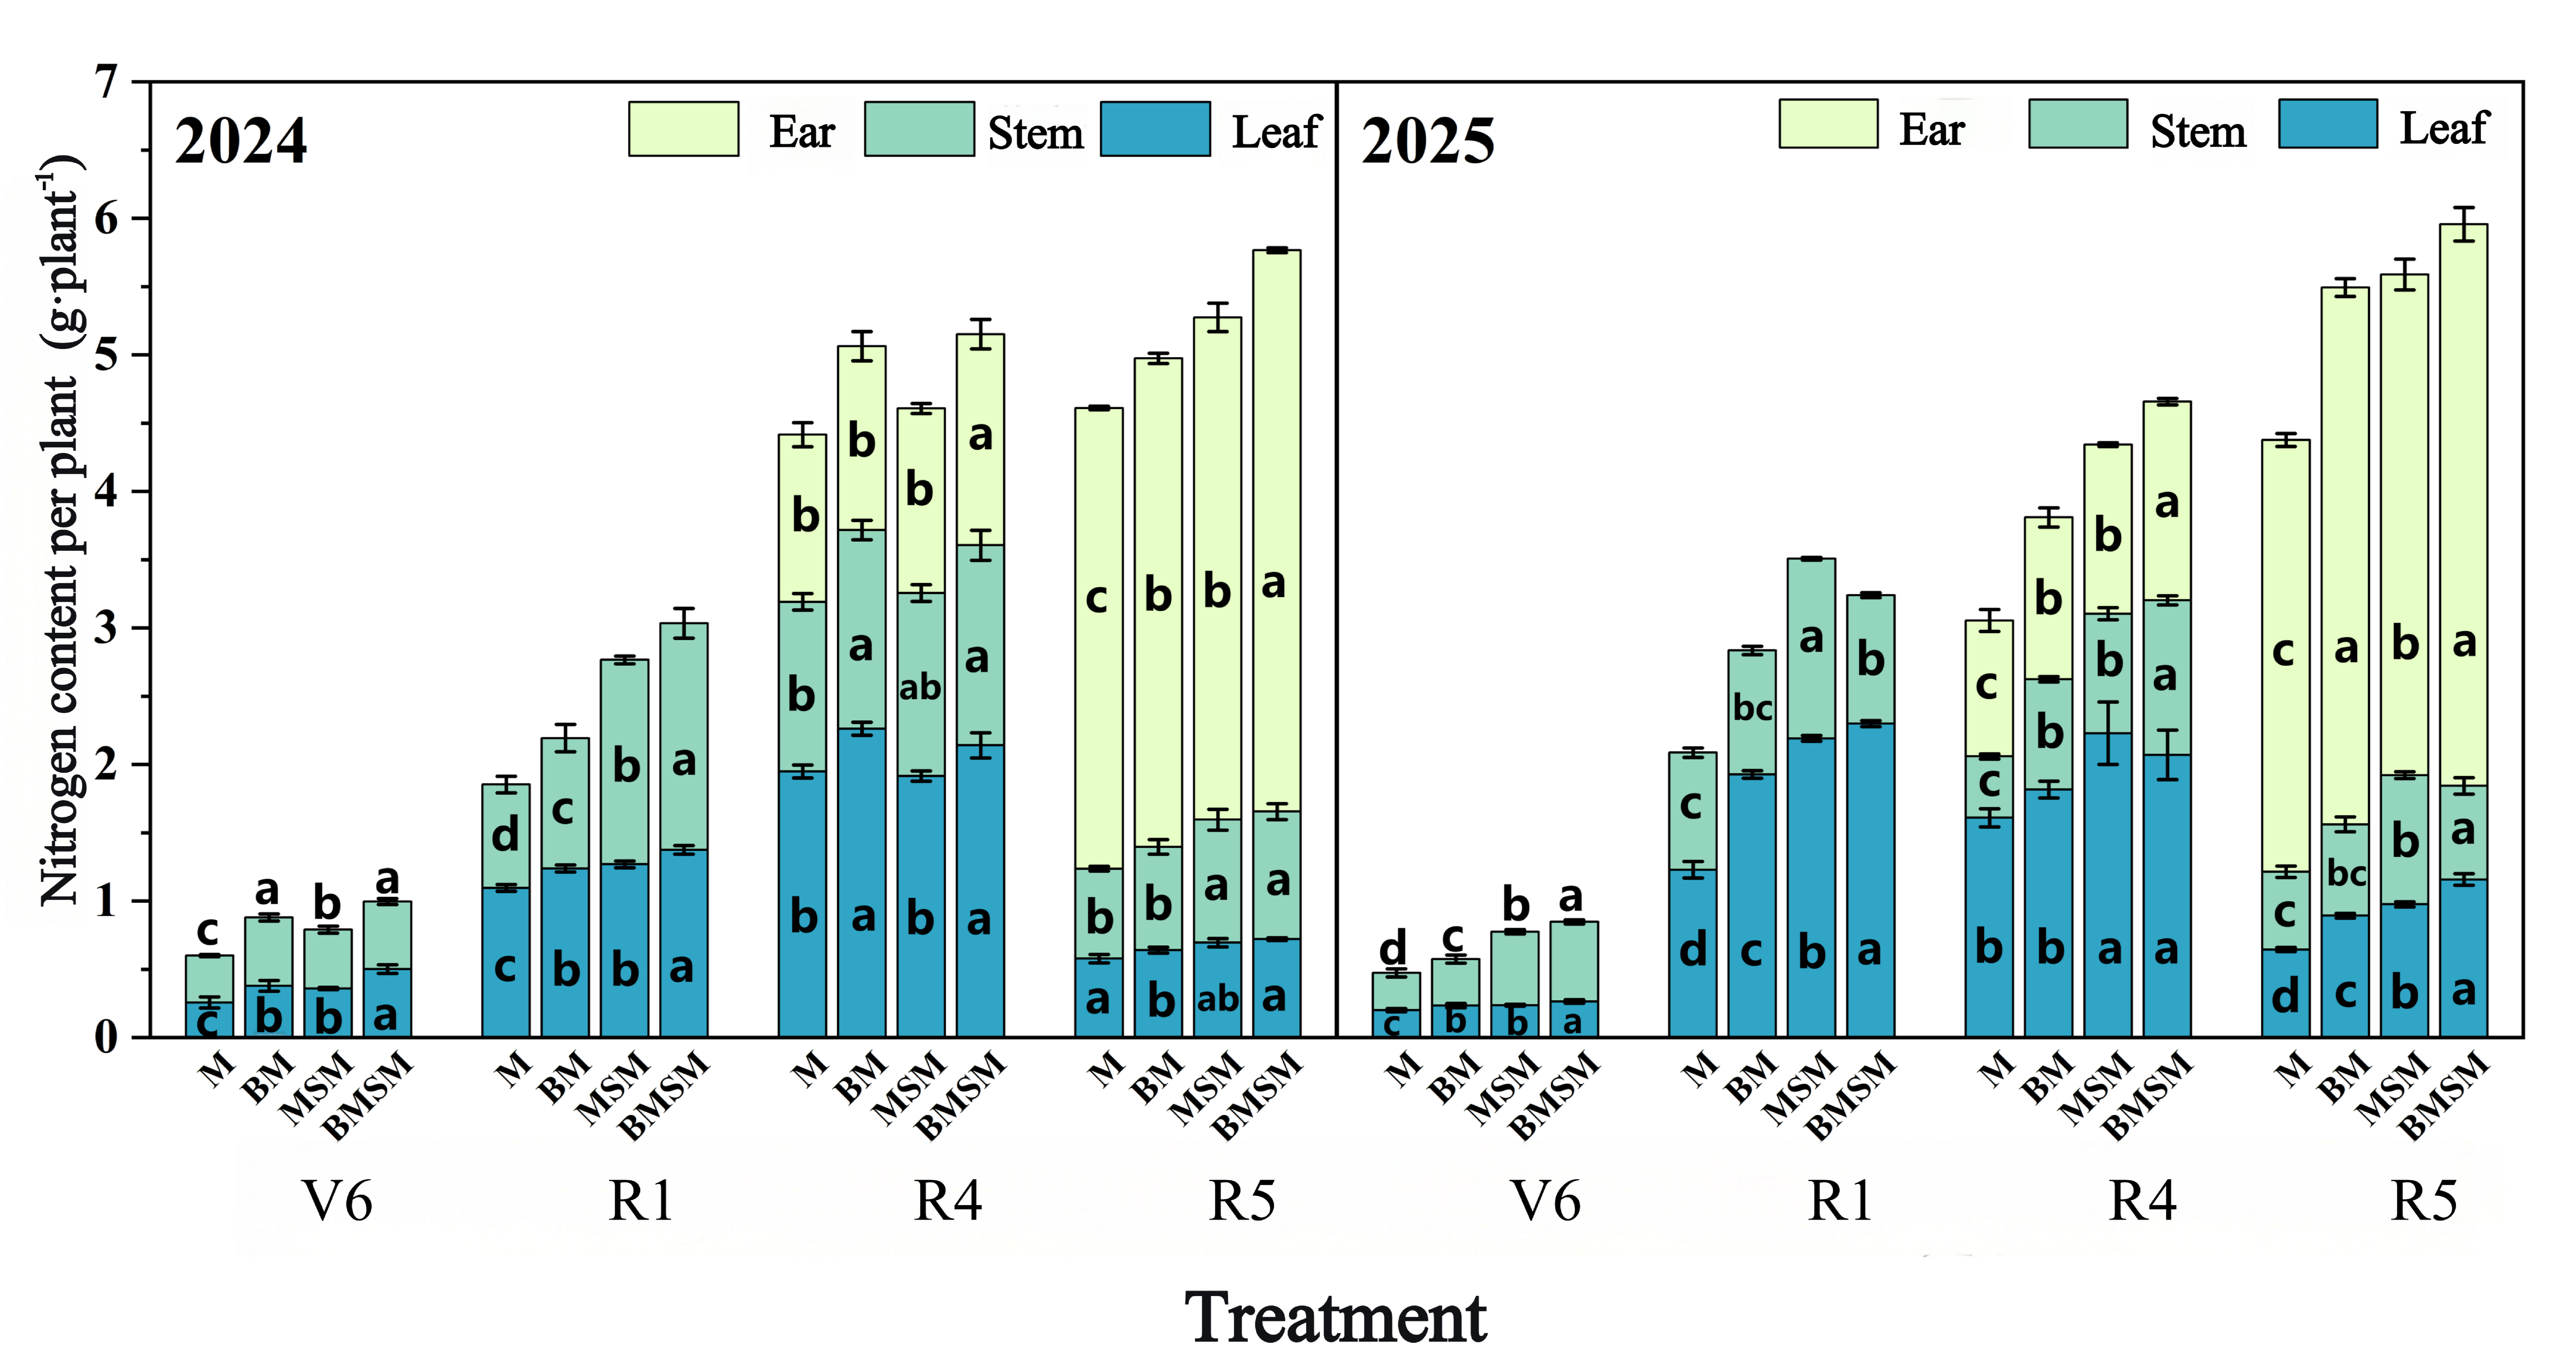
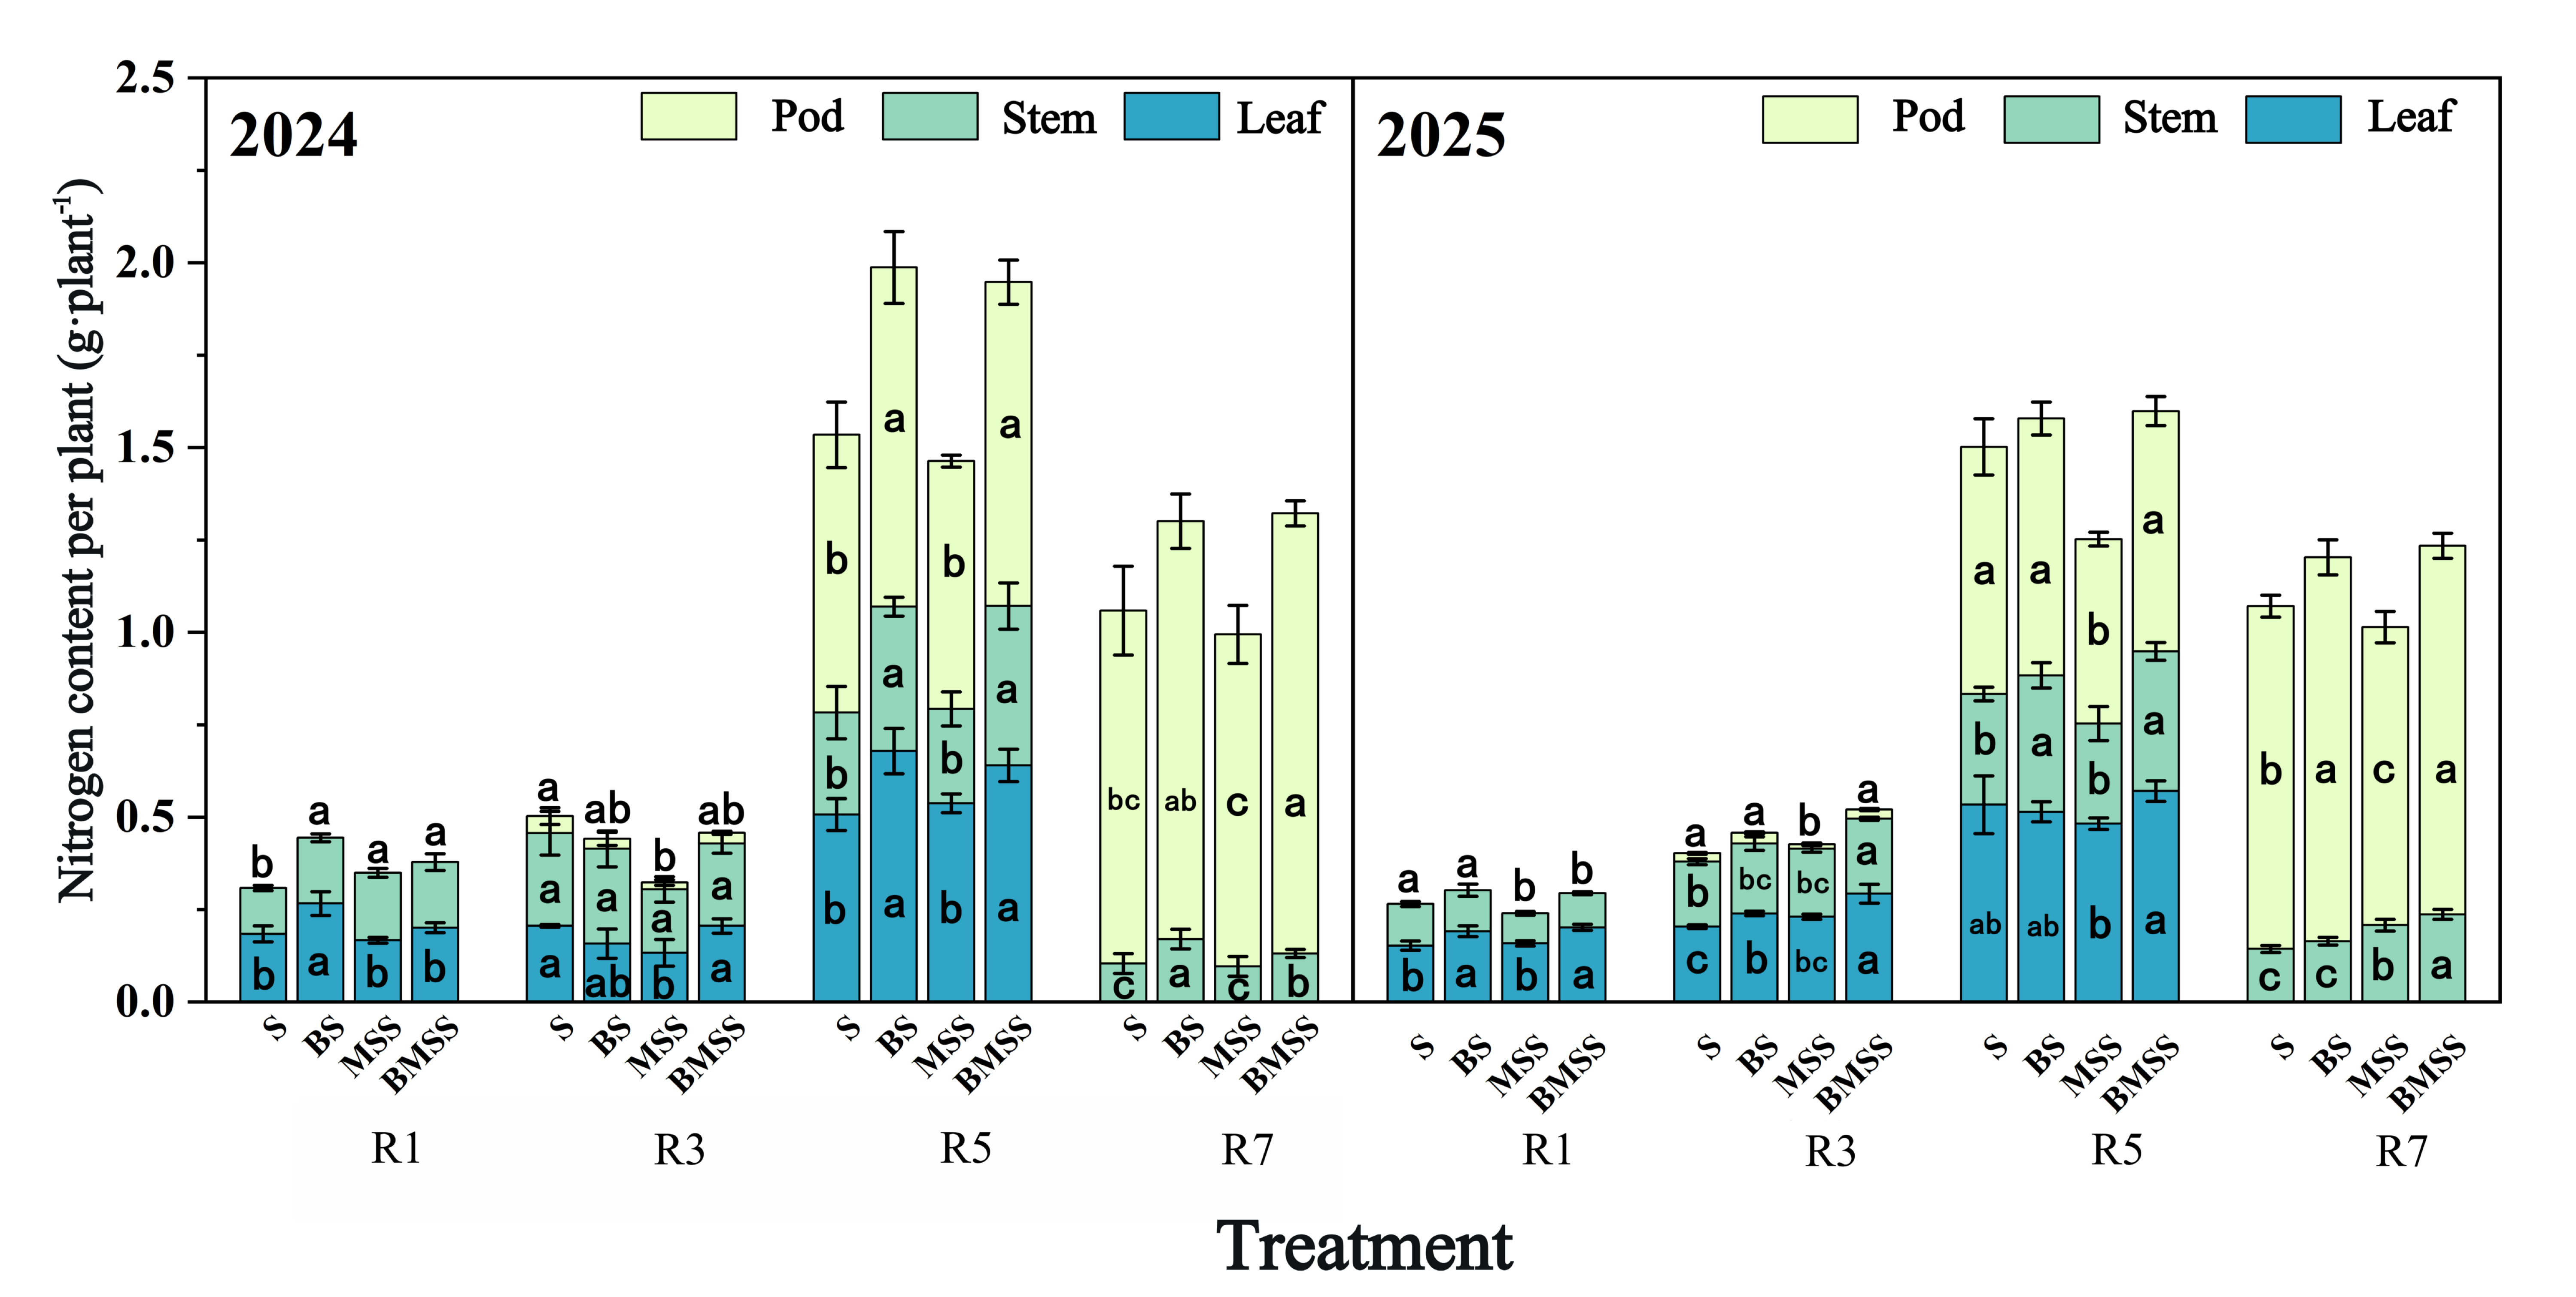
As shown in Figure 8, the nitrogen accumulation of maize organs was highly sensitive to cropping pattern and biochar application, and its overall variation trend was generally consistent with that of dry matter accumulation. In 2024, leaf nitrogen accumulation at the V6 stage under MSM and BMSM increased significantly by 39.84% and 47.85%, respectively, compared with M, while BMSM was significantly 32.06% higher than BM. At the V6 stage, leaf nitrogen accumulation under MSM, BM, and BMSM increased significantly by 15.80%, 13.03%, and 15.62%, respectively, compared with M, and BMSM was significantly 8.96% higher than BM. In stems at the R1 stage, MSM, BM, and BMSM increased significantly by 97.60%, 26.01%, and 73.86%, respectively, compared with M, while BMSM was significantly 5.97% higher than BM. In ears at the R1 stage, BMSM increased significantly by 7.30%, 6.38%, and 5.73% compared with M, MSM, and BM, respectively. At maturity, leaf nitrogen accumulation under MSM and BMSM increased significantly by 20.24% and 5.11%, respectively, compared with M, while BMSM was significantly 12.65% higher than BM. In stems, MSM and BMSM increased significantly by 36.80% and 22.42%, respectively, compared with M, and BMSM was significantly 23.49% higher than BM. Overall, both intercropping and biochar application promoted nitrogen accumulation in maize.
Figure 8.
Effects of biochar and cropping pattern on nitrogen accumulation in aboveground organs of maize. Different lowercase letters indicate significant differences at p < 0.05. Vertical lines represent the standard error (SE) of the mean.
In 2025, the promoting effects on maize nitrogen accumulation were further enhanced. At the V6 stage, leaf nitrogen accumulation under MSM, BM, and BMSM increased significantly by 13.36%, 6.11%, and 15.62%, respectively, compared with M, while BMSM was significantly 8.96% higher than BM. At maturity(R5), leaf nitrogen accumulation under BM, MSM, and BMSM increased significantly by 20.96%, 29.61%, and 33.24%, respectively, compared with M, and BMSM was significantly 10.15% and 2.80% higher than BM and MSM, respectively. In stems at the R1 stage, MSM, BM, and BMSM increased significantly by 11.72%, 14.03%, and 25.99%, respectively, compared with M, while BMSM was significantly 10.49% and 12.77% higher than BM and MSM, respectively. At maturity, stem nitrogen accumulation under MSM and BMSM increased significantly by 4.91% and 6.48%, respectively, compared with M, and BMSM was significantly 6.14% higher than BM. For ear nitrogen accumulation at the R1 stage, BMSM increased significantly by 10.50% and 12.23% compared with M and MSM, respectively. At maturity, ear nitrogen accumulation under BM, MSM, and BMSM increased significantly by 3.34%, 6.77%, and 13.22%, respectively, compared with M, while BMSM was significantly 9.56% and 6.04% higher than BM and MSM, respectively.
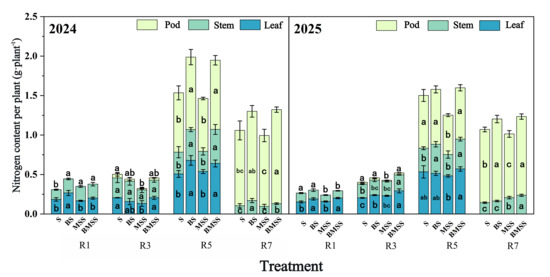
As shown in Figure 9, the aboveground nitrogen accumulation of soybean was relatively less affected by cropping pattern, whereas biochar application exhibited a relatively stable promoting effect. In 2024, leaf nitrogen accumulation at the flowering stage under BMSS decreased significantly by 21.46% compared with BS. At the pod-setting stage, MSS significantly decreased leaf nitrogen accumulation by 35.31% compared with S, indicating that intercropping markedly inhibited nitrogen accumulation in soybean leaves during this stage. For stem nitrogen accumulation at the flowering stage, BS and MSS increased significantly by 10.90% and 21.69%, respectively, compared with S. At maturity, stem nitrogen accumulation under BMSS was significantly 36.24% higher than that under MSS. For pod nitrogen accumulation at the seed-filling stage, BS significantly increased by 22.09% compared with S, while BMSS was significantly 30.73% higher than MSS. These results indicate that biochar application promoted nitrogen accumulation in both vegetative and reproductive organs of soybean.
Figure 9.
Effects of biochar and cropping pattern on nitrogen accumulation in aboveground organs of soybean. Different lowercase letters indicate significant differences at p < 0.05. Vertical lines represent the standard error (SE) of the mean.
In 2025, considerable interannual variation was observed in soybean nitrogen accumulation. At R1, leaf nitrogen accumulation under BS increased significantly by 22.46% compared with S. At R3, MSS and BMSS significantly increased leaf nitrogen accumulation by 16.98% and 40.05%, respectively, compared with S, while BMSS was significantly 31.51% and 19.72% higher than BS and MSS, respectively. At R5, BMSS significantly increased leaf nitrogen accumulation by 14.01% compared with MSS. For stem nitrogen accumulation at R1, MSS significantly decreased by 27.77% compared with S. At R5, BS significantly increased stem nitrogen accumulation by 29.35% compared with S, whereas BMSS was significantly 22.90% higher than MSS. At R7, stem nitrogen accumulation under BS, MSS, and BMSS increased significantly by 26.47%, 15.99%, and 23.86%, respectively, compared with S, while BMSS was significantly 6.79% higher than MSS. For pod nitrogen accumulation at R3, BMSS significantly decreased by 17.00% and 28.65% compared with S and BS, respectively, but was significantly 58.60% higher than MSS. At R5, MSS significantly decreased pod nitrogen accumulation by 18.11% compared with S, whereas BMSS significantly increased it by 35.19% compared with MSS. At R7, BS significantly increased pod nitrogen accumulation by 11.96% compared with S, while BMSS was significantly 23.66% higher than MSS. Overall, biochar application alleviated the adverse effects of intercropping on soybean nitrogen accumulation, although its promoting effects were mainly reflected in stems and certain pod developmental stages.
3.5. Effects of Biochar Application and Cropping Pattern on Aboveground Nitrogen Accumulation of Maize and Soybean
As shown in Table 3, cropping pattern was the dominant factor affecting the effective plant number of maize, with monocropping treatments showing significantly higher effective plant numbers than intercropping treatments. In 2024, the effective plant number of intercropped maize decreased significantly by an average of 53.81% compared with monocropped maize, while in 2025 the reduction averaged 45.18%.
Table 3.
Effects of biochar and cropping pattern on yield components of maize.
In terms of kernel number per ear and 1000-kernel weight, intercropped maize exhibited significant compensatory effects. In 2024, the kernel number per ear of intercropped maize increased significantly by 11.16–15.74% compared with monocropped maize, while the 1000-kernel weight increased significantly by 3.20–5.05%. In 2025, the kernel number per ear increased significantly by 5.56–11.14%, and the 1000-kernel weight increased by 3.75–5.42%. Specifically, in 2024, the kernel number per ear under MSM increased significantly by 12.60% compared with M and by 15.74% compared with BM. In 2025, the kernel number per ear under BMSM increased significantly by 11.13% compared with M and by 5.58% compared with BM. Regarding 1000-kernel weight, BMSM increased significantly by 3.69% and 5.05% compared with M and BM, respectively, in 2024, while the corresponding increases in 2025 were 5.42% and 3.75%.
For grain yield, although monocropped maize exhibited a clear advantage in effective plant number, intercropped maize compensated through increased kernel number per ear and 1000-kernel weight, thereby reducing the yield gap. In 2024, the grain yield of intercropped maize decreased significantly by an average of 41.61% compared with monocropped maize, whereas the reduction averaged 33.42% in 2025. The promoting effect of biochar application on maize yield was more pronounced under intercropping conditions. In 2025, the yield of BMSM increased significantly by 10.85% compared with MSM, slightly higher than the 10.37% increase observed for BM compared with M under monocropping conditions. These results indicate that biochar application contributed to strengthening the yield compensation mechanism of intercropped maize.
As shown in Table 4, the yield components of soybean were highly sensitive to cropping pattern. The effective plant number under monocropping treatments was significantly higher than that under intercropping treatments. In 2024, the effective plant number of intercropped soybean decreased significantly by an average of 55.95% compared with monocropped soybean, while in 2025 the average reduction was 32.60%.
Table 4.
Effects of biochar and cropping pattern on yield components of soybean.
Regarding grain number per plant, intercropped soybean was significantly lower than monocropped soybean. In 2024, the grain number per plant of intercropped soybean decreased significantly by an average of 8.96% compared with monocropped soybean, whereas in 2025 the average reduction was 7.99%. In contrast, differences in 100-grain weight among treatments were relatively small. The 100-grain weight of intercropped soybean increased by an average of 2.72% in 2024 but decreased by 1.81% in 2025 compared with monocropped soybean.
For grain yield, monocropped soybean was significantly higher than intercropped soybean. In 2024, the grain yield of intercropped soybean decreased significantly by an average of 58.71% compared with monocropped soybean, while in 2025 the average reduction was 45.31%. The promoting effect of biochar application on soybean yield was more pronounced under intercropping conditions. In 2025, the grain yield of BMSS increased significantly by 19.31% compared with MSS, which was markedly higher than the 10.39% increase observed for BS compared with S under monocropping conditions.
3.6. Effects of Biochar Application and Cropping Pattern on the Land Equivalent Ratio of the Maize–Soybean System
As shown in Table 5, the land equivalent ratio (LER) is an important indicator for evaluating land-use efficiency in intercropping systems. When LER > 1, the productivity of the intercropping system per unit land area exceeds that of the corresponding monocropping system, indicating a clear land-use advantage.
Table 5.
Effects of biochar and cropping pattern on land equivalent ratio of maize–soybean intercropping.
Based on the results from the two experimental years, the LER of the maize–soybean intercropping system without biochar application was generally close to or lower than 1. In 2024, the LER of the MSM + MSS treatment was 0.95, which was close to 1 but did not yet demonstrate a clear intercropping advantage. In 2025, the LER increased to 1.22, representing an increase of 28.42% compared with the previous year.
After biochar application, the land-use efficiency of the intercropping system increased markedly. In 2024, the LER of the BMSM + BMSS treatment reached 1.05, representing a 9.47% increase compared with the intercropping system without biochar application, indicating that biochar application enabled the maize–soybean intercropping system to exhibit a land-use advantage. As the experiment continued into the second year, this advantage became more pronounced. In 2025, the LER of the biochar-amended intercropping treatment increased to 1.21, which was 18.63% higher than that of the non-biochar intercropping treatment and 16.35% higher than that observed in 2024 under biochar application.
3.7. Effects of Biochar Application and Cropping Pattern on Interspecific Competition Intensity and Competitive Ratio in the Maize–Soybean System
As shown in Table 6, interspecific competition intensity (A) and competitive ratio (CR) are important indicators for evaluating resource competition relationships between different crops in intercropping systems. The A value reflects the direction of competitive advantage within the intercropping population, whereas the CR value is mainly used to quantify competition intensity and its relative magnitude.
Table 6.
Effects of biochar and cropping pattern on interspecific competitiveness and competition ratio in maize–soybean intercropping.
According to the interspecific competition intensity results, the A values of maize were positive in both experimental years, whereas those of soybean were negative, indicating that maize consistently occupied a competitive advantage in the maize–soybean intercropping system. Under conditions without biochar application, the interspecific competition intensity of maize was 1.14 in 2024, whereas that of soybean was −1.14. In 2025, the maize A value further increased to 1.32. Compared with 2024, the interspecific competition intensity of maize increased by 15.79%, indicating that the competitive advantage of maize in resource utilization was further strengthened with increasing cultivation duration, whereas soybean remained at a relative disadvantage in resource competition.
After biochar application, the interspecific competitive relationship changed noticeably. In the biochar-amended intercropping system, the maize A value was 1.13 in 2024, which was similar to that of the non-biochar treatment. However, in 2025, the value decreased to 1.07, representing an 18.94% reduction compared with the non-biochar treatment. Meanwhile, the absolute value of soybean interspecific competition intensity decreased markedly, suggesting that biochar application alleviated the competitive pressure exerted by maize on soybean and moderated the competitive relationship between the two crops.
The variation trend of competitive ratio was generally consistent with that of interspecific competition intensity. In both experimental years, the CR values of maize were greater than 1, whereas those of soybean were lower than 1, further demonstrating that maize possessed a stronger competitive ability for resources within the intercropping system. Under conditions without biochar application, the CR value of maize was 3.00 in 2024 and changed to 2.69 in 2025, representing a 10.33% decrease compared with the previous year. This result indicates that the competitive ability of maize for system resources did not increase but rather decreased slightly with increasing cultivation duration under this specific intercropping pattern.
Under biochar application, the competitive ratio of maize decreased markedly. In 2024, the maize CR value under the BMSM + BMSS treatment was 2.67, representing a 11.00% reduction compared with the non-biochar treatment. In 2025, it further decreased to 2.25, corresponding to a 16.36% reduction compared with the non-biochar treatment. Meanwhile, the CR value of soybean increased from 0.33 to 0.44. These results indicate that biochar application improved resource allocation within the intercropping system and enhanced the resource utilization capacity of soybean within the crop population, thereby weakening the competitive suppression exerted by maize on soybean.
4. Discussion
4.1. Effects of Biochar Application and Intercropping on Leaf Functional Traits and Photosynthetic Performance
Biochar application and cropping pattern exerted significant interactive effects on the physiological characteristics of maize and soybean [24,25]. Under intercropping conditions, maize, as a tall C4 crop, exhibited a competitive advantage, and its SPAD values and leaf gas exchange parameters, including net photosynthetic rate (Pn), transpiration rate (Tr), stomatal conductance (Gs), and intercellular CO2 concentration (Ci), were generally higher than those under monocropping. This advantage was particularly pronounced during the grain-filling stage, when the net photosynthetic rate of the MSM treatment in 2024 increased by 69.79% compared with monocropping. This enhancement may be partly attributed to possible improvements in canopy microclimate and a strengthened border-row effect under intercropping, which could have delayed leaf senescence and maintained relatively high photosynthetic activity during the later growth stages [26,27]. In addition, soybean nitrogen fixation and nitrogen transfer may also have contributed to improved nitrogen nutrition and sustained growth of maize under intercropping conditions. Biochar application further enhanced the photosynthetic capacity of maize. The BMSM treatment showed significantly higher net photosynthetic rate, stomatal conductance, and transpiration rate than the MSM treatment, with the greatest increases observed at the V6 and R1 stages, indicating that biochar exerted a cumulative promoting effect on maize photosynthetic performance [28]. The positive effects of biochar may be associated with its porous structure, which has been reported to improve soil physical properties and nutrient retention in previous studies [29,30].
Soybean showed a more sensitive response to cropping pattern. The photosynthetic rate of intercropped soybean was significantly lower than that of monocropped soybean during the early growth stages (V5 and R2), but compensatory recovery occurred during the pod-setting and seed-filling stages (R4 and R6), showing a “suppression–recovery” pattern. This phenomenon reflected both the adaptability of legumes to low-light environments and the spatiotemporal complementarity within the intercropping system [31]. Biochar application significantly alleviated the stress imposed by interspecific competition on soybean. The BMSS treatment exhibited significantly higher net photosynthetic rate, stomatal conductance, and transpiration rate than the MSS treatment during the later growth stages. These effects may be associated with biochar-induced improvements in the soybean rhizosphere microenvironment and enhanced root absorption of water and nutrients, as previously reported [32,33], suggesting that biochar may contribute to improved soybean performance under intercropping conditions. The generally greater improvements observed in 2025 may also have been associated with the wetter growing-season conditions, which could have enhanced the positive effects of biochar on soil water retention and nutrient availability. These findings provide a theoretical basis for optimizing interspecific relationships in intercropping systems through biochar application.
4.2. Effects of Biochar Application and Intercropping on Dry Matter and Nitrogen Accumulation
Dry matter accumulation and nitrogen uptake are the material basis of crop yield formation and important indicators for evaluating the effects of agricultural management practices [34]. The present study demonstrated that intercropping significantly promoted dry matter accumulation and nitrogen uptake in maize, and this effect became more pronounced during the later growth stages. This finding is consistent with the results of Yang et al. [35], who reported that intercropping improved light resource utilization efficiency through border-row advantages and interspecific complementarity. In terms of nitrogen distribution, the nitrogen accumulation of all maize organs under intercropping was generally higher than that under monocropping. For instance, stem nitrogen accumulation at the R4 stage in 2024 increased by 68.42%, indicating that intercropping promoted nitrogen accumulation in vegetative organs and thereby provided sufficient nitrogen sources for subsequent grain filling. Meanwhile, biological nitrogen fixation and potential nitrogen transfer from soybean may have further enhanced nitrogen supply within the system [36].
In contrast, dry matter accumulation and nitrogen uptake of soybean were inhibited to some extent under intercropping conditions. However, biochar application significantly alleviated this inhibitory effect. At maturity in 2024, pod dry matter accumulation and nitrogen accumulation under BMSS increased by 10.36% and 15.52%, respectively, compared with MSS, while the corresponding increases in 2025 were 8.99% and 10.70%. Previous results suggest that biochar may have alleviated interspecific competition pressure, possibly through improving soil physicochemical properties and rhizosphere conditions and by enhancing rhizobial activity and biological nitrogen fixation capacity [37]. Biochar may increase soil nutrient availability and improve pore structure, thereby facilitating root expansion and water/nutrient uptake, which could ultimately enhance soybean stress resistance and resource utilization efficiency [38]. These potential pathways are consistent with our observed results but require further verification. This result is consistent with the findings of Li et al. [39] in intercropping systems and further supports biochar application and intercropping in improving crop productivity.
4.3. Effects of Biochar Application and Intercropping on Yield Formation, Land-Use Efficiency, and Interspecific Competition Relationships
Yield components and land equivalent ratio (LER) are important criteria for evaluating the performance of cropping systems [40]. In the present study, intercropped maize partially compensated for the yield loss caused by reduced planting density through increases in kernel number per ear and 1000-kernel weight. In 2025, compared with the M treatment, kernel number per ear and 1000-kernel weight under the BMSM treatment increased by 11.13% and 5.42%, respectively, while grain yield increased by 10.85% compared with MSM, indicating that biochar application significantly strengthened the yield compensation mechanism of intercropped maize. Although the yield of intercropped soybean remained significantly lower than that of monocropped soybean, the LER values under biochar application were consistently greater than 1 and reached 1.21 in 2025, indicating that the combination of intercropping and biochar application conferred a clear land-use advantage.
Analysis of interspecific competition intensity and competitive ratio further revealed that biochar application reduced the competitive pressure exerted by maize on soybean [41]. These findings are consistent with those reported by Li et al. [42], who demonstrated that appropriate biochar application could optimize the competitive relationship between dominant and subordinate crops in maize–soybean systems and thereby improve overall system productivity.
5. Conclusions
The present study demonstrated that biochar application and maize–soybean intercropping were associated with improvements in crop physiological traits, dry matter accumulation, nitrogen accumulation, and system productivity. Intercropping strengthened the competitive advantage of maize and maintained relatively high productivity by enhancing photosynthetic capacity and promoting compensatory growth at the individual plant level. In contrast, soybean growth was suppressed during the early and middle growth stages due to asymmetric interspecific competition. During the later growth stages, biochar application may have helped maintain leaf physiological activity, which may have contributed to greater dry matter and nitrogen accumulation in soybean. This response could partially alleviate the competitive disadvantage of soybean under intercropping conditions, although soybean still remained relatively disadvantaged overall.
At the system level, these processes were reflected in increased land equivalent ratio and reduced competition intensity. Therefore, the combination of biochar application and intercropping was associated with improved maize growth performance, reduced competitive suppression on soybean, and improved system productivity and resource-use efficiency.
Author Contributions
Conceptualization, X.Z. and W.C.; methodology, X.Z., D.Q. and W.C.; software, X.Z.; validation, X.Z., W.C., D.Q., J.L. and J.C.; formal analysis, W.C.; investigation, X.Z., D.Q. and W.C.; resources, W.C.; data curation, X.Z. and J.L.; writing—original draft preparation, X.Z.; writing—review and editing, J.L.; visualization, F.W.; supervision, D.Q., F.W. and Z.W.; project administration, W.C.; funding acquisition, W.C. All authors have read and agreed to the published version of the manuscript.
Funding
Inner Mongolia Autonomous Region Department of Education Special Research Project on Carbon Peaking and Carbon Neutrality in Higher Education Institutions, grant number (STZX202314); National Natural Science Foundation of China, grant number (32160506).
Data Availability Statement
The data reported in this study are contained within the article.
Conflicts of Interest
The authors declare no conflicts of interest.
Abbreviations
The following abbreviations are used in this manuscript:
| SPAD | Soil–Plant Analysis Development |
| Pn | Net Photosynthetic Rate |
| Tr | Transpiration Rate |
| Gs | Stomatal Conductance |
| Ci | Intercellular CO2 Concentration |
| LER | Land Equivalent Ratio |
| CR | Competition Ratio |
| CEC | Cation Exchange Capacity |
References
- Raza, M.A.; Gul, H.; Wang, J.; Yasin, H.S.; Qin, R.; Khalid, M.H.B.; Naeem, M.; Iqbal, N.; Gitari, H.; Yang, W. Land productivity and water use efficiency of maize–soybean strip intercropping systems in semi-arid areas. J. Clean. Prod. 2021, 308, 127282. [Google Scholar] [CrossRef] [Scilit]
- Liu, X.; Meng, L.; Yin, T.; Wang, X.; Zhang, S.; Cheng, Z.; Li, S. Maize–soybean intercropping improves yield stability under different nitrogen application rates. Field Crops Res. 2023, 301, 109015. [Google Scholar] [CrossRef] [Scilit]
- Li, L.; Tilman, D.; Lambers, H.; Zhang, F. Plant diversity and overyielding: Insights from intercropping systems. Proc. Natl. Acad. Sci. USA 2014, 111, 1441–1446. [Google Scholar]
- Yu, Y.; Stomph, T.J.; Makowski, D.; van der Werf, W. Temporal niche differentiation increases land equivalent ratio of annual intercrops. Field Crops Res. 2015, 184, 133–144. [Google Scholar] [CrossRef] [Scilit]
- Gou, F.; Van Ittersum, M.K.; Simon, E.; Leffelaar, P.A.; van der Putten, P.E.L.; Zhang, L.; van der Werf, W. Intercropping wheat and maize increases total radiation interception and wheat RUE but lowers maize RUE. Eur. J. Agron. 2017, 84, 125–139. [Google Scholar] [CrossRef] [Scilit]
- Chimonyo, V.G.P.; Snapp, S.S.; Chikowo, R.; Giller, K.E.; Corbeels, M. Perennial legume intercrops provide multiple belowground ecosystem services in smallholder farming systems. Agric. Ecosyst. Environ. 2021, 320, 107566. [Google Scholar] [CrossRef] [Scilit]
- Feng, L.; Raza, M.A.; Chen, Y.; Khalid, M.H.B.; Meraj, T.A.; Ahsan, F.; Fan, Y.; Du, J.; Wu, X.; Song, C.; et al. Narrow-wide row planting pattern improves the light environment and seed yields of intercrop species in relay intercropping system. PLoS ONE 2019, 14, e0212885. [Google Scholar] [CrossRef] [Scilit] [PubMed]
- Raza, M.A.; Yasin, H.S.; Gul, H.; Qin, R.; Mohi Ud Din, A.; Khalid, M.H.B.; Hussain, S.; Gitari, H.; Saeed, A.; Wang, J.; et al. Maize/soybean strip intercropping produces higher crop yields and saves water under semi-arid conditions. Front. Plant Sci. 2022, 13, 1006720. [Google Scholar] [CrossRef] [Scilit]
- Nasar, J.; Ahmad, M.; Gitari, H.; Tang, L.; Chen, Y.; Zhou, X.-B. Maize/soybean intercropping increases nutrient uptake, crop yield and modifies soil physio-chemical characteristics and enzymatic activities in the subtropical humid region based in Southwest China. BMC Plant Biol. 2024, 24, 434. [Google Scholar] [CrossRef] [Scilit]
- Liu, X.; Rahman, T.; Song, C.; Su, B.; Yang, F.; Yong, T.; Wu, Y.; Zhang, C.; Yang, W. Changes in light environment, morphology, growth and yield of soybean in maize-soybean intercropping systems. Field Crops Res. 2017, 200, 38–46. [Google Scholar] [CrossRef] [Scilit]
- Liu, X.; Rahman, T.; Song, C.; Yang, F.; Su, B.; Cui, L.; Bu, W.; Yang, W. Relationships among light distribution, radiation use efficiency and land equivalent ratio in maize-soybean strip intercropping. Field Crops Res. 2018, 224, 91–101. [Google Scholar] [CrossRef] [Scilit]
- Nasar, J.; Zhao, C.J.; Khan, R.; Gul, H.; Gitari, H.; Shao, Z.; Abbas, G.; Haider, I.; Iqbal, Z.; Ahmed, W.; et al. Maize-soybean intercropping at optimal N fertilization increases the N uptake, N yield and N use efficiency of maize crop by regulating the N assimilatory enzymes. Front. Plant Sci. 2023, 13, 1077948. [Google Scholar] [CrossRef] [Scilit] [PubMed]
- Raza, M.A.; Wang, Z.; Yasin, H.S.; Gul, H.; Qin, R.; Rehman, S.U.; Mahmood, A.; Iqbal, Z.; Ahmed, Z.; Luo, S.; et al. Effect of crop combination on yield performance, nutrient uptake, and land use advantage of cereal/legume intercropping systems. Field Crops Res. 2023, 304, 109144. [Google Scholar] [CrossRef] [Scilit]
- Singh, H.; Rice, C.W.; Zhang, X.; Li, Y.; Kumar, S.; Wang, J.; Chen, L.; Patel, M.; Zhao, F.; Gupta, R.; et al. Biochar applications influence soil physical and chemical properties, microbial diversity, and crop productivity: A meta-analysis. Biochar 2022, 4, 8. [Google Scholar] [CrossRef] [Scilit]
- Nepal, J.; Ahmad, W.; Khan, R.; Ali, S.; Zhang, Y.; Li, M.; Hussain, M.; Chen, Z.; Wang, X.; Liu, J.; et al. Advances and prospects of biochar in improving soil fertility, biochemical quality, and environmental applications. Front. Environ. Sci. 2023, 11, 1114752. [Google Scholar] [CrossRef] [Scilit]
- Jeffery, S.; Verheijen, F.G.A.; van der Velde, M.; Bastos, A.C. A quantitative review of the effects of biochar on crop productivity. Agric. Ecosyst. Environ. 2011, 144, 175–187. [Google Scholar] [CrossRef] [Scilit]
- Xiao, L.; Lin, Y.; Chen, D.; Zhao, K.; Wang, Y.; You, Z.; Zhao, R.; Xie, Z.; Liu, J. Maximizing crop yield and water productivity through biochar application: A global synthesis of field experiments. Agric. Water Manag. 2024, 305, 109134. [Google Scholar] [CrossRef] [Scilit]
- Luan, C.; He, W.; Su, X.; Wang, X.; Bai, Y.; Wang, L. Effects of biochar on soil water and temperature, nutrients, and yield of maize/soybean and maize/peanut intercropping systems. Int. Agrophys. 2021, 35, 365–373. [Google Scholar] [CrossRef] [Scilit]
- Jiang, Y.; Li, T.; Xu, X.; Sun, J.; Pan, G.; Cheng, K. A global assessment of the long-term effects of biochar application on crop yield. Curr. Res. Environ. Sustain. 2024, 7, 100247. [Google Scholar] [CrossRef] [Scilit]
- Hou, S.; Sun, X.; Chen, G.; Siddique, K.H.M.; Chen, Z.; Liu, F.; Ping, S.; Lai, H.; Guo, H.; An, Y.; et al. Biochar addition mitigates asymmetric competition of water and increases yield advantages of maize–alfalfa strip intercropping systems in a semiarid region on the Loess Plateau. Field Crops Res. 2024, 319, 109645. [Google Scholar] [CrossRef] [Scilit]
- Luo, K.; Xie, C.; Yuan, X.; Liu, S.; Chen, P.; Du, Q.; Zheng, B.; Fu, Z.; Wang, X.; Yong, T.; et al. Biochar and biofertilizer reduced nitrogen input and increased soybean yield in the maize soybean relay strip intercropping system. BMC Plant Biol. 2023, 23, 38. [Google Scholar] [CrossRef] [Scilit]
- Gitari, H.I.; Nyawade, S.O.; Kamau, S.; Karanja, N.N.; Gachene, C.K.K.; Raza, M.A.; Maitra, S.; Schulte-Geldermann, E. Revisiting intercropping indices with respect to potato–legume intercropping systems. Field Crops Res. 2020, 258, 107957. [Google Scholar] [CrossRef] [Scilit]
- Willey, R.W.; Rao, M.R. A competitive ratio for quantifying competition between intercrops. Exp. Agric. 1980, 16, 117–125. [Google Scholar] [CrossRef] [Scilit]
- Wang, L.; Yu, B.; Ji, J.; Khan, I.; Li, G.; Rehman, A.; Liu, D.; Li, S. Assessing the impact of biochar and nitrogen application on yield, water-nitrogen use efficiency and quality of intercropped maize and soybean. Front. Plant Sci. 2023, 14, 1171547. [Google Scholar] [CrossRef] [Scilit]
- Brooker, R.W.; Bennett, A.E.; Cong, W.F.; Daniell, T.J.; George, T.S.; Hallett, P.D.; Hawes, C.; Iannetta, P.P.M.; Jones, H.G.; Karley, A.J.; et al. Improving intercropping: A synthesis of research in agronomy, plant physiology and ecology. New Phytol. 2015, 206, 107–117. [Google Scholar] [CrossRef] [Scilit] [PubMed]
- Yin, W.; Chai, Q.; Fan, Z.; Hu, F.; Zhao, L.; Fan, H.; He, W.; Zhao, C.; Yu, A.; Sun, Y.; et al. Review on physiological and ecological characteristics and agronomic regulatory pathways of intercropping to delay root and canopy senescence of crops. J. Integr. Agric. 2025, 24, 1–22. [Google Scholar] [CrossRef] [Scilit]
- Martin-Guay, M.-O.; Paquette, A.; Dupras, J.; Rivest, D. The new green revolution: Sustainable intensification of agriculture by intercropping. Sci. Total Environ. 2018, 615, 767–772. [Google Scholar] [CrossRef] [Scilit]
- Gu, Y.R.; Ibitoye, R.G.; He, J.J.; Gao, F.; Zhou, X.B. Photosynthetic performance and yield of intercropped maize and soybean under different planting densities. J. Sci. Food Agric. 2025, 105, 7440–7452. [Google Scholar] [CrossRef] [Scilit] [PubMed]
- Zhang, Y.; Wang, J.; Feng, Y. The effects of biochar addition on soil physicochemical properties: A review. Catena 2021, 202, 105284. [Google Scholar] [CrossRef] [Scilit]
- Akmal, M.; Maqbool, Z.; Khan, K.S.; Hussain, Q.; Ijaz, S.S.; Iqbal, M.; Aziz, I.; Hussain, A.; Abbas, M.S.; Rafa, H.U. Integrated use of biochar and compost to improve soil microbial activity, nutrient availability, and plant growth in arid soil. Arab. J. Geosci. 2019, 12, 232. [Google Scholar] [CrossRef] [Scilit]
- Zhang, G.; Li, Z.; Zhu, Q.; Yang, C.; Shu, H.; Gao, Z.; Du, X.; Wang, F.; Ye, L.; Liu, R. Cropping patterns and plant population density alter nitrogen partitioning among photosynthetic components, leaf photosynthetic capacity and photosynthetic nitrogen use efficiency in field-grown soybean. Ind. Crops Prod. 2025, 226, 120680. [Google Scholar] [CrossRef] [Scilit]
- Egamberdieva, D.; Ma, H.; Reckling, M.; Omari, R.A.; Wirth, S.; Bellingrath-Kimura, S.D. Interactive Effects of Biochar, Nitrogen, and Phosphorous on the Symbiotic Performance, Growth, and Nutrient Uptake of Soybean (Glycine max L.). Agronomy 2022, 12, 27. [Google Scholar] [CrossRef] [Scilit]
- Zheng, B.; Chen, P.; Du, Q.; Yang, H.; Luo, K.; Wang, X.; Yang, F.; Yong, T.; Yang, W. Straw incorporation and nitrogen reduction effect on the uptake and use efficiency of nitrogen as well as soil CO2 emission of relay strip intercropped soybean. Front. Plant Sci. 2022, 13, 1036170. [Google Scholar] [CrossRef] [Scilit] [PubMed]
- Fan, Y.; Wang, Z.; Liao, D.; Raza, M.A.; Wang, B.; Zhang, J.; Chen, J.; Feng, L.; Wu, X.; Liu, C.; et al. Uptake and utilization of nitrogen, phosphorus and potassium as related to yield advantage in maize-soybean intercropping under different row configurations. Sci. Rep. 2020, 10, 9504. [Google Scholar] [CrossRef] [Scilit] [PubMed]
- Yang, S.; Zhao, Y.; Xu, Y.; Cui, J.; Li, T.; Hu, Y.; Qian, X.; Li, Z.; Sui, P.; Chen, Y. Yield performance response to field configuration of maize and soybean intercropping in China: A meta-analysis. Field Crops Res. 2024, 306, 109235. [Google Scholar] [CrossRef] [Scilit]
- Zhang, B.C.; Zhang, J.; Liu, J.; Wang, X.; Li, Y.; Chen, P.; Zhao, H.; Yang, F.; Yong, T.; Du, Q.; et al. Maize–legume intercropping promote N uptake through changing the root spatial distribution, legume nodulation capacity, and soil N availability. J. Integr. Agric. 2022, 21, 1755–1771. [Google Scholar] [CrossRef] [Scilit]
- Farhangi-Abriz, S.; Torabian, S.; Qin, R.; Noulas, C.; Lu, Y.; Gao, S. Biochar effects on yield of legumes and biological nitrogen fixation under different soil environments: A meta-analysis. Sci. Total Environ. 2021, 775, 145869. [Google Scholar] [CrossRef] [Scilit]
- Cui, X.; Yuan, J.; Yang, X.; Wei, C.; Bi, Y.; Sun, Q.; Meng, J.; Han, X. Biochar application alters soil metabolites and nitrogen cycle-related microorganisms in a soybean continuous cropping system. Sci. Total Environ. 2024, 917, 170522. [Google Scholar] [CrossRef] [Scilit]
- Li, L.; Tilman, D.; Lambers, H.; Zhang, F.-S. Plant diversity and overyielding: Insights from belowground facilitation in intercropping systems. New Phytol. 2014, 203, 63–69. [Google Scholar] [CrossRef] [Scilit]
- Feng, C.; Sun, Z.; Zhang, L.; Feng, L.; Zheng, J.; Bai, W.; Gu, C.; Wang, Q.; Xu, Z.; van der Werf, W. Maize/peanut intercropping increases land productivity: A meta-analysis. Field Crops Res. 2021, 270, 108208. [Google Scholar] [CrossRef] [Scilit]
- Feng, L.; Yang, W.; Zhou, Q.; Tang, H.; Ma, Q.; Huang, G.; Wang, S. Effects of interspecific competition on crop yield and nitrogen utilisation in maize–soybean intercropping system. Plant Soil Environ. 2021, 67, 460–467. [Google Scholar] [CrossRef] [Scilit]
- Feng, L.; Yang, W.; Tang, H.; Huang, G.; Wang, S. Bandwidth row ratio configuration affects interspecific effects and land productivity in maize–soybean intercropping system. Agronomy 2022, 12, 3095. [Google Scholar] [CrossRef] [Scilit]

Disclaimer/Publisher’s Note: The statements, opinions and data contained in all publications are solely those of the individual author(s) and contributor(s) and not of MDPI and/or the editor(s). MDPI and/or the editor(s) disclaim responsibility for any injury to people or property resulting from any ideas, methods, instructions or products referred to in the content. |
© 2026 by the authors. Licensee MDPI, Basel, Switzerland. This article is an open access article distributed under the terms and conditions of the Creative Commons Attribution (CC BY) license.