Abstract
Amidst the rapid development of renewable energy, wind power, as a major renewable energy source, has raised ecological concerns regarding its impacts on ecosystems and biodiversity. Insects, as direct displays and feedback of the environment, have become a hot topic in ecology and conservation biology research due to the impact of environmental changes on them. So this study investigates the effects of wind power density on insect diversity and their mechanisms in the Ningxia desert steppe wind farms. The results indicated that minimal disturbance marginally increased insect aggregation at low wind power densities (2 turbines/km2). However, higher wind power densities caused pronounced insect population declines toward turbines (6, 11 turbines/km2), and with the increase in wind power density, the number of insects decreased significantly. Increased wind power disturbance led to decreases in soil total nitrogen (TN), total carbon (TC), nitrate nitrogen (NO3−-N), and soil moisture content (SM) and a significant decrease in total phosphorus (TP). While direct impacts on vegetation were relatively minor and irregular, vegetation height exhibited strong positive correlations with soil nutrient depletion, suggesting that wind-induced soil degradation indirectly constrains plant growth. Consequently, the effect of wind power on insects is mediated through coupled vegetation–soil interactions. These findings underscore the necessity of integrating ecological thresholds into wind farm management protocols.
1. Introduction
Currently, the proposal of the Milankovitch hypothesis and related theories has enabled humanity to explain the cyclical oscillations between glacial and interglacial pe-riods on Earth over million-year timescales. Yet in today’s era of global warming—in response to the global climate crisis (like global warming and extreme weather) and rapid transformation of energy structures, wind power has emerged as a cornerstone of renewable energy. According to forecasts by the Global Wind Energy Council (GWEC), global newly installed wind power capacity will reach 5.57 × 10⁸ kW during 2022–2026, demonstrating sustained industry growth [1]. While vigorously developing wind power generation, its impacts on ecosystems have received increasing attention [2,3].
The desert steppe exhibits typical regional representativeness and plays a crucial role in promoting local agro-pastoral development and maintaining ecological balance. However, due to soil erosion, drought, and desertification, this grassland type is highly vulnerable to climate change [4,5]. It features the lowest species diversity and potential productivity, poor stability, extreme susceptibility to degradation, and difficulty in recovery once damaged by climate change or human activities [6]. Characterized by a fragile ecosystem, it is regarded as the “threshold state” of grasslands [7]. Under the combined effects of uneven regional precipitation distribution, climate change, and anthropogenic disturbances, the desert steppe ecosystem suffers severe degradation, leading to adverse impacts on insect populations and vegetation diversity [8,9].
Ningxia possesses abundant land resources such as deserts, Gobi deserts, and barren lands, offering unparalleled advantages for wind energy development. In recent years, wind power generation in Ningxia has achieved rapid progress. Over ten wind farms, including Taiyangshan, Ningdong, and Xiangshan, have been constructed. While vigorously developing wind power generation, questions about whether it affects ecosystems and biodiversity have drawn increasing attention and verification. Existing studies indicate that wind farms have indeed exerted certain influences on ecosystems [10,11,12]. For example, during the operation of wind power, it will cause disturbance to atmospheric circulation, change the local microclimate, and affect the water, fertilizer, gas and heat conditions in local areas, thus changing the ground temperature and precipitation, which may be related to existing studies demonstrated that onshore wind farm construction affects land resources by altering soil structure, functional properties, and physicochemical characteristics—including increased soil bulk density, reduced moisture content, and decreased nutrient levels—which subsequently negatively impact vegetation [13,14,15]. Furthermore, wind farms generate environmental disturbances such as noise pollution, visual intrusion, and electromagnetic radiation [16,17,18,19,20,21].
Insects perform essential ecological functions, including foraging, pollination, decomposition, and soil aeration, making them critical bioindicators of environmental health [22,23]. As primary consumers and decomposers in ecosystems, they play pivotal roles in grassland restoration and ecological succession [24,25]. Together with vegetation and soil, insects form fundamental components of ecosystems, driving material cycling and nutrient flows [25,26]. Their biodiversity levels serve as indirect proxies for assessing broader biological diversity [27].
The impacts of wind power on insects primarily manifest through three interconnected pathways. First, the color setting and heat generated by wind turbines will attract insects, and the rotation of wind turbine blades will cause direct mechanical damage to flying insects, which will adversely affect the insect population [28,29,30]. Second, noise and electromagnetic interference exist in the whole process of wind turbine operation, and most insects will be affected by noise and electromagnetic interference to communication, navigation, courtship and other life activities [31,32,33,34,35]. Third, vegetation destruction during wind farm construction and operational maintenance cascades into impaired individual development and population decline through trophic interactions [36].
Current research on wind power’s ecological impacts predominantly focuses on birds, bats, mammalian species, and aquatic organisms, while largely neglecting insect communities in grassland ecosystems [37,38,39,40,41,42,43]. In view of the dominant position of Coleoptera insects in the desert grassland of Ningxia and insects’ ecological significance and the understudied effects of wind farm operations, this study conducted comprehensive field investigations at the Taiyangshan desert steppe wind farm in Wuzhong City, Ningxia, China, in 2024. To systematically assess epigeal beetle diversity, we collected synchronic vegetation and soil data. Through gradient analysis of wind power density, we aimed to unravel the response mechanisms of insect communities and environmental drivers within desert steppe ecosystems to wind energy infrastructure, providing empirical evidence for optimizing wind farm siting protocols and ecological management frameworks. Therefore, we formulate the hypothesis that insect diversity and its environmental factors will exhibit differential responses to varying wind turbine densities, with higher densities likely exerting negative impacts on both insect communities and their environmental parameters.
2. Materials and Methods
2.1. Study Area
Ningxia, located between 35°14′ N to 39°23′ N and 104°17′ E to 107°39′ E, is one of China’s major pastoral regions [44]. Its primary grassland types include temperate desert steppe, temperate steppe, temperate meadow steppe, and temperate steppe desert, which collectively account for 98.01% of the region’s total grassland area. Among these, the desert steppe is Ningxia’s largest grassland type, located in the transition zone between typical steppe and desert, covering approximately 1.3444 × 10⁶ ha and representing 55.02% of the region’s natural grassland area [45]. The climate belongs to a typical continental climate with an average annual temperature of 8.1 °C [46]. The annual accumulated temperature is 3430.3 °C, and the annual precipitation is 295 mm. The frost-free period is about 162 d. It is mainly dominated by xerophytes and mesophytes [47]. The main distribution is perennial plants such as Stipa breviflora, Leymus secalinus, Lespedeza davurica, and annual plants such as Setaria viridis and Salsola collina [48].
The study area is located at the Taiyangshan Town in Wuzhong City, Ningxia, with coordinates 38°00′58″ N, 106°44′25″ E. It lies within the desert steppe region of Ningxia. Geographically bounded by the Yinkun Expressway to the east, National Highway G338 to the south, Kushui River to the west, and Provincial Highway S304 to the north, the site covers approximately 720 km2 (Figure 1).
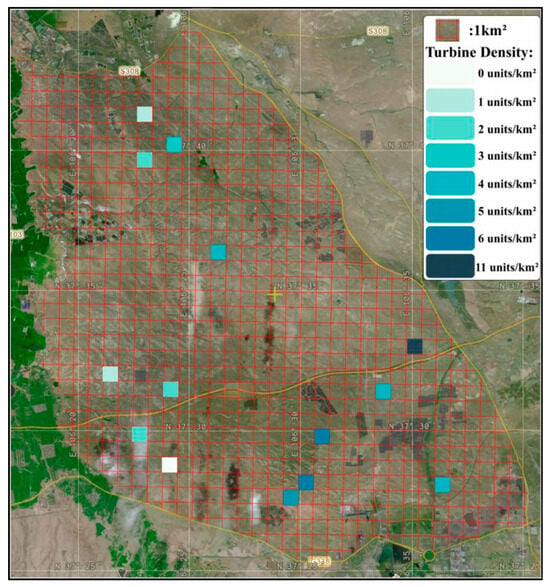
Figure 1.
Boundary delineation of the Taiyangshan Wind Farm.
2.2. Sampling Plot Design
Sampling plots were established through integrated GPS positioning, ArcGIS spatial analysis, and Digital Elevation Model (DEM) processing. A grid-based approach with 1 km2 (1 km × 1 km) resolution was implemented to partition the study area into standardized quadrats (Figure 1), each assigned a unique centroid code (e.g., Plot 550). Wind turbine density was defined as the number of operational turbines per km2, with representative plots categorized accordingly (Figure 2). Seasonal surveys of insect and vegetation diversity were conducted during spring, summer, and autumn of 2024, with one sampling campaign per season. Quadrats were excluded if their effective sampling area fell below 0.5 km2 or contained confounding infrastructure (photovoltaic installations, buildings, national highways, or expressways). A stratified sampling protocol was applied based on turbine density gradients to ensure proportional habitat representation. Through strict adherence to three criteria: (1) homogeneity in wind turbine age, (2) low-relief terrain facilitating field operations, and (3) spatial consistency in turbine distribution patterns. 14 experimental plots were selected in the Taiyangshan Wind Farm. These plots were systematically categorized into eight distinct density gradient types, with specific counts per gradient detailed in Table 1.
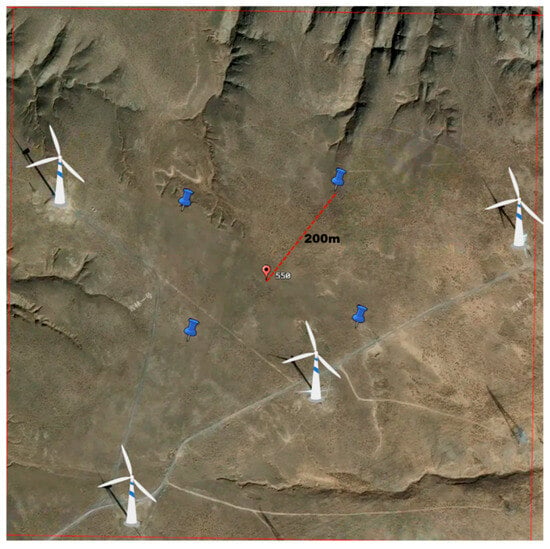
Figure 2.
Sampling plots with wind turbine density of 4 units/km2. Note: a central location (marked in red) and four peripheral points positioned 200 m from the center in cardinal directions (marked in blue).

Table 1.
Number of sample plots and determination under different wind power densities.
2.3. Investigation Method
2.3.1. Insect Monitoring Protocol
Insect sampling was conducted using a randomized five-point methodology across all monitoring zones. Each zone comprised five georeferenced sampling points: a central location (marked in red) and four peripheral points positioned 200 m from the center in cardinal directions (marked in blue), collectively forming a standardized sampling grid (Figure 2).
Pitfall trap protocol: For epigeal insect monitoring, we employed transparent, open-top disposable polypropylene cups (7.5 cm diameter × 9 cm height) as traps. Traps were installed with the rim flush with the soil surface (Figure S1) and filled with 60 mL preservative solution (33.3% ethylene glycol: water +3% detergent) to ensure that insects naturally fall into the traps and cannot escape. Each sampling point contained five traps spaced >5 m apart, forming a trap cluster representing one replicate. Across the five sampling points per monitoring zone, 25 traps were deployed in randomized spatial configurations, and they were recovered after two weeks. Captured specimens were retrieved and preserved in 75% ethanol, and they were identified at the species level following standardized protocols.
2.3.2. Vegetation Monitoring Protocol
On the diagonal of each monitoring sample, three randomly positioned 1 m × 1 m quadrats (with a minimum 50 m spacing between quadrats) were established to quantify vegetation parameters, including coverage, density, height, frequency, and aboveground biomass. Vegetation density was determined by counting all plant individuals per species within each quadrat, with five randomly selected individuals per species measured vertically using a tape scale to record height. For coverage assessment, each quadrat was subdivided into 100 grid cells of 10 cm × 10 cm. At each grid corner, a vertical pin was lowered to record the plant species intercepted, with overlapping intercepts (e.g., two species at one point) counted as a single overlap event. Total vegetation coverage was calculated as the sum of species-specific intercepts minus overlap counts. Frequency analysis employed a 0.10 m2 hollow aluminum alloy circle randomly tossed 15 times per quadrat, documenting plant species occurrence during each throw. Following these measurements, all aboveground vegetation was clipped at the ground level, sorted by species, and oven-dried at 80 °C for 12 h to constant weight. Species-specific dry biomass was measured to 0.01 g precision using an analytical balance, representing the community-level aboveground biomass.
2.3.3. Soil Monitoring Protocol
In September 2024, in different wind power density plots, three sampling points were randomly selected from five sampling points, and soil samples of 0–20 cm were collected randomly around them to mix them into one sample. The homogenized samples underwent comprehensive physicochemical analyses for total nitrogen (TN, %) and Total Carbon (TC, %), pH, Electrical conductivity (EC, μS/cm), Total phosphorus (TP), and available phosphorus (A-P, mg/kg), NH4+ and NO3− (mg/kg), and soil moisture content (SM, %).
2.4. Analysis Method
Based on taxonomic identification results, insect community metrics were analyzed using four ecological indices: (1) Margalef richness index (d), (2) Simpson dominance index (λ), (3) Shannon–Wiener diversity index (H), and (4) Pielou evenness index (E). The computational formulas are defined as follows:
where S is the number of species, Pi is the proportion of individuals in class i, Ni is the number of individuals in class i, and N is the total number of individuals.
d = (S − 1)/lnN
λ = ∑[Ni(Ni − 1)/N(N − 1)]
H = −∑Piln(Pi)
E = H/lnS
Generalized additive models (GAMs) were implemented in GraphPad Prism 9.5 to explore nonlinear relationships between wind turbine density and ecological variables, including insect alpha diversity indices, vegetation structural characteristics, and soil nutrient content. For multivariate correlation analysis, R v4.3.1 with the psych package was employed to compute pairwise associations among insect diversity metrics, vegetation parameters, and soil properties.
3. Results
3.1. Response of Insect Alpha Diversity to Wind Power Density
In this survey, a total of 138 insect species and 13,179 individuals were recorded. Analyses of insect alpha diversity indices across varying wind turbine densities in the Taiyangshan Wind Farm revealed significant ecological gradients. Total insect abundance and Simpson dominance index exhibited monotonic decreases with increasing turbine density, reaching a significant reduction in abundance at densities ≥6 turbines/km2 compared to turbine-free zones (0 turbines/km2) (Figure 3B,D).
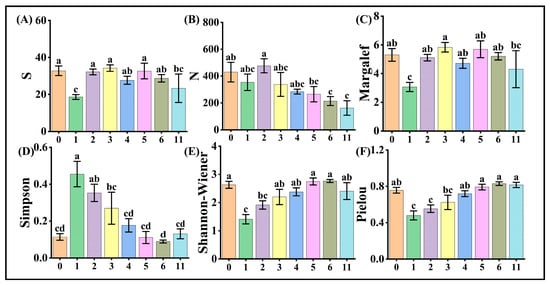
Figure 3.
Response of insect diversity indices to wind turbine density in Ningxia Taiyangshan Wind Farm. The X-axis is wind turbine density (turbines/km2), consistently with subsequent figures. Note: (A) is the number of species, (B) is the total number of individuals, (C) is the Margalef richness index, (D) is the Simpson dominance index, (E) is the Shannon–Wiener diversity index, and (F) is the Pielou evenness index. The letters a, b, c, and their combinations (such as ab, abc) above the bar chart are used to visually indicate whether the differences between groups are statistically significant. In the chart, identical letters indicate no significant difference between groups (p > 0.05), while different letters indicate significant differences (p ≤ 0.05). When letters are combined, groups with identical letters show no significant difference, and similarly hereinafter.
In contrast, the Shannon index and Pielou index evenness showed nonlinear increases. At 3 turbines/km2, the Shannon diversity index was higher than at 1 turbine/km2, while values at 5–6 turbines/km2 exceeded those at 2 turbines/km2. Evenness at ≥4 turbines/km2 surpassed lower densities (1–2 turbines/km2). At wind turbine densities ≥5 turbines/km2, Pielou indices exhibited no significant differences but were collectively significantly higher compared to plots with 3 turbines/km2 (Figure 3E,F).
Species richness and the Margalef index displayed moderate fluctuations across moderate densities. However, at extreme densities (11 turbines/km2), both metrics exhibited acute declines (Figure 3A,C).
3.2. Response of Vegetation Community Structure Characteristics to Wind Power Density
Analyses of vegetation community structure across varying wind turbine densities revealed stable patterns in the species count, coverage, and density. Vegetation species count remained consistent at 4–6 species per plot, with no significant differences observed across turbine density gradients (Figure 4A). Vegetation coverage is stabilized at 50% under most density conditions. However, plots with 3 turbines/km2 exhibited significantly lower coverage compared to those with 5–6 turbines/km2 (Figure 4B). The majority of plots maintained densities near 40, and only three turbines/km2 plots showed significantly reduced density relative to other densities, while no significant differences occurred among other density groups (Figure 4F).
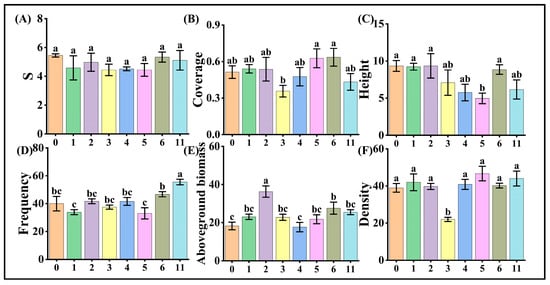
Figure 4.
Response of vegetation community structural characteristics to wind turbine density in Ningxia Taiyangshan. Note: (A) is the number of vegetation species, (B) is vegetation coverage, (C) is vegetation height, (D) is vegetation frequency, (E) is aboveground vegetation biomass, and (F) is vegetation density.
Vegetation height exhibited a decreasing trend with increasing wind turbine density, showing significantly lower values at 5 turbines/km2 compared to densities ≤2 turbines/km2 (Figure 4C). Conversely, vegetation frequency displayed an increasing trend, reaching significant elevation at extreme densities (11 turbines/km2) (Figure 4D). Aboveground biomass demonstrated irregular variations across density gradients: the highest biomass occurred at 2 turbines/km2 (significantly exceeding other densities), followed by 6 turbines/km2 (higher than 0 and 4 turbines/km2), though the overall impact of wind farm operations on vegetation in the Taiyangshan desert steppe was not pronounced (Figure 4E).
3.3. Correlation Between Wind Power Density and Insect Alpha Diversity
Nonlinear fitting of 2024 data from the Taiyangshan Wind Farm revealed correlations between wind turbine density and multiple insect diversity indices, with only individual abundance demonstrating highly significant reductions as turbine density increased (Figure 5B). The Simpson index also declined marginally with rising density, though not statistically significantly (Figure 5D). Conversely, both the Shannon index and Pielou index exhibited gradual increases—particularly notable in Pielou, which showed a steeper upward slope—but these trends lacked statistical significance (Figure 5E,F). The S and Margalef indices followed non-monotonic trajectories, initially rising at low turbine densities before declining, with minor fluctuations across the gradient and not significant (Figure 5A,C).
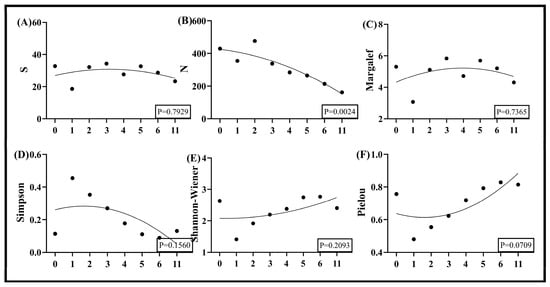
Figure 5.
Nonlinear fitted curves of insect diversity indices to wind turbine density in Ningxia Taiyangshan. Note: (A) is the number of species, (B) is the total number of individuals, (C) is the Margalef richness index, (D) is the Simpson dominance index, (E) is the Shannon–Wiener diversity index, and (F) is the Pielou evenness index.
3.4. Correlation Between Wind Power Density and the Structural Characteristics of Vegetation Communities
Nonlinear regression analysis of 2024 data from the Taiyangshan Wind Farm demonstrated weak correlations between wind turbine density and vegetation community structural indices. Species richness, frequency, and stem density exhibited non-significant bimodal trends (initial decline followed by increase) with rising turbine density. Among these, frequency displayed a marginally more pronounced increasing trajectory, while species richness and stem density remained in stochastic fluctuations (Figure 6A,D,F). Vegetation height showed a gradual decreasing trend across density gradients (Figure 6C). Coverage and aboveground biomass followed counter-phase patterns: coverage initially decreased, then increased, while biomass first increased, then decreased (Figure 6B,E). Both metrics exhibited statistically indistinguishable magnitudes of variation with horizontal linear patterns (Figure 6B,E).
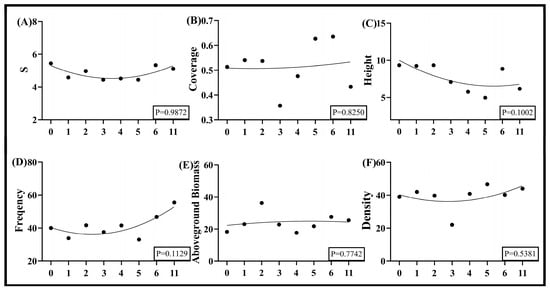
Figure 6.
Nonlinear fitted curves of vegetation community structural characteristics to wind turbine density in Ningxia. Note: (A) is the number of vegetation species, (B) is vegetation coverage, (C) is vegetation height, (D) is vegetation frequency, (E) is aboveground vegetation biomass, and (F) is vegetation density.
3.5. Correlation of Wind Power Density on Soil Nutrient Content
Nonlinear modeling of 2024 data from the Taiyangshan Wind Farm revealed correlations between wind turbine density and soil nutrient profiles, with total phosphorus (TP) exhibiting a significant decline (Figure 7E). Total nitrogen (TN), total carbon (TC), nitrate nitrogen (NO3−), and soil moisture content also decreased with increasing turbine density (Figure 7A,B,H,I). Soil electrical conductivity (EC), available phosphorus (A-P), and ammonium nitrogen (NH4+) followed non-monotonic trajectories, initially decreasing before increasing at higher densities (Figure 7D,F,G). Soil pH displayed a quadratic response, peaking at 5 turbines/km2 before declining (Figure 7C).
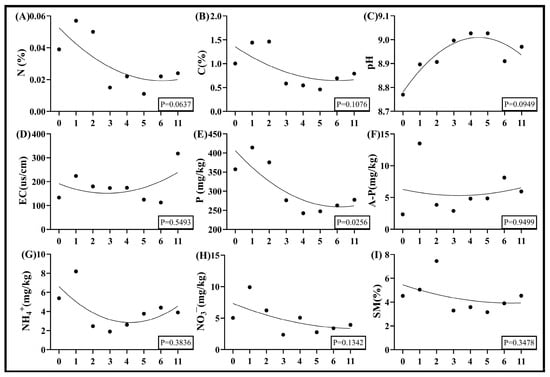
Figure 7.
Nonlinear fitted curves of soil nutrient responses to wind turbine density in Ningxia. Note: (A) is soil nitrogen content, (B) is soil carbon content, (C) is soil pH, (D) is soil electrical conductivity, (E) is soil total phosphorus, (F) is soil available phosphorus, (G) is soil ammonium nitrogen, (H) is soil nitrate nitrogen, and (I) is soil moisture content.
3.6. Correlation Between Alpha Diversity of Insects and Soil Nutrient Content and Vegetation Community Characteristics
Correlation analyses revealed significant associations between insect alpha diversity indices and both soil nutrient profiles and vegetation structural parameters. Species richness exhibited a significant negative correlation with available phosphorus. The Margalef index showed negative correlations with electrical conductivity and nitrate nitrogen. The Simpson index displayed a positive correlation with EC, whereas the Shannon diversity index correlated negatively with EC (Figure 8).
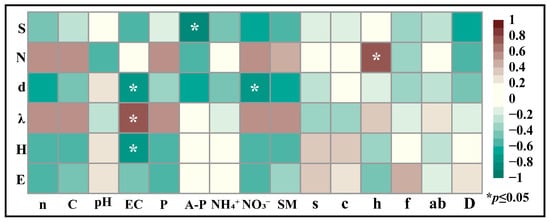
Figure 8.
Heatmap of insect diversity correlations with soil nutrients and vegetation structural characteristics in Ningxia. Note: The alpha diversity index of insects is as follows, from top to bottom in the left longitudinal direction. S is the number of insect species, N is the number of insect individuals, d is the richness index, λ is the dominance index, H is the diversity index, and E is the evenness index. The horizontal axis from left to right represents soil nutrients and vegetation community structure characteristics, n is soil nitrogen content, C is soil carbon content, pH is soil pH, EC is soil electrical conductivity, P is soil total phosphorus, A-P is soil available phosphorus, NH4+ is soil ammonium nitrogen, NO3− is soil nitrate nitrogen, and SM is soil moisture content. s is the number of vegetation species, c is vegetation coverage, h is vegetation height, f is vegetation frequency, ab is aboveground vegetation biomass, and D is vegetation density.
Total insect abundance demonstrated a positive correlation with vegetation height, and the sole significant vegetation association detected that significant relationships were observed between diversity indices and vegetation (Figure 8).
3.7. Correlation Analysis of Insects and Predominant Vegetation
Based on the correlation between insects and vegetation community characteristics, we classified the vegetation by family to identify dominant plant families for further analysis (Figure S2). Correlation analyses between insect alpha diversity indices and structural characteristics of dominant plant families revealed significant associations with Gramineae and Leguminosae, and non-significant trends were observed for Asteraceae and Chenopodiaceae (Figure 9). Insect species richness exhibited significant negative correlations with Gramineae frequency and density, whereas total abundance showed a highly significant positive correlation with Gramineae aboveground biomass. The Margalef index correlated negatively with Gramineae frequency and density, while the Simpson index demonstrated a positive correlation with Gramineae biomass. Conversely, the Shannon index and Pielou index both declined significantly with increasing Gramineae biomass (Figure 9B). For Leguminosae, insect abundance decreased with plant height and density, while Pielou increased with Leguminosae density (Figure 9D).
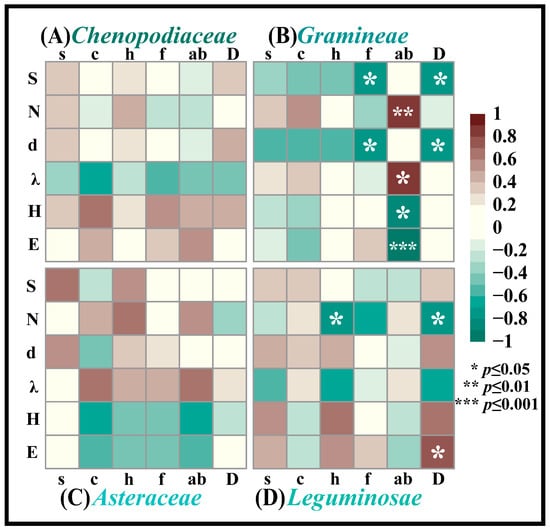
Figure 9.
Heatmap of insect diversity associations with dominant plant community characteristics in Ningxia. Note: (A) is the heatmap of insect diversity associations with Chenopodiaceae plant community characteristics, (B) is the heatmap of insect diversity associations with Gramineae plant community characteristics, (C) is the heatmap of insect diversity associations with Asteraceae plant community characteristics, and (D) is the heatmap of insect diversity associations with Leguminosae plant community characteristics. The alpha diversity index of insects is as follows, from top to bottom in the left longitudinal direction. S is the number of insect species, N is the number of insect individuals, d is the richness index, λ is the dominance index, H is the diversity index, and E is the evenness index. The horizontal axis from left to right represents the structure characteristics of the vegetation community. s is the number of vegetation species, c is vegetation coverage, h is vegetation height, f is vegetation frequency, ab is aboveground vegetation biomass, and D is vegetation density.
3.8. Correlation Analysis of Soil Nutrient Content and Predominant Vegetation
The correlation analysis between soil nutrients and main vegetation community structural characteristics shows that vegetation height and the content of several declining nutrients (soil total nitrogen (TN), total carbon (TC), total phosphorus (TP), nitrate nitrogen (NO3−-N), and soil moisture content (SM)) have a positive correlation, and vegetation height and the content of these declining nutrients (soil total nitrogen (TN), total carbon (TC), total phosphorus (TP), and soil moisture content (SM)) have a significantly positive correlation; vegetation species number and height and rising soil pH have a significantly negative correlation; overall, the vegetation community structural characteristics and soil nutrient content mostly have a positive correlation (Figure 10).
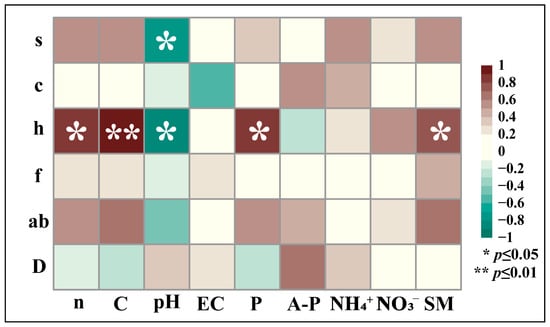
Figure 10.
Heatmap of vegetation-soil nutrient linkages in Ningxia. Note: The vegetation community structure characteristics are as follows, from top to bottom in the left longitudinal direction. s is the number of vegetation species, c is vegetation coverage, h is vegetation height, f is vegetation frequency, ab is aboveground vegetation biomass, and D is vegetation density. The horizontal axis from left to right represents soil nutrients. n is soil nitrogen content, C is soil carbon content, pH is soil pH, EC is soil electrical conductivity, P is soil total phosphorus, A-P is soil available phosphorus, NH4+ is soil ammonium nitrogen, NO3− is soil nitrate nitrogen, and SM is soil moisture content.
4. Discussion
4.1. Insect Responses to Wind Power Density Disturbances
Insects, functioning as consumers and decomposers in ecosystems through feeding, pollination, decomposition, and soil aeration, exhibit high sensitivity to habitat alterations. This study investigated the effects of wind energy infrastructure on insect communities by analyzing alpha diversity index variations across wind turbine density gradients. Nonlinear regression revealed a significant decline in insect abundance with increasing turbine density (Figure 5B). However, at low turbine densities (1–4 turbines/km2), insect abundance showed no significant difference from turbine-free zones, with a notable abundance elevation at 2 turbines/km2 (Figure 3B). This aligns with prior findings that wind turbine coloration and operational heat emissions may attract certain insects [28,30], and invasive species occasionally exploit turbine structures for overwintering [49], suggesting low-density turbine arrays might transiently enhance local insect recruitment. With the increasing wind density, insect abundance declined sharply, mirroring avoidance behaviors observed in birds, bats, and mammals near wind farms [50,51,52].
This phenomenon likely occurs because higher wind turbine densities intensify noise and electromagnetic field interference within wind farms, prompting acoustically and electromagnetically sensitive insect taxa to abandon the area due to the sensory disturbance intensity.
4.2. Response of Vegetation to Wind Power Density Disturbance
Vegetation plays critical roles in water conservation, soil stabilization, biodiversity maintenance, and desertification mitigation. While numerous studies report adverse impacts of wind farm construction on vegetation growth—reducing NDVI, Patrick richness, Simpson dominance, Pielou evenness, Shannon-Wiener diversity, aboveground biomass, and plant height [15,53,54,55,56,57,58,59]—this study observed minimal and irregular shifts in vegetation structural metrics across turbine density gradients (Figure 6). Notably, vegetation frequency transitioned from stochastic fluctuations to significant increases at higher turbine densities (Figure 4D), while species richness and stem density remained stable (Figure 4A,D and Figure 6A,D), aligning with findings that onshore wind farms exert negligible structural impacts on plant communities [60,61]. The study area, situated in Ningxia’s desert steppe—a region plagued by soil erosion, drought, and desertification—hosts vegetation with enhanced stress tolerance, potentially buffering against turbine-induced disturbances. Vegetation height exhibited a nonlinear response: taller at low turbine densities (1–3 turbines/km2), reduced at moderate densities (4–5 turbines/km2), and rebounding at extreme densities (6, 11 turbines/km2) (Figure 4). This pattern may correlate with insect abundance dynamics (Section 4.1): under the medium wind power density, insects were affected by wind power but to a lesser extent, and the vegetation height decreased. However, when the wind power density reached an extreme, the number of insects decreased significantly, and the vegetation height recovered.
4.3. Response of Soil Nutrient Content to Wind Power Density Disturbance
The ecological effects of wind farms on soil manifest in two primary dimensions. During the construction phase, large-scale land occupation and engineering activities degrade soil structure and function, exacerbating landscape fragmentation and impeding vegetation regeneration [62,63,64,65,66]. During operational phases, wind farms alter soil physicochemical properties: this study observed declining trends in total nitrogen (TN), total carbon (TC), total phosphorus (TP), nitrate nitrogen (NO3−), and soil moisture content with increasing turbine density, alongside rising pH levels (wind farm soils exhibited higher pH than turbine-free zones) (Figure 7). These findings align with global research documenting reduced soil moisture, TN, TC, TP, alkaline nitrogen, and available phosphorus, coupled with pH elevation in onshore wind farm soils [56,67,68,69,70]. The underlying mechanisms may involve pre-existing soil erosion and desertification in the arid steppe study area, compounded by construction-induced soil degradation. Post-construction operational effects—elevated ground temperature and wind speed—likely intensified evaporation and nutrient leaching, accelerating soil deterioration.
4.4. The Influence Mechanism Between Insects and Vegetation and Soil
Insects, vegetation, and soil collectively form critical components of ecosystem material and nutrient cycling. The correlations between insect abundance and plant height identified in Section 4.2 were substantiated through taxon-specific analyses: insect abundance exhibited significant negative correlations with both height and density of Leguminosae while demonstrating weaker associations with Chenopodiaceae, Gramineae, and Asteraceae heights. Conversely, a highly significant positive correlation was observed between insect abundance and Gramineae aboveground biomass (Figure 9B). This suggests that insect aggregation leads to reduced abundance and diminished plant height in Leguminosae vegetation, likely due to preferential herbivory on Leguminosae plants while exerting lower foraging interest on Gramineae species.
Insect abundance exhibited positive correlations with declining soil nutrients under wind turbine disturbances, including total nitrogen (TN), total carbon (TC), total phosphorus (TP), nitrate nitrogen (NO3−), and soil moisture content (Figure 8), suggesting that reduced insect populations in high-density turbine zones may stem from cumulative nutrient depletion exacerbated by wind farm operations. Soil-mediated effects on insects often operate via vegetation pathways [71]: vegetation height showed significant positive correlations with these declining soil nutrients (Figure 10). Specifically, vegetation height demonstrated significant positive associations with TN, TC, TP, and soil moisture (Figure 10), indicating that vegetation growth in the desert steppe—heavily reliant on TN, TC, TP, and soil moisture. Wind turbine disturbances further deplete these nutrients, suppressing vegetation growth and cascading into insect developmental constraints. Thus, the marked decline in insect abundance at high turbine densities likely arises not only from direct stressors like noise and electromagnetic fields but also from indirect soil–vegetation degradation feedback.
5. Conclusions
This study found that wind turbines exerted minimal direct impacts on vegetation. However, vegetation height displayed negative correlations with insect abundance, which was particularly pronounced in Leguminosae vegetation, suggesting that wind farm impacts on plants may be indirectly mediated through insect herbivory dynamics. Vegetation height showed significant positive correlations with these depleted soil nutrients, confirming that vegetation growth relies on nutrient availability. Wind turbine disturbances cause nutrient depletion, suppressing plant growth and cascading into constraints on insect development. Thus, reduced insect abundance in high-density turbine zones likely reflects dual stressors: direct turbine interference and indirect nutrient–vegetation degradation pathways.
This study concludes that wind turbine operations influence insect populations through multiphased mechanisms intricately linked to vegetation and soil dynamics. At low turbine densities, impacts are minimal or even attract insect aggregation, whereas higher densities trigger a marked decline in insect abundance, reflecting turbine avoidance behavior. This avoidance likely stems from cumulative stressors in high-density zones: intensified noise and electromagnetic interference, coupled with soil nutrient depletion that degrades vegetation biomass and alters microclimate stability. Collectively, these turbine-mediated disruptions to both abiotic (soil nutrient and biotic (vegetation–insect interaction) components affect insects and increase the adverse effects of wind power on insects. To balance energy production and biodiversity conservation, we propose spatial optimization of turbine layouts and active soil remediation strategies.
Supplementary Materials
The following supporting information can be downloaded at: https://www.mdpi.com/article/10.3390/agronomy15102253/s1, Figure. S1. For epigeal insects trap protocol. Figure. S2. Vegetation species composition in Ningxia Taiyangshan.
Author Contributions
Conceptualization, S.W. and J.M.; data curation: S.W., Y.C., S.Z., H.Z., Z.C., C.X., J.X., Y.L., J.M. and L.B.; formal analysis: Y.C., S.Z., H.Z. and Z.C.; funding acquisition: J.M. and S.W.; investigation: Y.C. and S.W.; Methodology: S.W., Y.C., Z.C., C.X., J.X., Y.L. and L.B.; Project management: S.W., J.X. and Y.L.; Resources: S.W., Y.C., Z.C. and C.X.; Software: Y.C., S.Z., H.Z. and Z.C.; Supervision: J.M., S.W., J.X. and Y.L.; Validation: Y.C., H.Z., Z.C., C.X., J.X. and Y.L.; Visualization: Y.C., S.Z., H.Z., Z.C. and C.X.; Writing—original draft: Y.C., S.Z., H.Z., Z.C. and S.W.; Writing—review and editing: L.B. and S.W. All authors have read and agreed to the published version of the manuscript.
Funding
This research was funded by Ningxia Hui Autonomous Region Key R&D Program Project, grant number 2023BEG02048.
Data Availability Statement
The data presented in this study are available on request from the corresponding author.
Conflicts of Interest
The authors declare no conflicts of interest.
References
- Yao, Y.; Mei, R.; Yang, D. The impact of the development and utilization of wind energy resources on biodiversity. Environ. Impact Assess. 2023, 45, 39–43. Available online: https://link.cnki.net/doi/10.14068/j.ceia.2023.03.007 (accessed on 1 September 2025). (In Chinese).
- Devine-Wright, P. Beyond NIMBYism: Towards an integrated framework for understanding public perceptions of wind energy. Wind. Energy 2005, 8, 125–139. [Google Scholar] [CrossRef]
- Leung, D.Y.C.; Yang, Y. Wind energy development and its environmental impact: A review. Renew. Sustain. Energy Rev. 2012, 16, 1031–1039. [Google Scholar] [CrossRef]
- Hawinkel, P.; Thiery, W.; Lhermitte, S.; Swinnen, E.; Verbist, B.; Van Orshoven, J.; Muys, B. Vegetation response to precipitation variability in East Africa controlled by biogeographical factors. J. Geophys. Res. Biogeosci. 2016, 121, 2422–2444. [Google Scholar] [CrossRef]
- Wang, B.; Liu, G.B.; Xue, S.; Zhu, B. Changes in soil physico-chemical and microbiological properties during natural succession on abandoned farmland in the Loess Plateau. Environ. Earth Sci. 2011, 62, 915–925. [Google Scholar] [CrossRef]
- Zhang, Y.; Li, J.P.; Xie, Y.Z.; Li, X.Y.; Luo, X.; Huang, X.; Wang, Y.T.; Yu, J.; Liang, X. Effects of precipitation changes and warming on vegetation–soil–microbial relationships in desert grasslands. Glob. Ecol. Conserv. 2024, 54, e03205. [Google Scholar] [CrossRef]
- Chen, J.; Song, N.; Wang, X.; Meng, C.; Zhang, Y.; Chen, L.; Wang, Q.; Lv, H.; Wu, X.; Yu, D. Precipitation and plant community-weighted mean traits determine total transpirable soil water in a desert grassland. Ecol. Indic. 2024, 160, 111873. [Google Scholar] [CrossRef]
- Zhong, T.; Tian, H.; Zheng, J.; Dou, B.; Wang, Y.; Yang, Z.; Li, P.; Xiao, P. Effect of chemical clogging on the permeability of weakly consolidated sandstone due to reinjection at different temperatures. J. Water Clim. Change 2022, 14, 142–155. [Google Scholar] [CrossRef]
- Marx, J.; Schreiber, A.; Zapp, P. Response to ‘Life-cycle green-house gas emissions of onshore and offshore wind turbines’. J. Clean. Prod. 2019, 219, 33–34. [Google Scholar] [CrossRef]
- Gasparatos, A.; Doll, C.N.H.; Esteban, M.; Ahmed, A.; Olang, T.A. Renewable energy and biodiversity: Implications for transitioning to a Green Economy. Renew. Sustain. Energy Rev. 2017, 70, 161–184. [Google Scholar] [CrossRef]
- Santangeli, A.; Toivonen, T.; Pouzols, F.M.; Pogson, M.; Hastings, A.; Smith, P.; Moilanen, A. Global change synergies and trade-offs between renewable energy and biodiversity. GCB Bioenergy 2016, 8, 941–951. [Google Scholar] [CrossRef]
- Denholm, P.; Hand, M.; Jackson, M.; Ong, S. Land Use Requirements of Modern Wind Power Plants in the United States (NREL/TP-6A2-45834); National Renewable Energy Lab. (NREL): Golden, CO, USA, 2009. [Google Scholar] [CrossRef]
- Xu, K.; He, L.; Hu, H.; Liu, S.; Du, Y.; Wang, Z.; Li, Y.L.; Khan, A.; Wang, G. Positive ecological effects of wind farms on vegetation in China’s Gobi desert. Sci. Rep. 2019, 9, 6341. [Google Scholar] [CrossRef]
- Chang, R.; Zhu, R.; Guo, P. A case study of land-surface-temperature impact from large-scale deployment of wind farms in China from Guazhou. Remote Sens. 2016, 8, 790. [Google Scholar] [CrossRef]
- Qin, Y.; Li, Y.; Xu, R.; Hou, C.; Armstrong, A.; Bach, E.; Wang, Y.; Fu, B. Impacts of 319 wind farms on surface temperature and vegetation in the United States. Environ. Res. Lett. 2022, 17, 024026. [Google Scholar] [CrossRef]
- Wang, S.; Wang, S.; Smith, P. Ecological impacts of wind farms on birds: Questions, hypotheses, and research needs. Renew. Sustain. Energy Rev. 2015, 44, 599–607. [Google Scholar] [CrossRef]
- Dhar, A.; Naeth, M.A.; Jennings, P.D.; Gamal El-Din, M. Perspectives on environmental impacts and a land reclamation strategy for solar and wind energy systems. Sci. Total Environ. 2020, 718, 134602. [Google Scholar] [CrossRef]
- Hall, R.; João, E.; Knapp, C.W. Environmental impacts of decommissioning: Onshore versus offshore wind farms. Environ. Impact Assess. Rev. 2020, 83, 106404. [Google Scholar] [CrossRef]
- Sayed, E.T.; Wilberforce, T.; Elsaid, K.; Rabaia, M.K.H.; Abdelkareem, M.A.; Chae, K.J.; Olabi, A.G. A critical review on environmental impacts of renewable energy systems and mitigation strategies: Wind, hydro, biomass and geothermal. Sci. Total Environ. 2021, 766, 144505. [Google Scholar] [CrossRef]
- Zhang, X.; Guo, H.; Chen, J.; Song, J.; Xu, K.; Lin, J.; Zhang, S. Potential effects of underwater noise from wind turbines on the marbled rockfish (Sebasticus marmoratus). J. Appl. Ichthyol. 2021, 37, 514–522. [Google Scholar] [CrossRef]
- Bassetto, M.; Reichl, T.; Kobylkov, D.; Kattnig, D.R.; Winklhofer, M.; Hore, P.J.; Mouritsen, H. No evidence for magnetic field effects on the behaviour of Drosophila. Nature 2023, 620, 595–599. [Google Scholar] [CrossRef] [PubMed]
- Jaiswal, P.; Bhandekar, R.; Ali, M.; Thiske, S. A review on: Insects as bioindicators for an ecosystem and key species in trophic level. World J. Adv. Res. Rev. 2024, 24, 430–446. [Google Scholar] [CrossRef]
- Ramola, G.C.; Rawat, N.; Singh, R.; Sajwan, A.S.; Sahu, L.; Rawat, P. Insects as Ecological Indicators: A Review. Int. J. Environ. Clim. Change 2024, 14, 260–279. [Google Scholar] [CrossRef]
- Ghosh, I.; Debnath, P. Are Insects Really Important in Nature? Int. J. Curr. Microbiol. Appl. Sci. 2023, 12, 99–106. [Google Scholar] [CrossRef]
- Noriega, J.A.; Hortal, J.; Azcárate, F.M.; Berg, M.P.; Bonada, N.; Briones, M.J.I.; Del Toro, I.; Goulson, D.; Ibanez, S.; Landis, D.A.; et al. Research trends in ecosystem services provided by insects. Basic Appl. Ecol. 2018, 26, 8–23. [Google Scholar] [CrossRef]
- Dangles, O. Ecosystem services provided by insects for achieving sustainable developmental goals. Comptes Rendus Biol. 2019, 342, 268. [Google Scholar] [CrossRef]
- Landmann, T.; Schmitt, M.; Ekim, B.; Villinger, J.; Ashiono, F.; Habel, J.C.; Tonnang, H.E.Z. Insect diversity is a good indicator of biodiversity status in Africa. Commun. Earth Environ. 2023, 4, 234. [Google Scholar] [CrossRef]
- Long, C.V.; Flint, J.A.; Lepper, P.A. Insect attraction to wind turbines: Does colour play a role? Eur. J. Wildl. Res. 2011, 57, 323–331. [Google Scholar] [CrossRef]
- MacGregor, K.A.; Lemaître, J. The management utility of large-scale environmental drivers of bat mortality at wind energy facilities: The effects of facility size, elevation. Glob. Ecol. Conserv. 2019, 20, e00871. [Google Scholar] [CrossRef]
- Horn, J.W.; Arnett, E.B.; Kunz, T.H. Behavioral responses of bats to operating wind turbines. J. Wildl. Manag. 2008, 72, 123–132. [Google Scholar] [CrossRef]
- Tougaard, J.; Hermannsen, L.; Madsen, P.T. How loud is the underwater noise from operating offshore wind turbines? J. Acoust. Soc. Am. 2020, 148, 2885–2893. [Google Scholar] [CrossRef]
- Norro, A.M.J.; Rumes, B.; Degraer, S.J. Differentiating between Underwater Construction Noise of Monopile and Jacket Foundations for Offshore Windmills: A Case Study from the Belgian Port of the North Sea. Sci. World J. 2013, 2013, 897624. [Google Scholar] [CrossRef]
- Lampe, U.; Reinhold, K.; Schmoll, T. How grasshoppers respond to road noise: Developmental plasticity and population differentiation in acoustic signalling. Funct. Ecol. 2014, 28, 660–668. [Google Scholar] [CrossRef]
- Orci, K.M.; Petróczki, K.; Barta, Z. Instantaneous song modification in response to fluctuating traffic noise in the tree cricket Oecanthus pellucens. Anim. Behav. 2016, 112, 187–194. [Google Scholar] [CrossRef]
- Cunnington, G.M.; Fahrig, L. Mate attraction by male anurans in the presence of traffic noise. Anim. Conserv. 2013, 16, 275–285. [Google Scholar] [CrossRef]
- Mitchell, L.J.; Williamson, B.J.; Masden, E.A. Methods for highlighting ecological monitoring needs in data-sparse regions: A case study of impact assessment for multi-component infrastructure installations. Environ. Impact Assess. Rev. 2024, 105, 107433. [Google Scholar] [CrossRef]
- Ling, S.; Linehan, A. Guidelines for Wind Power and Wildlife in Washington State, USA. Wind Eng. 2003, 27, 273–283. [Google Scholar] [CrossRef]
- Schöll, E.M.; Nopp-Mayr, U. Impact of wind power plants on mammalian and avian wildlife species in shrub- and woodlands. Biol. Conserv. 2021, 256, 109037. [Google Scholar] [CrossRef]
- Santos, M.; Bastos, R.; Travassos, P.; Bessa, R.; Repas, M.; Cabral, J.A. Predicting the trends of vertebrate species richness as a response to wind farms installation in mountain ecosystems of northwest Portugal. Ecol. Indic. 2010, 10, 192–205. [Google Scholar] [CrossRef]
- Marques, A.T.; Santos, C.D.; Hanssen, F.; Muñoz, A.R.; Onrubia, A.; Wikelski, M.; Moreira, F.; Palmeirim, J.M.; Silva, J.P. Wind turbines cause functional habitat loss for migratory soaring birds. J. Anim. Ecol. 2020, 89, 93–103. [Google Scholar] [CrossRef] [PubMed]
- Kumara, H.N.; Babu, S.; Rao, G.B.; Mahato, S.; Bhattacharya, M.; Rao, N.V.R.; Tamiliniyan, D.; Parengal, H.; Deepak, D.; Balakrishnan, A.; et al. Responses of birds and mammals to long-established wind farms in India. Sci. Rep. 2022, 12, 1339. [Google Scholar] [CrossRef] [PubMed]
- Skarin, A.; Sandström, P.; Alam, M. Out of sight of wind turbines—Reindeer response to wind farms in operation. Ecol. Evol. 2018, 8, 9906–9919. [Google Scholar] [CrossRef]
- Smith, K.T.; Taylor, K.L.; Albeke, S.E.; Beck, J.L. Pronghorn Winter Resource Selection Before and After Wind Energy Development in South-Central Wyoming. Rangel. Ecol. Manag. 2020, 73, 227–233. [Google Scholar] [CrossRef]
- Du, L.; Gong, F.; Zeng, Y.; Ma, L.; Qiao, C.; Wu, H. Carbon use efficiency of terrestrial ecosystems in desert/grassland biome transition zone: A case in Ningxia province, northwest China. Ecol. Indic. 2021, 120, 106971. [Google Scholar] [CrossRef]
- Hou, J.; Du, L.; Liu, K.; Hu, Y.; Zhu, Y. Characteristics of vegetation activity and its responses to climate change in desert/grassland biome transition zones in the last 30 years based on GIMMS3g. Theor. Appl. Climatol. 2019, 136, 915–928. [Google Scholar] [CrossRef]
- Song, K.; Zhang, H.; Hu, H.; Xie, Y.; Zhao, X.; Zhang, Y.; Yong, J.; Deng, W.; Guan, S. Precipitation changes alter the structure, species composition and interspecific relationships of desert steppe plant communities. Glob. Ecol. Conserv. 2025, 58, e03460. [Google Scholar] [CrossRef]
- Lewińska, K.E.; Hostert, P.; Buchner, J.; Bleyhl, B.; Radeloff, V.C. Short-term vegetation loss versus decadal degradation of grasslands in the Caucasus based on Cumulative Endmember Fractions. Remote Sens. Environ. 2020, 248, 111969. [Google Scholar] [CrossRef]
- An, H.; Li, Q.L.; Yan, X.; Wu, X.Z.; Liu, R.; Fang, Y. Desertification control on soil inorganic and organic carbon accumulation in the topsoil of desert grassland in Ningxia, northwest China. Ecol. Eng. 2019, 127, 348–355. [Google Scholar] [CrossRef]
- Dudek, K.; Dudek, M.; Tryjanowski, P. Wind Turbines as Overwintering Sites Attractive to an Invasive Lady Beetle, Harmonia axyridis Pallas (Coleoptera: Coccinellidae). Coleopt. Bull. 2015, 69, 665–669. [Google Scholar] [CrossRef]
- Drewitt, A.L.; Langston, R.H.W. Assessing the impacts of wind farms on birds. Ibis 2006, 148, 29–42. [Google Scholar] [CrossRef]
- Hastik, R.; Basso, S.; Geitner, C.; Haida, C.; Poljanec, A.; Portaccio, A.; Vrščaj, B.; Walzer, C. Renewable energies and ecosystem service impacts. Renew. Sustain. Energy Rev. 2015, 48, 608–623. [Google Scholar] [CrossRef]
- Poot, H.; Ens, B.J.; de Vries, H.; Donners, M.A.H.; Wernand, M.R.; Marquenie, J.M. Green Light for Nocturnally Migrating Birds. Ecol. Soc. 2008, 13, 47. [Google Scholar] [CrossRef]
- Aksoy, T.; Cetin, M.; Cabuk, S.N.; Senyel Kurkcuoglu, M.A.; Bilge Ozturk, G.; Cabuk, A. Impacts of wind turbines on vegetation and soil cover: A case study of Urla, Cesme, and Karaburun Peninsulas, Turkey. Clean Technol. Environ. Policy 2023, 25, 51–68. [Google Scholar] [CrossRef]
- Li, G.; Zhang, C.; Zhang, L.; Zhang, M. Wind Farm Effect on Grassland Vegetation Due to Its Influence on the Range, Intensity and Variation of Wind Direction. In Proceedings of the 2016 IEEE International Geoscience and Remote Sensing Symposium (IGARSS), Beijing, China, 10–15 July 2016; pp. 1304–1306. [Google Scholar] [CrossRef]
- Liu, Z.; Li, G.; Wang, G. Can wind farms change the phenology of grassland in China? Sci. Total Environ. 2022, 832, 155077. [Google Scholar] [CrossRef]
- Pekkan, O.I.; Senyel Kurkcuoglu, M.A.; Cabuk, S.N.; Aksoy, T.; Yilmazel, B.; Kucukpehlivan, T.; Dabanli, A.; Cabuk, A.; Cetin, M. Assessing the effects of wind farms on soil organic carbon. Environ. Sci. Pollut. Res. 2021, 28, 18216–18233. [Google Scholar] [CrossRef] [PubMed]
- Tang, B.; Wu, D.; Zhao, X.; Zhou, T.; Zhao, W.; Wei, H. The Observed Impacts of Wind Farms on Local Vegetation Growth in Northern China. Remote Sens. 2017, 9, 332. [Google Scholar] [CrossRef]
- Urziceanu, M.; Anastasiu, P.; Rozylowicz, L.; Senan, T.E. Local-scale impact of wind energy farms on rare, endemic, and threatened plant species. PeerJ 2021, 9, e11390. [Google Scholar] [CrossRef]
- Wu, X.; Zhang, L.; Zhao, C.; Gegen, T.; Zheng, C.; Shi, X.; Geng, J.; Letu, H. Satellite-Based Assessment of Local Environment Change by Wind Farms in China. Earth Space Sci. 2019, 6, 947–958. [Google Scholar] [CrossRef]
- Luo, L.; Zhuang, Y.; Duan, Q.; Dong, L.; Yu, Y.; Liu, Y.; Chen, K.; Gao, X. Local climatic and environmental effects of an onshore wind farm in North China. Agric. For. Meteorol. 2021, 308–309, 108607. [Google Scholar] [CrossRef]
- Pătru-Stupariu, I.; Calotă, A.M.; Santonja, M.; Anastasiu, P.; Stoicescu, I.; Biriş, I.A.; Stupariu, M.S.; Buttler, A. Do wind turbines impact plant community properties in mountain region? Biologia 2019, 74, 1613–1619. [Google Scholar] [CrossRef]
- Diffendorfer, J.E.; Dorning, M.A.; Keen, J.R.; Kramer, L.A.; Taylor, R.V. Geographic context affects the landscape change and fragmentation caused by wind energy facilities. PeerJ 2019, 7, e7129. [Google Scholar] [CrossRef]
- Guan, J. The impact of onshore wind farms on ecological corridors in Ningbo, China. Environ. Res. Commun. 2023, 5, 015006. [Google Scholar] [CrossRef]
- Guo, X.; Zhang, X.; Du, S.; Li, C.; Siu, Y.L.; Rong, Y.; Yang, H. The impact of onshore wind power projects on ecological corridors and landscape connectivity in Shanxi, China. J. Clean. Prod. 2020, 254, 120075. [Google Scholar] [CrossRef]
- Roscioni, F.; Rebelo, H.; Russo, D.; Carranza, M.L.; Di Febbraro, M.; Loy, A. A modelling approach to infer the effects of wind farms on landscape connectivity for bats. Landsc. Ecol. 2014, 29, 891–903. [Google Scholar] [CrossRef]
- Zhang, T.; Meng, M.; Cao, Y.; Liu, J.; Jiang, Y. The Influence of the Construction of Huitengxile Wind Farm on the Landscape Pattern of Grassland. Ecol. Environ. Sci. 2016, 25, 1899–1905. Available online: https://link.cnki.net/doi/10.16258/j.cnki.1674-5906.2016.12.002 (accessed on 1 September 2025). (In Chinese).
- Smith, J.; Nayak, D.R.; Smith, P. Wind farms on undegraded peatlands are unlikely to reduce future carbon emissions. Energy Policy 2014, 66, 585–591. [Google Scholar] [CrossRef]
- Wang, S.; Wang, S.; Smith, P. Quantifying impacts of onshore wind farms on ecosystem services at local and global scales. Renew. Sustain. Energy Rev. 2015, 52, 1424–1428. [Google Scholar] [CrossRef]
- Wang, G.; Li, G.; Liu, Z. Wind farms dry surface soil in temporal and spatial variation. Sci. Total Environ. 2023, 857, 159293. [Google Scholar] [CrossRef]
- Zhang, X.; Wang, H.M.; Shang, G.F.; Sun, M.H.; Yan, Z.H.; Gao, Y.X.; Yuan, Q.X.; Zhang, C. Impact of wind farms on local land surface temperature in Qinghai Province, China. Int. J. Remote Sens. 2024, 45, 7318–7338. [Google Scholar] [CrossRef]
- Zhang, Y.; Li, J.P.; Xie, Y.Z.; Li, X.Y.; Luo, X.; Huang, X.; Wang, Y.T.; Yu, J.; Liang, X. The Varieties of Plants α-Diversity and Biomass in Desert Grasslands Under the Precipitation Change and Climate Warming. Rangel. Ecol. Manag. 2025, 98, 508–517. [Google Scholar] [CrossRef]
Disclaimer/Publisher’s Note: The statements, opinions and data contained in all publications are solely those of the individual author(s) and contributor(s) and not of MDPI and/or the editor(s). MDPI and/or the editor(s) disclaim responsibility for any injury to people or property resulting from any ideas, methods, instructions or products referred to in the content. |
© 2025 by the authors. Licensee MDPI, Basel, Switzerland. This article is an open access article distributed under the terms and conditions of the Creative Commons Attribution (CC BY) license (https://creativecommons.org/licenses/by/4.0/).