Article

Improved UNet Recognition Model for Multiple Strawberry Pests Based on Small Samples

1
National Digital Agricultural Equipment (Artificial Intelligence and Agricultural Robotics) Innovation Sub-Centre, Jiangsu University, Zhenjiang 212013, China
2
School of Agricultural Engineering, Jiangsu University, Zhenjiang 212013, China
3
Key Laboratory of Modern Agricultural Equipment and Technology, Ministry of Education, Jiangsu University, Zhenjiang 212013, China
4
Key Laboratory for Theory and Technology of Intelligent Agricultural Machinery and Equipment, Jiangsu University, Zhenjiang 212013, China
*
Author to whom correspondence should be addressed.
Agronomy 2025, 15(10), 2252; https://doi.org/10.3390/agronomy15102252
Submission received: 8 September 2025 / Revised: 20 September 2025 / Accepted: 22 September 2025 / Published: 23 September 2025
(This article belongs to the Collection AI, Sensors and Robotics for Smart Agriculture)

Abstract

Intelligent pest detection has become a critical challenge in precision agriculture. Addressing the challenge of distinguishing between aphids, thrips, whiteflies, beet armyworms, spodopetra frugiperda, and spider mites during strawberry growth, this study establishes a small-sample multi-pest dataset for strawberries through field photography, open-source sharing, and web scraping. This study introduces a channel–space parallel attention mechanism (PCSA) into the UNet architecture. This improved UNet model accentuates pest color and morphology through channel-based attention and emphasizes spatial localization with coordinate-based attention, allowing for the comprehensive integration of global and local pixel information. Subsequently, comparative analysis of several color spaces identified HSV as optimal for pest recognition, with the “UNet + PCSA + HSV” approach achieving state-of-the-art results (IoU, 84.8%; recall, 89.9%; precision, 91.8%).

1. Introduction

Throughout agricultural development, pests and diseases have consistently been a major factor limiting crop yield and quality, and determining how to effectively control these pests and diseases has become a global challenge [1,2]. According to data from the Food and Agriculture Organization of the United Nations (FAO), global food losses to pests and diseases exceeded 10% in 2020 [3]. With increasing crop intensification, pest management has become more challenging, necessitating the development of precise and efficient pest identification technologies [4,5,6,7].
Strawberries exhibit broad environmental abundance, cultivated in over 100 countries worldwide and distributed extensively from tropical regions to the Arctic Circle [8]. China ranks among the world’s largest strawberry producers, accounting for 29.8% of global strawberry cultivation area and 35.6% of total worldwide production [9]. Strawberries in China are primarily grown in greenhouses, with a growth cycle of approximately 260 days. Due to the persistent high temperatures and humidity characteristics of greenhouses, various pests and diseases are prone to occur, becoming a key factor in reduced strawberry yields and diminished quality [10]. The extended crop cycle in Chinese greenhouses, spanning autumn through spring, exposes strawberries to a diverse pest complex. Additionally, China primarily cultivates fresh-eating strawberries, which demand high standards for quality and appearance. If strawberry pests are not effectively controlled, then strawberry yield and quality will be directly impacted, leading to reduced income or even losses for farmers.
Traditional pest identification primarily relies on technicians’ visual discernment, which is labor-intensive and prone to misjudgment [11]. This often results in delayed pest control measures, ultimately leading to poor fruit quality. In recent years, due to the rapid advancement of computer technology, machine vision and deep learning technologies have been widely applied in agricultural pest detection, providing critical information for pest control [12]. Traditional machine vision technology primarily extracts color, shape, and texture features of pests, commonly employing methods such as LBP, HoG, and SIFT [13,14].
Deep learning has become the primary method for pest identification by automatically extracting pest features from data samples, with its recognition accuracy and scope enhanced through image segmentation. Peng et al. [15] introduced a multi-scale feature fusion module into the ShuffleNet V2 architecture, achieving a 79.39% accuracy rate in recognizing a dataset of 24 pest types. Dong et al. [16] enhanced detection accuracy for brown planthoppers and diamondback moths by integrating the MFPN (Multi-Scale Feature Pyramid Network) and AFRPN (Adaptive Feature Region Proposal Network) modules. Ullah et al. [17] proposed an end-to-end DeepPestNet architecture for pest identification and classification, achieving an accuracy rate of 98.92% for nine pest types. Zhang et al. [18] integrated the Spatial Pyramid Pooling (SPP) and Combined Binary Attention Mechanism (CBAM) modules into the VGG-19 network, achieving precise detection of whiteflies and fruit flies. He et al. [19] employed deep learning techniques to construct a pest recognition model for brown planthoppers in brown rice. By optimizing the Faster R-CNN and YOLOv3 models, they achieved excellent pest recognition accuracy. Tang et al. [20] proposed a novel S-YOLOv5m architecture that detects aphids, spider mites, and cotton bollworms during tomato growth. Compared to the original YOLOv5m parameters, this model achieves a 31% reduction in parameters. Zhang et al. [21] designed the MMAE pest detection model by integrating a self-supervised learning mechanism, achieving a recognition rate of 98.12% for 15 pest categories. These studies demonstrate that numerous scholars have achieved multi-species pest identification for crops such as rice, tomatoes, and wheat by improving various deep learning models.
In recent years, scholars have also proposed several new deep learning methods for detecting strawberry pests. Xing et al. [22] designed a self-supervised learning CNN architecture targeting six common strawberry pests. By leveraging a dual attention network (DANet) to adapt to the integrated local features and global dependencies of pest damage, the architecture achieved a classification accuracy of 96.75% on collected pest damage images. Dong et al. [23] introduced inner product and norm operators into the fully connected layer of the AlexNet model, achieving favorable classification results for thrips, caterpillars, slugs, and aphids. Gan et al. [24] integrated a channel attention mechanism into ResNet50 and deployed the developed model within a WeChat mini-program, enabling strawberry farmers to easily identify pest and disease types and receive control recommendations. Choi et al.’s [25] CNN-based YOLO deep learning model enhances the slow learning speed and inference speed of existing R-CNN-based models, achieving an 81.35% pest detection rate.
Current strawberry pest identification primarily focuses on model development, refinement, and structural analysis, neglecting issues such as complex backgrounds, lighting interference, and significant feature variations in natural environments. This results in models that cannot be directly applied and exhibit poor performance under natural conditions. Strawberry pests present challenges due to their diverse species, small size, and rapid reproduction rates. Accurate extraction of pest characteristics is crucial for reliable identification. Traditional image segmentation methods struggle to effectively capture the significant variations in color and morphological traits among different pests. Due to the pixel-level feature extraction capability of semantic segmentation models, which have seen widespread application in pest identification tasks, this study employs the UNet model for pest recognition.
This study constructs a small-sample strawberry pest dataset with aphids, thrips, spider mites, whiteflies, beet armyworms, and Spodoptera litura serving as focal taxa. Capitalizing on UNet’s aptitude for small-object segmentation, we designed and integrated a novel dual-attention parallel model (PCSA) and integrated it into the UNet architecture. Through the multi-level fusion of global and local pixel information, the approach enhances pixel-level segmentation and recognition accuracy for small insect bodies. Finally, by analyzing color distribution characteristics across different color spaces, the optimal color space for pest recognition was identified. This enables reliable identification of multiple strawberry pests in natural scenes.
This paper is structured as follows: Section 2 describes the establishment of a dataset for multiple strawberry pests in small samples. Section 3 introduces an improved method for the UNet model in pest detection. In Section 4, we give a comparison of model performance. Finally, the conclusion and future works are discussed in Section 5.

2. Building the Strawberry Multi-Pest Dataset

During strawberry growth, common pests include aphids (Aphis fabae), thrips (Thrips vulgatissimus Haliday), spider mites (Tetranychus cinnbarinus), whiteflies (Trialeurodes vaporariorum), beet armyworms (Spodoptera exigua), and spodopetra frugiperda (Spodoptera litura) [26]. As temperatures rise in spring, pests begin to enter their peak activity period, and the microclimate within greenhouses facilitates their reproduction and spread. Various pests damage strawberry plants by chewing on or sucking the sap from their organs. At best, this causes fruit deformities and reduces fruit quality; at worst, it leads to widespread crop failure.

2.1. Pest Image Collection

Handheld camera operation may cause slight shaking, resulting in pixel ghosting of pests in images. This study employed a handheld 4D gimbal stabilizer (JingDong JingZao, Nanjing, China) paired with the D435 for field collection of pest imagery. When capturing images, the official Intel RealSense Viewer software (V2.53.1) was used and the RGB resolution was set to 1080p. The camera was positioned at least as far from the pest as the D435’s minimum imaging distance. Field collection of pest images was conducted during multiple visits to the Bai Tu Strawberry Base in Jurong, Jiangsu Province, and the Chuqiao Road Strawberry Garden in Zhenjiang between January 2019 and May 2024, as shown in Figure 1. Image acquisition was conducted throughout the process in different greenhouses, covering various environmental conditions including sunny, rainy, and cloudy days. Daily acquisition took place from 8:00 AM to 5:00 PM, with images focused on leaf surfaces.
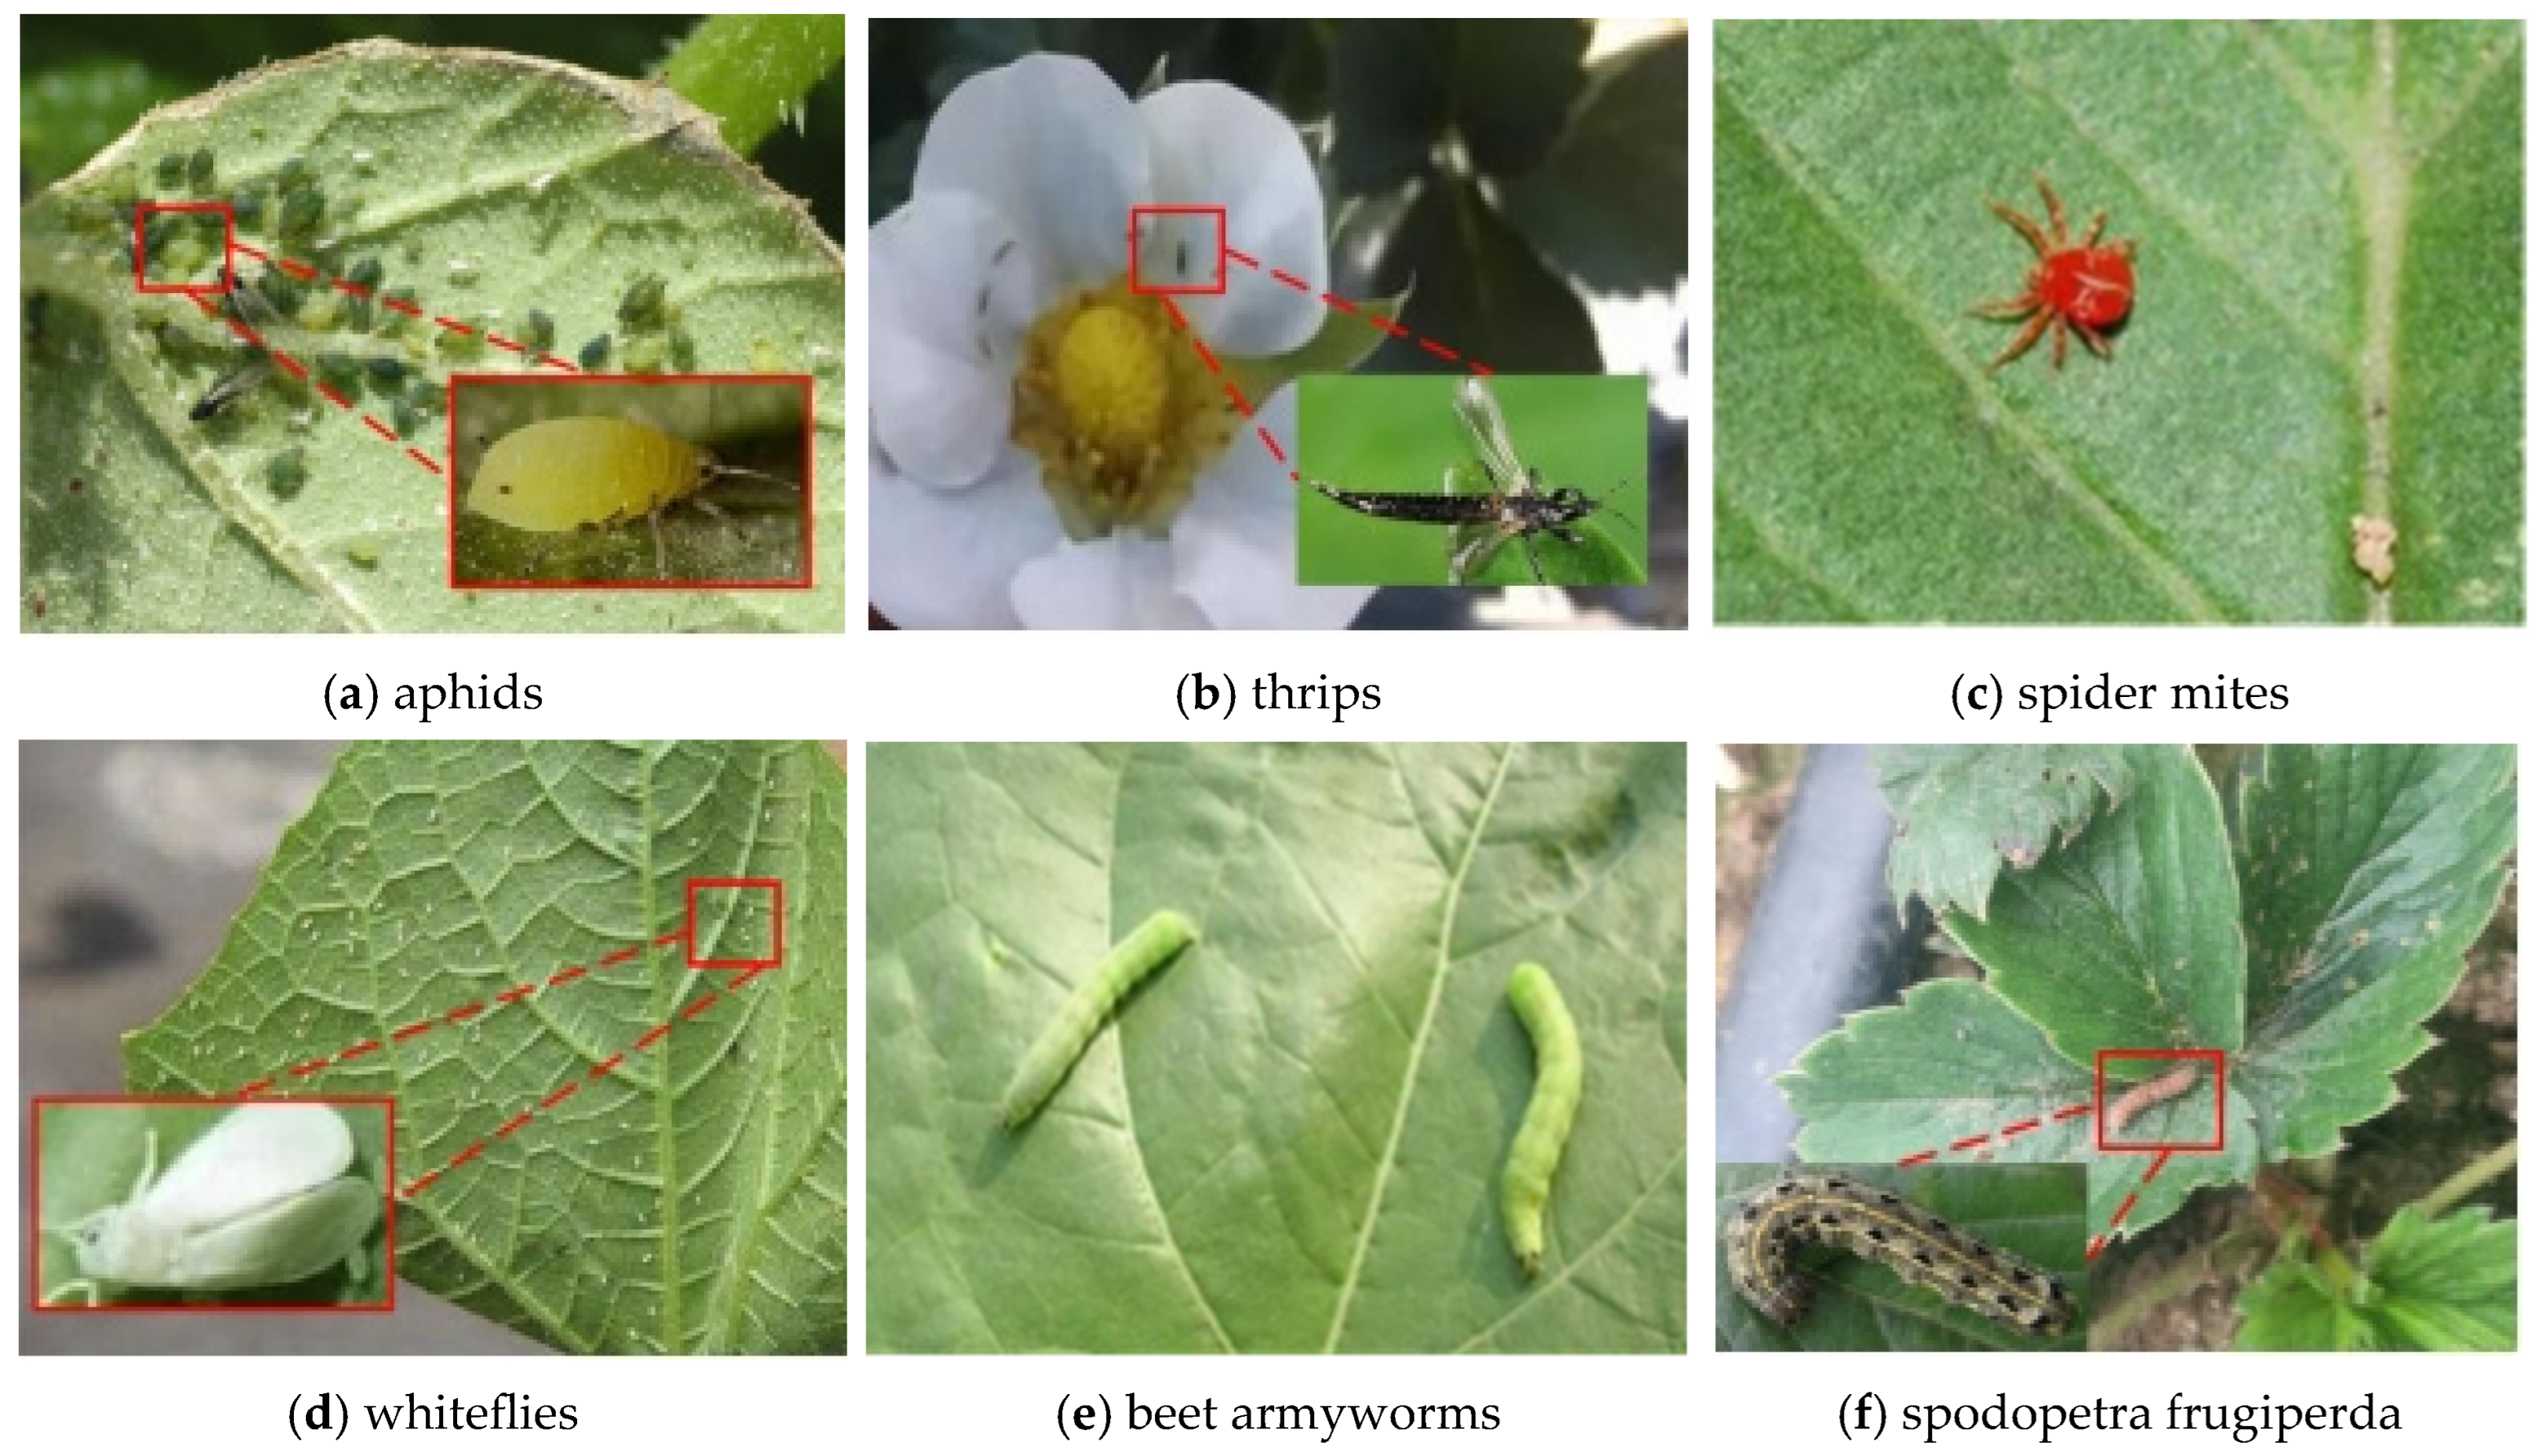
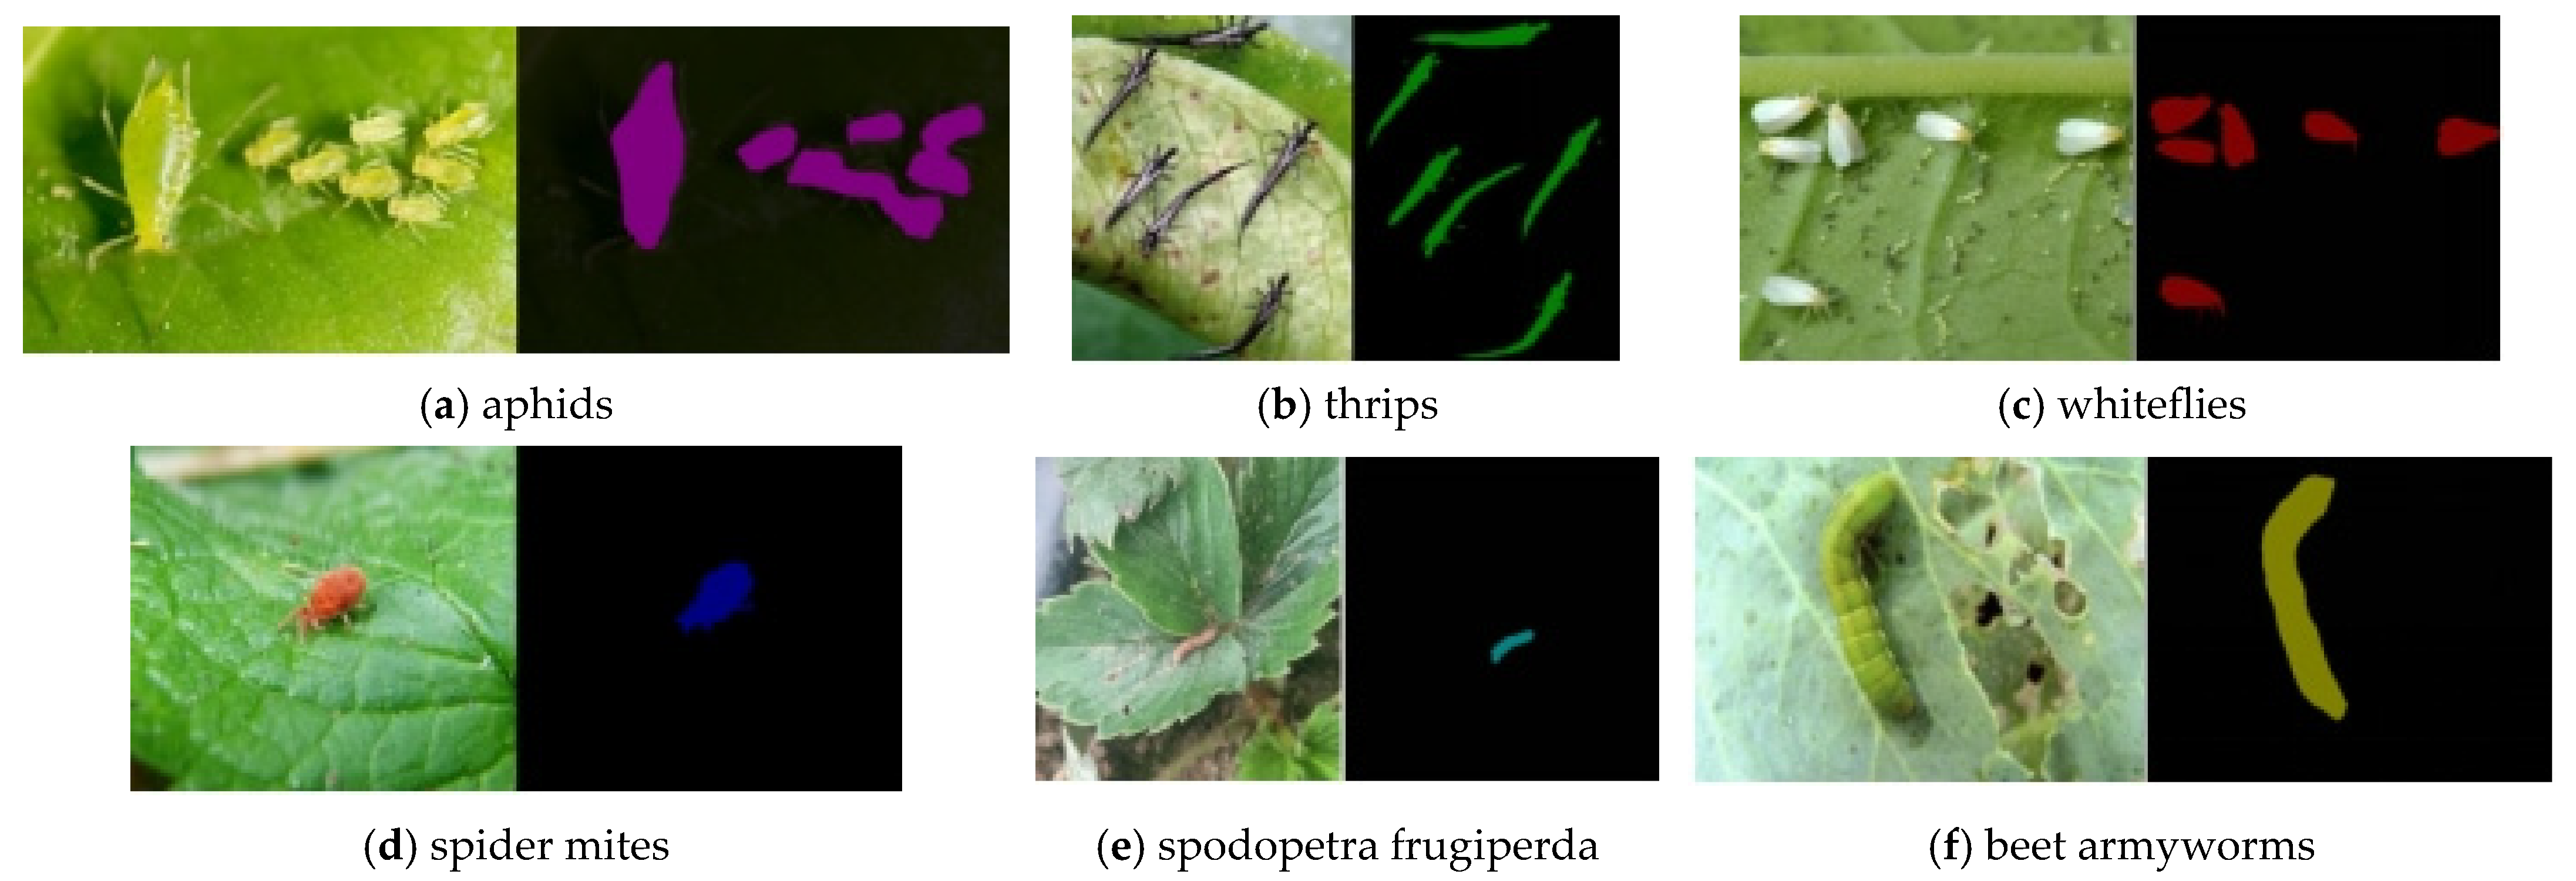
The activity periods and distribution patterns of strawberry pests are influenced by various environmental factors such as climate, season, and temperature. Collecting a large number of pest images through field surveys is impractical, and the six aforementioned pest categories also occur during the growth of other crops. Therefore, this study collected images of six types of pests infesting other crops through web crawling via mainstream search engines such as Baidu, Bing, and Google, as well as by screening open-source datasets. These datasets originate from two major international pest databases: Kaggle and Forestry. Each collected pest image undergoes meticulous screening to ensure high image quality and accurate classification within the dataset. Ultimately, we obtained 600 pest images, comprising 350 field-collected images, 150 images from open-source datasets, and 100 images scraped from the web. Some of the pest images are shown in Figure 2.
This study obtained a total of 600 pest images, with the specific details shown in Table 1. Given the relatively small sample size, this dataset qualifies as a small-sample dataset for deep learning training, necessitating a semantic segmentation model suitable for training with limited data. Images of each pest type were divided 80%/20% into the training and test sets, respectively. The former was used for model training, while the latter served to validate the model’s pest recognition performance.

2.2. Image Color Space Conversion

Unlike the RGB color model, which is highly susceptible to lighting variations, the HSV model exhibits lower sensitivity to changes in illumination. Furthermore, the chroma value in the H channel more effectively reflects the color difference between an object and its background, making it widely adopted in insect pest identification tasks. The LAB color space offers a broader range, simulating human visual perception through digital color representation to accurately depict any color found in nature. YUV achieves significant advantages in encoding and storage by compressing the size of image or video streams through reducing chrominance bandwidth while preserving the brightness and saturation of the original object.
In semantic segmentation tasks, common image color models include RGB, HSV, LAB, and YUV. Each color model consists of three color channel information streams. Different color models exhibit significant variations in how they represent object feature information, which can impact algorithm performance. The pest source images captured by the D435 camera are in the RGB color space, but the R, G, and B channel components vary with changes in light intensity within the greenhouse, leading to reduced detection accuracy. Therefore, the RGB color model is not optimal for pest identification tasks. A comprehensive comparison of multiple color models is required to determine the most suitable one for pest recognition.
Therefore, to analyze the impact of different color spaces on pest recognition, this study constructed training and test sets using distinct color models such as RGB, LAB, HSV, and YUV. The optimal color model was determined by comparing performance parameters to establish a foundation for enhancing pest detection efficiency. The RGB images of the original pests were converted into HSV, LAB, and YUV color spaces, with the results shown in Figure 3.

2.3. Pest Pixel Marker

The dataset was manually annotated using LabelMe software (V4.5.6) to mark the pixel regions of pests within images. The label features primarily include pest category information and are saved in the VOCdevkit dataset format, as shown in Figure 4. During the annotation process, three professional agricultural technicians performed the operations. Each annotated photo underwent mutual inspection to ensure the annotated area fully covered the pest pixels. Since semantic segmentation models perform feature extraction at the pixel level, to enhance pest recognition performance, each pest in the image must be annotated.

3. Pixel-Level Pest Segmentation Model Architecture

Pests are small in size, and the target pixel areas they occupy within dense canopy layers are even smaller, placing high demands on the model’s pixel-level recognition capabilities. To address these demands, this work synergistically integrates channel and spatial attention into a dual-attention parallel architecture (PCSA), and deeply integrates it into the original UNet to enhance recognition performance for small insect objects.

3.1. Backbone

Semantic segmentation models integrate image segmentation, CNN classification, and object detection capabilities, and the mainstream approaches include UNet, DeepLab, and FCN [27,28,29,30,31]. The semantic segmentation model employs an end-to-end operational mechanism to divide images into multiple blocks of pixel labels with multi-level semantic features. By leveraging the cascading relationships between features, it achieves contextual multi-feature fusion, thereby resolving the challenge of pixel-level segmentation for pests in complex agricultural scenarios [32,33].
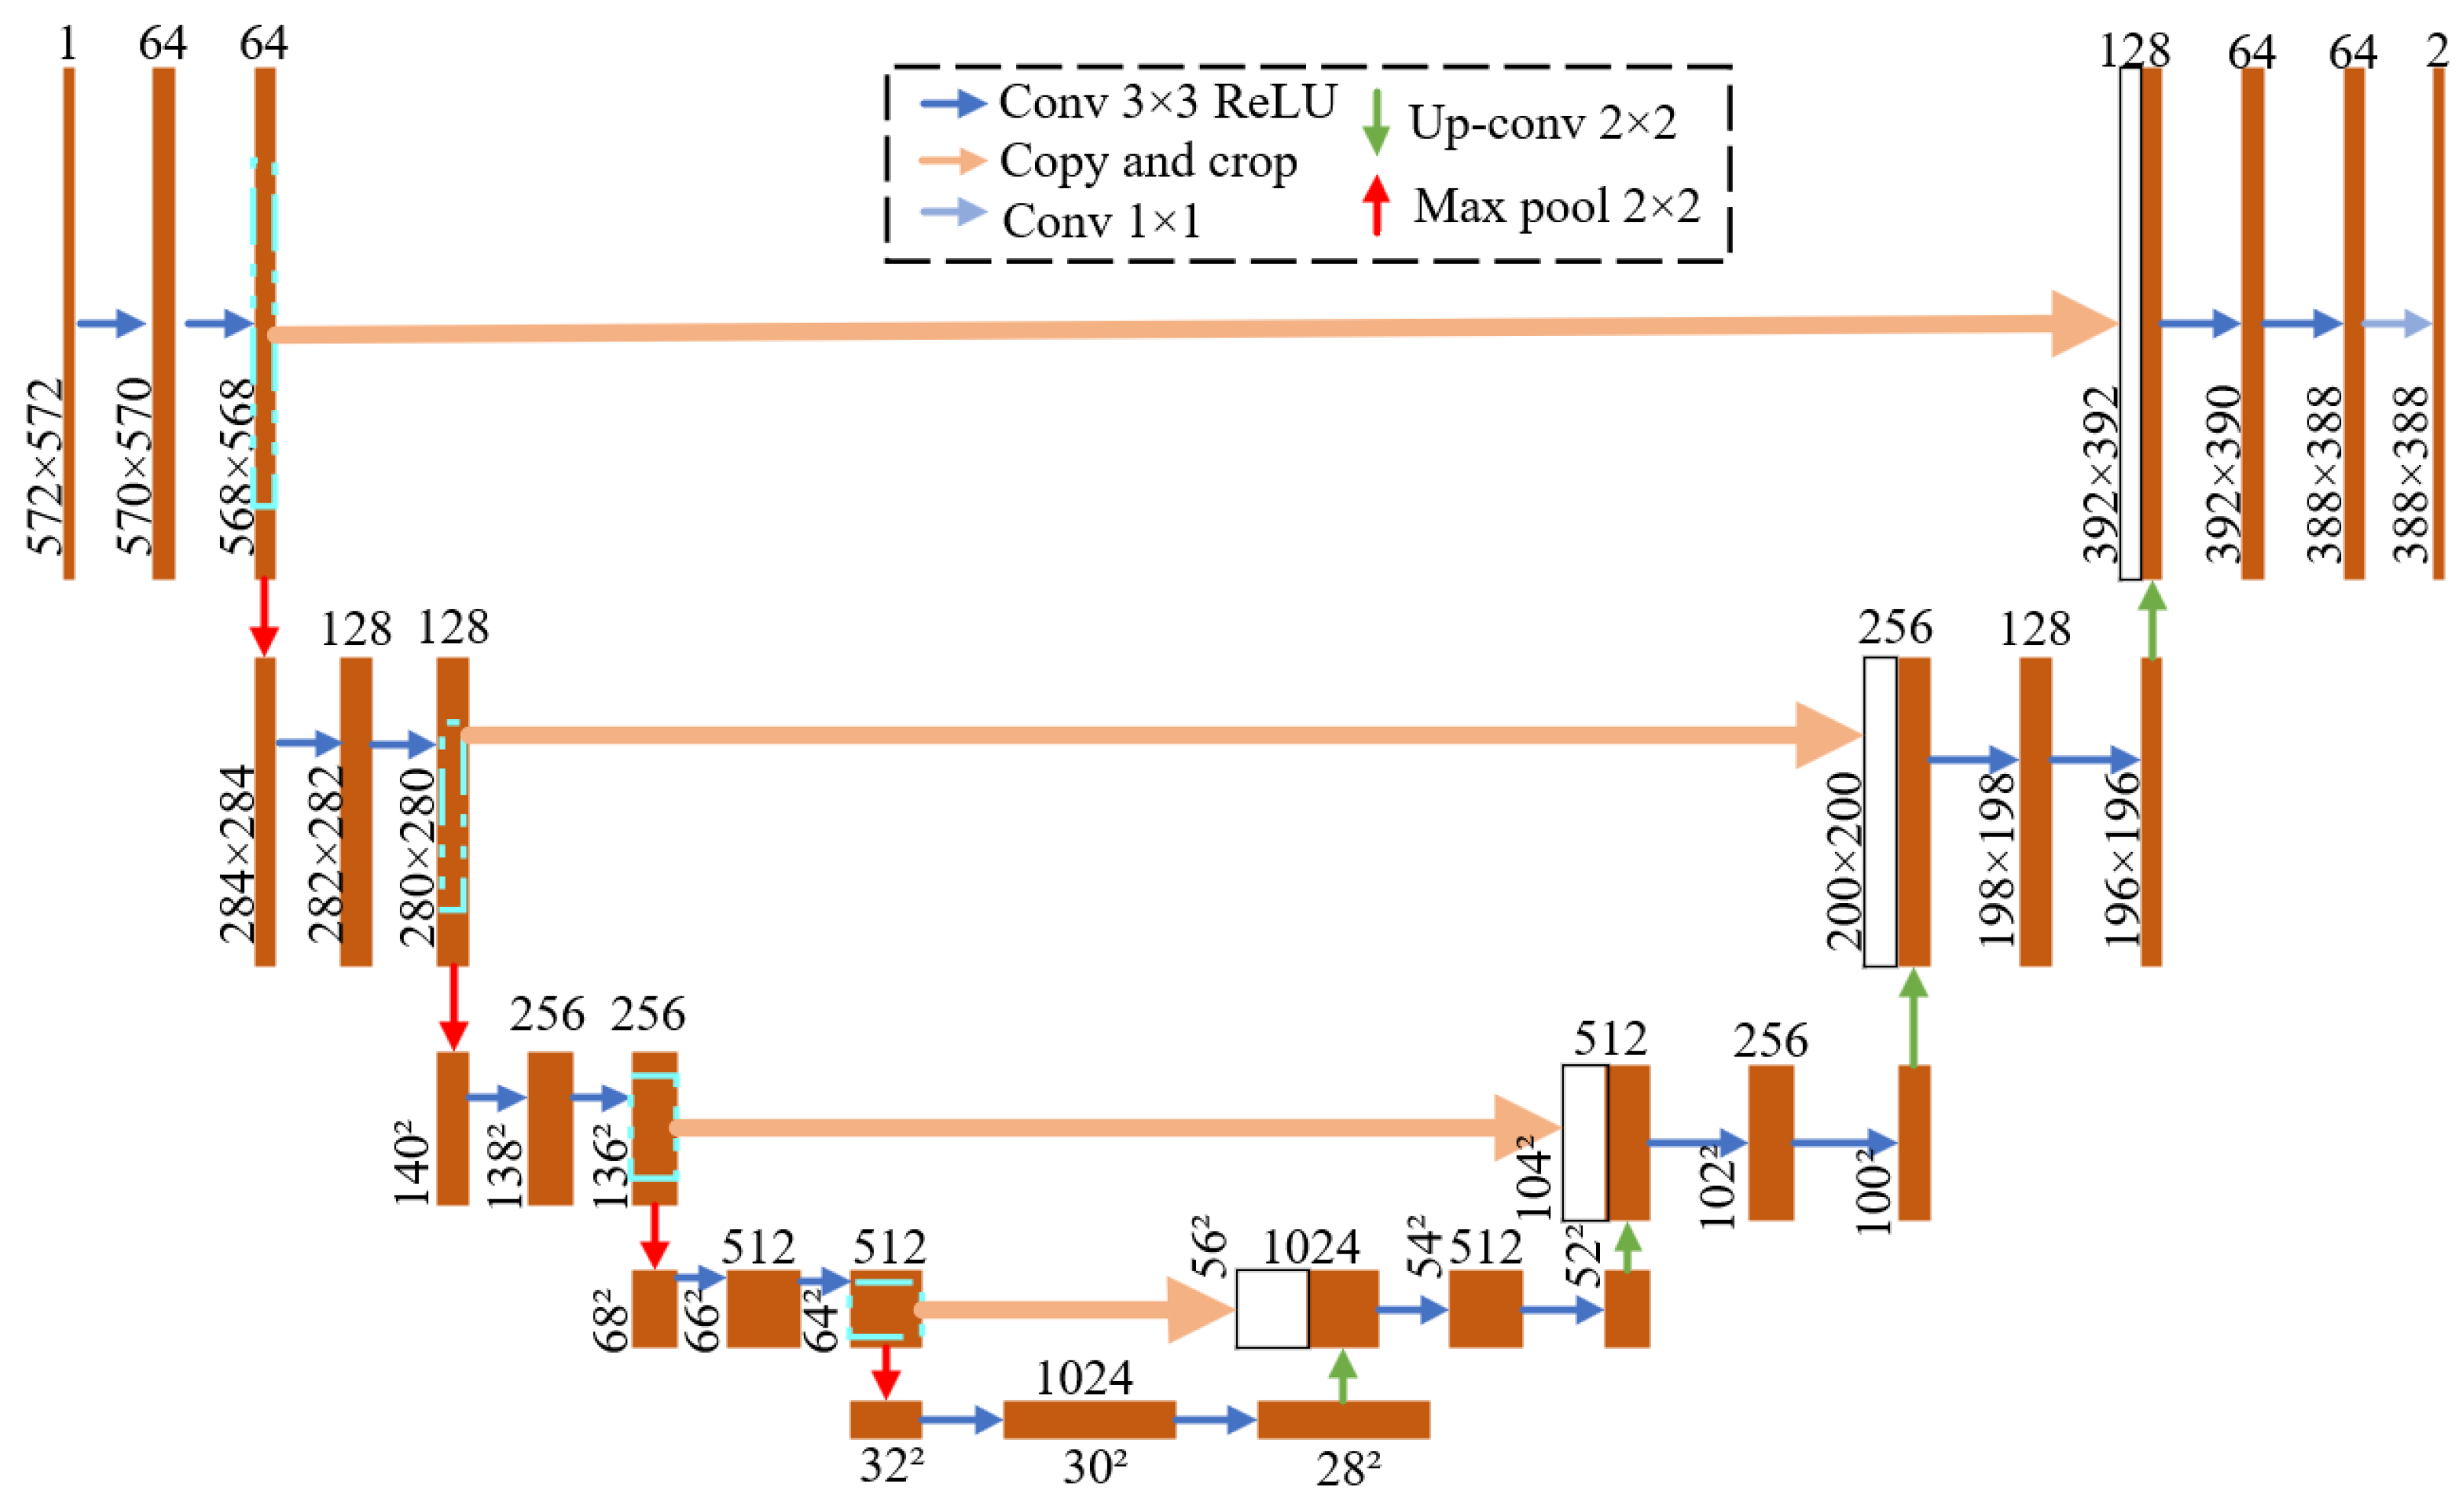
Ronneberger et al. [34] proposed a deep semantic segmentation model (UNet) based on the symmetric distribution of encoding and decoding. The model’s operations primarily involve downsampling in the compression path and upsampling in the expansion path, with the overall architecture exhibiting a U-shaped distribution. The model first performs a 3 × 3 convolution and 2 × 2 max pooling downsampling operation, as shown in Figure 5, ensuring the propagation of feature information from low-level details to high-level semantics within the compression path. The upsampling in the expansion path doubles the feature map size via 2 × 2 deconvolution and immediately fuses it with the channel feature map extracted from the contraction path. The “copy and crop” operations effectively merge the extracted deep and shallow feature information of identical size, preventing the loss of critical features and ensuring the precise classification and localization of objects.
UNet achieves simplicity, low computational complexity, and strong robustness through its overlapping tiling mechanism that integrates contextual information. It demonstrates exceptional performance in seamlessly segmenting small-target, sparse-sample datasets. Therefore, given the highly variable features and random distribution of multiple pest types, this study selects UNet as the base model.

3.2. Channel–Space Parallel Attention (PCSA)

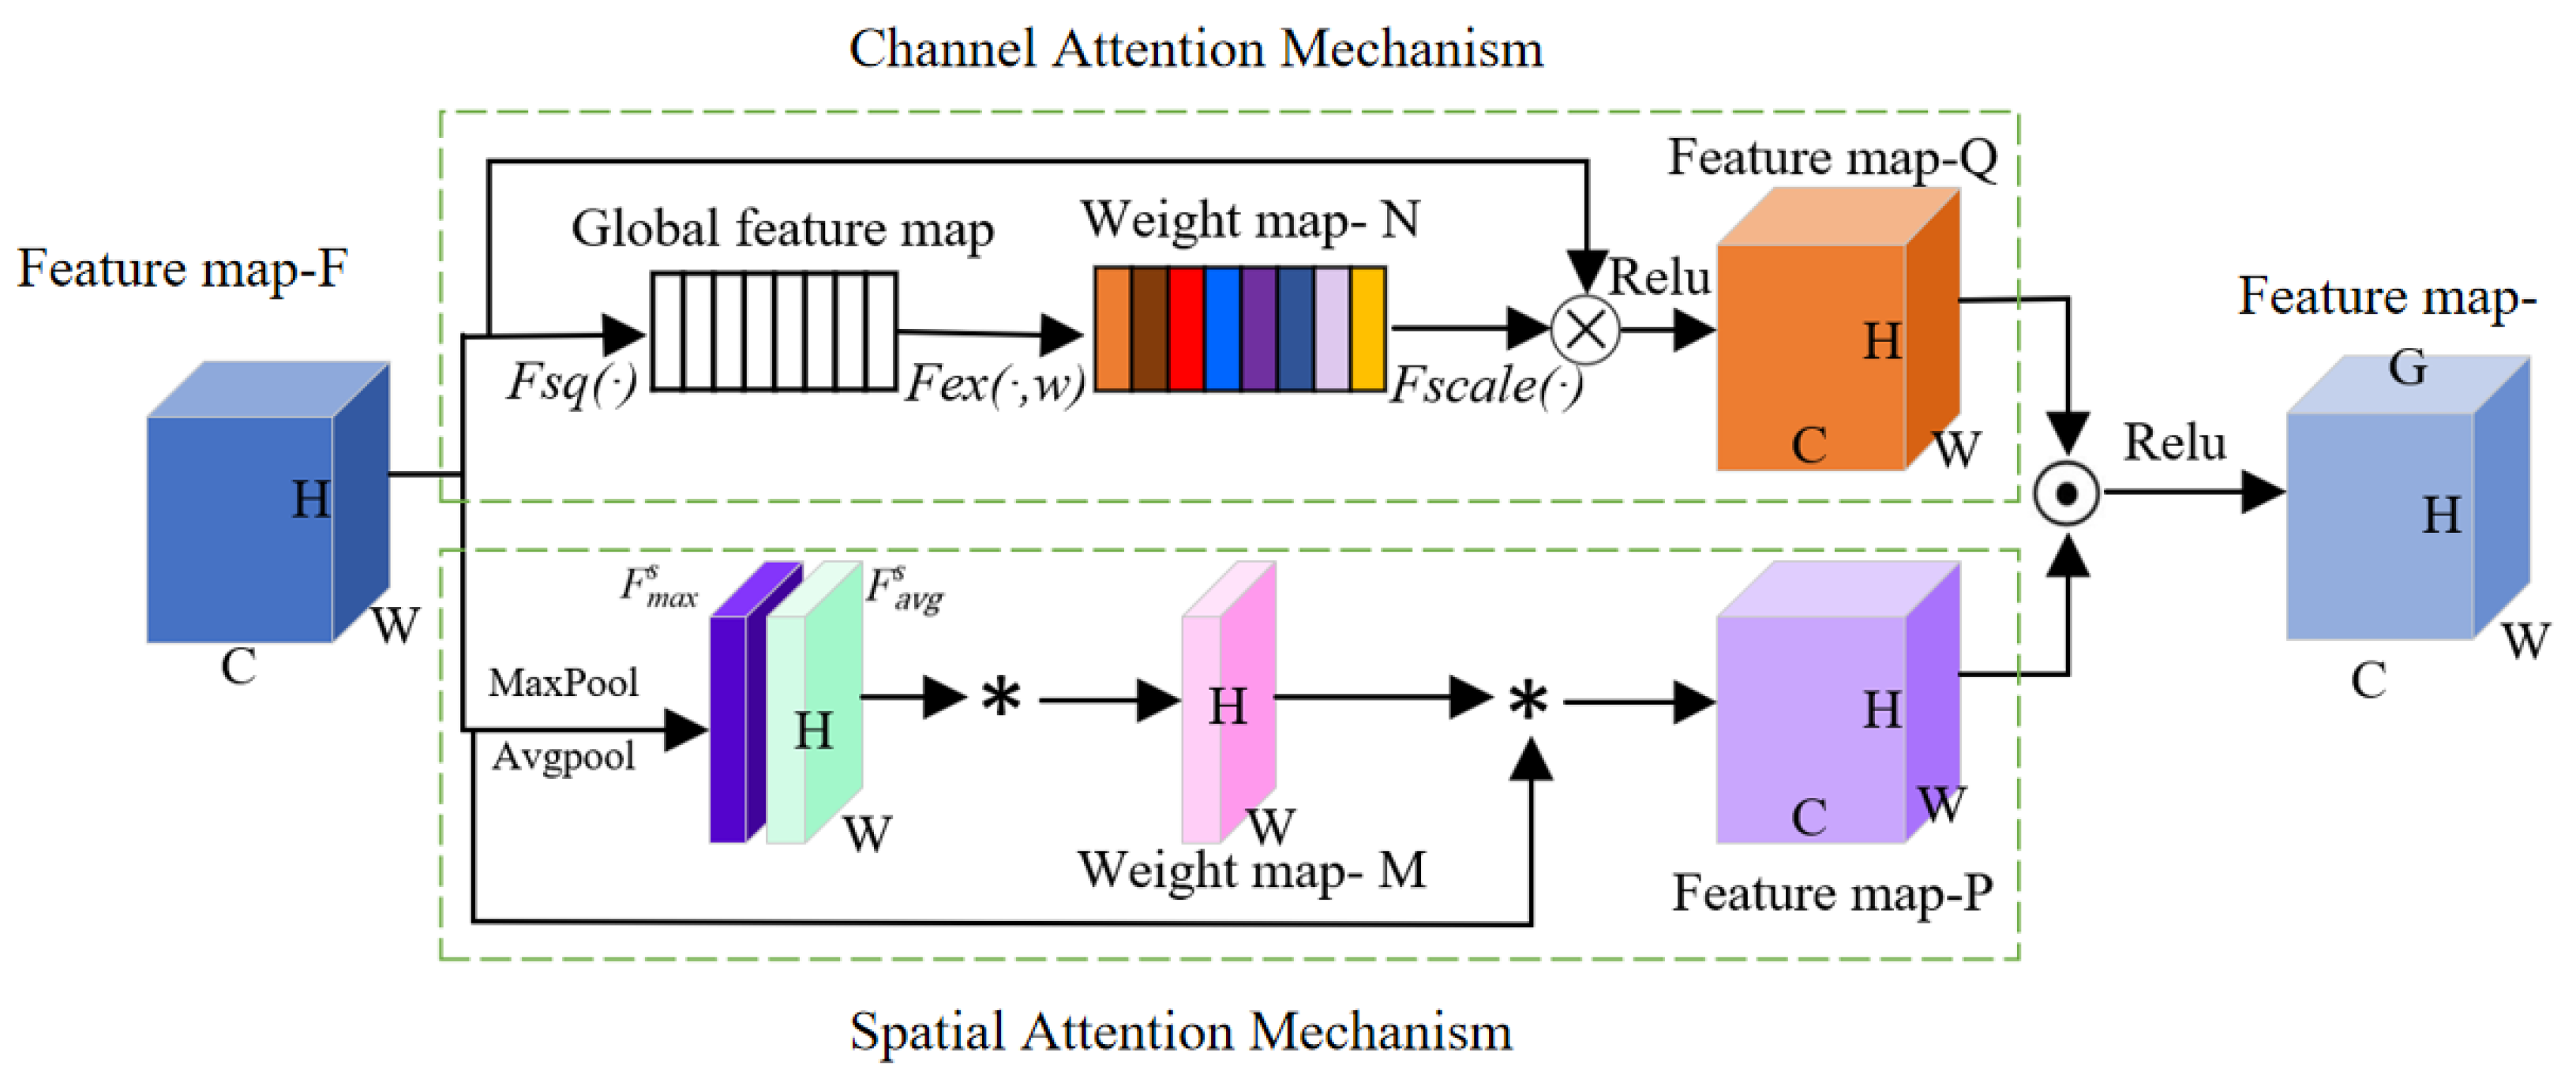
In recent years, numerous scholars have incorporated attention mechanisms into pest identification models, thereby enhancing the detection performance of these models [35]. In pest identification tasks, spatial attention can highlight pest pixel regions from a coordinate perspective, while channel attention emphasizes more feature information from a channel perspective. This paper proposes a channel–space parallel attention mechanism (PCSA) for pest feature extraction, as shown in Figure 6, leveraging the distinct advantages of both channel and spatial attention mechanisms. This module can be directly integrated into existing UNet network architectures.
(1)
Feature map extraction based on channel attention
We employ channel attention based on the Squeeze-and-Excitation Networks paradigm, redistributing weights across feature map channels through one-dimensional convolutions [36]. This approach increases the weights of pest-related channels while decreasing those of other channels. Global average pooling is performed on the input feature map of size C × H × W using Fsq, yielding a 1 × 1 × C feature vector, which is then fed into two fully connected layers. The ReLU activation function is applied between two fully connected layers. The generated feature maps are first reduced by the FC-1 layer and then expanded by FC-2, ensuring that the feature channel dimensions of the input and output remain identical. The calculation formula for Fsq is
F s q = 1 H * W i = 1 H i = 1 W u c ( i , j )
where uc(i,j) is the element in row i and column j of the input feature map.
Then, the input feature map F generates a 1 × 1 × C global feature map. The incentive operation (Fex) serves as the core of the entire channel attention module, employing a sigmoid activation function to compute the weights for each feature channel and assign them to the input feature map. The calculation formula for Fex is
F e x ( z , W ) = σ ( g ( z , W ) ) = σ ( W 2 σ ( W 1 z ) )
where σ is the ReLU function and z is the result of the compression operation.
Parameter W1 reduces the channel size to 1/r of its original dimension. In FC-2, parameter W2 restores the channel size to its original dimensions. The output feature channel weight vector is multiplied by the original input feature map through a scaling operation (Fscale), completing the calibration of the original features along the channel dimension. Ultimately, the extracted features exhibit greater directionality, enhancing pest recognition performance.
(2)
Spatial attention performs average pooling and max pooling operations on the original feature map F, generating two single-channel feature maps F a v g s and F m a x s . Then, these two feature maps are merged to generate the weight map M. The feature map F is weighted using the weight map M to produce the feature map P.
M s = ( A v g p o o l ( F ) M a x p o o l ( F ) ) = σ ( F a v g s F m a x s )
(3)
A dot product is performed between feature maps Q and P, and then the ReLU activation function is applied to obtain feature map G. The feature map G combines weight distributions across both channel and spatial dimensions, enabling it to highlight pest-specific regions while suppressing various types of interference. This allows the model to identify pests with greater accuracy. Meanwhile, when training on small datasets, we employ transfer learning and utilize regularization along with smaller-scale networks to minimize overfitting.

3.3. UNet Adds Attention Mechanism

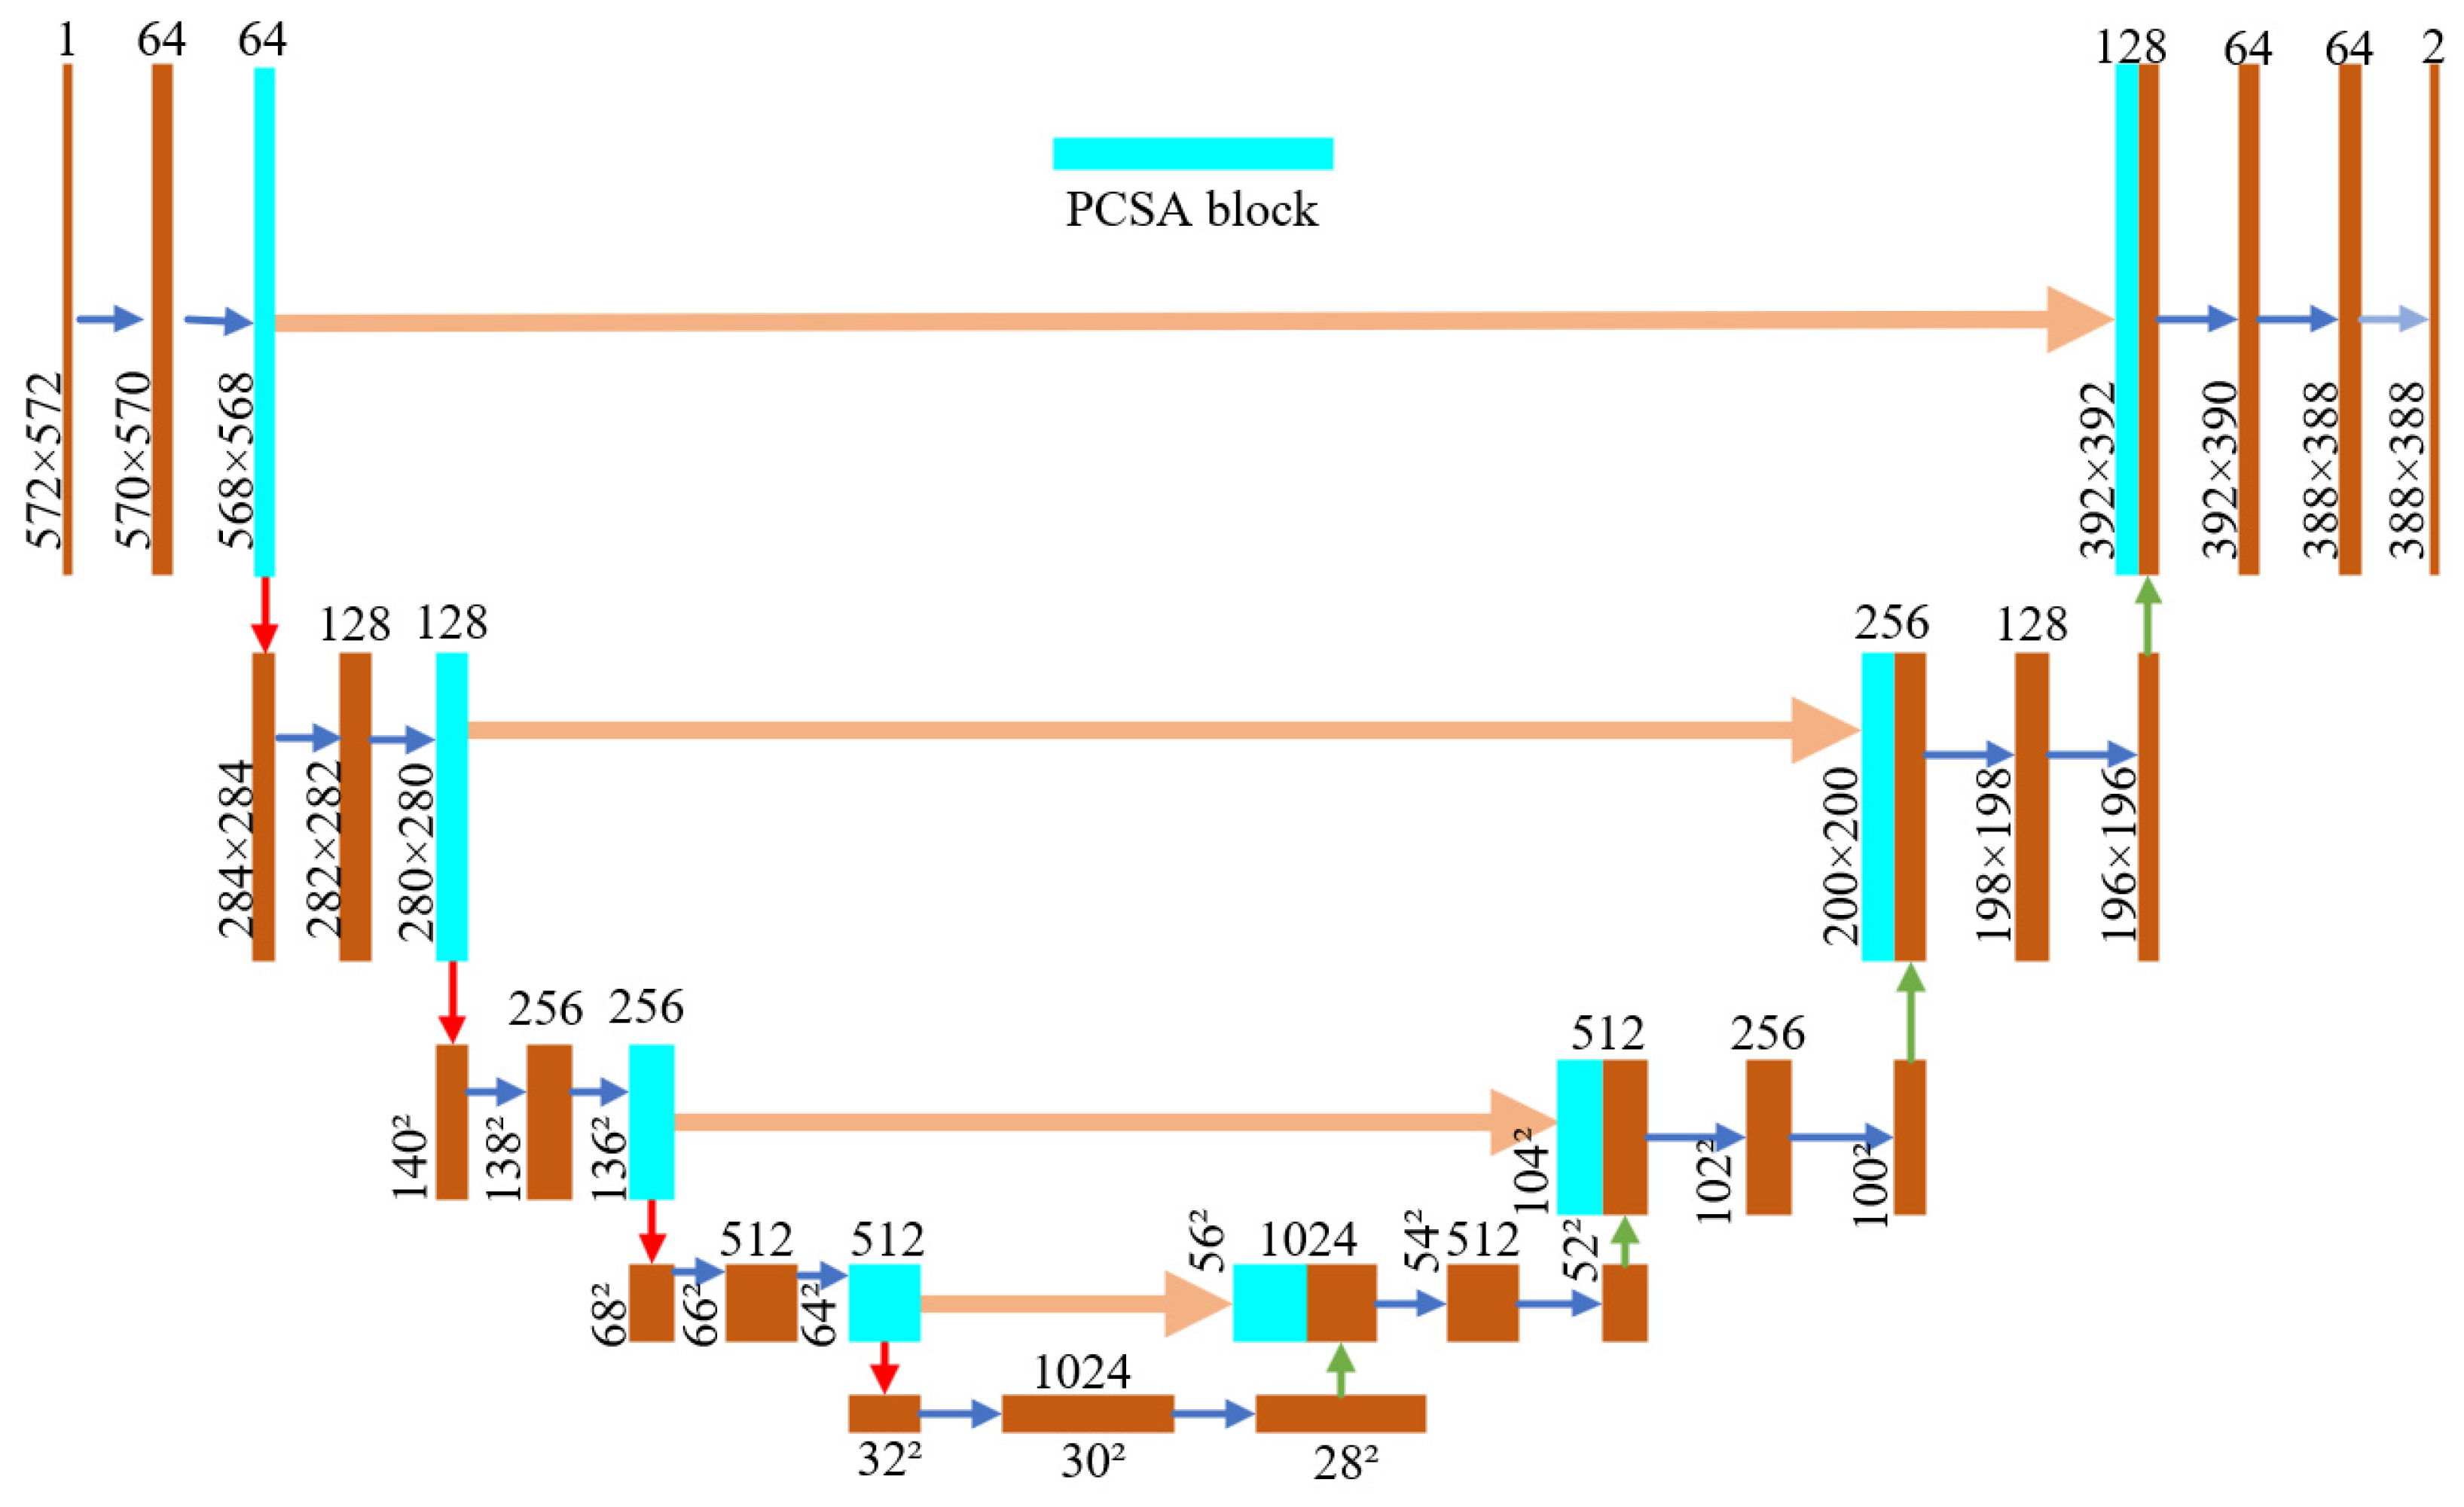
This study improves the original UNet architecture for pest identification tasks by embedding a channel–space dual attention parallel module into the model’s encoder, as shown in Figure 7. Following each stage’s convolutional encoding operation, dual attention-based pest feature enhancement is immediately applied, along with adaptive optimization of the intermediate feature maps. During the sampling process, the feature map input to the subsequent encoder originates from the convolution results of the preceding encoder, ensuring the propagation and utilization of the original feature map.
Compared to object detection models, semantic segmentation models contain over a million parameters, requiring extremely large datasets for training and demanding high computational power and energy consumption from devices. Transfer learning based on model weights is widely applied across various training tasks. It effectively prevents large models from overfitting to small-sample datasets and significantly enhances the model’s generalization capability in real-world detection scenarios.
Therefore, this study utilizes the UNet downsampling path trained on the ImageNet dataset as shared parameters. It further combines these with pest identification characteristics for hyperparameter fine-tuning, ensuring the model achieves good segmentation results on small-sample pest datasets.

3.4. Experimental Setup and Evaluation Index

A Dell T7920 workstation computer was used for model training, utilizing Anaconda3 as the virtual environment. The program was run on Python 3.6, PyTorch 1.2.0, and Torchvision 0.4.0. To reduce training time, NVIDIA CUDA 10.0 and the cuDNN neural network acceleration package were used throughout the training process.
The number of model training cycles was set to 150 epochs, with a batch size of 8 for each training batch. The optimization algorithm selected for training was stochastic gradient descent (SGD). IoU (Intersection over Union), Recall (R), Precision (P), Average Precision (AP), and Mean Average Precision (mAP) were introduced as evaluation metrics for pest segmentation tasks. The IoU can be expressed as follows:
IoU = T P T P   +   F P   +   F N
R, P, AP, and mAP can be expressed as follows:
P = T P T P   +   F P ;   R = T P T P   +   F N ; A P = 0 1 P ( R ) d R
where TP is the number of pixels that are actually pests among those classified as pests by the model, FP is the number of pixels classified as pests by the model that are not actually pests, FN is the number of pixels that are actually pests among those classified as pests by the model, and n is the number of pest species in the dataset.

4. Experimental Results and Discussion

4.1. PCSA Enhancements to UNet Performance

To validate the impact of the PCSA module designed in this study on model performance, this section trains the original and improved UNet models using the pest dataset without color space conversion and compares their performance metrics.
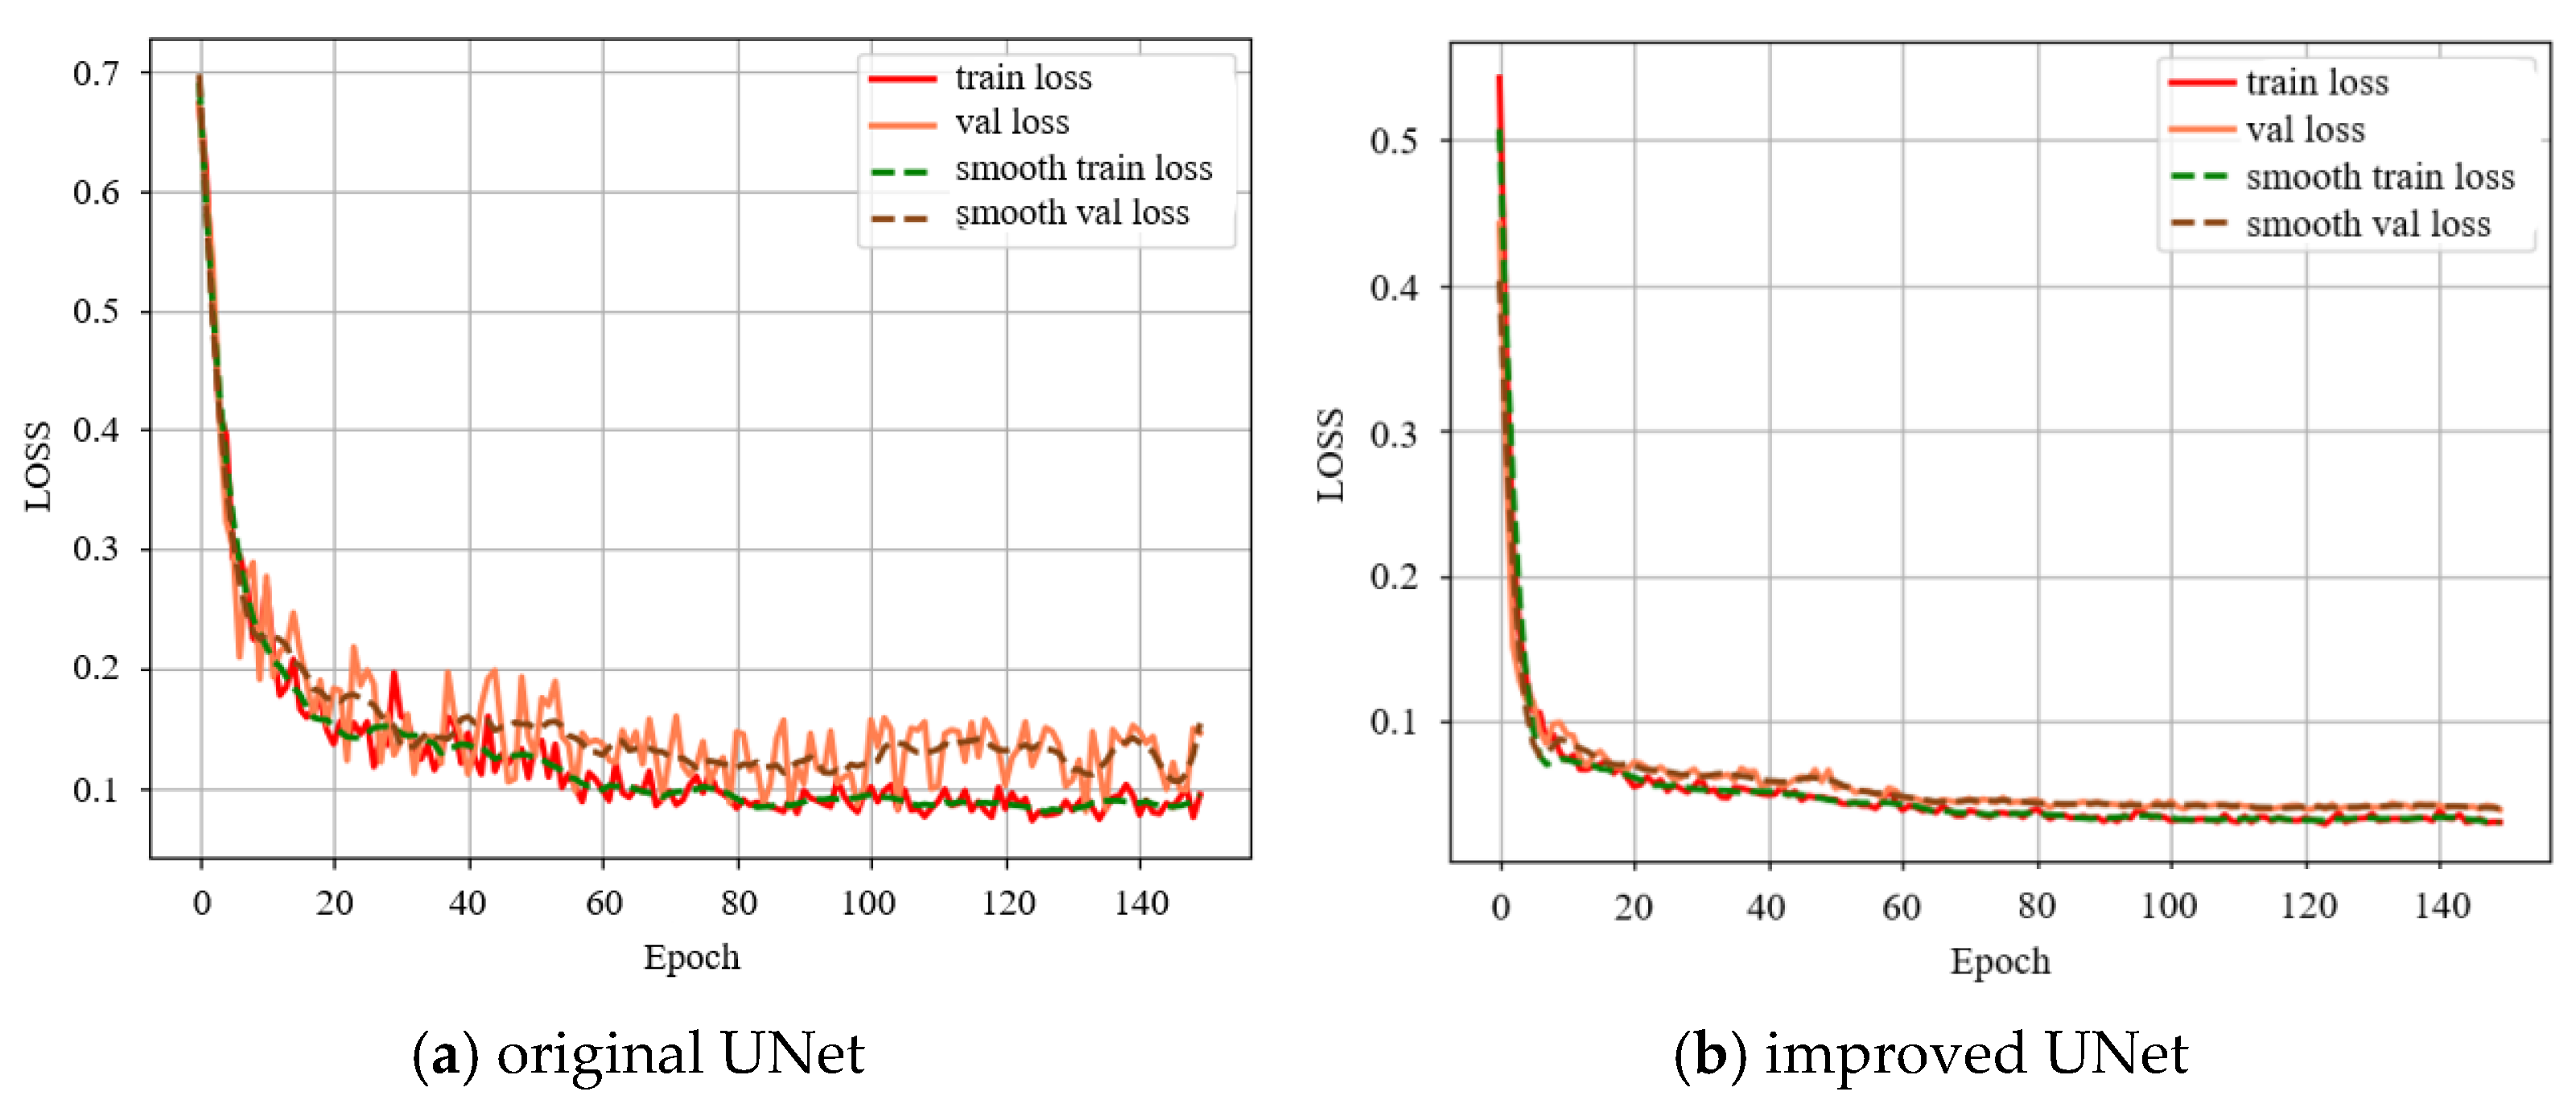
In Figure 8, the original UNet model begins to converge after 80 epochs, but the training and validation loss curves remain in a state of significant fluctuation even after convergence. The train–loss and val–loss curves of the improved UNet exhibit a steady decline. After 80 epochs, the model gradually stabilizes. Between epochs 80 and 150 following convergence, both train–loss and val–loss curves remain remarkably smooth with minimal fluctuation, demonstrating excellent convergence performance.
In Table 2, the improved UNet + PCSA achieves a 4.2% increase in mAP over the baseline UNet and shows enhanced average precision for all pest types. The identification accuracy for thrips, whiteflies, beet armyworms, and spodopetra frugiperda improves by over 4.6%, while that for aphids and spider mites increases by more than 3%.
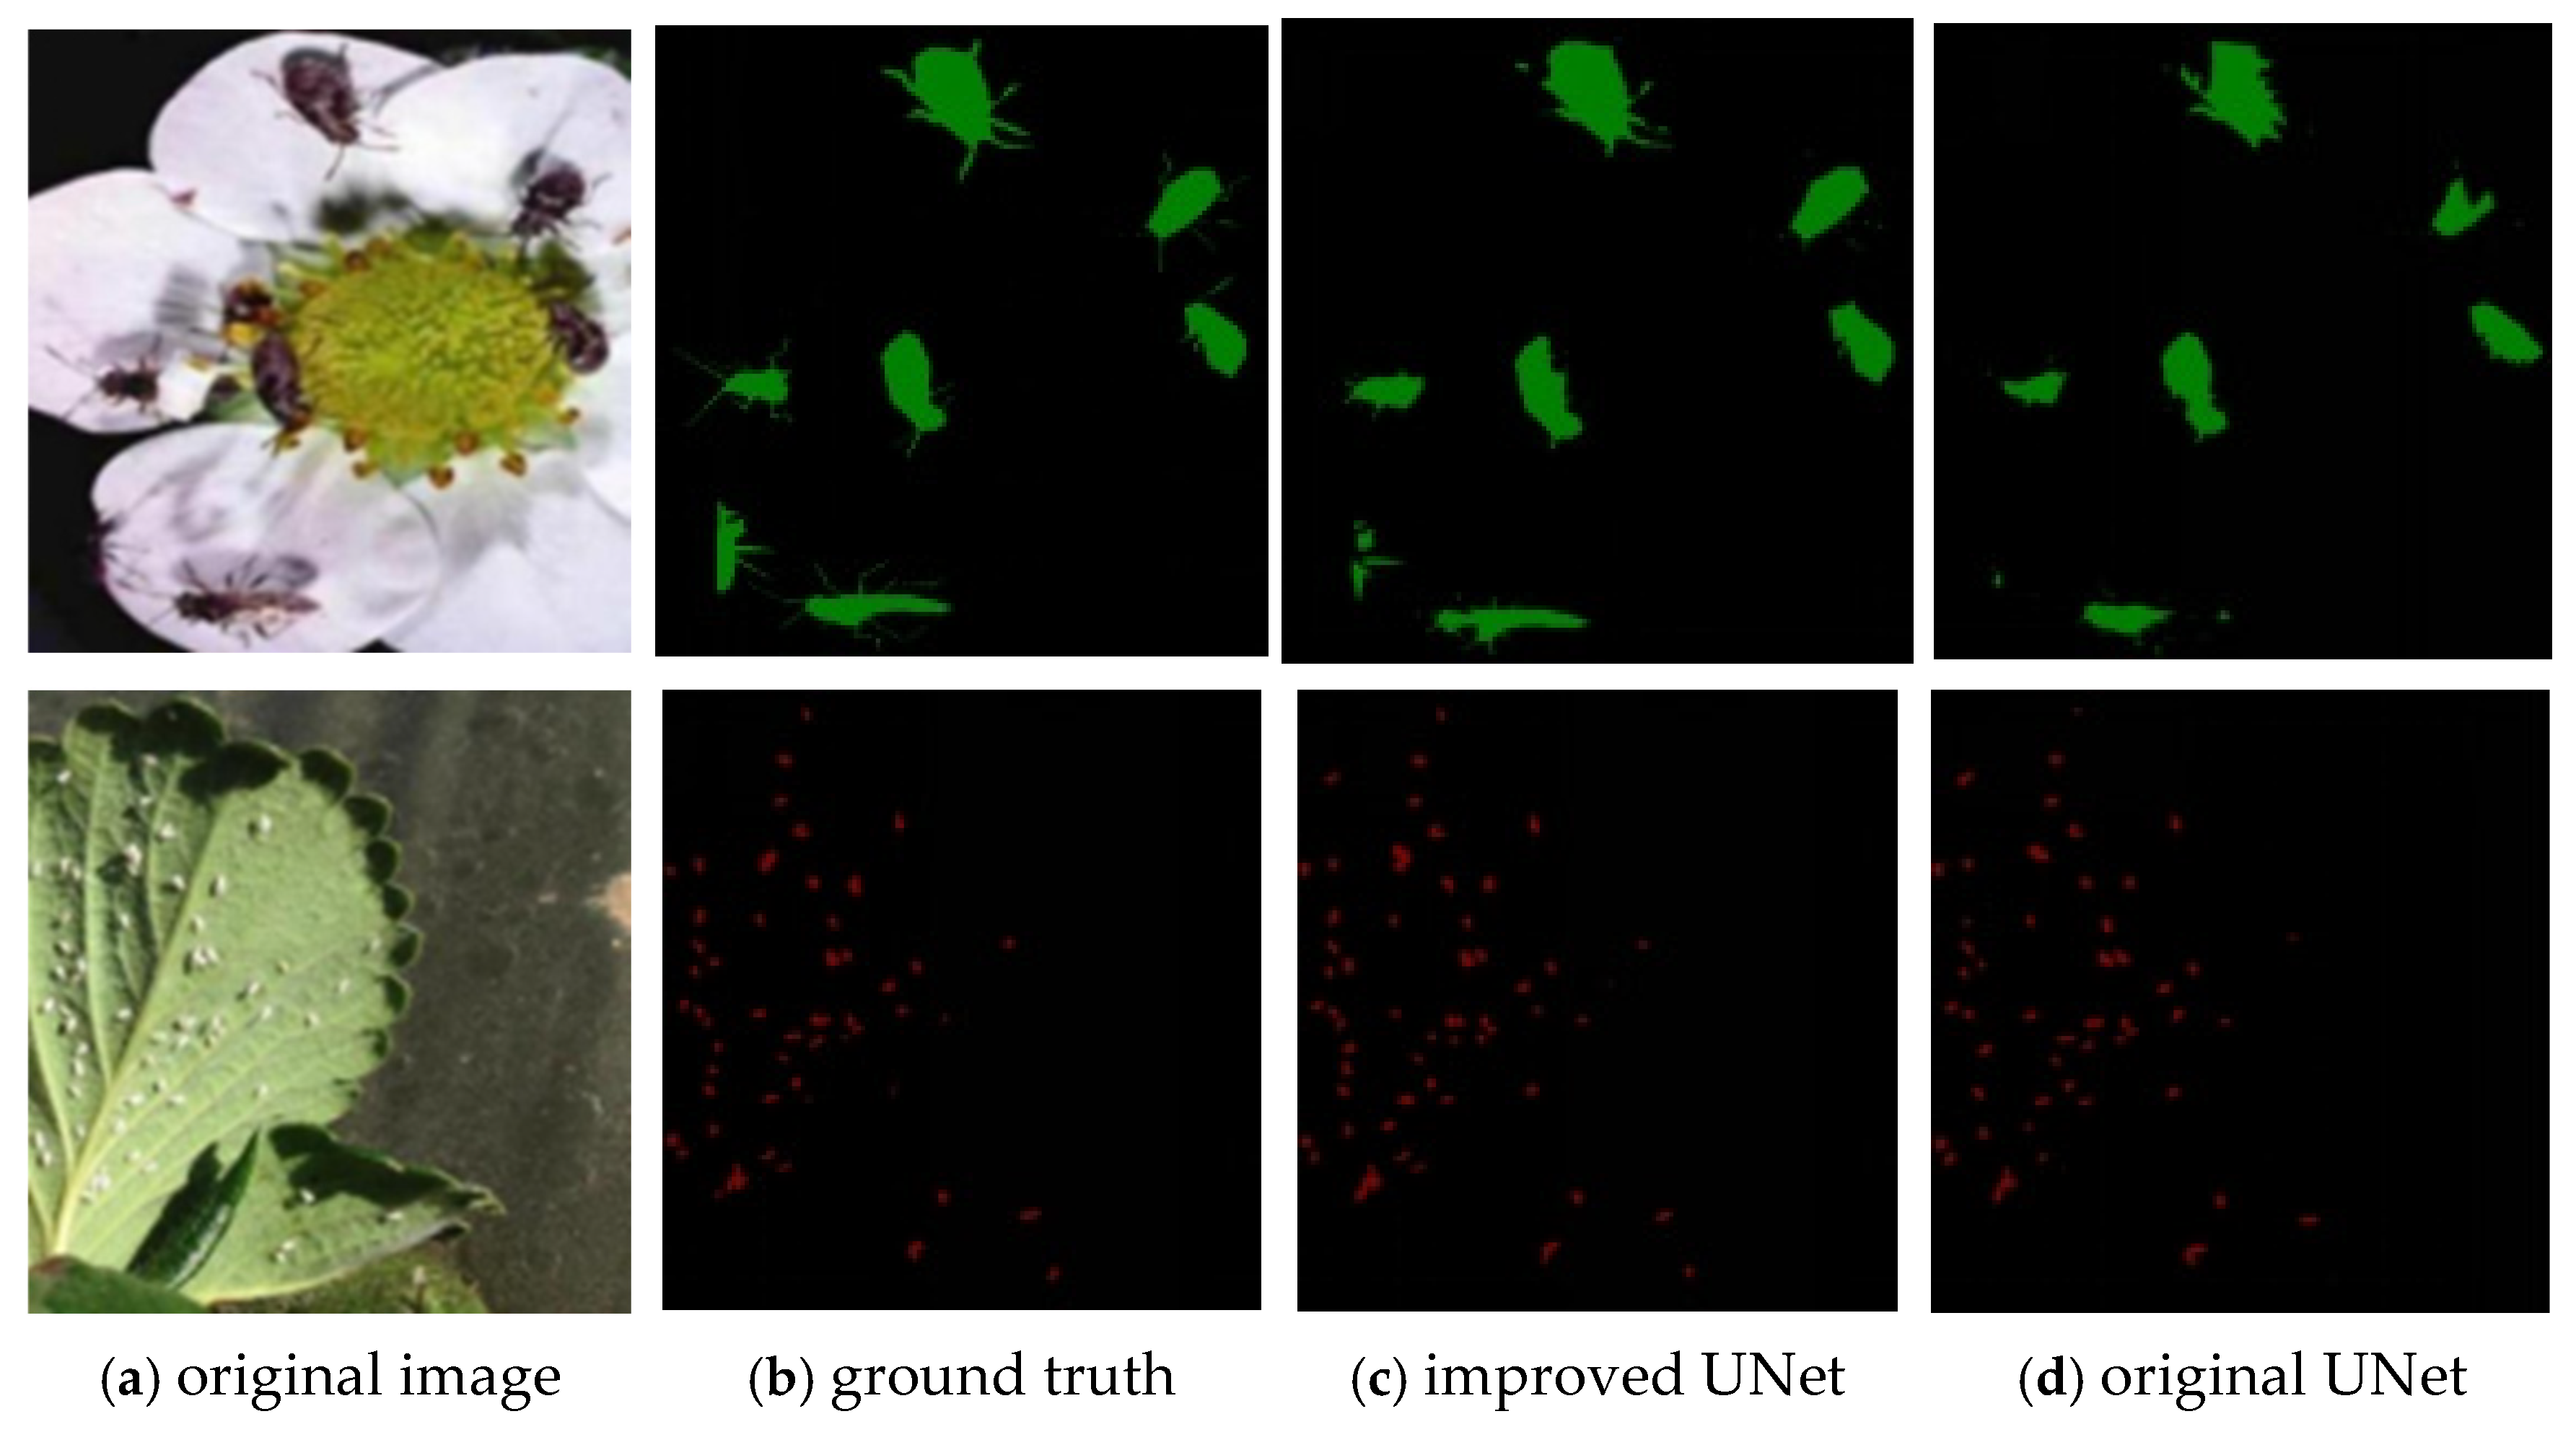
In Figure 9, in the RGB color space, both models exhibit pixel segmentation omissions for the pests. However, the original UNet model omits more pixel regions and suffers from ghosting artifacts in segmentation results. The improved UNet model demonstrates superior pixel extraction capabilities for small insect targets, resulting in fewer omitted areas. The missing pixels primarily concentrate on the insect’s legs and antennae—regions that do not impact pest identification. In summary, the proposed PCSA module demonstrates excellent pixel-level segmentation performance for small insect objects.

4.2. Comparison of Different Color Spaces for Pest Identification

This section further analyzes the optimal color spaces for pest identification, thus performing color space transformations of the original RGB dataset into HSV, LAB, and YUV. The improved UNet model is trained on datasets from these four color spaces under identical conditions.
In Table 3, the improved UNet exhibits significant IoU fluctuations across four color spaces in the pest dataset, with the lowest performance in the LAB color space at just 77.1%, a 7.7% gap from the highest-performing HSV color space. The HSV color space enhances the segmentation performance of the model, achieving a 5.2% improvement in IoU compared to the original RGB color space. In terms of R and P metrics, the model trained using the HSV color space also demonstrates optimal performance.
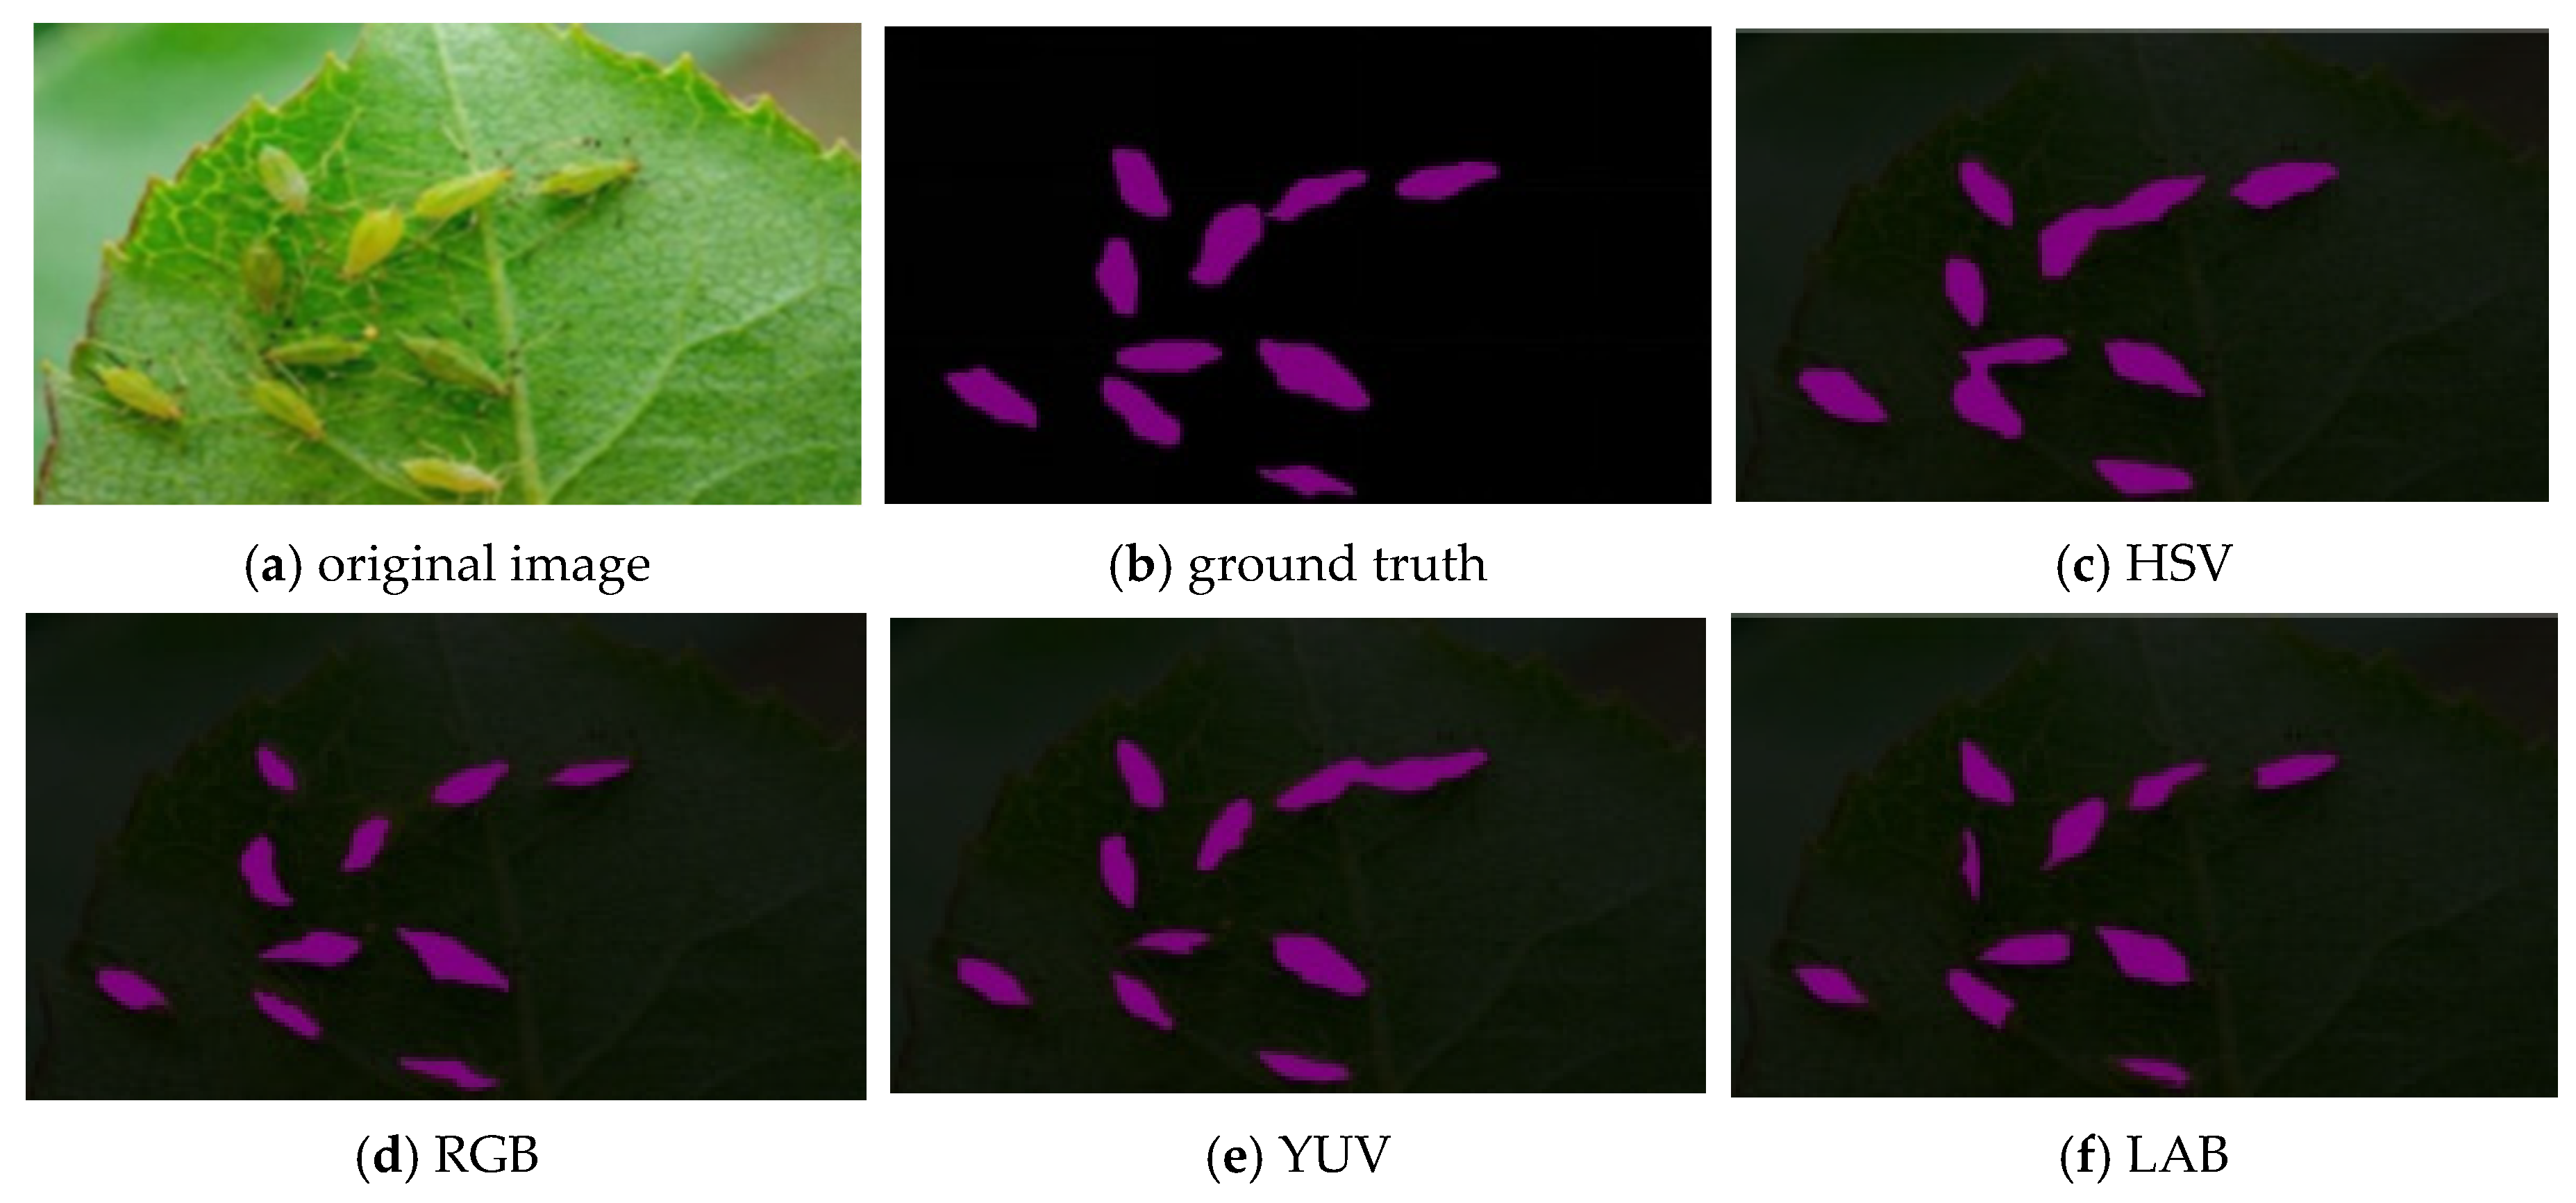
As shown in Figure 10, the HSV color space can segment more pixels containing detailed pest features, whereas the LAB color space loses these detailed characteristics, preventing the model from extracting more critical information and resulting in suboptimal model performance.
Overall, the HSV color space demonstrates superior performance in pest detection compared to RGB, LAB, and YUV color spaces. By decomposing color into intuitive components of hue, saturation, and lightness, it effectively mitigates the impact of lighting variations on target recognition. This makes it particularly suitable for scenarios where color distinctions are pronounced and ambient lighting conditions fluctuate significantly. The primary issue with RGB is its extreme sensitivity to changes in lighting conditions. When ambient light levels shift, RGB values undergo significant fluctuations, resulting in blurred color differences in the target object. Although LAB provides a more detailed description of color, particularly under extreme conditions of low and high illumination, its performance in pest detection within the LAB color space falls short of expectations, and its color description is relatively complex. The YUV color space is prone to losing important color information, especially in scenarios with significant color differences (such as green pests resembling their background), potentially failing to accurately distinguish pests from their surroundings. Therefore, employing the HSV color space for pest detection not only enhances detection accuracy but also improves the model’s robustness in complex environments.

4.3. Performance Comparison of Various Semantic Segmentation Models

To further validate the distinct advantages of the enhanced UNet model in handling small-object insect bodies and small-sample datasets, this study selected FCN and DeepLabV3 semantic segmentation models for comparative validation. All three models were trained on the HSV color space dataset, with identical training hardware and parameters maintained throughout.
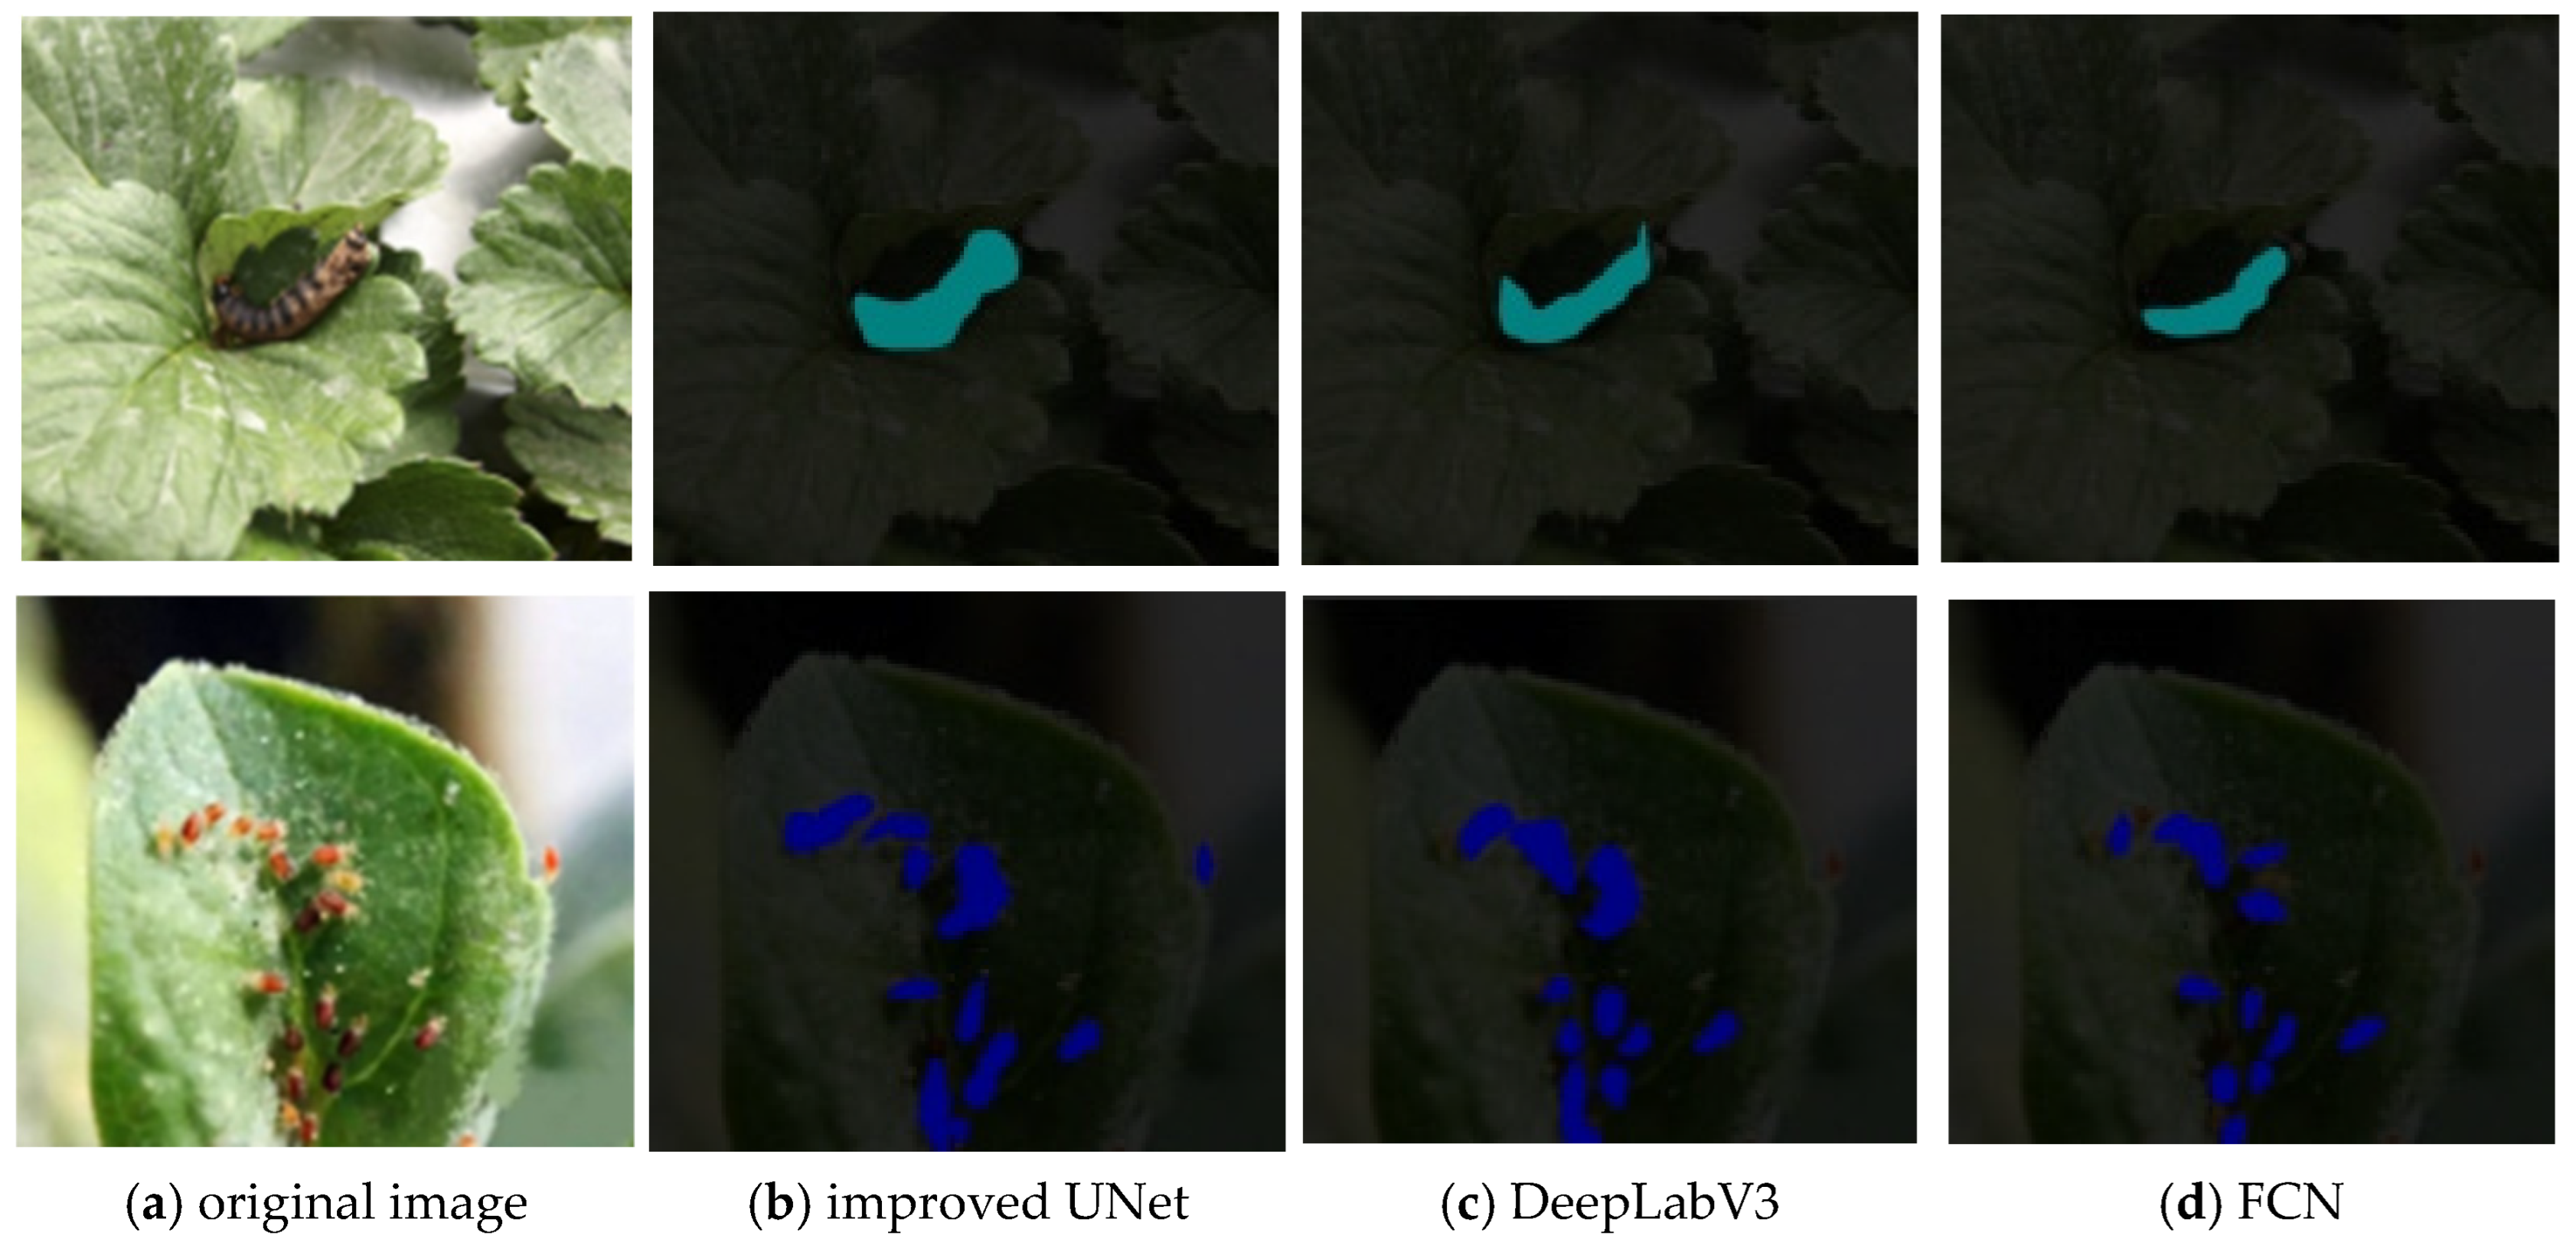
The performance of different semantic segmentation models in pest identification is shown in Figure 11. For a single insect body, all three models perform well in segmenting pixel regions. The improved UNet extracts more feature pixel information compared to FCN and DeepLabV3. For images featuring clustered distributions with extremely small insect targets, all three models exhibit missed detections, with FCN showing the most severe missed detection rate. The improved UNet outperforms DeepLabV3 in segmenting clustered pests individually, demonstrating the model’s ability to focus on finer details.
Table 4 summarizes the performance metrics achieved by three semantic segmentation models on images in the HSV color space. The improved UNet, FCN, and DeepLabV3+ achieved IoU scores of 84.8%, 79.8%, and 81.1%, respectively, on the HSV pest dataset. It can be seen that the improved UNet achieves the best IoU performance, surpassing FCN by 5%. Simultaneously, the enhanced UNet also demonstrates optimal performance in terms of R and P parameters.
Analysis of the IoU values shows that none of the three semantic segmentation models exceed 90%. However, the constructed dataset exhibits significant variations in color, texture, and morphology among different pest types, with random distribution patterns. Additionally, the features displayed on different plant parts show considerable differences. Traditional image segmentation, machine learning, or object detection methods struggle to achieve the results presented in this paper through pest color, shape, and morphological analysis, demonstrating that the improved UNet semantic segmentation model possesses outstanding application advantages for crop pest segmentation. Furthermore, by comparing the performance of different semantic segmentation models, it was found that DeepLabV3 and FCN require large-scale datasets for training to achieve high recognition accuracy, while UNet demonstrates a distinct advantage for small-object, small-sample datasets.
In the aforementioned comparative experiments, false detections of pests and diseases also occurred. This primarily affected two types of pests: aphids and whiteflies. Aphids closely resemble leaf coloration, leading the model to fail in detecting a small portion of aphids. Meanwhile, aphids and whiteflies are relatively small in size, and the model may fail to detect their clustered distribution patterns.

4.4. Validation of PCSA Effectiveness

Since the PCSA module proposed in this paper combines the advantages of channel and spatial attention, we selected the widely used CBAM and SENet for comparison [37]. The positions where attention is embedded into UNet are consistent with those in PCSA.
The comparison results are shown in Table 5. In terms of IoU performance, SENet achieved the lowest result at just 81.3%, while PCSA and CBAM outperformed it by 4.5% and 2.8%, respectively. This demonstrates that incorporating spatial attention on top of channel attention can further enhance the pest recognition capabilities of semantic segmentation models. Then, the PCSA achieves a 1.7% improvement in IoU compared to CBAM. The only difference between the two methods is that CBAM first extracts channel feature maps before extracting spatial feature maps, whereas PCSA performs simultaneous extraction of both channel and spatial feature maps. Therefore, the PCSA module proposed in this paper is effective and can improve the model’s pest recognition performance to a certain extent.
The improved UNet model’s visualization results for various pest identifications are shown in Figure 12. Each segmentation color represents a distinct pest type. The model’s recognition results demonstrate its capability to perform high-precision pest identification tasks.
Numerous studies have demonstrated that UNet exhibits strong performance on small-sample datasets [38,39,40]. In small-sample environments, models rely on transfer learning, data augmentation, and regularization to mitigate overfitting. In large-scale data scenarios, however, ample data provide models with a rich learning space for feature distribution. When dealing with pest and disease samples from large datasets, deeper variants or those incorporating attention mechanisms can be employed to enhance expressive capabilities, and training strategies and model adaptation require corresponding adjustments. Through targeted improvements in model architecture, training methods, and data processing, the UNet model achieves higher accuracy and greater robustness in large-scale data environments.

5. Conclusions and Future Work

To achieve reliable identification of several strawberry pests, this study establishes a small-sample pest dataset. Considering the challenges in pest recognition and leveraging the strengths of the UNet semantic segmentation model, we propose the channel–space parallel attention mechanism (PCSA) and deeply integrate it into UNet. The PCSA module redistributes key information within the output of the feature maps in each layer, deeply integrating global–local pixel information to enhance pest recognition performance. Furthermore, to determine the optimal color space for pest recognition, the original RGB data undergo transformations into HSV, LAB, and YUV color spaces. The experimental results demonstrate that the HSV color space is well-suited for pest identification tasks, achieving IoU, recall, and precision values of 84.8%, 89.9%, and 91.8%, respectively. Additionally, among various semantic segmentation models, the combination of “UNet + PCSA + HSV” proves most effective for pest identification, outperforming FCN and DeepLabv3 while accommodating recognition needs across different image sizes.
The model proposed in this paper will be deployed in agricultural robots. Given that complex field environments significantly impact the operational performance of inspection robots, in subsequent research tasks, we will further expand the dataset under varying light intensities to enhance the model’s robustness in field recognition. We will also establish a continuous learning framework that leverages the robot’s hardware computing power and software environment to train models while simultaneously collecting samples. The pest identification model investigated in this study holds significant commercial application potential. It can be deployed on inspection robots to identify pests or on pesticide application robots to enable precise, targeted spraying.

Author Contributions

Conceptualization, S.Z., J.L. and Y.J.; methodology, S.Z., J.L., T.H. and Y.J.; software, S.Z.; validation, S.Z., Y.J. and J.L.; formal analysis, S.Z., J.L., Y.J. and T.H.; investigation, S.Z. and J.L.; resources, J.L.; data curation, Y.J. and T.H.; writing—original draft preparation, S.Z.; writing—review and editing, S.Z., J.L. and Y.J. All authors have read and agreed to the published version of the manuscript.

Funding

The work was supported by the Young Scientists Fund of the National Natural Science Foundation of China (No. 32401693), and the Jiangsu Province Modern Agricultural Machinery Equipment and Technology Demonstration and Promotion Project (No. NJ2023-23). Priority Academic Program Development of Jiangsu Higher Education Institutions (No. PAPD2023-87).

Institutional Review Board Statement

Not applicable.

Informed Consent Statement

Not applicable.

Data Availability Statement

The original contributions presented in this study are included in the article. Further inquiries can be directed to the corresponding author.

Conflicts of Interest

The authors declare no conflicts of interest.

References

  1. Ma, Z.; Wang, W.; Chen, X.; Gehman, K.; Yang, H.; Yang, Y. Prediction of the global occurrence of maize diseases and estimation of yield loss under climate change. Pest Manag. Sci. 2024, 80, 5759–5770. [Google Scholar] [CrossRef]
  2. Zhao, S.; Peng, Y.; Liu, J.; Wu, S. Tomato leaf disease diagnosis based on improved convolution neural network by attention module. Agriculture 2021, 11, 651. [Google Scholar] [CrossRef]
  3. Eskola, M.; Kos, G.; Elliott, C.T.; Hajšlová, J.; Mayar, S.; Krska, R. Worldwide contamination of food-crops with mycotoxins: Validity of the widely cited ‘FAO estimate’ of 25%. Crit. Rev. Food Sci. Nutr. 2020, 60, 2773–2789. [Google Scholar] [CrossRef]
  4. Upadhyay, A.; Chandel, N.S.; Singh, K.P.; Chakraborty, S.K.; Nandede, B.M.; Kumar, M.; Subeesh, A.; Upendar, K.; Salem, A.; Elbeltagi, A. Deep learning and computer vision in plant disease detection: A comprehensive review of techniques, models, and trends in precision agriculture. Artif. Intell. Rev. 2025, 58, 92. [Google Scholar] [CrossRef]
  5. Martinelli, F.; Scalenghe, R.; Davino, S.; Panno, S.; Scuderi, G.; Ruisi, P.; Villa, P.; Stroppiana, D.; Boschetti, M.; Goulart, L.R. Advanced methods of plant disease detection. A review. Agron. Sustain. Dev. 2015, 35, 1–25. [Google Scholar] [CrossRef]
  6. Wang, Y.; Yang, N.; Ma, G.; Taha, M.F.; Mao, H.; Zhang, X.; Shi, Q. Detection of spores using polarization image features and BP neural network. Int. J. Agric. Biol. Eng. 2024, 17, 213–221. [Google Scholar] [CrossRef]
  7. Wang, Y.; Zhang, X.; Taha, M.F.; Chen, T.; Yang, N.; Zhang, J.; Mao, H. Detection method of fungal spores based on fingerprint characteristics of diffraction–polarization images. J. Fungi 2023, 9, 1131. [Google Scholar] [CrossRef]
  8. Liu, J.; Wu, S. Research Progress and Prospect of Strawberry Whole-process Farming Mechanization Technology and Equipment. Trans. Chin. Soc. Agric. Mach. 2021, 52, 1–16. [Google Scholar]
  9. Castro, P.; Bushakra, J.; Stewart, P.; Weebadde, C.; Wang, D.; Hancock, J.; Finn, C.; Luby, J.; Lewers, K. Genetic mapping of day-neutrality in cultivated strawberry. Mol. Breed. 2015, 35, 79. [Google Scholar] [CrossRef]
  10. Zhao, S.; Liu, J.; Wu, S. Multiple disease detection method for greenhouse-cultivated strawberry based on multiscale feature fusion Faster R_CNN. Comput. Electron. Agric. 2022, 199, 107176. [Google Scholar] [CrossRef]
  11. Han, Y.; Zhang, C.; Zhan, X.; Wang, Z. Fine-grained identification of crop pests using an enhanced ConvNeXt model. Trans. Chin. Soc. Agric. Eng. 2025, 41, 185–192. [Google Scholar]
  12. Batz, P.; Will, T.; Thiel, S.; Ziesche, T.M.; Joachim, C. From identification to forecasting: The potential of image recognition and artificial intelligence for aphid pest monitoring. Front. Plant Sci. 2023, 14, 1150748. [Google Scholar] [CrossRef] [PubMed]
  13. Pattnaik, G.; Parvathi, K. Automatic detection and classification of tomato pests using support vector machine based on HOG and LBP feature extraction technique. In Progress in Advanced Computing and Intelligent Engineering, Proceedings of the ICACIE 2019, Odisha, India, 20–22 December 2019; Springer: Singapore, 2020; Volume 2, pp. 49–55. [Google Scholar]
  14. Deng, L.; Wang, Y.; Han, Z.; Yu, R. Research on insect pest image detection and recognition based on bio-inspired methods. Biosyst. Eng. 2018, 169, 139–148. [Google Scholar] [CrossRef]
  15. Peng, H.; Xu, H.; Liu, H. Lightweight agricultural crops pest identification model using improved ShuffleNet V2. Trans. Chin. Soc. Agric. Eng. (Trans. CSAE) 2022, 38, 161–170. [Google Scholar]
  16. Dong, S.; Du, J.; Jiao, L.; Wang, F.; Liu, K.; Teng, Y.; Wang, R. Automatic crop pest detection oriented multiscale feature fusion approach. Insects 2022, 13, 554. [Google Scholar] [CrossRef]
  17. Ullah, N.; Khan, J.A.; Alharbi, L.A.; Raza, A.; Khan, W.; Ahmad, I. An efficient approach for crops pests recognition and classification based on novel DeepPestNet deep learning model. IEEE Access 2022, 10, 73019–73032. [Google Scholar] [CrossRef]
  18. Zhang, Z.; Rong, J.; Qi, Z.; Yang, Y.; Zheng, X.; Gao, J.; Li, W.; Yuan, T. A multi-species pest recognition and counting method based on a density map in the greenhouse. Comput. Electron. Agric. 2024, 217, 108554. [Google Scholar] [CrossRef]
  19. He, Y.; Zhou, Z.; Tian, L.; Liu, Y.; Luo, X. Brown rice planthopper (Nilaparvata lugens Stal) detection based on deep learning. Precis. Agric. 2020, 21, 1385–1402. [Google Scholar] [CrossRef]
  20. Tang, Y.; Luo, F.; Wu, P.; Tan, J.; Wang, L.; Niu, Q.; Li, H.; Wang, P. An improved YOLO network for small target insects detection in tomato fields. Comput. Electron. Agric. 2025, 239, 110915. [Google Scholar] [CrossRef]
  21. Zhang, Y.; Chen, L.; Yuan, Y. Few-shot agricultural pest recognition based on multimodal masked autoencoder. Crop Prot. 2025, 187, 106993. [Google Scholar] [CrossRef]
  22. Xing, S.; Lee, H.J. Crop pests and diseases recognition using DANet with TLDP. Comput. Electron. Agric. 2022, 199, 107144. [Google Scholar] [CrossRef]
  23. Dong, C.; Zhang, Z.; Yue, J.; Zhou, L. Automatic recognition of strawberry diseases and pests using convolutional neural network. Smart Agric. Technol. 2021, 1, 100009. [Google Scholar] [CrossRef]
  24. Gan, G.; Xiao, X.; Jiang, C.; Ye, Y.; He, Y.; Xu, Y.; Luo, C. Strawberry disease and pest identification and control based on Se-Resnext50 model. In Proceedings of the 2022 3rd International Conference on Computer Vision, Image and Deep Learning & International Conference on Computer Engineering and Applications (CVIDL & ICCEA), Changchun, China, 20–22 May 2022; pp. 237–243. [Google Scholar]
  25. Choi, Y.-W.; Kim, N.-e.; Paudel, B.; Kim, H.-t. Strawberry pests and diseases detection technique optimized for symptoms using deep learning algorithm. J. Bio-Environ. Control 2022, 31, 255–260. [Google Scholar] [CrossRef]
  26. Wang, D.; Deng, L.; Ni, J.; Gao, J.; Zhu, H.; Han, Z. Recognition pest by image-based transfer learning. J. Sci. Food Agric. 2019, 99, 4524–4531. [Google Scholar]
  27. Lottes, P.; Behley, J.; Milioto, A.; Stachniss, C. Fully convolutional networks with sequential information for robust crop and weed detection in precision farming. IEEE Robot. Autom. Lett. 2018, 3, 2870–2877. [Google Scholar] [CrossRef]
  28. Chen, L.-C.; Papandreou, G.; Kokkinos, I.; Murphy, K.; Yuille, A.L. Semantic image segmentation with deep convolutional nets and fully connected crfs. arXiv 2014, arXiv:1412.7062. [Google Scholar]
  29. Chen, L.-C.; Papandreou, G.; Kokkinos, I.; Murphy, K.; Yuille, A.L. Deeplab: Semantic image segmentation with deep convolutional nets, atrous convolution, and fully connected crfs. IEEE Trans. Pattern Anal. Mach. Intell. 2017, 40, 834–848. [Google Scholar] [CrossRef]
  30. Chen, L.-C.; Zhu, Y.; Papandreou, G.; Schroff, F.; Adam, H. Encoder-decoder with atrous separable convolution for semantic image segmentation. In Proceedings of the European Conference on Computer Vision (ECCV), Munich, Germany, 8–14 September 2018; pp. 801–818. [Google Scholar]
  31. Long, J.; Shelhamer, E.; Darrell, T. Fully convolutional networks for semantic segmentation. In Proceedings of the IEEE Conference on Computer Vision and Pattern Recognition, Boston, MA, USA, 7–12 June 2015; pp. 3431–3440. [Google Scholar]
  32. Tassis, L.M.; de Souza, J.E.T.; Krohling, R.A. A deep learning approach combining instance and semantic segmentation to identify diseases and pests of coffee leaves from in-field images. Comput. Electron. Agric. 2021, 186, 106191. [Google Scholar] [CrossRef]
  33. Bose, K.; Shubham, K.; Tiwari, V.; Patel, K.S. Insect image semantic segmentation and identification using unet and deeplab v3+. In ICT Infrastructure and Computing, Proceedings of the ICT4SD 2022, Goa, India, 29–30 July 2022; Springer: Singapore, 2022; pp. 703–711. [Google Scholar]
  34. Ronneberger, O.; Fischer, P.; Brox, T. U-net: Convolutional networks for biomedical image segmentation. In Proceedings of the International Conference on Medical Image Computing and Computer-Assisted Intervention, Munich, Germany, 5–9 October 2015; pp. 234–241. [Google Scholar]
  35. Janarthan, S.; Thuseethan, S.; Joseph, C.; Palanisamy, V.; Rajasegarar, S.; Yearwood, J. Efficient Attention-Lightweight Deep Learning Architecture Integration for Plant Pest Recognition. IEEE Trans. AgriFood Electron. 2025, 1–13. [Google Scholar] [CrossRef]
  36. Hu, J.; Shen, L.; Sun, G. Squeeze-and-excitation networks. In Proceedings of the IEEE Conference on Computer Vision and Pattern Recognition, Salt Lake City, UT, USA, 18–23 June 2018; pp. 7132–7141. [Google Scholar]
  37. Woo, S.; Park, J.; Lee, J.-Y.; Kweon, I.S. Cbam: Convolutional block attention module. In Proceedings of the European Conference on Computer Vision (ECCV), Munich, Germany, 8–14 September 2018; pp. 3–19. [Google Scholar]
  38. Ye, W.; Lao, J.; Liu, Y.; Chang, C.-C.; Zhang, Z.; Li, H.; Zhou, H. Pine pest detection using remote sensing satellite images combined with a multi-scale attention-UNet model. Ecol. Inform. 2022, 72, 101906. [Google Scholar] [CrossRef]
  39. Zhang, J.; Cong, S.; Zhang, G.; Ma, Y.; Zhang, Y.; Huang, J. Detecting pest-infested forest damage through multispectral satellite imagery and improved UNet++. Sensors 2022, 22, 7440. [Google Scholar] [CrossRef] [PubMed]
  40. Kang, C.; Wang, R.; Liu, Z.; Jiao, L.; Dong, S.; Zhang, L.; Du, J.; Hu, H. Mcunet: Multidimensional cognition unet for multi-class maize pest image segmentation. In Proceedings of the 2023 2nd International Conference on Robotics, Artificial Intelligence and Intelligent Control (RAIIC), Mianyang, China, 11–13 August 2023; pp. 340–346. [Google Scholar]
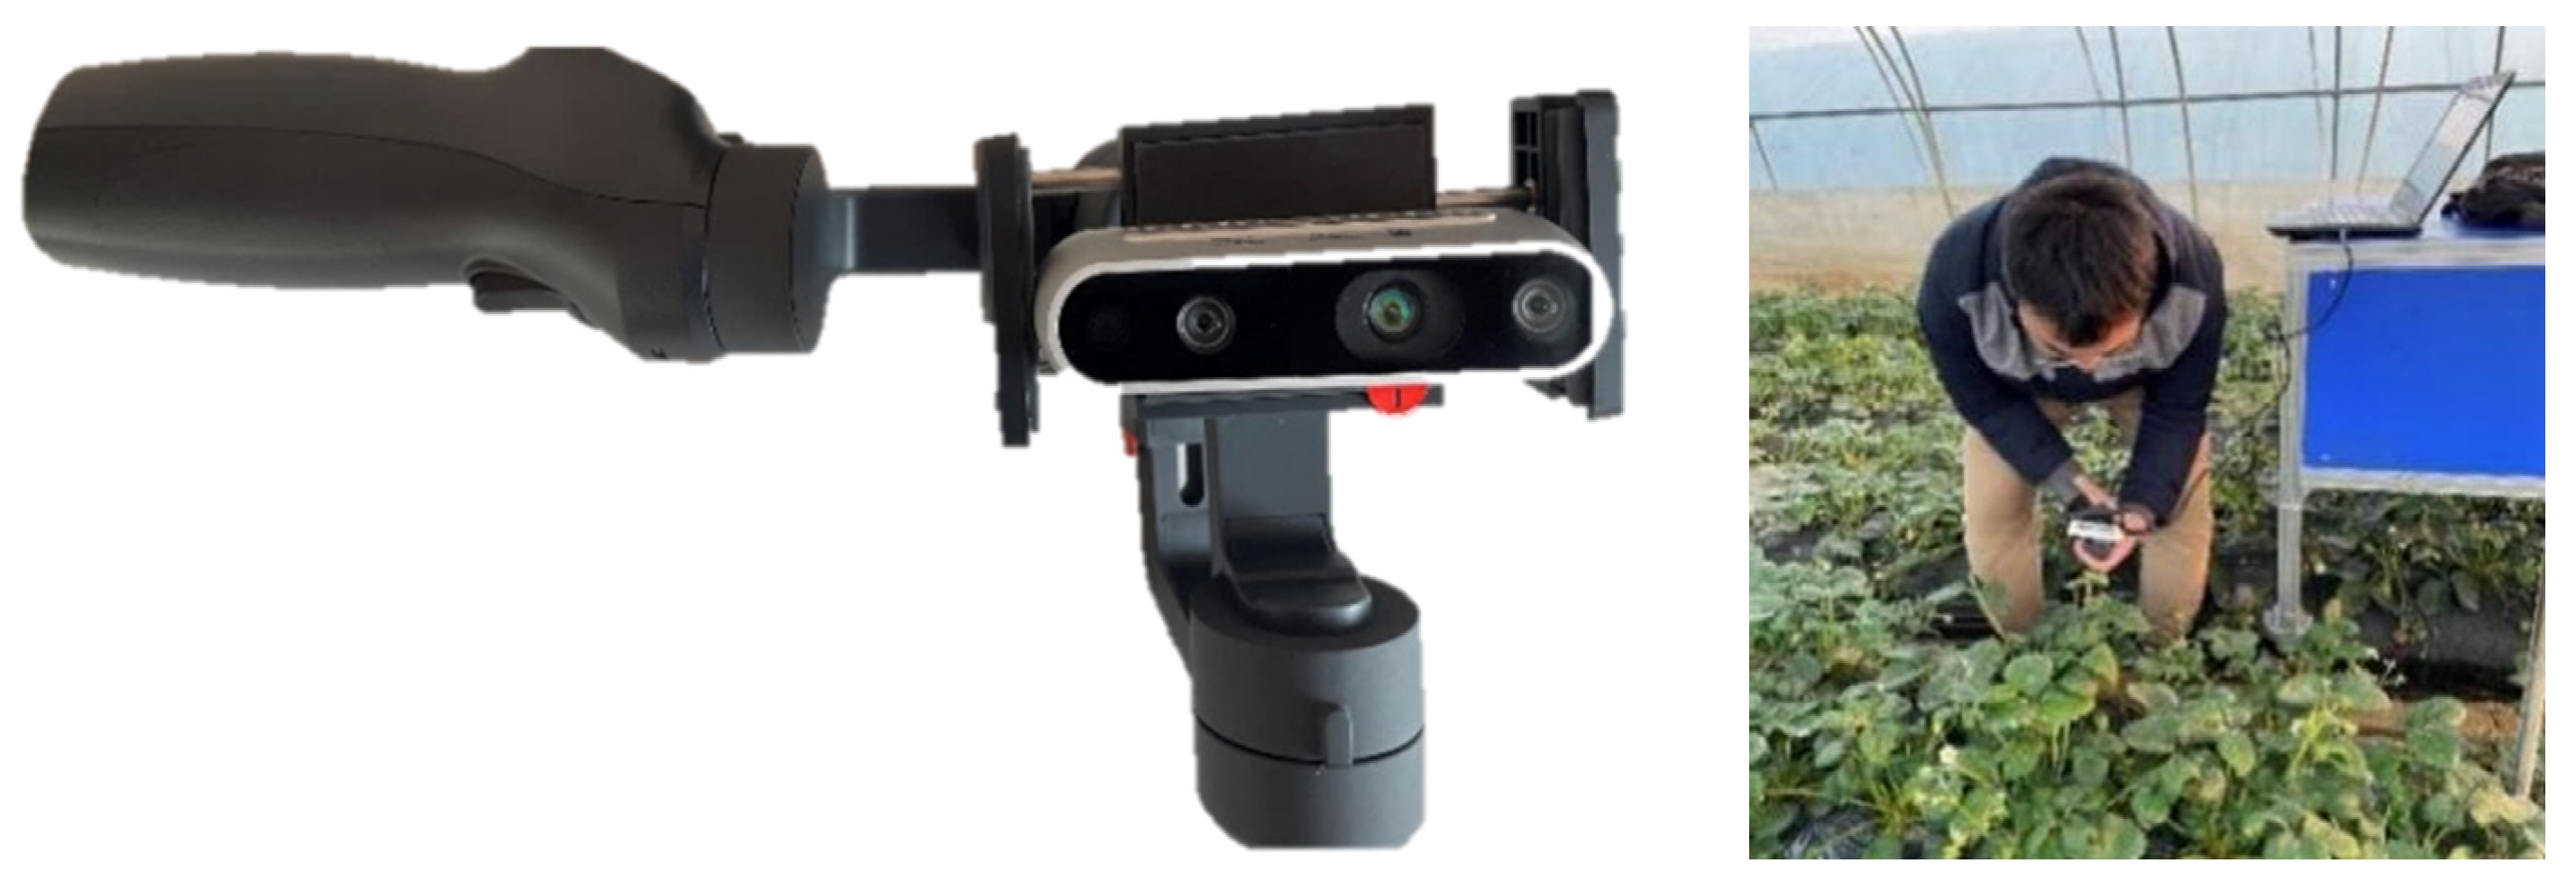
Figure 1. Pest image collection in greenhouse.
Agronomy 15 02252 g001
Figure 2. Examples of a pest sample.
Agronomy 15 02252 g002
Figure 3. Different color space conversions.
Agronomy 15 02252 g003
Figure 4. Images annotated by LabelMe.
Agronomy 15 02252 g004
Figure 5. The architecture of UNet.
Agronomy 15 02252 g005
Figure 6. Dual-attention parallel network architecture.
Agronomy 15 02252 g006
Figure 7. UNet network architecture combined with PCSA module.
Agronomy 15 02252 g007
Figure 8. Changes in the loss value in the training process of the two models.
Agronomy 15 02252 g008
Figure 9. The effect of dual attention on model segmentation results.
Agronomy 15 02252 g009
Figure 10. Visualization of pixel-wise segmentation results of different color spaces.
Agronomy 15 02252 g010
Figure 11. Recognition effects of the three models.
Agronomy 15 02252 g011
Figure 12. Recognition effect on different size images.
Agronomy 15 02252 g012
Table 1. Detailed information of the pest dataset.
TypeColor FeaturesStageTraining Testing
AphidsGreen (close to the leaves)Adult9624
ThripsBlackAdult6416
WhitefliesWhiteAdult8020
Beet armywormsGreen (close to the leaves)Larva8020
spodopetra frugiperdaBrownLarva7218
Spider mitesRedAdult8822
Total480120
Table 2. PCSA on model performance impact (RGB color space).
ModelAP (%)mAP (%)IoU
(%)
AphidsThripsWhitefliesBeet ArmywormsSpodopetra FrugiperdaSpider Mites
Original UNet83.1584.0982.7588.0388.6787.3685.6875.3
Improved UNet80.0479.3978.1283.3483.6584.0781.4479.6
Table 3. Performance of segmentation of different color space datasets.
No.Color SpaceIoU (%)Recall (%)Precision (%)
1RGB79.687.187.5
2HSV84.889.991.8
3LAB79.786.687.0
4YUV80.186.287.9
Table 4. The segmentation performance of different networks.
ModelColor SpaceIoU (%)Recall (%)Precision (%)
Improved UNetHSV84.889.991.8
FCN79.884.586.4
DeepLabv381.186.688.4
Table 5. Performance of segmentation of different attention mechanism.
No.Attention MechanismIoU (%)Recall (%)Precision (%)
1PCSA84.889.991.8
2CBAM83.188.690.5
3SENet80.385.287.1
Disclaimer/Publisher’s Note: The statements, opinions and data contained in all publications are solely those of the individual author(s) and contributor(s) and not of MDPI and/or the editor(s). MDPI and/or the editor(s) disclaim responsibility for any injury to people or property resulting from any ideas, methods, instructions or products referred to in the content.