


Abstract
The planting of inter-row cover vegetation has long been practised in Western European fruit-growing regions, yet research in this area remains limited in many countries. With the rise of organic farming, the role and selection of inter-row cover species are becoming increasingly important. Proper species selection enhances weed control and promotes biodiversity, supporting flowering plants and beneficial insects in orchards. The six-year research aimed to develop a multi-species, perennial, multifunctional inter-row cover species mixture for a dry continental climate, which is suitable for soil protection and the displacement of heat-loving, drought-tolerant, invasive weed species. There was another expectation for this native seed mixture to be able to regenerate spontaneously and to be sustainable in the orchard for a long time with minimal maintenance. Based on our results, the two multi-species mixtures (15 and 18 species) successfully reduced the cover of weed species, and their composition changed in the direction of the natural flora characteristic of the area. According to general management practices, native species could not widely appear in the control rows created by mowing the local weed flora.
1. Introduction
Standing crops are included in the ecosystem services network in the same way, often unnoticed, as natural or nature-like grasslands, groves, forests and other living communities [1]. This means that standing crops—in this case, orchards—are connected to their natural environment through the thoughtful use of perennial herbaceous species and are made part of a functional agroecosystem in the long term. It is a long process, but overall, we obtain much more at the end than just protecting the plantation’s soil from erosion or establishing nitrogen-collecting butterflies in the rows.
Soil covering or mulching is a means of physical protection against weeds, and it also has a positive effect on soil water balance, preventing erosion and deflation. A variety of organic and inorganic mulches are available. The favourable and unfavourable effects of living mulches and cover crops influence the appropriate design of the ecological environment of the plantations [2,3]. Weeds and sown species compete for the same resources, and the farmer’s task is to time and carry out the planting and care of the cover vegetation in such a way as to favour the inter-row cover species in this competition, while also taking into account the interactions between the cover plant and the main plant. In addition to occupying physical space, the phenomenon of allelopathy can also play a role in developing the relationship between cover vegetation and weeds, reducing the germination rate of weed seeds [4]. The soil’s N and organic C content in the plantations are also positively affected by the periodic, rotated weed vegetation that produces a large amount of biomass and the living mulch made mostly of butterfly-flowered species [5,6,7]. The water management of rows covered with living mulch is also improved, as the herbaceous vegetation changes the microclimate in the zone close to the ground level and helps the precipitation to infiltrate more quickly [8,9,10].
Using dead and living mulches in plantations increases the number and diversity of beneficial members of the soil fauna. After years, the plant diversity in the rows planted with species-rich mixtures increases comparably compared to the Control created by mowing from the local weed flora [11], which is explained by the fact that the seed bank of areas under agricultural cultivation for a longer period becomes impoverished and weed species become dominant [12,13]. The diversity of inter-row vegetation (sown or natural grasslands) is related to the diversity of pollinating insect species. Species-rich grasslands containing flowering dicotyledons are more frequently and stably visited by pollinating insects, which contribute to the effective pollination of the main crop [14,15]. Habitats rich in flowers are also attractive for the pollen-feeding buzz fly adults [16]. The adaptation of different pollinating insects to the types of flowers is different, so the plant species of the living mulch must be diverse in this respect.
However, in addition to the positive effects of cover crops, their use can also result in crop loss or reduced shoot growth, especially in periods of low rainfall and in farming without irrigation [2,8,17]. At the same time, erosion is also associated with a loss of yield on crop sites not covered by vegetation due to a decrease in topsoil [18,19]. Among the disadvantages, the increase in the rodent population and serious damage can also be mentioned [20].
The application of inter-row coverings in professional fruit production does not have a long history. The task of grassing is, among other things, erosion protection, increasing the organic matter content of the soil, ensuring that the rows of the plantation are passable even in rainy weather, and ensuring that mechanical work is not delayed due to soggy soil. There are several requirements for the grass species: low growth rate, good covering and renewable ability, moderate water and nutrient requirements, shade tolerance, and trampling tolerance. In addition to weeding, regular mowing of the local weed flora is an economically more favourable way to create perennial inter-row cover vegetation. With this practice, in a short time, under the right conditions, we can make a plant assemblage of mostly trampled grasses suitable for the local flora, which tolerates frequent mowing and periods of low rainfall [21,22].
The vegetation meets the goal of soil protection if it is a closed stand, the dominant species of which are grasses and bushes, and the supplementary species are papilionaceous (legume) plants and lawns, which are capable of continuous growth during the growing season. Ground cover vegetation exerts its anti-erosion effect by capturing precipitation, accelerating its infiltration, preserving soil moisture and reducing wind strength [23]. Soil that is not adequately protected can be damaged by both water and wind erosion. Wind erosion (deflation) typically causes great damage on frost-free winter days, on dry soil and in early spring, on soil not yet covered with vegetation; sandy soils are particularly affected. Damage caused by water erosion results from the leaching of soil nutrients and humus, which can be substantial. The leaching of nutrients and the degradation of the soil structure lead to yield reduction, which can reach 20–80% depending on the plant culture [24,25]. However, the total economic loss may be higher due to crop losses of more valuable crops (grape, fruit) [18].
The dominant species in the meadow vegetation are perennial grasses, composed of undergrowth and fibre grasses, with other herbaceous dicotyledonous species, such as papilionaceous plants (legumes) and weeds. In addition to perennials, there are biennial and annual species [26,27]. Papilionaceous plants (legumes) are valuable plant species of natural grasslands; they make up 3–20% of the grasslands in the plant community. Their flowering lasts for a long time, and they are also valuable species in lawns intended for mowing and pasture, which also contribute to increasing the N content of the soil. The floristic composition of meadow associations is greatly influenced by human activity. Grazing, mowing or topping can change the number or proportion of plant species in the association [28,29]. A standard method of creating inter-row covers is to induce turfing by mowing the local weed flora. Spontaneous succession can be the basis for this if the seed bank of the production site contains the propagules of the species of the original, natural grassland vegetation. If the seed bank is impoverished and dominated by weed species typical of degraded production sites, the succession process slows down or may even stop [30,31].
The location of the plantation determines the species composition and type of the original plant community, from which propagules can be brought to the area in favourable cases. The species diversity of the area can be increased by applying mowed grass and hay, moving soil or turf bricks. Spontaneous succession can be interfered with and accelerated by sowing target species [32,33]. Companion species typical of natural lawns should be sown together with grass species because the dominance of grass species and the accumulation of litter may prevent establishment later on. Litter prevents germination through allelopathic compounds and physical inhibition [34].
A wide range of species mixtures used for greening and melioration can be found in the seed distribution companies’ offerings; however, the number of mixtures specifically recommended for grape or fruit rows does not show such a positive image. The expectations regarding inter-row cover vegetation are multifaceted. The species used should be low-growing, should not use up the soil’s nutrient and water resources to a large extent, should be attractive to the natural enemies of pests, but should not be harmful to the pests, should flower preferably throughout the season, tolerate partial shading, cover at least 60–70 per cent of the soil. Tolerate trampling, be able to regenerate, and improve the soil structure. Their main flowering should preferably not coincide with the flowering time of the main crop so as not to distract flower-visiting insects, especially honey bees, from the fruit trees [11,35].
Our research aimed to investigate and develop a multi-species, perennial inter-row cover species mixture. Selection of mixing species that reflect the species composition of the original plant community of the area so that the species spectrum changes in the direction characteristic of the natural growing area under extensive conditions. It was important that the flowering time of the species should not be parallel to the flowering of the main crop and that it should provide a potential source of food for wild pollinators and other beneficial insects for a long time. We wanted to pay special attention to the fact that the plant species used to protect the soil of the row spacing with their covering throughout the year, that with proper treatment, they can suppress aggressive weeds. Above all, the perennials can spontaneously regenerate and survive in the row spacing for a long time.
2. Materials and Methods
In the experimental area, the first results were obtained in 2016 after the sowings, the species of the summer aspect and their cover percentage were determined. Prior to this, in June 2015, the inter-row areas were mowed with a low stubble (5 cm), in line with the practice of the Experimental Farm, which caused a severe reduction of fast-growing annual species in the area and damage to the already developing biennial and perennial plants. There was no soil preparation in the control line, and the area was undisturbed. In the 6 years following the mixture sowing, the recruitments were carried out in the following spectra: 2016—summer, autumn spectra, 2019—summer, autumn spectra, 2021—spring, and autumn spectra. The results for this year are presented in the analyses so that the baseline and the change can be visualised.
2.1. The Experimental Area
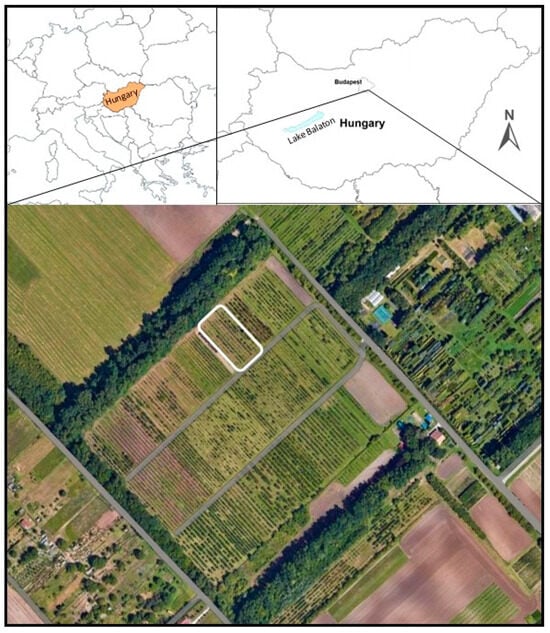
The experimental area is located outside Budapest (Soroksár) in Hungary, GPS coordinates 47.3977; 19.1410. In the Northwest–Southeast oriented research area, the apple plantation was planted 12 years ago in a 3.6 × 1.0 m space, in a 1 × 4, randomised arrangement. There are 12 rows in the area, each of which is 72 m long (Figure 1). A total of 12 plots (row spacing) were created during the experiment’s setup. For each mixture, 4 replicates were used in a random arrangement—the size of the plots was 2.6 × 6.0 m (15.6 m2).
Figure 1.
Location of the experimental area Soroksár, Budapest (47°3977′ N; 19°1410′ E).
The main parameters of the soil of the experimental area are shown in Table 1.
Table 1.
Some of the physical-chemical soil characteristics of the Arenosol at the experimental site.
The experimental period’s climatic conditions (mean temperature and total precipitation) were determined from the data of the meteorological station in the study area (Table 2).
Table 2.
The weather (climatic) conditions of the research area throughout the study period.
Before sowing, the soil was prepared by discing and harrowing. The seed mixtures were sown by hand in the pre-designated plots, then they were worked shallowly into the soil, and the soil surface was closed with a grass roller. The inter-row cover vegetation was mowed once a year depending on the ripening of the perennial mixed species and weeding.
2.2. Experimental Arrangement
The experimental period took place between 2016 and 2019. During this time, biannual phenological surveys of the sown cover crops were conducted in alignment with the cultivation technology of the apple orchard. The extensive treatment concluded in 2019, with no treatment applied to the area in 2020. In 2021, we assessed the status of the abandoned treatments.
To test the selected apple hybrids in the field designated for the experiment, seedlings were planted on M9 rootstock. The apple hybrids were arranged in 12 rows on the board. Each row is 72 m long and contains 73 apple trees. The experimental plots were bordered by 6 trees on each side, totalling 12 trees. The treatments were arranged in four repetitions within each row, resulting in 12 plots per row. The plots sown with the inter-row seed mixture are 15.6 m2. The tree and row spacing correspond to the standards used in apple orchards planted on M9 rootstock under operational conditions. The soil conditions and topological characteristics showed no significant differences between the plots. Figure 1 (photo) illustrates the area’s homogeneity and location, while Table 1 presents the main soil properties characterising the area. The treatments used during the experiment are listed in Table 3.
Table 3.
Some of the physical-chemical soil characteristics of the Arenosol at the experimental site.
The composition of the seed mixtures used in the experimental setups is shown in Table 4.
Table 4.
(a) The composition of the Wildflower mix 1. (2015) seed mix. (b) The composition of the Wildflower mix 2. (2016) seed mix. (c) The composition of the Ecovin mix (2015–2016) seed mix. (d) The composition of the Grass–cover mix (2015–2016) seed mix.
The grass species found in the Grass–clover mix (Festuca rubra L., Lolium perenne L.) are among the most commonly used grass species in fruit orchards in our country. Lolium perenne typically has a high proportion in various grass seed mixtures, allowing it to become dominant in the inter-row cover quickly. However, the density of Lolium perenne begins to decrease after a few years, following its rapid growth and coverage, while Festuca rubra, developing more slowly but with a longer lifespan, can achieve greater coverage over time. We selected the grass species in the Wildflower 1 and Wildflower 2 mixtures based on their ecological requirements, aiming for species most similar to those native to the local flora. To this end, we relied on floristic source materials. The availability of the grass species’ seeds in commerce also influenced our selection. Since the goal of developing these mixtures is practical application, we had to forgo using certain species that could not be sourced in larger quantities. Lolium perenne was excluded from the Wildflower mix because we aimed to ensure that none of the grass species would be distinctly dominant over the others.
2.3. Evaluation of Experimental Mixtures
Plant coenological recordings were made using a 100 × 100 cm measuring frame. During the surveys, we determined the species of plants found on 1 square meter [36,37] and their coverage percentage. Visual estimation (semiquantitative method) was used to determine the dominance values [38]. During several visits to the area, we observed the beginning and length of the flowering phenophase of the main dicotyledonous mixture constituents. The planned time interval of the surveys was aimed at surveying the species in the spring, summer, and autumn aspects.
As the elements of the species list were created as a result of the recordings, we determined the types of social behaviour, their life form, their taxonomic place (family), their flowering time and their average height [36]. The data obtained by XlStat 4.2.2019 were analysed using statistical software (IBM SPSS Statistics 22).
2.4. Data Analysing
Data were analysed using the IBM SPSS Statistics 22 software package. The statistical methods applied included one-way ANOVA to assess the differences between groups, followed by Tukey’s HSD (Honestly Significant Difference) post hoc tests for pairwise comparisons. The analyses were conducted at a 95% confidence level, ensuring that the probability of incorrectly rejecting the null hypothesis (Type I error) was limited to 5%. The assumptions of normality and homogeneity of variances were tested prior to the ANOVA. In cases where assumptions were violated, appropriate transformations or non-parametric alternatives were considered. Results were interpreted with caution, accounting for both statistical significance (p-value < 0.05) and practical significance.
3. Results
During the experimental period, 96 grassland species were identified at the species level, distributed across 27 families. Plant species whose phenological phase at the time of recording did not allow for identification at the species level were labelled with genus and ‘sp.’ notation (e.g., Anthemis sp., Bromus sp., Poaceae, Potentilla sp.). The list of species identified over the five-year experiment is provided in Appendix A.
The distribution of plant life forms is diverse. Based on the classification of plant species found in the experimental area according to their social behaviour types, species characteristic of natural habitats are present, though in smaller numbers (14 species). However, consistent with the agricultural use of the area, species typical of disturbed, secondary, and artificial habitats appear in greater numbers. Among these, six species belong to the group of aggressive, non-native invasive species, while nine species are classified as ruderal competitors. Additionally, a significant number of natural weed species are also present.
Characterisation of the Inter-Row Cover Crop Plant Community
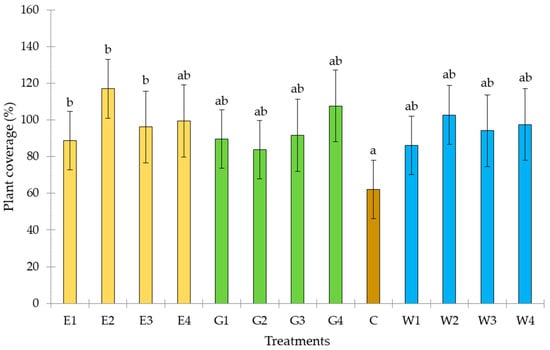
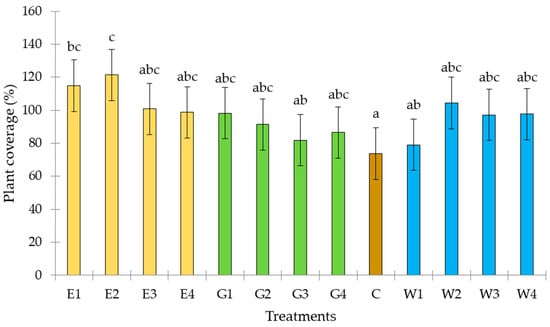
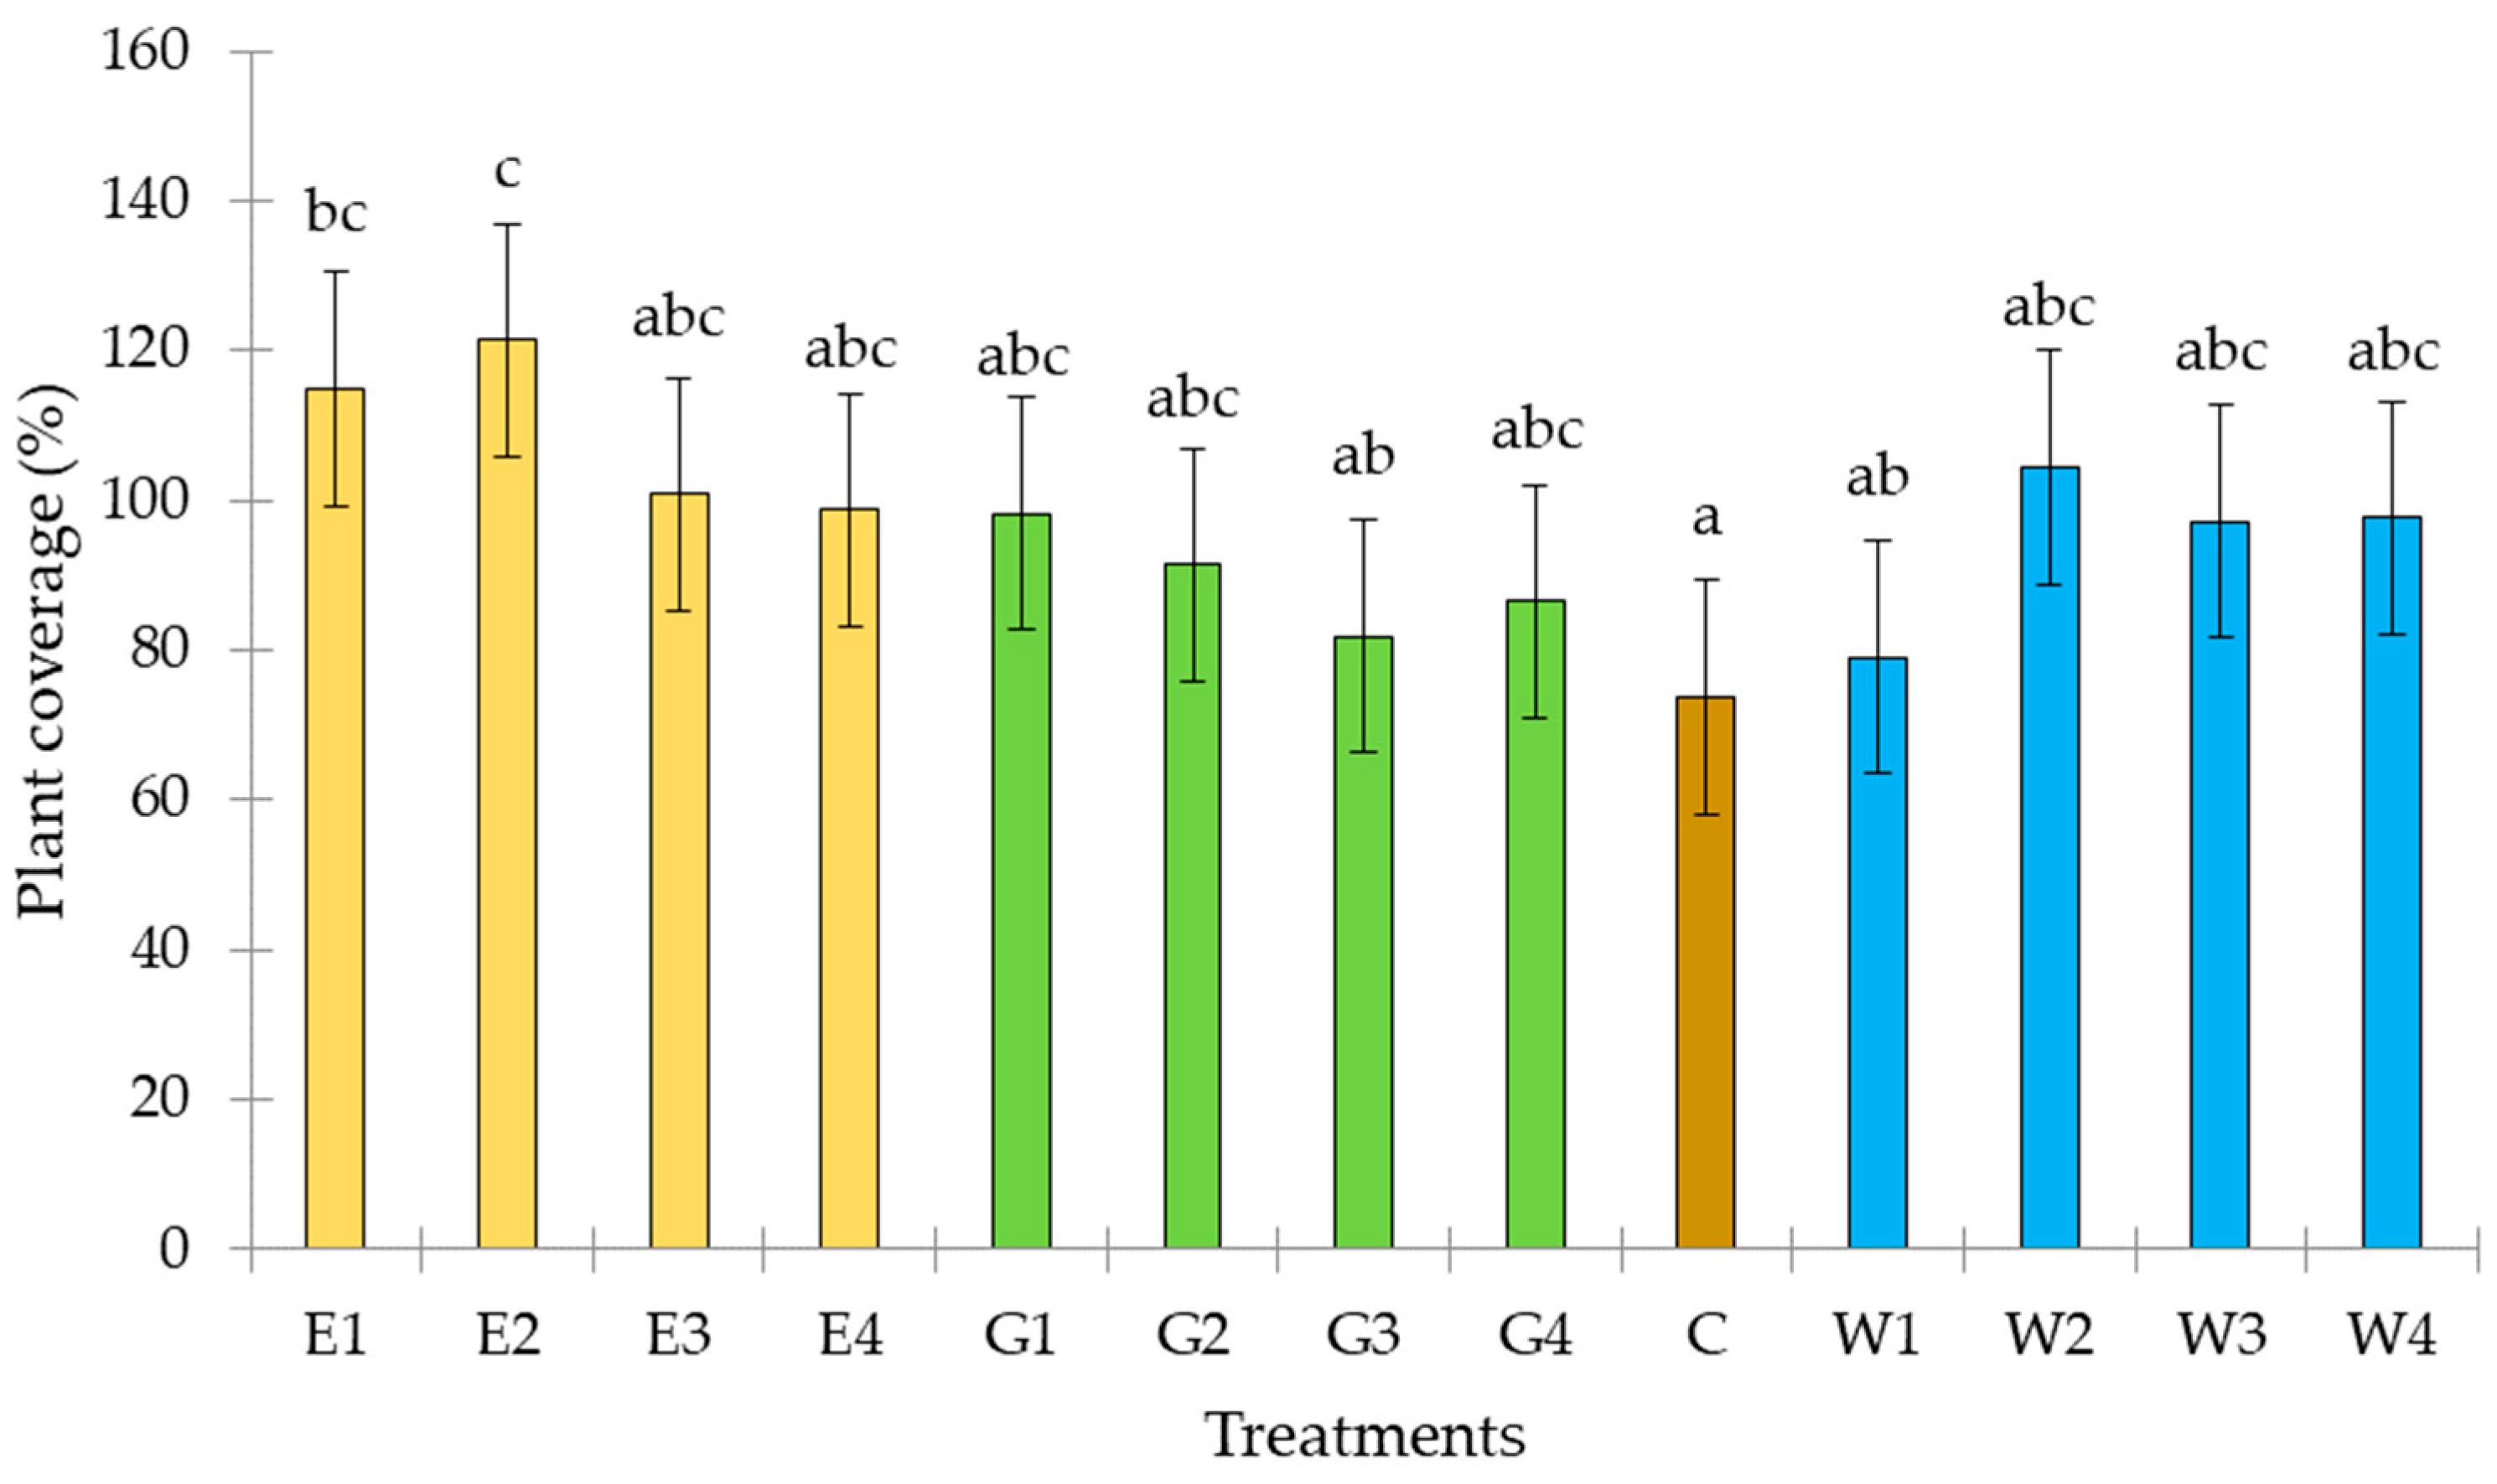
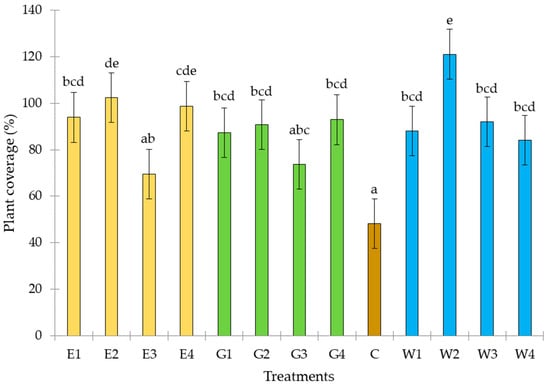
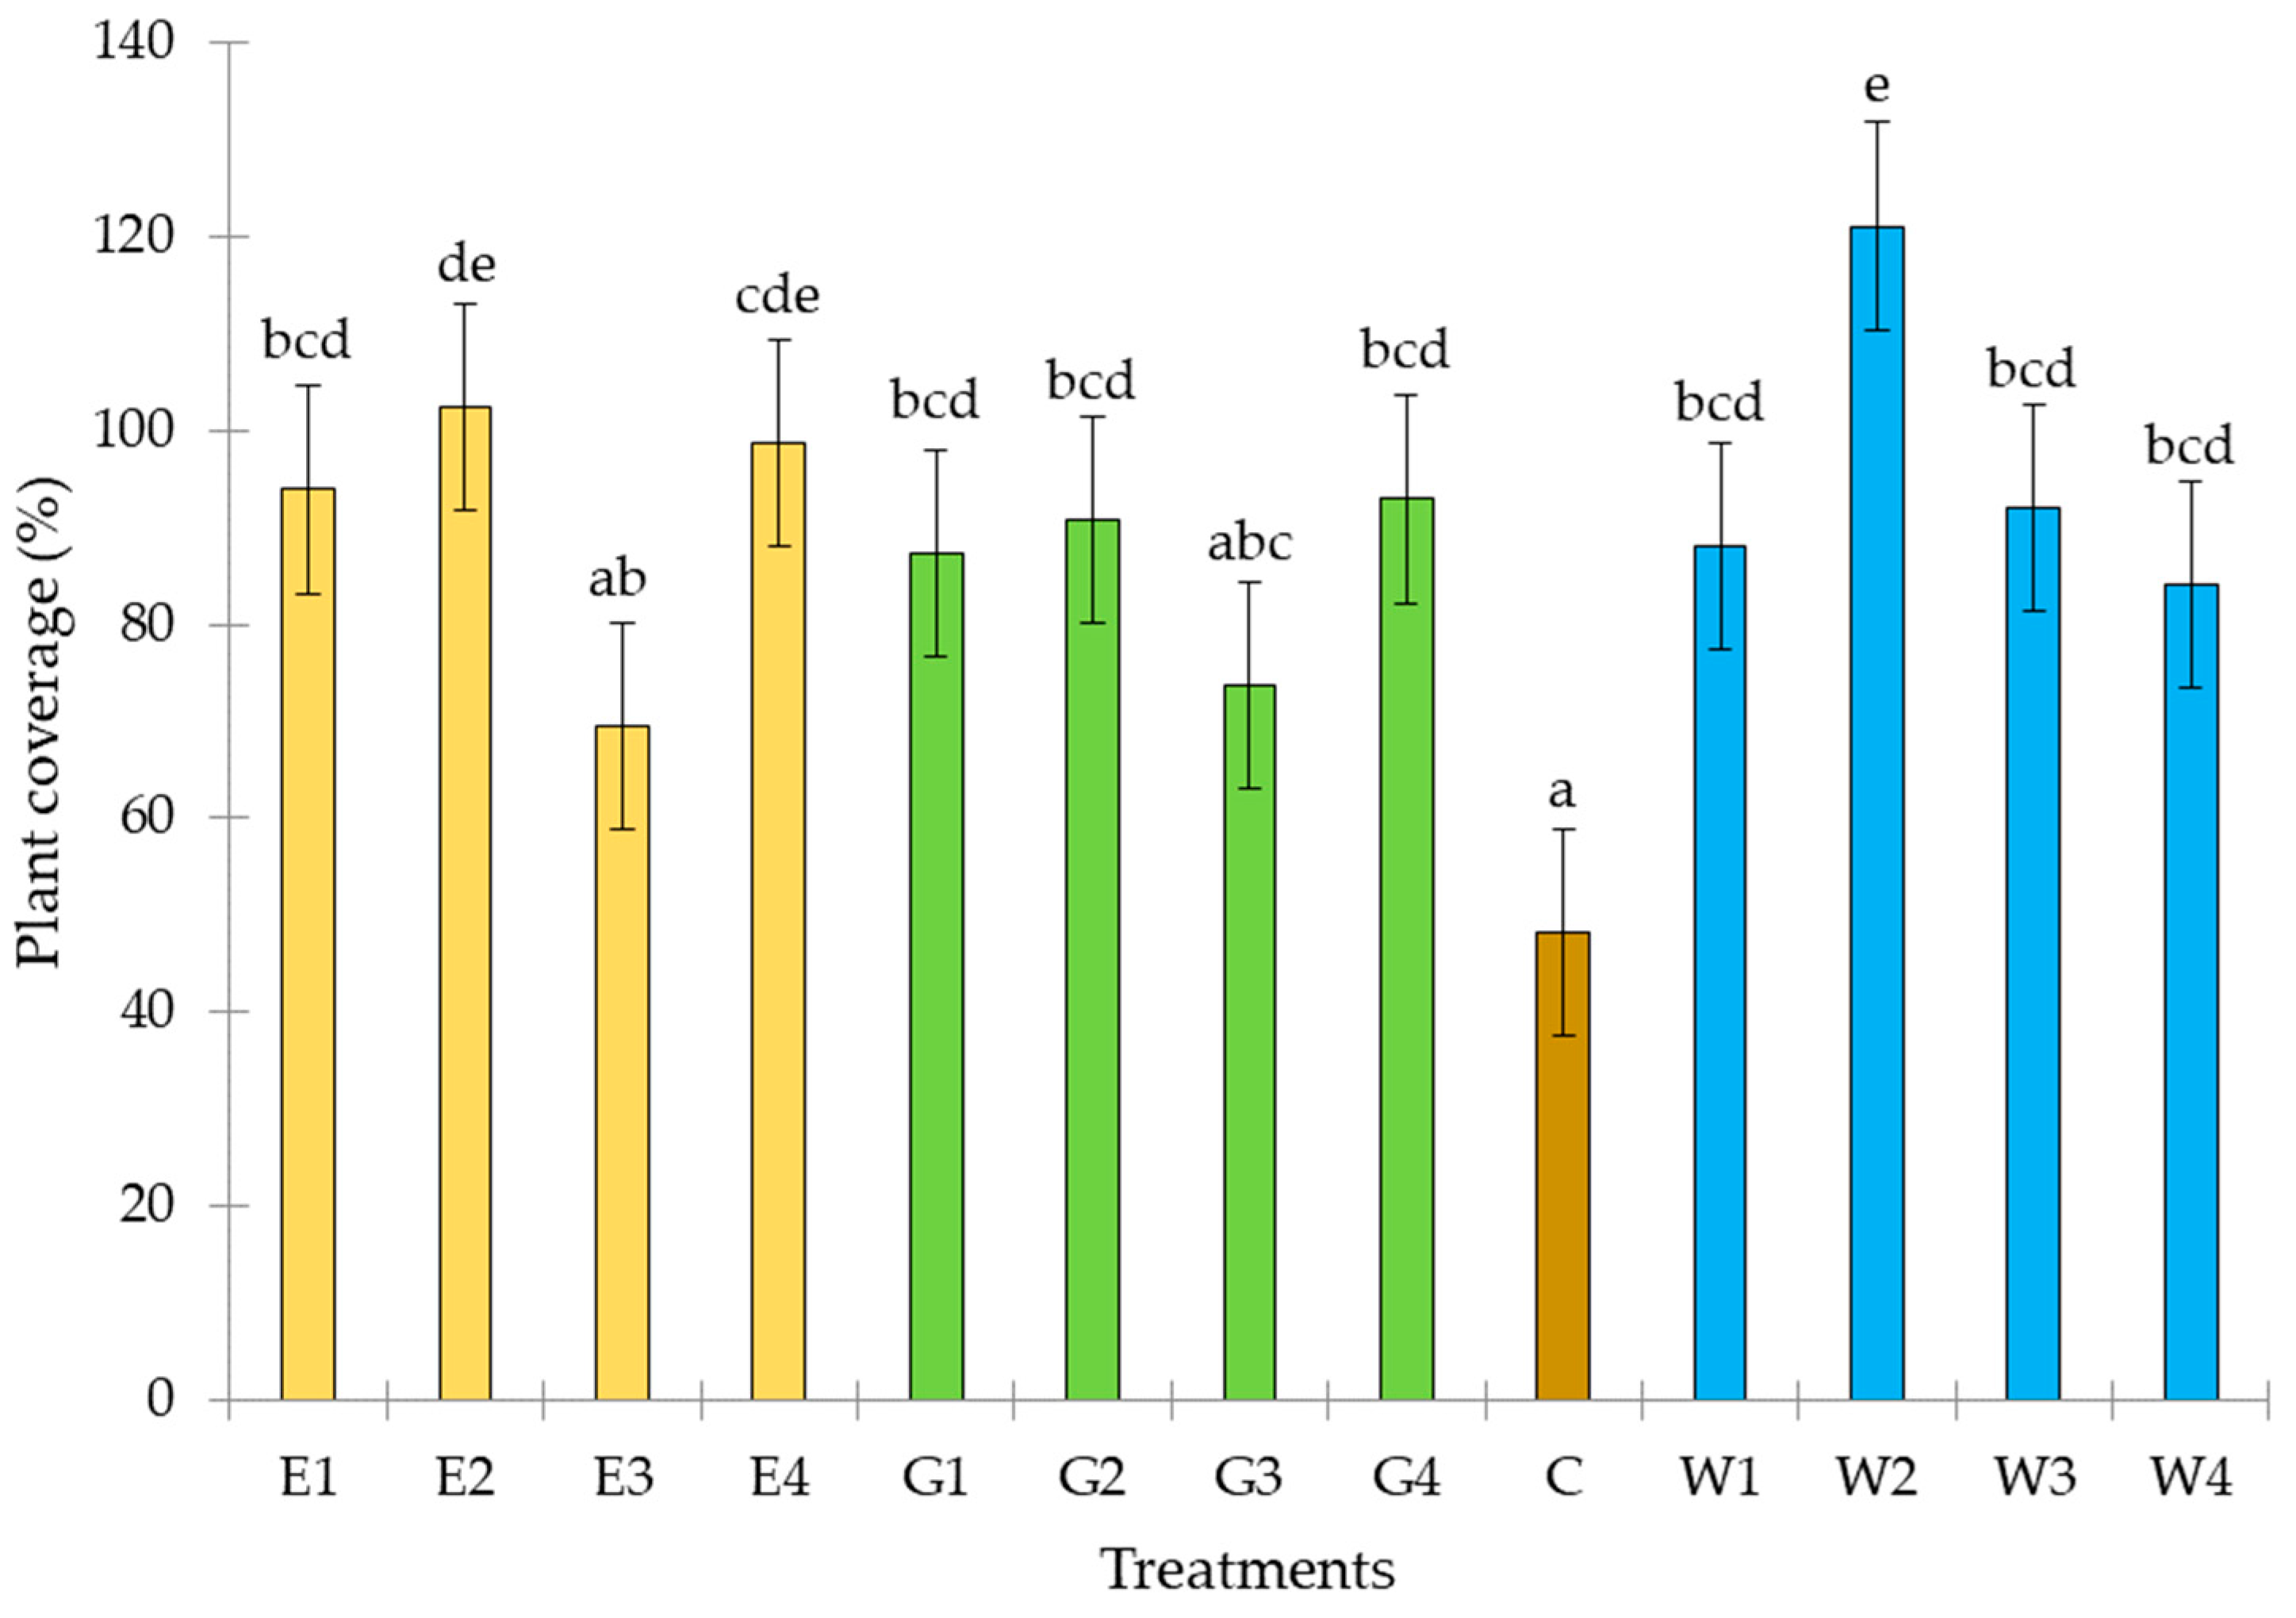
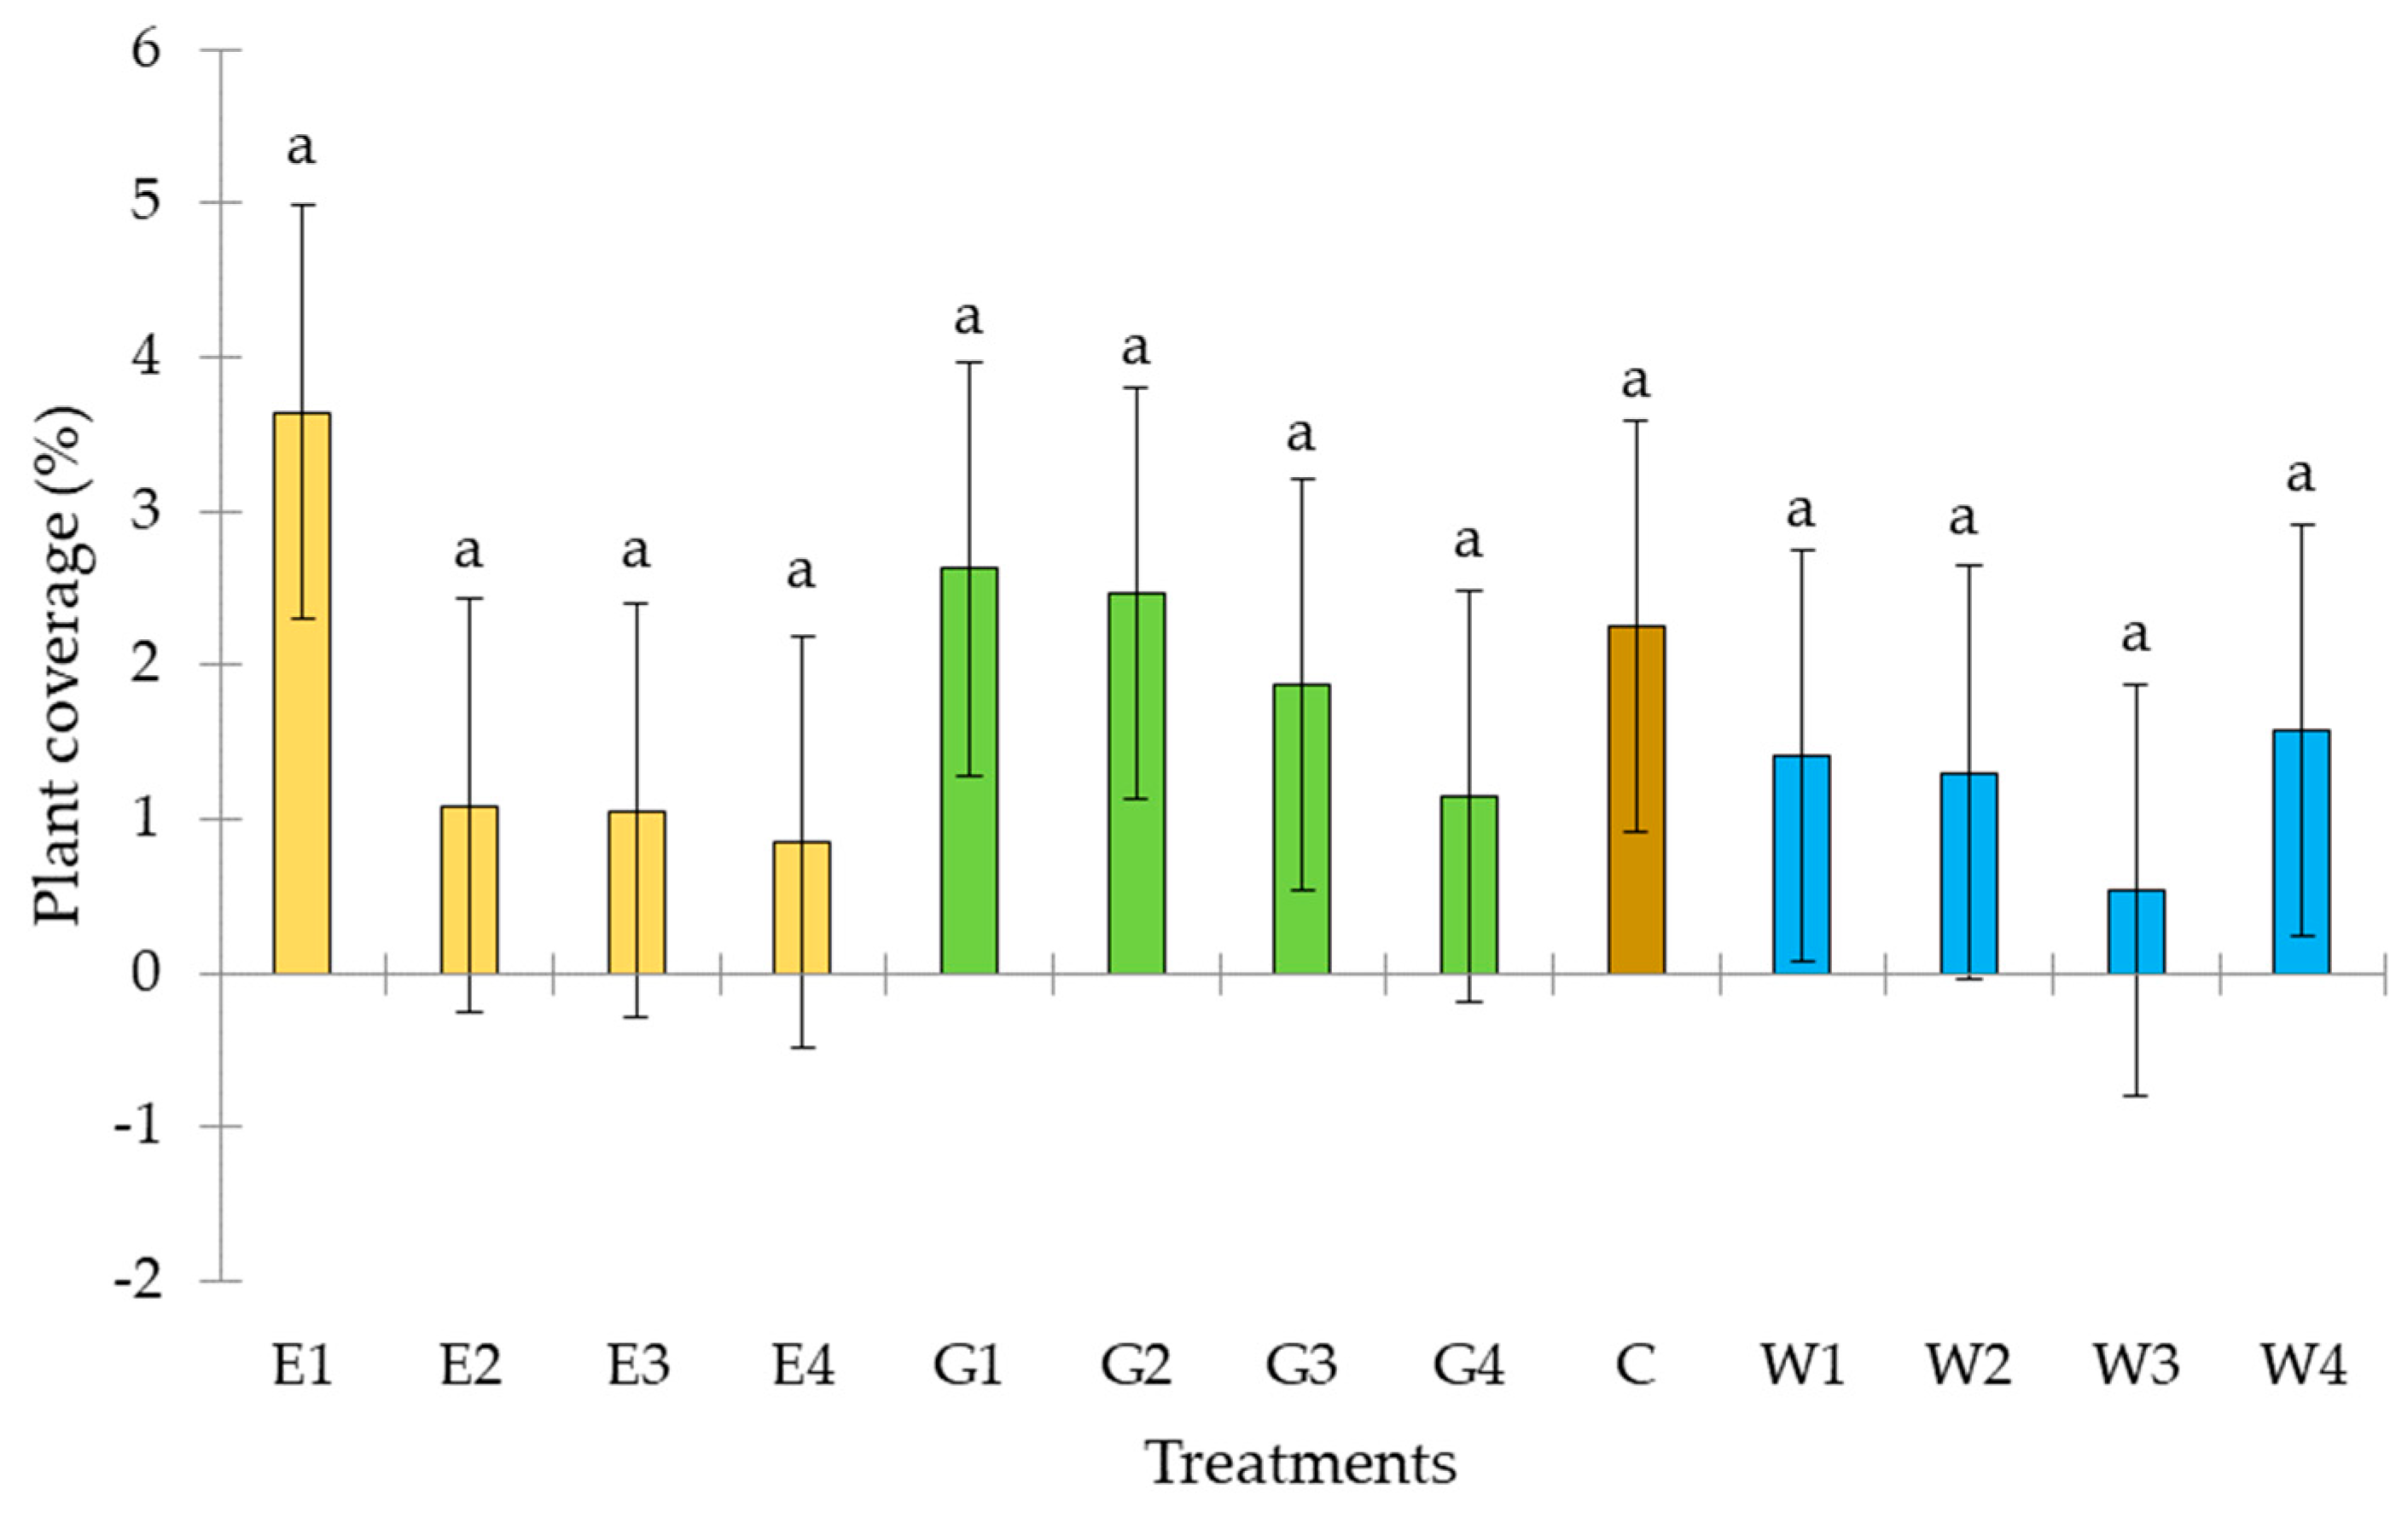
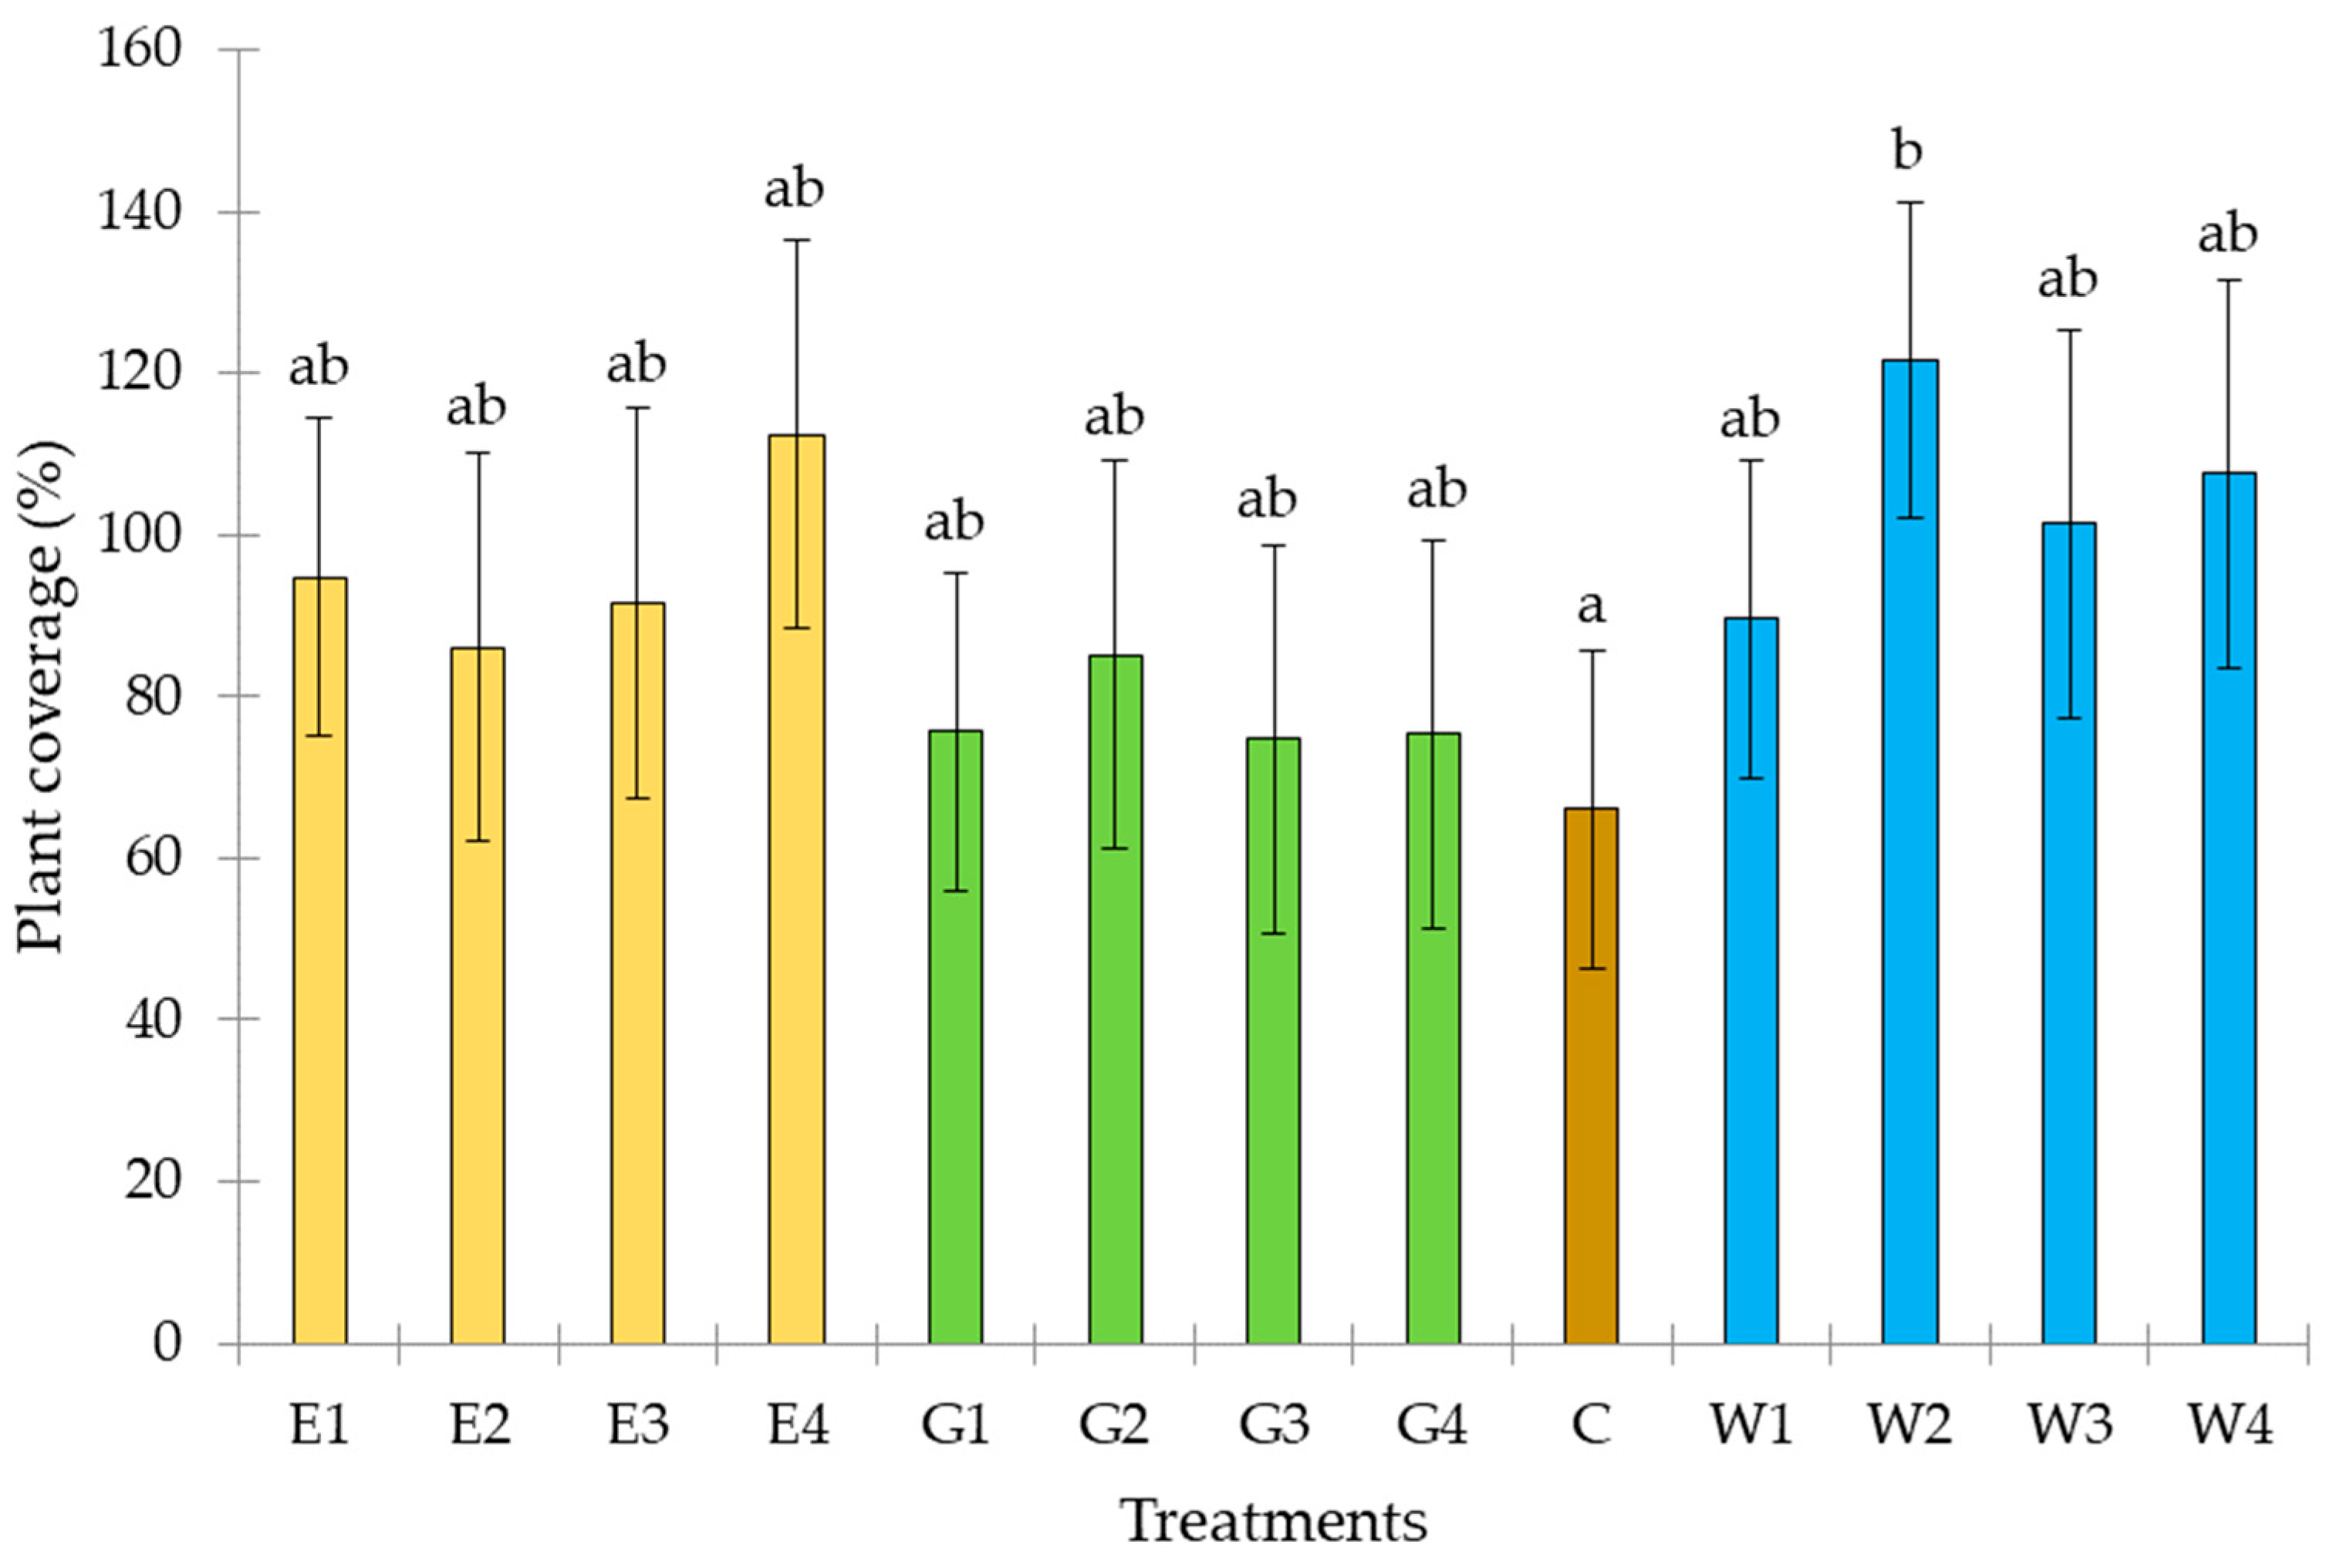
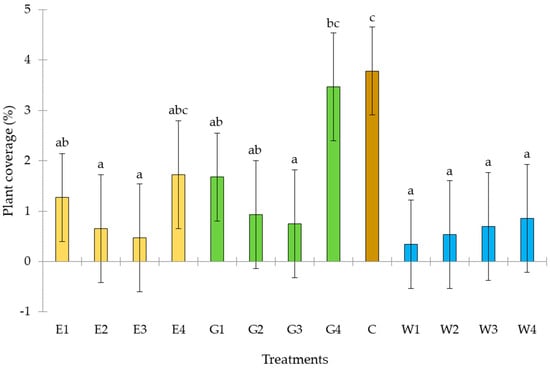
The Ecovin mixtures were sown in 2015 with seed rates of 5000 and 10,000 seeds/m2 (E1, E2), the Grass–clover mixture was sown in 2016 with a seed rate of 10,000 seeds/m2 (G4), and the Wildflower mixture sown in 2015 with a seed rate of 10,000 seeds/m2 (W2) showed statistically significant differences compared to the Control inter-rows. However, for the other mixtures, no statistically significant differences were found (Figure 2).
Figure 2.
Results of the Tukey test for comparing the mean total coverage of plots in 2016. C—Control; E—Ecovin mixes; G—Grass–clover mixes; W—Wildflower mixes. Average of 4 samples per treatment; letters indicate the significant difference between treatments within the same survey time.
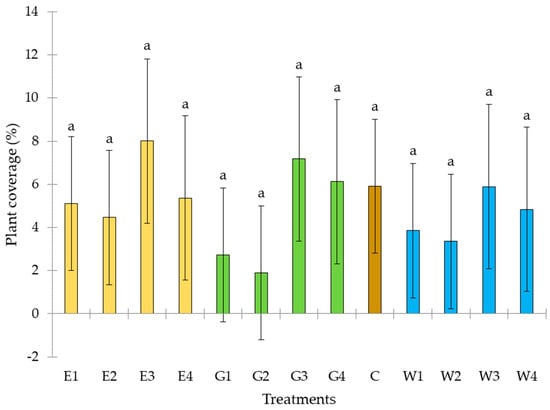
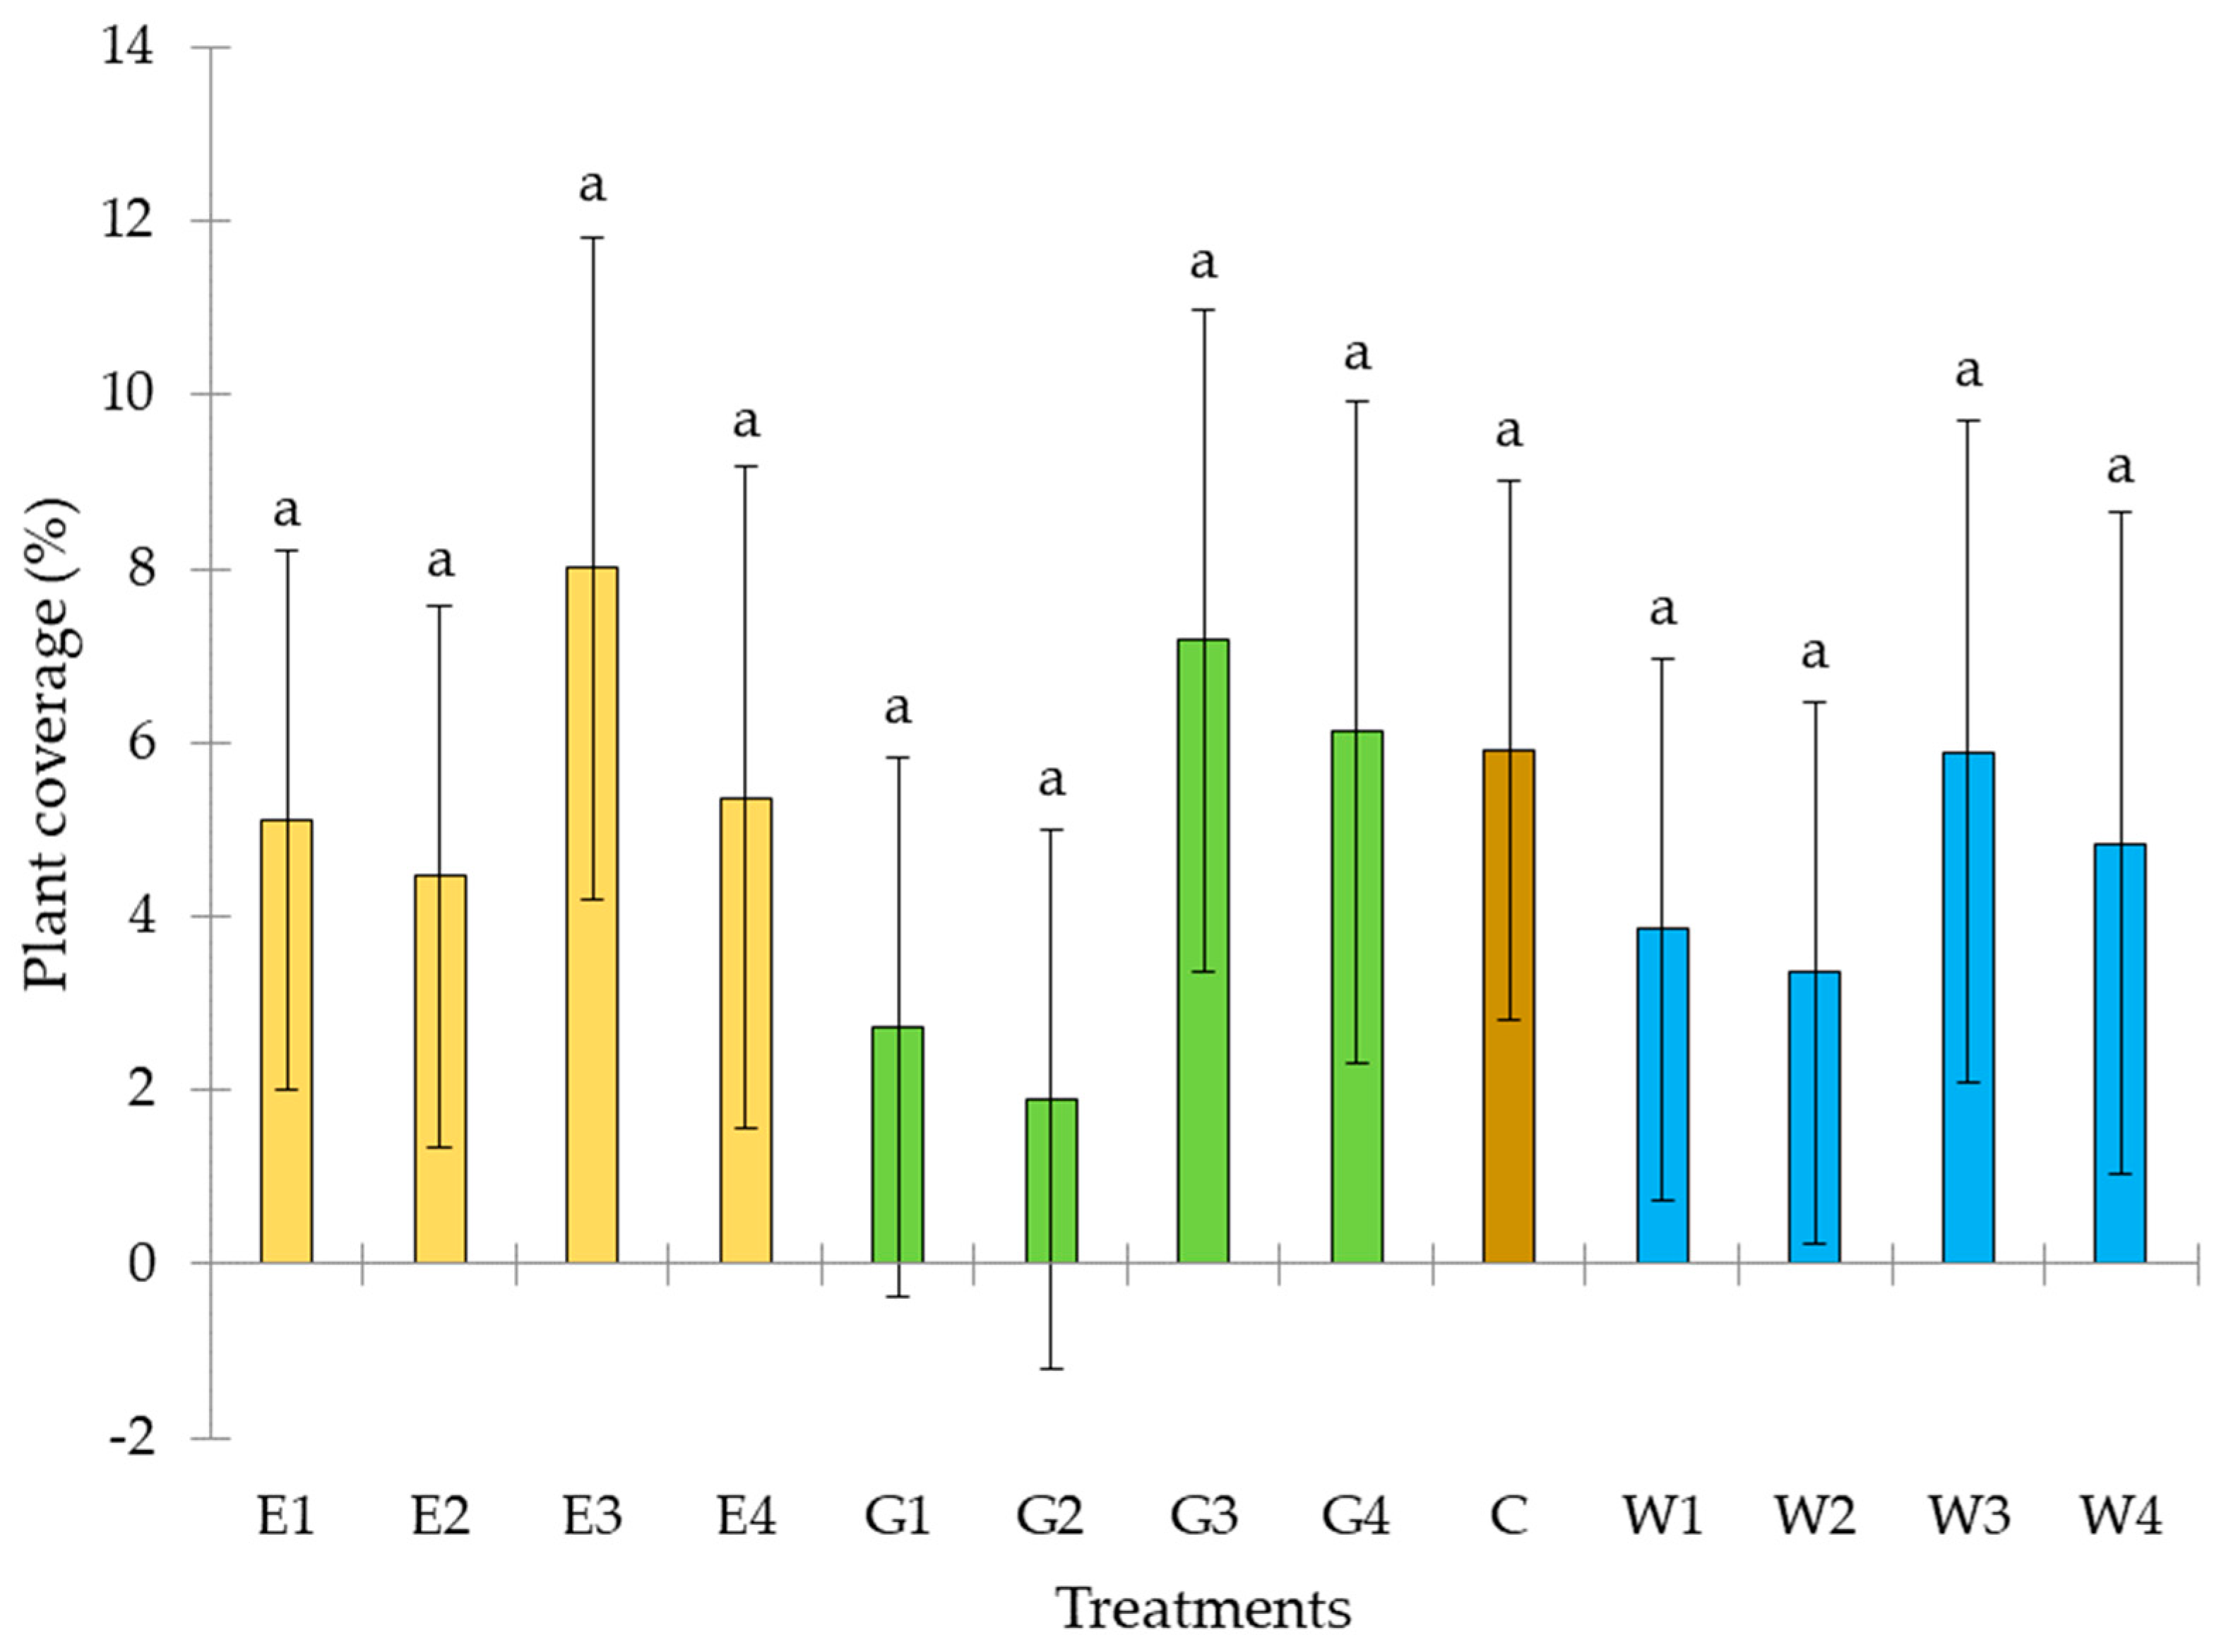
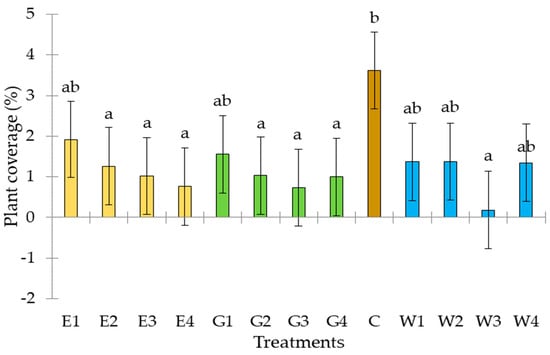
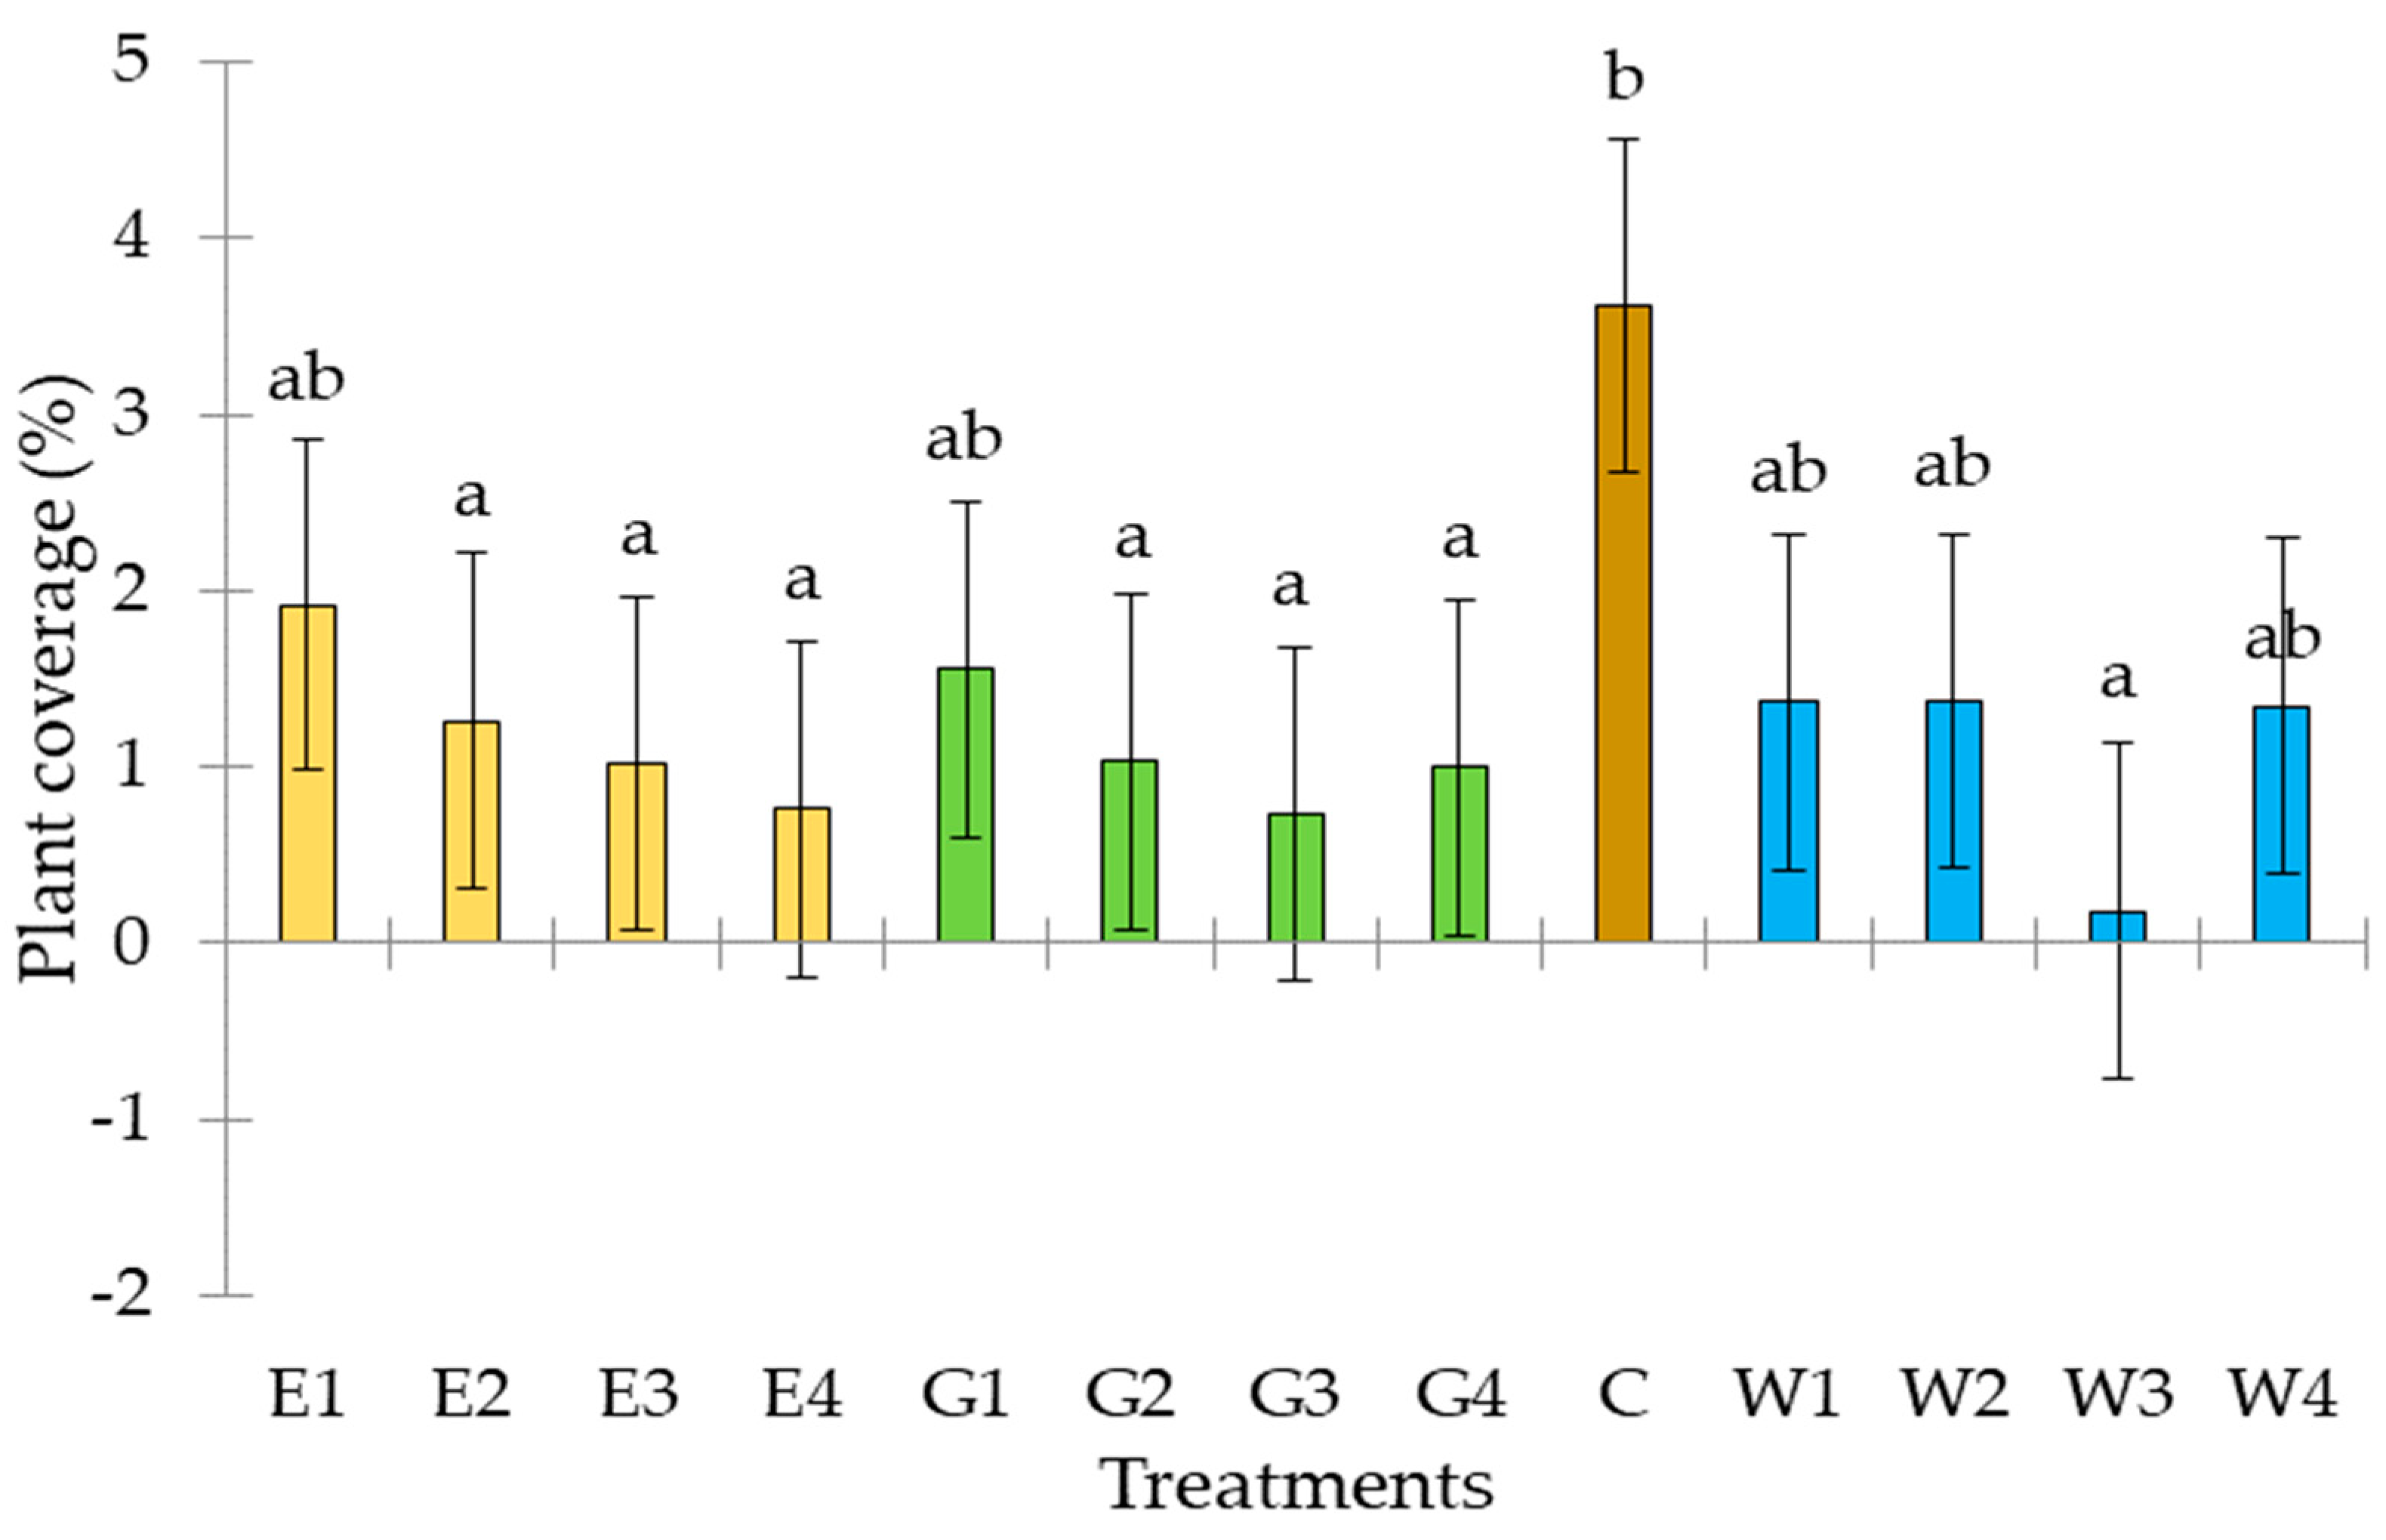
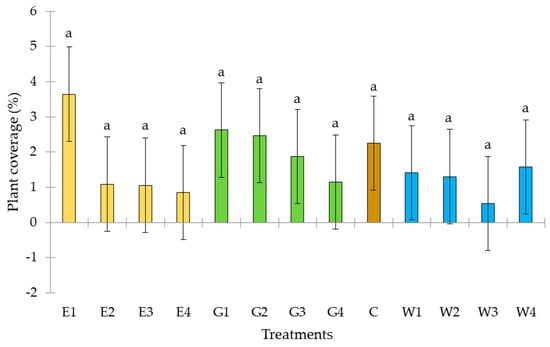
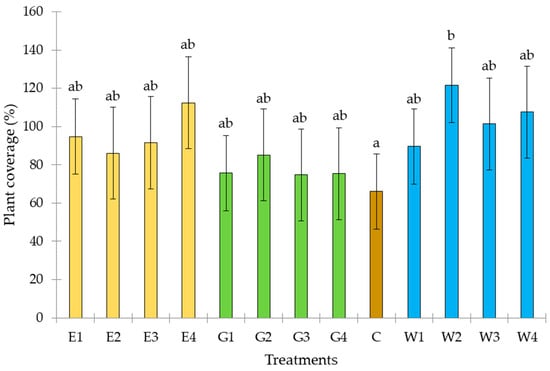
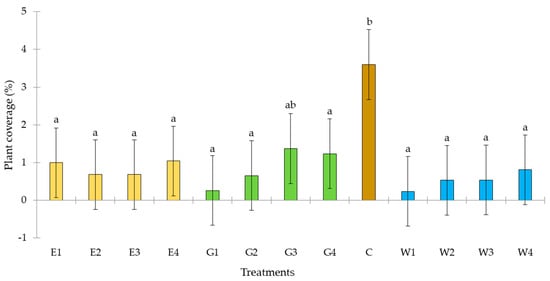
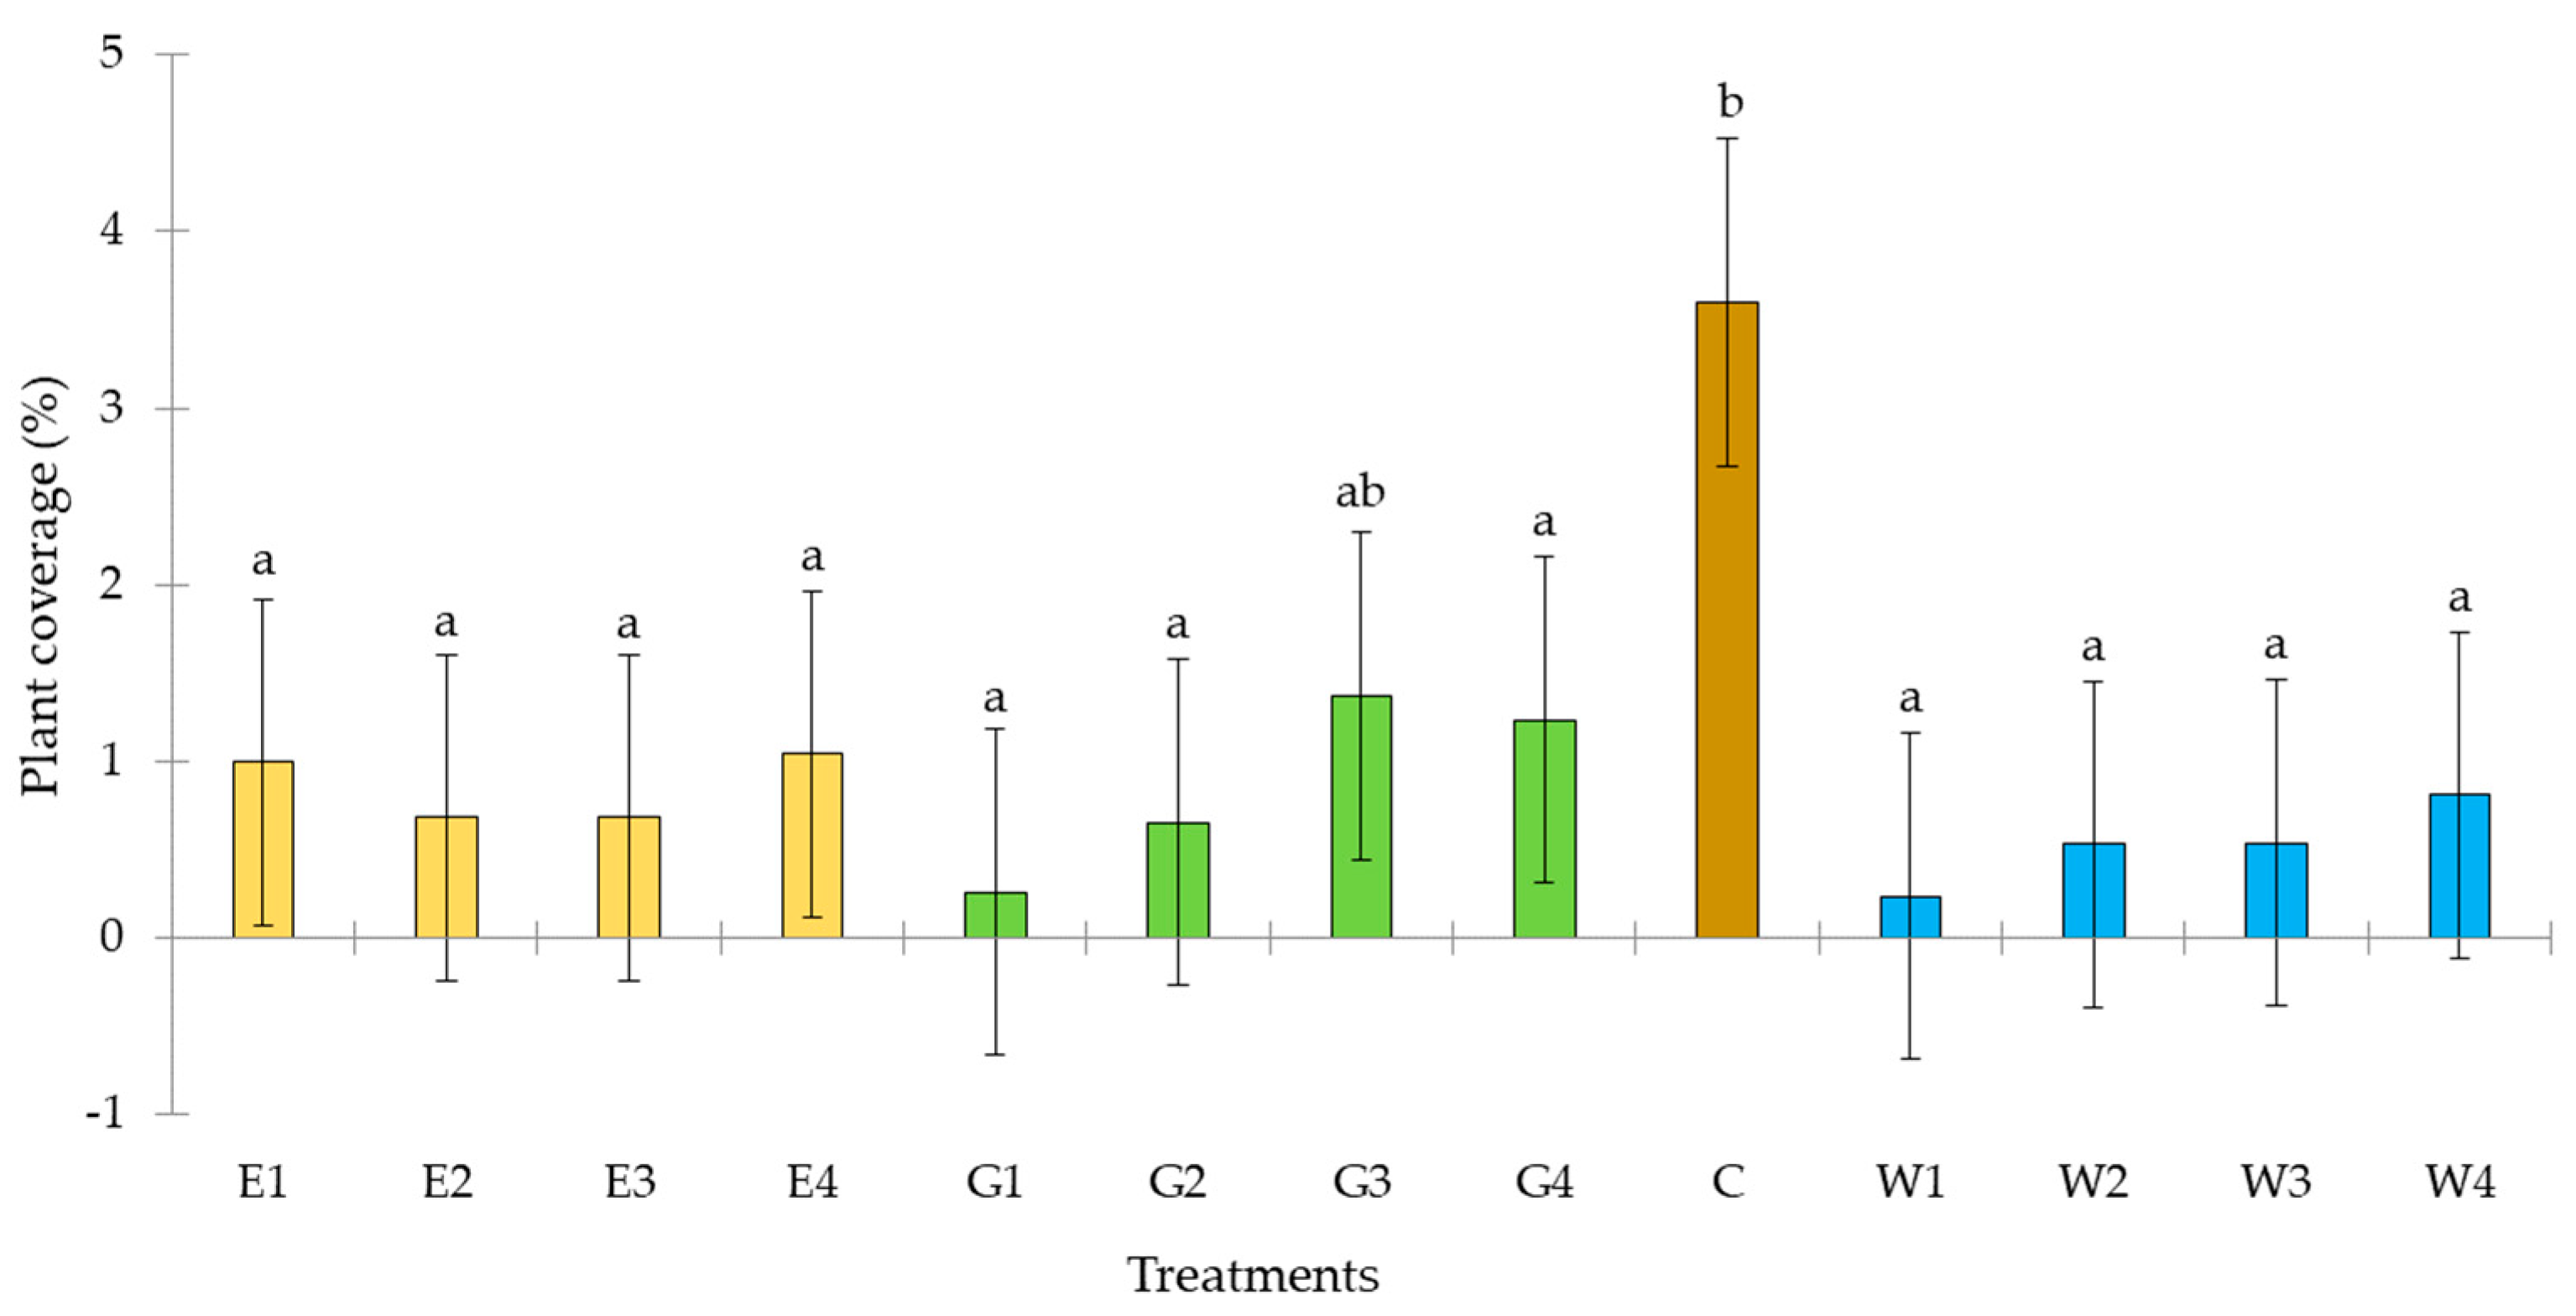
Examining hazardous weed species in 2016, one-way analysis of variance (ANOVA) and the Tukey test (p ≤ 0.95) revealed no significant differences in coverage values between treatments (Figure 3). Notably, the perennial Conyza canadensis (L.) Cronqu. exhibited high coverage in the E1, E2 (over 20%), W1, W2 (14–17%), and Control plots (30%), while the annual Echinochloa crus-galli (L.) P.B. showed substantial coverage in the E3, E4 (45–36%), G3, G4 (33–36%), and W3, W4 (30–32%) plots (Figure 3).
Figure 3.
Coverage of hazardous perennial and annual weed species in 2016. C—Control; E—Ecovin mixes; G—Grass–clover mixes; W—Wildflower mixes. Average of four samples per treatment; letters indicate the significant difference between treatments within the same survey time.
Examining the hazardous weed species in 2016, one-way analysis of variance (ANOVA) and the Tukey test (p ≤ 0.95) showed no significant differences in coverage values between treatments (Figure 3). The perennial Conyza canadensis (L.) Cronqu. Exhibited notably high coverage in E1, E2 (over 20%), W1, W2 (14–17%), and Control plots (30%). Meanwhile, the annual Echinochloa crus-galli (L.) P.B. showed substantial coverage in E3, E4 (45–36%), G3, G4 (33–36%), and W3, W4 (30–32%) plots.
A significant difference can be demonstrated between the mixtures, specifically between the Control and the E1 and E2 mixtures. The total coverage of both Ecovin mixtures sown in 2015 significantly exceeds that of the Control. Similarly, the average total coverage of the E1 and E2 mixtures is significantly higher than that of the F3 and V1 mixtures (Figure 4).
Figure 4.
Results of the Tukey test for comparing the mean total coverage of plots in 2017. C—Control; E—Ecovin mixes; G—Grass–clover mixes; W—Wildflower mixes. Average of four samples per treatment; letters indicate the significant difference between treatments within the same survey time.
Based on the statistical analysis of the coverage values of perennial and annual invasive weed species, a significant difference is evident between the control and the E2, E3, E4, F2, F3, F4, and V3 mixtures (Figure 5). Compared to these mixtures, the coverage of invasive weeds was significantly higher in the control plots.
Figure 5.
Coverage of hazardous perennial and annual weed species in 2017. C—Control; E—Ecovin mixes; G—Grass–clover mixes; W—Wildflower mixes. Average of four samples per treatment; letters indicate the significant difference between treatments within the same survey time.
The statistical analysis of average total coverage (Figure 6) demonstrates that most treatments differ significantly from the Control, achieving higher total coverage in the 2018 survey compared to the average total coverage of the control plots.
Figure 6.
Results of the Tukey test for comparing the mean total coverage of plots in 2018. C—Control; E—Ecovin mixes; G—Grass–clover mixes; W—Wildflower mixes. Average of four samples per treatment; letters indicate the significant difference between treatments within the same survey time.
The statistical analysis of the coverage of perennial and annual invasive weed species did not reveal any significant differences among the treatments (Figure 7). Based on the statistical analysis of the average total coverage of plant species recorded in 2019 (Figure 8), the W2 treatment (sown in 2015, with a seed rate of 10,000 seeds/m2) showed a significantly higher coverage value compared to the Control. For the other treatments, the statistical tests did not reveal significant differences. The dominant species in the W2 mixture were Festuca rubra L. (32%) and Medicago lupulina L. (26%).
Figure 7.
Coverage of hazardous perennial and annual weed species in 2018. C—Control; E—Ecovin mixes; G—Grass–clover mixes; W—Wildflower mixes. Average of four samples per treatment; letters indicate the significant difference between treatments within the same survey time.
Figure 8.
Results of the Tukey test for comparing the mean total coverage of plots in 2019. C—Control; E—Ecovin mixes; G—Grass–clover mixes; W—Wildflower mixes. Average of four samples per treatment; letters indicate the significant difference between treatments within the same survey time.
The statistical analysis of the coverage values for perennial and annual hazardous weed species (Figure 9) demonstrated significant differences between the Control and the F1–F4 and V2 treatments. The Control plots had significantly higher coverage of hazardous weed species compared to the E1, E2, E3, and F1, F2, F3, and V1, V2, V3, and V4 treatments. The dominant weed species in the Control plots was Stenactis annua (L.) Pers., with an average coverage of 15–20%.
Figure 9.
Coverage of hazardous perennial and annual weed species in 2019. C—Control; E—Ecovin mixes; G—Grass–clover mixes; W—Wildflower mixes. Average of four samples per treatment; letters indicate the significant difference between treatments within the same survey time.
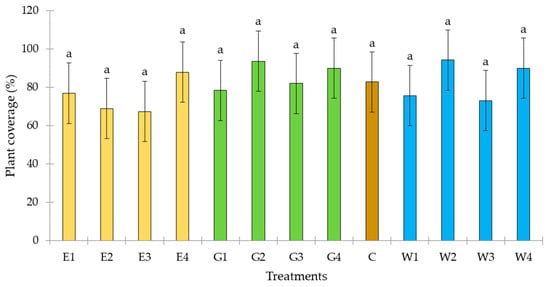
Based on the analysis of the data from the spring and autumn aspects of 2021 using one-way analysis of variance (ANOVA) and Tukey’s HSD test (at a significance level of p ≤ 0.95), no significant differences were found in the average total coverage of mixture components and local flora elements between the treatments and the Control (Figure 10). The statistical analysis of the average total coverage of mixture components and local flora elements did not show significant differences between the treatments for any parameter.
Figure 10.
Results of the Tukey test for comparing the mean total coverage of plots in 2021. C—Control; E—Ecovin mixes; G—Grass–clover mixes; W—Wildflower mixes. Average of four samples per treatment; letters indicate the significant difference between treatments within the same survey time.
The statistical analysis of the coverage values for perennial and annual hazardous weeds (Figure 11) demonstrated significant differences when comparing the Control with the Ecovin mixtures, Wildflower mixtures, and G1, G2, and G4 mixtures. However, no significant differences were found in the total coverage of hazardous weeds between the Ecovin, Grass–clover, and Wildflower mixtures.
Figure 11.
Coverage of hazardous perennial and annual weed species in 2021. C—Control; E—Ecovin mixes; G—Grass–clover mixes; W—Wildflower mixes. Average of four samples per treatment; letters indicate the significant difference between treatments within the same survey time.
4. Discussion
4.1. Average Coverages
The species found in the mixtures predominantly consist of those from disturbed, artificial, and secondary habitats. When further subdivided based on Social Behaviour Types (SBT) values, the experimental area contains aggressive, non-native invasive species (SBT-3), ruderal competitors (SBT-2), naturalised alien species (SBT-1), natural weed species (SBT-1), and disturbance-tolerant native plant species (SBT 2) [39,40]. From the perspective of mixture evaluation, not all species indicative of artificial habitats are considered negative. Disturbance-tolerant native species and natural weed species are part of the indigenous flora [39,41]. Naturalised alien species are generally part of the mixture components, with the exception of Sorghum halepense (L.) Pers. (Johnsongrass). The average number of species characteristic of natural habitats is low per mixture, with three mixture component species (Anthyllis vulneraria L. subsp. vulneraria—E1, E2, E3, W1, W2, W3, W4; Bromus inermis Leiss.—V2; Festuca rubra L.—G1, G2, F3, G4, W1, W2, W3, W4) and two local flora elements (Arenaria serpyllifolia L.—Control; Potentilla arenaria Borkh.—W2) belonging to this category in the studied area. The dominant species in the E1 and E2 mixtures is Onobrychis viciifolia Scop., with an average coverage ranging from 30–53%. The higher value observed in the E1 mixture is induced by the average coverage of Stenactis annua (L.) Pers., which exceeds 20%. Among the invasive weeds, Ambrosia artemisiifolia L. exhibited an average coverage below 1%, while Conyza canadensis (L.) Cronq. had coverage below 2% within the mixtures and in the Control plots in the case of ragweed. Echinochloa crus-galli (L.) P.B. was found exclusively in the E1 treatment, with an average coverage value of 0.125. Stenactis annua (L.) Pers. appeared in all treatments, showing the highest average values in the E1 (10%) and Control (7.75%) plots. The dominant weed species in the Control plots was the common dandelion (Taraxacum officinale Weber et Wiggers), with an average coverage of 15.6%.
In 2016, the statistical analysis of average coverages among treatments revealed significant differences. The Control had significantly lower coverage compared to the treatments. Among the Ecovin mixtures, the 2015 single-seed-rate E2 treatment (5000 seeds/m2) achieved the highest coverage (117%). Among the Grass–clover mixtures, the 2016 double-seed-rate G4 treatment (10,000 seeds/m2) recorded the highest coverage (107.6%). For the Wildflower mixtures, the 2015 W2 treatment had the highest coverage (102.7%). The Control had an average coverage of 62%. In 2019, the analysis of average coverages showed significant differences between the Control and the Wildflower 2 (W2) treatment. The average coverage of the W2 treatment was nearly twice that of the Control (121.6% vs. 66%). In 2021, no significant differences were found among average coverage values. Three treatments (W2, W4, G2) had average coverages exceeding 90%. The highest coverage was recorded in the null Control (98%), while the lowest was observed in the E3 treatment (67.4%). Tyll [42] and Zhao [43] established that effective erosion control requires a suitable composition of vegetation—comprising a mix of rhizomatous and tufted grasses and legumes—and adequate coverage. According to Bručienė [44] and Restuccia [45], inter-row cover crops should cover the soil by at least 60–70% throughout the year. Restuccia [45] and Medrano [46] noted that extensive cover vegetation derived from natural weed flora does not guarantee uniform coverage. In line with this, and supported by our measurements, Peltzer [47] found that natural weed vegetation in fallow cultivated inter-rows could achieve coverage of about 30–50%. Reviewing the average coverages over five years, we observe that the Control, which is composed of local weed flora, exceeded 70% coverage in two years but had the lowest coverage in four of the studied years. Only in 2021 did it surpass 80%, yet it still represents the median value among the treatments. In 2018, the coverage fell short of the expected 60%.
4.2. Naturalness and Changes in Species Composition
By monitoring species composition changes across treatments and categorising them by social behaviour types, we can conclude the stability, naturalness, regenerative capacity, and disturbance levels of the plant community [39,48]. When planning for long-term species-rich cover vegetation, stability and resilience become critical factors. The proportion of species characteristic of natural habitats exhibited a continuous positive trend from 2016 to 2019, with the Wildflower mixtures demonstrating the highest initial values. However, in 2021, this trend reversed in some instances, showing a negative shift.
Effective vegetation management is essential for maintaining the persistence of valuable species, as highlighted by [32,49]. Due to extensive farming practices, by 2021, the coverage values of seed mixtures declined compared to earlier years. As a result, the Grass–clover mixtures (F) exhibited significantly higher levels of monocotyledonous and dicotyledonous weeds than the Control, representing natural habitats. Appropriate timing and frequency of mowing and mulching are crucial to ensuring the stability and species richness of grassland communities [34,48].
The negative trends observed in 2021 are tempered by many of the species identified in the disturbed and artificial habitats belonging to disturbance-tolerant natural species and natural weed species. Disturbance-tolerant natural species are often associated with secondary succession and, in some cases, are components of the seed mixtures. Initially, these species were generalists from natural dry grasslands. On the other hand, natural weed species have been present in disturbed, anthropogenic habitats for centuries [39].
5. Conclusions
From the year of sowing (2015) until 2021, species composition and coverage values of various treatments were monitored. Observations indicated that all three seed mixtures effectively controlled weeds, consistently outperforming the Control, which relied on a mown inter-row cover of local weed flora. Although delivering new grass species into the extensive micro-ecological system did not yield a substantial difference in coverage and weed control over time, inter-row cover cropping in fruit orchards on coarse sandy soils has demonstrated multiple ecological benefits. Additionally, this practice offers significant economic advantages. For example, dense plant coverage effectively suppresses weeds and enhances soil health, contributing to biodiversity. However, long-term success requires careful species selection, site-specific adaptation, and consistent management practices, such as mowing and mulching. The most common inter-row cover in fruit orchards remains the local weed flora, maintained through regular mowing or incorporation. Occasionally, species-poor grass mixes and green cover plants are also used. Still, our study demonstrated that living mulch with selected species can persist and renew on dry, sandy soils just as effectively as weed-based cover. Living mulch, however, offers a more prosperous species composition and a more resilient plant community from the outset. Like preserving species-rich meadows and pastures, herbaceous flora in organic orchards can be significantly enhanced through seed mixes optimised for the specific site, as opposed to relying on local weeds alone. Since fruit orchards are often located on long-cultivated soils where the seed bank no longer contains seeds of local natural vegetation, mowing the weed flora does not support natural succession. This finding was confirmed by surveying vegetation in the control inter-rows, where local flora lacked diversity. Orchards sown with site-specific, species-rich mixes play a critical role in soil protection and provide substantial environmental benefits beyond those achieved by traditionally managed orchards.
Author Contributions
Conceptualisation, B.F. and M.Z.S.; validation, M.Z.S.; writing—original draft preparation, review and editing, B.F., T.K. and Z.K.; data curation, A.G.; formal analysis, Z.K. and T.K. All authors have read and agreed to the published version of the manuscript.
Funding
This study was funded by the Hungarian University of Agriculture and Life Sciences Research Excellence Program 2024 Grant number MATE-K/1011-30/2024 (T.K.) and MATE-K/1011-32/2024 (Z.K.).
Data Availability Statement
The original contributions presented in the study are included in the article; further inquiries can be directed to the corresponding author.
Conflicts of Interest
The authors declare no conflicts of interest.
Appendix A
Table A1.
Social behaviour type, life form, and taxonomic position of the identified species (2016–2021).
References
- Varga, C.; Fekete, I.; Piskolczi, M.; Dorka, D.; Helmeczi, B. The Effect of Different Mulching Materials on Quantitative Changes of Microbes in the Soil of an Integrated Apple Plantation. Sci. Bull. Ser. C Fascicle Mech. Tribol. Mach. Manuf. Technol. 2007, 21, 725. [Google Scholar]
- Médiène, S.; Valantin-Morison, M.; Sarthou, J.-P.; de Tourdonnet, S.; Gosme, M.; Bertrand, M.; Roger-Estrade, J.; Aubertot, J.-N.; Rusch, A.; Motisi, N.; et al. Agroecosystem Management and Biotic Interactions: A Review. Agron. Sust. Developm. 2011, 31, 491–514. [Google Scholar] [CrossRef] [Scilit]
- Markó, V.; Jenser, G.; Kondorosy, E.; Ábrahám, L.; Balázs, K. Flowers for Better Pest Control? The Effects of Apple Orchard Ground Cover Management on Green Apple Aphids (Aphis Spp.) (Hemiptera: Aphididae), Their Predators and the Canopy Insect Community. Biocontrol Sci. Technol. 2013, 23, 126–145. [Google Scholar] [CrossRef] [Scilit]
- Mia, M.J.; Furmanczyk, E.M.; Golian, J.; Kwiatkowska, J.; Malusá, E.; Neri, D. Living Mulch with Selected Herbs for Soil Management in Organic Apple Orchards. Horticulturae 2021, 7, 59. [Google Scholar] [CrossRef] [Scilit]
- Sanchez, J.E.; Edson, C.E.; Bird, G.W.; Whalon, M.E.; Willson, T.C.; Harwood, R.R.; Kizilkaya, K.; Nugent, J.E.; Klein, W.; Middleton, A. Orchard Floor and Nitrogen Management Influences Soil and Water Quality and Tart Cherry Yields. J. Am. Soc. Hortic. Sci. 2003, 128, 277–284. [Google Scholar] [CrossRef] [Scilit]
- Granatstein, D.; Kirby, E.; Davenport, J. Direct Seeding Legumes into Orchard Alleys for Nitrogen Production. In Proceedings of the II International Organic Fruit Symposium 1001, Leavenworth, WA, USA, 19–21 June 2012; pp. 329–334. [Google Scholar]
- Mia, M.J.; Monaci, E.; Murri, G.; Massetani, F.; Facchi, J.; Neri, D. Soil Nitrogen and Weed Biodiversity: An Assessment under Two Orchard Floor Management Practices in a Nitrogen Vulnerable Zone in Italy. Horticulturae 2020, 6, 96. [Google Scholar] [CrossRef] [Scilit]
- Krohn, N.G.; Ferree, D.C. Effects of Low-Growing Perennial Ornamental Ground Covers on the Growth and Fruiting of ‘Seyval Blanc’ grapevines. HortScience 2005, 40, 561–568. [Google Scholar] [CrossRef] [Scilit]
- Granatstein, D.; Mullinix, K. Mulching Options for Northwest Organic and Conventional Orchards. HortScience 2008, 43, 45–50. [Google Scholar] [CrossRef] [Scilit]
- Atucha, A.; Merwin, I.A.; Brown, M.G. Long-Term Effects of Four Groundcover Management Systems in an Apple Orchard. HortScience 2011, 46, 1176–1183. [Google Scholar] [CrossRef] [Scilit]
- Pfiffner, L.; Cahenzli, F.; Steinemann, B.; Jamar, L.; Bjørn, M.C.; Porcel, M.; Tasin, M.; Telfser, J.; Kelderer, M.; Lisek, J. Design, Implementation and Management of Perennial Flower Strips to Promote Functional Agrobiodiversity in Organic Apple Orchards: A Pan-European Study. Agric. Ecosyst. Environ. 2019, 278, 61–71. [Google Scholar] [CrossRef] [Scilit]
- Bakker, J.P.; Poschlod, P.; Strykstra, R.J.; Bekker, R.M.; Thompson, K. Seed Banks and Seed Dispersal: Important Topics in Restoration Ecology. Acta Bot. Neerl. 1996, 45, 461–490. [Google Scholar] [CrossRef] [Scilit]
- Symonides, E.; Silvertown, J.; Andreasen, V. Population Cycles Caused by Overcompensating Density-Dependence in an Annual Plant. Oecologia 1986, 71, 156–158. [Google Scholar] [CrossRef] [Scilit] [PubMed]
- Biesmeijer, J.C.; Roberts, S.P.M.; Reemer, M.; Ohlemüller, R.; Edwards, M.; Peeters, T.; Schaffers, A.P.; Potts, S.G.; Kleukers, R.; Thomas, C.D.; et al. Parallel Declines in Pollinators and Insect-Pollinated Plants in Britain and the Netherlands. Science 2006, 313, 351–354. [Google Scholar] [CrossRef] [Scilit] [PubMed]
- Ebeling, A.; Klein, A.; Schumacher, J.; Weisser, W.W.; Tscharntke, T. How Does Plant Richness Affect Pollinator Richness and Temporal Stability of Flower Visits? Oikos 2008, 117, 1808–1815. [Google Scholar] [CrossRef] [Scilit]
- Földesi, R.; Kovács-Hostyánszki, A.; Kőrösi, Á.; Somay, L.; Elek, Z.; Markó, V.; Sárospataki, M.; Bakos, R.; Varga, Á.; Nyisztor, K.; et al. Relationships between Wild Bees, Hoverflies and Pollination Success in Apple Orchards with Different Landscape Contexts. Agric. For. Entomol. 2016, 18, 68–75. [Google Scholar] [CrossRef] [Scilit]
- Miglécz, T.; Valkó, O.; Török, P.; Deák, B.; Kelemen, A.; Donkó, Á.; Drexler, D.; Tóthmérész, B. Establishment of Three Cover Crop Mixtures in Vineyards. Sci. Hortic. 2015, 197, 117–123. [Google Scholar] [CrossRef] [Scilit]
- Panagos, P.; Standardi, G.; Borrelli, P.; Lugato, E.; Montanarella, L.; Bosello, F. Cost of Agricultural Productivity Loss Due to Soil Erosion in the European Union: From Direct Cost Evaluation Approaches to the Use of Macroeconomic Models. Land Degrad. Dev. 2018, 29, 471–484. [Google Scholar] [CrossRef] [Scilit]
- Madarász, B.; Jakab, G.; Szalai, Z.; Juhos, K.; Kotroczó, Z.; Tóth, A.; Ladányi, M. Long-Term Effects of Conservation Tillage on Soil Erosion in Central Europe: A Random Forest-Based Approach. Soil Tillage Res. 2021, 209, 104959. [Google Scholar] [CrossRef] [Scilit]
- Merwin, I.A.; Ray, J.A.; Curtis, P.D. Orchard Groundcover Management Systems Affect Meadow Vole Populations and Damage to Apple Trees. HortScience 1999, 34, 271–274. [Google Scholar] [CrossRef] [Scilit]
- Thompson, K.; Bakker, J.P.; Bekker, R.M. The Soil Seed Banks of North West Europe: Methodology, Density and Longevity; Cambridge University Press: Cambridge, UK, 1997; ISBN 978-0-521-49519-6. [Google Scholar]
- Manchester, S.J.; McNally, S.; Treweek, J.R.; Sparks, T.H.; Mountford, J.O. The Cost and Practicality of Techniques for the Reversion of Arable Land to Lowland Wet Grassland—An Experimental Study and Review. J. Environ. Manag. 1999, 55, 91–109. [Google Scholar] [CrossRef] [Scilit]
- Nugroho, P.A.; Prettl, N.; Madarász, B.; Kotroczó, Z.; Juhos, K. Soil Chemical Properties under 16 Years Conservation Tillage Practise in Hungary. In Proceedings of the 17th Carpathian Basin Conference for Environmental Sciences, Cluj Napoca, Romania, 6–9 April 2022; pp. 272–278. [Google Scholar]
- Kariminejad, N.; Biglarfadafan, M.; Kumar, V.; Jamir, I.; Shafaie, V.; Pourghasemi, H.R. Review of Multihazards Research with the Basis of Soil Erosion. In Advanced Tools for Studying Soil Erosion Processes; Elsevier: Amsterdam, The Netherlands, 2024; pp. 295–306. [Google Scholar]
- Toy, T.J.; Foster, G.R.; Renard, K.G. Soil Erosion: Processes, Prediction, Measurement, and Control; John Wiley & Sons: Hoboken, NJ, USA, 2002. [Google Scholar]
- Zi, H.B.; Ade, L.J.; Liu, M.; Hu, L.; Chen, Y.; Yang, Y.F.; Wang, C.T. Difference of Community Characteristics and Niche of Dominant Species in Different Grassland Types of Alpine Meadow. Chin. J. Appl. Environ. Biol. 2016, 22, 546–554. [Google Scholar]
- Hábenczyus, A.A.; Weiterová, I.; Foremnik, K.; Jakob, A.; Khopkar, S.; Kumar, A.; Lazăr, A.; Paganeli, B.; Samraoui, K.R.; Sidwell, J.; et al. Long-term Effects of Meadow Management on Seed Bank Diversity and Composition. J. Veg. Sci. 2024, 35, e13282. [Google Scholar] [CrossRef] [Scilit]
- Furquim, F.F.; Scasta, J.D.; Overbeck, G.E. Interactive Effects of Fire and Grazing on Vegetation Structure and Plant Species Composition in Subtropical Grasslands. Appl. Veg. Sci. 2024, 27, e12800. [Google Scholar] [CrossRef] [Scilit]
- Török, P.; Lindborg, R.; Eldridge, D.; Pakeman, R. Grazing Effects on Vegetation: Biodiversity, Management, and Restoration. Appl. Veg. Sci. 2024, 27, e12794. [Google Scholar] [CrossRef] [Scilit]
- Török, P.; Matus, G.; Papp, M.; Tothmeresz, B. Secondary Succession of Overgrazed Pannonian Sandy Grasslands. Preslia 2008, 80, 73–85. [Google Scholar]
- Janečková, P.; Tichý, L.; Walker, L.R.; Prach, K. Global Drivers Influencing Vegetation during Succession: Factors and Implications. J. Veg. Sci. 2024, 35, e13297. [Google Scholar] [CrossRef] [Scilit]
- Zeiter, M.; Stampfli, A.; Newbery, D.M. RECRUITMENT LIMITATION CONSTRAINS LOCAL SPECIES RICHNESS AND PRODUCTIVITY IN DRY GRASSLAND. Ecology 2006, 87, 942–951. [Google Scholar] [CrossRef] [Scilit]
- Pereira, S.M.; Hoffman, M.R.; Salemi, L.F. Soil Physical Properties in an Oxisol under a Syntropic Agroforestry System: Row versus Inter-Row. Rev. Bras. De Geogr. Física 2024, 17, 838–844. [Google Scholar] [CrossRef] [Scilit]
- Deák, B.; Valkó, O.; Kelemen, A.; Török, P.; Miglécz, T.; Ölvedi, T.; Lengyel, S.; Tóthmérész, B. Litter and Graminoid Biomass Accumulation Suppresses Weedy Forbs in Grassland Restoration. Plant Biosyst.—Int. J. Deal. All Asp. Plant Biol. 2011, 145, 730–737. [Google Scholar] [CrossRef] [Scilit]
- Donkó, Á.; Miglécz, T.; Tótmérész, B.; Valkó, O.; Deák, B.; Kelemen, A.; Török, P.; Zanathy, G.; Zsigrai, G.; Drexler, D. Intercropping Experiments in Hungarian Vineyards. Acta Fytotech. et Zootech. 2016, 18, 128–130. [Google Scholar] [CrossRef] [Scilit]
- Király, G.; Virók, V.; Szmorad, F.; Molnár, V.A. Új Magyar Füvészkönyv: Magyarország Hajtásos Növényei: Határozókulcsok; Aggteleki Nemzeti Park Igazgatóság: Jósvafő, Hungary, 2009. [Google Scholar]
- Simon, T. A Magyarországi Edényes Flóra Határozója: Harasztok-Virágos Növények; Nemzeti Tankönyvkiadó: Budapest, Hungary, 2000. [Google Scholar]
- Török, P.; Lukács, B.; Tóthmérész, B. Terepi Módszerek a Vegetáció Vizsgálatához; Debreceni Egyetemi Kiadó–Debrecen University Press: Debrecen, Hungary, 2010. [Google Scholar]
- Borhidi, A.; Fernandez, M.Z. The Genus Stenostomum CF Gaertn. (Rubiaceae) or the Reconsideration of the New World Antirhea Species. Acta Bot. Hung 1993, 94, 157–166. [Google Scholar]
- Andrade, B.O.; Menezes, L.d.S.; Boldrini, I.I.; Pillar, V.D.; Overbeck, G.E. Grassland Plant Community Composition and Dynamics: Disturbance as Determinants of Grassland Diversity. In South Brazilian Grasslands; Overbeck, G.E., Pillar, V.D.P., Müller, S.C., Bencke, G.A., Eds.; Springer International Publishing: Cham, Switzerland, 2024; pp. 177–204. ISBN 978-3-031-42579-0. [Google Scholar]
- Meier, T.; Hensen, I.; Kühn, I. Functional Approach to Xerothermic Grasslands in Central Germany: Trait Composition, Dominant Grasses and Soil Factors. Preslia 2024, 96, 183–208. [Google Scholar] [CrossRef] [Scilit]
- Thyll, S. Talajvédelem És Vízrendezés Dombvidéken; Mezőgazda Kiadó: Budapest, Hungary, 1992; Available online: https://library.hungaricana.hu/hu/view/VizugyiKonyvek_226/?pg=1&layout=s (accessed on 4 May 2024).
- Zhao, H.; Feng, S.; Li, W.; Gao, Y. Study on the Effect and Enhancement of Near-Natural Integrated Plant Positioning Configuration in the Hilly Gully Region, China. Forests 2024, 15, 841. [Google Scholar] [CrossRef] [Scilit]
- Bručienė, I.; Buragienė, S.; Šarauskis, E. Weeding Effectiveness and Changes in Soil Physical Properties Using Inter-Row Hoeing and a Robot. Agronomy 2022, 12, 1514. [Google Scholar] [CrossRef] [Scilit]
- Restuccia, A.; Scavo, A.; Lombardo, S.; Pandino, G.; Fontanazza, S.; Anastasi, U.; Abbate, C.; Mauromicale, G. Long-Term Effect of Cover Crops on Species Abundance and Diversity of Weed Flora. Plants 2020, 9, 1506. [Google Scholar] [CrossRef] [Scilit]
- Medrano Narvaez, E. Monitoreo de La Tasa de Deforestación y Su Impacto Sobre Las Poblaciones de Abejas Silvestres (Apidae: Meliponini) En La Ecoregión Del Chaco Serrano Comunidad Itapochi Del Parque Nacional y Área Natural de Manejo Integrado Serranía Del Iñao. Master’s Thesis, Universidad Andina Simón Bolívar, Sucre, BO, Bolivia, 2020. [Google Scholar]
- Peltzer, S.C.; Hashem, A.; Osten, V.A.; Gupta, M.L.; Diggle, A.J.; Riethmuller, G.P.; Douglas, A.; Moore, J.M.; Koetz, E.A. Weed Management in Wide-Row Cropping Systems: A Review of Current Practices and Risks for Australian Farming Systems. Crop Pasture Sci. 2009, 60, 395–406. [Google Scholar] [CrossRef] [Scilit]
- Kalamees, R.; Zobel, M. Soil Seed Bank Composition in Different Successional Stages of a Species Rich Wooded Meadow in Laelatu, Western Estonia. Acta Oecol. 1998, 19, 175–180. [Google Scholar] [CrossRef] [Scilit]
- Valkó, O.; Török, P.; Tóthmérész, B.; Matus, G. Restoration Potential in Seed Banks of Acidic Fen and Dry-Mesophilous Meadows: Can Restoration Be Based on Local Seed Banks? Restor. Ecol. 2011, 19, 9–15. [Google Scholar] [CrossRef] [Scilit]

Disclaimer/Publisher’s Note: The statements, opinions and data contained in all publications are solely those of the individual author(s) and contributor(s) and not of MDPI and/or the editor(s). MDPI and/or the editor(s) disclaim responsibility for any injury to people or property resulting from any ideas, methods, instructions or products referred to in the content. |
© 2024 by the authors. Licensee MDPI, Basel, Switzerland. This article is an open access article distributed under the terms and conditions of the Creative Commons Attribution (CC BY) license (https://creativecommons.org/licenses/by/4.0/).