


Abstract
Multivariate analysis was conducted to explore the moist temperate forests of the Shangla district, Khyber Pakhtunkhwa. The prime objective was to quantitatively describe and differentiate the vegetation groups and the factors that determine the boundaries and composition of plant communities in the Shangla district. This was achieved by sampling all common species in a complex vegetation mosaic coinciding with local gradients in topography and soil distribution. Ward’s clustering dendrogram demonstrated four significant vegetation clusters with respect to environmental effects. These four major groups of the tree vegetation were superimposed on the ordination plane: 1. Pinus wallichiana, the dominant group associated with Abies pindrow; 2. Abies pindrow and the Picea smithiana group; 3. Dominant Cedrus deodara associated with the Pinus wallichiana, Abies pindrow, Picea smithiana, and Quercus baloot group; 4. Pinus roxberghii pure group. The key controlling factors for each group were the environmental characteristics (i.e., edaphic factors, topographic factors, soil physical properties, and soil nutrients). The results revealed elevation (p <0.001) to be the prominent factor in the composition of plant communities. Furthermore, pH, soil moisture, maximum water holding capacity, and soil physical properties (sand, silt, and clay) also showed a significant (p < 0.05) relationship with vegetation. The other environmental factor did not show a significant relationship with vegetation. Ward’s cluster dendrogram of understory species also demonstrated four groups. Group 1 comprises two subgroups, a and b, with the highest number of species, i.e., Digeteria sanguinalis, Fragaria nubicola, Verbascum Thapsus, Pinus wallichiana seedlings, and Polygonatum multiflorium, respectively. The second large group contains twenty-five species out of eight stands, and the dominant species was Tagetis minuta. Eighteen species out of six stands were found in group 3, which was considered the smallest group. Group 4 consisted of seven stands containing twenty-four species of ground flora, with Anaphalis scopulosa followed by Adiantum venustum as the dominant species. The environmental characteristics of the understory vegetation showed a resemblance with the tree communities. With the exception of elevation, the other factors did not show a significant correlation.
1. Introduction
In an ecological study, multivariate analysis is one of the most important approaches, demonstrating the relationship between species and their local communities [1]. This technique has been used widely to abstract and simplify the massive ecological data set available and explore the possible relationship between various environmental variables and vegetation. Therefore, for understanding the species composition and distribution with respect to environmental variables, multivariate analysis techniques are reliable approaches [2]. In Pakistan, earlier ecological studies were based on observational approaches. Though, for the determination of the floristic composition of vegetation, few quantitative studies have been conducted, they were mostly based on primitive techniques. Advanced multivariate ordination and cluster analysis techniques have been used routinely in Europe and North America for several decades. In Pakistan, Shaukat and Qadir [3] and Ahmed [4,5] applied the multivariate techniques to the vegetation of the calcareous hills around Karachi, the industrial area of Karachi, and the Skardu District for the first time. Shaukat et al. [6] used these techniques to show significant correlations between the local environmental variables and vegetation. Various physical and environmental characteristics, including biotic and abiotic stresses, and particularly anthropogenic disturbance, have been linked to the distribution of plant species and communities [6,7,8,9,10,11].
Most of the vegetation of Pakistan has been analyzed by various researchers using multivariate techniques. Using the multivariate technique, Shaukat and Uddin [12] investigated the Achyranthes aspera tree composition and pattern. Ahmed et al. [13] and Hussain et al. [14] illustrated the vegetation of Chiltan in Baluchistan and the Swabi area of Khyber Pakhtunkhwa, respectively, using multivariate analysis. Ahmad et al. [15] investigated the phytosociological and structural characteristics of the Himalayan forests in several climatic zones of Pakistan. They found that specific communities had similar floristic compositions but differing quantitative values and provided a description of understory species. Ilyas et al. [16] analyzed the anthropogenic pressure on existing temperate forests in the Swat district, Khyber Pakhtunkhwa, including logging, deforestation, overgrazing, and forest removal for terrace farming. Ahmad, Fazal, Valeem, Khan, Sarwar and Iqbal [15] evaluated ecological aspects of roadside vegetation around Havalian city using multivariate techniques and vegetation along the motorway (M-2) in Pakistan. Siddiqui et al. [17] analyzed Pakistan’s major moist temperate area vegetation quantitatively using multivariate agglomerative cluster analysis. Siddiqui et al. [18] conducted detailed research on several forests in Pakistan’s moist temperate areas, whereas Rashid et al. [19] carried out a phytoecological evaluation with a detailed floristic appraisal of the vegetation around Malam Jabba’s forests. Wahab et al. [20] explored the population dynamics of pine tree species in the Dir District, and Khan [21] investigated the vegetation ecology of Chitral Gol National Park.
The understory vegetation plays a very important role in a functioning forest ecosystem and structure. These species make strong association with trees and maintain the nutrient cycle as well as canopy succession [22]. The impact of trees on the understory vegetation and its relationship is essential because ground flora plays a significant role in the functioning of forest ecosystems. Natural and diverse understory vegetation may be significant to plant communities beyond any effect on growth or nutrients. Huo, Feng, and Su [22] suggested that coniferous forests are less favorable to biodiversity than mixed- or hardwood forests. On the other hand, few investigations have compared the vegetation of coniferous species [23,24]. Natural forest patches, mainly inhabited by Pinus wallichiana, are commonly distributed in the Hindu Kush Himalayan mountains of the northern area of Pakistan. These vegetated areas, composed mainly of forests, are a critical source of timber, firewood, and water conservation, and prevent the erosion of the local fertile soils in the region. Owing to the rigid and harsh mountainous system and less accessible part of the Khyber Pakhtunkhwa, quantitative and multivariate analysis of the vegetation of this area had been ignored in the past. Therefore, this study examined the vegetation–environmental relationship using multivariate techniques. The proposed study is the first multivariate analysis study from the Shangla district. This study is expected to enhance the understanding of the vegetation and environmental complex of these forests.
2. Materials and Methods
2.1. Vegetation Sampling
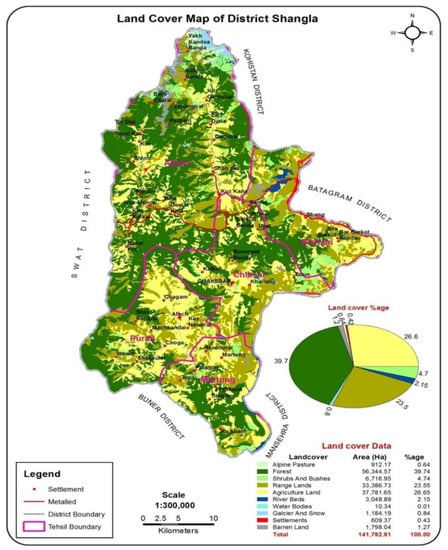
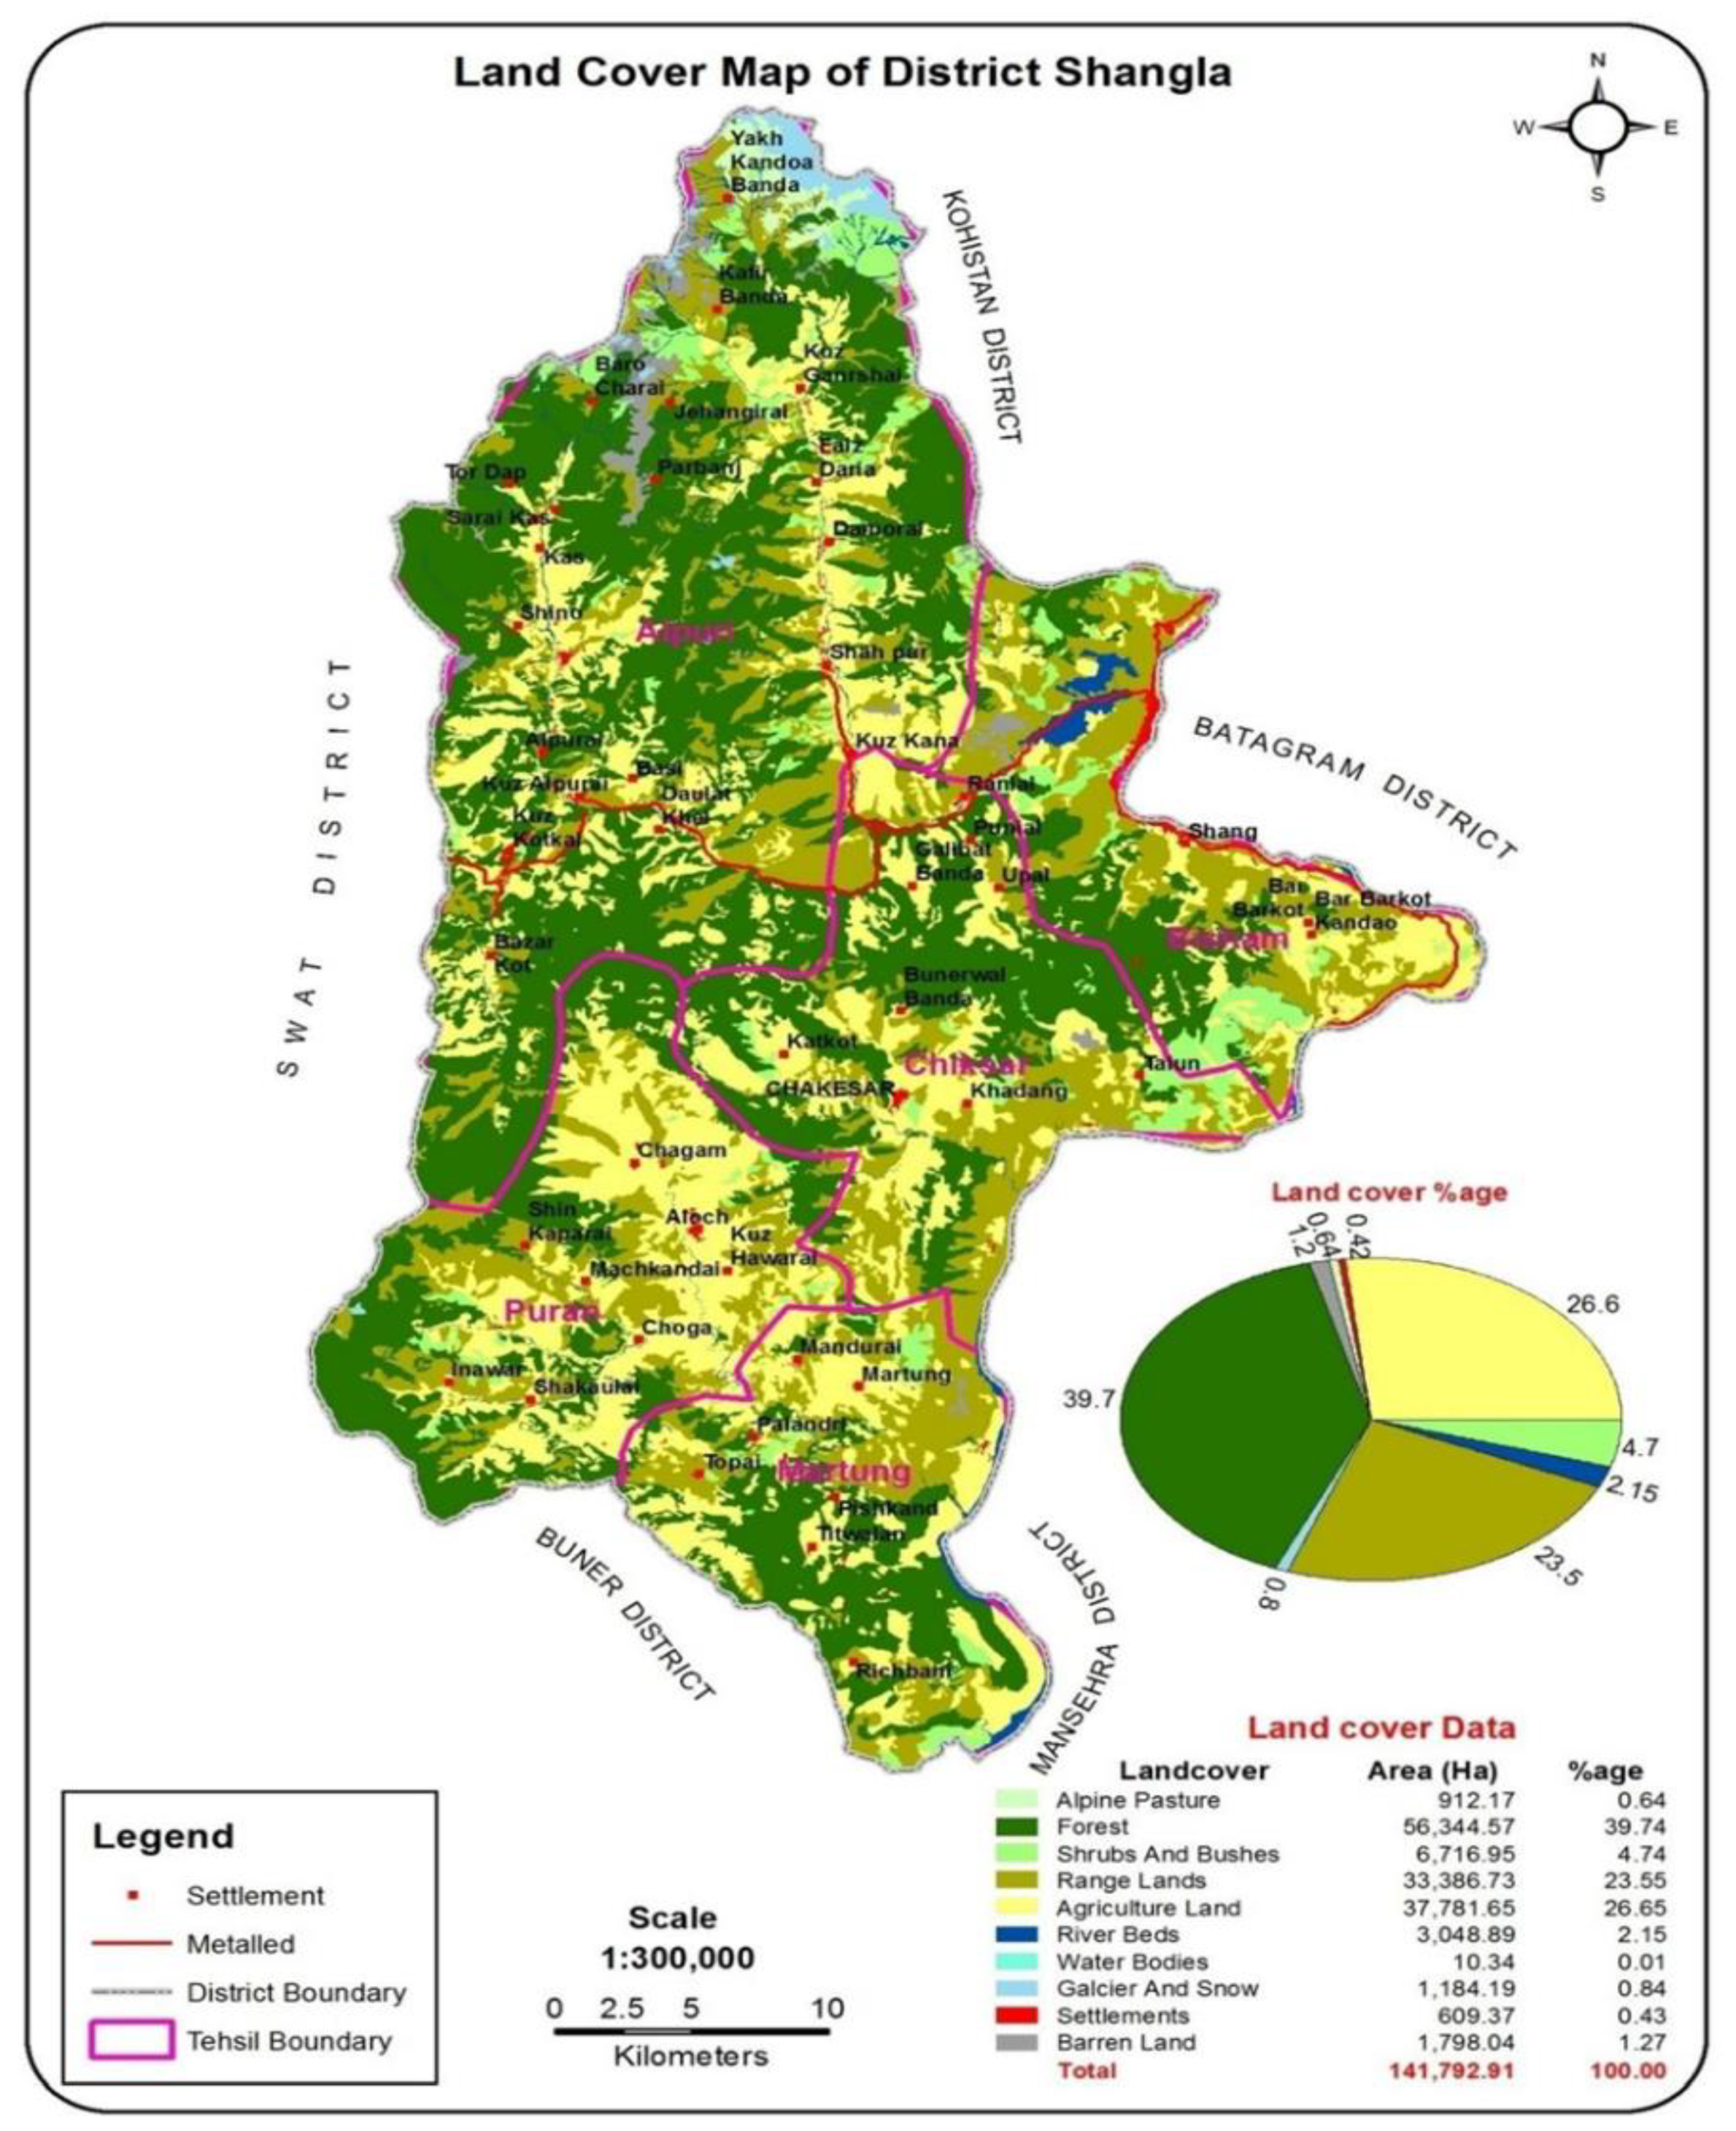
Sampling was conducted in forests of the Shangla district of Khyber Pakhtunkhwa (Figure 1). The study sites were selected on the basis of the maturity of forests determined by (1) no sign of recent disturbances and (2) tress that have at least 60 cm dbh. Forty mature sites of conifer tree species were sampled using the PCQ (point-centered quarter) method reported by Cottam and Curtis [25]. At each site, trees under 10 cm dbh and understory species were sampled with a circular plot, 1.5 m in diameter. In addition, the coordination and altitude of the sampling sites were calculated by GPS. At each sampling site, three soil samples were collected from a 10 cm depth up to 500 gm, and a composite of the samples was made for analysis. The slope angle and aspect were recorded using a clinometer. The phytosociological attributes, including the relative and absolute density and basal area of the tree species, were calculated using standard ecological approaches [25,26,27].
Figure 1.
Land cover map of the study area.
2.2. Laboratory Procedure
Soil samples were dried in air at room temperature (25 to 30 °C), then sieved through a 2 mm sieve. The soil characteristics, including (TDS) total dissolved solids, soil pH, salinity, and conductivity of this soil were obtained and analyzed by making a suspension of 20 gm soil and filtering through a Whatman filter paper no. 42. These filtered samples were taken in a beaker, and their results were determined using a multiparameter meter (HANNA Model Sension Tm105). The maximum water holding capacity (MWHC) of the collected soil samples was determined using the approach reported by Eaton [28]. The soil organic matter was determined by applying weight loss following the loss-on-ignition method [29]. The phosphorus (P) level was estimated using the method of Vanado-Molybdate-Yellow (Barton’s Reagent) described by [30]. The total phosphorus was calculated as a percentage. The soil texture was then assessed. Soil has particles of different sizes called sand, silt, and clay. Sands are the largest particles in the soil. Silt has midsized particles of soil. Clay is the smallest-sized soil particles. The percentages of sand, silt, and clay were determined using the pipette method reported by Cornell Nutrient Analysis Laboratory (CNAL), website: www.css.cornell.edu/soiltest, accessed on 1 June 2022.
2.3. Statistical Analysis
For the statistical analysis, the obtained data were subjected to a computer program (PC-ord version 5). The tree vegetation and understory species were classified by cluster analysis [31]. Two techniques, i.e., principal component analysis (PCA) and two-dimensional nonmetric multidimensional scaling (NMS), described by [32], were used for ordination. The frequency of the understory vegetation and the importance value of the trees were taken to categorize the vegetation into groups. The differences between the local environmental variables among the groups were investigated using the single-way analysis (ANOVA). The understory vegetation was divided into different groups according to the method of Tansley and Chipp [33,34]: (I) 10–20% Rare, (II) 21–30% Occasional, (III) 31–40% Frequent, (IV) 41–50% Abundant, and (V) 51–60% Very abundant.
3. Results
3.1. Classification Based on Ward’s Cluster Analysis (Tree Vegetation Data)
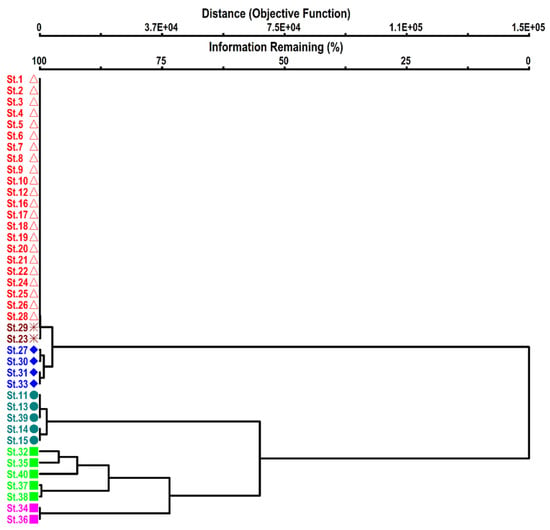
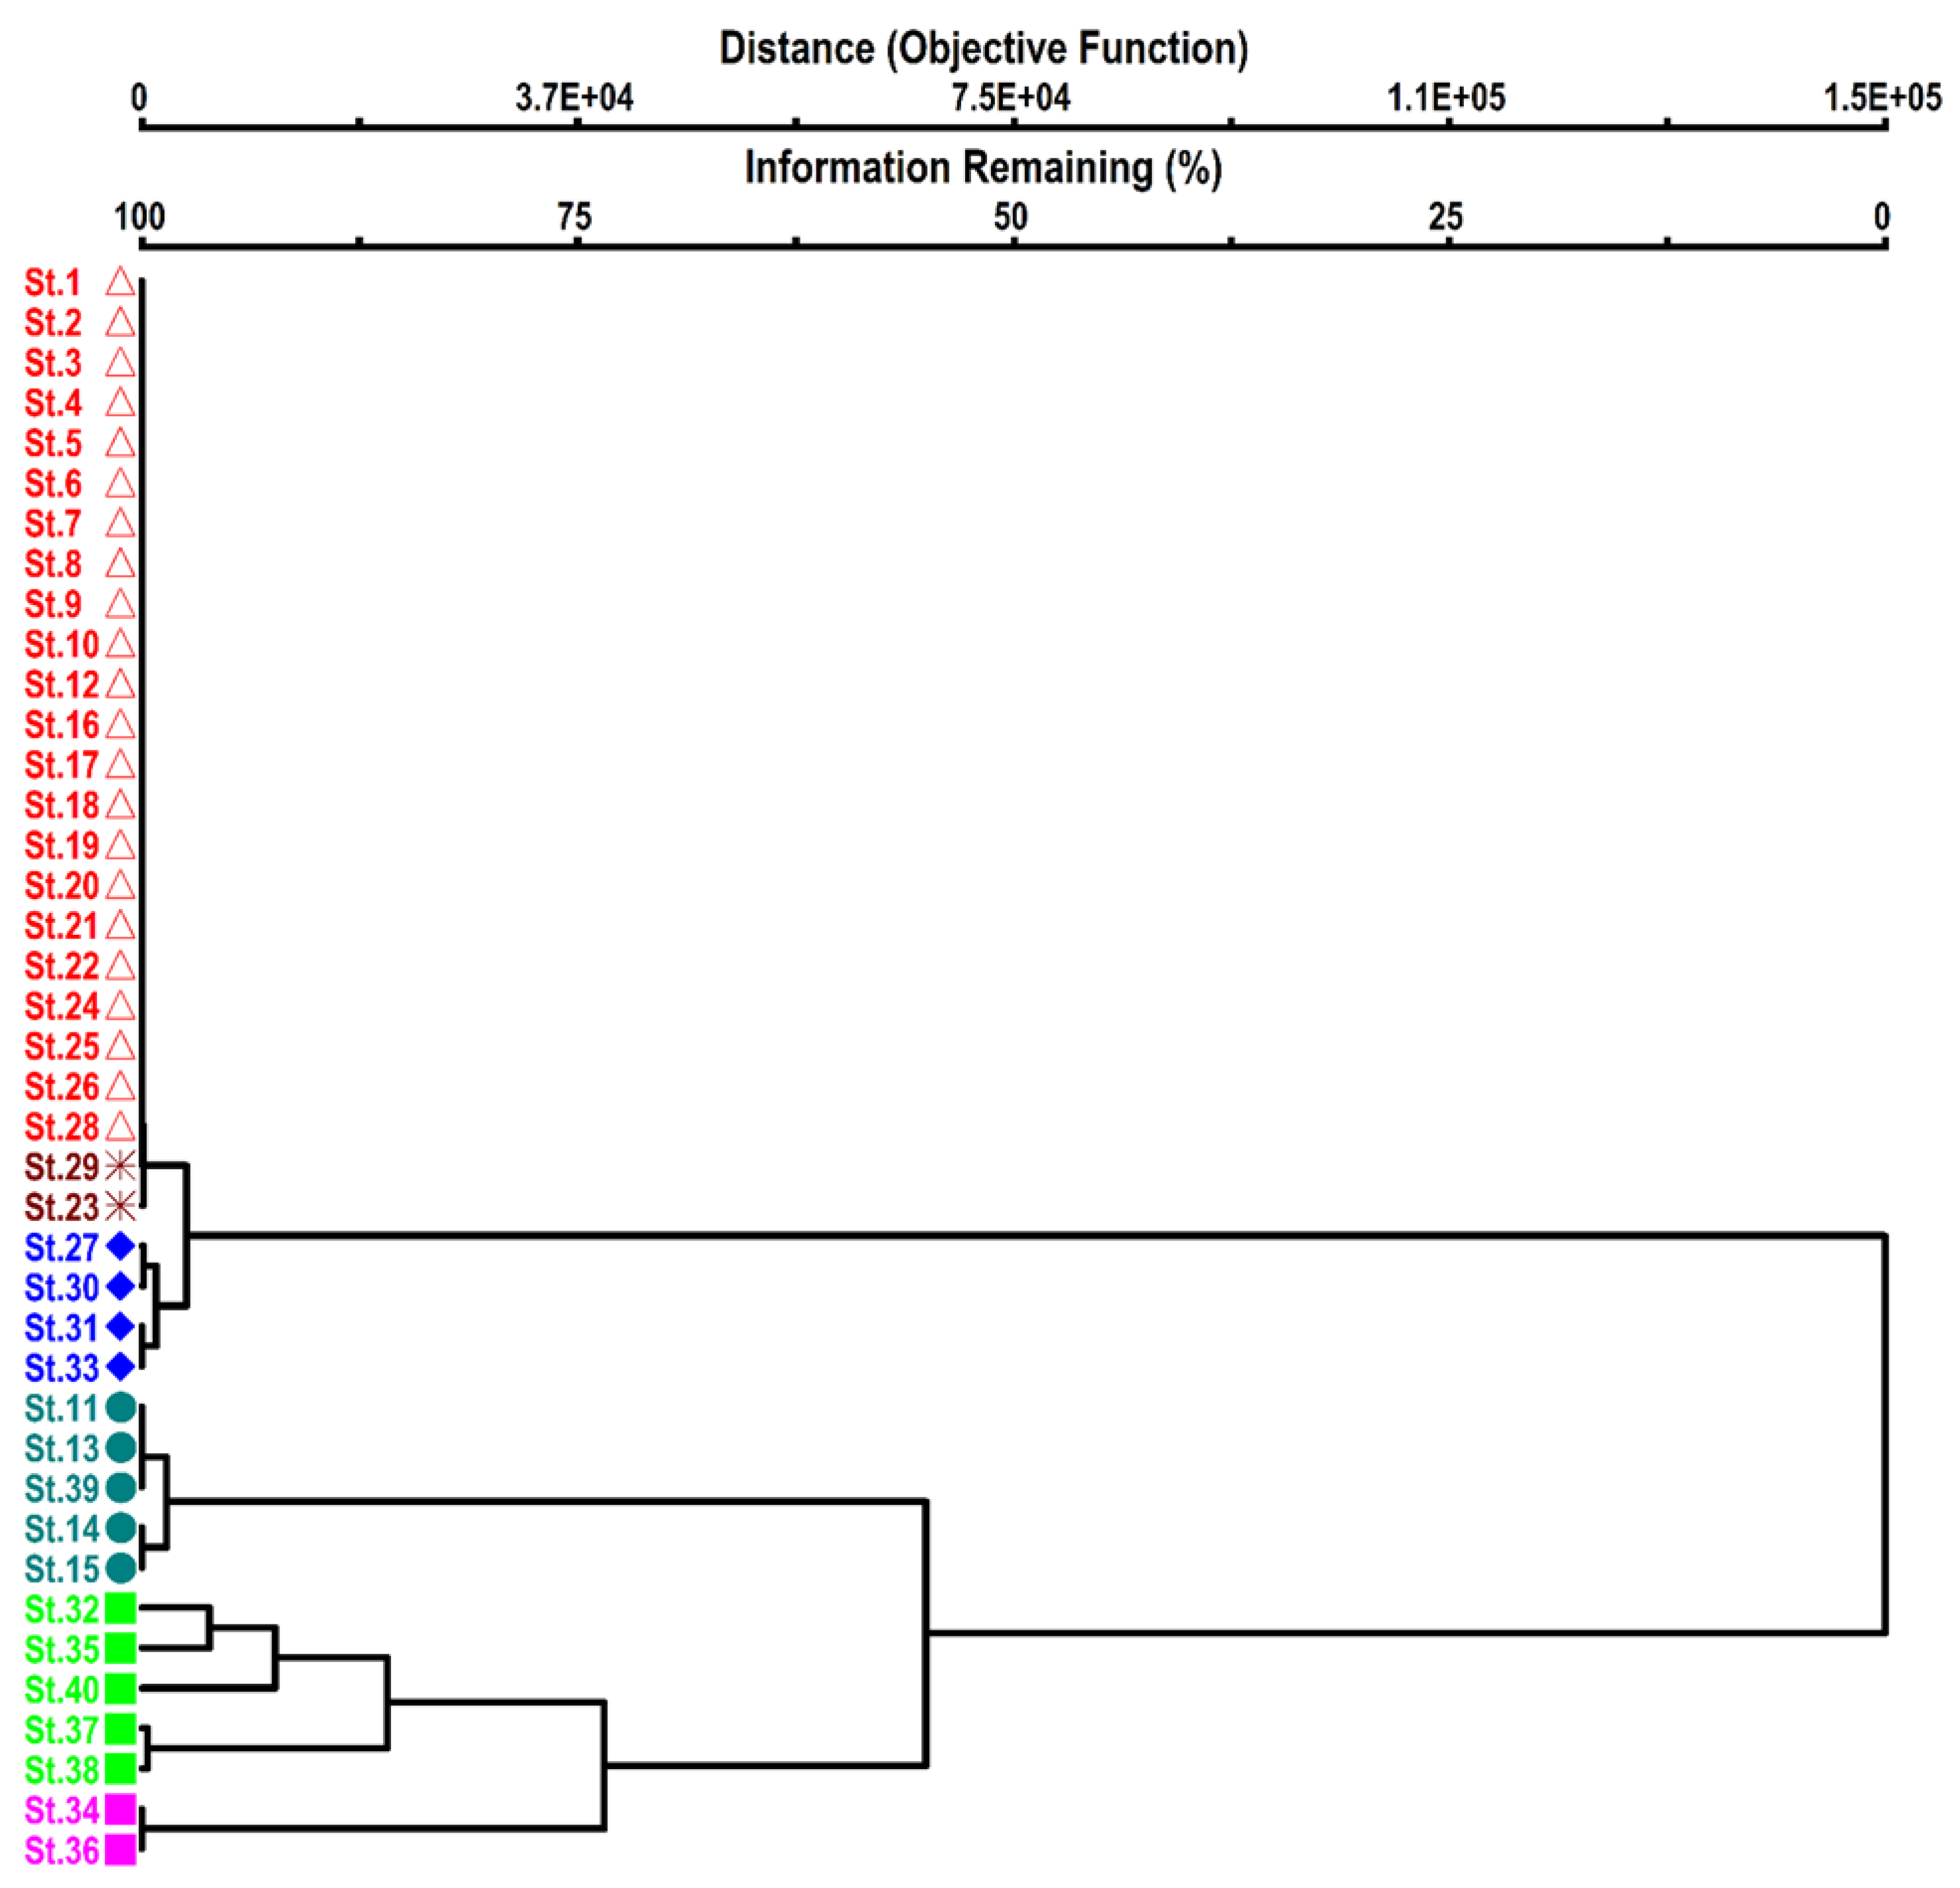
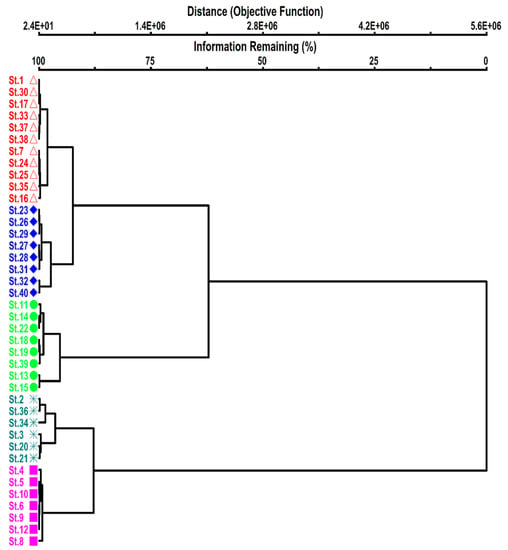
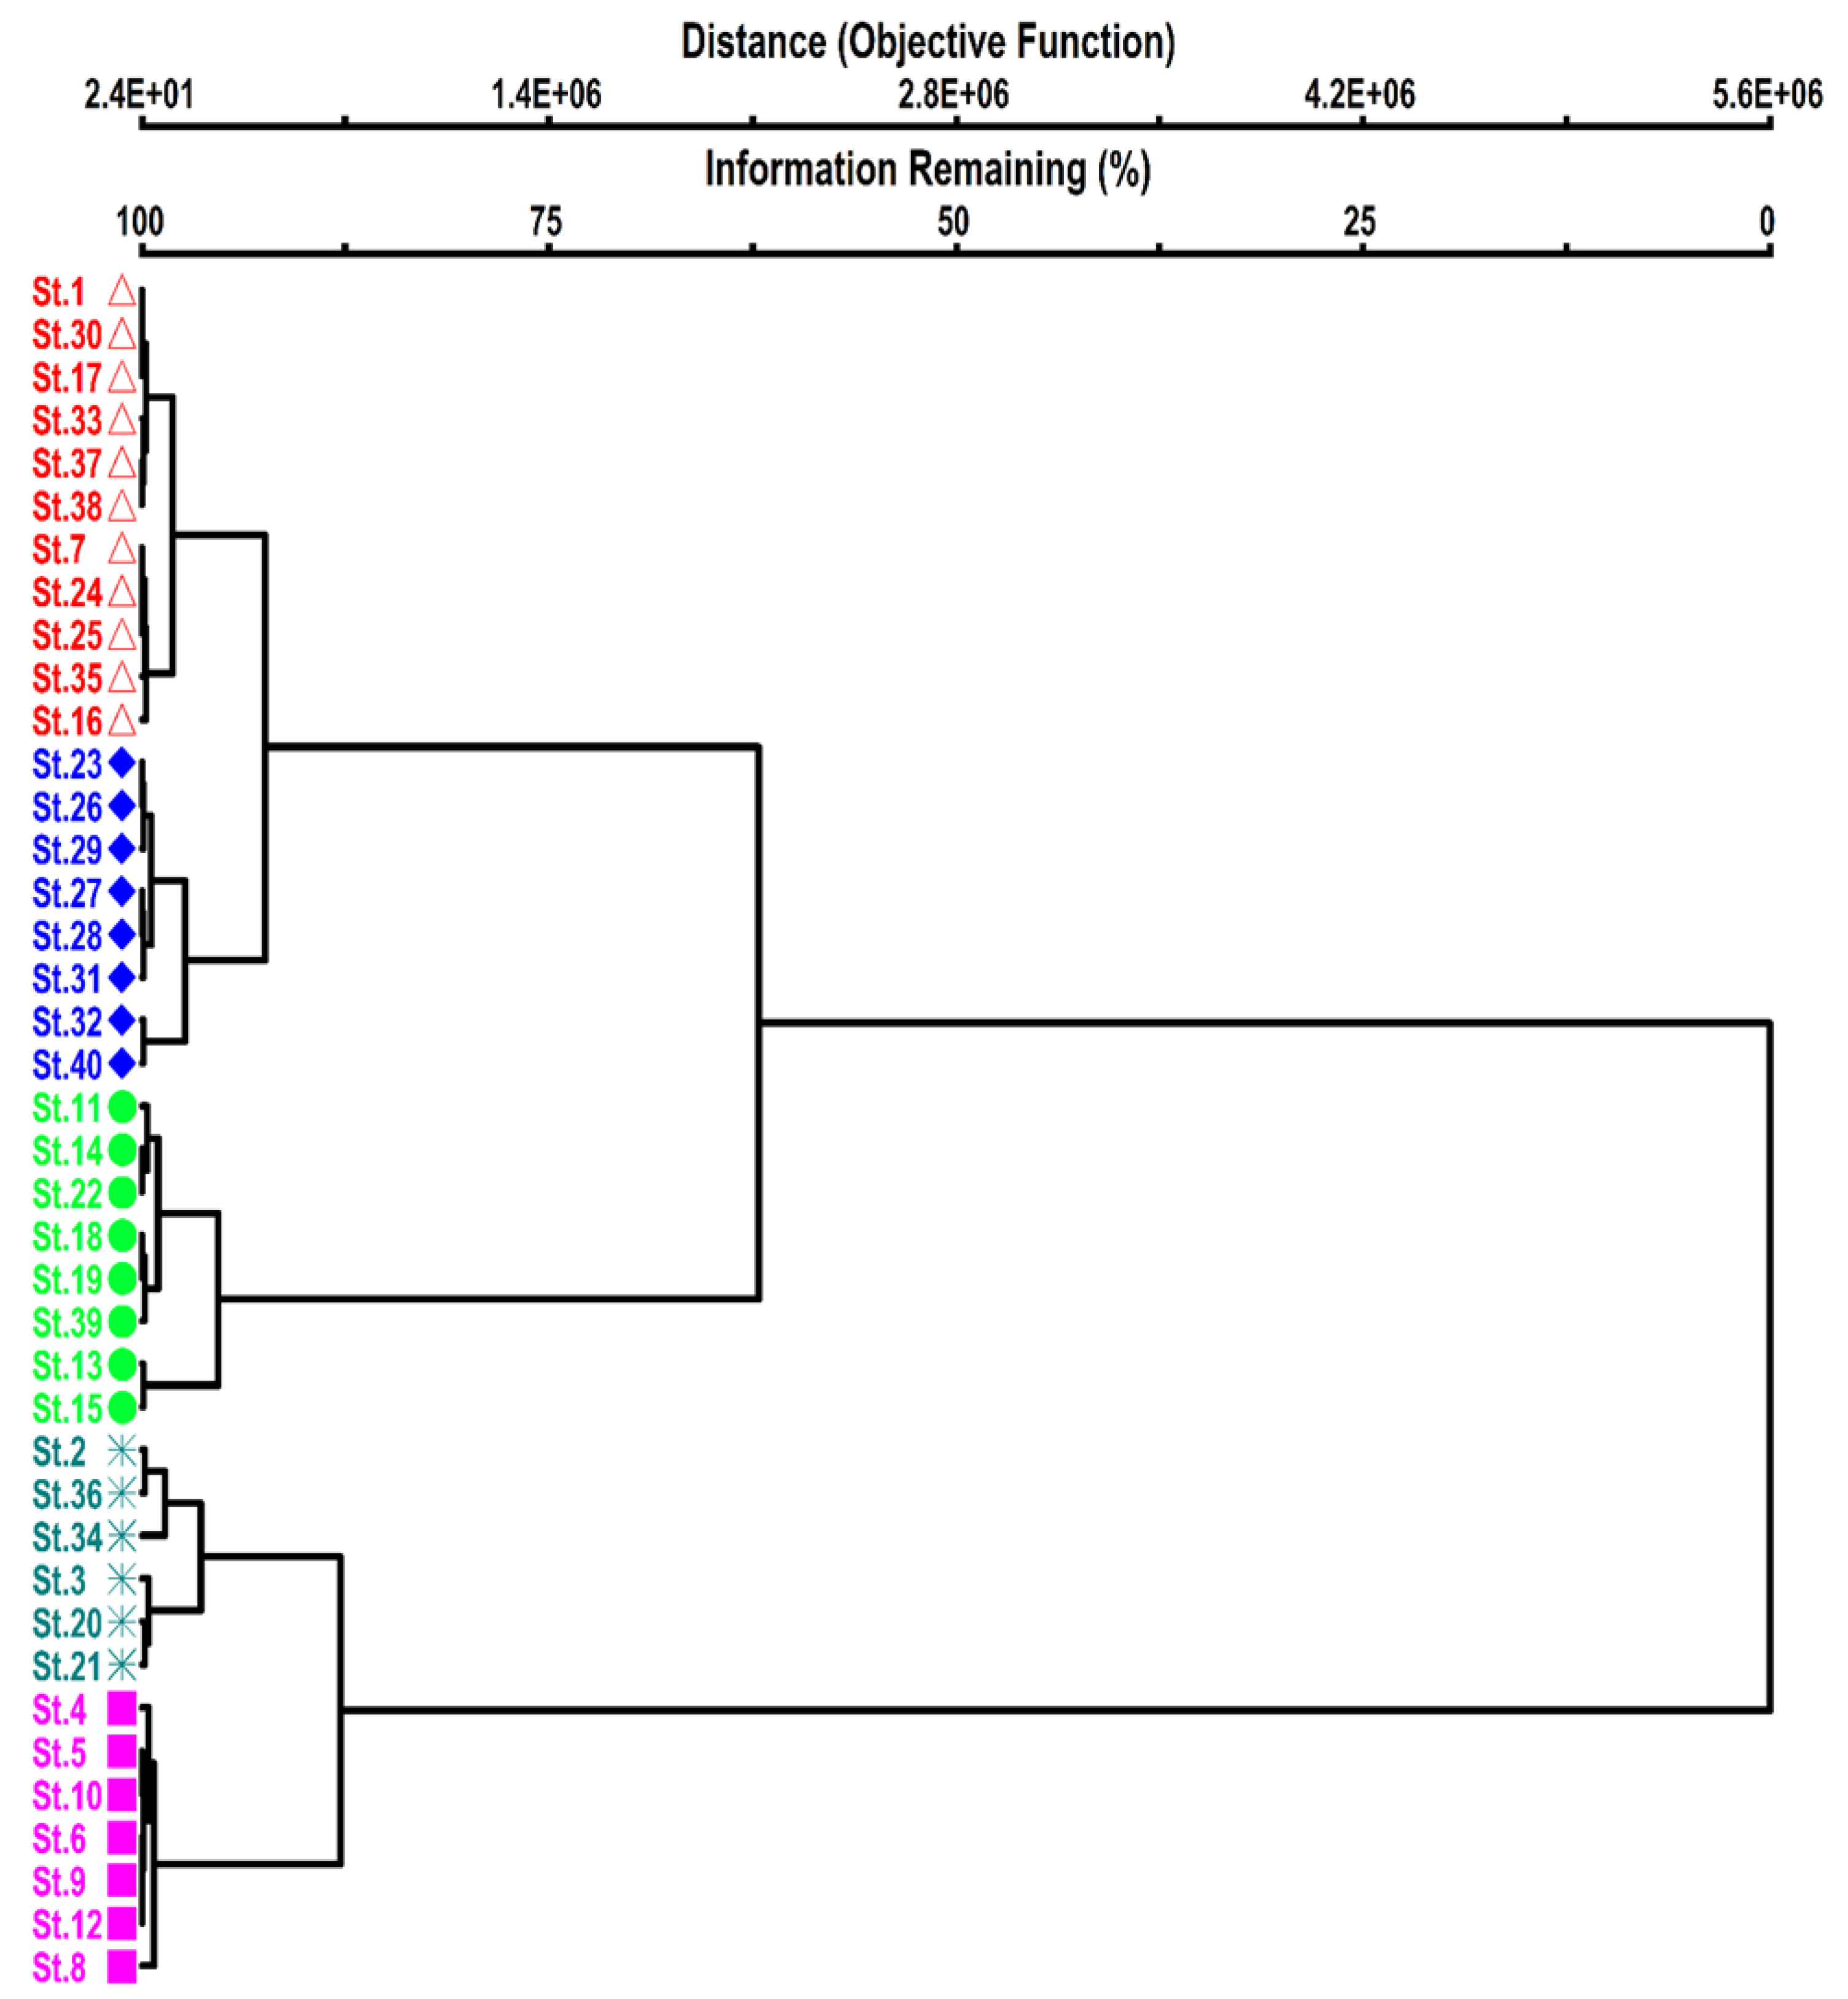
The cluster dendrogram (Figure 2) separated four major groups of vegetation. Table 1 lists the characteristic features of these groups, whereas Table 2 presents the environmental variables.
Figure 2.
Dendrogram derived from Ward’s cluster analysis using the importance value of tree species from the Shangla district. The different colors indicate different floristic composition with respect to their environmental variables. (St indicates different stands in groups of vegetation.)
Table 1.
Four groups derived from Ward’s cluster analysis of 40 stands and their average tree species composition (average importance value for each group).
Table 2.
Mean values ± SE of the environmental variables (topographic, edaphic, and soil nutrient) based on three groups derived from Ward’s cluster analysis using the tree vegetation data. (Mean ± SE).
3.1.1. Group I Pinus wallichiana Dominant Group
Twenty-eight stands comprised of three subgroups were obtained: group 1 (a), composed of 21 stands of pure Pinus wallichiana tree species; group 1 (b), comprised of three stands of Pinus wallichiana and Abies pindrow association; group 1 (c), four stands comprised of two gymnosperm and one angiosperm species (Figure 2).
3.1.2. Group I (a) Pure Pinus wallichiana
Among the groups, this was the largest group, which is composed of 21 stands of Pinus wallichiana. As this group was based on monospecific stands of Pinus wallichiana, their importance value index (IVI) was 100. The average elevation of this group was 1953.1 ± 69 m, whereas the slope angle was 39.05 ± 1.41°. The total dissolved salts (TDS) and water-holding capacity were 68.0 ± 6.8 g/L and 12.24. ± 0.06%, respectively. The salinity, conductivity, and soil moisture of this group were 0.06 ± 0.01%, 136.6 ± 13.7 μS/cm, and 24.5 ± 1.2%, respectively. The soil nature of this group was alkaline, having a mean pH of 7.94 ± 0.04. Regarding the soil nutrients, this group had mean values of organic matter of 0.6 ± 0.0% and mean phosphorus of 0.43 ± 0.09%. The mean sand, silt, and clay were 53.37 ± 1.90%, 32.37 ± 1.63%, and 13.9 ± 1.53%, respectively.
3.1.3. Group I (b) Pinus wallichiana and Abies pindrow Association
This subgroup contained three stands showing two gymnosperm tree species: Pinus wallichiana and Abies pindrow. Pinus wallichiana is the leading dominant species with a 98.33 ± 1.67 importance value, and codominant species Abies pindrow contributed a very low 1.67 ± 1.67 importance value. The mean elevation of this group was 2203.3 ± 29.6 m with a 38.3 ± 4.4 mean slope angle. The edaphic condition of this group showed that the TDS value, maximum water-holding capacity, salinity, conductivity, and soil moisture were 48.67 ± 5.36, 11.70 ± 0.9, 0.04 ± 0.0, 96.67 ± 10.09%, and 23.4 ± 1.8%, respectively. The pH was alkaline at 8.06 ± 0.03. The soil nutrient organic matter content was 43 ± 0.030 and the phosphorus level was 0.23 ± 0.03%. The sand, silt, and clay contents were 51.73 ± 7.66, 36.9 ± 7.36, and 11.3 ± 1.13%, respectively.
3.1.4. Group I (c) Pinus wallichiana Mix Group
This subgroup comprised four stands of trees showing two coniferous species, Pinus wallichiana and Abies pindrow, with high importance values of 80.9 ± 2.2 and 10 ± 6.1, respectively. By contrast, the angiospermic species Quercus baloot contributed a 9.0 ± 5.2% importance value to this group. This group is generally associated with an elevation of 2171.5 ± 35 m with a 30.8 ± 3.3° steep slope. The edaphic features of this group showed a TDS, maximum water-holding capacity, salinity, conductivity, and soil moisture of 71.3 ± 19.1, 9.5 ± 0.6, 0.07 ± 0.02, 143.8 ± 37.6, and 18.9 ± 1.2%, respectively. The pH was 7.8 ± 0.2. The soil nutrients of this group showed an organic matter level of 0.7 ± 0.2 and a phosphorus level of 0.33 ± 0.11%. The physical characteristics of the soil of this group were composed of sand 49.4 ± 5.0%, silt 42.0 ± 6.0%, and clay 8.7 ± 2.6%.
3.1.5. Group II Abies pindrow and Picea smithiana Association
This group includes five stands; Abies pindrow dominates with a 92.5 ± 4.6% average importance value, while Picea smithiana attained a 7.5 ± 4.6% average importance value. Compared to the other groups, this group was commonly growing on the highest elevation (2691.2 ± 47.6 m), with a 34.0 ± 7.48° slope angle. In the edaphic variables, the TDS, maximum water-holding capacity, salinity, conductivity, and soil moisture were 44.4 ± 7.01; 15.4 ± 1.81, 0.04 ± 0.01, 82.6 ± 7.59, and 30.8 ± 3.61%, respectively. The pH was 7.78 ± 0.09. Regarding the soil nutrients, this group showed 0.42 ± 0.07% of organic matter and 0.53 ± 0.17% phosphorus. This group contained 45.88 ± 2.59% sand, 34.48 ± 3.11% silt, and 19.64 ± 4.22% clay.
3.1.6. Group III Mixed Group of Conifer Dominating Species
This group contains five stands of 32, 35, 37, 38, and 40, respectively, and included four conifers and one angiospermic tree species. The dominant species was Cedrus deodara, with an average importance value of 44 ± 20.7, followed in order by Pinus wallichiana, Picea smithian, Abies pindrow, and Quercus baloot at average importance values of 26.3 ± 9.3, 16.25 ± 16.2, 9.75 ± 9.75, and 3.75 ± 2.5%, respectively. The elevation value means of this group were slightly lower at 2188 = 76.2 than that found in the previous group, while the mean slope was 38.2 ± 4.04, higher than the previous group. The edaphic feature of this group showed a mean TDS, maximum water-holding capacity, salinity, conductivity, and soil moisture of 51.2 ± 4.9, 12.05 ± 0.83, 0.05 ± 0.0, 108 ± 12.73, and 24.1 ± 1.7%, respectively. The pH of this group was 7.60 ± 0.06. The soil nutrients of this group were 0.48 ± 0.05 for organic matter and 0.46± 0.09 for phosphorus. The sand, silt, and clay contents were 47.56 ± 5.85, 43.44 ± 5.61, and 9 ± 0.6%, respectively.
3.1.7. Group IV Pure Pinus roxberghii Association
Among the groups, group IV was the smallest group, composed of two pure stands of Pinus roxberghii tress with 100 ± 00% importance values. This group belongs to the subtropical area. The topographic appearances of this group revealed a comparatively low elevation of 1374.5 ± 76.5 m with a 35.0 ± 5° slope angle. The edaphic feature of this group showed a mean TDS, maximum water-holding capacity, salinity, conductivity, and soil moisture of 45.0 ± 17.0, 8.07 ± 4.23, 0.04 ± 0.02, 89.5 ± 34.5, and 16.14 ± 8.46, respectively. The soil pH was 7.40 ± 0.02. The soil texture was composed of 27 ± 0.0% sand, 53.8 ± 11.0% silt, and 19.2 ± 11.0% clay. Soil organic matter was 0.4 ± 0.2, and the phosphorus level was 0.3 ± 0.0.
3.2. Univariate Analysis of Variance (ANOVA)
ANOVA was used to determine the relationship between vegetation and environmental characteristics. The results showed that in the topographic factors, elevation was highly significant (p < 0.001), whereas the slope was nonsignificant. Among the edaphic factors, pH was significantly correlated (p < 0.01) (Table 3). Soil moisture and maximum water holding capacity also showed a significant p > correlation with vegetation. Salinity, conductivity, and TDS were nonsignificant. The soil texture (sands, silt, and clay) also showed a significant correlation (p < 0.05). Regarding the soil nutrients, soil organic matter was correlated significantly (p < 0.001), but phosphorus was nonsignificant.
Table 3.
Analysis of the variance of individual environmental variables (topographic, edaphic, soil texture, and soil nutrients) by Ward’s cluster analysis using the tree vegetation data of 40 stands.
3.3. Ordination
Principal Component Analysis (PCA) Ordination of Tree Vegetation Data
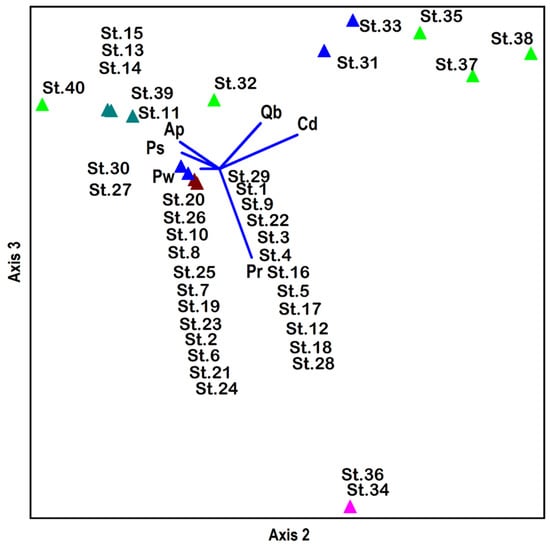
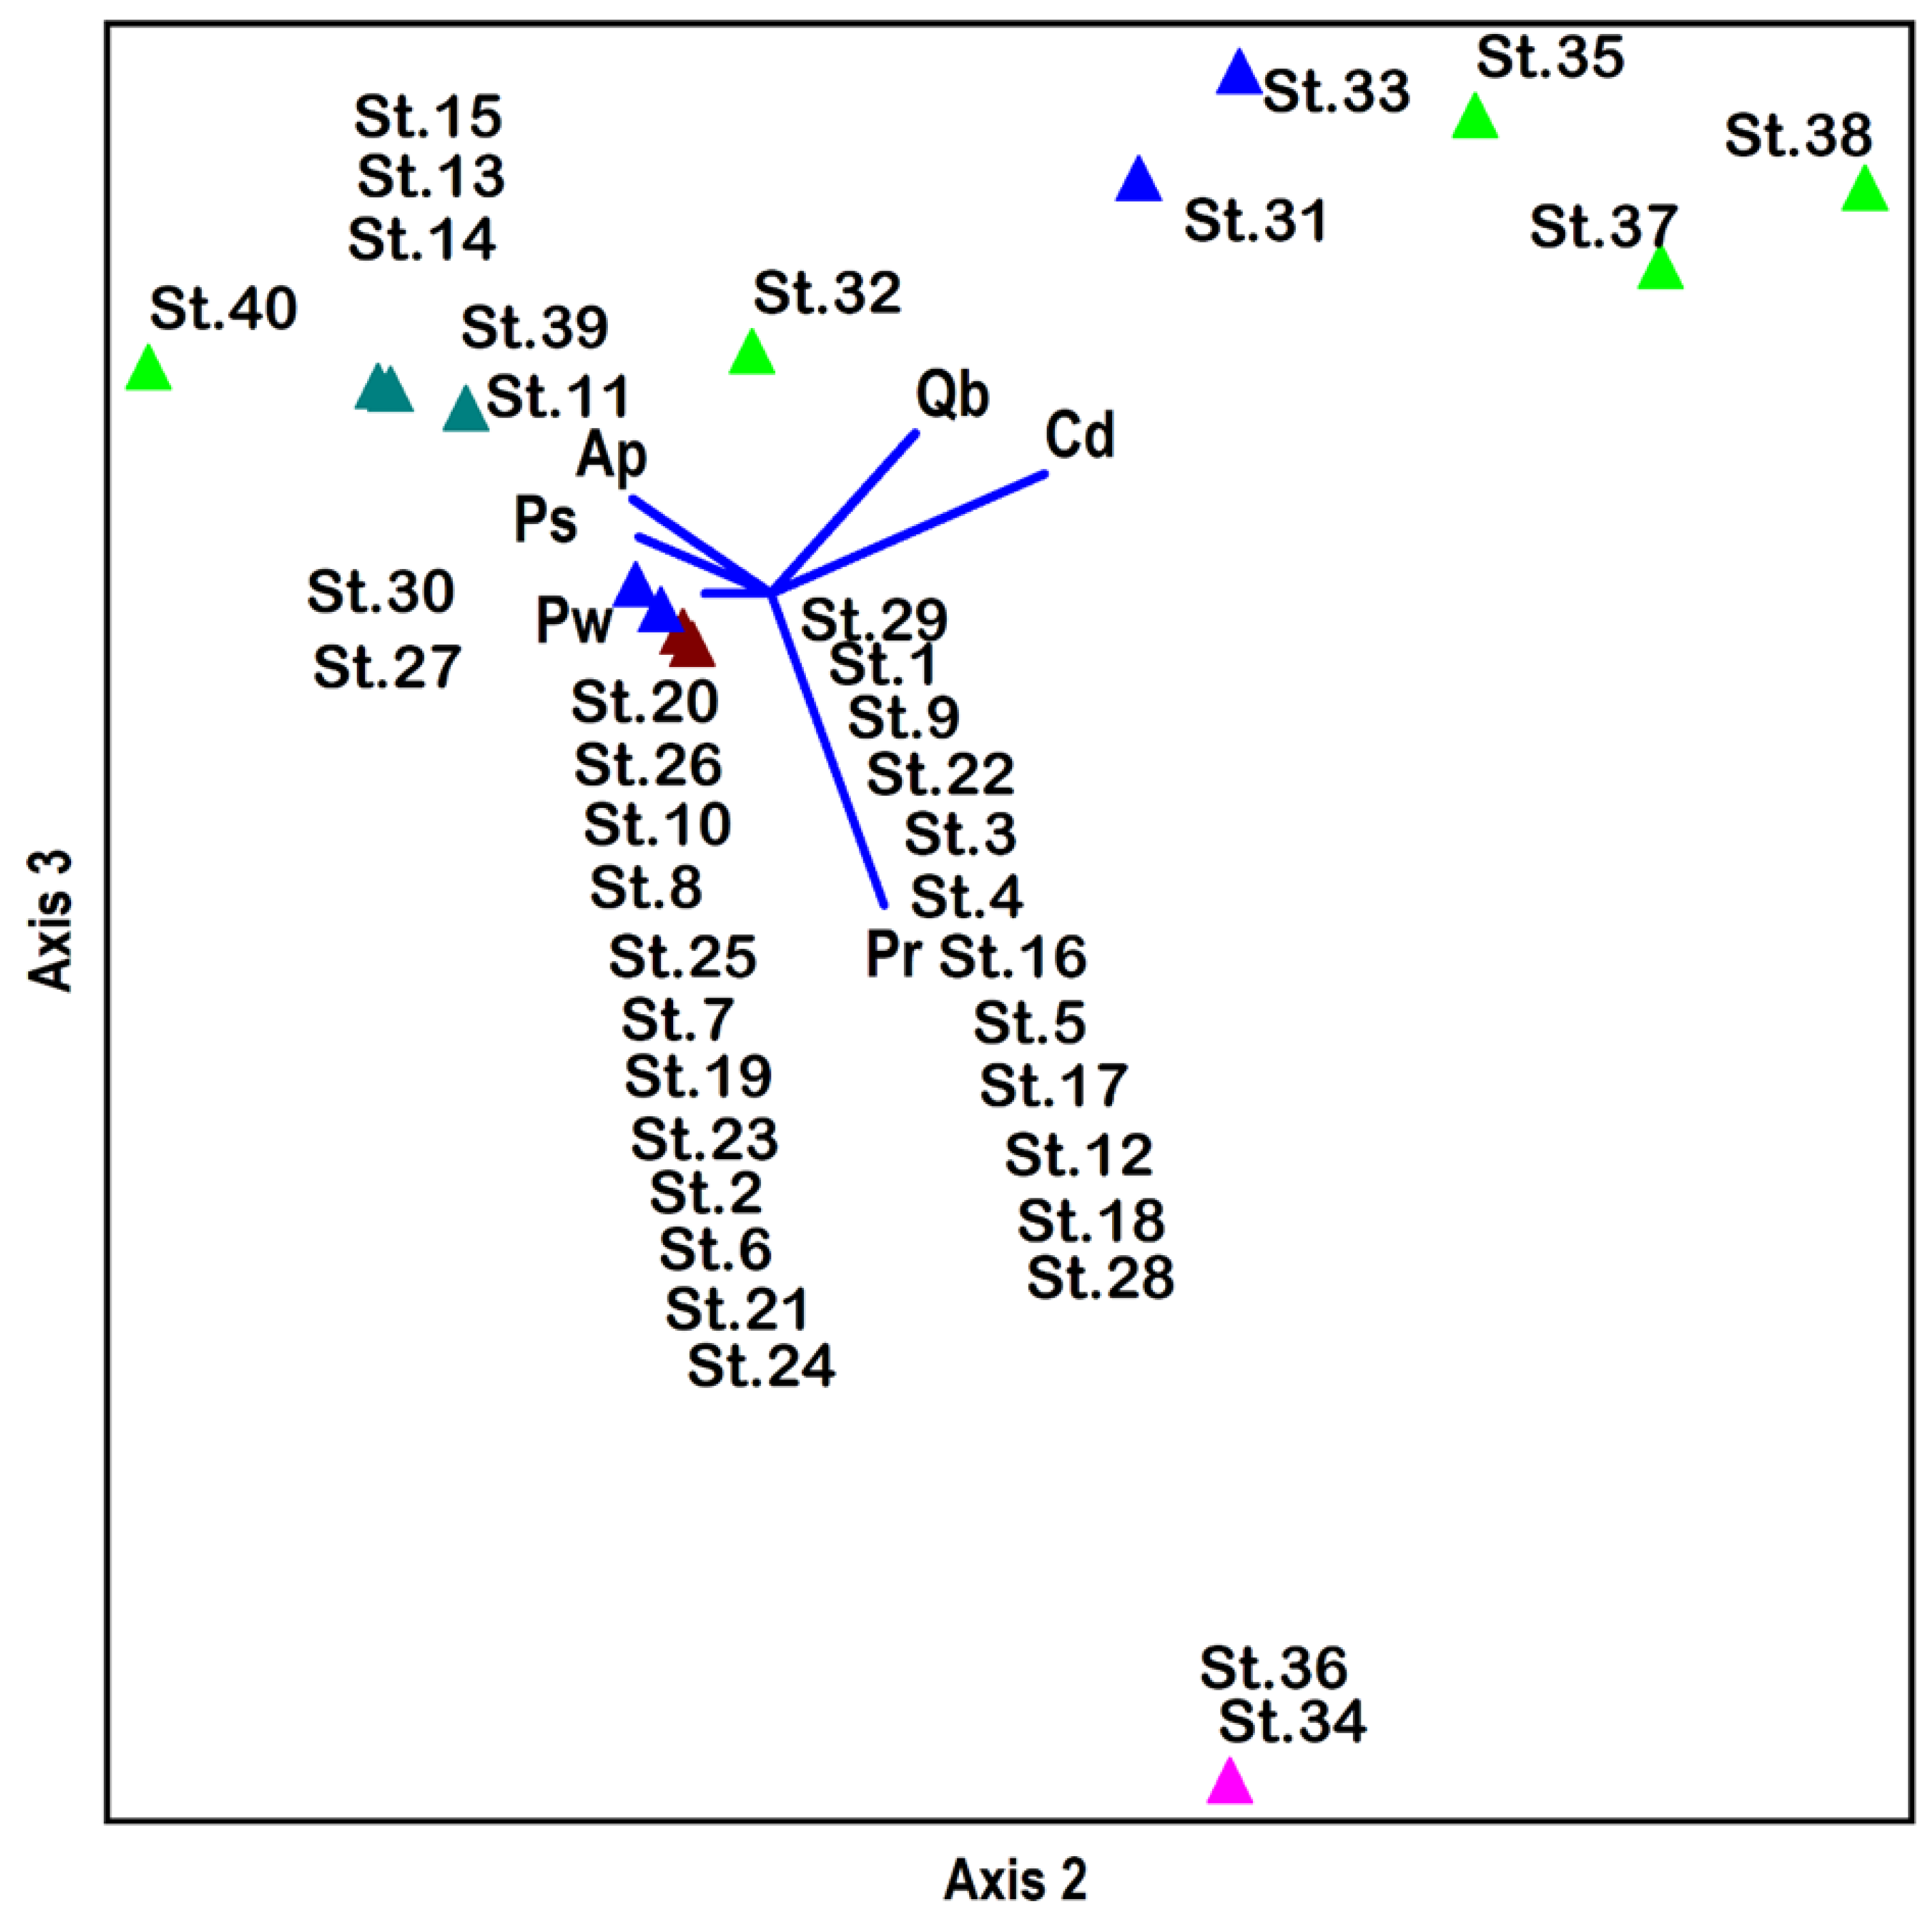
PCA was used to determine the different soil factors, i.e., topographic variables (elevation and slope), edaphic factors, soil physical properties, and soil nutrients, and the importance value index of the tree species (Table 4). Four major groups were isolated by Ward’s cluster analysis and superimposed on the PCA ordination with axis 1 and 2, 1 and 3, and 2 and 3 (Figure 3). The analyses showed no overlapping among the groups in the two axes of 1,2 and 1,3, whereas axis 2,3 showed little overlap. The largest group among all four groups was group 1, showing 28 stands. This group contained three subgroups, i.e., group I (a), group I (b), and group I (c), showing different cospecies compositions. Pinus wallichiana was the main dominant species in the three subgroups. Group I was separated on all axes. This group was present on the three axes of 1–2, 1–3, and 2–3.
Table 4.
The correlation coefficients of environmental variables (topographic variables, edaphic variables, soil texture, and soil nutrients) with 3 PCA ordination axes obtained by tree vegetation data.
Figure 3.
PCA stand ordination based on IVI of tree species from the Shangla district, Pakistan. The floristic composition/group obtained from Ward’s cluster analysis were super imposed on ordination axes. The different colors in the above ordination plan indicate different groups. (St indicates different stands in groups of vegetation.)
Group I (a) consisted of 21 stands mainly containing Pinus wallichiana, which was the only species there. The elevation and slope angles of this group were 1953.1 ± 69.7 m and 39.05 ± 1.41, respectively. Group I (b) was composed of three stands containing Abies pindrow as the codominant species. The average elevation of this group was 2203.3 ± 29 m, with a 38.33 ± 4.4° slope angle. Group I (c) was composed of four stands. This subgroup contained two species: Abies pindrow and Quercus baloot. This group was found on a 2171.5 ± 35 m average elevation and a 30.8 ± 3.3° average slope angle. Group II was composed of five stands with Abies pindrow the dominant tree, while Picea smithiana was codominant. This group was found on the highest elevation (2691.2 ± 47) with a slope angle of 34.0 ± 7.4. Group III was composed of five stands dominated by Cedrus deodara. The codominant species were Pinus wallichiana, Picea smithiana, and Abies pindrow. In this group, one angiosperm, Quercus baloot, was also recorded. This group was located on an average elevation of 2188.0 ± 76, with a 38.2 ± 4° slope angle. Group IV was the smallest group, which was separated based on their monospecific position. In this group, two stands, i.e., 34 and 36, were recorded as pure Pinus roxburghii stands. The lowest average elevation was recorded as 1374.5 ± 76.5 m, with a 35 ± 5° average slope angle. This group was represented only in the subtropical condition.
3.4. Relationship (Correlation Coefficients) of Three Ordination Axes with Environmental Variables
The correlation between the PCA ordination of the three axes with different environmental variables are shown in (Table 4). Axis 1 was significantly correlated with elevation (p < 0.05) and silt (p < 0.05), while the other environmental factors did not show a significant correlation. Axis 2 ordination showed a significant correlation (p < 0.005) with silt, whereas no correlation was observed with the other environmental factors. Ordination on axis 3 was a highly significant correlation (p <0.001) on the elevation and a significant correlation between the maximum water-holding capacity and soil moisture, while the other environmental variables did not show a significant correlation.
3.5. Understory Vegetation Data
Ward’s Cluster Analysis of Stands
Based on frequency, Ward’s cluster dendrogram distributed the understory vegetation into four groups (Figure 4). Table 5 lists the average frequency of these four groups, while Table 6 presents their environmental factors.
Figure 4.
Ward’s cluster analysis of the understory vegetation based on frequency. The understory species indicates five distinct groups. (St indicates different stands in groups of vegetation.)
Table 5.
Average frequency of the understory vegetation of four main groups was derived from Ward’s cluster analysis.
Table 6.
Mean values ± SE of environmental variables based on four groups derived from Ward’s cluster analysis using understory vegetation data of 40 stands.
Group I is the largest group among the groups and was divided into two subgroups, Group I (A) and Group I (B), as follows.
Group I (A) contained a large understory vegetation group composed of eleven stands and twenty-nine tree species. Among these species, Digeteria sanguinalis, Fragaria nubicola, Verbascum Thapsus, and Pinus wallichiana seedlings showed a 40% average frequency, which are the dominant species recorded in these stands. Asplenium ceterach was the second dominant species and showed a 37.5% average frequency. Urtica dioica, with a 15% average frequency, was recorded as a rare species in this group. Based on the topographic characteristics, this group was recorded at 2062.73 ± 17 m mean elevation with a 38.18 ± 2.6° mean slope angle. In the edaphic factors, the water-holding capacity was highest (11.49 ± 0.6). The recorded mean salinity and organic matter were 0.5 ± 0.0 and 0.5 ± 0.04, respectively. The sand, silt, and clay contents were 51.33 ± 3.5%, 37.2 ± 3.8%, and 11.47 ± 2.2%, respectively.
Group I (B) contained eight stands composed of 25 species. Among these species, 22 were common, and the leading species was Polygonatum multiflorium, with a 45% average frequency. Fragaria nubicola was the second dominant species, with a 40% average frequency. Other species, such as Impaliense braclycenera (36.6%), Corbichonia decumbers (35%), and Solanum nigrum (35%), were occasional species, while Launaea procum (15%) was a rare species. According to the environmental variables, this group has a 2249.5 ± 28.9 m elevation and a 36.13 ± 2.5° mean steep slope. The sand, silt, and clay contents were 51.5 ± 3.6, 37.23 ± 3.5, and 11.28 ± 1.2%, respectively.
Group II was the second largest group of understory vegetation and contained eight stands with 25 different species of ground flora. Sixteen of these species were common in group I (a) and group I (b). Tagetis minuta was the dominant species in this group, with a 55% average frequency. Phragmites karka had a 50% average frequency and ranked second. Solanum nigrum was a rare species with a 20% average frequency. This group showed the highest elevation (2645.75 ± 37.01 m), with a mean slope angle of 36.25 ± 4.6°. Among the edaphic variables of this group, this group had the highest water-holding capacity (14.24 ± 1.24). The salinity and organic matter of this group were 0.05 ± 0.01 and 0.49 ± 0.07%, respectively. The sand, silt, and clay contents were 48.78 ± 2.7, 35.3 ± 2.6, and 15.93 ± 3.1, respectively.
Group III consisted of six stands and 18 species and was considered the smallest group. The group was dominated by Fragaria nubicola, representing a 45% average frequency. Twelve species were common with group I (a) and group I (b), whereas thirteen species that occurred in this group were also recorded in group II. Asplenium ceterach was the second dominant species in this group, with a 36% average frequency. Digeteria sanguinalis was a rare species, with a 17.5% average frequency in this group. With respect to the environmental variables, this group was characterized by a very low elevation (1509.83 ± 52 m) and mean slope (34.17 ± 2.01°). The edaphic variables showed a water-holding capacity of 11.68 ± 1.7, which was similar to group I (a), while the salinity and organic matter mean values were 0.06 ± 0.02 and 0.55 ± 0.2, respectively, which was similar to group I (a) and group I (b).
Compared to the other groups, sand was the lowest (44.73 ± 5.9), whereas silt had the highest value (40.93 ± 5.3). Clay was calculated as 14.33 ± 3.3, which was different from the other groups.
Group IV consisted of seven stands and 24 species of ground flora. Among these species, only five were common in all four groups from the cluster analysis. Anaphalis scopulosa was the dominant species in this group, with a 47.5% average frequency. The codominant species was Adiantum venustum, with a 45% frequency, while Cannabis sativa had a 37.5% average frequency. Drypteris stewartii and Launaea procum were rare species, with a 15% average frequency. The results of the environmental variables group showed that this group was characterized by an average elevation (1792.14 ± 19 m) with the highest mean steep slope of 40.71 ± 2.5°. The water-holding capacity was 12.86 ± 0.7, whereas the salinity and organic matter were 0.07 ± 0.01 and 0.71 ± 0.15, respectively. The sand of this group was 51.34 ± 3.9, similar to group I (A and B). The recorded silt was 32.57 ± 3.2%, while the clay was 16.09 ± 3.4%, the highest among all groups.
3.6. Univariate Analysis of Variance (ANOVA)
The results of the different environmental variables of the understory vegetation of the four main groups derived from Ward’s cluster analysis were examined by ANOVA (Table 7). The results showed that, of the topographic variables, elevation showed a significant (p < 0.001) correlation, while slope showed no relationship. The other environmental variables did not significantly correlate with the understory species.
Table 7.
Analysis of variance of individual environmental variables (topographic, edaphic, and soil texture) derived by Ward’s cluster analysis using understory vegetation data.
3.7. Stand Ordination of the Understory Vegetation Data
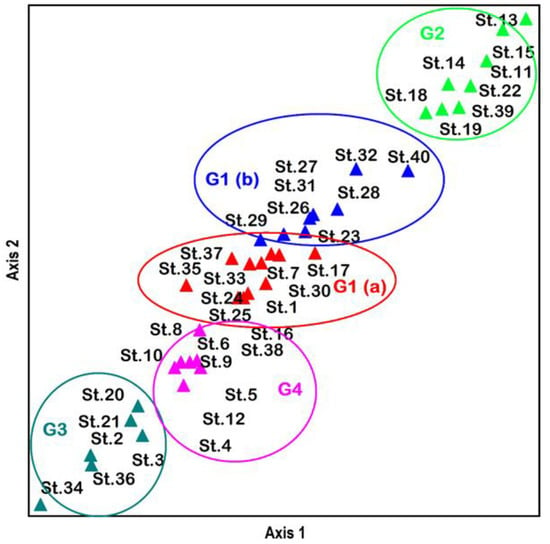
Two-dimensional nonmetric multidimensional scaling (NMS) ordination divided the understory species into four distinct groups (Figure 5). A continuous pattern appeared to exist between axes 1 and 2. Groups 1 (A) and 1 (B) were located on the top of the ordination axes, whereas group 2 was slightly lower. Groups 3 and 4 were located on the extreme lower middle side of the ordination plan, indicating differences in species composition and environmental variables.
Figure 5.
NMS stand ordination of the understory species, based on the frequency from the Shangla district, Pakistan. The four distinct groups (G1–G4) and the subgroup (G1a) obtained from Ward’s cluster analysis of understory species were clearly imposed on ordination plan. (St indicates different stands in groups of vegetation.)
Relationship (correlation coefficient) between the NMS ordination axis and the environmental variables of the understory vegetation data.
Table 8 lists the results of the environmental factors with the ordination axis. The topographic and edaphic factors of elevation, with a significant correlation with axis 1 (p < 0.001) and axis 2 (p < 0.001), of the NMS ordination are shown. The other environmental factors did not exhibit a significant relationship.
Table 8.
Relationship (correlation coefficient) of the environmental variables with two axes of NMS ordination based on understory vegetation.
4. Discussion
Multivariate techniques (i.e., classification and ordination) were conducted on tree and understory vegetation of 40 forest stands in the Shangla area. Ordination and cluster analyses have important advantages. They can yield corresponding results and provide deeper explanations of the ecological data, as reported by [35]. Frades and Matthiesen [36] reported that the cluster analysis approach is a quantitative and objective detailed categorization technique. Environmental factors play an essential role in understanding the vegetation pattern. The elevation is an environmental factor that could be considered a critical factor in understanding vegetation patterns distribution, as suggested by Lovett et al. [37] and Gajoti et al. [38]. Zhang et al. [39] reported that the vegetation distribution pattern is a basic tool for evaluating and managing forests. Other researchers investigated quantitative separation to illustrate the influence of environmental factors on the layers of plant communities and their distribution patterns [39]. Indeed, natural communities are distributed continuously and usually contain different plant communities at several succession stages related to environmental factors.
4.1. Classification
According to Ward’s cluster analysis, the classified groups obtained from tree vegetation and understory vegetation data were associated with several factors, including topographic, edaphic, and soil physical parameters. In general, the results of classification and ordination, alongside the environmental variables, have improved the understanding of the vegetation communities and their locations in the study area. In the current investigation, the sequence of the natural vegetation of tree and understory communities could be explained in terms of several environmental characteristics. The vegetation groups found in the cluster analysis were almost dominated by a single species, and sometimes by two species. Group I (a) was composed of 21 stands dominated by a single species, Pinus wallichiana, showing a 100% average importance value, and was the largest group in this study. This group had an average elevation of 1953.1 ± 70 m and the highest slope angle (39.05 ± 1.4). A Pinus wallichiana pure community was reported by Ahmed, Tareen, and Tareen [13] from different climatic zones of Himalayan forests in Pakistan. They described a pure Pinus wallichiana stand at an approximately 2770 m elevation from Naltar-Gilgit and a 3100 m elevation from Takht-e-Suleiman. Saima et al. [40] found that the Pinus wallichiana community was associated with two species, Taxus wallichiana and Abies pindrow, in the Ayubia National Park.
Ahmad et al. [41] reported that Pinus wallichiana was common in 22 forests in Pakistan at an elevation range from 1950 to 2700 m with a slope of 23° to 25°. Khan and Hussain [34] and Wahab, Moinuddin, Nasrullah, and Sarangzai [20] examined the communities of the same species in the Dir District and Chitral at approximately 1875 m and 2559 m elevations, respectively. Siddiqui, Ahmed, Shaukat, and Khan [17] reported five different Pinus wallichiana-dominated stands in the moist temperate areas of the Himalayan mountains range in Pakistan, and assumed that this species preferred to grow on relatively medium elevations of 2368 m and low slope angles of 29°. Akbar [42] described Pinus wallichiana tree forests at a 3169 m elevation with a low slope angle of 28°. Ilyas, Shinwari, and Qureshi [16] described Pinus wallichiana tree forests from temperate mountain forests in Qalagi Hills Swat. Group I (b) was composed of Abies pindrow as a codominant tree growing in three stands with an elevation of 2203.3 ± 29 m and at an average slope. Group I (c) contained four stands, with Abies pindrow and Quercus baloot growing communities, with an average elevation and slope angle. In all these subgroups, Pinus wallichiana was the main species in these groups. Pinus wallichiana shows large ecological growing areas in different climatic zones. Wahab et al. [43] found Pinus wallichiana and Cedrus deodara species naturally growing close to the Afghanistan and Pakistan border. Group II contained five stands occupied mainly by Abies pindrow and followed by Picea smithiana rec, with the highest average elevation of 2691.2 ± 47 m with a 34 ± 7.4° slope angle. Ahmed, Tareen, and Tareen [13] described Abies pindrow stands at a 3450 m elevation with a 45° slope angle in the Rama District Astore. Wahab, Moinuddin, Nasrullah, and Sarangzai [20] observed Abies pindrow stands at a 2670 m elevation in the Dir District. Siddiqui, Ahmed, Shaukat, and Khan [17] reported Abies pindrow in 21 communities in the moist temperate areas of the region of Lalazar, Naran. They assumed that Abies pindrow preferred growing at high elevations (2617 m) and at high slope angles (36°). The natural distribution of Abies pindrow trees shows that this species can grow and form communities in different climatic regions.
Group III was described in five stands containing Cedrus deodara, Pinus wallichiana, Picea smithiana, Abies pindrow, and broad-leaved species of Quercus baloot with an average elevation and slope angle. Similar communities were described by Wahab, Ahmed, and Khan [43], who reported Cedrus deodara and Pinus wallichiana communities at the Pakistan and Afghanistan border. Ahmad, Abdul, and Akbar [41] found Cedrus deodara forests from approximately 1650 m to 2770 m and at slope angles from 12° to 50°. Siddiqui, Ahmed, Shaukat, and Khan [17] reported Cedrus deodara and Pinus wallichiana natural forests in the moist temperate areas of Pakistan. Siddiqui, Ahmed, Shaukat, and Khan [17] studied the Cedrus deodara communities growing naturally in the Gol National Park, Chitral District. Siddiqui, Ahmed, Shaukat, and Khan [17] suggested that Cedrus deodara is the predominant species in the forest of the moist temperate areas of the Himalayan mountains. Group IV contained Pinus roxburghii pure stands, which was the smallest group in two different sites, with a low average elevation of 1374.5 ± 76.5 and a 35 ± 5° slope, and represented the dry condition of the area. Malik and Malik [44] reported that this species was common in the Azad Jammu and Kashmir areas. Ahmed et al. (2006) and Siddiqui, Ahmed, Shaukat, and Khan [17] observed Pinus roxburghii natural communities in the subtropical areas of Hindukush and the Himalayan mountains of Pakistan. Wahab, Moinuddin, Nasrullah, and Sarangzai [20] also reported the Pinus roxburghii natural community from the Dir District.
The understory vegetation cluster analysis revealed four significant groups. Diverse shapes were described in the vegetation of these forests, but some of them were common. The dominant species of the understory vegetation in the current study were Asplenium ceterach, Fragaria orientalis, Cenchrus penusaliformis, Fragaria nubicola, Rubus fruticosus, Digeteria sanguinalis, and Solanum nigrum. Group I was composed of two subgroups: group I (a) and group I (b). This group was predominated by Digeteria sanguinalis, Verbascum Thapsus, Fragaria nubicola, and Pinus wallichiana seedlings in group I (a), while Polygonatum multiflorium was the main plant species associated with Fragaria nubicola, commonly growing in both subgroups. Group II was composed mainly of Tagatis minuta, with a 55% average frequency, followed by the Phragmatis karka, with a 50% frequency. This group was found at the highest mean elevation of 2645.75 m. Group III was the smallest and contained Fragaria nubicola with a 45% average frequency. This group has a low mean elevation of 1509.83 m and a low slope. Group IV contained mainly Anaphalis scopulosa, with a 47.5% average frequency, a mean elevation of 1792.14 m, and the highest slope angle of 40.71°. Environmental factors, including the edaphic and photographic variables of the understory species, were common among the groups.
4.2. Ordination
Ordination techniques are commonly applied to study the relationship between the vegetation pattern composition and the gradients of the underlying environment [45,46]. Ordination might be one of the easiest methods to determine species commonly growing in areas and to associate them with other species. Furthermore, it describes how the species composition is changed in these natural communities with fluctuations of the elevation range. Two basic approaches were complementary to each other, which were classification and ordination, and could be applied to the natural communities [35]. The PCA ordination approach was used to investigate the compositional variations in the gradients of the environment in the tree vegetation ecological data from other taxonomic studies [47,48,49,50]. McCune and Mefford [51] considered PCA to be an essential and effective approach for the ordination and evaluation of the data of homogenous communities. This is mainly an Eigen analysis, in which the sum of the Eigenvalues is primarily equal to the sum of the variance of all the variables in a data set. PCA provides reasonable and true indicators of the relationship among vegetation species in natural communities. Nonmetric multidimensional scaling (NMS) was used to study the different environmental variables that correlate with the species composition of understory vegetation. The NMS is considered a true nonparametric ordination approach to identify the best-reduced space portrayal of environmental relationships. These methods are commonly used to identify possible similarities in a data set, classify the information, and order them. Kenkel [1] considered NMS a highly effective approach for evaluating data sets showing a low diversity.
The current investigations showed four separated groups of tree vegetation on ordination axes dominated by conifer species. These results might show acceptable correspondence between the ordination and cluster analysis results of the tree and understory vegetation studied. Group I was composed of three subgroups: Group I (a, b, and c). The groups were composed mainly of Pinus wallichiana, and an association with other cospecies was found on all three axes axis, 1–2, 1–3, and 2–3. These three subgroups were naturally growing on the average mean elevations of 1953, 2203, and 2171, which may provide sufficient evidence that this is the suitable elevation range and slope angle for them. Group II showed a high mean elevation of 2691 m, which is suitable for growing Abies pindrow and steep slopes. Group III, mainly composed of Cedrus deodara, was associated with Pinus wallichiana, Picea smithiana, Abies pindrow, and an angiospermic species, Quercus baloot, located on an average mean elevation (2188 m). Siddiqui, Ahmed, Shaukat, and Khan [17] also recorded Cedrus deodara on a moderate slope on all exposures equally and suggested that exposure is not a controlling factor for the existence of Cedrus deodara. Group IV was the smallest group, composed of two monospecific stands with a very low mean elevation of 1374 m. Similarly, four main groups of tree vegetation were derived for understory vegetation based on the nonmetric multidimensional scaling (NMS) ordination technique. These four groups were superimposed on two axes, plotted between axes 1 and 2, showing a continuous pattern among these axes.
In the present study, environmental variables with PCA ordination showed that elevation is significantly (p < 0.05) associated with axis 1 and highly significant (p < 0.001) with axis 3 of tree vegetation, and a highly significant (p < 0.001) correlation showed in the understory vegetation with the NMS ordination. Siddiqui, Ahmed, Shaukat, and Khan [17] also calculated a highly significant correlation on axis 1 with the DCA ordination of the tree and axis 3 (in the understory vegetation). Khan [21] reported a significant correlation on axis 1 with the DCA ordination of tree vegetation and axis 1 and 3 of the understory vegetation from the Chitral District. Wahab, Moinuddin, Nasrullah, and Sarangzai [20] reported a significant correlation of elevation in all three axes of tree vegetation and axis 1 of the understory vegetation from the Dir District when applying the NMS ordination. Akbar [42] reported a significant correlation of elevation for the understory vegetation in axis 1 with the DCA ordination. Their results agreed with these findings. Holdridge [52] and García [53] showed that elevation has a great extent of control in climatic conditions, particularly in temperature and precipitation. They also observed that an increase in altitude causes a decrease in temperature, water-holding capacity, soil fertility, and plant cover. Ver Hoef et al. [54] revealed a correlation with vegetation on ordination axes and suggested that the elevation and study area are the first two factors regulating the vegetation composition. In other environmental variables, the maximum water-holding capacity and soil moisture showed significant correlation on axis 3 in the tree vegetation data; similarly, in the soil texture, silt had a significant correlation in axes 1 and 2.
5. Conclusions
As a part of the moist temperate forests of Pakistan, the tree association groups were similar to the other findings in Pakistan. On the other hand, there is a considerable difference among the groups of the understory vegetation. Despite some disturbances, the classification and ordination showed a similar association of the tree species, which are the controlling agent of the environment of the Shangla forests. Moreover, in these natural mature forests, elevation and soil moisture play an essential role in determining the association. These forests provide a better environment, carbon storage, biodiversity, and other resources to the local population. These forests should be maintained and used sustainably. In the future, seedling growth, regeneration patterns, and health status should be carried out to protect and manage these forests.
Author Contributions
Conceptualization and methodology, J.I., N.S., M.A., W.Z. and A.K.; software, validation, and formal analysis, D.O.E.-A., H.S., H.O.E. and S.P.; investigation, resources, and data curation, J.I., N.S., M.A., W.Z. and A.K.; writing—original draft preparation, writing—review and editing, visualization, supervision, project administration, and funding acquisition, S J.I., N.S., M.A., W.Z., A.K., D.O.E.-A., H.S., H.O.E. and S.P.; visualization, methodology, and writing—review and editing, W.Z. and A.A. All authors have read and agreed to the published version of the manuscript.
Funding
This research was funded by King Saud University (RSP-2021/118).
Institutional Review Board Statement
Not applicable.
Informed Consent Statement
Not applicable.
Data Availability Statement
Not applicable.
Acknowledgments
The authors extend their deep appreciation to the Researchers Supporting Project number (RSP-2021/118), King Saud University, Riyadh, Saudi Arabia. The authors acknowledge Precision Agriculture Laboratory, Department of Pomology, Faculty of Agriculture (El-Shatby), Alexandria University.
Conflicts of Interest
The authors declare no conflict of interest.
References
- Kenkel, N.C. The personal computer as a tool for data analysis in population and community ecology. Abstr. Bot. 1986, 10, 79–86. [Google Scholar]
- Austin, M.P.; Belbin, L.; Meyers, J.A.; Doherty, M.D.; Luoto, M. Evaluation of statistical models used for predicting plant species distributions: Role of artificial data and theory. Ecol. Model. 2006, 199, 197–216. [Google Scholar] [CrossRef] [Scilit]
- Shaukat, S.S.; Qadir, S.A. Multivariate analysis of the vegetation of calcarious hills around Karachi. Vegetatio 1971, 23, 235–253. [Google Scholar] [CrossRef] [Scilit]
- Ahmed, M. Multivariate analysis of the vegetation around Skardu. Agri. Pak. 1976, 26, 177–187. [Google Scholar]
- Moinuddin, A. Vegetation of some foothills of Himalayan range in Pakistan. Pak. J. Bot. 1986, 18, 261–269. [Google Scholar]
- Enright, N.J.; Miller, B.P. Livestock grazing impacts on desert vegetation, Khirthar National Park, Pakistan. Rangel. Ecol. Manag. 2007, 60, 680–684. [Google Scholar] [CrossRef] [Scilit]
- Manghwar, H.; Hussain, A. Mechanism of tobacco osmotin gene in plant responses to biotic and abiotic stress tolerance: A brief history. Biocell 2022, 46, 623. [Google Scholar] [CrossRef] [Scilit]
- Manghwar, H.; Hussain, A.; Ali, Q.; Liu, F. Brassinosteroids (BRs) role in plant development and coping with different stresses. Int. J. Mol. Sci. 2022, 23, 1012. [Google Scholar] [CrossRef] [Scilit]
- Manghwar, H.; Hussain, A.; Ali, Q.; Saleem, M.H.; Abualreesh, M.H.; Alatawi, A.; Ali, S.; Munis, M.F.H. Disease severity, resistance analysis, and expression profiling of pathogenesis-related protein genes after the inoculation of Fusarium equiseti in wheat. Agronomy 2021, 11, 2124. [Google Scholar] [CrossRef] [Scilit]
- Manghwar, H.; Hussain, A.; Ullah, A.; Gul, S.; Shaban, M.; Khan, A.H.; Ali, M.; Sani, S.G.A.S.; Chaudhary, H.J.; Munis, M.F.H. Expression analysis of defense related genes in wheat and maize against Bipolaris sorokiniana. Physiol. Mol. Plant Pathol. 2018, 103, 36–46. [Google Scholar] [CrossRef] [Scilit]
- Naz, H.S.; Gul, S.; Chaudhary, H.J.; Munis, M.F.H. First report of Rhizopus oryzae causing fruit rot of Citrus medica L. in Pakistan. J. Plant Pathol. 2015, 97, 215. [Google Scholar]
- Shaukat, S.S.; Uddin, M. An application of canonical correlation and principal component analysis to the study of desert environment. Abstr. Bot. 1989, 13, 17–45. [Google Scholar]
- Ahmed, M.; Tareen, R.; Tareen, K. Vegetation ordination of Chilton in Balochistan. Mod. Trends Plant Sci. Res. Pak. 1987, 39–43. [Google Scholar]
- Hussain, F.; Ahmed, M.; Shaheen, G.; Durrant, M.J. Phytosociology of the vanishing tropical deciduous forest in district Swabi, Pakistan. II. Ordination. Pak. J. Bot. 1994, 26, 149–160. [Google Scholar]
- Ahmad, S.S.; Fazal, S.; Valeem, E.E.; Khan, Z.I.; Sarwar, G.; Iqbal, Z. Evaluation of ecological aspects of roadside vegetation around Havalian city using multivariate techniques. Pak. J. Bot 2009, 41, 53–60. [Google Scholar]
- Ilyas, M.; Shinwari, Z.K.; Qureshi, R. Vegetation composition and threats to the montane temperate forest ecosystem of Qalagai hills, Swat, Khyber Pakhtunkhwa, Pakistan. Pak. J. Bot. 2012, 44, 113–122. [Google Scholar]
- Siddiqui, M.F.; Ahmed, M.; Shaukat, S.S.; Khan, N. Advanced multivariate techniques to investigate vegetation-environmental complex of pine forests of moist temperate areas of Pakistan. Pak. J. Bot 2010, 42, 267–293. [Google Scholar]
- Siddiqui, M.F.; Shaukat, S.S.; Ahmed, M.; Khan, N.; Khan, I.A. Vegetation-Environment relationship of conifer dominating forests of moist temperate belt of Himalayan and Hindukush regions of Pakistan. Pak. J. Bot 2013, 45, 577–592. [Google Scholar]
- Rashid, A.; Swati, M.F.; Sher, H.; Al-Yemeni, M.N. Phytoecological evaluation with detail floristic appraisal of the vegetation arround Malam Jabba, Swat, Pakistan. Asian Pac. J. Trop. Biomed. 2011, 1, 461–467. [Google Scholar] [CrossRef] [Scilit]
- Wahab, M.; Moinuddin, A.; Nasrullah, K.; Sarangzai, A.M. A phytosociological study of pine forests from district Dir, Pakistan. Int. J. Biol. Biotechnol. 2011, 7, 219–226. [Google Scholar]
- Khan, N. Vegetation ecology and Dendrochronology of Chitral. Ph.D. Thesis, Federal Urdu University of Arts Sciences & Technology, Islamabad, Pakistan, 2011. [Google Scholar]
- Huo, H.; Feng, Q.; Su, Y.H. The influences of canopy species and topographic variables on understory species diversity and composition in coniferous forests. Sci. World J. 2014, 2014, 252489. [Google Scholar] [CrossRef] [Scilit] [PubMed]
- Ares, A.; Neill, A.R.; Puettmann, K.J. Understory abundance, species diversity and functional attribute response to thinning in coniferous stands. For. Ecol. Manag. 2010, 260, 1104–1113. [Google Scholar] [CrossRef] [Scilit]
- Spanner, M.A.; Pierce, L.L.; Peterson, D.L.; Running, S.W. Remote sensing of temperate coniferous forest leaf area index The influence of canopy closure, understory vegetation and background reflectance. Remote Sens. 1990, 11, 95–111. [Google Scholar] [CrossRef] [Scilit]
- Cottam, G.; Curtis, J.T. The use of distance measures in phytosociological sampling. Ecology 1956, 37, 451–460. [Google Scholar] [CrossRef] [Scilit]
- Dahdouh-Guebas, F.; Koedam, N. Empirical estimate of the reliability of the use of the Point-Centred Quarter Method (PCQM): Solutions to ambiguous field situations and description of the PCQM+ protocol. For. Ecol. Manag. 2006, 228, 1–18. [Google Scholar] [CrossRef] [Scilit]
- de Lucena, R.F.P.; de Medeiros, P.M.; de Lima Araújo, E.; Alves, A.G.C.; de Albuquerque, U.P. The ecological apparency hypothesis and the importance of useful plants in rural communities from Northeastern Brazil: An assessment based on use value. J. Environ. Manag. 2012, 96, 106–115. [Google Scholar] [CrossRef] [Scilit]
- Eaton, S.V. Physical Properties of Soil. Bot. Gaz. 1931, 380. [Google Scholar]
- Dean, W.E. Determination of carbonate and organic matter in calcareous sediments and sedimentary rocks by loss on ignition; comparison with other methods. J. Sediment. Res. 1974, 44, 242–248. [Google Scholar]
- Jackson, M.L. Soil Chemical Analysis; Constable and Co. Ltd.: London, UK, 1962. [Google Scholar]
- McCune, B.; Grace, J.B.; Urban, D.L. Analysis of Ecological Communities; MjM software design: Gleneden Beach, OR, USA, 2002; Volume 28. [Google Scholar]
- Minchin, P.R. An evaluation of the relative robustness of techniques for ecological ordination. In Proceedings of the Theory and Models in Vegetation Science: Proceedings of Symposium, Uppsala, Sweden, July 8–13, 1985; Prentice, I.C., van der Maarel, E., Eds.; Springer Netherlands: Dordrecht, Holand, 1987; pp. 89–107. [Google Scholar]
- Tansley, A.G.; Chipp, T.F. Aims and Methods in the Study of Vegetation; White friars Press: London, UK, 1926. [Google Scholar]
- Khan, M.; Hussain, F. Classification and ordination of vegetation in Tehsil Takht-e-Nasrati, District Karak, Khyber Pakhtunkhawa, Pakistan. J. Ecol. Nat. Environ. 2013, 5, 30–39. [Google Scholar] [CrossRef] [Scilit]
- Greig-Smith, P. Quantitative Plant Ecology, 3rd ed.; Black-Well Scientific Publications: London, UK, 1983. [Google Scholar]
- Frades, I.; Matthiesen, R. Overview on techniques in cluster analysis. Bioinform. Methods Clin. Res. 2010, 593, 81–107. [Google Scholar]
- Lovett, J.C.; Clarke, G.P.; Moore, R.; Morrey, G.H. Elevational distribution of restricted range forest tree taxa in eastern Tanzania. Biodivers. Conserv. 2001, 10, 541–550. [Google Scholar] [CrossRef] [Scilit]
- Gajoti, T.E.; Haciyev, V.; Javanshir, A.; Nosrati, H.; Haghighi, A.R.; Eimanifar, A.; Stewart, N., Jr. Vegetation analysis of Sutan-Chay Basin in Arasbaran. Am. J. Agric. Biol. Sci. 2010, 5, 357–362. [Google Scholar] [CrossRef] [Scilit]
- Zhang, Z.L.; He, Y.Q.; Pang, H.X. Variation of glaciers in response to ENSO in the Mount Yulong. J. Glaciol Geogryology 2004, 26, 294–297. [Google Scholar]
- Saima, S.; Dasti, A.A.; Hussain, F.; Wazir, S.M.; Malik, S.A. Floristic compositions along an 18-km long transect in Ayubia National Park district Abbottabad, Pakistan. Pak. J. Bot. 2009, 41, 2115–2127. [Google Scholar]
- Ahmad, S.S.; Abdul, W.; Akbar, K.F. Multivariate classification and data analysis of vegetation along motorway (M-2), Pakistan. Pak. J. Bot. 2010, 42, 1173–1185. [Google Scholar]
- Akbar, M. Forest Vegetation and Dendrochronology of Gilgit, Astore and Skardu Districts of Northern Areas (Gilgit-Baltistan), Pakistan. Ph.D. Thesis, Federal Urdu University of Arts, Science & Technology, Islamabad, Pakistan, 2013. [Google Scholar]
- Wahab, M.; Ahmed, M.; Khan, N. Phytosociology and dynamics of some pine forests of Afghanistan. Pak. J. Bot. 2008, 40, 1071–1079. [Google Scholar]
- Malik, N.Z.; Malik, Z.H. Present status of subtropical chir pine vegetation of Kotli Hills, Azad Jammu and Kashmir. J. Res. Sci. 2004, 15, 85–90. [Google Scholar]
- Ali, S.M.; Malik, R.N. Spatial patterns of vegetation with underlying soil properties prevailing along drain side areas in Islamabad City. Pak. J. Bot. 2010, 42, 2397–2410. [Google Scholar]
- Bai, X.; Sadia, S.; Yu, J. Community composition and structure along the environmental gradients of Larix gmelinii forest in northeast China. Pak. J. Bot. 2021, 53, 1845–1850. [Google Scholar] [CrossRef] [Scilit]
- Ullah, F.; Gao, Y.; Sari, İ.; Jiao, R.; Saqib, S.; Gao, X. Macro-Morphological and Ecological Variation in Rosa sericea Complex. Agronomy 2022, 12, 1078. [Google Scholar] [CrossRef] [Scilit]
- Tabaripour, R.; Keshavarzi, M.; Ullah, F. Micromorphological characters variation of lemma and palea in subtribe of Loliinae (Poaceae). Microsc. Res. Tech. 2022, 85, 117–134. [Google Scholar] [CrossRef] [Scilit] [PubMed]
- Ullah, F.; Ayaz, A.; Saqib, S.; Parmar, G.; Bahadur, S.; Zaman, W. Taxonomic implication of leaf epidermal anatomy of selected taxa of Scrophulariaceae from Pakistan. Microsc. Res. Tech. 2021, 84, 521–530. [Google Scholar] [CrossRef] [Scilit] [PubMed]
- Ullah, F.; Gao, Y.; Jiao, R.-F.; Gao, X.-F. Comparative taxonomic variation in fruits and seeds’ surface morphology among populations of alpine Rosa sericea complex (Rosaceae). Microsc. Res. Tech. 2021, 84, 2337–2350. [Google Scholar] [CrossRef] [Scilit]
- McCune, B.; Mefford, M.J. PC-ORD Multivariate Analysis of Ecological Data, Version 5.31; MjM Solfware Gleneden Beach: Gleneden Beach, OR, USA, 2006. [Google Scholar]
- Holdridge, L.R. Ecología Basada En Zonas De Vida; Instituto Interamericano de Cooperacion´ para la Agricultura: San Jose, Costa Rica, 1978. [Google Scholar]
- García, E. Climates of the State of Veracruz according to the climatic classification of Koppen modified by the author. An. Del Inst. De Biologia. Ser. Bot. Mex. 1970, 41, 3–41. [Google Scholar]
- Ver Hoef, J.M.; Neiland, B.J.; Glenn-Lewin, D.C. Vegetation gradient analysis of two sites in southeast Alaska. Northwest Sci. 1988, 62, 171–180. [Google Scholar]

Publisher’s Note: MDPI stays neutral with regard to jurisdictional claims in published maps and institutional affiliations. |
© 2022 by the authors. Licensee MDPI, Basel, Switzerland. This article is an open access article distributed under the terms and conditions of the Creative Commons Attribution (CC BY) license (https://creativecommons.org/licenses/by/4.0/).