


Abstract
Butylammonium acetate (BAAc) was investigated as a concentration-dependent precursor additive for inverted triple-cation perovskite solar cells based on FA0.80Cs0.07MA0.13PbI2.64Br0.39. BAAc loadings ranging from 0 to 7 mol% were systematically compared to determine how moderate and excessive additive concentrations influence film formation, defect behavior, and device operation. At 3 mol% BAAc, the mean equivalent-circle grain diameter increased from 0.508 to 0.719 μm, and the median increased from 0.495 to 0.688 μm, while cross-sectional SEM confirmed a comparable absorber thickness of 500 ± 20 nm across the series. The PbI2-to-perovskite diffraction peak height ratio decreased from 0.2691 to 0.0427, and the intensity-weighted photoluminescence lifetime increased from 230.2 to 350.0 ns. Light-intensity-dependent open-circuit voltage, impedance spectroscopy, thermal admittance spectroscopy, and space-charge-limited current measurements consistently indicated reduced trap-assisted recombination and transport loss at this concentration. In the EIS analysis, BAAc-3 showed the lowest transport resistance (222.17 ± 9.52 Ω) and the highest recombination resistance (8.211 ± 0.061 kΩ); all principal resistance parameters had relative standard errors below 10%, although systematic high-frequency residuals limit quantitative interpretation of the transport CPE. The champion BAAc-3 device reached 23.37% efficiency, compared with 20.42% for the control, and the 50-device mean increased from 19.63 ± 0.45% to 22.77 ± 0.30%. At 7 mol%, the morphological and electrical trends reversed and the champion efficiency decreased to 19.34%, which defines an over-treatment boundary. The 30-day dry–dark storage and 120 min maximum-power-point tests provide comparative, short-duration stability evidence. The concentration dependence is consistent with a literature-supported working model of precursor coordination and ammonium–halide interactions, without constituting direct spectroscopic identification of a specific complex.
1. Introduction
Since the first use of an organometal-halide perovskite as a visible-light sensitizer in 2009 [1], perovskite solar cells (PSCs) have developed rapidly as solution-processed thin-film photovoltaics [2]. Perovskite absorbers are part of a wider photovoltaic materials landscape that includes crystalline silicon wafers, oxide ceramic photoelectrodes and transport layers, and III–V semiconductor nanowire heterostructures [3,4,5,6]. Silicon remains the dominant commercial platform, whereas oxide and nanostructured semiconductor systems provide complementary routes to chemical robustness, light management, and band-structure engineering. Against this background, metal-halide perovskites are distinguished by low-temperature solution processing and compositionally tunable optoelectronic properties, although their defect-sensitive crystallization remains a central limitation. Compositional engineering has been central to this progress. Mixed formamidinium (FA), methylammonium (MA), and cesium (Cs) A-site compositions improve phase stability and processing reproducibility compared to many single-cation absorbers [7]. The inverted p–i–n architecture is attractive for its low-temperature fabrication, compatibility with tandem integration, and low current–voltage hysteresis. Buried-interface molecular hybrids, interfacial bond-strength regulation, and coordinated bulk/surface defect control have recently produced efficient inverted devices with improved operational robustness [8,9,10,11].
The photovoltaic performance of mixed-cation, mixed-halide perovskites remains sensitive to film-formation kinetics and the resulting defect landscape. Energy-level offsets and recombination at the perovskite/charge transport layer interfaces can dominate the open-circuit-voltage loss [12]. Grain boundaries provide ion-migration pathways [13], while undercoordinated Pb2+, halide vacancies, residual precursor phases, strain, and compositional heterogeneity create nonradiative recombination sites and accelerate degradation [14]. Stability data also require a clear definition of illumination, temperature, atmosphere, encapsulation, electrical bias, and test duration, as specified by the ISOS consensus framework [15].
Precursor-intermediate control offers a direct route to address these limitations. Hydrogen-bond-bridged intermediates can regulate nucleation and crystallization [16], the homogenization of out-of-plane cation distributions can suppress local compositional fluctuations [17], and the bidirectional control of nucleation and crystal growth can improve crystallinity and interfacial contact [18]. These studies show that the coordination environment before and during antisolvent extraction determines the final grain structure and defect distribution.
Ionic liquids and related protic organic salts are useful precursor modifiers because their cations and anions can be varied independently. Ionic-liquid additives have extended the stability of planar PSCs [19], and polymeric room-temperature molten salts have provided simultaneous crystallization regulation and defect passivation in inverted devices [20]. Ionic-liquid solvent engineering [21], pseudo-halide-mediated strain regulation [22], rational ionic-liquid solvent design [23], and protic ionic liquids for stable metal-halide perovskite colloids [24] further demonstrate the broad chemical space available for precursor control. Spectroscopic and computational analyses indicate that passivation depends on specific coordination and hydrogen-bonding interactions between the ionic species and undercoordinated lattice sites [25].
The size and structure of the organic cation therefore influence film formation. A systematic ionic-liquid comparison identified a size-dependent balance among precursor complexation, steric effects, and crystallization kinetics [26]. Alkylammonium passivators with different chain lengths also change molecular packing, steric hindrance, interfacial orientation, and charge extraction [27]. Moderate alkylammonium loading can support crystallization and defect passivation, whereas excessive loading favors organic-rich accumulation and electronically resistive low-dimensional motifs.
Acetate-based protic salts are especially relevant because acetate (Ac−) can coordinate Pb2+ through its carboxylate oxygen atoms, while an alkylammonium cation can interact with I− and Br− through N–H⋯X hydrogen bonds. Methylammonium acetate (MAAc) has passivated defects in CsPbIBr2 absorbers [28] and regulated crystallization in inverted triple-cation mixed-halide devices [29]. Pentylammonium acetate has also served as a multifunctional modifier in flexible PSCs [30]. The anion provides a Pb coordination site, and the alkylammonium chain controls steric demand, interfacial residence, and the risk of transport barriers.
Butylammonium acetate (BAAc) occupies an intermediate steric and hydrophobic range between MAAc and longer-chain ammonium acetates. BAAc-mediated interfacial-energy regulation has been associated with shallower grain-junction grooves and improved nanoscale cross-grain cation homogeneity in FA–Cs perovskites [31]. BAAc has also been incorporated into FAPbI3 precursors to regulate film growth and passivate defects [32]. These reports establish the chemical relevance of BAAc and indicate that its optimum concentration depends on absorber composition, substrate interface, solvent coordination, antisolvent kinetics, and thermal history.
The FA0.80Cs0.07MA0.13PbI2.64Br0.39 absorber was selected as a reproducible MA/Br-containing triple-cation baseline that allows direct comparison with the previously reported MAAc strategy in an inverted device [29]. The retained MA fraction provides a defined reference for evaluating how the longer butylammonium cation changes the useful additive window, while the FA-rich composition preserves the absorption and phase-stability advantages of mixed A-site formulations. Related studies further show that antisolvent processing and the PTAA-based buried interface strongly influence crystallization and optical coupling [33,34]; these parameters were therefore kept unchanged throughout the concentration series.
The present work does not claim the first use of BAAc or a record device efficiency. Its specific contribution is the concentration-resolved identification of a beneficial window and an over-treatment boundary for BAAc in an inverted, mixed-halide triple-cation architecture. In contrast to the earlier FAPbI3 study, six BAAc loadings are correlated with morphology, diffraction, optical decay, device-level recombination, energetic trap response, 50-device statistics, and short-term stability. The comparison with MAAc is used only as a literature benchmark. Because this study resolves the BAAc concentration window rather than screening ammonium-cation identity, no cation-size or steric superiority over MAAc is claimed.
Accordingly, Ac−–Pb2+ coordination and BA+–halide hydrogen bonding are treated below as a literature-supported working hypothesis. The experimental conclusions are based on the observed concentration-dependent structural, optical, electrical, and photovoltaic trends rather than on a claim that a specific coordination complex was directly identified.
Here, BAAc loadings of 0, 1, 2, 3, 5, and 7 mol% relative to the methylammonium content were evaluated in inverted FA0.80Cs0.07MA0.13PbI2.64Br0.39 devices. The samples are denoted control, BAAc-1, BAAc-2, BAAc-3, BAAc-5, and BAAc-7. Section 2 describes materials, precursor preparation, device fabrication, and characterization. Section 3.1 discusses the proposed interactions and concentration-dependent film formation; Section 3.2 analyzes optical and electrical defect indicators; and Section 3.3 presents photovoltaic statistics, EQE, and stability. Section 4 summarizes the effective concentration window, limitations, and future directions.
2. Materials and Methods
2.1. Materials and Precursor Preparation
Formamidinium iodide (FAI, 99.99%), cesium iodide (CsI, 99.99%), methylammonium bromide (MABr, 99.99%), lead (II) bromide (PbBr2, 99.99%), and lead (II) iodide (PbI2, 99.99%) were obtained from Advanced Electron Technology (Dongguan, China). Poly[bis(4-phenyl)(2,4,6-trimethylphenyl)amine] (PTAA), [6,6]-phenyl-C61-butyric acid methyl ester (PC61BM), 2,3,5,6-tetrafluoro-7,7,8,8-tetracyanoquinodimethane (F4-TCNQ), and 4,7-diphenyl-1,10-phenanthroline (Bphen) were obtained from Nichem Fine Technology Co., Ltd. (Taiwan, China). Polymethyl methacrylate (PMMA, 2.0–4.0 mPa s) was obtained from TCI (Tokyo, Japan). BAAc (99.5%) was supplied by Xi’an Bailete (Xi’an, China). N,N-Dimethylformamide (DMF), N-methyl-2-pyrrolidone (NMP), 2-butanol, chlorobenzene, ethyl acetate, ethanol, acetone, and isopropanol were purchased from Sigma-Aldrich (Shanghai, China).
The perovskite precursor was prepared by dissolving FAI (285.5 mg), CsI (36.4 mg), MABr (29.1 mg), PbI2 (802.1 mg), and PbBr2 (95.42 mg) in 0.87 mL DMF and 0.13 mL NMP. The mixture contained approximately 2.00 mmol total Pb and had the molar ratios FAI:CsI:MABr:PbI2:PbBr2 = 0.830:0.070:0.130:0.870:0.130 relative to total Pb. The total Pb concentration was 2.0 M. The slight excess of organic/alkali halides was retained for all formulations. The preparation process of the battery components is detailed in Table 1.
Table 1.
Preparation and processing parameters used for the BAAc concentration series.
BAAc was added at 0, 1, 2, 3, 5, and 7 mol% relative to the methylammonium content. A calibrated BAAc stock solution in DMF/NMP was used to maintain the same final precursor volume, solvent ratio, and Pb concentration across the series. BAAc was treated as a processing additive and was not included in the nominal A-site stoichiometry.
2.2. Device Fabrication
Inverted devices were fabricated with the architecture glass/ITO/PTAA:F4-TCNQ/PMMA/perovskite/PC61BM/Bphen/Ag. Patterned ITO-coated glass substrates were sequentially ultrasonicated in deionized water, acetone, and isopropanol; dried with compressed gas; and treated with UV–ozone for 15 min. PTAA:F4-TCNQ solution, prepared by dissolving 20 mg PTAA and 1 mg F4-TCNQ in 4 mL chlorobenzene, was spin-coated at 4000 rpm for 30 s and annealed at 100 °C for 2 min. PMMA (0.2 mg mL−1 in ethyl acetate) was then spin-coated at 4000 rpm for 20 s and annealed at 100 °C for 1 min. The ultrathin PMMA layer was used as a fixed buried-interface modifier to improve wetting of the hydrophobic PTAA surface and suppress interfacial defect-assisted recombination [35]. The cross-sectional SEM did not resolve PMMA as a separately measurable stratum; therefore, no absolute thickness is assigned. Its solution composition and deposition conditions were identical for all BAAc concentrations, and no concentration-dependent effect is attributed to PMMA thickness.
The perovskite precursor was dispensed onto the PTAA:F4-TCNQ/PMMA substrate and spin-coated at 6000 rpm for 20 s. During spinning, 300 μL of 2-butanol was dropped onto the wet film at 5–6 s. The films were annealed at 100 °C for 15 min. All concentration groups were processed with the same precursor volume, antisolvent volume and timing, substrate temperature, and annealing history. After cooling, PC61BM (20 mg mL−1 in chlorobenzene) was spin-coated at 2500 rpm for 20 s, followed by Bphen (0.7 mg mL−1 in ethanol) at 6000 rpm for 20 s. A 100 nm Ag electrode was deposited by thermal evaporation through a shadow mask.
2.3. Characterization
Top-view and cross-sectional morphologies were examined using a field-emission scanning electron microscope (FEI Quanta FEG 250, Thermo Fisher Scientific, Shenzhen, China). The top-view micrographs were acquired at an accelerating voltage of 20 kV and a working distance of 9.0 mm, as recorded in the image metadata. For grain-size analysis, the 5 μm scale bar of each image was calibrated independently. The annotation and instrument-footer regions were excluded; the analysis region was converted to grayscale, Gaussian-smoothed, enhanced using a local ridge/gradient score, and segmented by a marker-controlled watershed procedure. Objects intersecting the analysis boundary and objects with equivalent-circle diameters below 0.18 μm or above 2.20 μm were excluded to suppress texture noise and abnormal merged regions. The projected area A of each retained grain was converted to an equivalent-circle diameter using D = 2(A/π)1/2. The displayed fields yielded n = 627, 340, 353, 278, 524, and 393 grains for control, BAAc-1, BAAc-2, BAAc-3, BAAc-5, and BAAc-7, respectively. Mean ± standard deviation, median, interquartile range, and coefficient of variation were calculated from the individual grain distributions.
Crystal structure was characterized using an Ultima IV X-ray diffractometer (Rigaku, Tokyo, Japan) with Cu Kα radiation (λ = 1.5406 Å). Patterns were collected over 2θ = 5–40° with a step interval of 0.02°. Peak positions, full widths at half maximum (FWHMs), integrated areas, and the PbI2/perovskite peak height ratio were compared using the same baseline and normalization procedure. The 5–12° region was examined for crystalline BA-containing reduced-dimensional phases. Considering the 0.02° acquisition interval and instrument repeatability, peak-position differences smaller than approximately 0.02° were not interpreted as lattice changes.
UV–visible absorption spectra were recorded from 400 to 900 nm using a Shimadzu UV-1780 spectrophotometer (Kyoto, Japan). The six cross-sectional SEM images show absorber thicknesses within approximately 480–520 nm; the common thickness used for optical and SCLC calculations was 500 ± 20 nm. Direct-transition Tauc plots, (αhν)2 versus hν, were fitted over the steep fundamental-absorption region immediately above the onset (approximately 1.64–1.72 eV); the sub-bandgap tail and visibly curved regions were excluded. Variation in the fitting window gave an uncertainty of approximately ±0.005 eV. Steady-state PL spectra were collected from glass/perovskite films from the air side using an OmniPL fluorescence spectrometer (Raleigh, NC, USA) under 600 nm excitation with a 1 nm spectral interval. The incident power, spot position, integration time, and collection geometry were unchanged for all samples, and the spectra were normalized to the absorbed excitation fraction obtained from the corresponding UV–visible spectrum. TRPL decays and fluorescence-lifetime maps were acquired from the same glass/perovskite configuration using a Leica TCS SP8 STED 3X confocal system (Shanghai, China) equipped with a PicoHarp 300 time-correlated single-photon-counting module and a HyD SMD detector. A 600 nm pulsed laser (pulse width < 5 ps; repetition rate 2.16 MHz) was used. The same decay model, instrument response, acquisition window, and fitting procedure were applied to all samples, and the intensity-weighted average lifetime was used for comparison.
Electrochemical impedance spectroscopy (EIS) was performed with a CHI760E electrochemical workstation (Shanghai, China) in the dark at a DC bias of 1.0 V, using a 10 mV AC perturbation over 1 MHz–0.1 Hz (61 frequency points). The complex spectra were fitted simultaneously in Z′ and −Z″ using the common circuit Rs + (Rtr∥CPEtr) + (Rrec∥CPErec), with modulus weighting by |Z|. The CPE impedance was defined as ZCPE = 1/[Q(jω)n]. Seven free parameters were fitted to 122 real residual components, giving 115 degrees of freedom. Parameter standard errors were obtained from the Jacobian-based asymptotic covariance matrix, and 95% confidence intervals used the corresponding t-critical value. The reduced χ2 was calculated as Σ[(ΔZ′/|Z|)2 + (Δ(−Z″)/|Z|)2]/(2N − p); fit quality was assessed jointly from this statistic and the frequency-dependent normalized residuals. The high-frequency branch is assigned to transport/contact response and the low-frequency branch to recombination response. Light-intensity-dependent Vo⊂ measurements were carried out from 0.1 to 100 mW cm−2 using calibrated neutral-density filters, and the ideality factor n was obtained from Vo⊂ = (nkBT/q)ln(I) + C. Thermal admittance spectroscopy was performed at 0 V DC bias with a 20 mV AC amplitude over 100 Hz–1 MHz.
Space-charge-limited current (SCLC) measurements were conducted in the dark using electron-only devices with the structure glass/ITO/SnO2/perovskite/PC61BM/Bphen/Ag. The trap-filled-limit voltage (VtFL) was determined from the intersection of the linear fits to the ohmic and trap-filled regimes. The effective trap density was calculated using Nt = 2εrε0VtFL/(qL2), with εr = 25 and the measured perovskite thickness L = 500 ± 20 nm. These values are reported as model-dependent effective trap densities because mobile ions, contact injection, film thickness, and the selected transition point can affect the absolute SCLC result [36,37].
Photovoltaic measurements were performed under simulated AM 1.5G irradiation at 100 mW cm−2 using a class-AAA Sirius-SS solar simulator (Zolix Instrument Co., Ltd., Beijing, China) calibrated with a certified silicon reference photodiode (ABET Technologies, Baltimore, MD, USA). J–V curves were recorded with a Keithley 2400 source meter over 0–1.2 V at 50 mV s−1 in both forward and reverse directions. The metal overlap and non-reflective aperture both defined an active area of 0.09 cm2. Reverse scans were used for the reported statistical and champion values after a 5 s stabilization at open circuit; The corresponding reverse- and forward-scan curves acquired under the same conditions as a hysteresis check. No light soaking or voltage pre-bias was applied before acquisition. EQE spectra were measured using a Sirius-SS source, an Omni-λ-300 monochromator (Beijing, China), and a Keithley 2400 (Shanghai, China). Device reproducibility was evaluated using 50 functional devices per composition. MPP output was tracked under continuous one-sun illumination in N2 at 25 ± 2 °C for 120 min. Dry–dark shelf stability was measured using unencapsulated devices stored for 30 days at 25 ± 2 °C and 15 ± 5% relative humidity. These tests are described as short-duration operational and shelf-stability comparisons rather than standardized lifetime certification.
3. Results
3.1. Analysis of Crystallization Performance
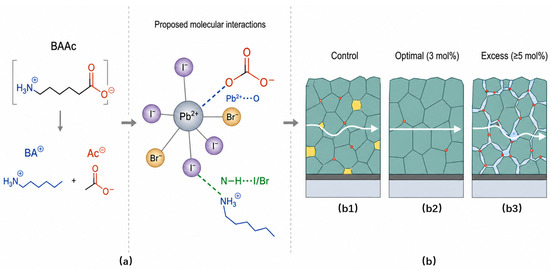
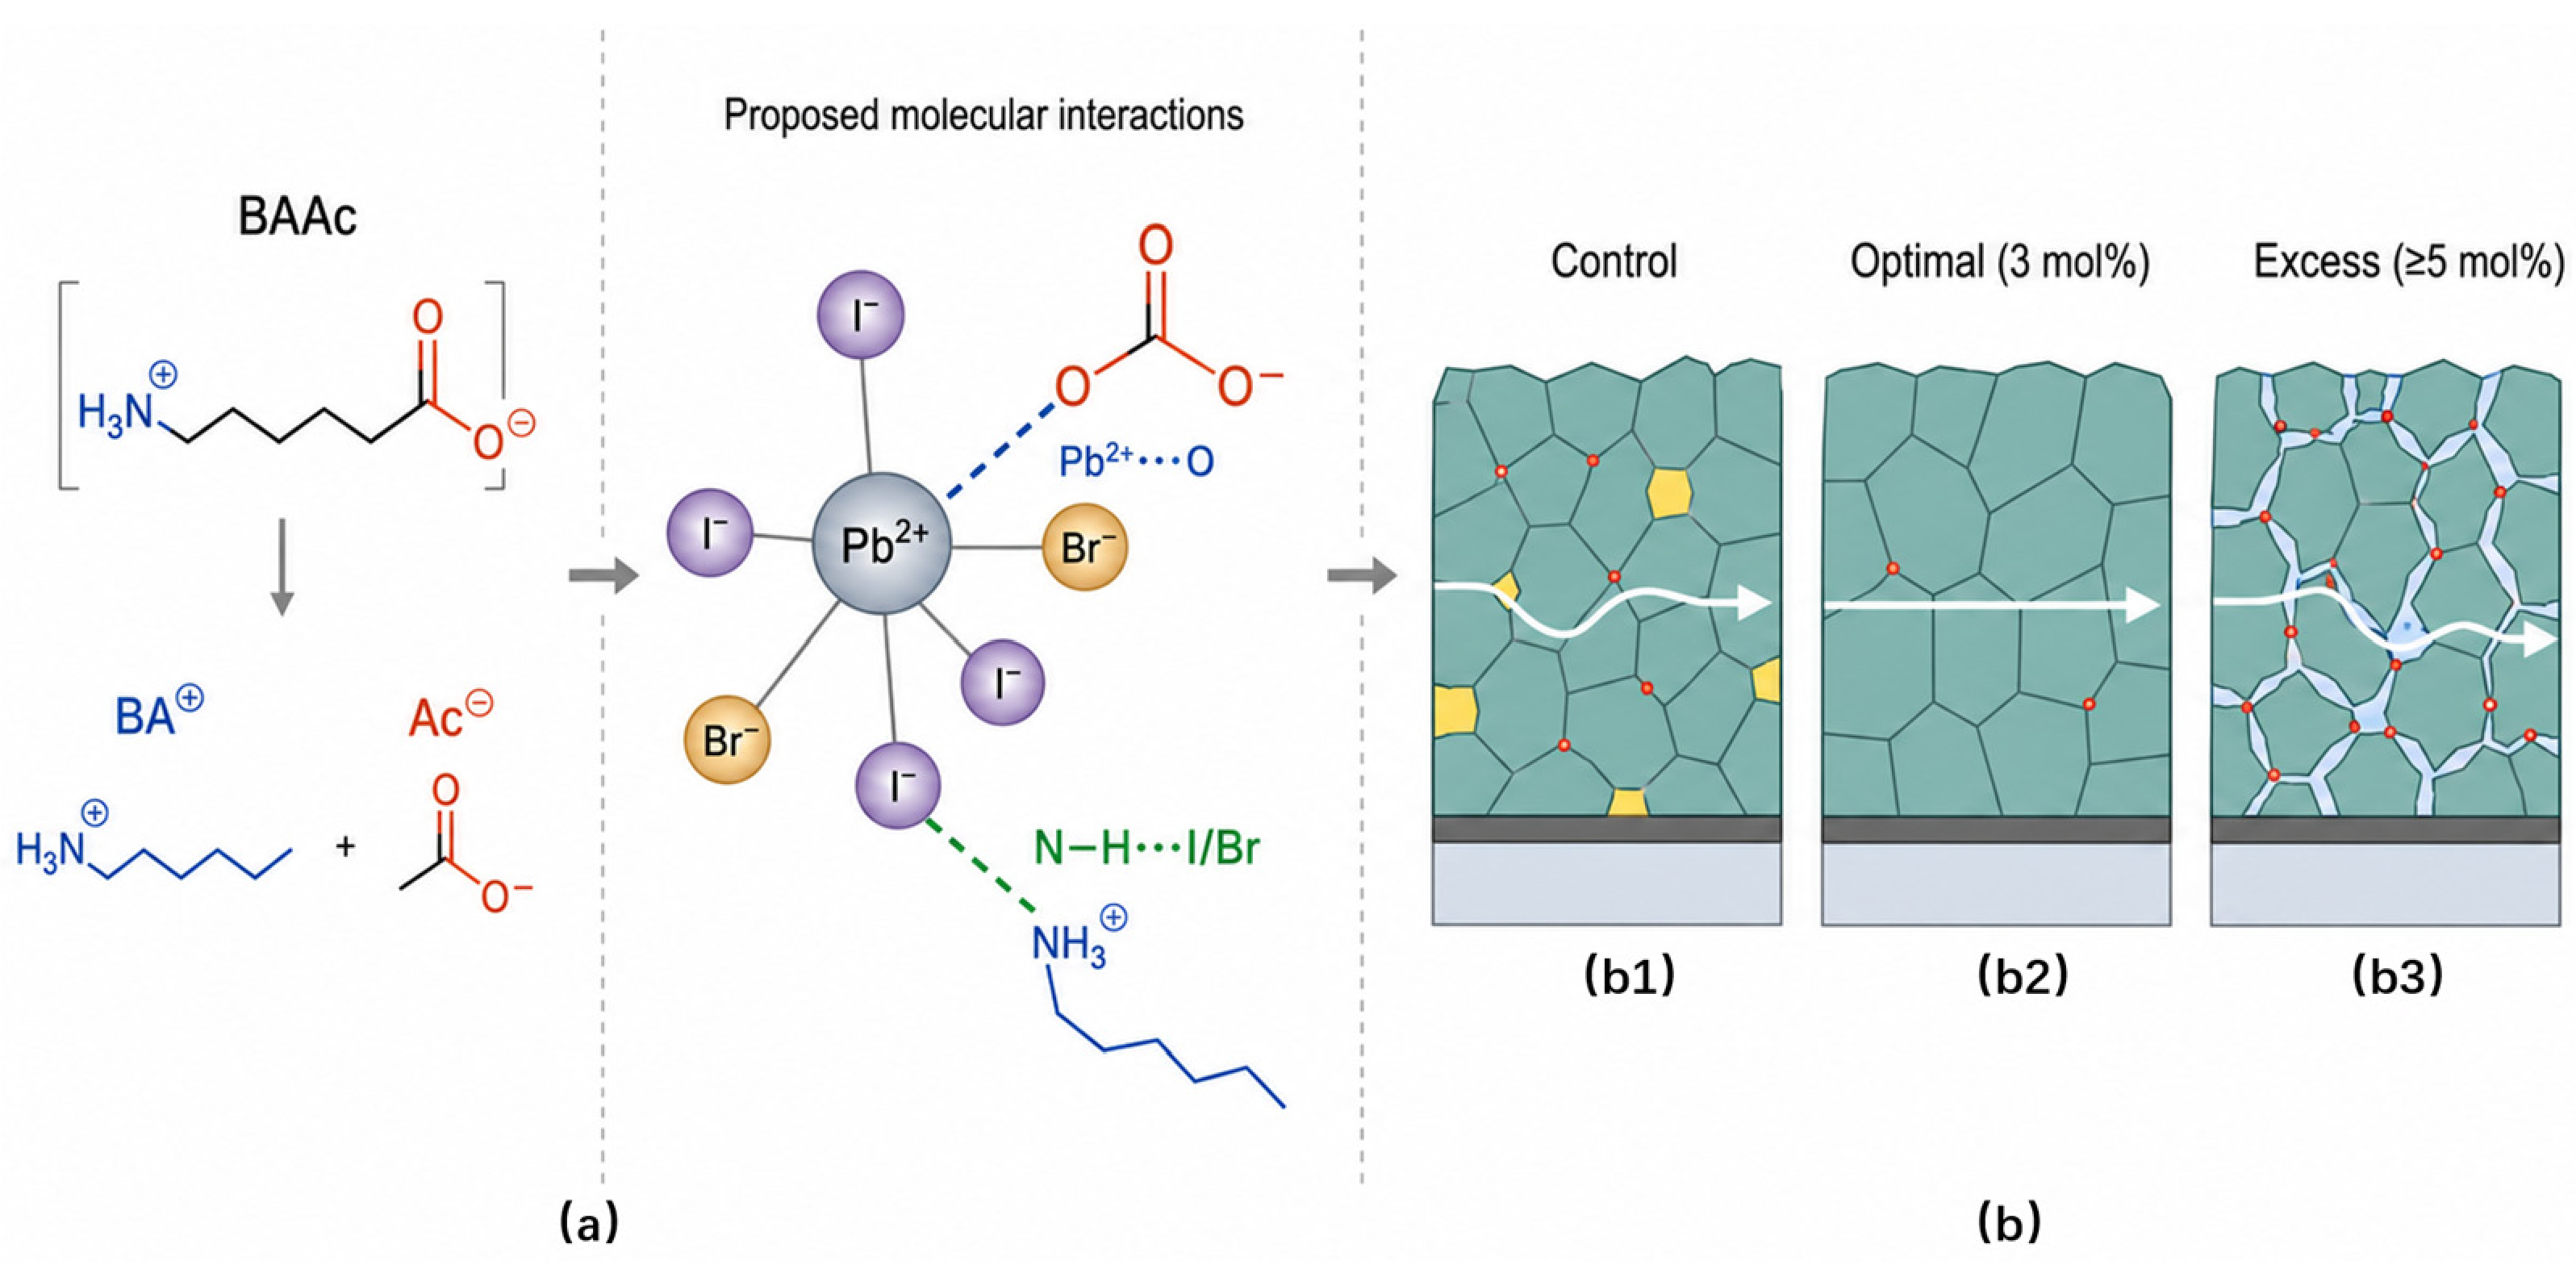
Figure 1a presents a literature-supported working model for the precursor interactions. BAAc dissociates into butylammonium (BA+) and acetate (Ac−) in the polar DMF/NMP medium. Related acetate and ionic-liquid systems support Lewis-basic Ac−–Pb2+ coordination and N–H⋯I/Br interactions involving alkylammonium species [25,29,32,38]. In the present formulation, these specific interactions were not directly resolved by vibrational or photoelectron spectroscopy; the scheme therefore illustrates chemically plausible precursor associations rather than an experimentally identified coordination complex.
Figure 1.
Literature-supported working model of BAAc-mediated precursor regulation: the arrows indicate the sequence of the process of action. (a) BAAc dissociation and proposed Ac−–Pb2+/BA+–halide interactions; (b) concentration-dependent film response comprising (b1) control, (b2) moderate loading (1–3 mol%), and (b3) excess loading (5–7 mol%).
The phenomenological concentration response is summarized in Figure 1b. Figure 1(b1) represents the control condition, Figure 1(b2) the beneficial 1–3 mol% range, and Figure 1(b3) the excess 5–7 mol% range. Moderate loading is consistent with regulated nucleation/growth and fewer electronically active defects. At 5–7 mol%, the favorable morphology and transport response is lost. Butylammonium can support 2D–3D motifs under suitable conditions [26,27,31,32,39]; however, no additional crystalline reflection attributable to such a phase was resolved between 5° and 12°. The high-loading response is therefore described as possible BA-rich or organic-rich interfacial accumulation, without assigning a specific reduced-dimensional phase.
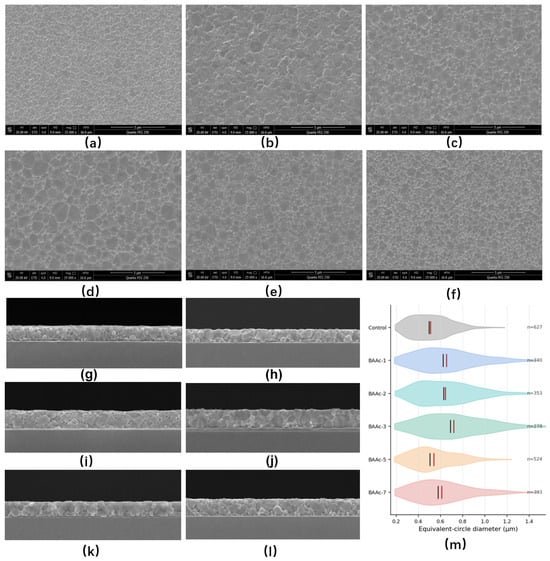
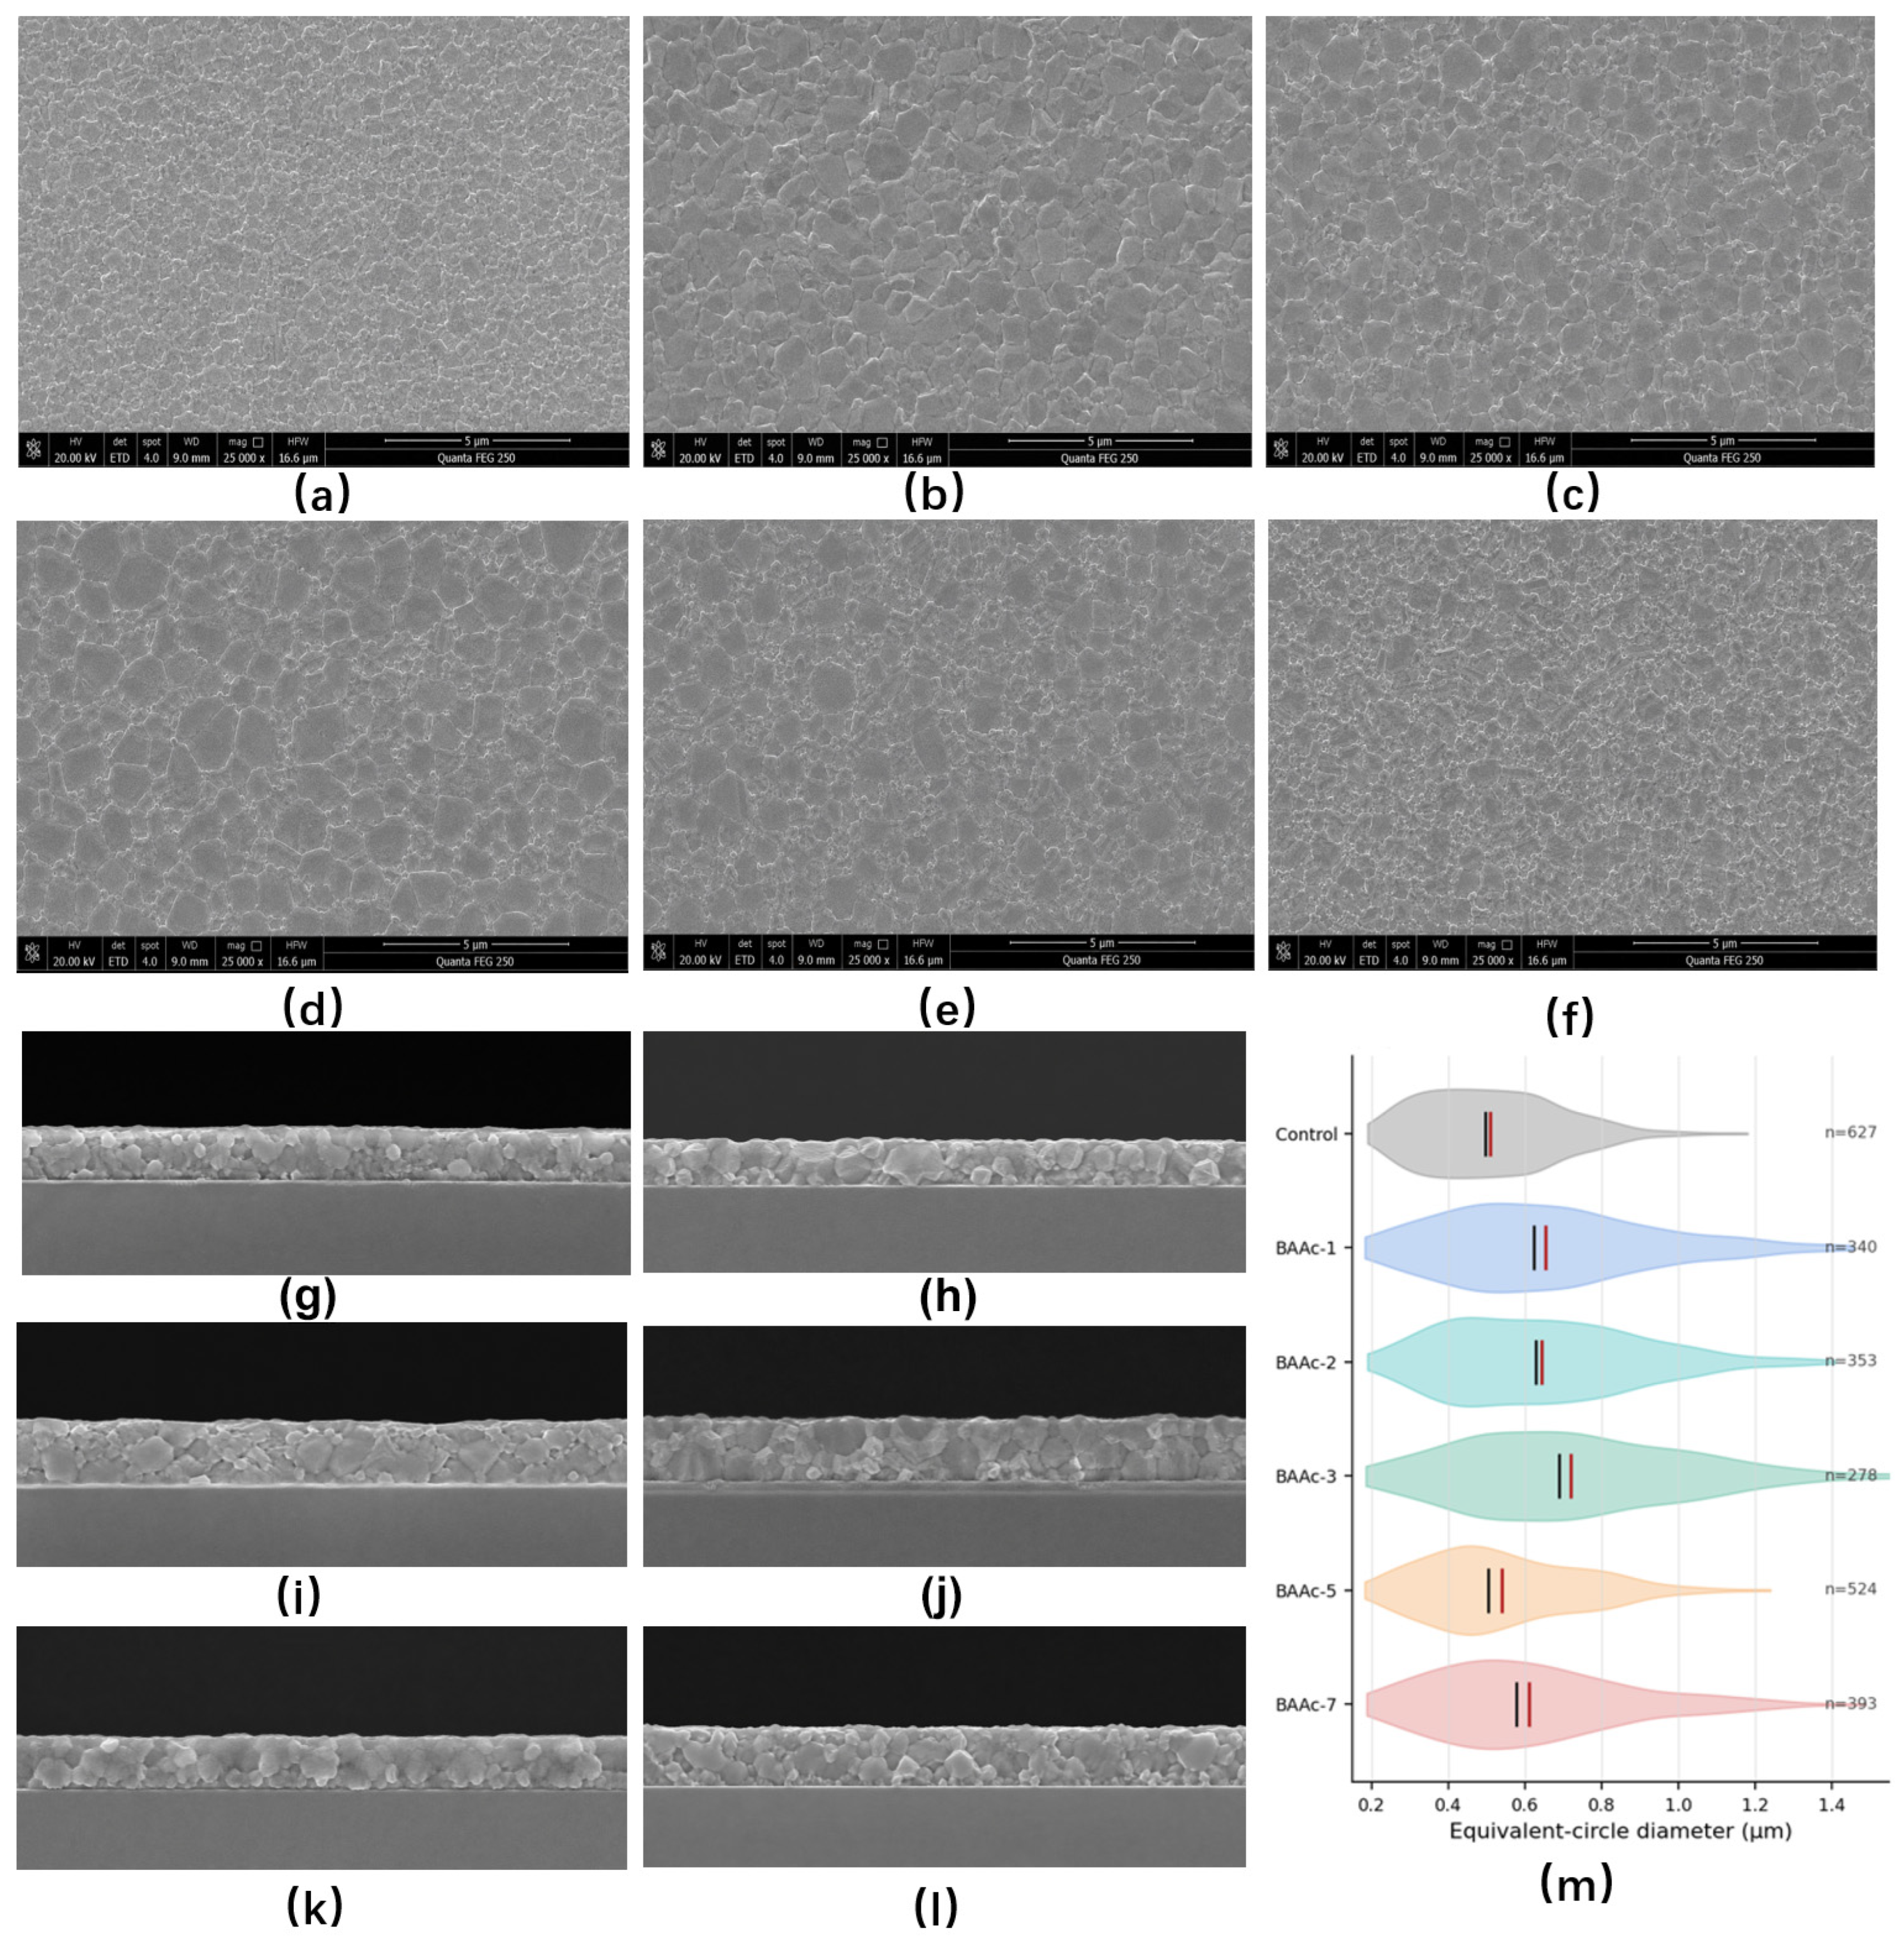
The top-view SEM images (Figure 2a–f), cross-sectional images (Figure 2g–l), and individual grain distributions (Figure 2m and Table 2) provide complementary measures of morphology, the black line in Figure 2m represents the mean value, and the red line represents the median value. The mean equivalent-circle diameters were 0.508 ± 0.179, 0.653 ± 0.270, 0.643 ± 0.248, 0.719 ± 0.296, 0.540 ± 0.203, and 0.609 ± 0.251 μm for the control, BAAc-1, BAAc-2, BAAc-3, BAAc-5, and BAAc-7, respectively. BAAc-3 therefore had the largest mean diameter, which represented a 41.5% increase over the control. The corresponding medians were 0.495, 0.623, 0.627, 0.688, 0.504, and 0.577 μm, respectively, which confirms that the trend was not produced solely by a small number of large grains.
Figure 2.
Morphology and grain-size distributions of the BAAc series: top-view SEM images of (a) control, (b) BAAc-1, (c) BAAc-2, (d) BAAc-3, (e) BAAc-5, and (f) BAAc-7; corresponding cross-sectional SEM images (g–l); and (m) individual grain equivalent-circle-diameter distributions. Top-view scale bars: 5 μm. Cross-sectional absorber thickness: approximately 500 ± 20 nm.
Table 2.
Descriptive statistics of the individual grain equivalent-circle-diameter distributions.
The IQR values ranged from 0.267 to 0.420 μm and the coefficients of variation from 35.18% to 41.41%. Thus, BAAc-3 increased the characteristic grain size but did not narrow the relative grain-size distribution; the earlier claim of reduced morphological heterogeneity has been removed. The cross-sectional images show continuous absorber layers with comparable thicknesses of approximately 480–520 nm, supporting the use of a common 500 ± 20 nm thickness in the optical and SCLC calculations. Because neither projected diameter nor a limited set of cross-sections provides a statistically independent pinhole-density measurement, the morphological conclusion is restricted to grain-size distribution, layer continuity, and thickness.
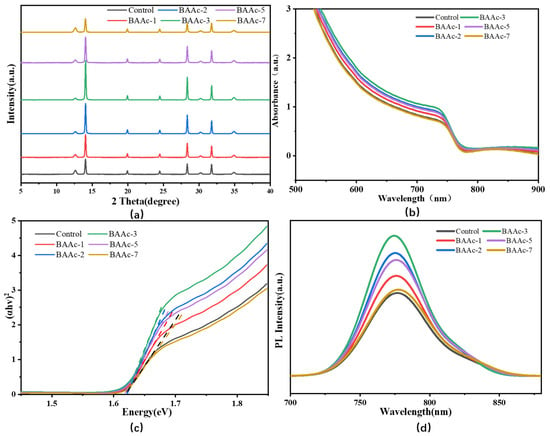
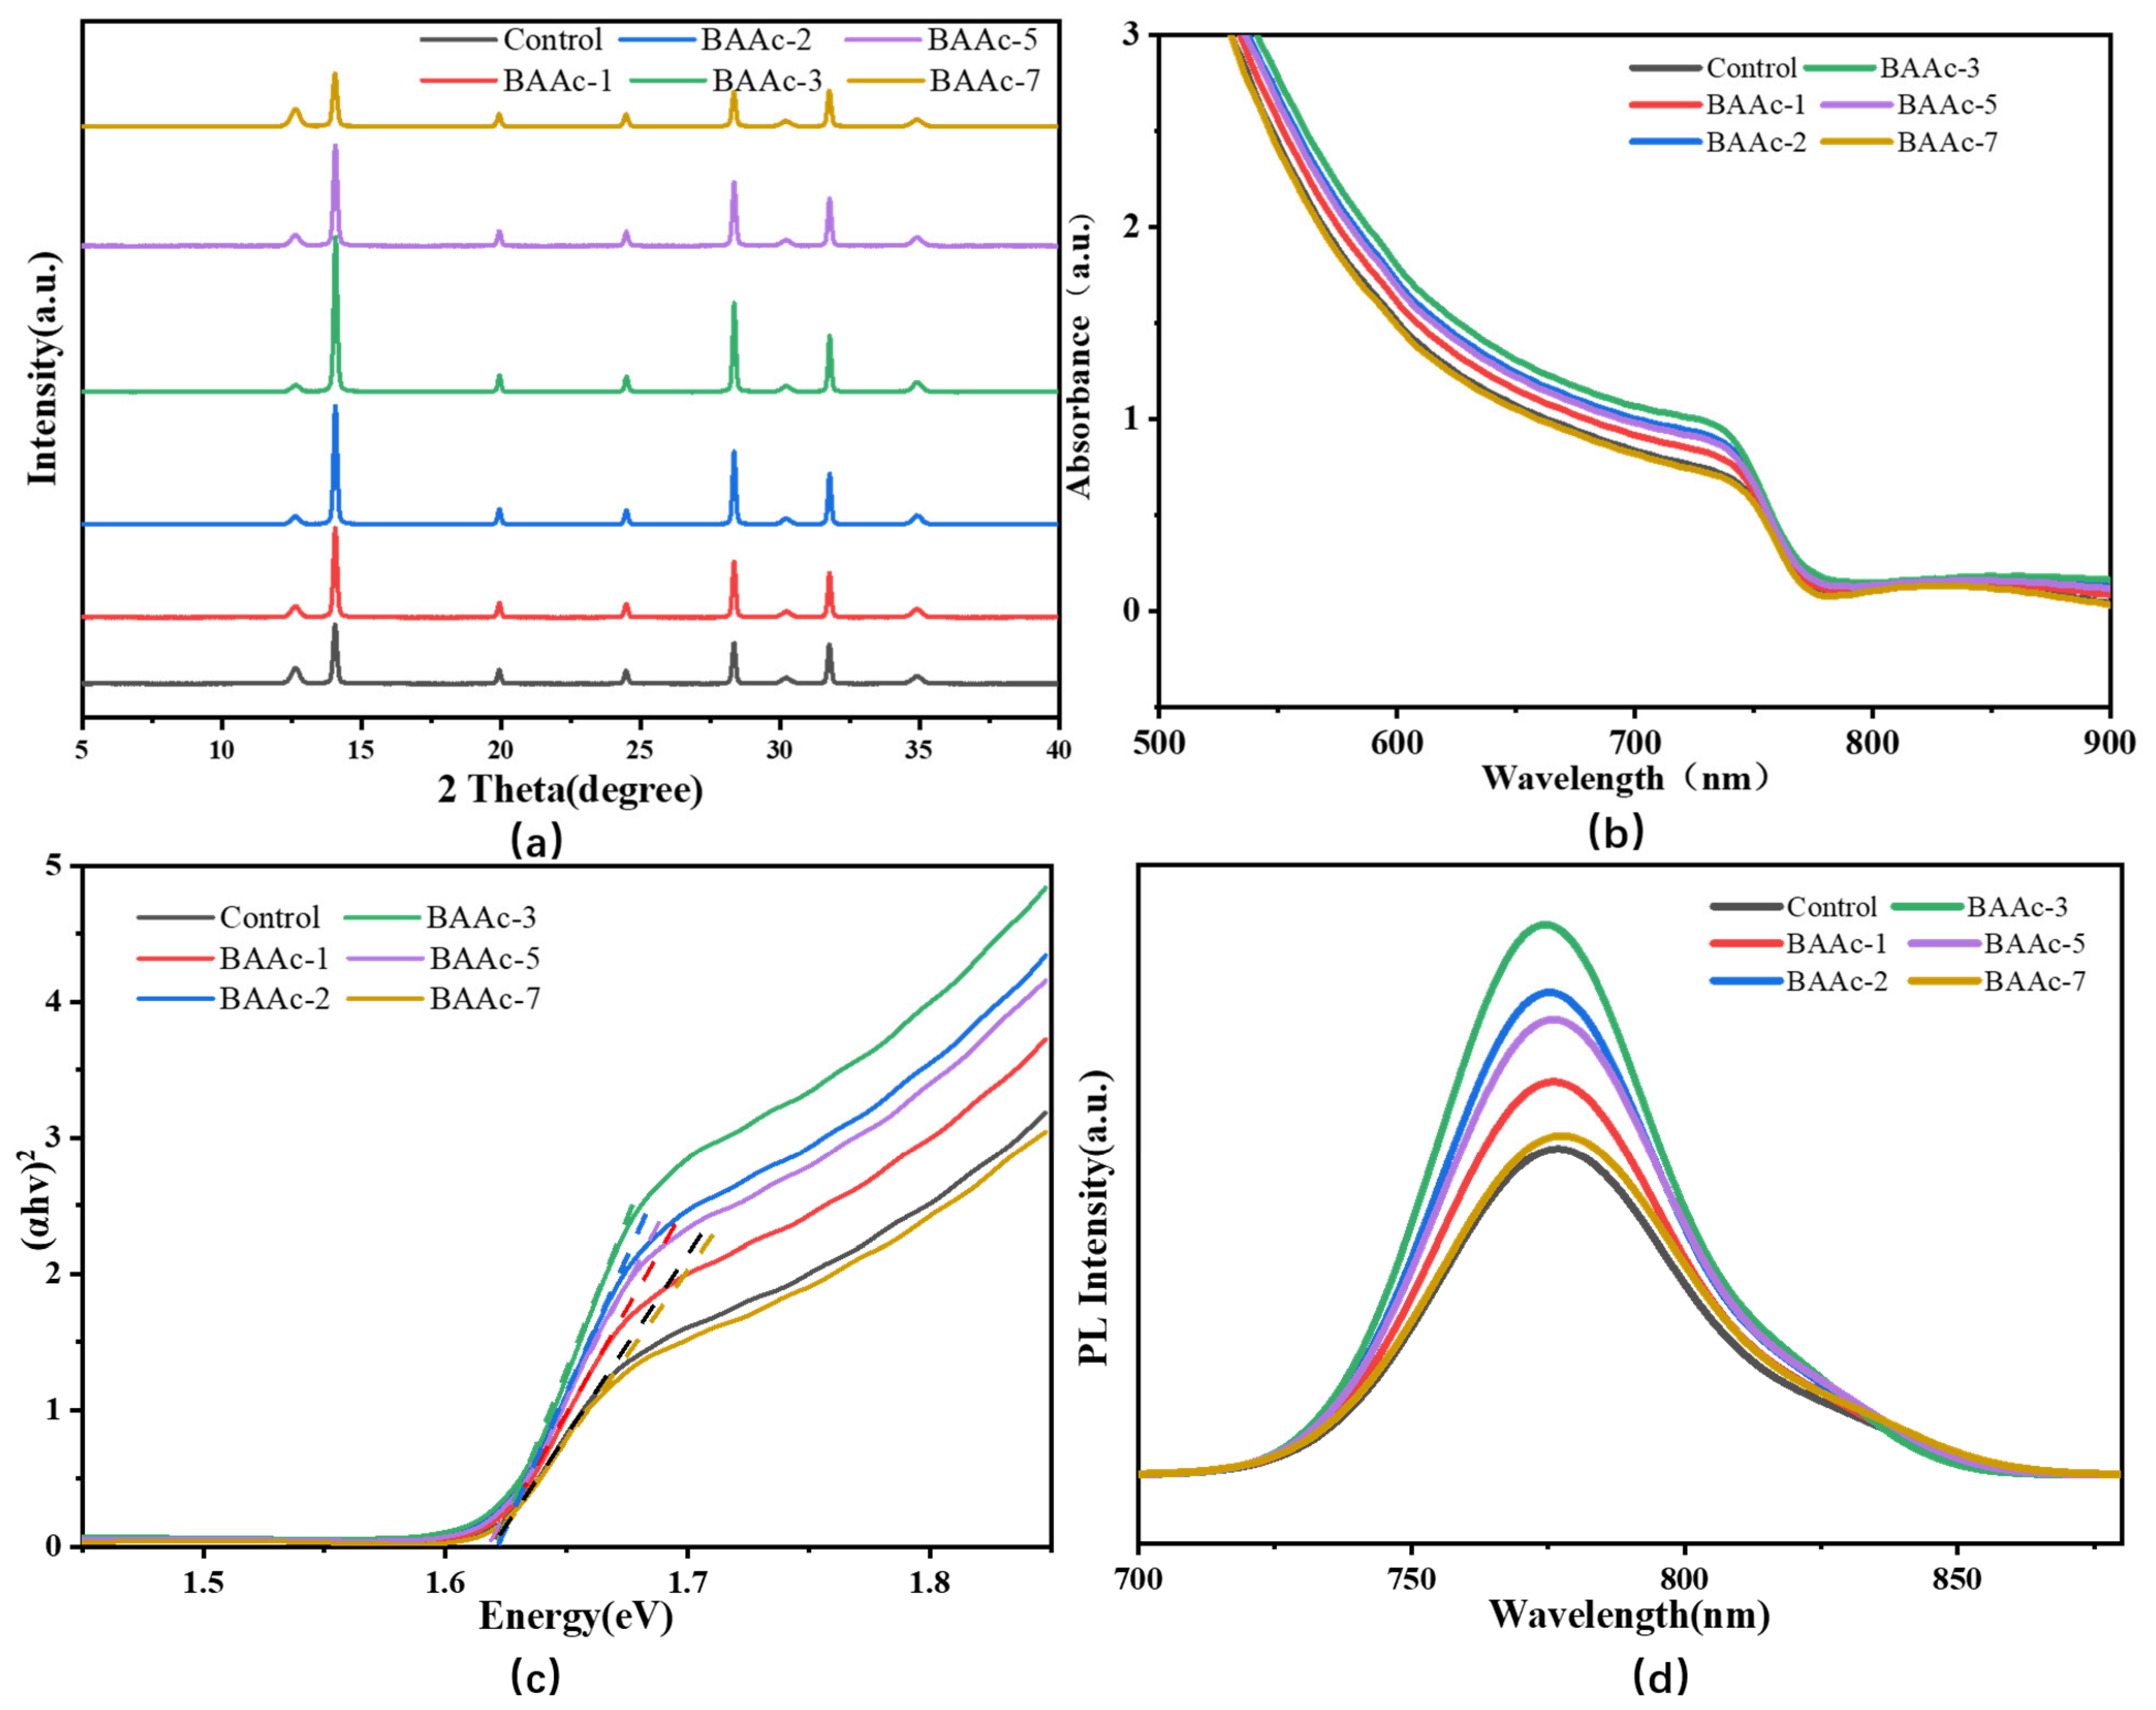
The XRD patterns in Figure 3a retained the characteristic perovskite reflections at approximately 14.1°, 28.4°, and 31.8° for every composition. The fitted principal-peak positions for the control and BAAc-3 were 14.06° and 14.08°, respectively; this difference is comparable to the acquisition interval and is not interpreted as a measurable change in the average bulk lattice. The peak height increased from 4.46 × 10³ to 1.172 × 10⁴ counts, the FWHM narrowed from 0.156° to 0.142°, and the apparent coherent-domain size increased from 51.3 to 56.4 nm. The PbI2/perovskite peak height ratio decreased from 0.2691 for the control to 0.1259, 0.0674, and 0.0427 for BAAc-1, BAAc-2, and BAAc-3, respectively, which indicates more complete conversion under the selected processing conditions. No additional diffraction peak was resolved in the 5–12° region. BAAc-7 showed a broader main peak (0.175°) and a PbI2/perovskite ratio of 0.3317. Residual PbI2 can improve or impair performance depending on its amount and location [40,41,42].
Figure 3.
Concentration-dependent structural and steady-state optical properties: (a) XRD patterns, (b) UV–visible absorption spectra, (c) direct-bandgap Tauc plots with linear extrapolations, and (d) steady-state PL spectra of control and BAAc-treated perovskite films.
The UV–visible spectra in Figure 3b displayed similar long-wavelength onsets and no concentration-dependent displacement of the band edge. BAAc-2 and BAAc-3 showed slightly higher absorbance through the visible region. Direct-transition Tauc fits (Figure 3c) were restricted to the steep fundamental-absorption region described in Section 2.3, in which the dashed lines represent the tangents of the PL curve. The intersection points of these tangents with the coordinate axes indicate the bandgap energy. avoiding the sub-bandgap tail and visibly curved region in accordance with established cautions on Tauc analysis [43]. The fitted values were 1.619, 1.622, 1.624, 1.624, 1.623, and 1.618 eV for the control, BAAc-1, BAAc-2, BAAc-3, BAAc-5, and BAAc-7, respectively, with an estimated fitting uncertainty of ±0.005 eV. The 5.9 meV total variation is therefore not interpreted as a composition-induced bandgap shift.
The dominant steady-state PL band in Figure 3d occurs at 775–780 nm and is assigned to near-band-edge radiative recombination in the mixed-cation, mixed-halide absorber [44,45]. The control film emitted at 778 nm with an FWHM of approximately 47 nm. BAAc-3 showed a peak at 775 nm, a 2.6-fold intensity enhancement, and an FWHM of approximately 38 nm, whereas BAAc-7 emitted near 780 nm, with an FWHM of approximately 54 nm. The comparison was corrected using the absorbed 600 nm excitation fraction obtained from the corresponding UV–visible spectra. The enhanced and narrowed BAAc-3 emission, together with the TRPL response, is consistent with reduced nonradiative loss and energetic disorder.
3.2. Optical and Electrical Performance Analysis
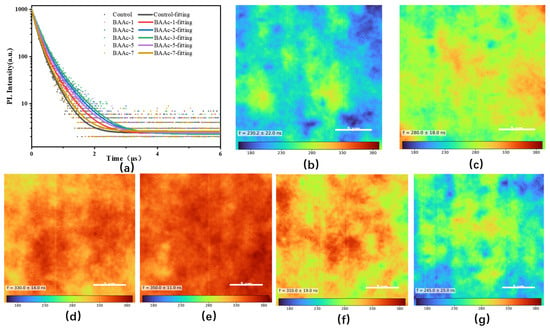
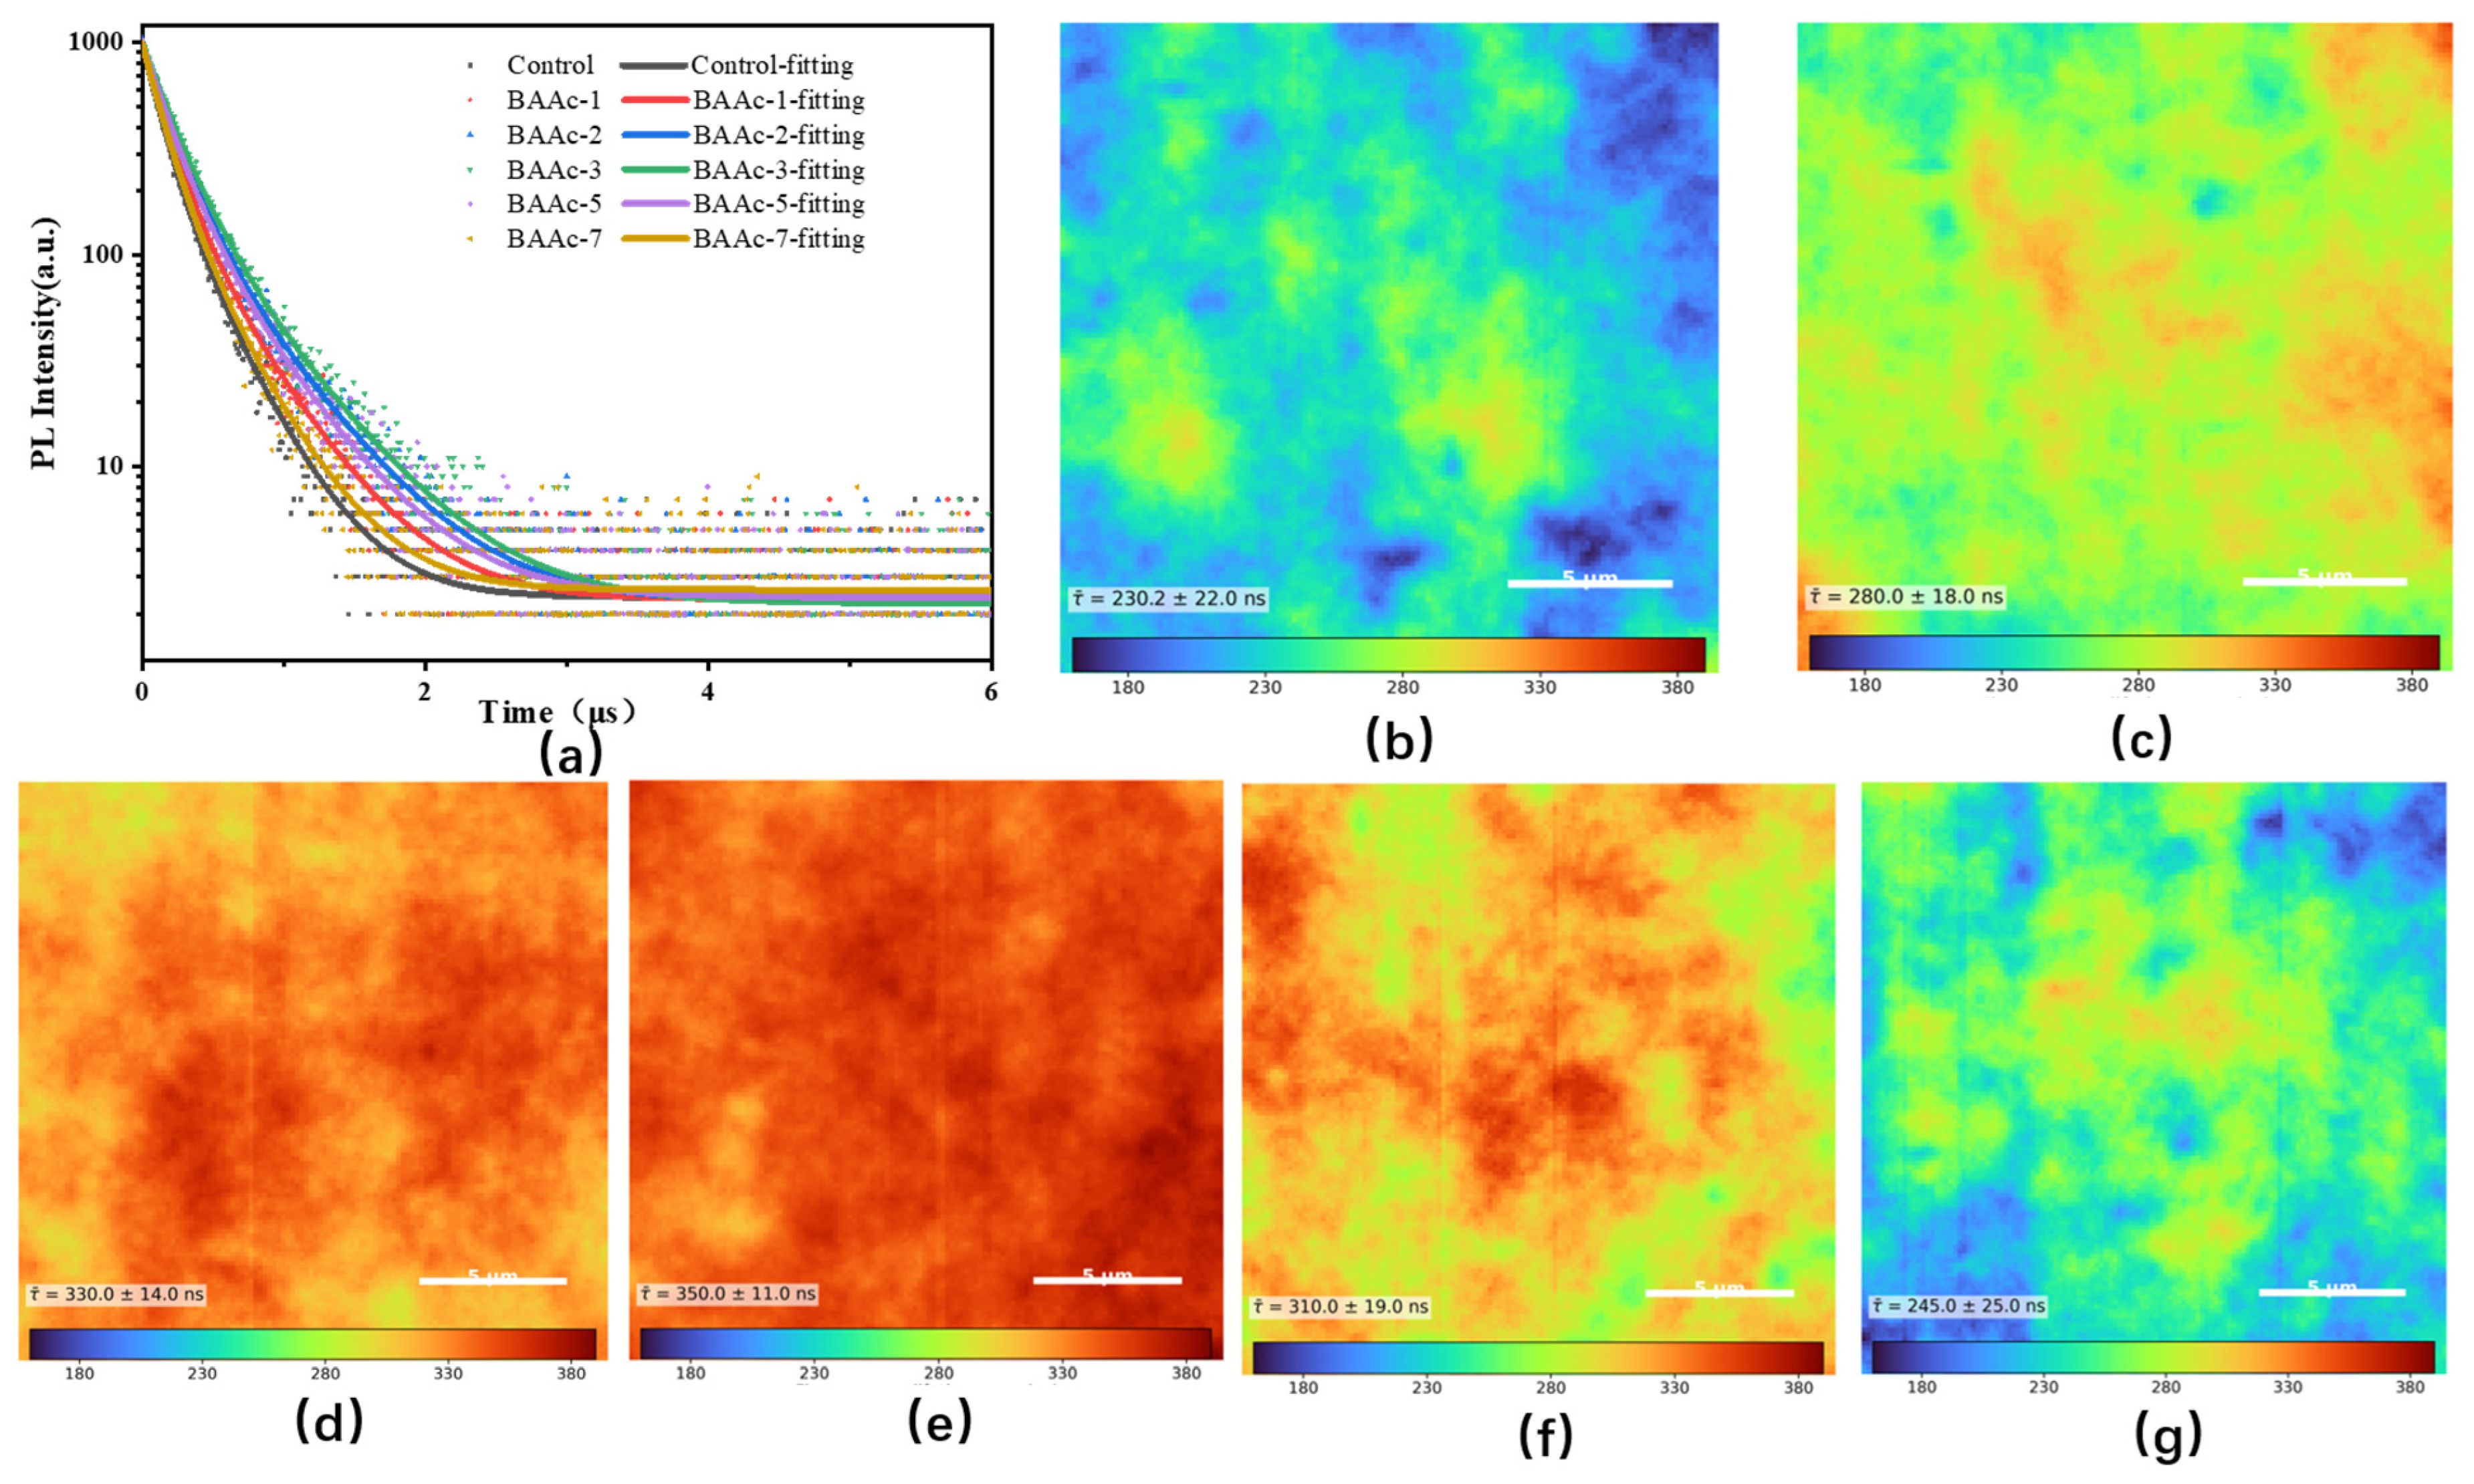
The TRPL curves in Figure 4a follow the steady-state PL ordering. The intensity-weighted average lifetime increased from 230.2 ns for the control to 280.0, 330.0, and 350.0 ns for BAAc-1, BAAc-2, and BAAc-3, respectively, and then decreased to 310.0 and 245.0 ns for BAAc-5 and BAAc-7, respectively. All decays were measured on glass/perovskite films from the air side under the common 600 nm TCSPC conditions specified in Section 2.3, so the comparison does not include extraction by a charge transport layer. The 52.0% increase between the control and BAAc-3 is therefore consistent with the suppression of effective nonradiative decay channels [44,45,46], although TRPL alone does not identify a specific defect species.
Figure 4.
(a) TRPL decay curves and fitted decays of the concentration series. Spatial fluorescence-lifetime maps for (b) control, (c) BAAc-1, (d) BAAc-2, (e) BAAc-3, (f) BAAc-5, and (g) BAAc-7. All maps use the same lifetime scale; scale bars: 5 μm.
The spatial lifetime maps in Figure 4b–g resolved the same concentration dependence. Mean lifetimes of 230.2 ± 22.0, 280.0 ± 18.0, 330.0 ± 14.0, 350.0 ± 11.0, 310.0 ± 19.0, and 245.0 ± 25.0 ns were obtained for the control, BAAc-1, BAAc-2, BAAc-3, BAAc-5, and BAAc-7, respectively. The coefficient of variation decreased from 9.56% for the control to 3.14% for BAAc-3, showing that the optimized film combined a longer lifetime with a more uniform spatial response. BAAc-7 had the widest distribution (10.20% coefficient of variation), consistent with renewed local heterogeneity.
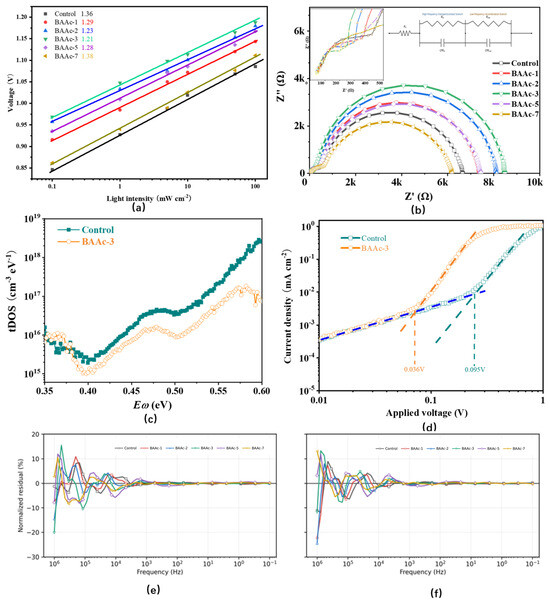
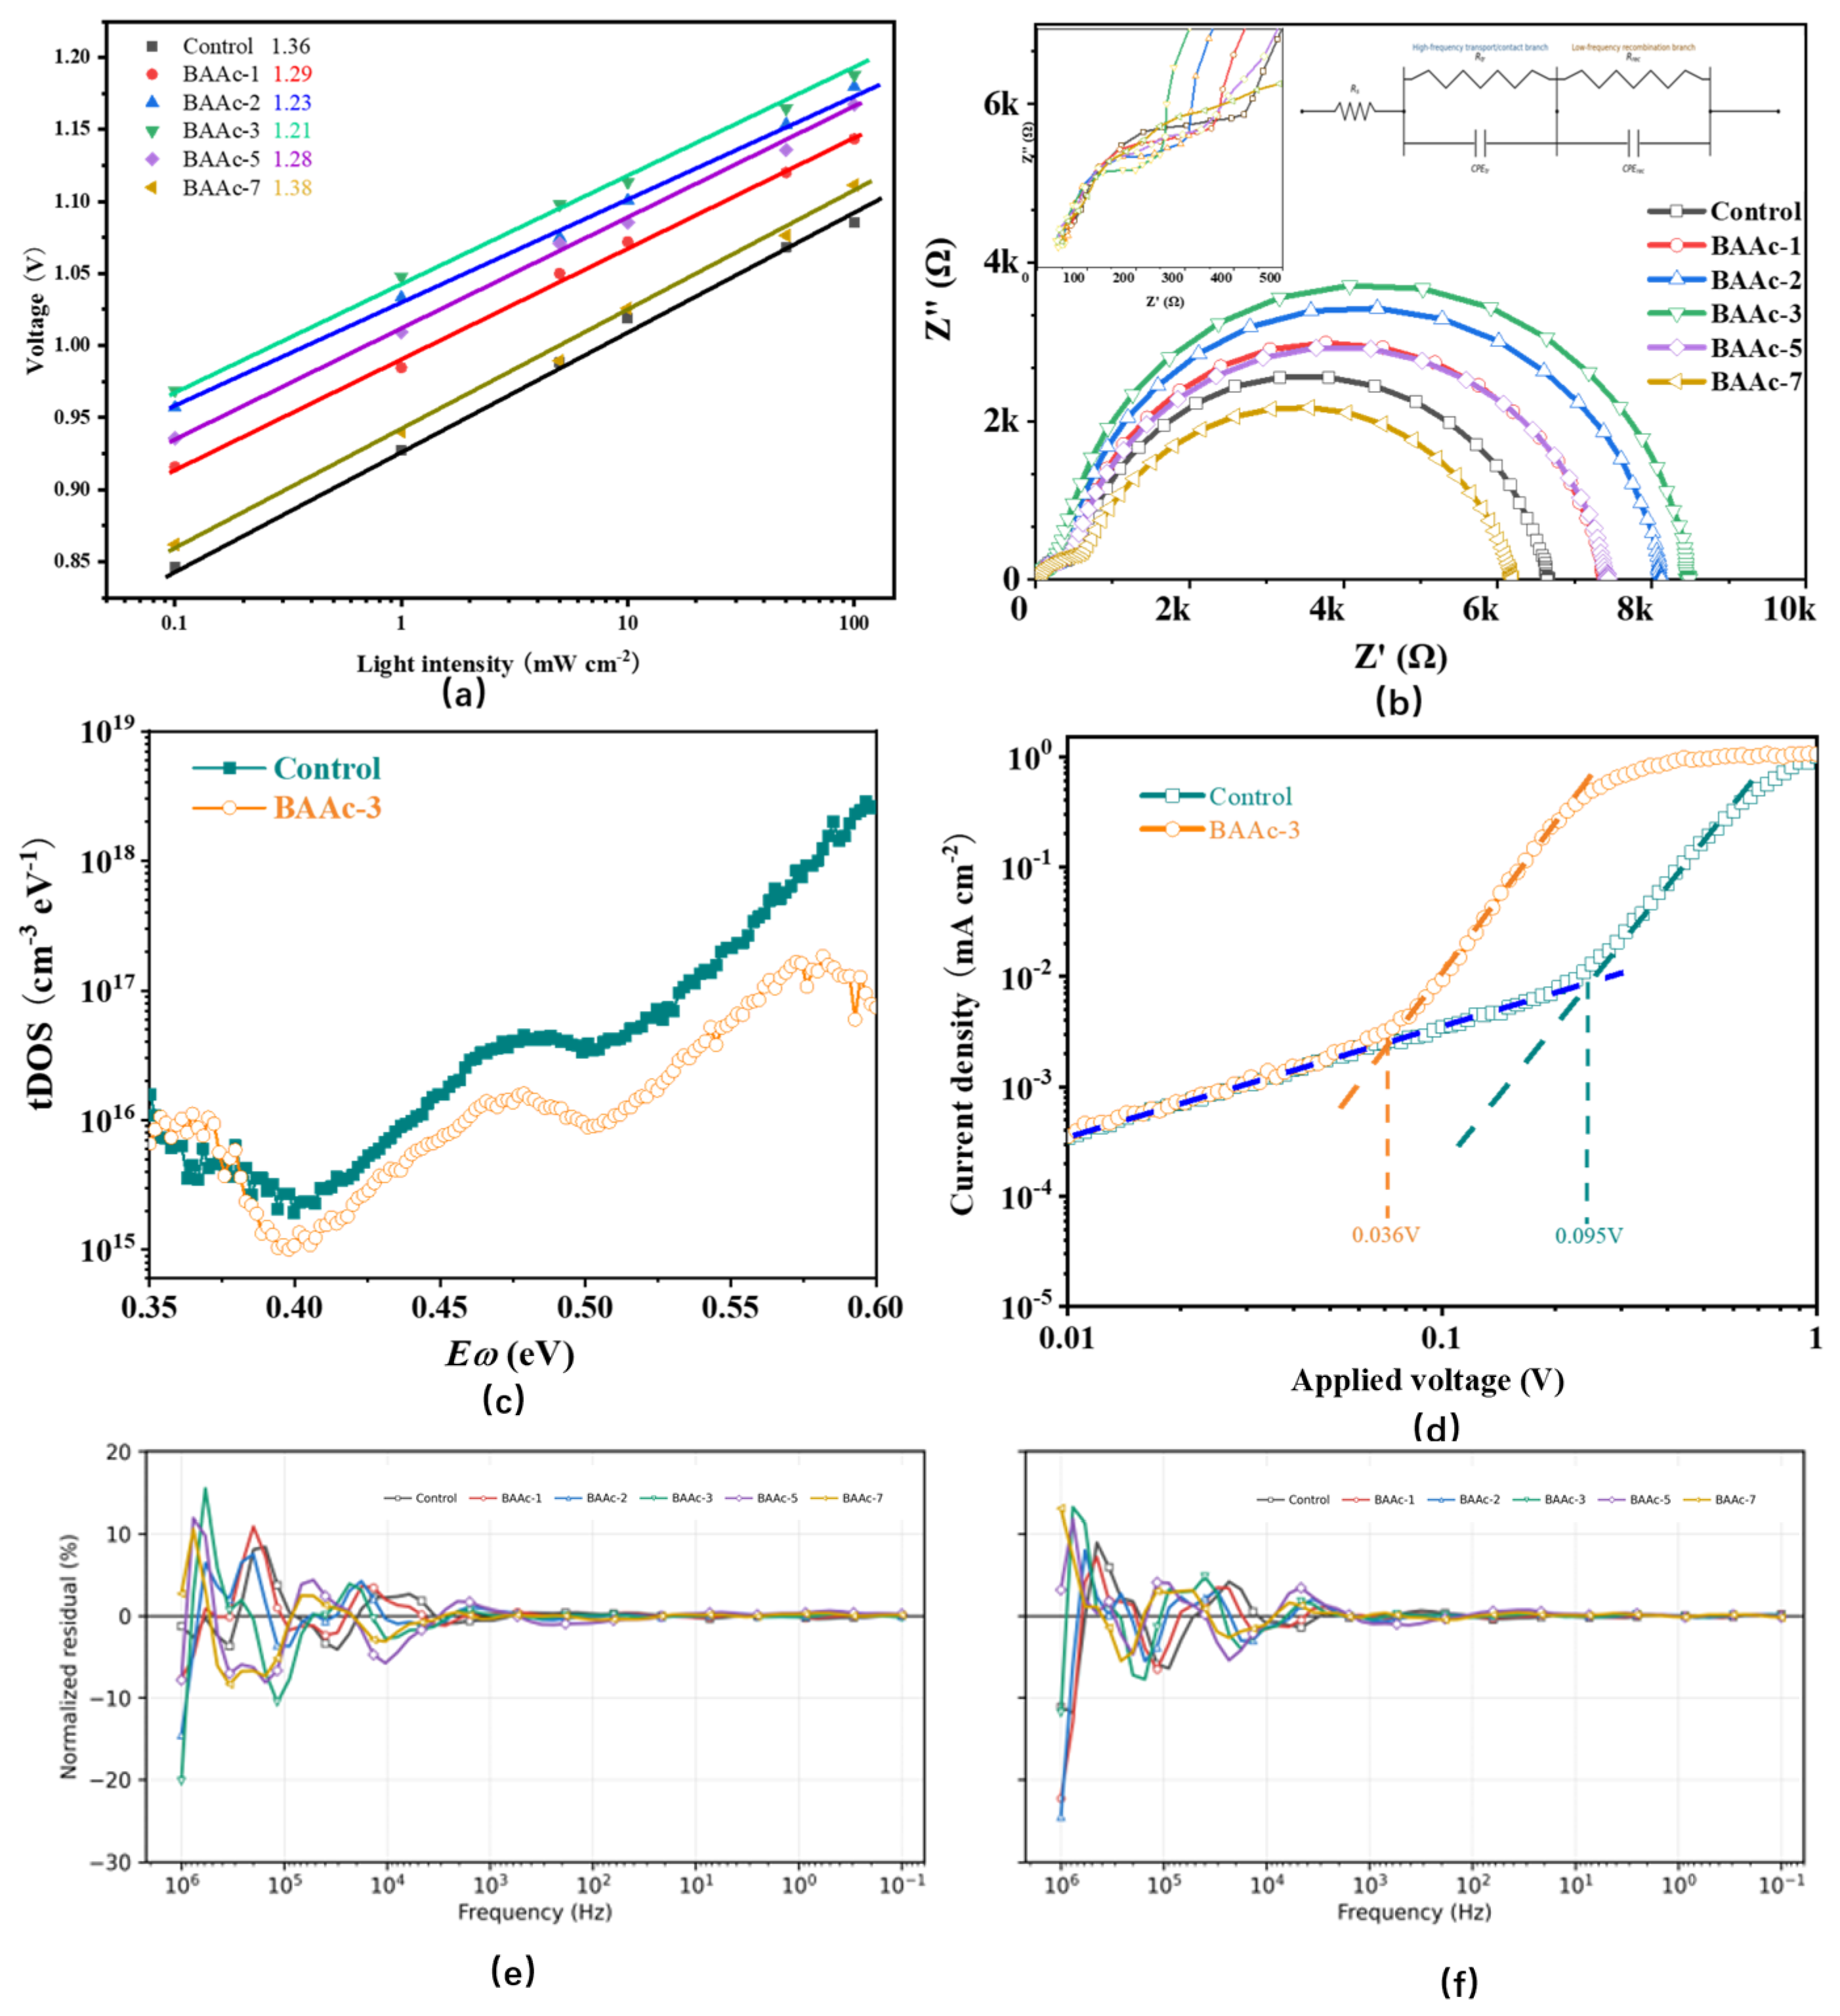
The light-intensity-dependent Vo⊂ data in Figure 5a yielded ideality factors of 1.364, 1.290, 1.230, 1.210, 1.280, and 1.380 for the control, BAAc-1, BAAc-2, BAAc-3, BAAc-5, and BAAc-7, respectively. The corresponding fitted Vo⊂ values at 100 mW cm−2 were 1.092, 1.145, 1.176, 1.188, 1.164, and 1.105 V, respectively. The decrease to 1.210 at 3 mol% is consistent with a reduced contribution from trap-mediated Shockley–Read–Hall recombination, while the increase at 7 mol% indicates renewed defect-assisted loss. Ideality factors in PSCs can contain contributions from bulk, interfacial, and transport-layer recombination; the interpretation was therefore made in combination with TRPL, EIS, tDOS, and SCLC [47,48].
Figure 5.
Electrical characterization of the BAAc series: (a) light-intensity-dependent Vo⊂ measurements and linear fits; (b) Nyquist plots and common equivalent-circuit fits; (c) energetic tDOS of control and BAAc-3; (d) SCLC characteristics of control and BAAc-3 electron-only devices; and normalized (e) real and (f) imaginary EIS residuals for all six concentrations.
The Nyquist plots in Figure 5b and the common equivalent-circuit analysis in the Figure 5b inset and Table 3a show a clear concentration dependence. Rtr decreased from 453.38 ± 14.89 Ω for the control to 343.33 ± 13.39, 258.69 ± 9.53, and 222.17 ± 9.52 Ω for BAAc-1, BAAc-2, and BAAc-3, respectively, while Rrec increased from 6.155 ± 0.039 to 6.993 ± 0.050, 7.825 ± 0.054, and 8.211 ± 0.061 kΩ, respectively. At higher loading, Rtr increased to 327.34 ± 9.57 Ω for BAAc-5 and 527.66 ± 14.65 Ω for BAAc-7, whereas Rrec decreased to 7.087 ± 0.046 and 5.644 ± 0.039 kΩ, respectively. The principal resistance trends therefore support improved transport and reduced device-level recombination near 3 mol% BAAc, followed by an over-treatment response.
Table 3.
(a) Main EIS parameters. Values are estimate ± standard error; square brackets give the 95% confidence interval, followed by RSE for the three resistance parameters. (b) CPE parameters. Values are estimate ± standard error; square brackets give the 95% confidence interval.
All Rs, Rtr, and Rrec estimates had relative standard errors below 7.14%, 4.29%, and 0.75%, respectively. The reduced χ2 values ranged from 6.63 × 10⁻⁴ to 1.41 × 10⁻³, which is within or close to the commonly targeted 10−4–10−3 range under the present weighting definition. However, the normalized residuals in Figure 5e,f show systematic high-frequency oscillations near 104–106 Hz. In addition, Qtr had relative standard errors of 16.10–30.39%, and ntr reached the upper fitting bound of 0.999 for BAAc-2 and BAAc-3 (Table 3b). Consequently, the major resistance trend is used for comparison, whereas the high-frequency CPE parameters are treated as descriptive fit quantities and are not assigned an independent mechanistic meaning.
Thermal admittance spectroscopy, as shown in Figure 5c, resolved the energetic trap distribution. At 0.47 eV, the tDOS values were 3.71 × 10¹⁶ and 1.41 × 1016 cm−3 eV−1 for the control and BAAc-3, respectively, corresponding to a 62.0% reduction. The integrated density over 0.20–0.50 eV decreased from 5.14 × 10¹⁵ to 1.94 × 1015 cm−3. The conversion followed the derivative-admittance method for extracting defect-energy distributions from junction capacitance [49].
The electron-only SCLC curves in Figure 5d give VtFL values of 0.095 V for the control and 0.036 V for BAAc-3. Using εr = 25 and L = 500 ± 20 nm, the corresponding model-dependent effective trap densities were 1.05 × 10¹⁵ and 3.96 × 1014 cm−3, respectively. The relative decrease is 62.3%; varying the common film thickness within its measured uncertainty changes the absolute values but not this ratio. The SCLC and tDOS magnitudes are not expected to coincide because tDOS is an energy-resolved junction-admittance quantity, whereas SCLC integrates the traps accessed under carrier injection, the specific data can be found in Table 4. Their common direction, together with a longer TRPL lifetime, higher Rrec, and lower ideality factor, supports reduced trap-assisted recombination at 3 mol% BAAc [36,37].
Table 4.
Electrical and defect-related parameters extracted using the common analysis protocol.
3.3. Photovoltaic Performance Analysis
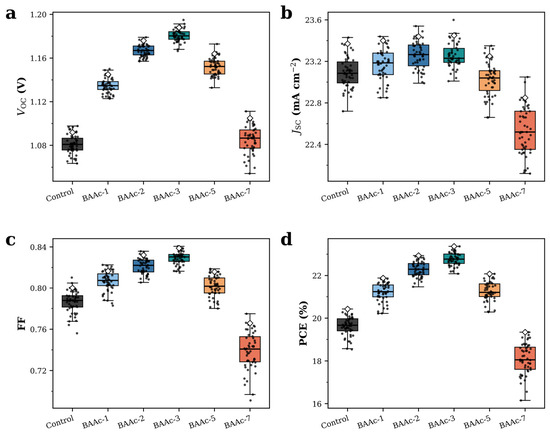
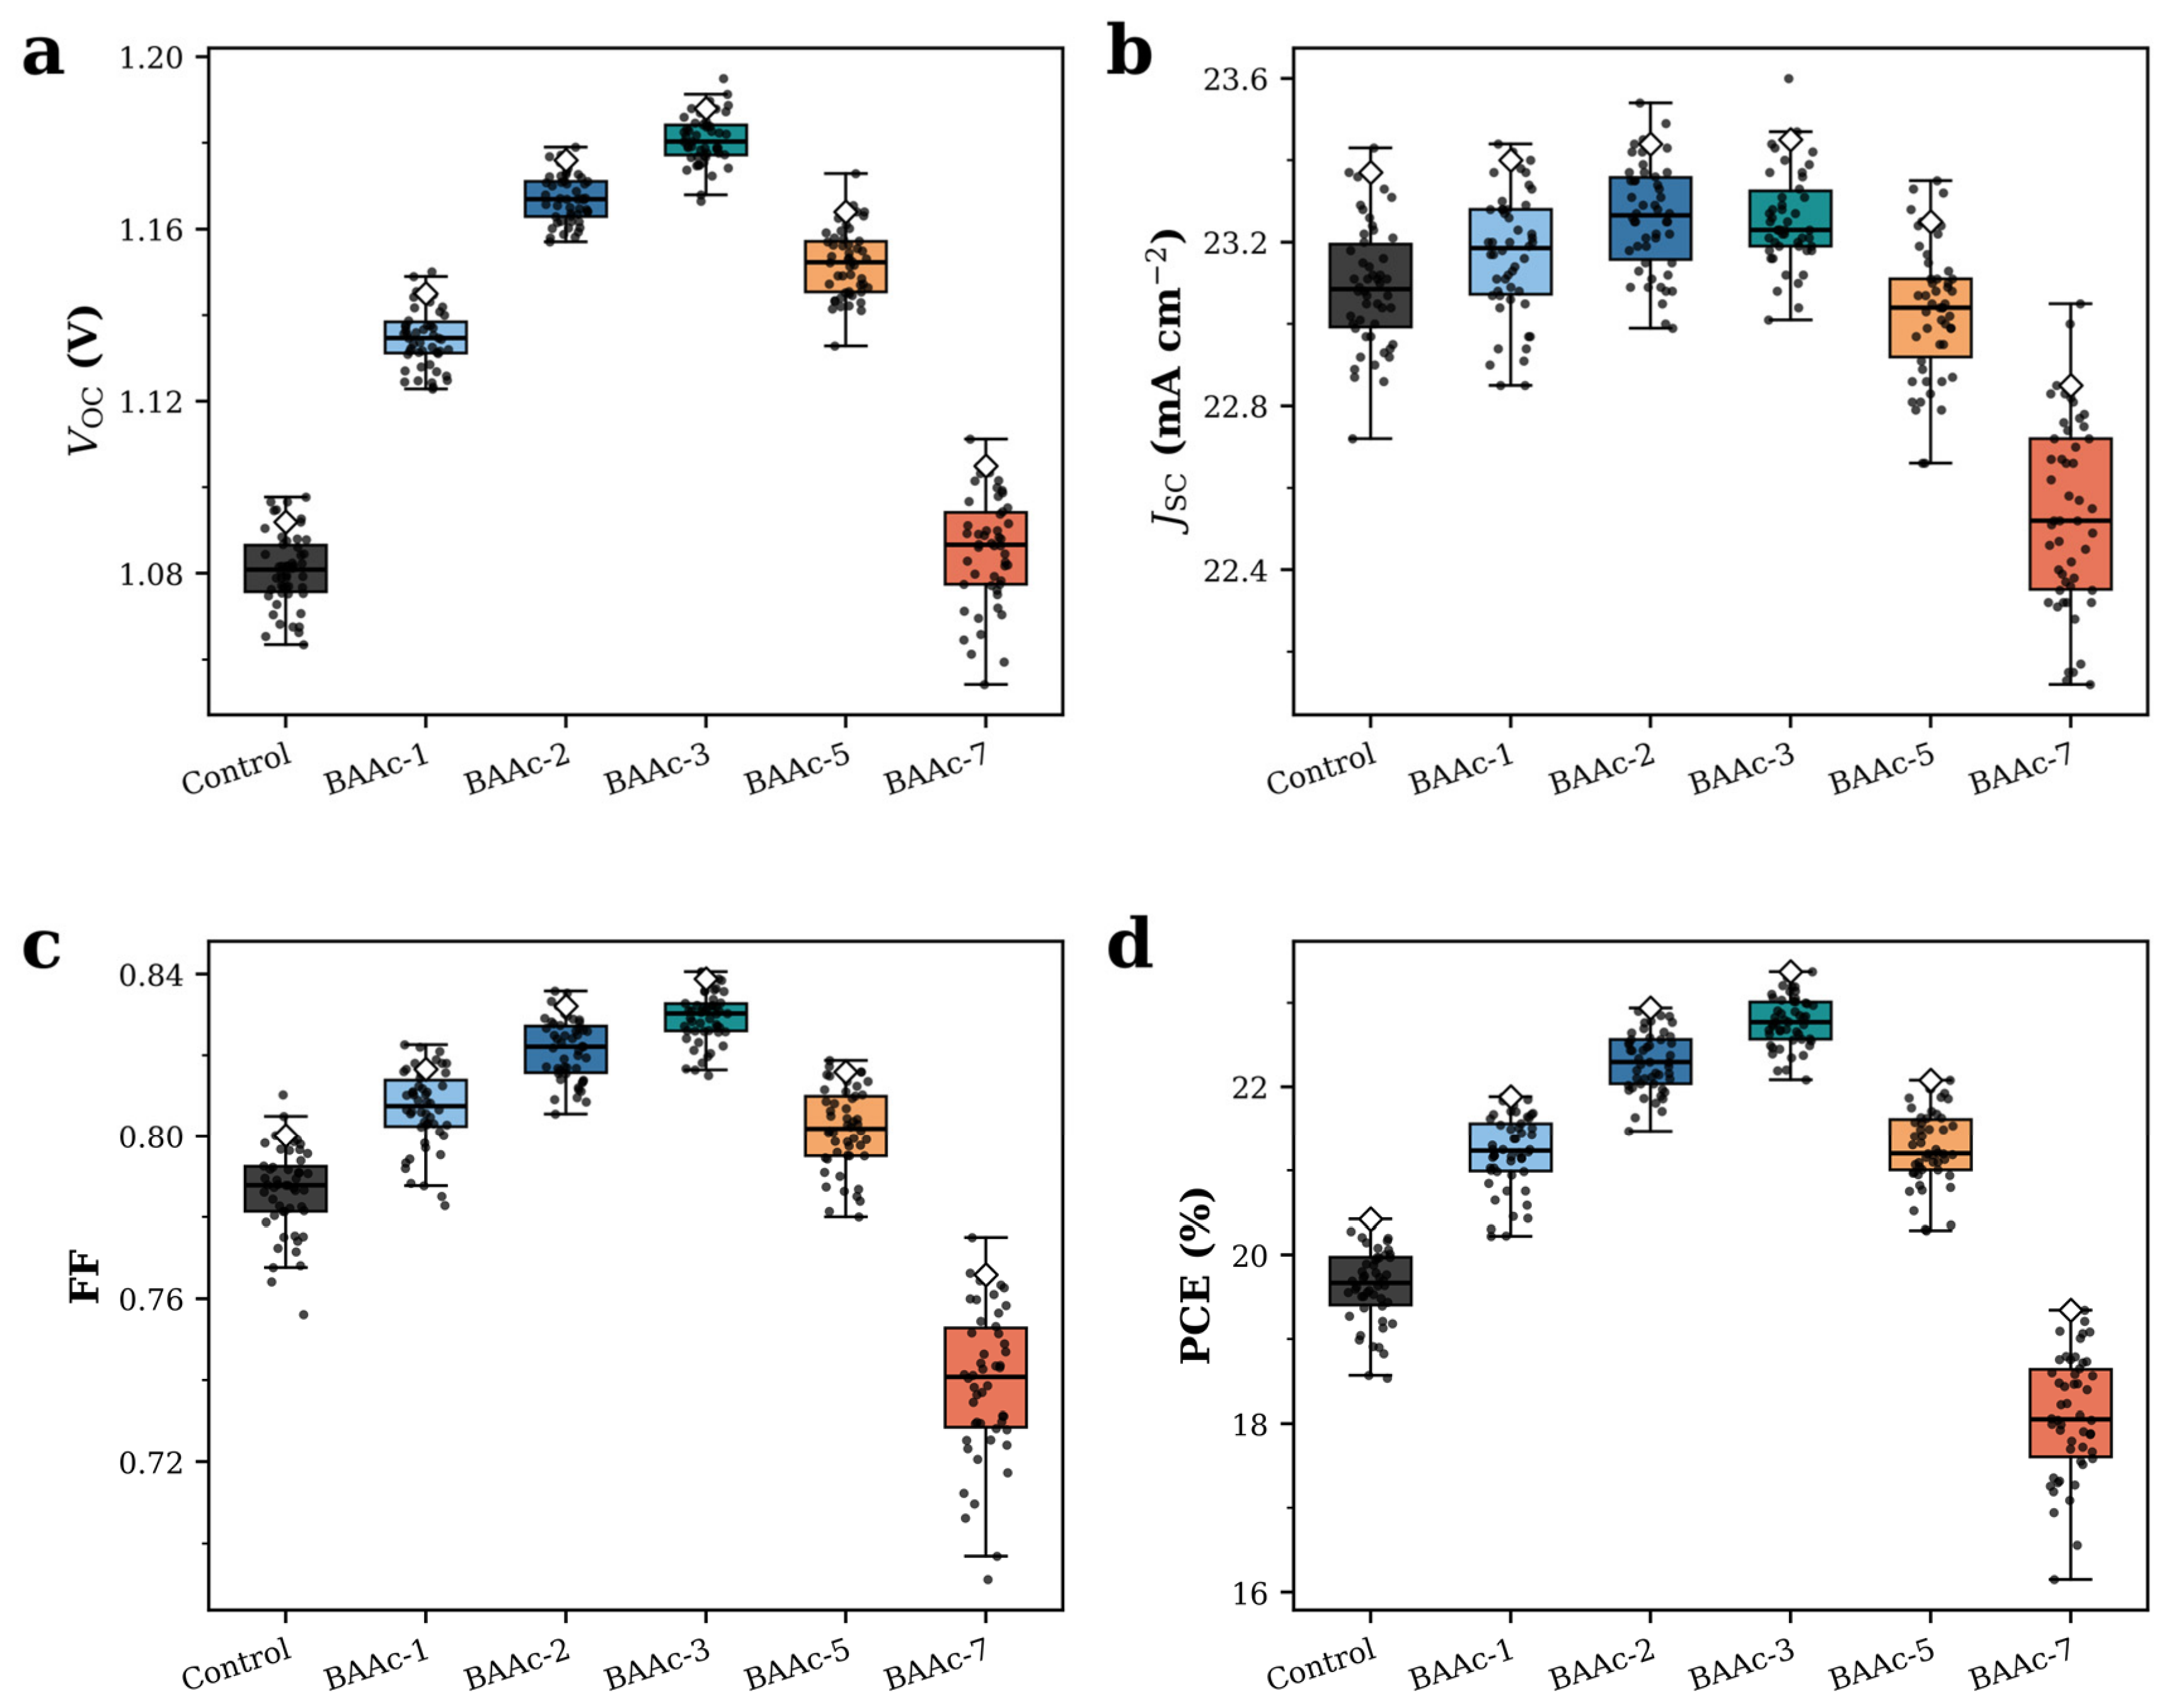
The 50-device distributions in Figure 6 follow the concentration trend established by the film and electrical measurements. Mean Vo⊂ values were 1.08 ± 0.0086, 1.13 ± 0.0069, 1.16 ± 0.0056, 1.18 ± 0.0057, 1.15 ± 0.0079, and 1.08 ± 0.0127 V for the control, BAAc-1, BAAc-2, BAAc-3, BAAc-5, and BAAc-7, respectively. The mean Js⊂ changed within a narrower range: 23.091 ± 0.150, 23.170 ± 0.154, 23.261 ± 0.133, 23.260 ± 0.119, 23.030 ± 0.164, and 22.533 ± 0.232 mA cm−2, respectively.
Figure 6.
Statistical distributions from 50 devices per composition: (a) Vo⊂, (b) Js⊂, (c) FF, and (d) PCE for control, BAAc-1, BAAc-2, BAAc-3, BAAc-5, and BAAc-7.
The FF distributions gave 0.7864 ± 0.0107, 0.8067 ± 0.0098, 0.8215 ± 0.0075, 0.8292 ± 0.0063, 0.8017 ± 0.0101, and 0.7392 ± 0.0185. The corresponding mean PCEs were 19.63 ± 0.45%, 21.21 ± 0.44%, 22.30 ± 0.36%, 22.77 ± 0.30%, 21.27 ± 0.44%, and 18.08 ± 0.71%, respectively. The coefficient of variation of PCE decreased from 2.29% for the control to 1.31% for BAAc-3 and increased to 3.94% for BAAc-7. The BAAc-3 group therefore combined the highest mean output with the narrowest efficiency distribution. The improvement is concentrated in Vo⊂ and FF, matching the lower recombination and transport losses in Figure 5.
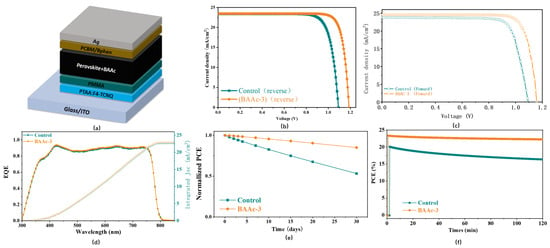
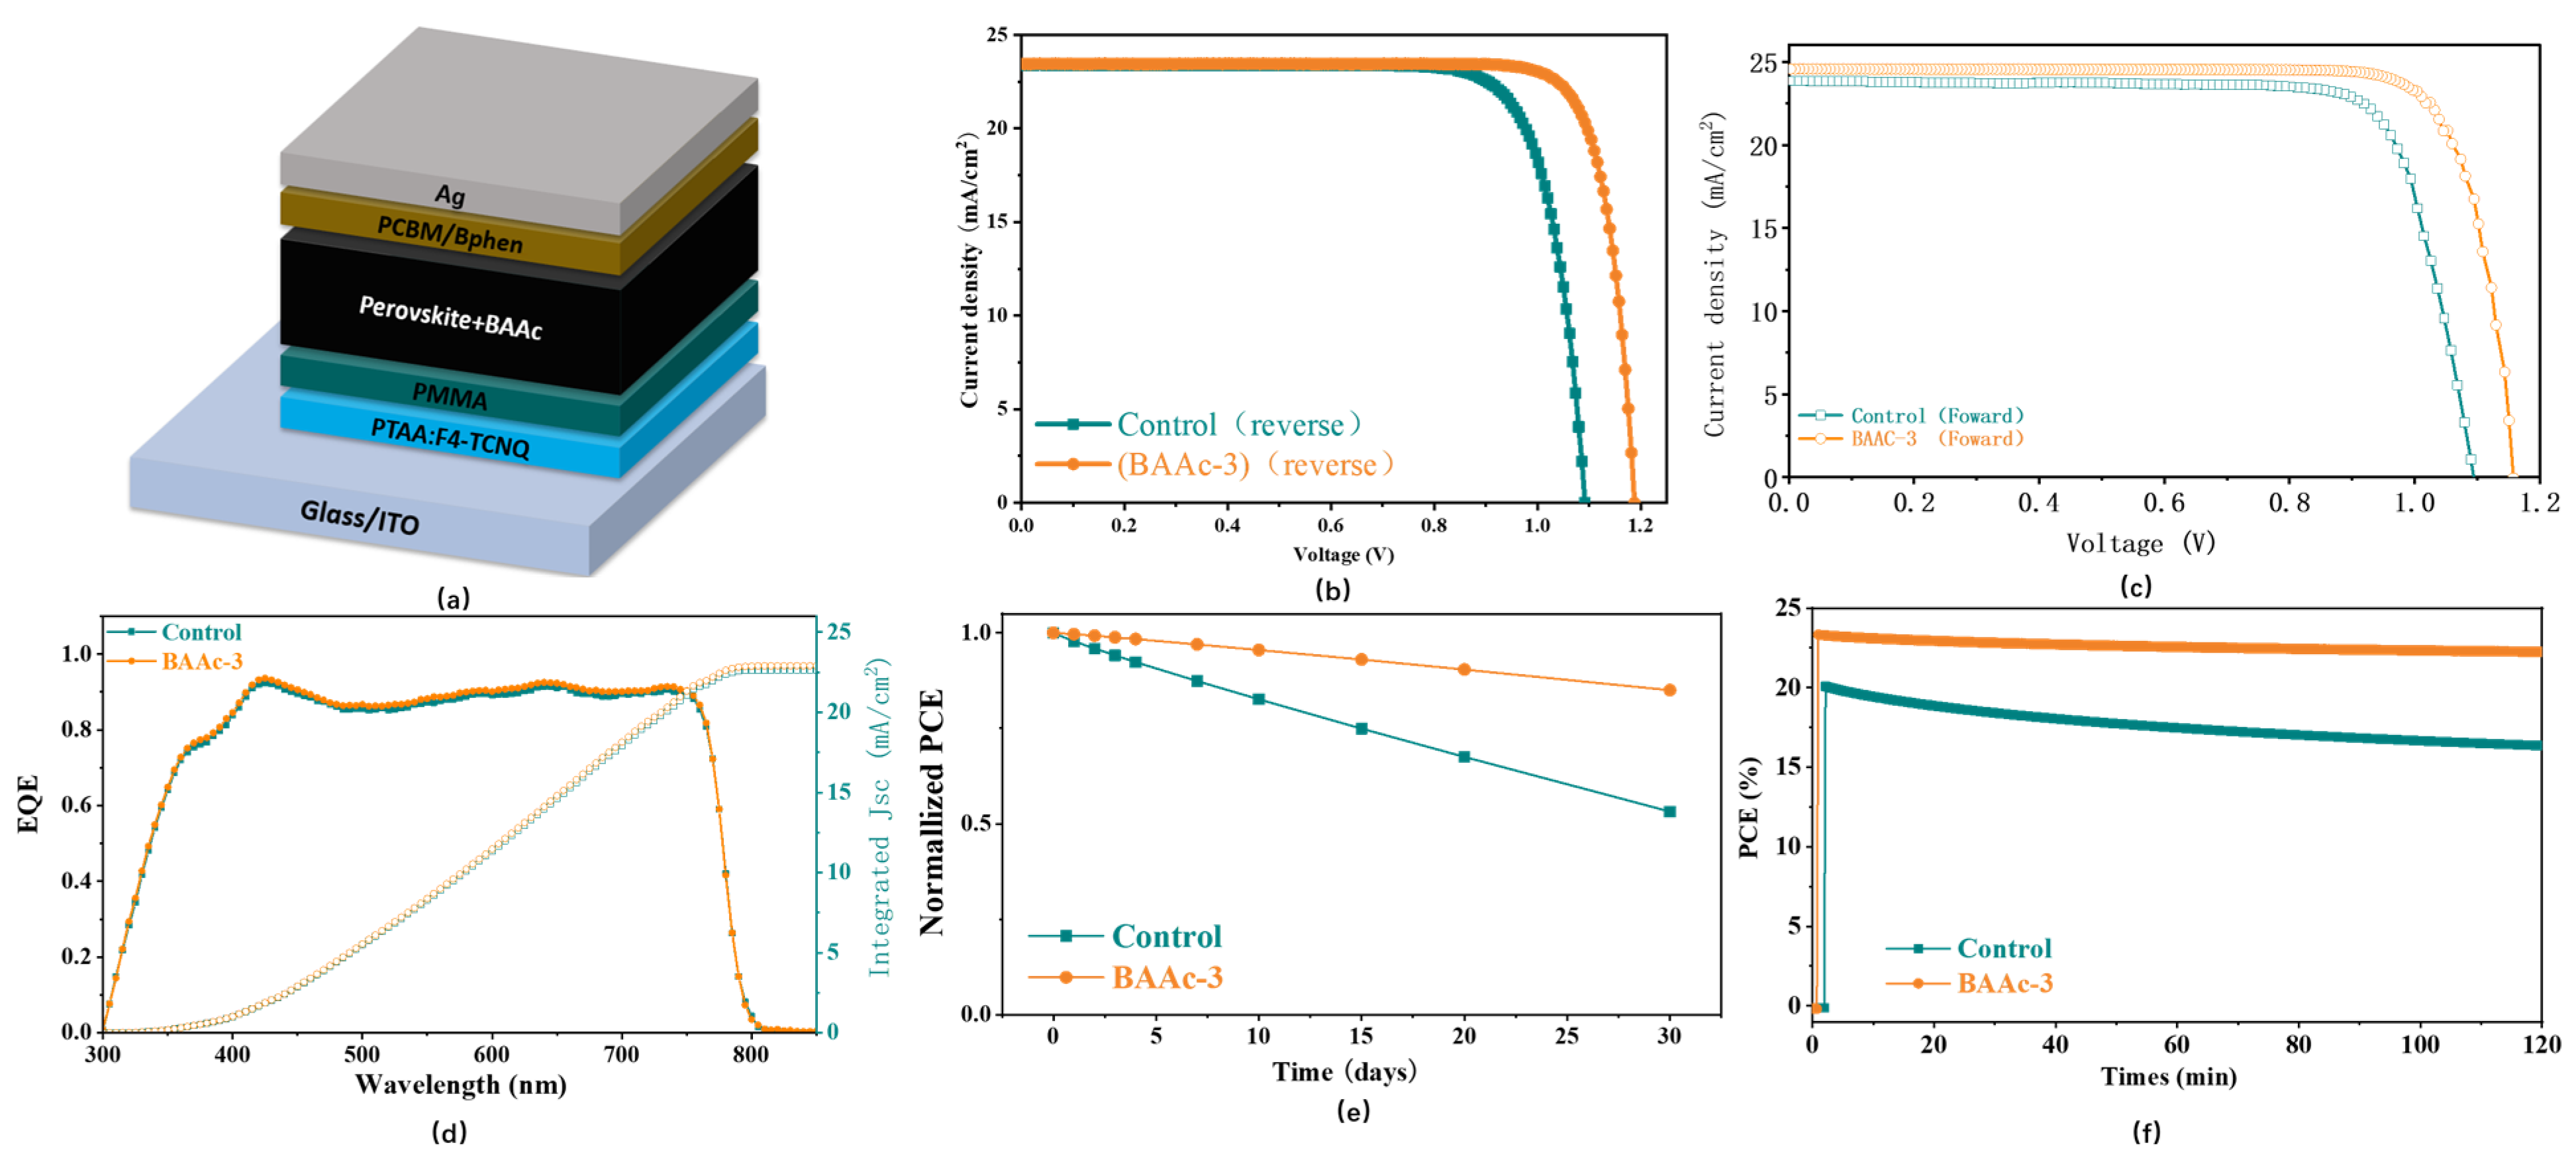
Figure 7a shows the inverted device architecture, while Figure 7b,c compares the reverse- and forward-scan J–V curves of the control and BAAc-3 acquired at 50 mV s−1. The paired traces preserve the performance ranking between the two compositions and show limited scan-direction separation over the measured voltage range. Reverse scans remain the basis of the champion and statistical values to maintain a single reporting convention; the bidirectional comparison is used only as a hysteresis check. The concentration-dependent champion PCEs were 20.42%, 21.88%, 22.94%, 23.37%, 22.08%, and 19.34% for the control, BAAc-1, BAAc-2, BAAc-3, BAAc-5, and BAAc-7, respectively (Table 5). The 2.95 percentage-point gain from the control to BAAc-3 arose mainly from a 96 mV increase in Vo⊂ and a 0.039 increase in FF, whereas Js⊂ increased by only 0.08 mA cm−2. This partition is consistent with lower nonradiative recombination and improved extraction. The present dataset does not separate these contributions from a possible change in surface potential or energy alignment because no UPS or Kelvin probe measurement was performed. The EQE-integrated current densities in Figure 7d are 22.65 and 22.91 mA cm−2 for the control and BAAc-3, respectively, 3.08% and 2.30% below the J–V-derived values and the dotted line represents the integrated current. The mismatch is attributed to spectral mismatch, aperture alignment, monochromator bandwidth, and the different acquisition geometries; neither dataset was rescaled.
Figure 7.
Device architecture, photovoltaic performance, and stability: (a) inverted device structure glass/ITO/PTAA:F4-TCNQ/PMMA/perovskite/PC61BM/Bphen/Ag; (b) representative reverse-scan J–V curves of control and BAAc-3 devices; (c) corresponding forward-scan J–V curves; (d) EQE spectra with integrated current densities; (e) normalized PCE during 30 days of dry–dark shelf storage; and (f) PCE during 120 min of continuous MPP tracking under one-sun illumination.
Table 5.
Statistical and champion photovoltaic parameters of the six BAAc concentrations.
Dry–dark shelf stability is shown in Figure 7e. Unencapsulated devices were stored at 25 ± 2 °C and 15 ± 5% relative humidity. After 30 days, the control and BAAc-3 retained 53.2% and 85.0% of their initial efficiencies, respectively. The improved retention is consistent with the reduced grain-boundary and recombination indicators, but no specific moisture-barrier mechanism is assigned. In accordance with ISOS reporting principles [15], this result is described as a preliminary dry–dark shelf comparison rather than a standardized operational lifetime.
The 120 min MPP traces in Figure 7f provide a short-duration check of the swept J–V values. At 5.04 min, the control and BAAc-3 delivered 19.80% and 23.20%, respectively; after 120 min, the outputs were 16.35% and 22.25%, respectively. The initial relaxation can include light soaking, thermal equilibration, and ion redistribution in addition to irreversible degradation, so it is described as burn-in/relaxation rather than assigned to a single process. From the measured traces, the control device reached T95 and T90 at approximately 16.1 and 39.4 min, respectively, whereas BAAc-3 remained above both thresholds throughout the 120 min window (T95 and T90 > 120 min). These values quantify the short measurement window and are not extrapolated to long-term lifetime.
Table 6 places the optimized BAAc-3 device in the context of related acetate- and alkylammonium-based strategies. The 23.37% champion PCE is lower than the 25.62% and 26.12% reported for the BAAc systems in references [31,32], respectively; however, direct efficiency ranking is not used because the absorber composition, device architecture, additive definition, and stability protocol differ among the studies. The closest MAAc benchmark reached 23.68% [29]. In the absence of a same-batch MAAc control, this comparison does not establish a cation-size or steric advantage. The distinguishing result of the present work is the six-point concentration window in an MA/Br-containing inverted triple-cation system, including the reversal of the morphological, electrical, and photovoltaic trends at excessive loading.
Table 6.
Comparison with selected acetate-, alkylammonium-, and ionic-liquid-modified perovskite solar cells.
4. Conclusions
The systematic BAAc series revealed a non-monotonic relationship among additive loading, grain-size distribution, defect response, and photovoltaic performance. The mean equivalent-circle diameter increased from 0.508 μm for the control to 0.719 μm for BAAc-3, while the median increased from 0.495 to 0.688 μm, respectively. The CV remained broad (35.18–41.41%), so the morphological result is grain coarsening rather than a demonstrated narrowing of the size distribution. Cross-sectional SEM confirmed continuous absorber layers with comparable thicknesses of approximately 500 ± 20 nm. BAAc-3 also showed the lowest Rtr (222.17 ± 9.52 Ω), the highest Rrec (8.211 ± 0.061 kΩ), a longer PL lifetime, a lower ideality factor, and lower tDOS/SCLC estimates, without a resolvable bandgap shift. The agreement of these independent measurements supports reduced nonradiative recombination and transport loss as the immediate device-level explanation.
The BAAc-3 champion device reached 23.37%, and the 50-device mean increased to 22.77 ± 0.30%, compared with 20.42% and 19.63 ± 0.45%, respectively, for the control. At 7 mol%, the favorable electrical trend reversed and the champion PCE decreased to 19.34%, which defines an over-treatment boundary. This study does not directly identify an Ac−–Pb2+ complex or a BA-rich reduced-dimensional phase, and the absence of UPS/Kelvin probe data prevents the separation of defect passivation from possible energy-level changes. The EIS resistance parameters are well constrained, but the systematic high-frequency residuals and the Qtr/ntr correlation limit detailed interpretation of the high-frequency CPE branch. The 30-day shelf and 120 min MPP tests establish comparative trends under the stated conditions but do not constitute long-term lifetime certification. Future work should prioritize direct coordination spectroscopy, work-function analysis, multi-area quantitative morphology, and longer standardized MPP testing. Within these limitations, the robust conclusion is that BAAc acts as a strongly concentration-sensitive precursor additive in this inverted triple-cation process.
Author Contributions
Conceptualization, S.C. and Y.Y.; methodology, H.Z.; software, H.Z.; valida tion, H.Z. and Y.Y.; formal analysis, H.Z.; investigation, H.Z.; resources, H.Z.; data curation, H.Z.; writing—original draft preparation, H.Z.; writing—review and editing, H.Z.; visualization, H.Z.; supervision, S.C.; project administration, H.Z.; funding acquisition, H.Z. All authors have read and agreed to the published version of the manuscript.
Funding
This research was funded by Innovation Teams of Ordinary Universities in Guangdong Province (Natural Sciences) (2024KCXTD065); The Focal Area Program of the Guangdong Higher Education Institute (Grant No. 2025ZDZX1081); and the Doctoral Research Initiation Project (BS22024008).
Data Availability Statement
The original contributions presented in this study are included in the article; further inquiries can be directed to the corresponding author.
Conflicts of Interest
The authors declare no conflicts of interest. The funders had a role in the design of the study, writing of the manuscript, and in the decision to publish the results.
References
- Kojima, A.; Teshima, K.; Shirai, Y.; Miyasaka, T. Organometal Halide Perovskites as Visible-Light Sensitizers for Photovoltaic Cells. J. Am. Chem. Soc. 2009, 131, 6050–6051. [Google Scholar] [CrossRef] [Scilit] [PubMed]
- Green, M.A.; Ho-Baillie, A.; Snaith, H.J. The Emergence of Perovskite Solar Cells. Nat. Photonics 2014, 8, 506–514. [Google Scholar] [CrossRef] [Scilit]
- Suchikova, Y.; Nazarovets, S.; Konuhova, M.; Popov, A.I. Binary Oxide Ceramics (TiO2, ZnO, Al2O3, SiO2, CeO2, Fe2O3, and WO3) for Solar Cell Applications: A Comparative and Bibliometric Analysis. Ceramics 2025, 8, 119. [Google Scholar] [CrossRef] [Scilit]
- Cheng, D.; Gao, Y.; Yang, C. A Comprehensive Review on Wafering of Silicon Substrate for Photovoltaic Solar Cell. Sol. Energy 2025, 301, 113977. [Google Scholar] [CrossRef] [Scilit]
- Prete, P.; Lovergine, N. High Efficiency III–V Nanowire Solar Cells: The Road Ahead. Nano Futures 2025, 9, 042502. [Google Scholar] [CrossRef] [Scilit]
- Chen, G.; Sun, G.; Ding, Y.J.; Prete, P.; Miccoli, I.; Lovergine, N.; Shtrikman, H.; Kung, P.; Livneh, T.; Spanier, J.E. Direct Measurement of Band Edge Discontinuity in Individual Core–Shell Nanowires by Photocurrent Spectroscopy. Nano Lett. 2013, 13, 4152–4157. [Google Scholar] [CrossRef] [Scilit] [PubMed]
- Saliba, M.; Matsui, T.; Seo, J.-Y.; Domanski, K.; Correa-Baena, J.-P.; Nazeeruddin, M.K.; Zakeeruddin, S.M.; Tress, W.; Abate, A.; Hagfeldt, A.; et al. Cesium-Containing Triple Cation Perovskite Solar Cells: Improved Stability, Reproducibility and High Efficiency. Energy Environ. Sci. 2016, 9, 1989–1997. [Google Scholar] [CrossRef] [Scilit] [PubMed]
- Liu, S.; Li, J.; Xiao, W.; Chen, R.; Sun, Z.; Zhang, Y.; Lei, X.; Hu, S.; Kober-Czerny, M.; Wang, J.; et al. Buried Interface Molecular Hybrid for Inverted Perovskite Solar Cells. Nature 2024, 632, 536–542. [Google Scholar] [CrossRef] [Scilit] [PubMed]
- Li, Q.; Liu, H.; Hou, C.-H.; Yan, H.; Li, S.; Chen, P.; Xu, H.; Yu, W.-Y.; Zhao, Y.; Sui, Y.; et al. Harmonizing the Bilateral Bond Strength of the Interfacial Molecule in Perovskite Solar Cells. Nat. Energy 2024, 9, 1506–1516. [Google Scholar] [CrossRef] [Scilit]
- Chen, R.; Wang, J.; Liu, Z.; Ren, F.; Liu, S.; Zhou, J.; Wang, H.; Meng, X.; Zhang, Z.; Guan, X.; et al. Reduction of Bulk and Surface Defects in Inverted Methylammonium- and Bromide-Free Formamidinium Perovskite Solar Cells. Nat. Energy 2023, 8, 839–849. [Google Scholar] [CrossRef] [Scilit]
- Zhang, S.; Ye, F.; Wang, X.; Chen, R.; Zhang, H.; Zhan, L.; Jiang, X.; Li, Y.; Ji, X.; Liu, S.; et al. Minimizing Buried Interfacial Defects for Efficient Inverted Perovskite Solar Cells. Science 2023, 380, 404–409. [Google Scholar] [CrossRef] [Scilit] [PubMed]
- Stolterfoht, M.; Caprioglio, P.; Wolff, C.M.; Márquez, J.A.; Nordmann, J.; Zhang, S.; Rothhardt, D.; Hörmann, U.; Amir, Y.; Redinger, A.; et al. The Impact of Energy Alignment and Interfacial Recombination on the Internal and External Open-Circuit Voltage of Perovskite Solar Cells. Energy Environ. Sci. 2019, 12, 2778–2788. [Google Scholar] [CrossRef] [Scilit]
- Shao, Y.; Fang, Y.; Li, T.; Wang, Q.; Dong, Q.; Deng, Y.; Yuan, Y.; Wei, H.; Wang, M.; Gruverman, A.; et al. Grain Boundary Dominated Ion Migration in Polycrystalline Organic–Inorganic Halide Perovskite Films. Energy Environ. Sci. 2016, 9, 1752–1759. [Google Scholar] [CrossRef] [Scilit]
- Boyd, C.C.; Cheacharoen, R.; Leijtens, T.; McGehee, M.D. Understanding Degradation Mechanisms and Improving Stability of Perovskite Photovoltaics. Chem. Rev. 2019, 119, 3418–3451. [Google Scholar] [CrossRef] [Scilit] [PubMed]
- Khenkin, M.V.; Katz, E.A.; Abate, A.; Bardizza, G.; Berry, J.J.; Brabec, C.; Brunetti, F.; Bulović, V.; Burlingame, Q.; Di Carlo, A.; et al. Consensus Statement for Stability Assessment and Reporting for Perovskite Photovoltaics Based on ISOS Procedures. Nat. Energy 2020, 5, 35–49. [Google Scholar] [CrossRef] [Scilit]
- Li, F.; Deng, X.; Shi, Z.; Wu, S.; Zeng, Z.; Wang, D.; Li, Y.; Qi, F.; Zhang, Z.; Yang, Z.; et al. Hydrogen-Bond-Bridged Intermediate for Perovskite Solar Cells with Enhanced Efficiency and Stability. Nat. Photonics 2023, 17, 478–484. [Google Scholar] [CrossRef] [Scilit]
- Liang, Z.; Zhang, Y.; Xu, H.; Chen, W.; Liu, B.; Zhang, J.; Zhang, H.; Wang, Z.; Kang, D.-H.; Zeng, J.; et al. Homogenizing Out-of-Plane Cation Composition in Perovskite Solar Cells. Nature 2023, 624, 557–563. [Google Scholar] [CrossRef] [Scilit] [PubMed]
- Wei, D.; Wang, M.; Cai, S.; Meng, N.; Li, Y.; Gao, J.; He, X.; Zhang, R.; Cai, Q.; Chen, G.; et al. Bidirectional Synergistic Crystallization Strategy for Regulating Growth Kinetics toward Highly Efficient and Stable Perovskite Solar Cells. Adv. Funct. Mater. 2024, 34, 2410679. [Google Scholar] [CrossRef] [Scilit]
- Bai, S.; Da, P.; Li, C.; Wang, Z.; Yuan, Z.; Fu, F.; Kawecki, M.; Liu, X.; Sakai, N.; Wang, J.T.-W.; et al. Planar Perovskite Solar Cells with Long-Term Stability Using Ionic Liquid Additives. Nature 2019, 571, 245–250. [Google Scholar] [CrossRef] [Scilit] [PubMed]
- Wang, S.; Yang, B.; Han, J.; He, Z.; Li, T.; Cao, Q.; Yang, J.; Suo, J.; Li, X.; Liu, Z.; et al. Polymeric Room-Temperature Molten Salt as a Multifunctional Additive toward Highly Efficient and Stable Inverted Planar Perovskite Solar Cells. Energy Environ. Sci. 2020, 13, 5068–5079. [Google Scholar] [CrossRef] [Scilit]
- Wang, F.; Zhou, X.; Liang, X.; Duan, D.; Ge, C.-Y.; Lin, H.; Zhu, Q.; Li, L.; Hu, H. Solvent Engineering of Ionic Liquids for Stable and Efficient Perovskite Solar Cells. Adv. Energy Sustain. Res. 2023, 4, 2200140. [Google Scholar] [CrossRef] [Scilit]
- Jiang, X.; Wang, X.; Wu, X.; Zhang, S.; Liu, B.; Zhang, D.; Li, B.; Xiao, P.; Xu, F.; Lu, H.; et al. Strain Regulation via Pseudo Halide-Based Ionic Liquid toward Efficient and Stable α-FAPbI3 Inverted Perovskite Solar Cells. Adv. Energy Mater. 2023, 13, 2300700. [Google Scholar] [CrossRef] [Scilit]
- Gu, L.; Ran, C.; Chao, L.; Bao, Y.; Hui, W.; Wang, Y.; Chen, Y.; Gao, X.; Song, L. Designing Ionic Liquids as the Solvent for Efficient and Stable Perovskite Solar Cells. ACS Appl. Mater. Interfaces 2022, 14, 22870–22878. [Google Scholar] [CrossRef] [Scilit] [PubMed]
- Gu, H.; Niu, T.; Zuo, S.; Cai, Y.; Chao, L.; Müller-Buschbaum, P.; Xia, Y.; Zhang, J.; Xing, G.; Chen, Y. Stable Metal–Halide Perovskite Colloids in Protic Ionic Liquid. CCS Chem. 2022, 4, 3264–3274. [Google Scholar] [CrossRef] [Scilit]
- Zhang, S.; Xiao, T.; Fadaei Tirani, F.; Scopelliti, R.; Nazeeruddin, M.K.; Zhu, D.; Dyson, P.J.; Fei, Z. The Chemistry of the Passivation Mechanism of Perovskite Films with Ionic Liquids. Inorg. Chem. 2022, 61, 5010–5016. [Google Scholar] [CrossRef] [Scilit] [PubMed]
- Wang, F.; Zhou, K.; Liang, X.; Zhou, X.; Duan, D.; Ge, C.; Zhang, X.; Shi, Y.; Lin, H.; Zhu, Q.; et al. Revealing Size-Dependency of Ionic Liquid to Assist Perovskite Film Formation Mechanism for Efficient and Durable Perovskite Solar Cells. Small Methods 2024, 8, 2300210. [Google Scholar] [CrossRef] [Scilit] [PubMed]
- Gao, W.; Ding, J.; Ma, Q.; Zhang, H.; Zhang, J.; Zhang, Z.; Li, M.; Wang, Y.; Zhang, B.; Pauporté, T.; et al. Synergistic Modulation of Orientation and Steric Hindrance Induced by Alkyl Chain Length in Ammonium Salt Passivator toward High-Performance Inverted Perovskite Solar Cells and Modules. Adv. Mater. 2025, 37, 2413304. [Google Scholar] [CrossRef] [Scilit] [PubMed]
- Shi, L.; Yuan, H.; Sun, X.; Li, X.; Zhu, W.; Wang, J.; Duan, L.; Li, Q.; Zhou, Z.; Huang, Z.; et al. MAAc Ionic Liquid-Assisted Defect Passivation for Efficient and Stable CsPbIBr2 Perovskite Solar Cells. ACS Appl. Energy Mater. 2021, 4, 10584–10592. [Google Scholar] [CrossRef] [Scilit]
- Zhang, H.; Song, J.; Deng, Y. Protic Ionic-Liquid Precursor Engineering with Methylammonium Acetate for Efficient and Stable Inverted Triple-Cation Perovskite Solar Cells. Crystals 2026, 16, 19. [Google Scholar] [CrossRef] [Scilit]
- Gao, D.; Li, B.; Li, Z.; Wu, X.; Zhang, S.; Zhao, D.; Jiang, X.; Zhang, C.; Wang, Y.; Li, Z.; et al. Highly Efficient Flexible Perovskite Solar Cells through Pentylammonium Acetate Modification with Certified Efficiency of 23.35%. Adv. Mater. 2023, 35, 2206387. [Google Scholar] [CrossRef] [Scilit] [PubMed]
- Hao, M.; Yang, J.; Yu, W.; Lawrie, B.J.; Guo, P.; Zhang, X.; Duan, T.; Xiao, T.; Chen, L.; Xiang, Y.; et al. Nanoscopic Cross-Grain Cation Homogenization in Perovskite Solar Cells. Nat. Nanotechnol. 2025, 20, 630–638. [Google Scholar] [CrossRef] [Scilit] [PubMed]
- Zhang, Q.; Zhao, C.; Xu, J.; Shen, F.; Wang, Y.; Ji, B.; Guan, X.; Ma, S.; Wu, Y.; Li, Z.; et al. Multifunctional Butylammonium Acetate Additive Regulates FAPbI3 Film Growth and Defect Passivation for Highly Efficient and Stable Perovskite Solar Cells with 26.12% Efficiency. Adv. Funct. Mater. 2025, 35, 2507934. [Google Scholar] [CrossRef] [Scilit]
- Sajid, S.; Alzahmi, S.; Tabet, N.; Al-Haik, M.Y.; Mahmoud, S.T.; Haik, Y.; Elseman, A.M.; Obaidat, I.M. A Facile Approach for Fabricating Efficient and Stable Perovskite Solar Cells. Nanoscale 2025, 17, 398–406. [Google Scholar] [CrossRef] [Scilit] [PubMed]
- Xu, C.Y.; Hu, W.; Wang, G.; Niu, L.; Elseman, A.M.; Liao, L.; Yao, Y.; Xu, G.; Luo, L.; Liu, D.; et al. Coordinated Optical Matching of a Texture Interface Made from Demixing Blended Polymers for High-Performance Inverted Perovskite Solar Cells. ACS Nano 2020, 14, 196–203. [Google Scholar] [CrossRef] [Scilit] [PubMed]
- Hu, L.; Zhang, L.; Ren, W.; Zhang, C.; Wu, Y.; Liu, Y.; Sun, Q.; Dai, Z.; Cui, Y.; Cai, L.; et al. High Efficiency Perovskite Solar Cells with PTAA Hole Transport Layer Enabled by PMMA:F4-TCNQ Buried Interface Layer. J. Mater. Chem. C 2022, 10, 9714–9722. [Google Scholar] [CrossRef] [Scilit]
- Le Corre, V.M.; Duijnstee, E.A.; El Tambouli, O.; Ball, J.M.; Snaith, H.J.; Lim, J.; Koster, L.J.A. Revealing Charge Carrier Mobility and Defect Densities in Metal Halide Perovskites via Space-Charge-Limited Current Measurements. ACS Energy Lett. 2021, 6, 1087–1094. [Google Scholar] [CrossRef] [Scilit] [PubMed]
- Dong, Q.; Fang, Y.; Shao, Y.; Mulligan, P.; Qiu, J.; Cao, L.; Huang, J. Electron–Hole Diffusion Lengths > 175 μm in Solution-Grown CH3NH3PbI3 Single Crystals. Science 2015, 347, 967–970. [Google Scholar] [CrossRef] [Scilit] [PubMed]
- Chao, L.; Niu, T.; Xia, Y.; Chen, Y.; Huang, W. Ionic Liquid for Perovskite Solar Cells: An Emerging Solvent Engineering Technology. Acc. Mater. Res. 2021, 2, 1059–1070. [Google Scholar] [CrossRef] [Scilit]
- Wang, Z.; Lin, Q.; Chmiel, F.P.; Sakai, N.; Herz, L.M.; Snaith, H.J. Efficient Ambient-Air-Stable Solar Cells with 2D–3D Heterostructured Butylammonium–Caesium–Formamidinium Lead Halide Perovskites. Nat. Energy 2017, 2, 17135. [Google Scholar] [CrossRef] [Scilit]
- de Quilettes, D.W.; Vorpahl, S.M.; Stranks, S.D.; Nagaoka, H.; Eperon, G.E.; Ziffer, M.E.; Snaith, H.J.; Ginger, D.S. Impact of Microstructure on Local Carrier Lifetime in Perovskite Solar Cells. Science 2015, 348, 683–686. [Google Scholar] [CrossRef] [Scilit] [PubMed]
- Sherkar, T.S.; Momblona, C.; Gil-Escrig, L.; Ávila, J.; Sessolo, M.; Bolink, H.J.; Koster, L.J.A. Recombination in Perovskite Solar Cells: Significance of Grain Boundaries, Interface Traps, and Defect Ions. ACS Energy Lett. 2017, 2, 1214–1222. [Google Scholar] [CrossRef] [Scilit] [PubMed]
- Jacobsson, T.J.; Correa-Baena, J.-P.; Halvani Anaraki, E.; Philippe, B.; Stranks, S.D.; Bouduban, M.E.F.; Tress, W.; Schenk, K.; Teuscher, J.; Moser, J.-E.; et al. Unreacted PbI2 as a Double-Edged Sword for Enhancing the Performance of Perovskite Solar Cells. J. Am. Chem. Soc. 2016, 138, 10331–10343. [Google Scholar] [CrossRef] [Scilit] [PubMed]
- Brik, M.G.; Srivastava, A.M.; Popovs, A. A Few Common Misconceptions in the Interpretation of Experimental Spectroscopic Data. Opt. Mater. 2022, 127, 112276. [Google Scholar] [CrossRef] [Scilit]
- Wetzelaer, G.J.A.H.; Scheepers, M.; Sempere, A.M.; Momblona, C.; Ávila, J.; Bolink, H.J. Trap-Assisted Non-Radiative Recombination in Organic–Inorganic Perovskite Solar Cells. Adv. Mater. 2015, 27, 1837–1841. [Google Scholar] [CrossRef] [Scilit] [PubMed]
- Leijtens, T.; Eperon, G.E.; Barker, A.J.; Grancini, G.; Zhang, W.; Ball, J.M.; Kandada, A.R.S.; Snaith, H.J.; Petrozza, A. Carrier Trapping and Recombination: The Role of Defect Physics in Enhancing the Open Circuit Voltage of Metal Halide Perovskite Solar Cells. Energy Environ. Sci. 2016, 9, 3472–3481. [Google Scholar] [CrossRef] [Scilit]
- Staub, F.; Hempel, H.; Hebig, J.-C.; Mock, J.; Paetzold, U.W.; Rau, U.; Unold, T.; Kirchartz, T. Beyond Bulk Lifetimes: Insights into Lead Halide Perovskite Films from Time-Resolved Photoluminescence. Phys. Rev. Appl. 2016, 6, 044017. [Google Scholar] [CrossRef] [Scilit]
- Caprioglio, P.; Wolff, C.M.; Sandberg, O.J.; Armin, A.; Rech, B.; Albrecht, S.; Neher, D.; Stolterfoht, M. On the Origin of the Ideality Factor in Perovskite Solar Cells. Adv. Energy Mater. 2020, 10, 2000502. [Google Scholar] [CrossRef] [Scilit]
- Pockett, A.; Eperon, G.E.; Peltola, T.; Snaith, H.J.; Walker, A.; Peter, L.M.; Cameron, P.J. Characterization of Planar Lead Halide Perovskite Solar Cells by Impedance Spectroscopy, Open-Circuit Photovoltage Decay, and Intensity-Modulated Photovoltage/Photocurrent Spectroscopy. J. Phys. Chem. C 2015, 119, 3456–3465. [Google Scholar] [CrossRef] [Scilit]
- Walter, T.; Herberholz, R.; Müller, C.; Schock, H.W. Determination of Defect Distributions from Admittance Measurements and Application to Cu(In,Ga)Se2-Based Heterojunctions. J. Appl. Phys. 1996, 80, 4411–4420. [Google Scholar] [CrossRef] [Scilit]

Disclaimer/Publisher’s Note: The statements, opinions and data contained in all publications are solely those of the individual author(s) and contributor(s) and not of MDPI and/or the editor(s). MDPI and/or the editor(s) disclaim responsibility for any injury to people or property resulting from any ideas, methods, instructions or products referred to in the content. |
© 2026 by the authors. Licensee MDPI, Basel, Switzerland. This article is an open access article distributed under the terms and conditions of the Creative Commons Attribution (CC BY) license.