


Abstract
We investigate the existence and properties of defect-induced localized modes in one-dimensional thermal wave crystals governed by the Cattaneo–Vernotte (CV) hyperbolic heat equation. When a single defect layer is introduced into a periodic bilayer of biological tissues, translational symmetry is broken, and a localized thermal excitation emerges within the band gap, characterized by a discrete frequency at which the imaginary part of the Bloch wave vector exhibits a sharp minimum, indicating maximal penetration depth and energy confinement at the defect layer. Using the transfer matrix method, we show that the resonance frequency of this defect mode is determined by the properties of the defect material and its thickness, and is essentially independent of the number of mirror periods surrounding it. The spatial confinement of the mode, by contrast, is governed by the number of mirror periods: increasing this number dramatically sharpens the localization, in direct analogy with a high-quality-factor optical microcavity. We further demonstrate that the defect-mode frequency is continuously tunable across the entire band gap by varying the defect-layer thickness, for three biologically relevant candidate materials. These results establish the CV thermal wave crystal as a platform for engineering localized thermal excitations at the microscale, using materials and layer thicknesses that are experimentally accessible today, and provide a theoretical framework that may motivate future experimental studies on narrowband thermal filtering and biological-tissue characterization.
1. Introduction
The control of heat flow using periodic structures has emerged as a rich direction in heat-transport engineering, driven by the analogy between thermal wave propagation and the behavior of electromagnetic and acoustic waves in photonic and phononic crystals [1,2,3]. When heat transport is governed by the Cattaneo–Vernotte (CV) model [4,5] rather than Fourier’s diffusion law, the parabolic diffusion equation is replaced by a damped wave equation—the thermal analogue of the telegrapher’s equation, whose solutions admit interference effects and band-gap formation in periodic structures. A material relaxation time governs the transition from diffusive to wave-like behavior, and the resulting finite propagation speed sets the length and frequency scales of the periodic structure. This wave-like character enables band-gap formation in periodic multilayers—the so-called thermal wave crystals (TWCs) [6,7]—and opens the possibility of engineering the thermal band structure through unit-cell design [8].
The broader goal of guiding and localizing heat at specific frequencies draws direct inspiration from photonic and phononic crystal physics [9,10]. In photonic crystals, a structural defect within the periodic arrangement breaks translational symmetry and introduces a localized resonance within the band gap [11,12,13]. These defect modes underpin a wide range of devices, from narrowband filters [14] and biosensors [15,16] to microcavity-enhanced emitters [17]. In phononic crystals, analogous defect states have been exploited for acoustic filters, waveguides, and tunable sensors [18,19,20]. In both cases, within the band gap, the Bloch wave vector is purely imaginary, leading to exponential attenuation of waves away from the defect. The defect layer introduces a resonant condition where this attenuation is locally suppressed, producing a confined mode with exponentially decaying tails into the surrounding periodic medium.
Maldovan identified point-defect heat localization—“Thermal lattices”—as one of the six outstanding opportunities offered by thermocrystals [21], alongside heat waveguides, heat imaging, thermo-optics, thermal diodes, and thermal cloaking [10]. Realizing these phenomena requires engineering the phonon spectrum within a narrow hypersonic window around 100–300 GHz through nanostructured Si/Ge alloy films with periodicities of ∼10–20 nm. As Maldovan himself noted, this represents a formidable fabrication challenge, and experimental demonstrations of phonon-based heat localization at defect sites remain outstanding [10,21]. The omnidirectional mirror—another key target identified by Maldovan—has been demonstrated in a one-dimensional porous silicon thermocrystal [22], confirming that band-gap engineering in periodic thermal structures is physically realizable, while also highlighting the stringent nanofabrication requirements of the phononic approach. The present work addresses precisely this challenge, realizing the “Thermal lattices” phenomenology (Maldovan’s Figure 3b in [21]) in the alternative CV framework, where the nanofabrication bottleneck is replaced by length and frequency scales accessible to current experimental techniques.
The CV thermal wave crystal operates on a qualitatively different physical basis and provides access to the same wave phenomena at readily available scales. In CV materials, wave-like heat transport is encoded directly in the material relaxation time , without any requirement for phonon-spectrum engineering. Band gaps consequently form at layer thicknesses of ∼10 μm—three orders of magnitude larger than in thermocrystals—and the relevant frequency scale of ∼0.05–1 Hz is naturally matched by biological-tissue multilayers [6,7]. The two platforms are thus complementary: thermocrystals target hypersonic phonon control at the nanoscale, while CV-TWC systems access the same band-gap physics at the microscale with materials that are experimentally available today. Recent work on CV-TWC systems has addressed topics ranging from Bragg reflection [7] and heterostructure design [8] to omnidirectional band gaps [23] and plane-wave analysis [24,25]. In all of these studies, however, the crystal is perfect and periodic. The effect of a defect layer—and the possibility of energy localization at a specific site—has not been addressed.
The objective of the present work may be viewed in the broader context of wave-crystal physics. Historically, concepts first developed for electronic Bloch waves were later extended to photonic and phononic crystals. Once a new wave equation is shown to support periodic media and band-gap formation, a natural next question is whether the canonical phenomena of wave crystals, such as defect states, cavity modes, localization, coupled cavities, and tunable resonances, also exist within that framework. The present study addresses this question for thermal wave crystals governed by the Cattaneo–Vernotte equation, an intrinsically dissipative wave system describing non-Fourier heat transport.
Here we investigate defect-induced localized modes in a one-dimensional CV thermal wave crystal formed by a stratum corneum/dermis bilayer superlattice. Using the transfer matrix method (TMM), we construct the defect supercell, compute the complex band structure, and identify the localized state through a sharp minimum of the imaginary Bloch wave vector. We show that the defect-mode frequency is continuously tunable across the gap by varying the defect-layer thickness, and that spatial confinement increases with the number of mirror periods, in direct analogy with a photonic crystal microcavity. The results are validated through zone folding of the supercell band structure.
2. Theory
The basis of this work is the Maxwell–Cattaneo constitutive relation, which is obtained by introducing a finite relaxation time between the establishment of a temperature gradient and the resulting heat flux [26,27]. Unlike Fourier’s law, which implies instantaneous propagation of thermal disturbances, the Maxwell–Cattaneo equation accounts for finite thermal propagation speeds and serves as the simplest hyperbolic extension of classical heat conduction. In the CV model, an empirical delay is introduced in the heat flux q to account for causality, leading to the modified Fourier-law relation [4,5,26]
where T is the temperature and is the thermal conductivity. Combined with energy conservation
where and are the density and specific heat, one obtains the hyperbolic heat equation
where is the thermal diffusivity. This is the thermal analogue of the telegrapher’s equation. The coexistence of the first- and second-order time derivatives is a direct consequence of combining the Maxwell–Cattaneo constitutive relation with energy conservation. The first-order term represents irreversible thermal dissipation and guarantees recovery of Fourier’s diffusion equation in the limit , whereas the second-order term introduces finite propagation speed and wave-like behavior [27,28].
2.1. Solution in the Frequency Domain
For harmonic solutions , the spatial amplitude satisfies the Helmholtz equation
with complex wave vector
with wave speed
The choice of branch ensures that the term decays as while decays as , so that both forward and backward components remain physically bounded within each layer and can interfere coherently. The general solution in each layer is a superposition of forward and backward wave components:
where and are the forward and backward temperature-wave amplitudes, and
is the thermal impedance of the medium, defined as the ratio of heat flux to temperature in a single progressive wave.
2.2. The Supercell
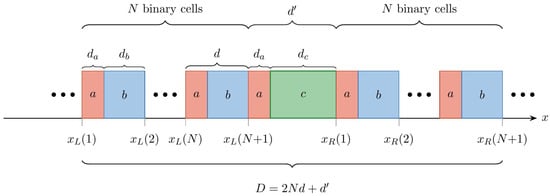
The supercell consists of N binary cells of period flanking a central defect cell on each side (Figure 1). The defect cell shares layer a with the mirror bilayer, followed by a defect material c of thickness , giving defect-cell thickness and total supercell period .
Figure 1.
Schematic of the defect supercell . Each binary cell has period ; the defect cell has thickness , where is the defect-layer thickness. The total supercell length is .
2.2.1. Fields in the Binary Cells
For each of the N binary cells to the left of the defect (), the temperature and heat-flux amplitudes are
where the interface matrices are
with the thermal impedance of layer , given by Equation (9) with the corresponding material parameters , , . The propagation matrices on the left side of the defect take the explicit form
with
the position of the left edge of cell n. The extremal value , shown in Figure 1, marks the right boundary of the left mirror stack and coincides with the left edge of the defect cell. The matrix has the same diagonal structure with replaced by and the reference point shifted by (to the left edge of layer b within the cell).
For each of the N binary cells to the right of the defect, the propagation matrices have the same diagonal structure but are referenced to
that is, and are obtained from Equation (13) by replacing with (and, for layer b, adding the offset ). The corresponding extremal value marks the right boundary of the supercell. The interface matrices and are identical on both sides.
2.2.2. Cell-to-Cell Recurrence and Unit-Cell Matrix
Let denote the vector of forward and backward amplitudes in layer of cell n. Imposing continuity of and at the interface at gives
where is the propagation matrix evaluated over the thickness of layer . Similarly, continuity at the interface at gives
Note that and are independent of n and identical on both sides of the defect. Eliminating between Equations (16) and (17) yields the cell-to-cell recurrence:
The unit-cell transfer matrix satisfies , and the Bloch dispersion relation of the perfect crystal is
where is the Bloch wave vector of the binary unit cell.
The order of matrix multiplication is determined by the physical sequence of layers and interfaces. As in photonic-crystal transfer-matrix theory, the matrices do not generally commute.
2.2.3. Defect Block and Supercell Transfer Matrix
Applying the same two-step procedure (continuity at the and interfaces, with propagation matrix ) gives the defect block
2.2.4. Perfect-Crystal Limit and Numerical Validation
Setting and (defect layer identical to mirror material b) gives , so
corresponding to defect-free bilayers with period . This identity provides a stringent numerical check: extracted from with period must agree with from with period d (after the appropriate rescaling) to within floating-point precision.
2.2.5. Bloch Dispersion Relation of the Supercell
Imposing the Bloch condition leads to an eigenvalue problem for . Since , the supercell dispersion relation is
where is the complex Bloch wave vector of the supercell, extracted from the eigenvalues of . The defect mode corresponds to a frequency at which exhibits a sharp local minimum within the band gap of the perfect crystal. We denote this defect-mode frequency by ; at , the mode is maximally localized at the defect site.
3. Material Selection and Single-Layer Dispersion
The CV dispersion relation for a homogeneous medium follows from Equation (4) with defined in Equation (5). The real part determines the spatial oscillation (phase velocity) of the temperature wave, while governs its intrinsic attenuation within each layer. Here the subscript labels the constituent material; in particular, denotes the relaxation time of material , whereas (Section 2) denotes the generic relaxation time of the CV model. From Equation (5), we obtain:
with . Taking the branch , the real and imaginary parts of admit the closed form
These expressions make explicit how the CV model interpolates between two well-separated transport regimes. In the wave-like regime , Equations (25) and (26) reduce to and : the real part grows linearly with frequency and the imaginary part saturates at a frequency-independent attenuation, recovering standard wave propagation with finite speed and weak damping. In the diffusive regime , both parts collapse to , with denoting the thermal diffusivity, which is the characteristic dispersion of the Fourier diffusion equation. The crossover between the two regimes occurs at , i.e., , and sets the natural frequency scale of each material. For the five materials in Table 1, ranges from 8 mHz (dermis, s) to Hz (stratum corneum, s). The defect-mode frequency Hz identified in the Section 4 therefore sits well within the wave-like regime () for every material considered, where interference effects and band-gap formation are physically meaningful.
Table 1 lists the thermophysical parameters for all materials considered. The thermal relaxation time is the most uncertain parameter. Since no direct measurement of has been reported for intact biological tissue [29], the values adopted here are representative estimates within the range reported in the literature: for the stratum corneum and dermis we follow the skin-tissue parametrization of Xu et al. [29], and for subcutaneous tissue and processed meat we adopt values consistent with [30] and [31], respectively, the latter resting on a measurement that has been questioned [32]. The skeletal-muscle relaxation time is taken as a representative value within the same physiological range.
Table 1.
Thermophysical parameters for the CV thermal wave crystal materials. . Sources: † Xu et al. [29]; ‡ representative value within the reported tissue range [29,31]; § Kaminski [30]; ‖ Mitra et al. [31]; , , from Duck (1990) via Xu et al. [29].
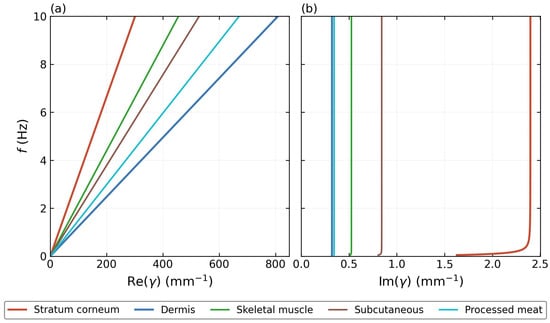
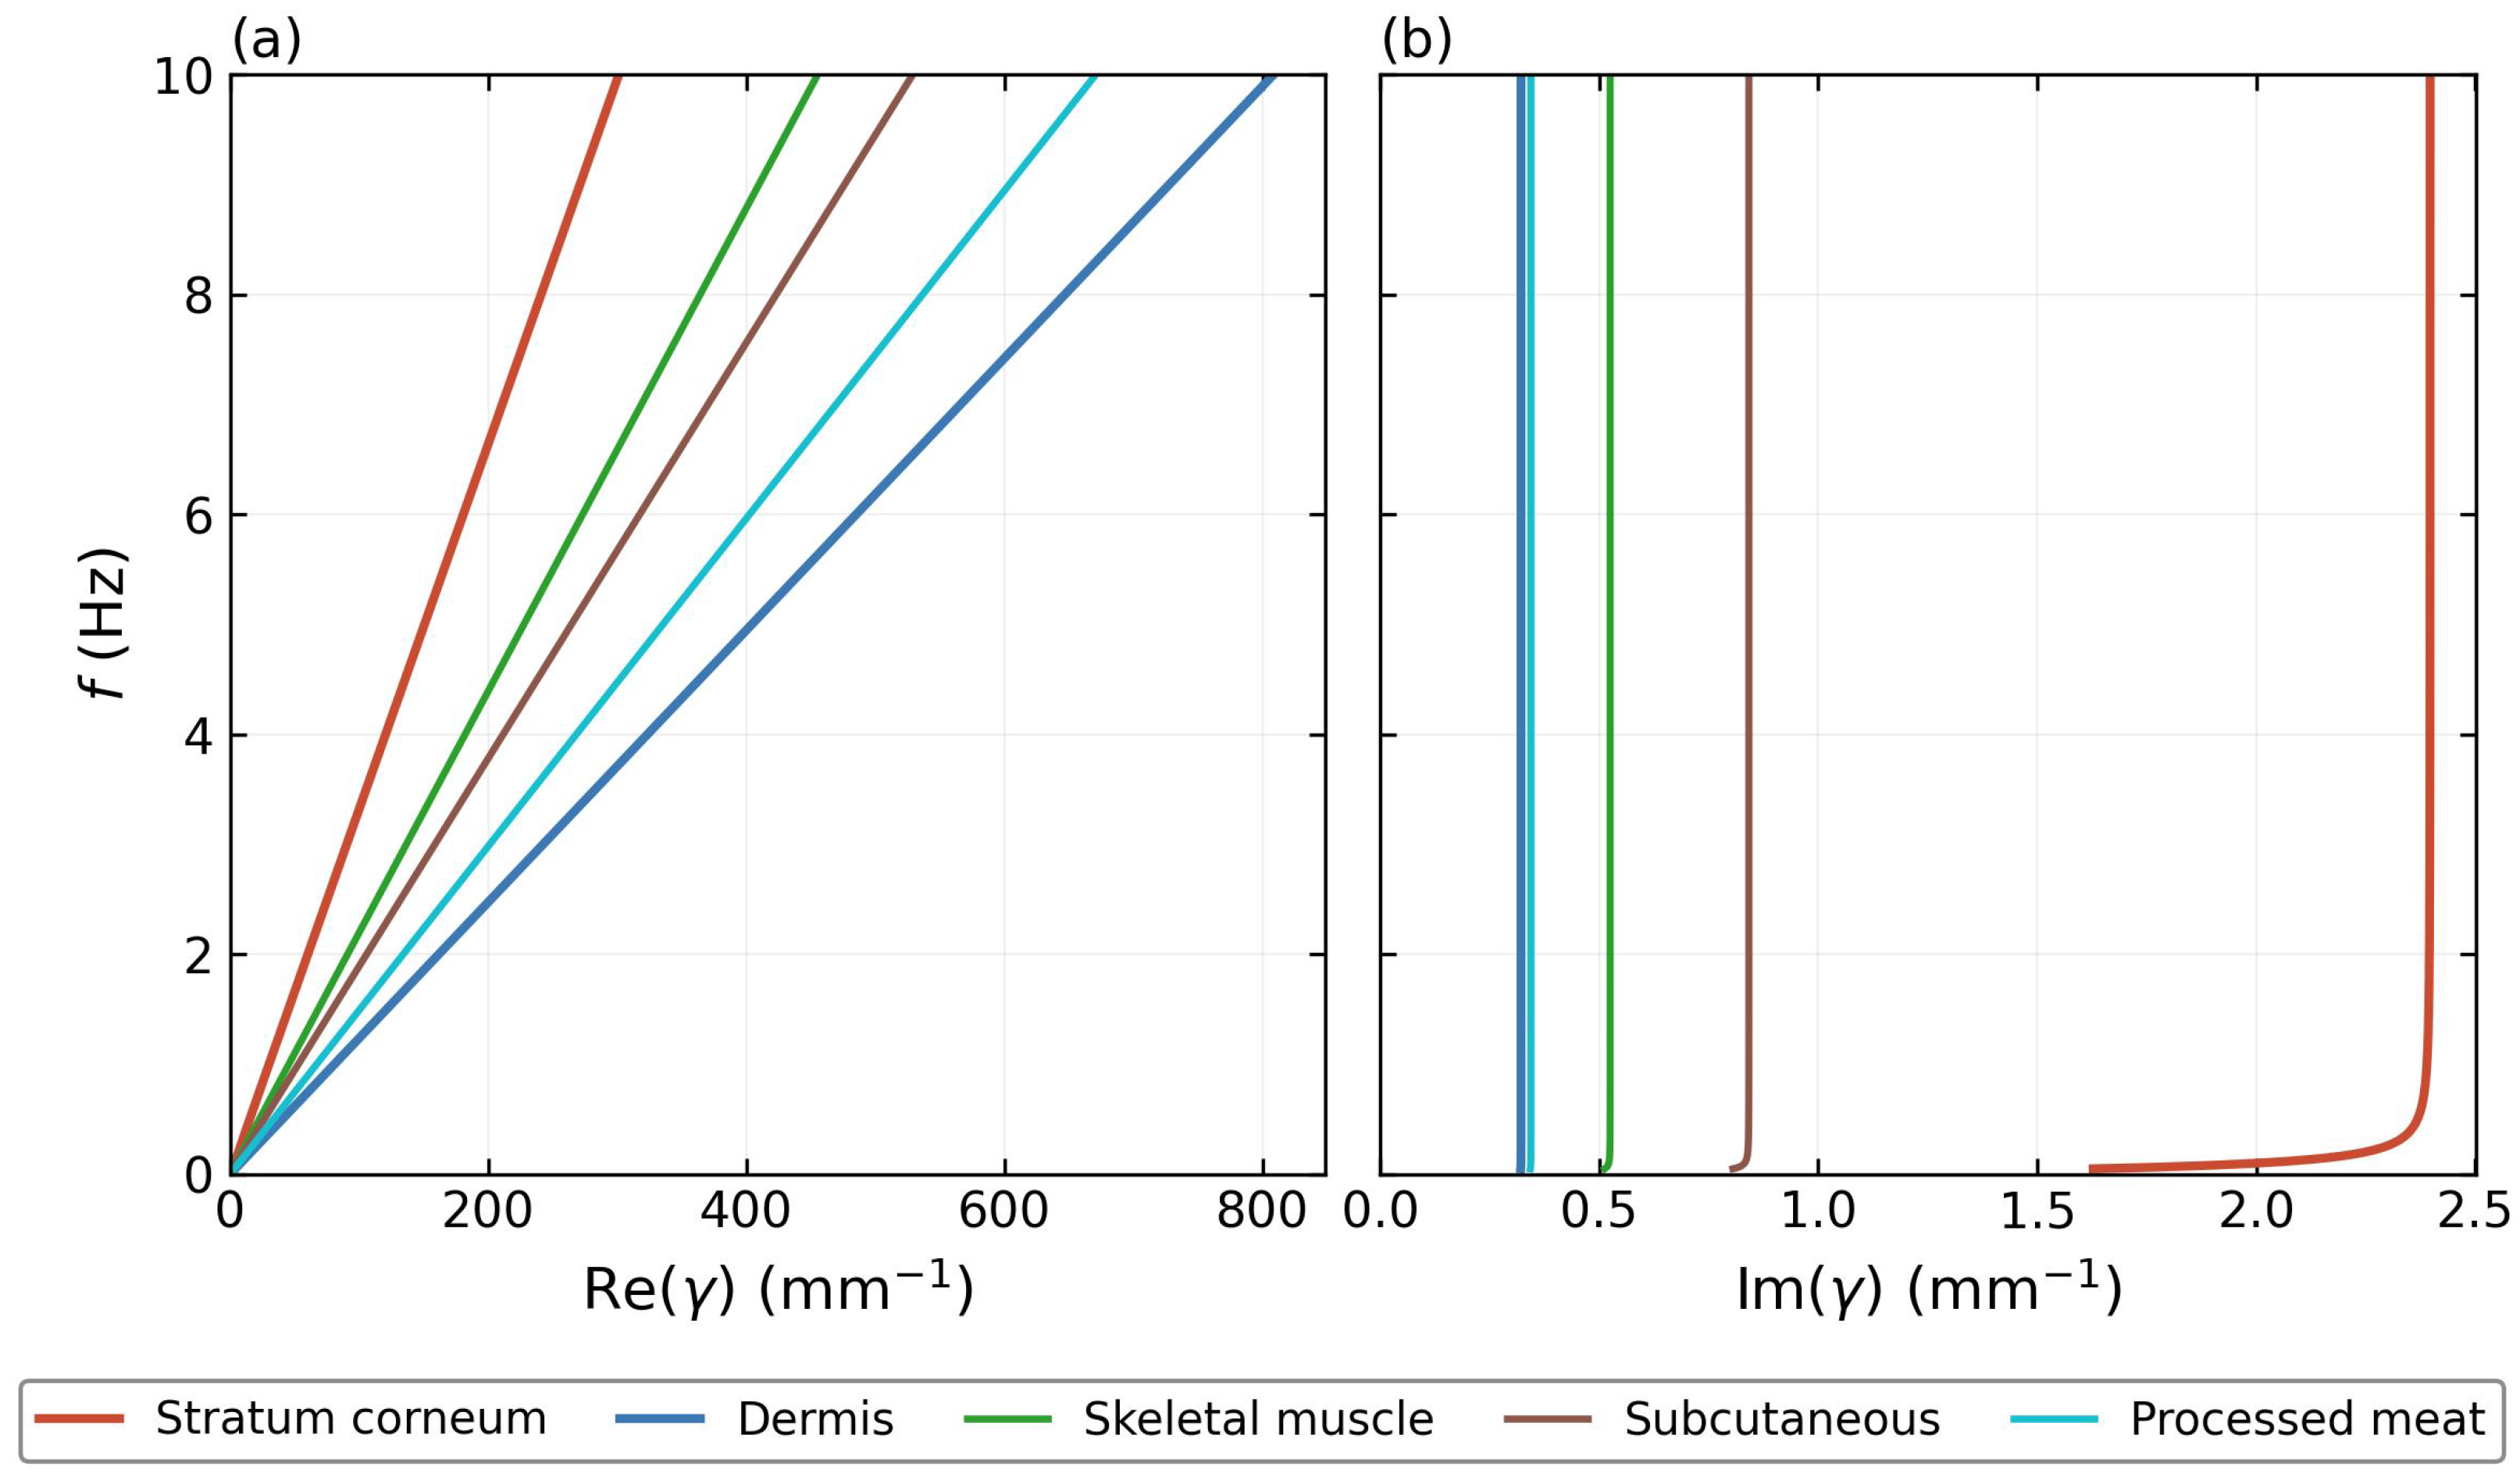
Figure 2 shows the CV dispersion relation for all five materials. Dermis has the largest at every frequency, confirming its role as the high-index (slow) mirror component with mm/s, while stratum corneum forms the low-index (fast) component with mm/s. The velocity contrast produces wide band gaps comparable to high-contrast photonic crystals. A material suitable as a defect layer must have v intermediate between the two mirror materials, so that its resonance frequency falls inside the gap. All three candidate materials in Table 1 satisfy this criterion: their dispersion curves in panel (a) lie between the two solid mirror lines. Among them, skeletal muscle is adopted as the primary defect material, with taken as a representative value within the physiological range.
Figure 2.
CV dispersion relation for the five materials in Table 1. (a) Real part (mm−1), proportional to the phase accumulation per unit length. (b) Imaginary part (mm−1), governing the intrinsic attenuation of thermal waves within each layer. Solid lines: stratum corneum (red) and dermis (blue), forming the mirror bilayer. Thinner solid lines: skeletal muscle (green), subcutaneous tissue (brown), and processed meat (teal), used as candidate defect materials whose wave speeds are intermediate between those of the mirror materials. For materials with sufficiently large relaxation times , the condition is satisfied throughout most of the plotted frequency range, causing to approach the asymptotic limit predicted by Equation (26) and become nearly frequency independent. Stratum corneum () reaches this regime only at higher frequencies, resulting in the residual frequency dependence visible in panel (b).
The thermal waves considered here are assumed to be generated by an external harmonically modulated heat source. Examples include frequency-domain thermoreflectance (FDTR) [33], photothermal excitation [34], and periodically driven resistive heaters [35]. In such experiments, the deposited heat power is modulated at frequency f, producing temperature oscillations that propagate through the medium according to the Cattaneo–Vernotte equation. The frequency range investigated in this work (∼1–4 Hz) is readily accessible using existing modulated-heating techniques and serves as the excitation frequency for the thermal wave crystal. In this sense, the thermal wave crystal plays a role analogous to that of a photonic or phononic crystal, acting as a filter for externally generated waves rather than as their source.
It should be emphasized that the periodic multilayer considered here is an engineered structure rather than a naturally occurring biological tissue. The biological materials are employed because experimentally reported values of the thermal relaxation time are available, enabling realistic estimates of the thermal wave band structure.
4. Results
4.1. Band Structure and Zone-Folding Validation
Before presenting defect-mode results, we validate the supercell method in the perfect-crystal limit (where and ), for which the Bloch wave vector extracted from must coincide with that obtained directly from the unit-cell matrix . This validation establishes the numerical reliability of the supercell approach before the defect layer is introduced and, at the same time, characterizes the band structure of the perfect stratum corneum/dermis crystal that will serve as the reference throughout the remainder of the paper.
We further validate the supercell transfer matrix against the analytical formula of Chen et al. [6]:
with and the thermal impedances of the two layers as defined in Equation (9). Our TMM computes the same quantity by direct matrix multiplication, extracting k via Equation (19). Agreement between both routes is within the floating-point rounding error (∼), confirming the correctness of the interface and propagation matrices. The mathematical structure of Equation (27) is identical to that encountered in one-dimensional photonic and phononic crystals. This reflects the fact that all three systems can be described by transfer matrices and Bloch theory. The specific form used here was derived by Chen et al. [6] for thermal wave crystals governed by the Cattaneo–Vernotte equation, where the electromagnetic impedance [36] is replaced by the thermal impedance defined in Equation (9).
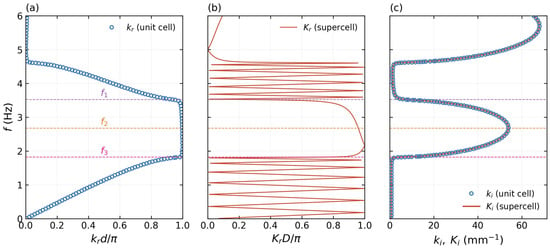
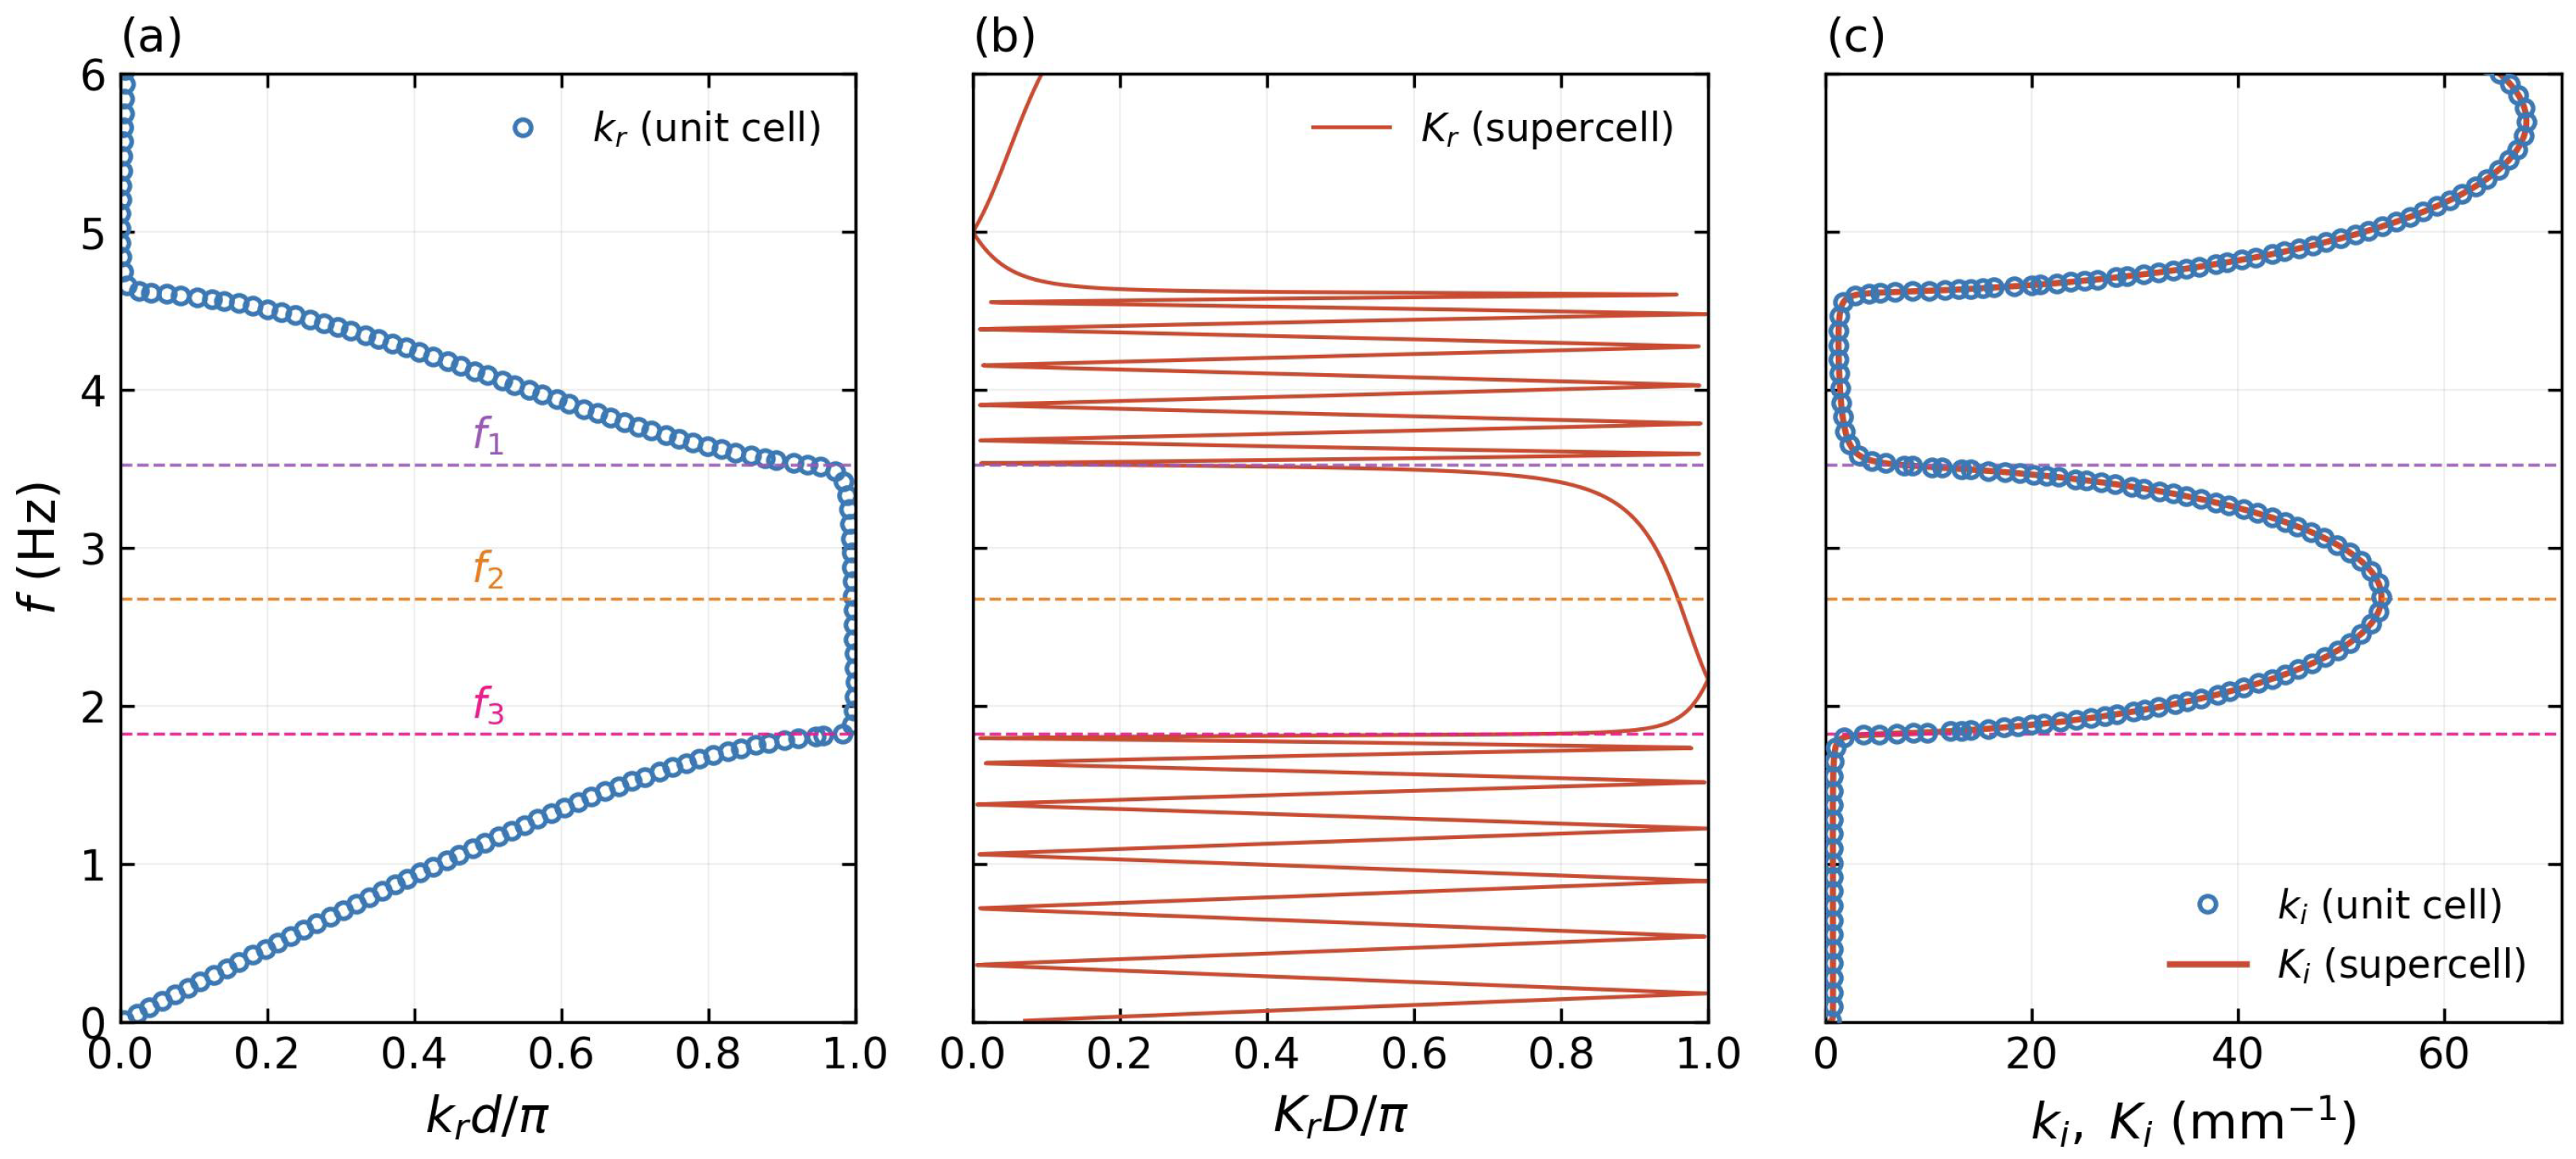
Figure 3 presents the zone-folding validation using the perfect-crystal limit of the supercell (Equation (22)) with , giving and supercell period d. The layer thicknesses used throughout this work are , giving a unit-cell period . At the frequencies of interest (–), the corresponding thermal wave wavelengths, estimated from the wave-regime relation , range from approximately (dermis) to (stratum corneum). The wavelength is therefore comparable to the periodicity of the structure, with 1.5 d–4 d, placing the system in the Bragg-scattering regime required for thermal wave band-gap formation. This relationship between wavelength and periodicity is analogous to that encountered in photonic and phononic crystals, where interference effects become significant when the wavelength is of the same order as the lattice period.
Figure 3.
Zone-folding validation (, perfect-crystal limit , , d, m). (a) Perfect-crystal band structure from (Equation (19)). (b) Supercell band structure from : the zone folding is clearly visible. (c) Imaginary Bloch wave vector: from the unit cell (blue open circles) and from the supercell (red solid) coincide to within mm−1, confirming exact numerical equivalence. Dashed horizontal lines mark gap edges Hz (pink), gap center Hz (orange), and Hz (purple).
Panel (a) shows the band structure of the perfect crystal: three band gaps are visible within the displayed range, with the first centered near Hz with edges at Hz and Hz. The large velocity contrast produces wide gaps comparable to high-contrast photonic crystals. Panel (b) shows the supercell result: the band structure is folded 13 times into the reduced Brillouin zone , in direct analogy with zone folding in phononic and semiconductor superlattices [37,38]; to our knowledge, this is its first explicit demonstration within the Cattaneo–Vernotte thermal wave crystal framework. Panel (c) provides the critical numerical check: from the unit cell and from the supercell coincide to within mm−1, seven orders of magnitude smaller than the physical gap values (∼10–50 mm−1), confirming that Equation (22) holds to full double-precision accuracy. This three-way validation—analytical formula, matrix multiplication, and zone folding—establishes the numerical reliability of the supercell method before the defect layer is introduced.
4.2. Mode Profiles of the Perfect Crystal
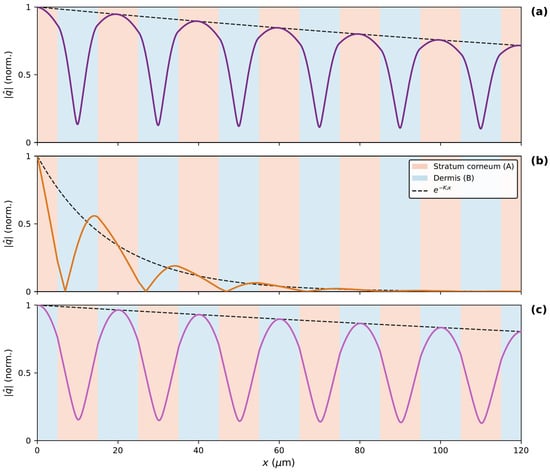
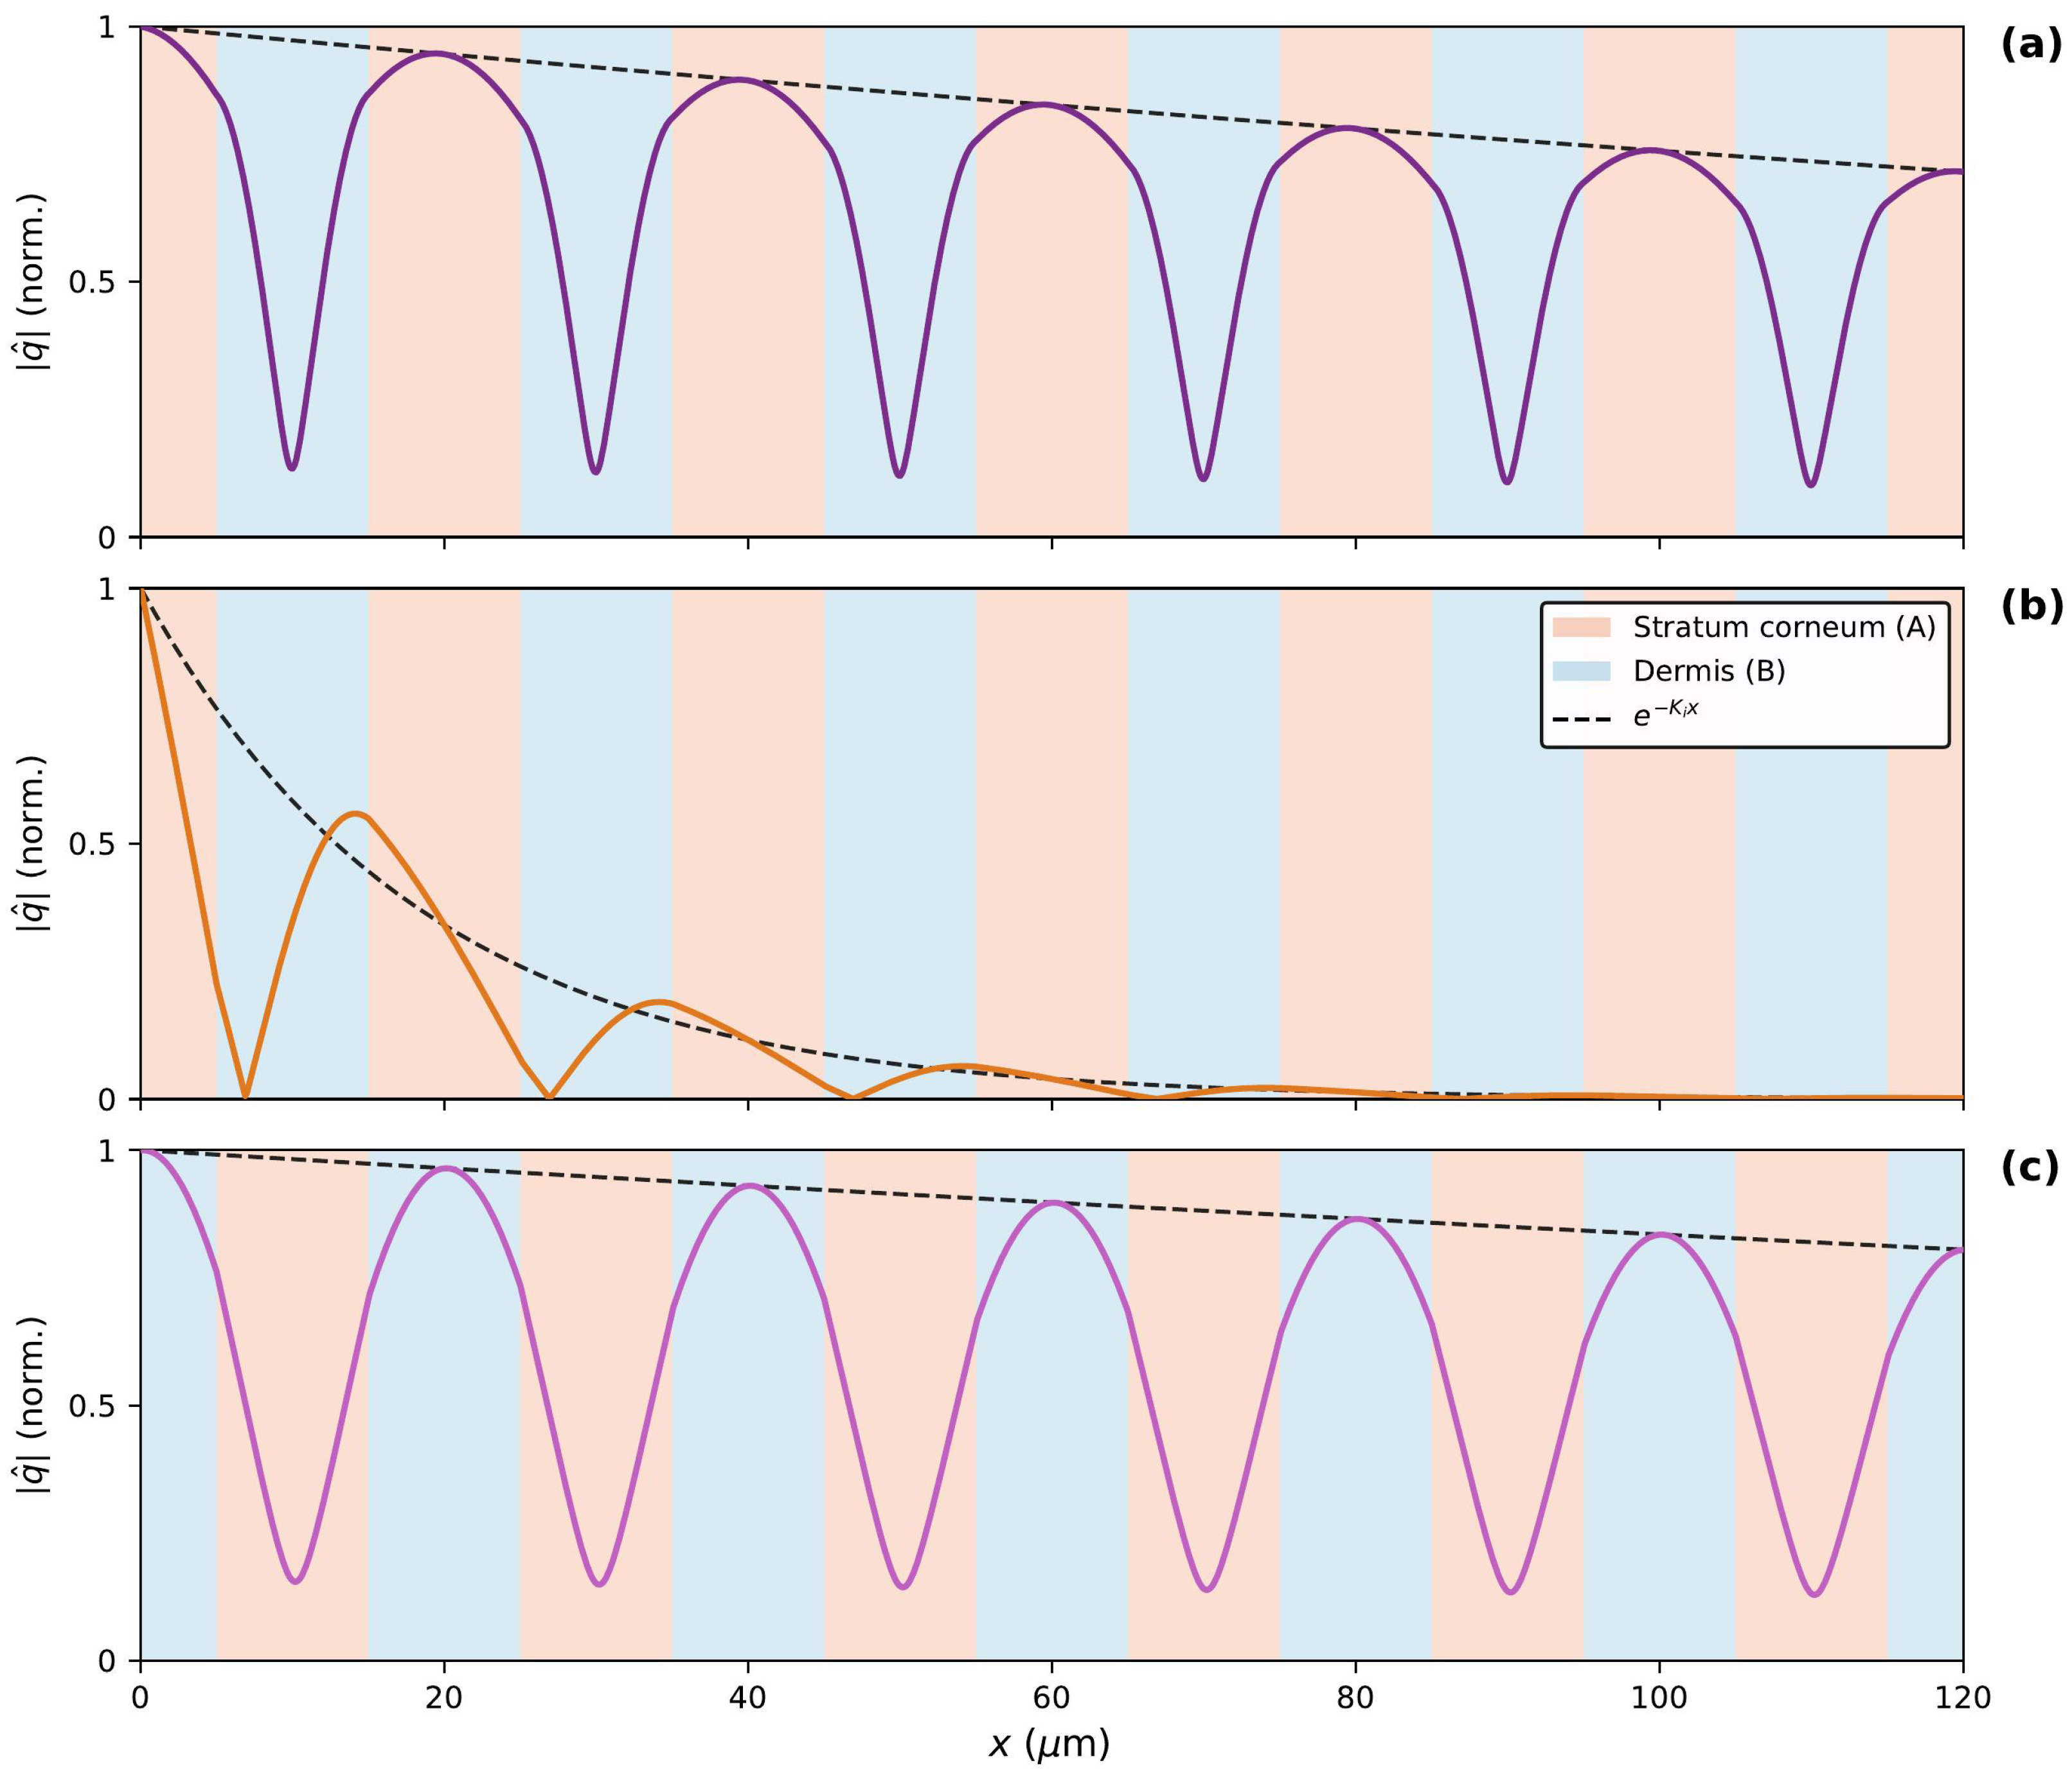
Figure 4 shows the heat-flux amplitude for three representative frequencies within gap 1, reconstructed from the eigenvector of via the Bloch relation and Equation (8).
Figure 4.
Heat-flux amplitude for gap 1 (m, ). Black dashed line: Bloch envelope . Solid line: heat-flux amplitude , colored to match the corresponding frequency marker in Figure 3 ( purple, orange, pink). Background: stratum corneum (A, salmon) and dermis (B, blue). (a) Upper gap edge ( Hz): mode concentrated in stratum corneum, the low-index material at the upper band edge. (b) Gap center ( Hz): purely evanescent decay, at maximum—strongest thermal reflection. (c) Lower gap edge ( Hz): mode concentrated in dermis, the high-index material at the lower band edge.
Panel (a), at the upper gap edge Hz, shows the heat-flux amplitude concentrated within the stratum corneum (a) layers. This is the thermal analogue of the dielectric band rule in photonic crystals [11]: at the upper band edge, the mode concentrates in the low-index (fast) material, here stratum corneum with mm/s. The nearly flat Bloch envelope () confirms that this frequency lies at the band edge where propagation just becomes allowed. Panel (b), at the gap center Hz, shows purely evanescent character: the amplitude decays as with at its maximum, meaning wave propagation is most strongly suppressed at this frequency. Panel (c), at the lower gap edge Hz, shows the complementary situation: the mode concentrates in the dermis (b) layers, the high-index (slow) material with mm/s. The three panels together establish the mode character of the perfect crystal and provide the reference against which the defect state is identified.
4.3. Effect of N on the Defect Mode
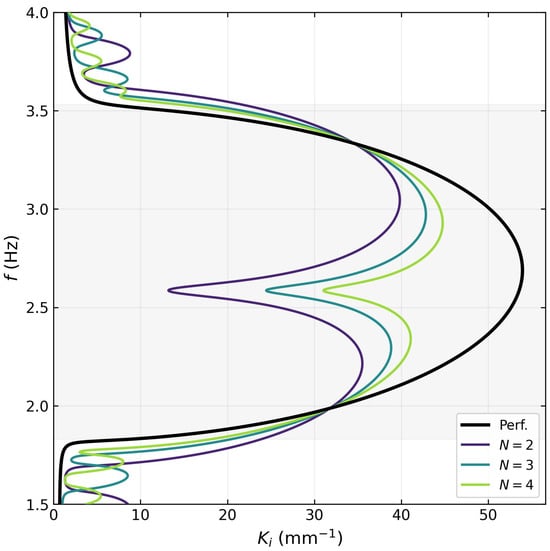
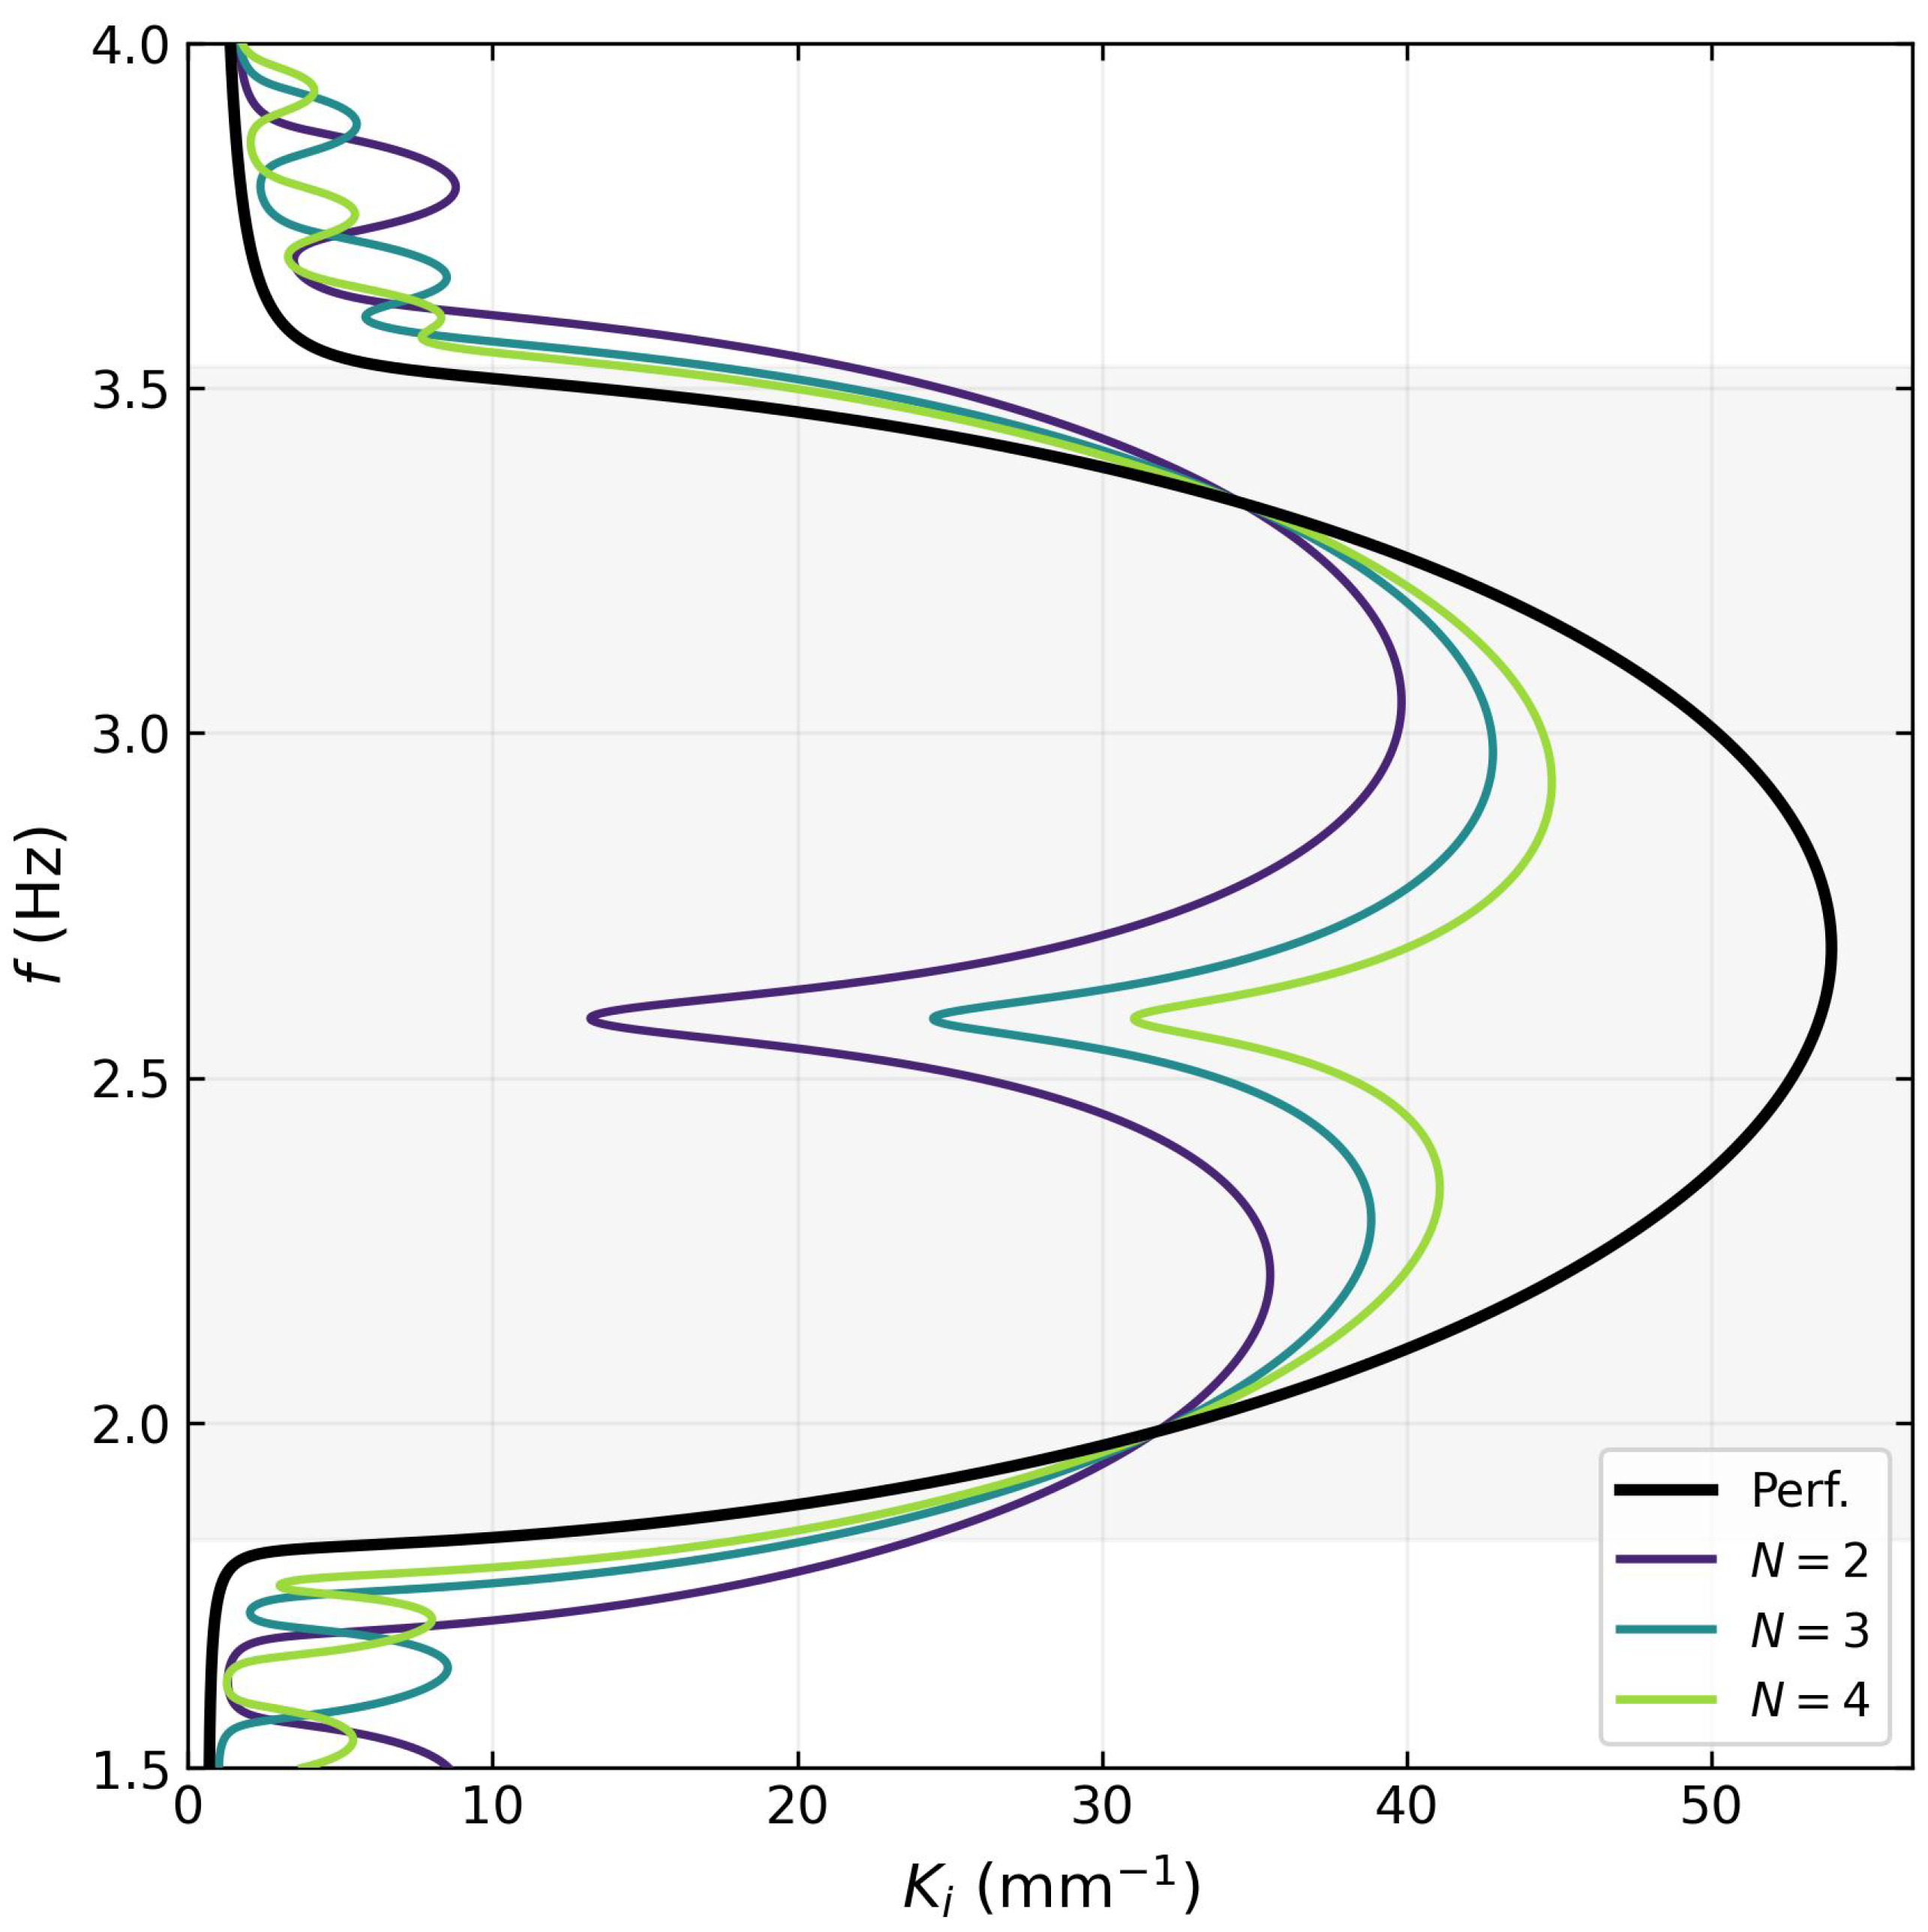
Figure 5 shows for the perfect crystal and for defect supercells with mirror periods (per side), at fixed skeletal-muscle defect thickness m. This value is chosen so that the defect mode lies deep inside the band gap, well separated from both edges; it does not coincide with the thickness that maximizes the confinement, , identified in the tunability study of Section 4.5. The shaded region indicates the band gap Hz of the perfect crystal.
Figure 5.
Imaginary Bloch wave vector across the full frequency range (– Hz) for the perfect crystal (black) and defect supercells with mirror periods (per side) (color, viridis scale), at fixed defect thickness m (skeletal muscle). The shaded region marks the band gap Hz. The sharp minimum at Hz is the defect mode; its frequency is independent of N while its depth increases markedly, reflecting stronger spatial confinement for larger N. Pass-band oscillations outside the gap are Fabry–Pérot resonances of the finite supercell.
Each supercell curve develops a sharp downward spike at a defect-mode frequency Hz, located well inside the gap. The frequency is essentially independent of N, determined mainly by the thermal impedance of the defect material and its thickness . By contrast, the depth of the minimum—, and for , respectively—grows strongly with N. Increasing the number of surrounding periods deepens the minimum of at the defect-mode frequency, resulting in stronger exponential suppression of the mode amplitude away from the defect layer. This is the direct thermal analogue of increasing the number of mirror pairs in a photonic crystal microcavity: more mirrors reflect more strongly, pushing the resonance deeper into the gap and increasing the spatial confinement of the mode. The pass-band oscillations visible above and below the gap correspond to Fabry–Pérot resonances of the finite supercell and are not numerical artifacts.
Figure 6 examines this trend over an extended range, –16. increases monotonically with N, with a growth that is fast (up to ) and progressively slows thereafter, approaching the mid-gap attenuation of the unperturbed mirror crystal. Over the same range, the defect-mode frequency remains essentially constant, Hz, confirming that the resonance condition is fixed by the defect cell alone.
Figure 6.
Localization as a function of the number of mirror periods N (per side), at fixed d (skeletal muscle), for –16. The growth is monotonic but not linear: fast up to and progressively slower thereafter. Open squares mark the cases shown in Figure 5 and Figure 7, namely the three defect configurations whose spectra (Figure 5) and spatial profiles (Figure 7) are reported there; this is what the legend label “values reported in Figure 5 and Figure 7” denotes. The exact values are , and for , respectively, corresponding to , and m.
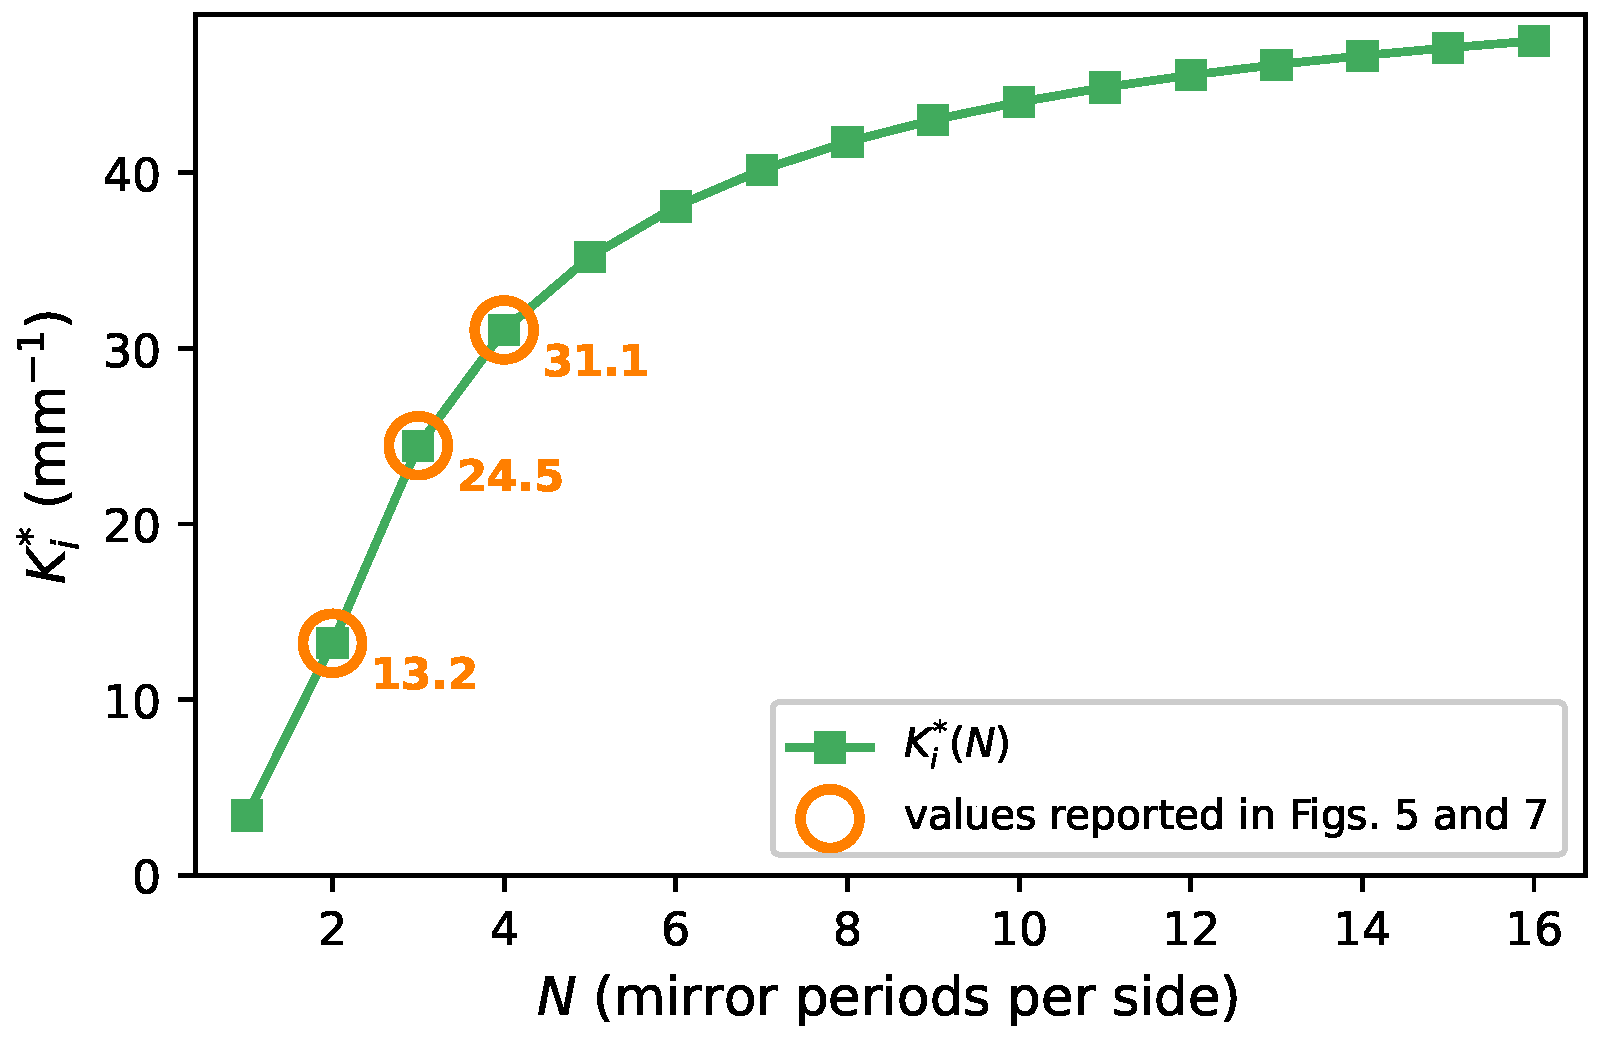
Figure 7.
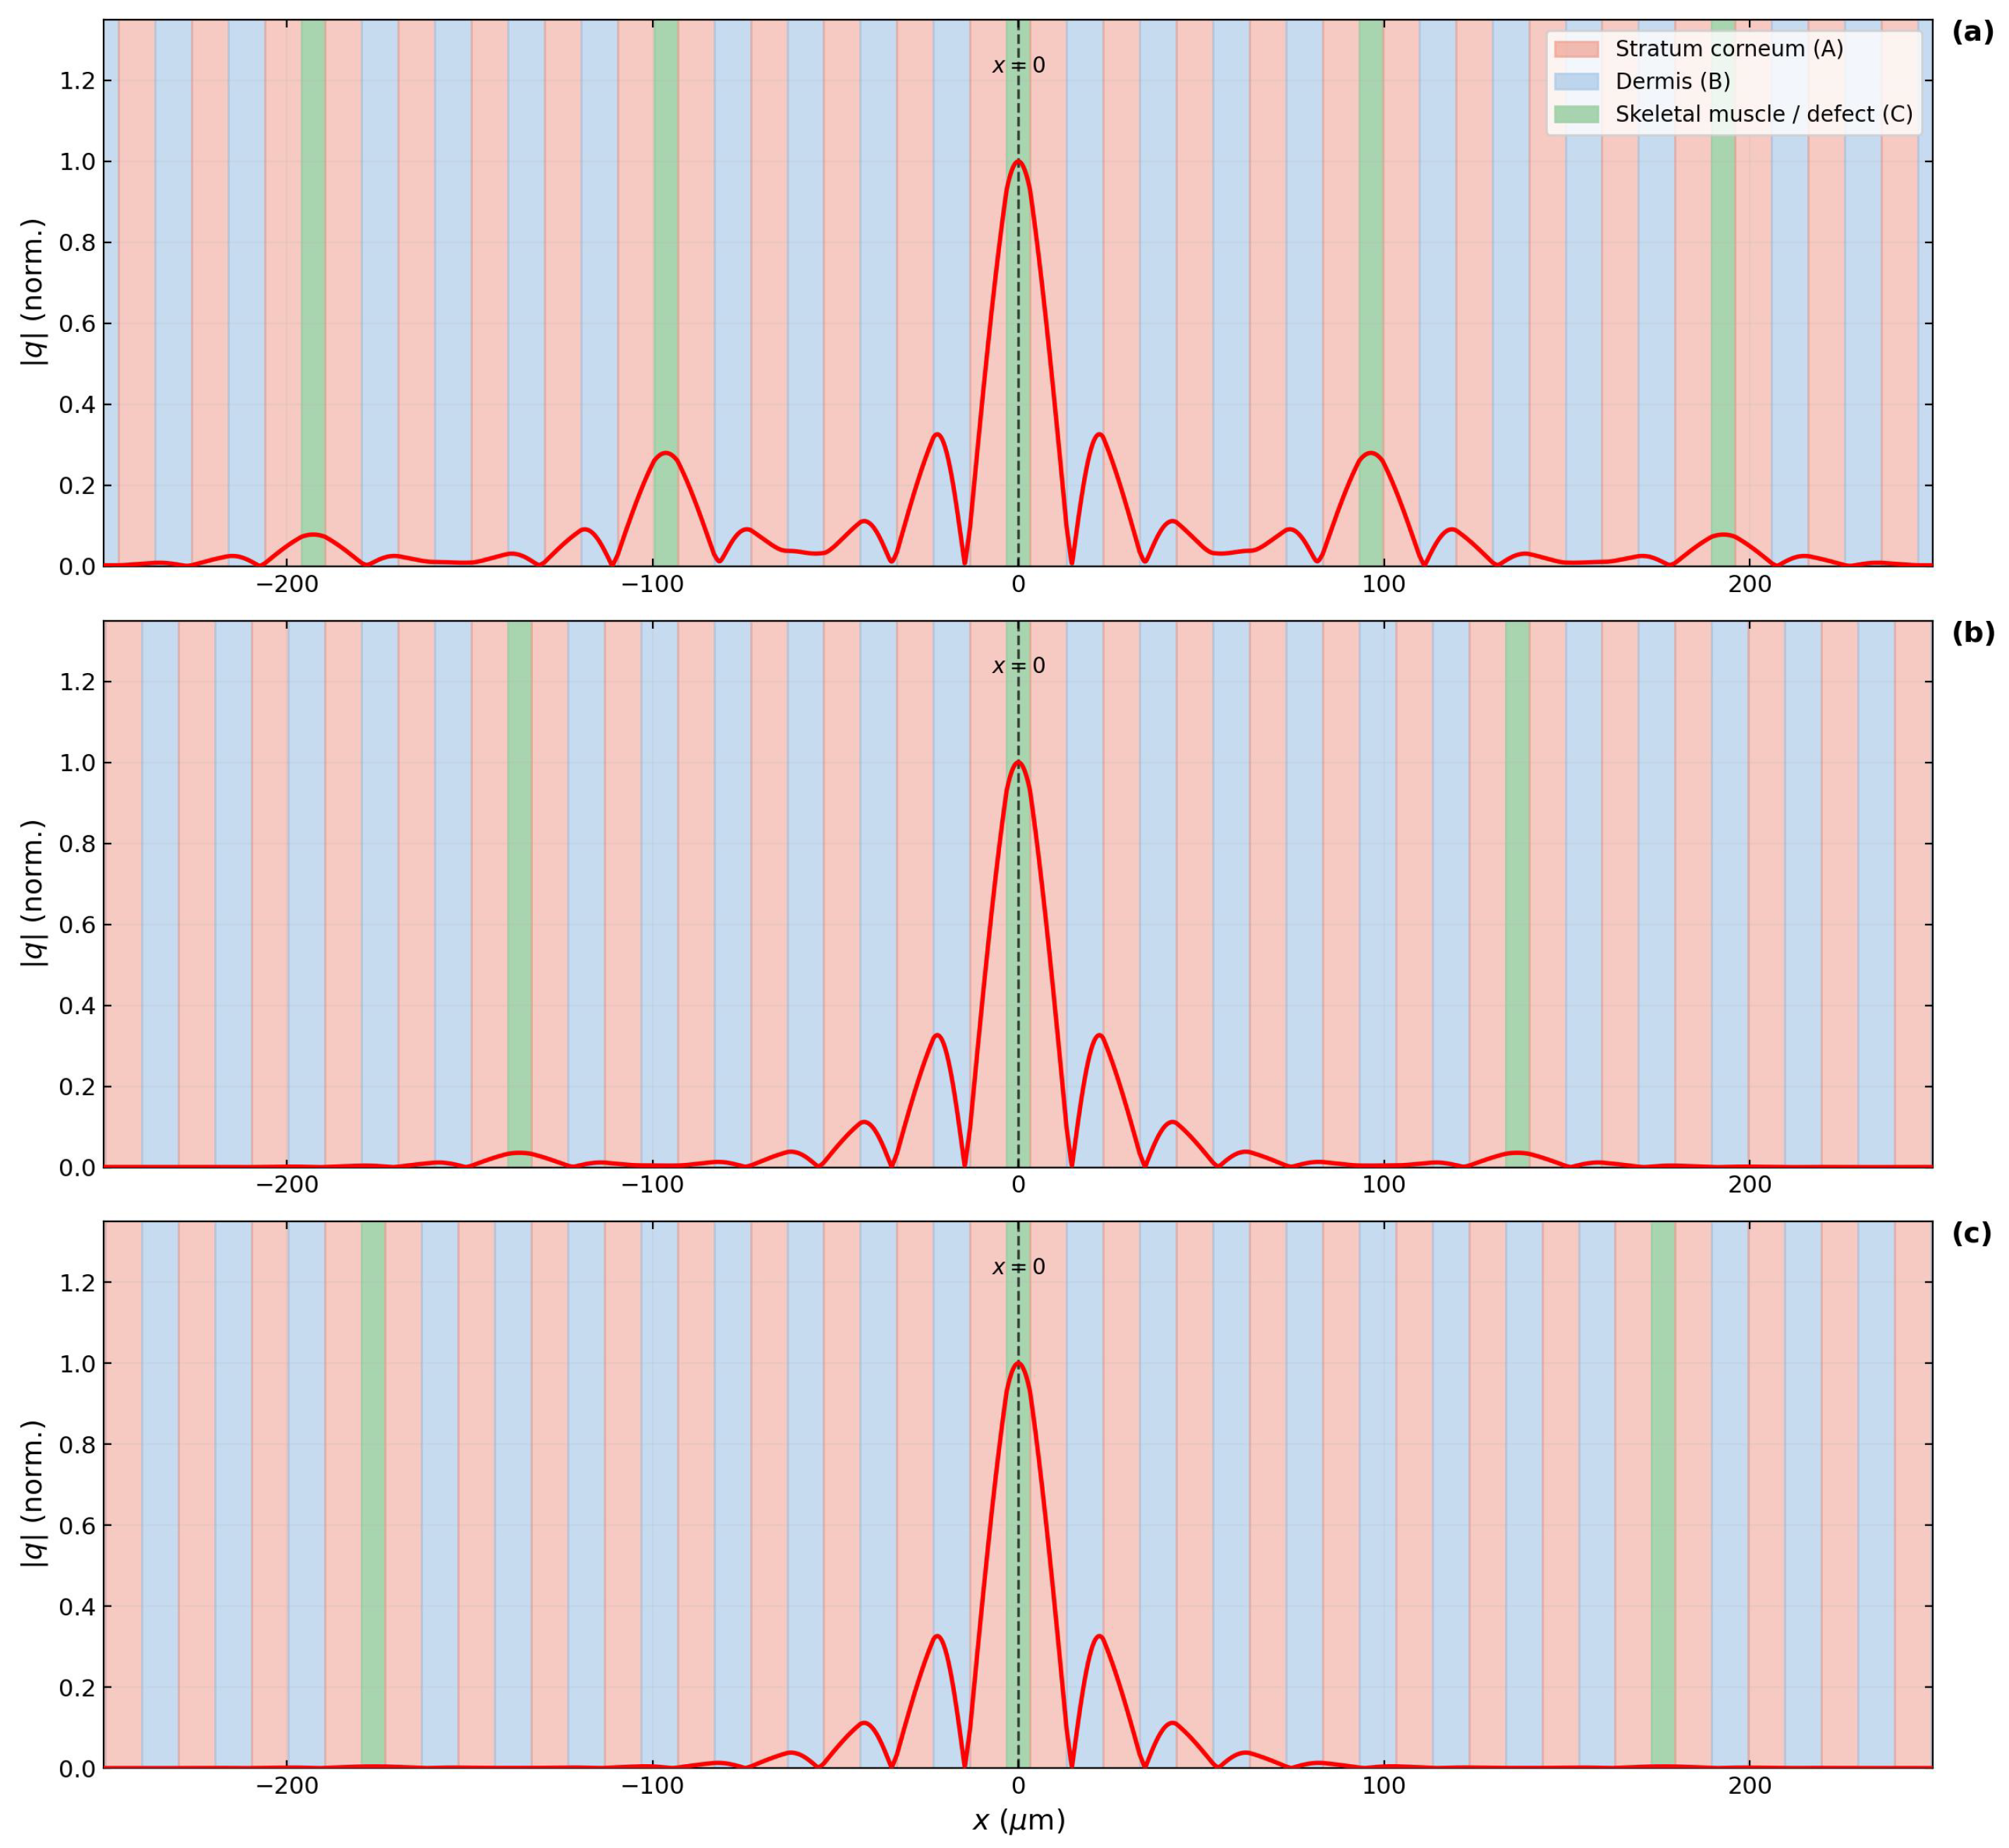
Normalized heat-flux amplitude of the defect mode (red line), evaluated at the defect-mode frequency for each case. (a) , Hz; (b) , Hz; (c) , Hz. Background: stratum corneum (A, salmon), dermis (B, blue), defect layer (C, green). The mode is sharply peaked at the defect center (, dashed line) and decays exponentially into the mirror crystal, with the decay length decreasing from m to m as N increases from 2 to 4 (mirror periods per side). Additional green bands outside the central defect layer are periodic images of the supercell, a consequence of the Bloch periodicity underlying the transfer-matrix formulation, and are not additional physical defects.
4.4. Spatial Profile of the Defect Mode
While Figure 5 characterizes the defect mode in the spectral domain, Figure 7 presents the complementary real-space picture: the spatial profile of the mode, whose decay length is the direct real-space expression of the spectral minimum. The figure shows the normalized heat-flux amplitude of the defect mode for , evaluated at the respective . In all panels, the profile is sharply peaked at (the center of the defect layer) and decays exponentially into the mirror crystal on both sides, with a decay length that decreases from m () to m () and m (). This spatial confinement is the defining signature of a localized cavity mode. The mode envelope follows the exponential predicted by Bloch theory, with no evidence of reflections from the supercell boundaries. The defect layer (green) is clearly visible at the center of each panel, flanked by the alternating stratum corneum (salmon) and dermis (blue) layers of the mirror crystal.
4.5. Tunability of the Defect Mode
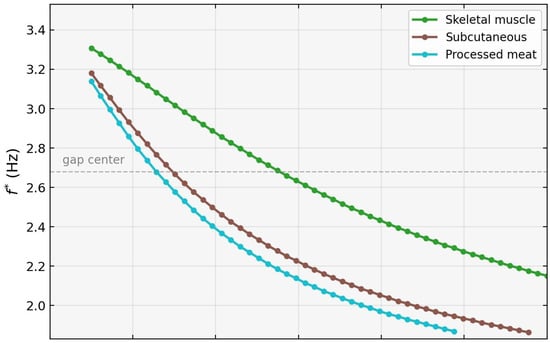
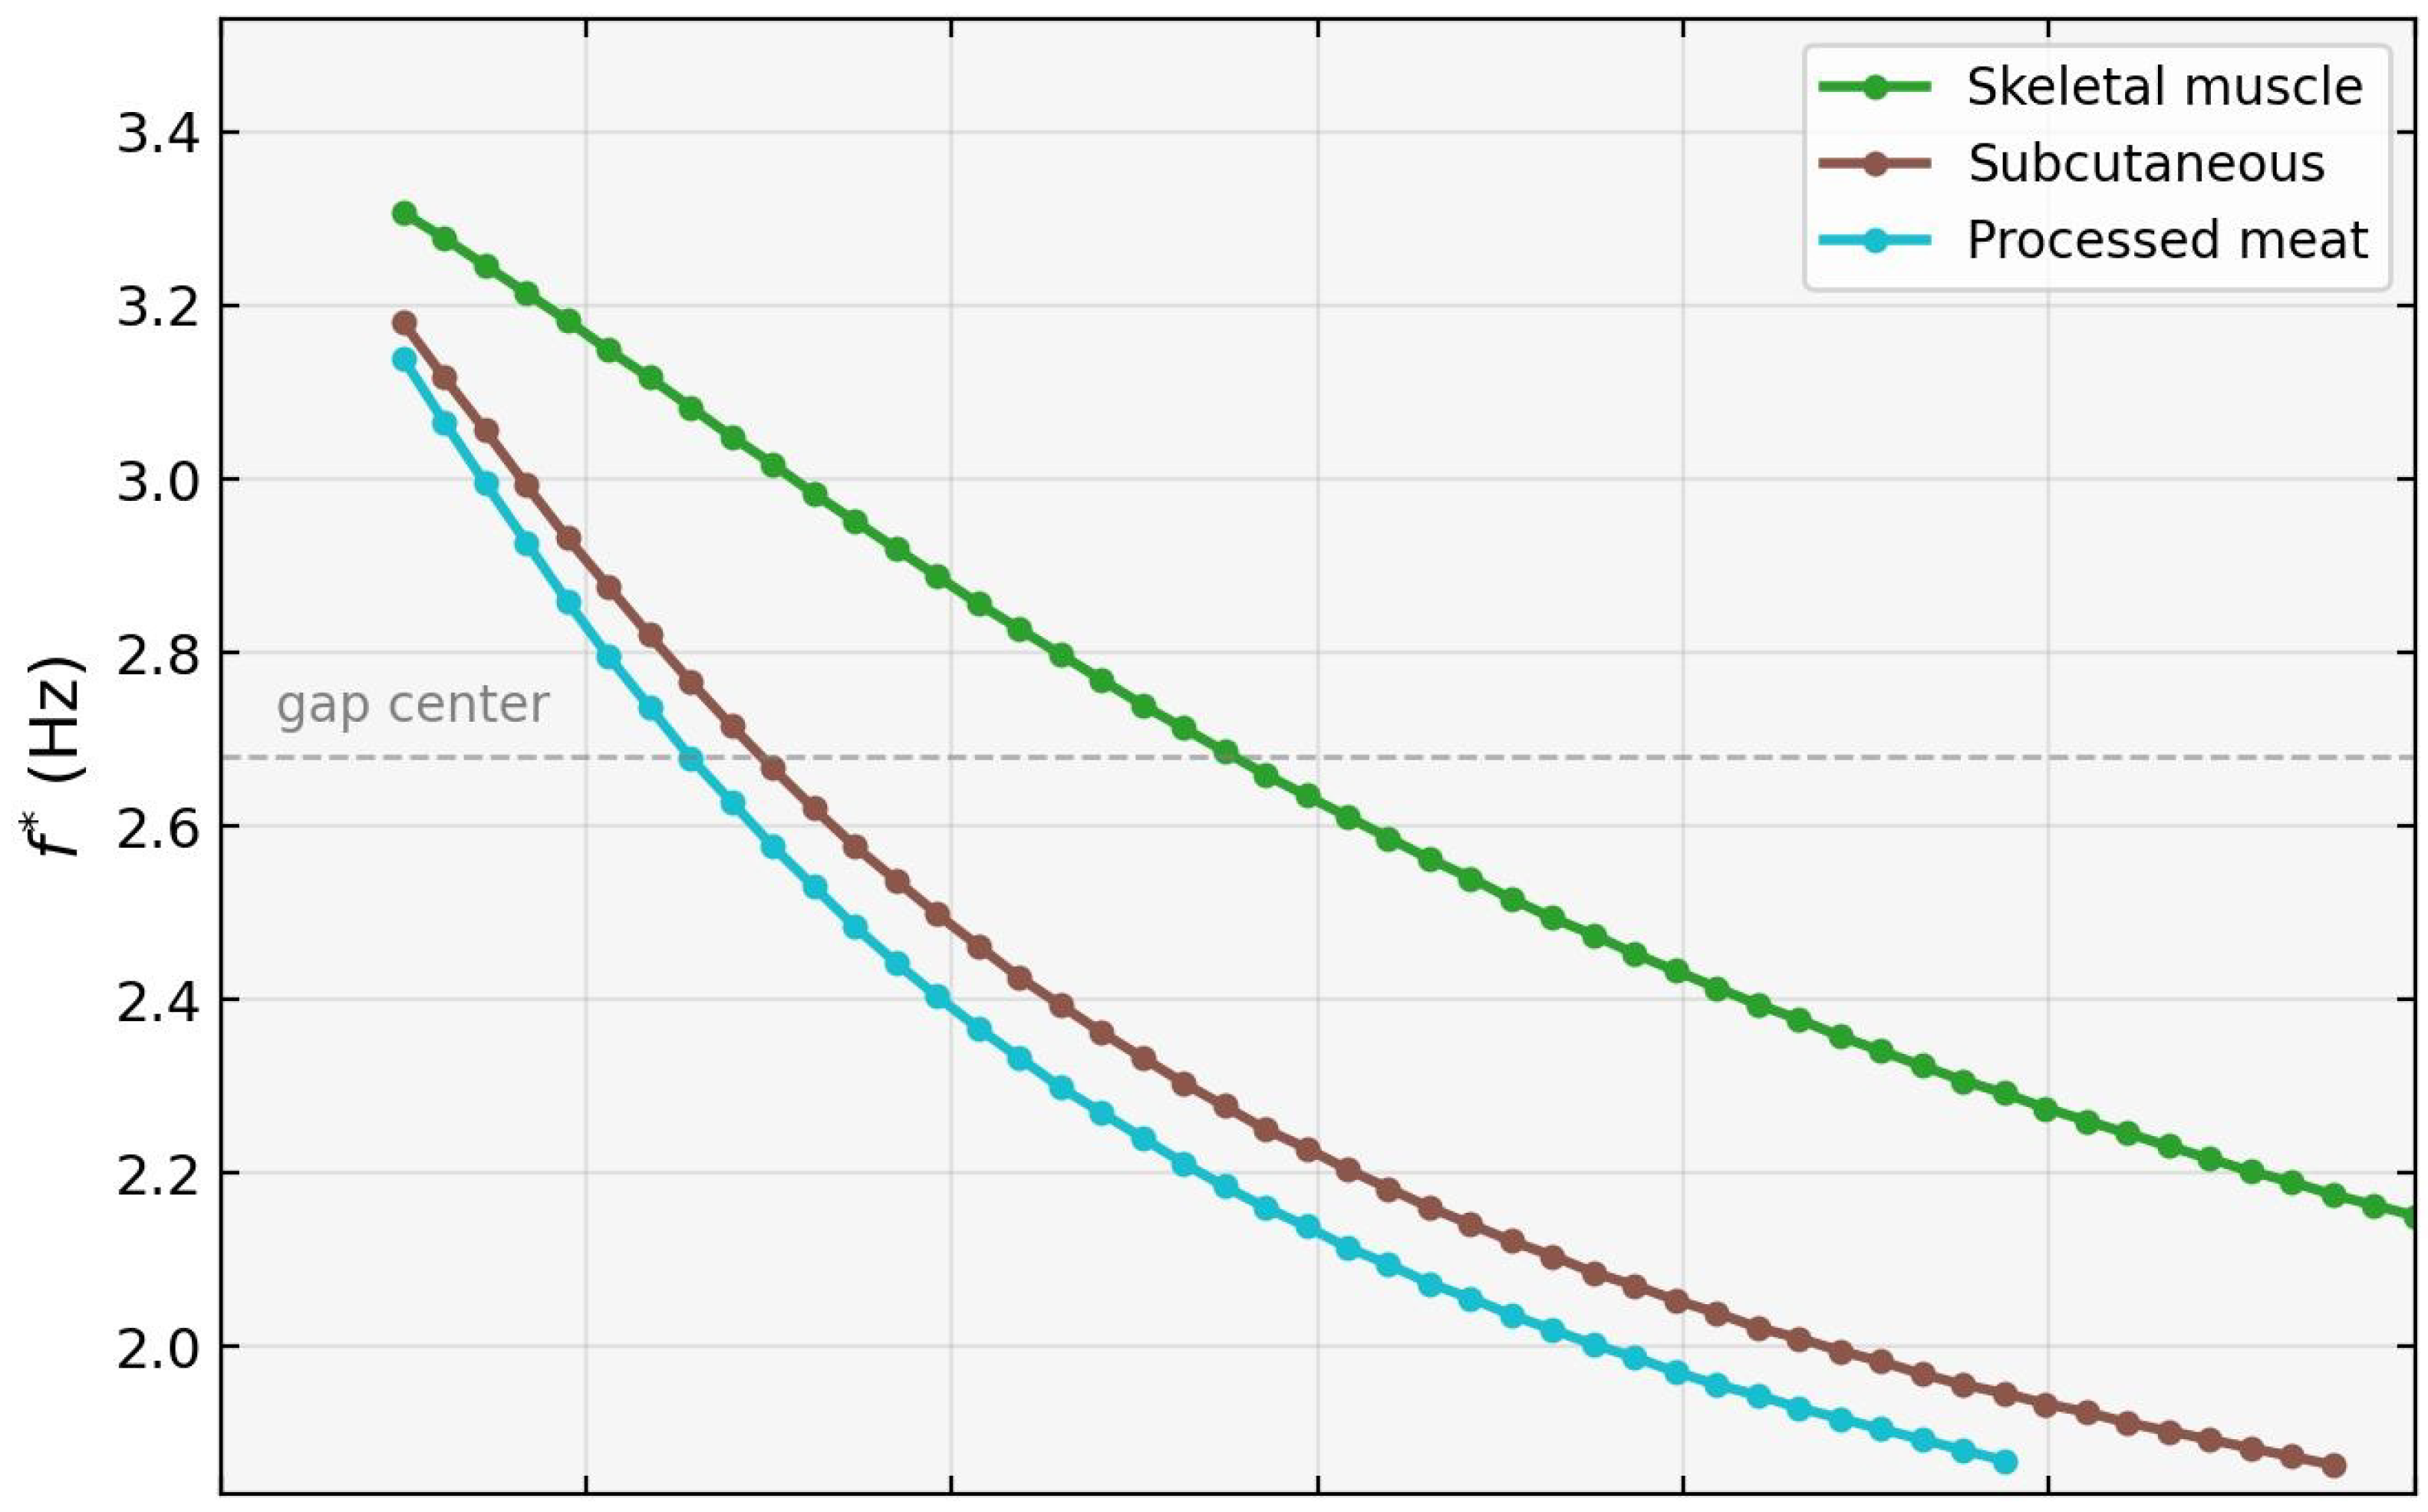
Figure 8 demonstrates that the defect mode is continuously tunable across the entire band gap by varying the defect-layer thickness . As increases from 0 to , decreases monotonically for all three candidate materials, sweeping from near the upper gap edge (∼3.3 Hz) down toward the lower edge (∼2.0 Hz). Physically, varying modifies the phase accumulation within the defect layer and the impedance mismatch at the and interfaces, thereby shifting the resonance condition that selects within the gap. The dashed horizontal line at the gap center ( Hz) indicates the crossing point accessible to each material.
Figure 8.
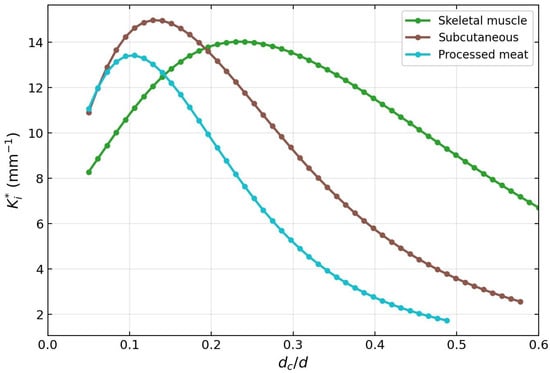
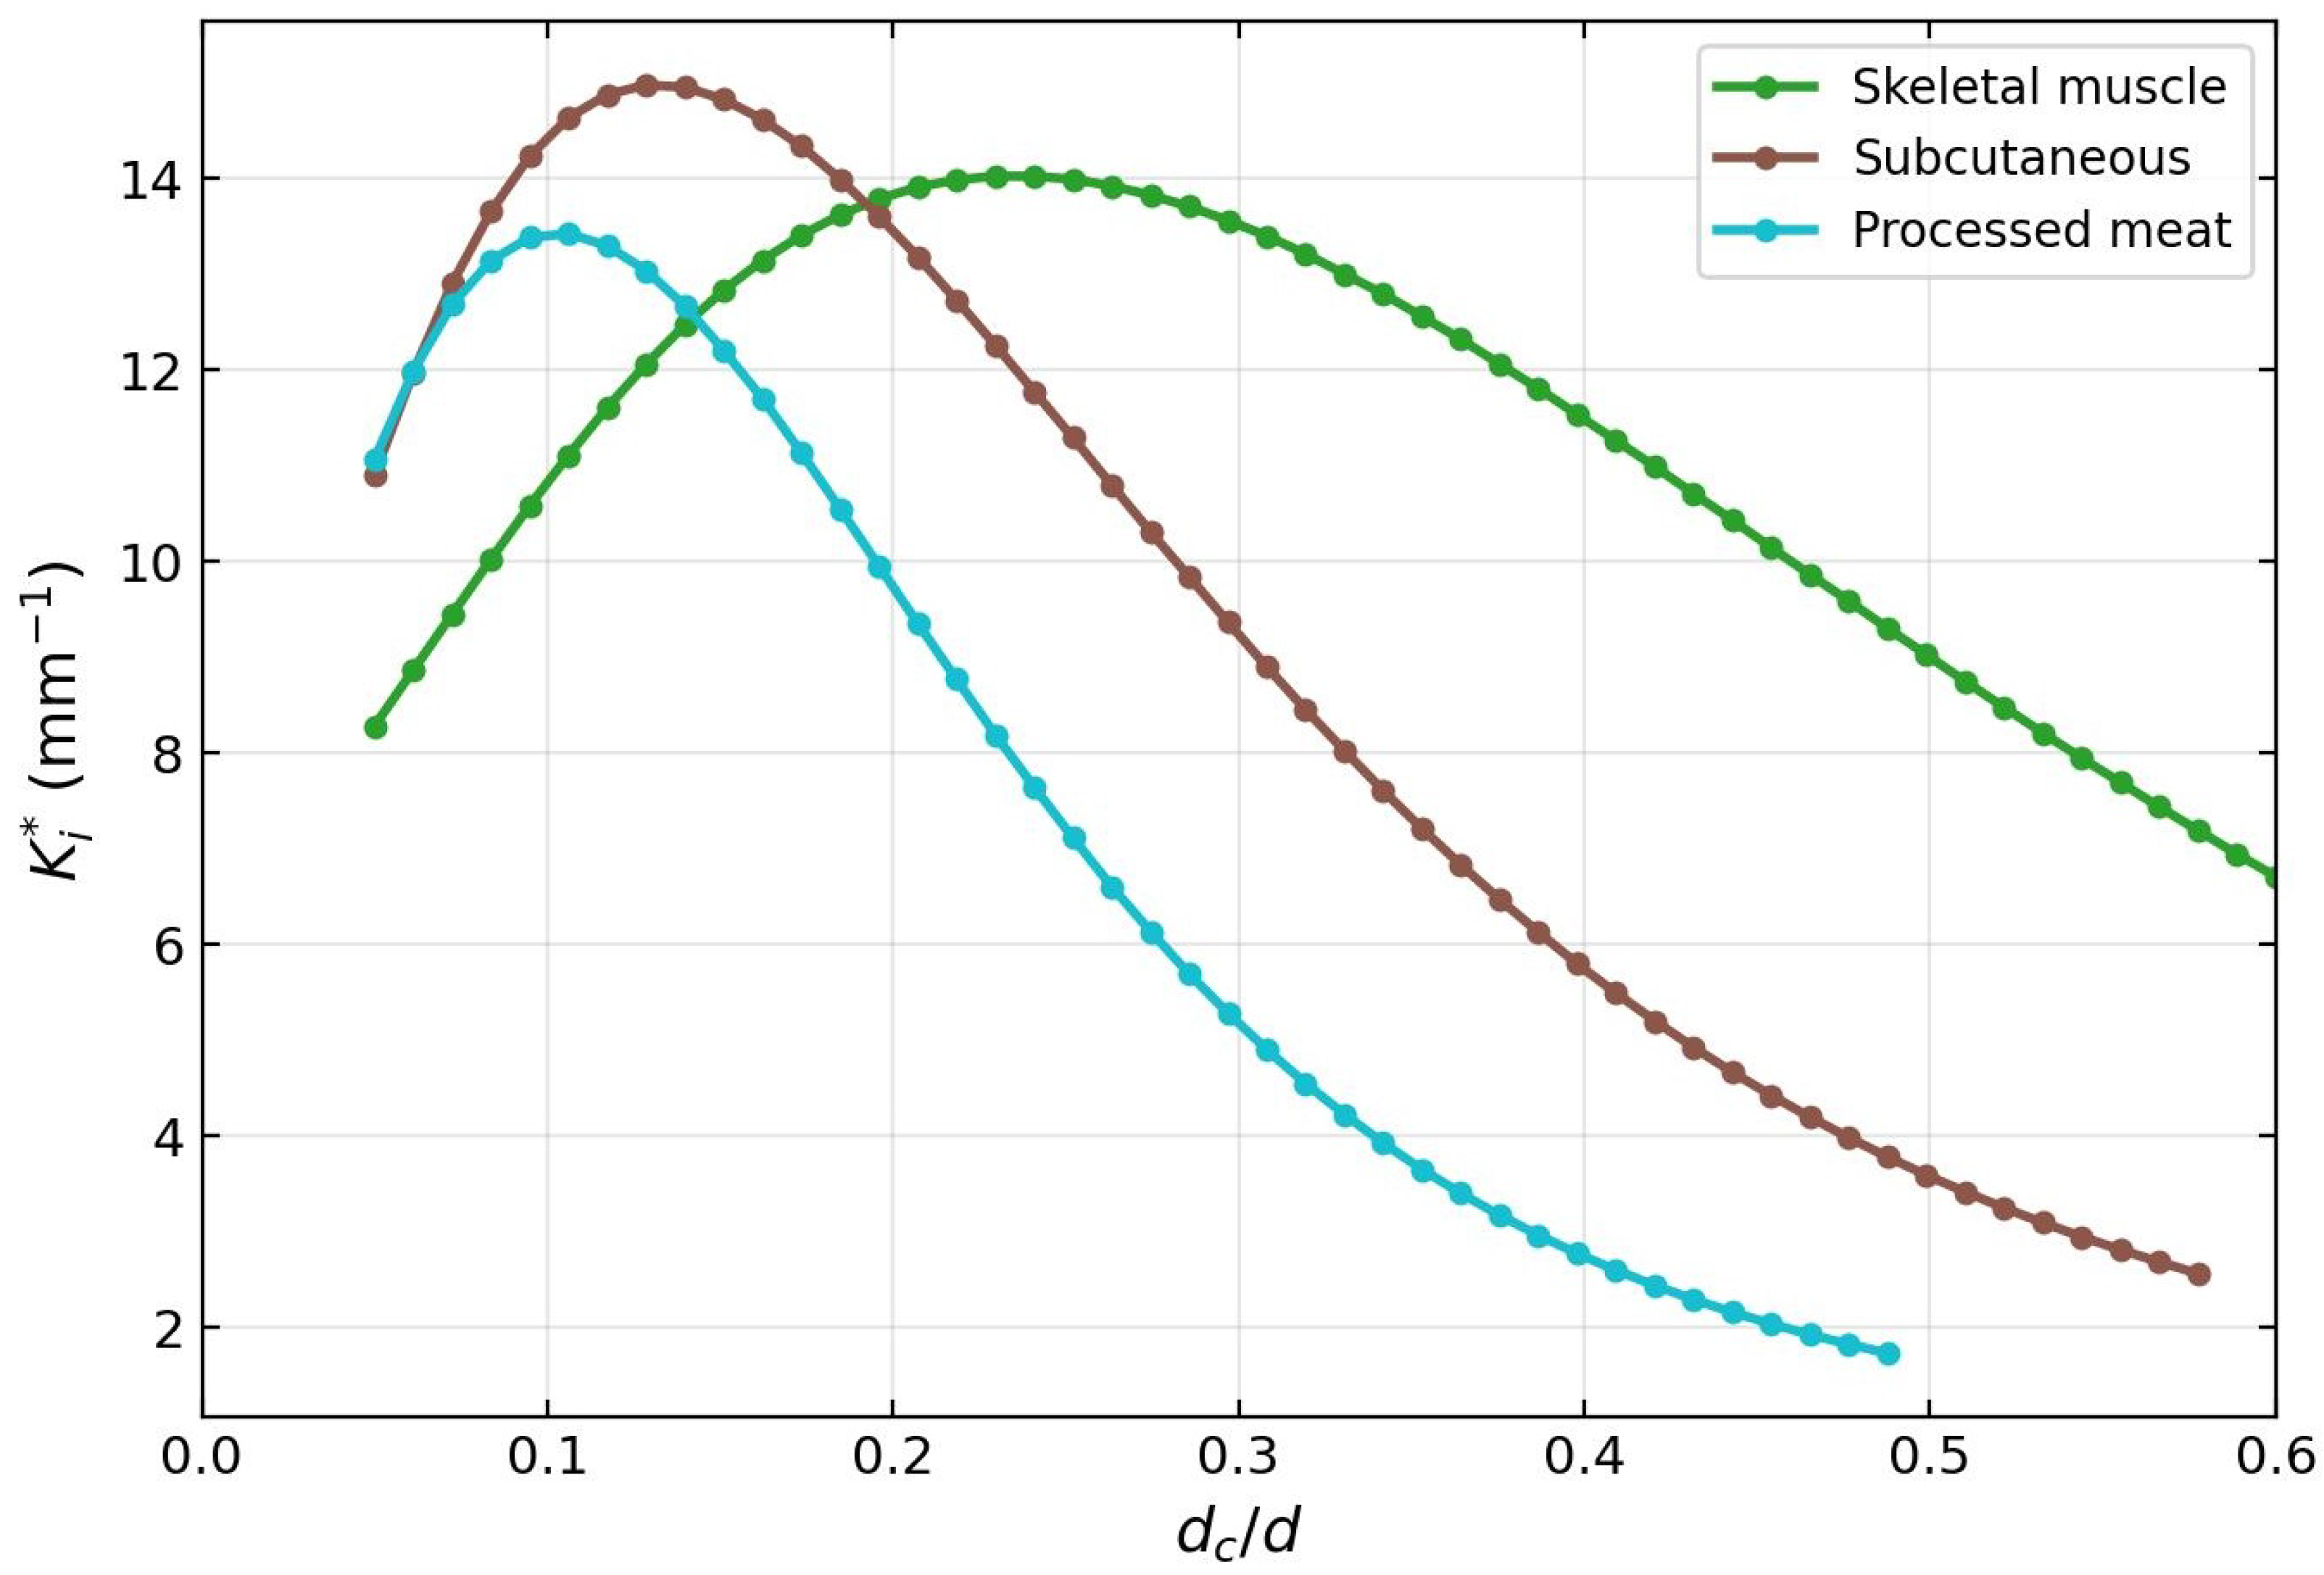
Tunability of the defect mode for mirror periods (per side). (Top) defect-mode frequency as a function of normalized defect thickness, for skeletal muscle (green), subcutaneous tissue (brown), and processed meat (teal), matching the color convention of Figure 2 (skeletal muscle: W m−1 K−1, s; subcutaneous: , s; processed meat: , s; see Table 1). The dashed horizontal line marks the gap center at Hz. decreases monotonically as increases, sweeping the defect mode continuously from near the upper gap edge toward the lower edge. (Bottom) Localization . The maximum confinement is achieved at – for all three materials, reaching –15 mm−1; beyond this range, decreases as the mode approaches the gap edges where . Together, the two panels establish that defect material and thickness act as coarse and fine tuning controls of the defect-mode operating point.
The bottom panel shows that the localization peaks at – for all materials before decreasing as the mode approaches the gap edges, where . The optimal confinement is achieved near , where reaches 13–15 mm−1 for mirror periods (per side). Among the three materials, subcutaneous tissue (brown) and processed meat (teal) allow the mode to reach lower frequencies within the gap for the same , due to their lower v values. Skeletal muscle (green), adopted as the reference defect material, provides a representative and conservative tuning curve.
5. Discussion
The results presented in Section 4 establish a close phenomenological correspondence between the defect modes of a CV thermal wave crystal and those of a photonic crystal microcavity. Unlike photonic and phononic crystals, the CV thermal wave crystal constitutes an intrinsically dissipative Bloch medium in which the wave vector remains complex even in homogeneous materials. The existence of localized defect states is therefore not guaranteed a priori and represents a nontrivial extension of defect-state physics to non-Fourier heat transport. Three aspects of this correspondence deserve emphasis.
First, the decoupling of frequency and confinement— essentially independent of N, while increases monotonically (though not linearly) with N (Figure 6)—is the hallmark of a high-quality-factor cavity mode [11]. The defect material and its thickness fix the resonance condition, whereas the mirror crystal sets the rate of energy leakage out of the cavity. This clean separation enables an independent design of operating frequency and mode confinement, a feature that has been exploited extensively in photonic [14,17] and phononic [19,20] devices, and which our calculations show to carry over quantitatively to the thermal wave regime.
Second, the continuous tunability of across the whole band gap by varying (Figure 8) provides a design lever that could be exploited for narrowband thermal filtering if the predicted modes are experimentally confirmed. Varying the defect-layer thickness modifies the phase accumulation and the effective impedance mismatch at the interfaces, thereby shifting the resonance condition that defines the localized mode frequency within the band gap. Because all three candidate defect materials yield monotonically decreasing curves—but with distinct slopes set by their v values—the platform allows both coarse (material choice) and fine (thickness) tuning, analogously to multilayer optical filters.
Third, the length scales involved are accessible to existing microfabrication and tissue-engineering techniques. Layer thicknesses of order m are three orders of magnitude larger than those required by phononic thermocrystals [10,21], eliminating the need for nanoscale patterning of Si/Ge alloys. The predicted operating window of ∼2–3 Hz is also directly compatible with modulated-heating characterization methods used on biological multilayers [29,39]. Combined with the omnidirectional band gap previously demonstrated in porous-silicon thermocrystals [22] and in finite CV multilayers [23], the present results outline a viable route toward experimental realization of such cavity resonances in the CV regime.
Several limitations of the present analysis deserve explicit discussion. First, the results rest on the assumption that heat transport in the layered biological medium is adequately described by the CV model within the frequency range considered. The applicability of the CV model to biological tissue remains a subject of active investigation: no direct measurement of for intact tissue is available [29], and the values used here are representative estimates within the range reported in the literature [29,31]; alternative formulations such as the dual-phase-lag [40] or fractional-derivative [2] models have been proposed to capture non-Fourier transport in heterogeneous tissues. The values of for subcutaneous tissue [30] and processed meat [31] rest on measurements that have been questioned in the literature [32]; our Figure 8 therefore serves primarily to illustrate the tuning mechanism, with skeletal muscle as the reference candidate material. Accordingly, the numerical values of and reported here should be interpreted as predictions contingent on the CV parametrization rather than as definitive quantitative claims about real tissue.
Second, the present analysis is strictly one-dimensional and assumes homogeneous, non-dispersive CV parameters within each layer. Real biological tissues exhibit anisotropy, perfusion effects, and frequency-dependent , all of which would broaden the sharp minimum reported here. A two-dimensional treatment incorporating lateral heterogeneity and the vascular contribution to heat transport is a natural next step. Finally, the present work is purely theoretical and numerical; experimental demonstration of the predicted modes—and thereby validation of the underlying CV description over the relevant frequency range—remains an open challenge, which we address in the paragraph that follows.
The experimental requirements that follow from the present calculations are concrete. The predicted defect mode lies at Hz with a spectral width set by ∼30–m, implying that a measurement must resolve sub-Hertz spectral features while probing depth variations on the m scale. Two experimental modalities are naturally suited to this regime. Frequency-domain thermoreflectance (FDTR) with modulation frequencies in the sub-Hz to tens-of-Hz range has been used to observe non-Fourier thermal transport in solids [39], and its extension to layered biological samples would require mainly an appropriate probe geometry and the preparation of stacked tissue layers of controlled thickness. Photothermal and photoacoustic techniques operating in the same frequency window are other candidates, with the practical advantage that the thermal response of skin and near-surface tissue is already routinely measured by these methods. In either case, the experimental signature of the defect mode would be a narrow minimum in the apparent thermal attenuation as a function of modulation frequency, evaluated for a sample prepared with a well-defined defect layer of thickness between N mirror bilayers. The sensitivity of to predicted in Figure 8 provides an internal consistency check: a correctly realized sample should display the linear dependence across the range of defect thicknesses explored here. Such a measurement would constitute both a confirmation of the defect-mode physics and an independent test of the CV description of heat transport in layered biological media.
6. Conclusions
We have demonstrated the existence and properties of defect-induced localized modes in a one-dimensional CV thermal wave crystal. A single defect layer inserted into a periodic stratum corneum/dermis bilayer creates a localized resonance—a cavity mode—whose frequency lies within the band gap of the perfect crystal. The mode is identified unambiguously through a sharp minimum of the imaginary Bloch wave vector in the supercell band structure, in direct analogy with defect modes in photonic and phononic crystals. The spatial profile of the mode is a sharply peaked, exponentially decaying function centered at the defect layer, with a localization length ranging from m at to m at mirror periods per side.
Two key design parameters control the mode independently. First, the number of mirror periods N controls the degree of spatial confinement: increases from to as N goes from 2 to 4, while remains essentially constant at ≈2.586 Hz. This decoupling of frequency and confinement is precisely the behavior of a photonic crystal microcavity, where adding mirror pairs increases the quality factor without shifting the resonance frequency. Second, the defect-mode frequency is fully tunable across the gap by varying the defect-layer thickness : for all three candidate biological materials (skeletal muscle, subcutaneous tissue, and processed meat), decreases monotonically as increases, sweeping continuously from near the upper gap edge to near the lower edge.
The method is validated at three levels: analytical agreement with the Chen et al. [6] dispersion formula, matrix multiplication consistency, and exact zone-folding recovery of the perfect-crystal band structure from the supercell limit (Equation (22)), with numerical agreement to within .
From a broader perspective, these results establish that the phenomenology of photonic crystal microcavities—localized resonance, exponential confinement, mirror-controlled quality factor, continuous frequency tuning—is fully reproduced in the CV thermal wave crystal at the microscale, using biologically available materials and layer thicknesses of order m. The CV platform is thus a viable route to engineered heat localization, complementary to phononic thermocrystals but accessible at far larger scales and without nanofabrication.
Several directions for future work are suggested by these results. The extension to heterostructures with multiple defects could realize coupled-cavity arrays and tight-binding bands in this thermal setting. The sensitivity of to the defect material parameters—particularly —suggests that defect-mode spectroscopy could, in principle, serve as a probe of thermal relaxation times in layered structures. Application to biological tissue would require independent validation of CV-type transport at the relevant frequencies. Finally, the experimental realization of the CV thermal wave crystal via frequency-domain thermoreflectance [39] remains an important open challenge, and the present calculations provide the quantitative predictions required to guide such experiments.
Author Contributions
Conceptualization, J.M.-M. and R.E.-S.; methodology, J.M.-M. and B.M.-M.; software, J.M.-M. and D.S.-P.; validation, J.M.-M., B.M.-M. and D.S.-P.; formal analysis, J.M.-M. and R.E.-S.; investigation, J.M.-M., B.M.-M., R.E.-S. and D.S.-P.; writing—original draft preparation, J.M.-M.; writing—review and editing, B.M.-M., R.E.-S. and D.S.-P.; visualization, J.M.-M.; supervision, J.M.-M.; project administration, J.M.-M. All authors have read and agreed to the published version of the manuscript.
Funding
This research received no external funding.
Data Availability Statement
The original contributions presented in this study are included in the article. Further inquiries can be directed to the corresponding author.
Acknowledgments
J.M.-M. and R.E.-S. would like to acknowledge the UNISON–UNAM collaboration program for its support.
Conflicts of Interest
The authors declare no conflicts of interest.
Abbreviations
The following abbreviations are used in this manuscript:
| CV | Cattaneo–Vernotte |
| TWC | Thermal wave crystal |
| TMM | Transfer matrix method |
| PhC | Photonic crystal |
| PnC | Phononic crystal |
References
- Chatterjee, S.; Paras; Hu, H.; Chakraborty, M. A Review of Nano and Microscale Heat Transfer: An Experimental and Molecular Dynamics Perspective. Processes 2023, 11, 2769. [Google Scholar] [CrossRef] [Scilit]
- Bazhlekova, E.; Bazhlekov, I. Transition from Diffusion to Wave Propagation in Fractional Jeffreys-Type Heat Conduction Equation. Fractal Fract. 2020, 4, 32. [Google Scholar] [CrossRef] [Scilit]
- Sobolev, S.L.; Dai, W. Heat Transport on Ultrashort Time and Space Scales in Nanosized Systems: Diffusive or Wave-like? Materials 2022, 15, 4287. [Google Scholar] [CrossRef] [Scilit] [PubMed]
- Cattaneo, C. Sulla conduzione del calore. Atti Sem. Mat. Fis. Univ. Modena 1948, 3, 83–101. [Google Scholar]
- Vernotte, P. Les paradoxes de la théorie continue de l’équation de la chaleur. C. R. Acad. Sci. Paris 1958, 246, 3154–3155. [Google Scholar]
- Chen, A.L.; Li, Z.Y.; Ma, T.X.; Li, X.S.; Wang, Y.S. Heat reduction by thermal wave crystals. Int. J. Heat Mass Transf. 2018, 121, 215–222. [Google Scholar] [CrossRef] [Scilit]
- Camacho de la Rosa, A.; Becerril, D.; Gómez-Farfán, M.G.; Esquivel-Sirvent, R. Bragg Mirrors for Thermal Waves. Energies 2021, 14, 7452. [Google Scholar] [CrossRef] [Scilit]
- Morales-Morales, G.; Manzanares-Martínez, J. Enlargement of band gaps on thermal wave crystals by using heterostructures. Results Phys. 2022, 42, 106019. [Google Scholar] [CrossRef] [Scilit]
- McGurn, A.R. Introduction to Photonic and Phononic Crystals and Metamaterials; Springer: Cham, Switzerland, 2020. [Google Scholar]
- Maldovan, M. Sound and heat revolutions in phononics. Nature 2013, 503, 209–217. [Google Scholar] [CrossRef] [Scilit] [PubMed]
- Joannopoulos, J.D.; Johnson, S.G.; Winn, J.N.; Meade, R.D. Photonic Crystals: Molding the Flow of Light, 2nd ed.; Princeton University Press: Princeton, NJ, USA, 2008. [Google Scholar]
- Yablonovitch, E. Inhibited spontaneous emission in solid-state physics and electronics. Phys. Rev. Lett. 1987, 58, 2059–2062. [Google Scholar] [CrossRef] [Scilit] [PubMed]
- John, S. Strong localization of photons in certain disordered dielectric superlattices. Phys. Rev. Lett. 1987, 58, 2486–2489. [Google Scholar] [CrossRef] [Scilit] [PubMed]
- Gryga, M.; Ciprian, D.; Gembalova, L.; Hlubina, P. One-dimensional photonic crystal with a defect layer utilized as an optical filter. Crystals 2023, 13, 93. [Google Scholar] [CrossRef] [Scilit]
- Panda, A.; Pukhrambam, P.D.; Wu, F.; Belhadj, W. Graphene-based 1D defective photonic crystal biosensor. Eur. Phys. J. Plus 2021, 136, 809. [Google Scholar] [CrossRef] [Scilit]
- Segovia-Chaves, F.; Navarro Barón, E.; Vinck-Posada, H. Local density of states for different cancer cells in a one-dimensional photonic biosensor. Mater. Res. Express 2025, 12, 026201. [Google Scholar] [CrossRef] [Scilit]
- Shirai, H.; Ishii, K.; Miyagawa, H.; Koshiba, S.; Nakanishi, S.; Tsurumachi, N. Efficient terahertz emission using one-dimensional photonic crystal microcavity. J. Opt. Soc. Am. B 2014, 31, 1393–1401. [Google Scholar] [CrossRef] [Scilit]
- Shelke, A.; Banerjee, S.; Habib, A.; Rahani, E.K.; Ahmed, R.; Kundu, T. Wave guiding and wave modulation using phononic crystal defects. J. Intell. Mater. Syst. Struct. 2014, 25, 1541–1552. [Google Scholar] [CrossRef] [Scilit]
- Yang, J.; Jo, S.H. Experimental validation for mechanically tunable defect bands. Crystals 2024, 14, 701. [Google Scholar] [CrossRef] [Scilit]
- Jo, S.H. Temperature-controlled defective phononic crystals with shape memory alloys. Crystals 2025, 15, 412. [Google Scholar] [CrossRef] [Scilit]
- Maldovan, M. Narrow low-frequency spectrum and heat management by thermocrystals. Phys. Rev. Lett. 2013, 110, 025902. [Google Scholar] [CrossRef] [Scilit] [PubMed]
- Manzanares-Martínez, B.; Manzanares-Martínez, J. Omnidirectional THz mirror on a one-dimensional porous silicon thermocrystal. Nanosci. Nanotechnol. Lett. 2019, 11, 1699–1705. [Google Scholar] [CrossRef] [Scilit]
- Manzanares-Martínez, J.; Esquivel-Sirvent, R. Non-Fourier omnidirectional thermal mirror in finite biological multilayer. Results Phys. 2026, 80, 108563. [Google Scholar] [CrossRef] [Scilit]
- Romero-Ramos, C.A.; Manzanares-Martínez, M.B.; Soto-Puebla, D.; Manzanares-Martínez, J. Complex band structure of thermal wave crystals: The plane-wave method. Rev. Mex. Fís. 2024, 70, 031601. [Google Scholar] [CrossRef] [Scilit]
- Romero-Ramos, C.A.; Manzanares-Martínez, J.; Soto-Puebla, D.; Manzanares-Martínez, B. Complex band structure of thermal wave crystals. Rev. Mex. Fís. 2024, 70, 061603. [Google Scholar] [CrossRef] [Scilit]
- Straughan, B. Heat Waves; Applied Mathematical Sciences; Springer Science & Business Media: New York, NY, USA, 2011; Volume 177. [Google Scholar] [CrossRef] [Scilit]
- Joseph, D.D.; Preziosi, L. Heat waves. Rev. Mod. Phys. 1989, 61, 41–73. [Google Scholar] [CrossRef] [Scilit]
- Jou, D.; Casas-Vázquez, J.; Lebon, G. Extended irreversible thermodynamics. Rep. Prog. Phys. 1988, 51, 1105–1179. [Google Scholar] [CrossRef] [Scilit]
- Xu, F.; Seffen, K.A.; Lu, T.J. Non-Fourier analysis of skin biothermomechanics. Int. J. Heat Mass Transf. 2008, 51, 2237–2259. [Google Scholar] [CrossRef] [Scilit]
- Kaminski, W. Hyperbolic heat conduction equation for materials with a nonhomogeneous inner structure. ASME J. Heat Transf. 1990, 112, 555–560. [Google Scholar] [CrossRef] [Scilit]
- Mitra, K.; Kumar, S.; Vedevarz, A.; Moallemi, M.K. Experimental evidence of hyperbolic heat conduction in processed meat. ASME J. Heat Transf. 1995, 117, 568–573. [Google Scholar] [CrossRef] [Scilit]
- Scott, E.P.; Tilahun, M.; Vick, B. The question of thermal waves in heterogeneous and biological materials. J. Biomech. Eng. 2009, 131, 074518. [Google Scholar] [CrossRef] [Scilit] [PubMed]
- Camacho de la Rosa, A.; Esquivel-Sirvent, R.; Becerril, D. Relaxation times of non-Fourier materials using frequency-domain thermoreflectance. J. Appl. Phys. 2025, 137, 155103. [Google Scholar] [CrossRef] [Scilit]
- Camacho de la Rosa, A.; Becerril, D.; Gómez-Farfán, M.G.; Esquivel-Sirvent, R. Time-harmonic photothermal heating by nanoparticles in a non-Fourier medium. J. Phys. Chem. C 2021, 125, 22856–22862. [Google Scholar] [CrossRef] [Scilit]
- Shirzadkhani, R.; Eskandari, S.; Akbarzadeh, A. Non-Fourier thermal wave in 2D cellular metamaterials: From transient heat propagation to harmonic band gaps. Int. J. Heat Mass Transf. 2023, 205, 123917. [Google Scholar] [CrossRef] [Scilit]
- Yeh, P.; Yariv, A.; Hong, C.S. Electromagnetic propagation in periodic stratified media. I. General theory. J. Opt. Soc. Am. 1977, 67, 423–438. [Google Scholar] [CrossRef] [Scilit]
- Dechaumphai, E.; Chen, R. Thermal transport in phononic crystals: The role of zone folding effect. J. Appl. Phys. 2012, 111, 073508. [Google Scholar] [CrossRef] [Scilit]
- Nomura, M.; Anufriev, R.; Zhang, Z.; Maire, J.; Guo, Y.; Yanagisawa, R.; Volz, S. Review of thermal transport in phononic crystals. Mater. Today Phys. 2022, 22, 100613. [Google Scholar] [CrossRef] [Scilit]
- Beardo, A.; López-Suárez, M.; Pérez, L.A.; Sendra, L.; Alonso, M.I.; Melis, C.; Bafaluy, J.; Camacho, J.; Colombo, L.; Rurali, R.; et al. Observation of second sound in a rapidly varying temperature field in Ge. Sci. Adv. 2021, 7, eabg4677. [Google Scholar] [CrossRef] [Scilit] [PubMed]
- Kumar, P.; Kumar, D.; Rai, K.N. Numerical simulation of dual-phase-lag bioheat transfer model during thermal therapy. Math. Biosci. 2016, 281, 82–91. [Google Scholar] [CrossRef] [Scilit] [PubMed]
Disclaimer/Publisher’s Note: The statements, opinions and data contained in all publications are solely those of the individual author(s) and contributor(s) and not of MDPI and/or the editor(s). MDPI and/or the editor(s) disclaim responsibility for any injury to people or property resulting from any ideas, methods, instructions or products referred to in the content. |
© 2026 by the authors. Licensee MDPI, Basel, Switzerland. This article is an open access article distributed under the terms and conditions of the Creative Commons Attribution (CC BY) license.