


Abstract
To investigate the structural characteristics of Irn clusters (n = 9–30) and their interaction with NH3, the CALYPSO structure-prediction method was employed to identify the lowest-energy configurations. The Lennard–Jones potential was then used to compute the binding energy and average binding energy, thereby evaluating size-dependent stability. The results show that Irn clusters evolve from relatively open motifs to compact three-dimensional frameworks as n increases. Meanwhile, the average binding energy increases overall and exhibits several locally stable size regions, indicating a pronounced size effect. Based on slab and cluster models, NH3 adsorption was further examined on the Ir13 cluster as a representative system due to its high structural stability as a “magic-number” cluster. The calculated adsorption energies demonstrate that the Ir13 cluster exhibits substantially stronger adsorption than the bulk Ir surface, with low-coordinated Ir atoms playing a key role in strengthening the interaction and enhancing adsorption activity. Adsorption-configuration analysis indicates that NH3 preferentially binds to active surface sites via the N lone pair. These findings clarify the relationship between structural stability and adsorption performance of Ir clusters and provide theoretical support for Ir-based materials in NH3 catalytic conversion and high-sensitivity gas detection, and offer insights relevant to improving NH3 monitoring in underground coal mine environments.
1. Introduction
Ammonia (NH3), a potent irritant and corrosive nitrogen-containing pollutant, poses grave risks to human health and the ecological environment when excessively accumulated. During industrial production, chemical processing, and energy utilization, unplanned NH3 leakage can occur due to operational conditions or material degradation. Within the confined spaces of underground coal mines, NH3 may originate from residual explosives, decomposition of nitrogenous materials, ventilation system leaks, or equipment corrosion. Owing to the narrow, poorly ventilated environment underground, NH3 readily accumulates locally, causing severe irritation to miners and potentially interfering with gas monitoring systems, thereby undermining the reliability of mine-ventilation safety management. Consequently, developing functional materials possessing both high adsorption capacity and superior sensitivity toward NH3 is critical for enhancing detection performance in coal-mine monitoring systems [1].
Beyond its environmental hazards, NH3 has also emerged as a promising carbon-free energy carrier [2]. Catalytic decomposition of NH3 can produce high-purity H2 and N2 without CO2 emissions [3], making it a clean and efficient pathway for hydrogen generation and storage. Owing to its high volumetric hydrogen density, ease of liquefaction, and relatively low transport cost, NH3 is increasingly regarded as a key element in future hydrogen-energy systems. Consequently, the design of highly active catalysts capable of efficiently adsorbing and activating NH3 is of broad interest in both environmental protection and hydrogen-energy research.
Various metal-based catalysts—including Pd, Pt, Rh, Ni, and their alloys—have been widely investigated for NH3 decomposition and adsorption applications [2,4,5]. Although these catalysts exhibit certain levels of activity, recent experimental and theoretical studies have demonstrated that iridium (Ir) exhibits superior catalytic stability and surface reactivity compared with many other noble metals [6,7,8,9,10]. At the nanoscale, Ir clusters show markedly enhanced catalytic and adsorption performance relative to bulk Ir due to the abundance of low-coordinated surface atoms and pronounced electronic–structure modifications [11]. These characteristics enable Ir clusters (Irn) to serve as model systems for understanding the structure–activity relationships of Ir-based catalytic and sensing materials [12,13]. Such structural advantages also suggest that Ir clusters are promising candidates for high-performance NH3 sensing materials, particularly for real-time monitoring in coal-mine environments.
When Ir clusters participate in NH3-related catalysis, they are typically supported on suitable substrates [14]. Such supported metal catalysts exhibit pronounced structure dependence. As the size of a metal nanoparticle decreases to an atomic cluster or even a single atom, the electronic structure and energy-level distribution change accordingly, gradually evolving from quasi-continuous energy levels to discrete states. These changes influence the selectivity and strength of adsorption, and therefore the catalytic activity and selectivity of supported catalysts depend strongly on particle size.
According to the size of the supported metal species, supported metal catalysts are generally classified into three categories: single-atom catalysts (SACs), supported metal cluster catalysts (SMCs), and nanoparticle catalysts (NPs) [15]. SACs are highly attractive because of their high atomic utilization efficiency and excellent reactivity. However, for some complex reactions that require the cooperative participation of multiple active centers, SACs may be insufficient. In contrast, SMCs usually exhibit three characteristics: adjacent metal–metal sites, small cluster sizes (generally below 2 nm), and a limited number of cluster atoms. Owing to their unique geometric and electronic structures, such supported metal cluster catalysts often display distinctive selectivity and excellent activity in many reactions. In addition, they provide the possibility of simultaneously achieving nearly 100% metal-atom utilization and abundant surface-active sites.
Avelino Corma and co-workers investigated Pt species of different sizes, ranging from single atoms to subnanometric clusters and nanoparticles, supported on MCM-22 for the reduction of NO by CO. Both experimental and DFT results showed that only the subnanometric Pt clusters exhibited the highest catalytic activity, whereas isolated Pt atoms and Pt nanoparticle catalysts suffered from rapid sintering or CO poisoning and therefore showed much lower activity. Motivated by the advantages of SMCs, the present work focuses on the geometric structures of Ir clusters containing 9–30 atoms and further selects Ir13 as a representative cluster for NH3 adsorption analysis. The size range considered in this study falls within the typical scale of supported metal cluster catalysts (SMCs), which are generally regarded as an intermediate form between single-atom catalysts and nanoparticle catalysts [15].
The geometric structures and stability of Ir clusters critically depend on their size, as widely demonstrated in both theoretical and experimental studies. Experimental investigations have shown that specific cluster sizes can exhibit enhanced stability due to geometric and electronic shell effects. Consequently, theoretical structure-prediction techniques have become indispensable tools for exploring the stable configurations and intrinsic properties of these elusive metal clusters [16]. CALYPSO, a powerful particle-swarm-optimization-based global structure search method, has been successfully applied from crystals to nanostructures and metal clusters, demonstrating remarkable efficiency in identifying low-energy configurations across complex potential-energy surfaces.
In this work, CALYPSO was employed to systematically predict the lowest-energy geometries of Irn clusters (n = 9–30) [17,18]. Furthermore, the NH3 adsorption behavior on Ir clusters and the Ir(100) surface was comparatively analyzed to elucidate the structural origin of enhanced nanoscale adsorption activity [19,20]. These findings elucidate the size-dependent structure–property relationships of iridium clusters and provide mechanistic insight into NH3 adsorption on nanoscale Ir species. The results may also offer material-level guidance for developing NH3-related catalytic and sensing materials, with potential relevance to challenging underground coal-mine monitoring scenarios.
While iridium clusters are typically supported on substrates in practical catalysis, this study focuses on isolated gas-phase clusters to elucidate their intrinsic size-dependent geometric and electronic properties. This approach eliminates complex metal–support interactions, providing a fundamental benchmark for understanding how cluster size alone dictates catalytic activity.
2. Computational Methods
2.1. Structural Search and Optimization of Ir Clusters
The geometric structures of Irn clusters (n = 9–30) were predicted using the CALYPSO (Crystal structure AnaLYsis by Particle Swarm Optimization) global structure search method. In the CALYPSO framework, each candidate cluster is treated as a “particle” on the potential energy surface, and its structural evolution follows the standard particle-swarm-optimization (PSO) update rules. The position and velocity of the i-th particle at iteration k are updated according to:
where is the position of the i-th particle at iteration k; is the velocity of the i-th particle at iteration k; is the historical best position found by the i-th particle; is the global best position identified during the search process; is the inertia weight used to balance global exploration and local exploitation; and are the cognitive and social learning factors, respectively; and are random numbers uniformly distributed between 0 and 1. The terms and guide the particle toward its individual best and the global optimum, respectively.
To enhance search efficiency and prevent excessive redundant structure generation, we applied symmetry constraints and fingerprint-based structural similarity screening. Symmetry-guided generation guarantees that candidate clusters exhibit sound geometric arrangements, while fingerprint-based filtering eliminates structurally equivalent or highly similar candidates, preserving population diversity.
In this work, each Irn cluster was initialized with a population of randomly generated structures. A population size of 30 and 50 global optimization generations was used to ensure sufficient sampling of the potential energy surface. The lowest-energy structures from each generation were retained and passed to subsequent iterations. These settings guarantee that the major low-energy configurations of Irn (n = 9–30) clusters are adequately explored and reliably identified.
2.2. Lennard–Jones Potential for Ir–Ir Interaction
The interatomic interactions within Ir clusters were described using the Lennard–Jones (LJ) potential, which was originally proposed by Lennard–Jones (1924) [21]. The LJ potential is expressed as:
where is the distance between atoms i and j (Å); is the potential well depth representing the strength of the attractive interaction (eV); and is the characteristic length parameter corresponding to the distance at which the potential becomes zero (Å). In this work, the LJ parameters for iridium were adopted from the Universal Force Field (UFF) [22], with ε = 0.00317 eV and σ = 2.84 Å. These parameters were applied consistently in all subsequent structural searches and energetic evaluations of Irn clusters. The UFF parameters have been widely used in preliminary structural exploration and global optimization of metal clusters due to their computational efficiency and reasonable transferability.
2.3. Structures of Optimized Ir Clusters
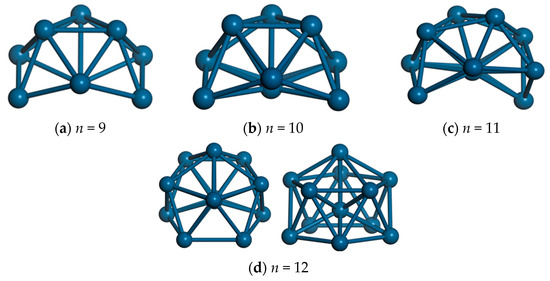
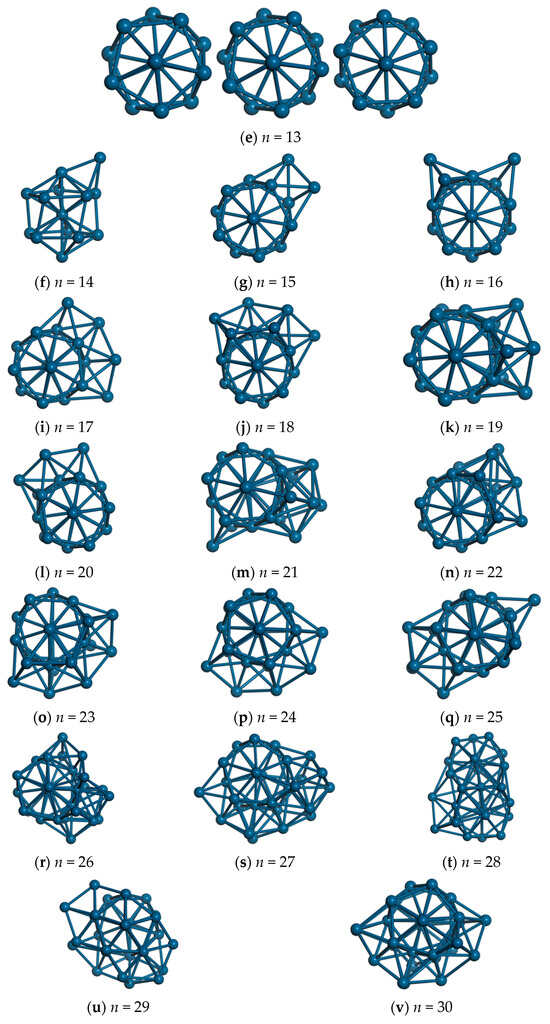
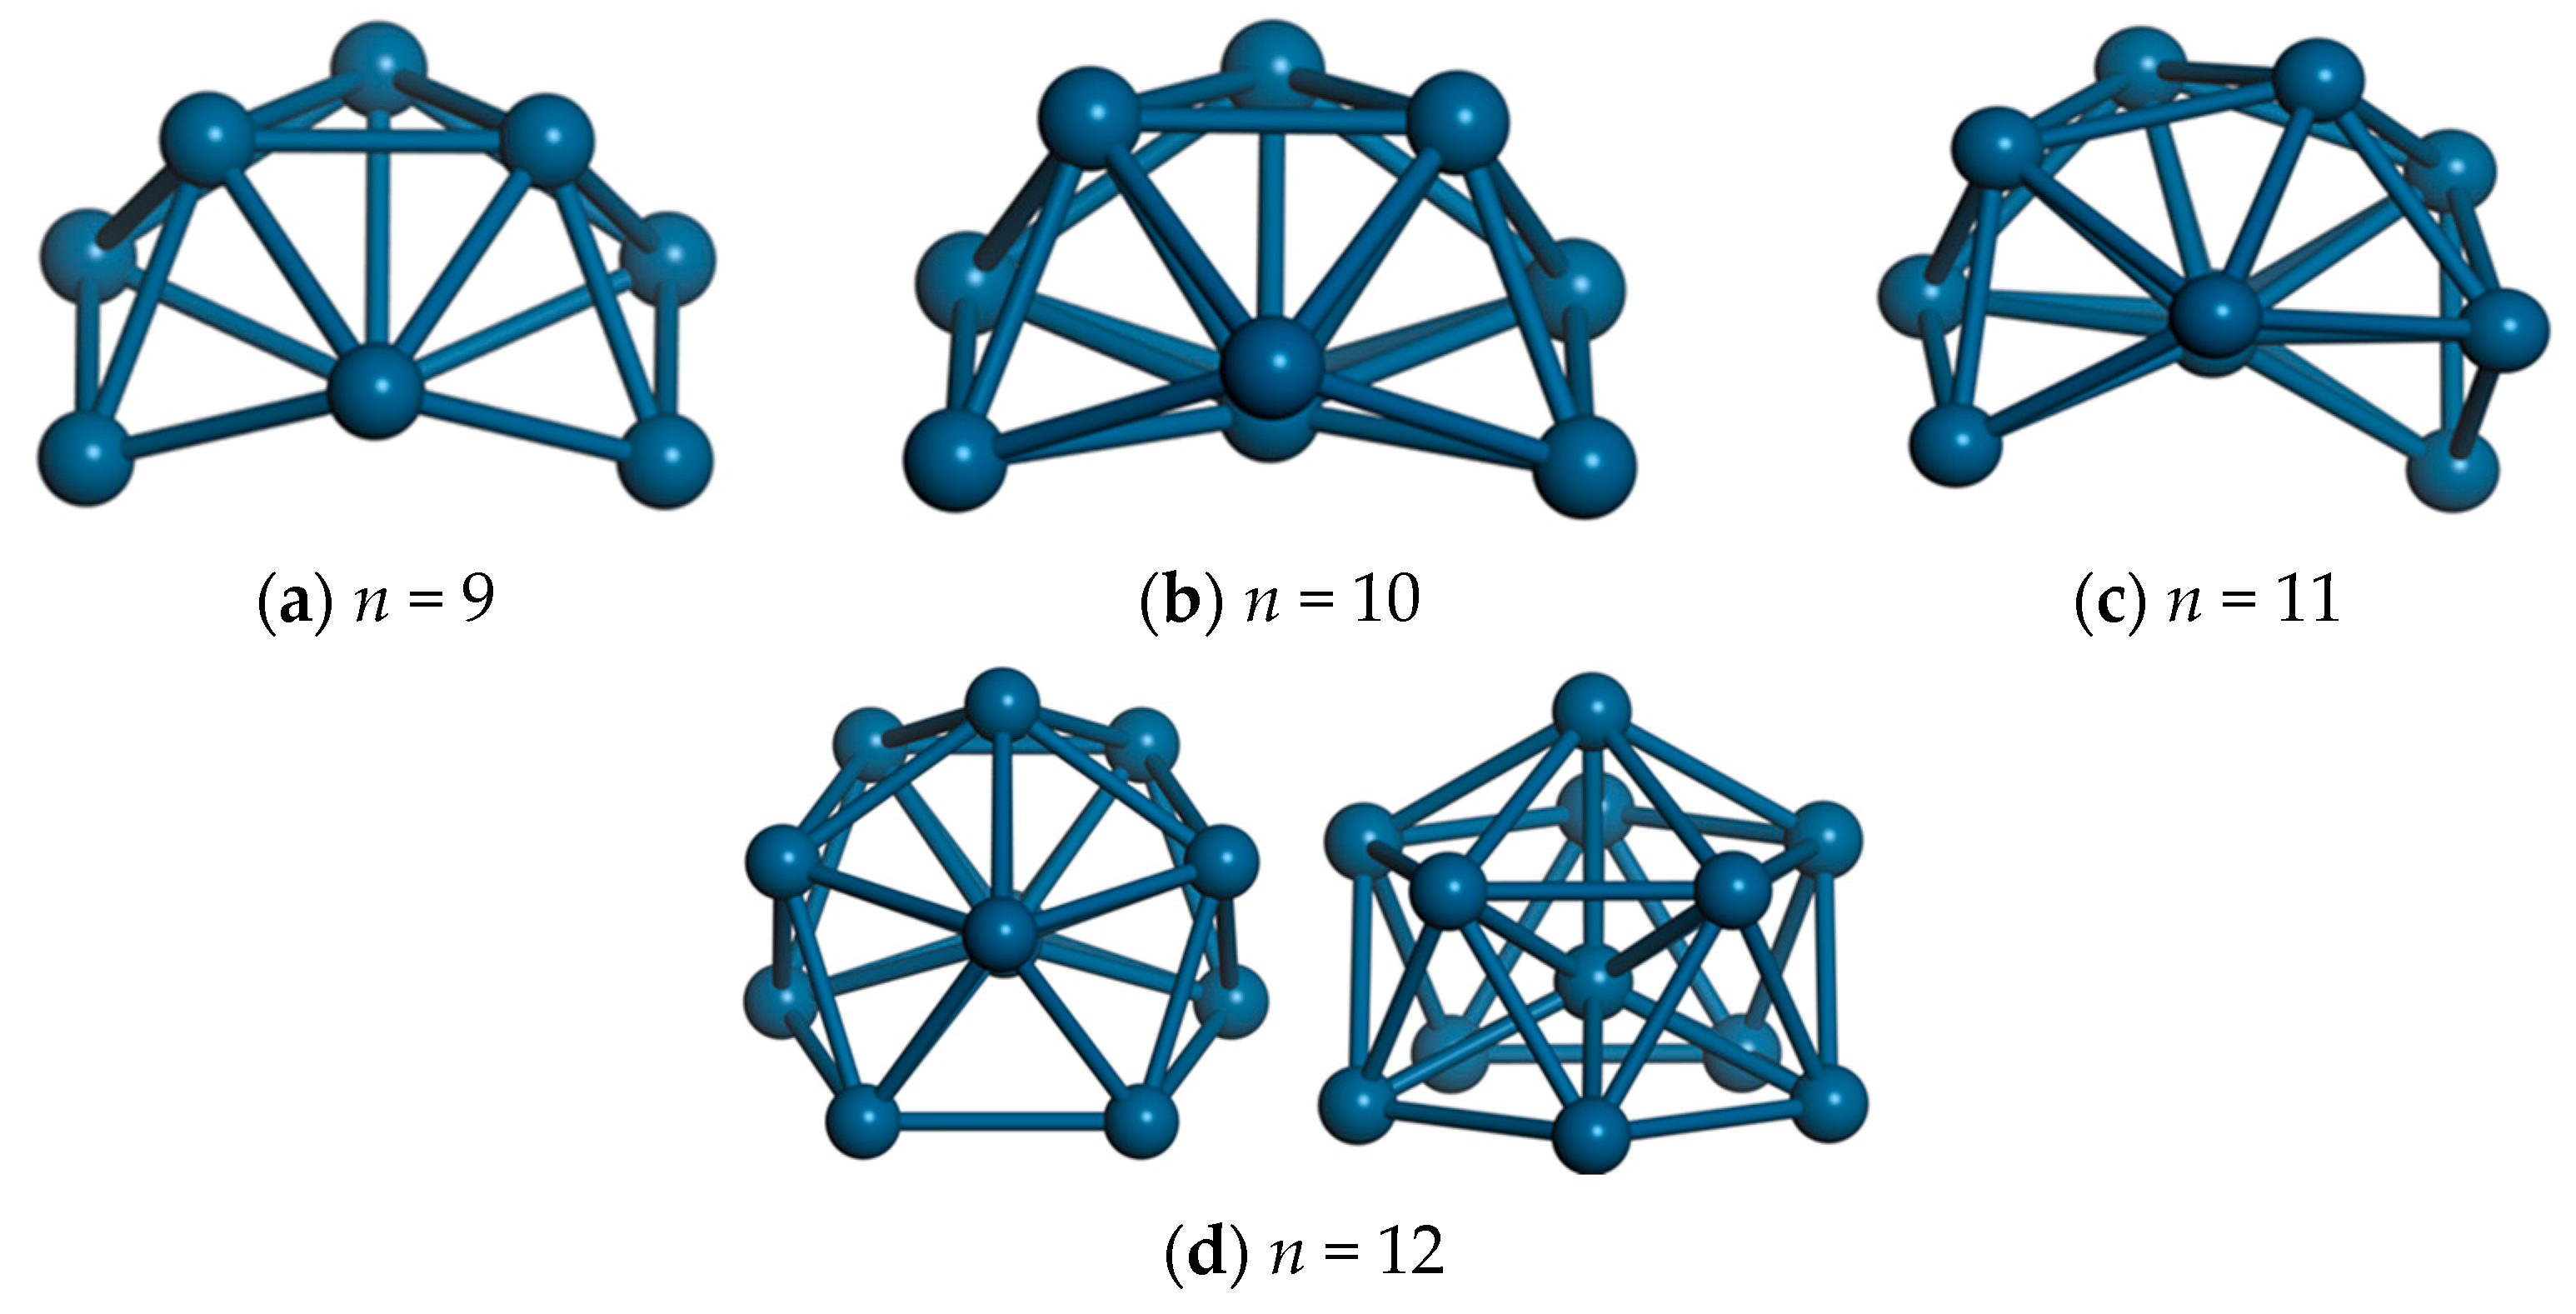
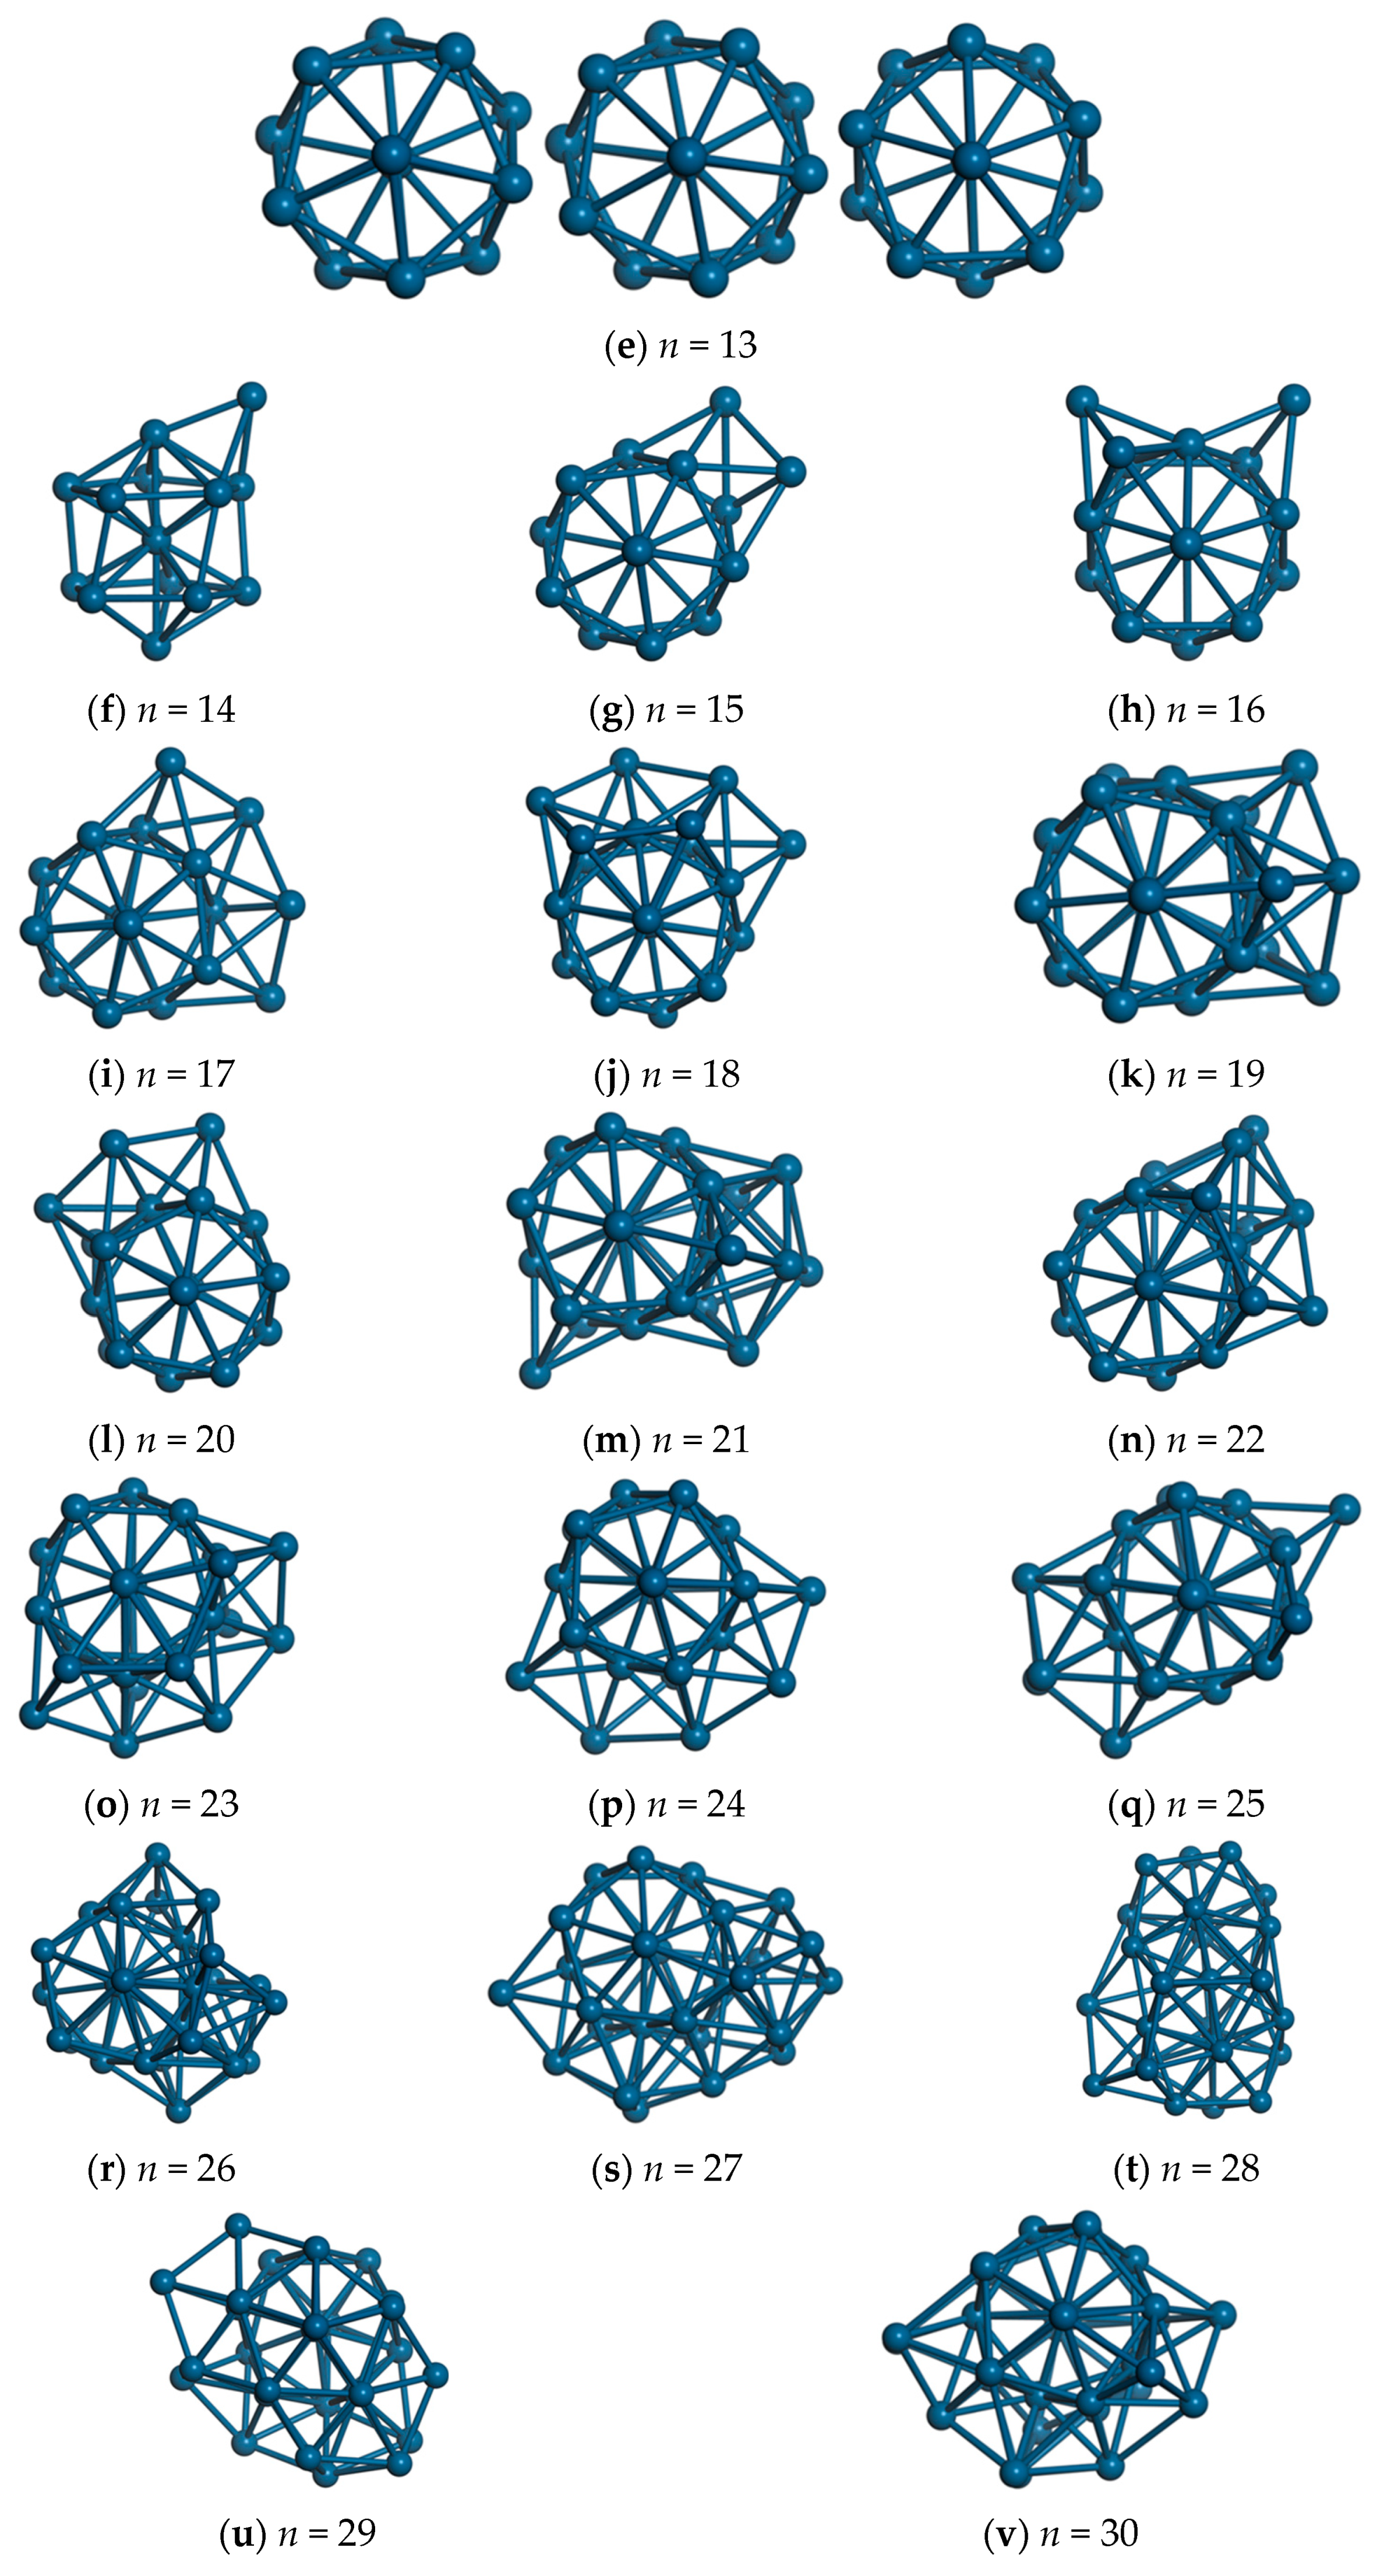
Figure 1 shows Ir clusters with different numbers of atoms obtained by optimizing using the aforementioned method. Observation shows that, if Ir13 is taken as the reference configuration, clusters containing different numbers of atoms are formed by adding or removing atoms from this basis. For example, in Figure 1a–d, Ir9~Ir12 is formed by gradually removing atoms from Ir13, while Ir14~Ir30 is formed by gradually adding atoms to Ir13, as shown in Figure 1f–v.
Figure 1.
Lowest-energy configurations of Irn clusters (n = 9–30). Panels (a–v) correspond to n = 9–30, respectively.
2.4. Binding Energy
After obtaining the lowest-energy geometry of each Irn cluster, the binding energy was calculated to evaluate their relative stability. The binding energy is defined as:
where is the average binding energy (eV/atom); is the total energy of the Irn cluster in its most stable configuration (eV); is the energy of an isolated Ir atom (eV); and n is the number of atoms in the cluster. This expression describes the average energy change per atom when n-isolated Ir atoms combine to form an Irn cluster. A larger indicates a greater degree of stabilization and thus a more stable cluster structure. Based on this definition, the variation in with cluster size was used to analyze stability evolution and to identify particularly stable cluster sizes. The absolute value of the binding energy is reported in this study.
2.5. NH3 Adsorption Energy Calculation
A larger indicates a more stable adsorption configuration and a stronger interaction between NH3 and the Ir substrate, whereas a value close to zero indicates weak adsorption.
To assess the adsorption strength of NH3 on various Ir-based models, the adsorption energy was calculated employing an energy-difference approach, precisely by comparing the total energy of the adsorption system with those of the isolated substrate and molecule. The adsorption energy is defined as:
where is the adsorption energy of NH3 on the slab or cluster model (eV); is the total energy of the adsorption system composed of the slab (or cluster) and the NH3 molecule (eV); is the total energy of the clean slab or Ir cluster (eV); and is the energy of an isolated NH3 molecule (eV). This definition is applicable to both bulk-surface models and cluster models. In this study, is reported directly as the calculated adsorption energy; therefore, a more negative corresponds to stronger adsorption and a more stable adsorption configuration.
For larger clusters (n ≥ 26, Figure 1s–v), the three-dimensional framework becomes more complete, and the interatomic arrangement increasingly resembles bulk-like metallic motifs. In this size range, structural variations are mainly associated with subtle surface rearrangements rather than fundamental changes in the overall geometry, indicating a gradual convergence of Irn clusters toward bulk structural characteristics with increasing size.
Overall, the transformation from sprawling, loosely bound structures to dense, tightly knit configurations epitomizes the characteristic size-dependent transformation of metal nanoclusters. These structural characteristics furnish the foundational framework essential for interpreting the stability trends and adsorption properties of Irn clusters discussed in the following sections.
Although empirical potentials were used for structural search, the adsorption properties were further evaluated using DFT calculations to ensure reliability. The structures obtained from the LJ-based global search are generally consistent with those optimized at the DFT level, with only minor deviations in total energy and geometry, indicating that the LJ potential provides a reasonable description for structural trends.
2.6. Calculation Settings for Adsorption of NH3 on Ir Clusters
After optimizing the geometric structures of Ir clusters containing different numbers of atoms, a suitable cluster should be selected to study the adsorption of NH3 on its surface. For detailed results, see Section 3.3. The specific calculation settings are as follows:
All geometry optimizations were performed using the CP2K package. In the calculations, the Gaussian and plane-wave (GPW) method was adopted. Core electrons were represented by pseudopotentials, and the exchange–correlation interaction was described using the GGA-PBE (Perdew–Burke–Ernzerhof) functional. A plane-wave cutoff energy of 600 Ry was employed. Periodic boundary conditions were applied in the x, y, and z directions, and a simulation cell of 25 Å × 25 Å × 25 Å was used to avoid artificial interactions between periodic images. Only the Γ point was included in the Brillouin-zone sampling, and the DFT-D3 dispersion correction was applied. The convergence criteria for geometry optimization were set to an RMS force of 3 × 10⁻³ and a maximum geometry change (MAX_DR) of 3 × 10⁻⁴.
3. Results and Discussion
3.1. Geometric Structures of Irn Clusters
The structural prediction results for Irn clusters (n = 9–30) are shown in Figure 1a–v, revealing a clear size-dependent evolution of their geometric characteristics. Small clusters generally exhibit open and irregular geometries, indicating high structural flexibility and pronounced surface dominance, which are typical features of small transition-metal clusters.
With increasing cluster size, local ordering gradually emerges in the atomic arrangement. Medium-sized clusters tend to form more compact three-dimensional structures, accompanied by an increase in the coordination numbers of core atoms. Notably, clusters at specific sizes (e.g., Ir13, Ir19, and Ir23) exhibit relatively higher symmetry and more tightly packed configurations, suggesting enhanced stability at these sizes along the potential energy landscape.
Among the investigated clusters, Ir13 was selected as the representative model for subsequent NH3 adsorption analysis due to its distinct structural significance. As a well-known “magic-number” cluster, Ir13 adopts a highly symmetric icosahedral-like geometry [23] with enhanced stability. This structure represents a key transition point from fluxional, molecule-like clusters to more rigid, bulk-like configurations. Moreover, the presence of well-defined surface sites (e.g., vertex and edge atoms) provides a suitable platform for systematically investigating adsorption behavior at the sub-nanoscale. Therefore, the selection of Ir13 ensures both physical representativeness and consistency with established cluster science studies.
3.2. Binding Energy Evolution of Irn Clusters
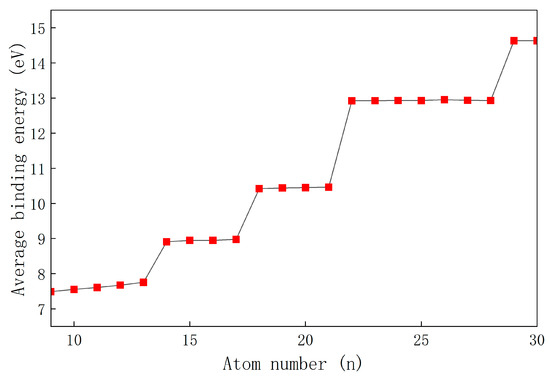
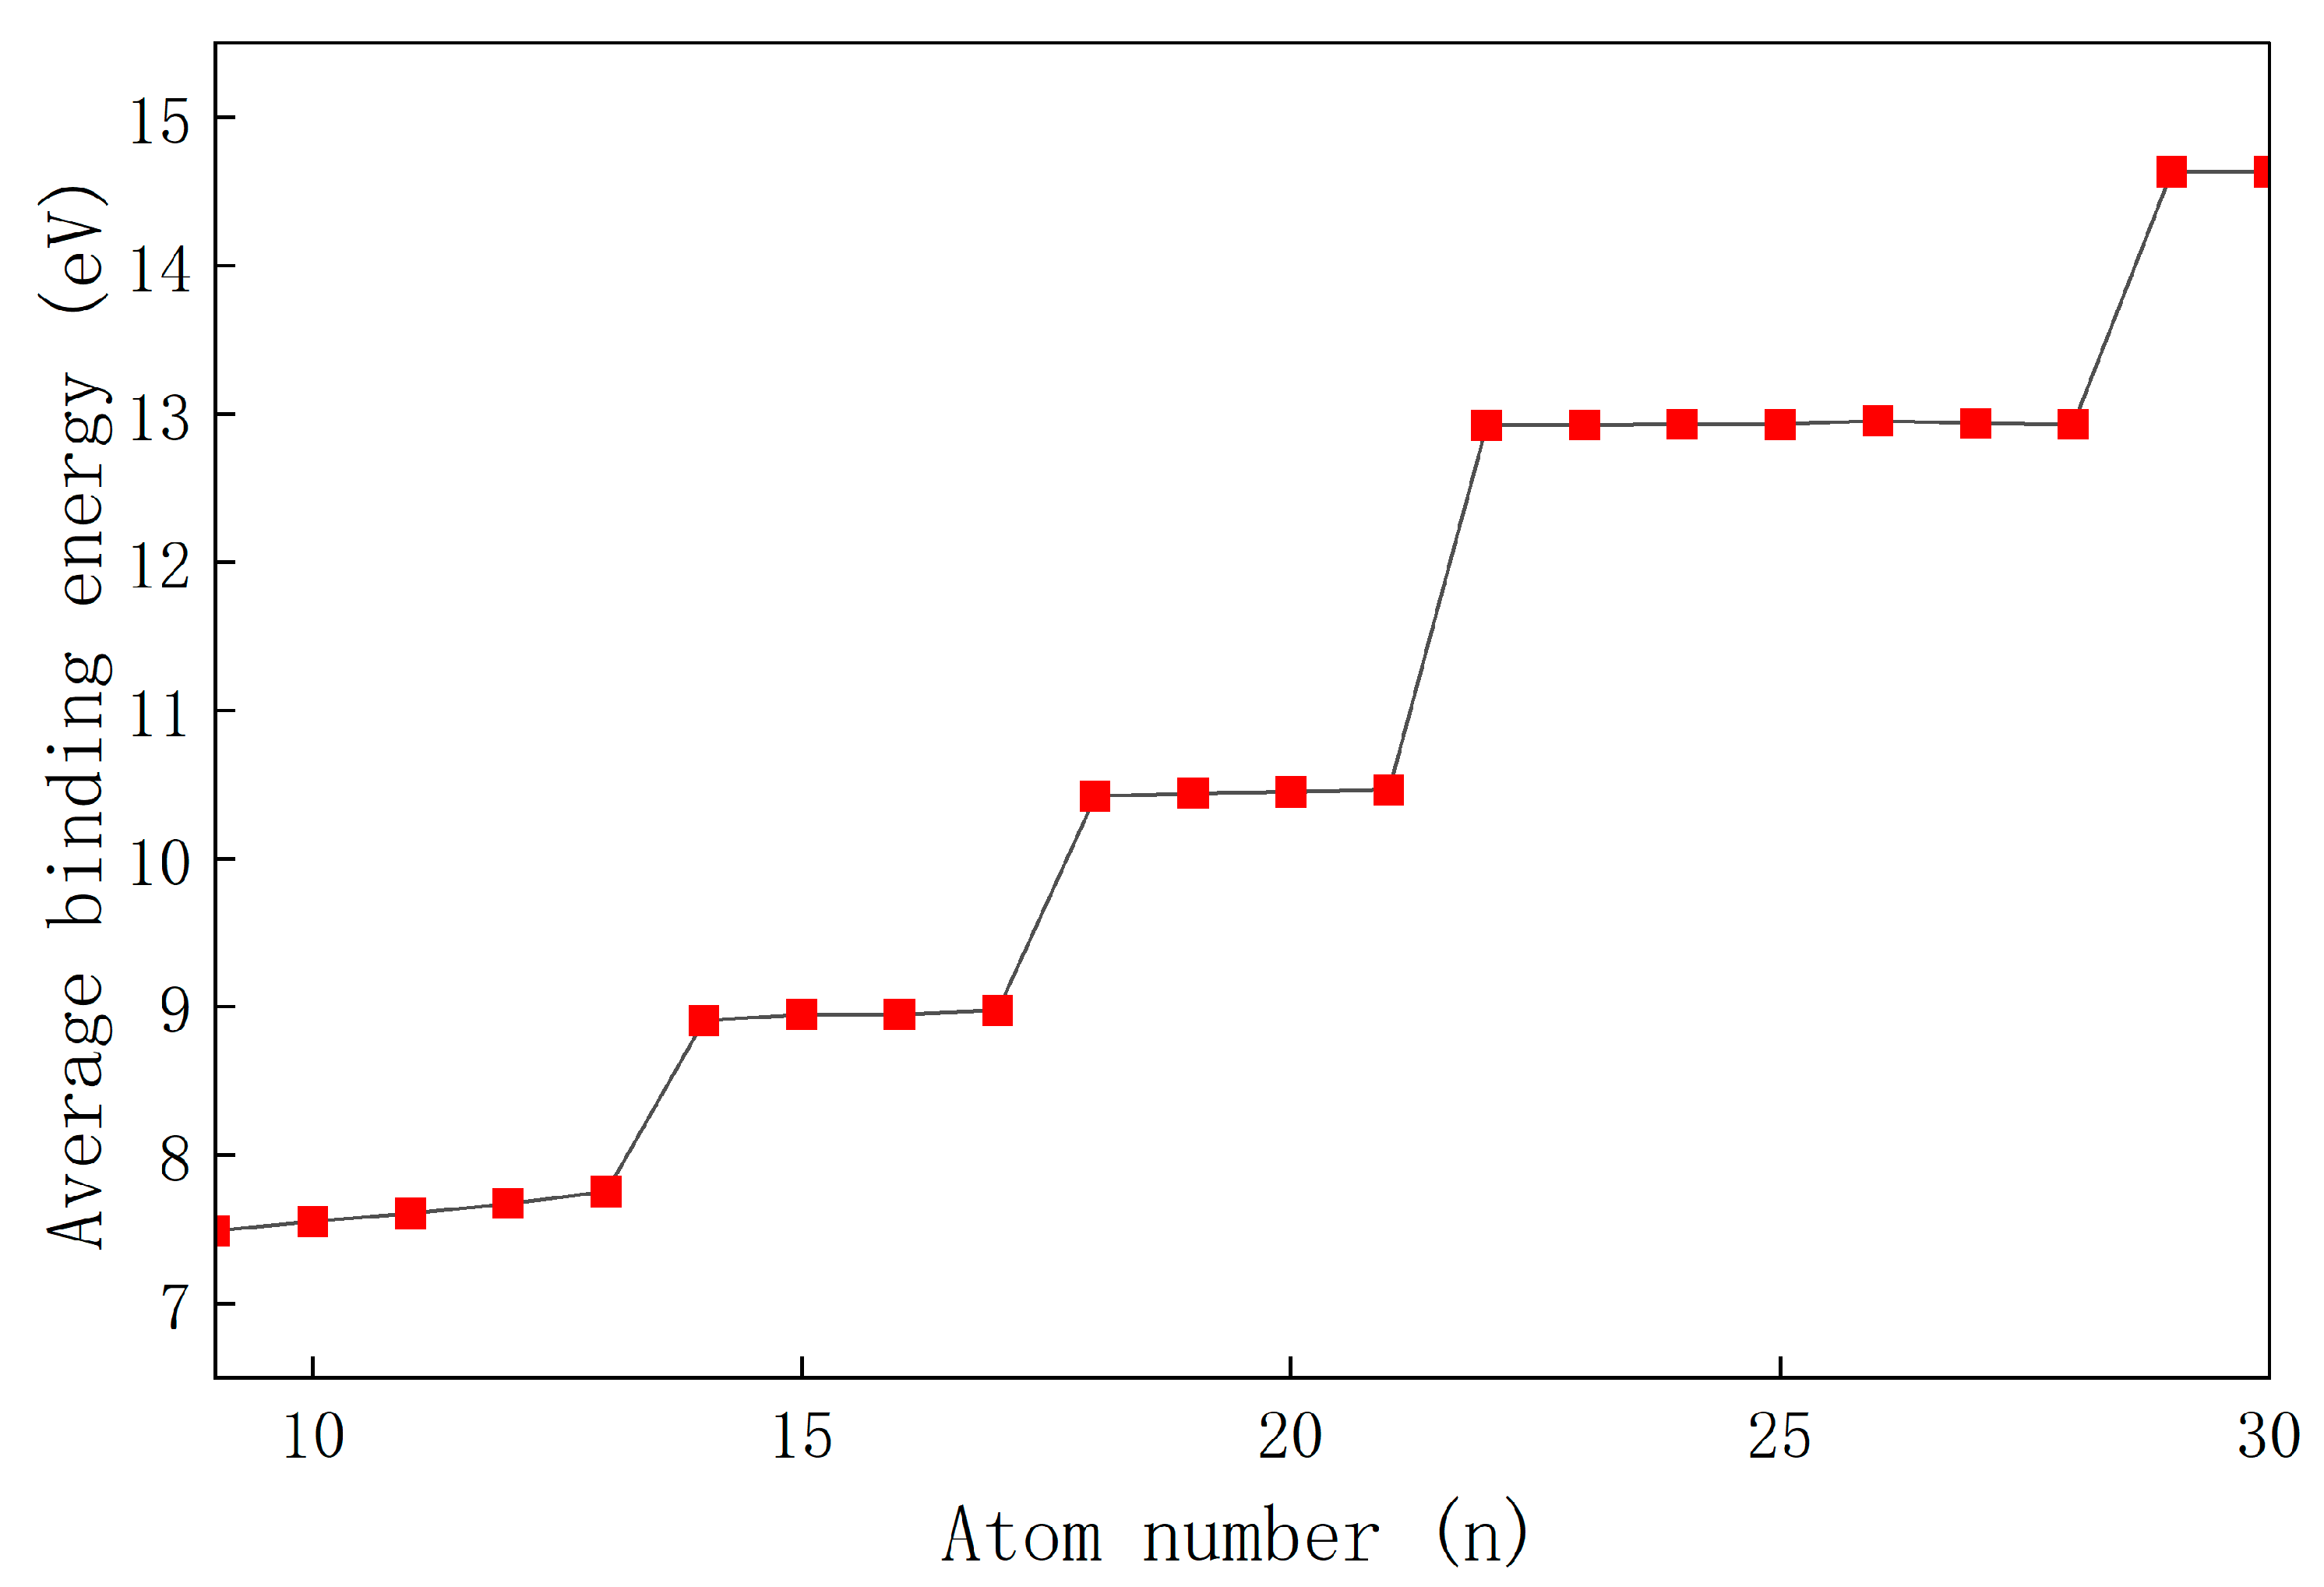
The total binding energies and average binding energies of Irn clusters (n = 9–30) are summarized in Table 1. The total binding energy increases continuously with increasing n, indicating that larger clusters experience greater overall energetic stabilization upon formation. The average binding energy, calculated according to Equation (4), provides a more direct measure of size-dependent stability. The corresponding variation in the average binding energy with cluster size is shown in Figure 2.
Table 1.
Total binding energies and average binding energies of Irn clusters (n = 9–30).
Figure 2.
Average binding energy of Irn clusters as a function of cluster size (n = 9–30).
As shown in Figure 2, the average binding energy increases overall with cluster size, although the growth is not uniform and several plateau-like regimes can be identified. For n = 9–13, the average binding energy remains around 7.6 eV. When the size increases to n = 14–17, it rises to approximately 8.9 eV. A further increase to n = 20–21 yields an average binding energy of about 10.4 eV. For n = 22–28, the average binding energy stabilizes near 12.9 eV, and the largest clusters (n = 29 and 30) reach approximately 14.6 eV. The noticeable increase at n = 29 is attributed to a structural transition toward a more compact and highly coordinated configuration, leading to enhanced interatomic interactions and stabilization.
This gradual enhancement in average binding energy indicates that atoms within larger clusters occupy increasingly compact and strongly bound local environments. The slight shortening of representative bond lengths, such as from approximately 2.858 Å in Ir13 to about 2.844 Å in Ir26, further supports this structural stabilization trend.
Overall, the binding energy results demonstrate that Irn clusters become progressively more stable as their size increases, exhibiting clear size-dependent stability regions that correspond well with the structural evolution patterns described in Figure 1. These findings form the energetic foundation for understanding the adsorption behavior discussed in the Section 3.3.
3.3. NH3 Adsorption Behavior on Ir Clusters and Bulk Ir Surface
3.3.1. Adsorption Configurations of NH3 on the Ir13 Cluster
To investigate the adsorption behavior of NH3 on the Ir13 cluster, the preferred adsorption configuration of NH3 on the cluster must first be identified [5].
The electrostatic potential (ESP) distribution on the molecular van der Waals surface has long been used to predict electrophilic and nucleophilic reactive sites. Regions with more positive (or more negative) electrostatic potential are considered more likely to attract nucleophilic (or electrophilic) reagents, respectively, and thus undergo chemical reactions. The van der Waals surface is typically defined following Bader’s criterion, corresponding to an electron density isosurface of 0.001 a.u.
However, even when no chemical reaction occurs between two interacting species, the electrostatic potential can still play a decisive role in determining the adsorption configuration. Lu [24] demonstrated that electrostatic interactions have a critical influence on the configuration of hydrogen and nitrogen dimers, showing that their structural preferences are predominantly governed by electrostatic effects.
Because both the Ir13 cluster and the NH3 molecule exhibit nonuniform electrostatic potential distributions near their surfaces, these features can be used to identify plausible initial adsorption configurations.
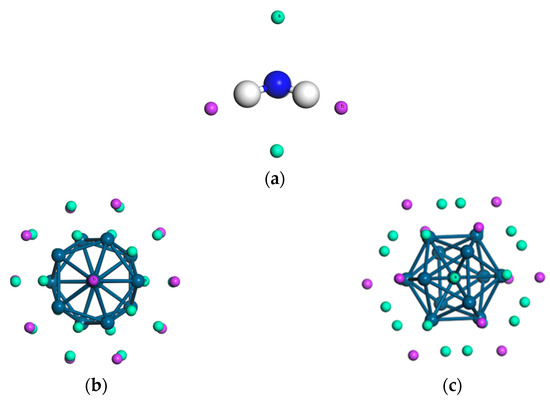
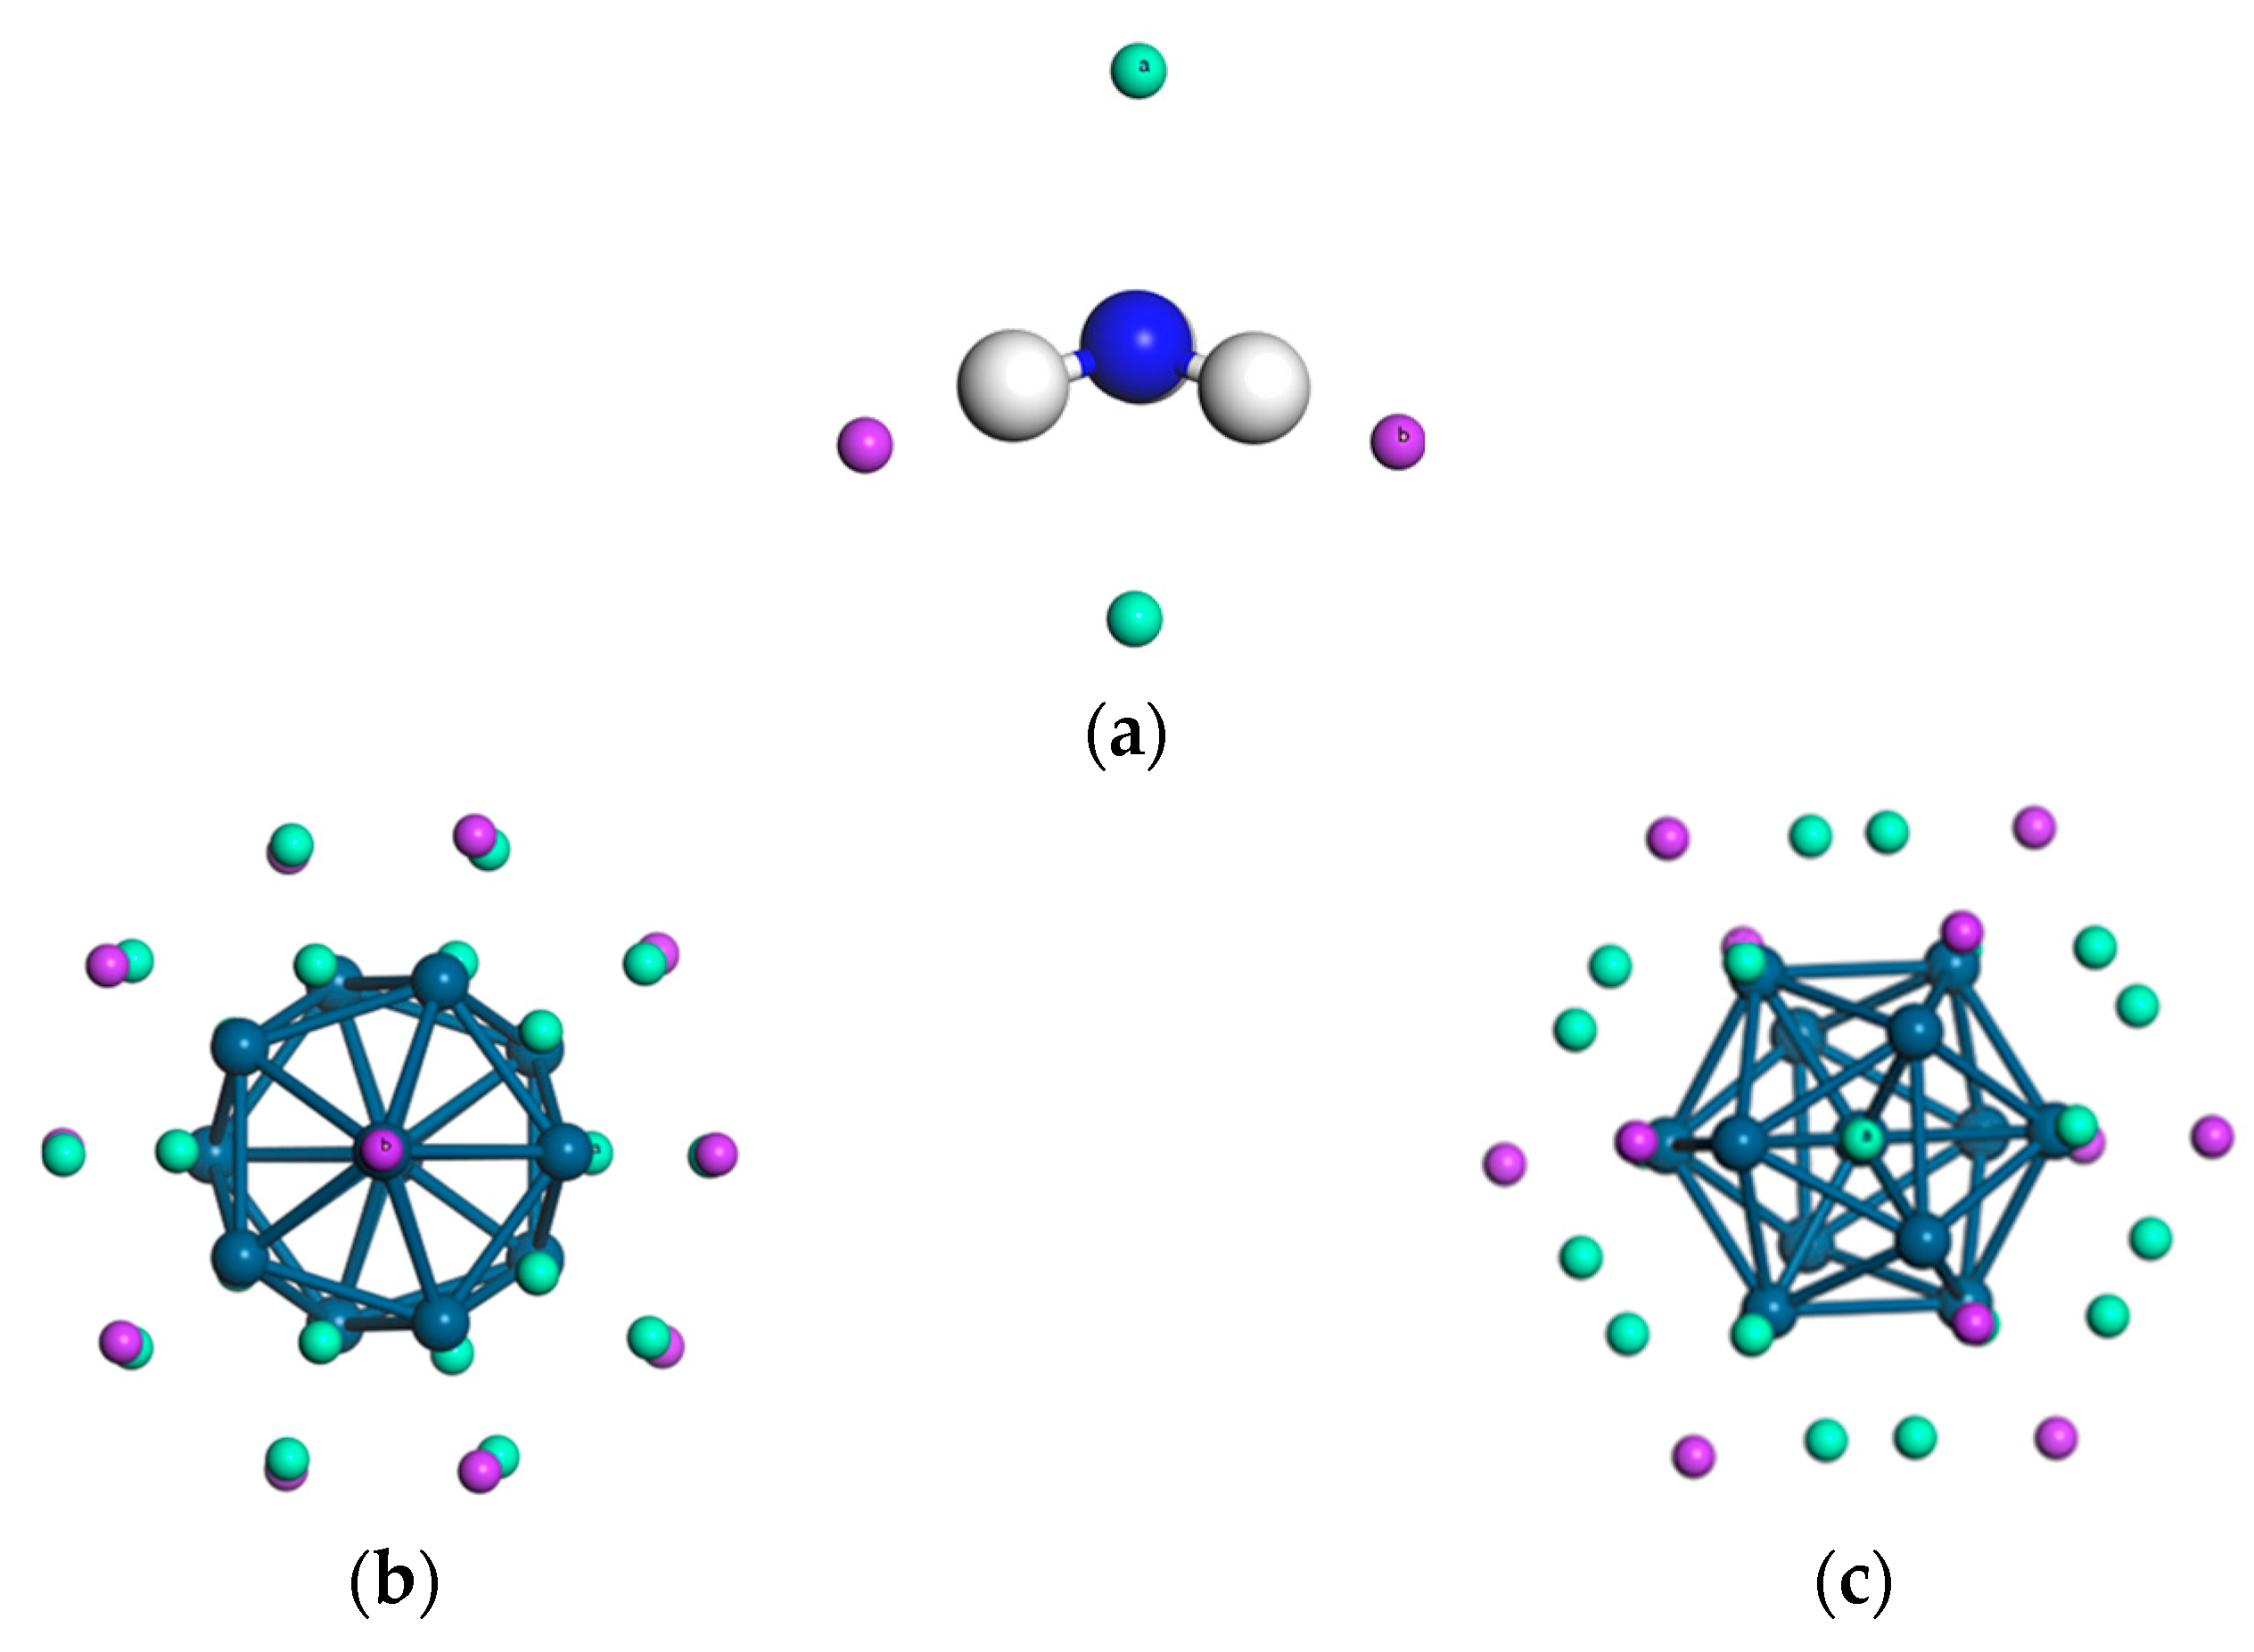
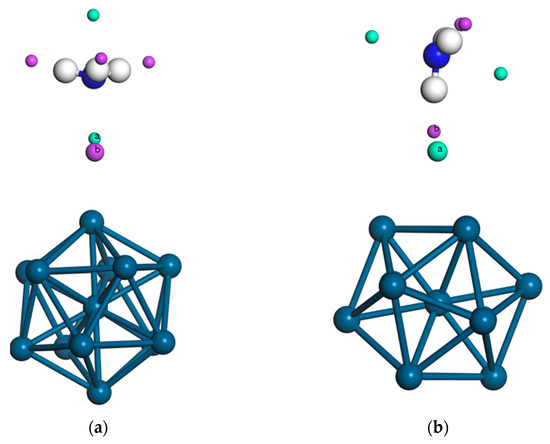
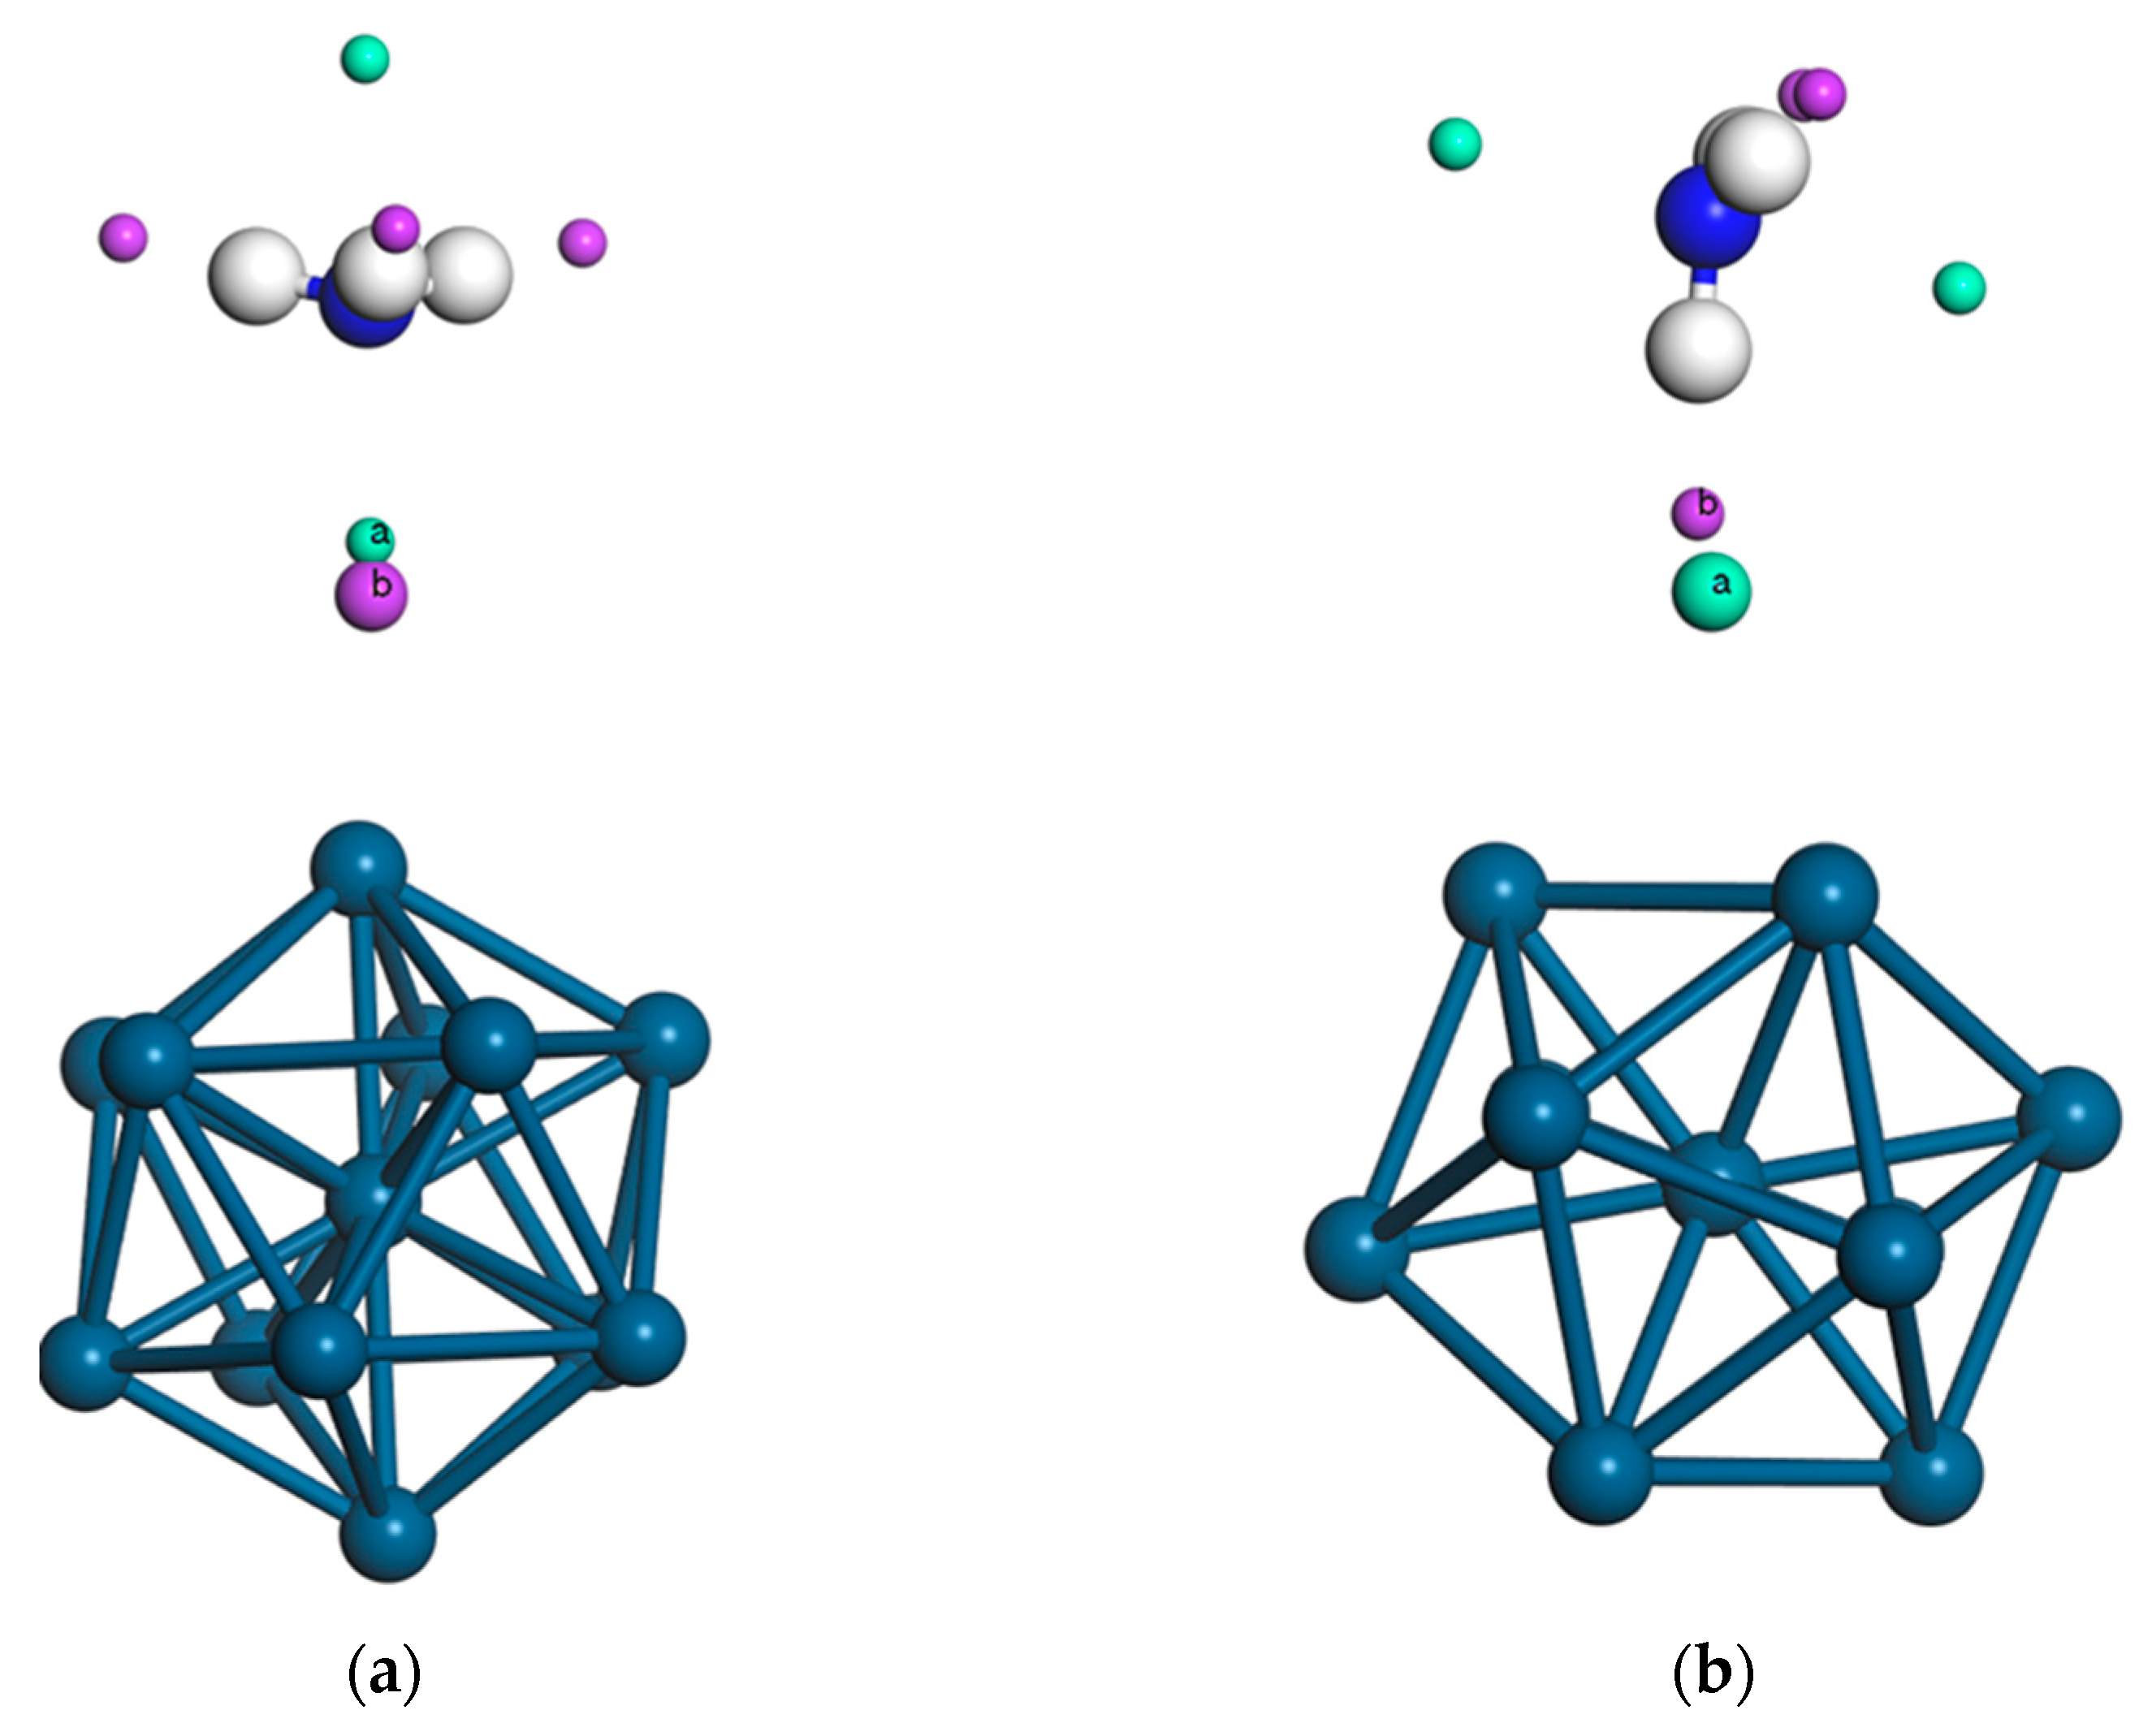
In this study, the extrema of the electrostatic potential on the van der Waals surfaces of the Ir13 cluster and the NH3 molecule were calculated using the Gaussian 16 package. The van der Waals surface was defined by an electron density isosurface of 0.001 a.u. As shown in Figure 3, the green spheres represent the local minima of the electrostatic potential (negative values, denoted as a), whereas the purple spheres represent the local maxima (positive values, denoted as b). Based on the spatial distribution of these extrema, two initial adsorption configurations were constructed, namely NH3 (a) + Ir13 (b) and NH3 (b) + Ir13 (a), as shown in Figure 4.
Figure 3.
Electrostatic potential on the van der Waals surfaces of NH3 and Ir13: (a) shows the electrostatic potential extrema on the NH3 molecular surface; (b) shows the maximum electrostatic potential on the top site of the Ir13 cluster (Max > 0); and (c) shows the minimum electrostatic potential on the hollow site of the Ir13 cluster (Min < 0). The labels “a” and “b” denote the local minima and maxima of the electrostatic potential, respectively. Green spheres represent local minima (negative electrostatic potential), and purple spheres represent local maxima (positive electrostatic potential).
Figure 4.
Initial adsorption configurations of NH3 on the Ir13 cluster: (a) and (b) show adsorption modes 1 and 2, respectively. Colors represent different atoms (Ir: light blue, N: blue, H: white). The labels “a” and “b” marked on the structures denote the electrostatic potential minima and maxima, respectively, consistent with the definition in Figure 3.
The two initial adsorption configurations were then subjected to geometry optimization in order to obtain the lowest-energy structures and determine the most stable adsorption mode. All geometry optimizations were performed using the CP2K package. In the calculations, the Gaussian and plane-wave (GPW) method was adopted. Core electrons were represented by pseudopotentials, and the exchange–correlation interaction was described using the GGA-PBE (Perdew–Burke–Ernzerhof) functional. A plane-wave cutoff energy of 600 Ry was employed. Periodic boundary conditions were applied in the x, y, and z directions, and a simulation cell of 25 Å × 25 Å × 25 Å was used to avoid artificial interactions between periodic images. Only the Γ point was included in the Brillouin-zone sampling, and the DFT-D3 dispersion correction was applied. The convergence criteria for geometry optimization were set to an RMS force of 3 × 10⁻³ and a maximum geometry change (MAX_DR) of 3 × 10⁻⁴.
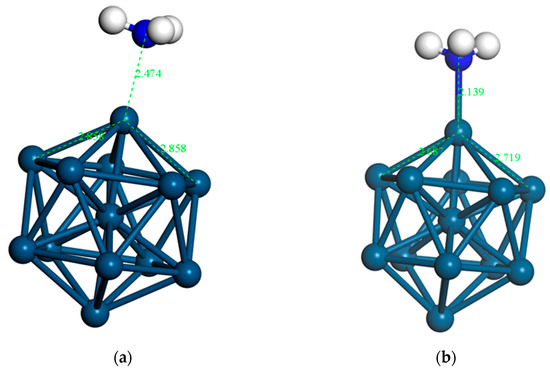
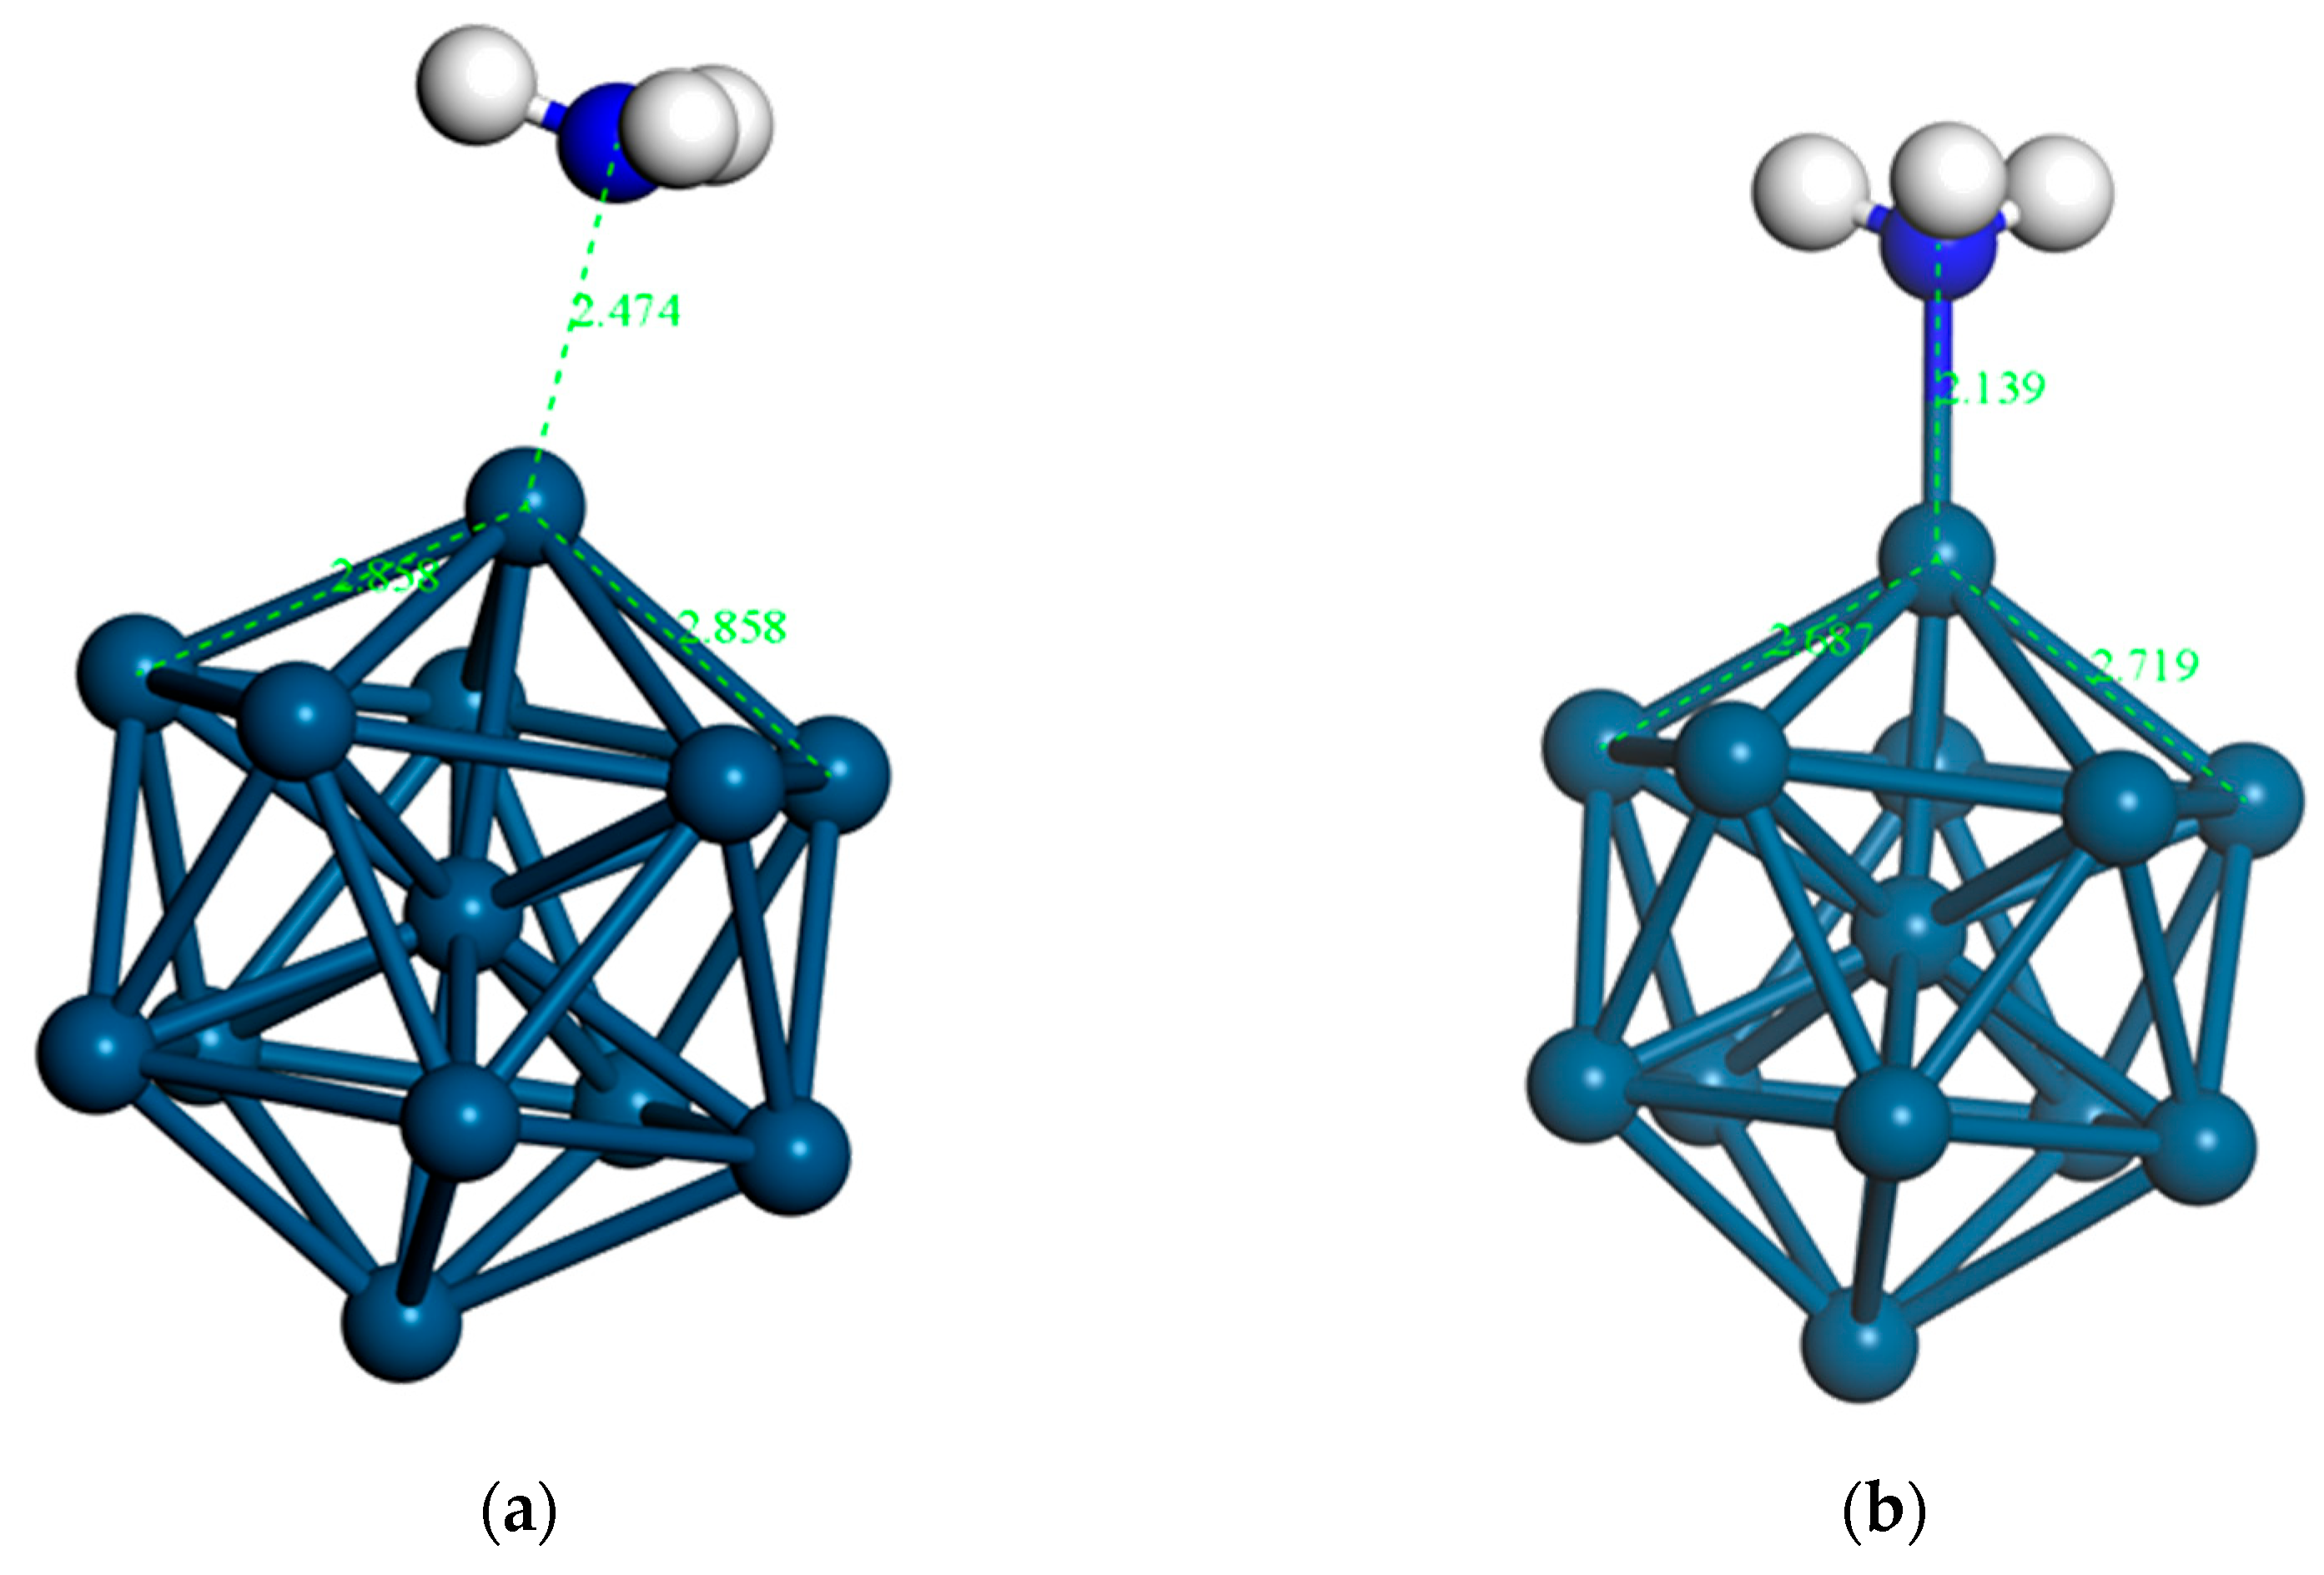
During the optimization process, all atoms were fully relaxed. After structural optimization, the adsorption energy was calculated according to Equation (5), and the results are listed in Table 2. It can be seen that adsorption mode 1 exhibits a more negative adsorption energy than adsorption mode 2, indicating that adsorption mode 1 is thermodynamically more stable. Therefore, the following calculations and discussions are mainly based on adsorption mode 1. To further illustrate the structural evolution during adsorption, the initial and optimized geometries of adsorption mode 1 are compared in Figure 5.
Table 2.
Energy comparison of two adsorption configurations of NH3 on the Ir13 cluster (Energy unit: eV).
Figure 5.
Structural evolution of adsorption mode 1 during geometry optimization: (a) Initial structure before optimization; (b) Optimized structure after relaxation. Colors represent different atoms (Ir: light blue, N: blue, H: white). The values shown indicate bond lengths (in Å).
As shown in Figure 5, after geometry optimization of adsorption mode 1, both the Ir–N bond length between NH3 and the directly bonded Ir atom and the neighboring Ir–Ir bond lengths become slightly shorter than those in the initial structure. This structural contraction indicates that the optimized adsorption configuration is more compact and energetically more stable.
3.3.2. Comparison of NH3 Adsorption Energies on the Ir13 Cluster and the Ir(100) Surface
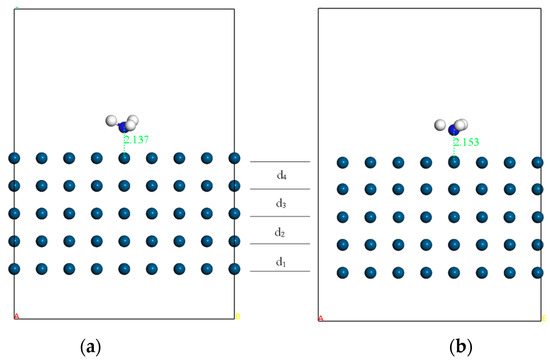
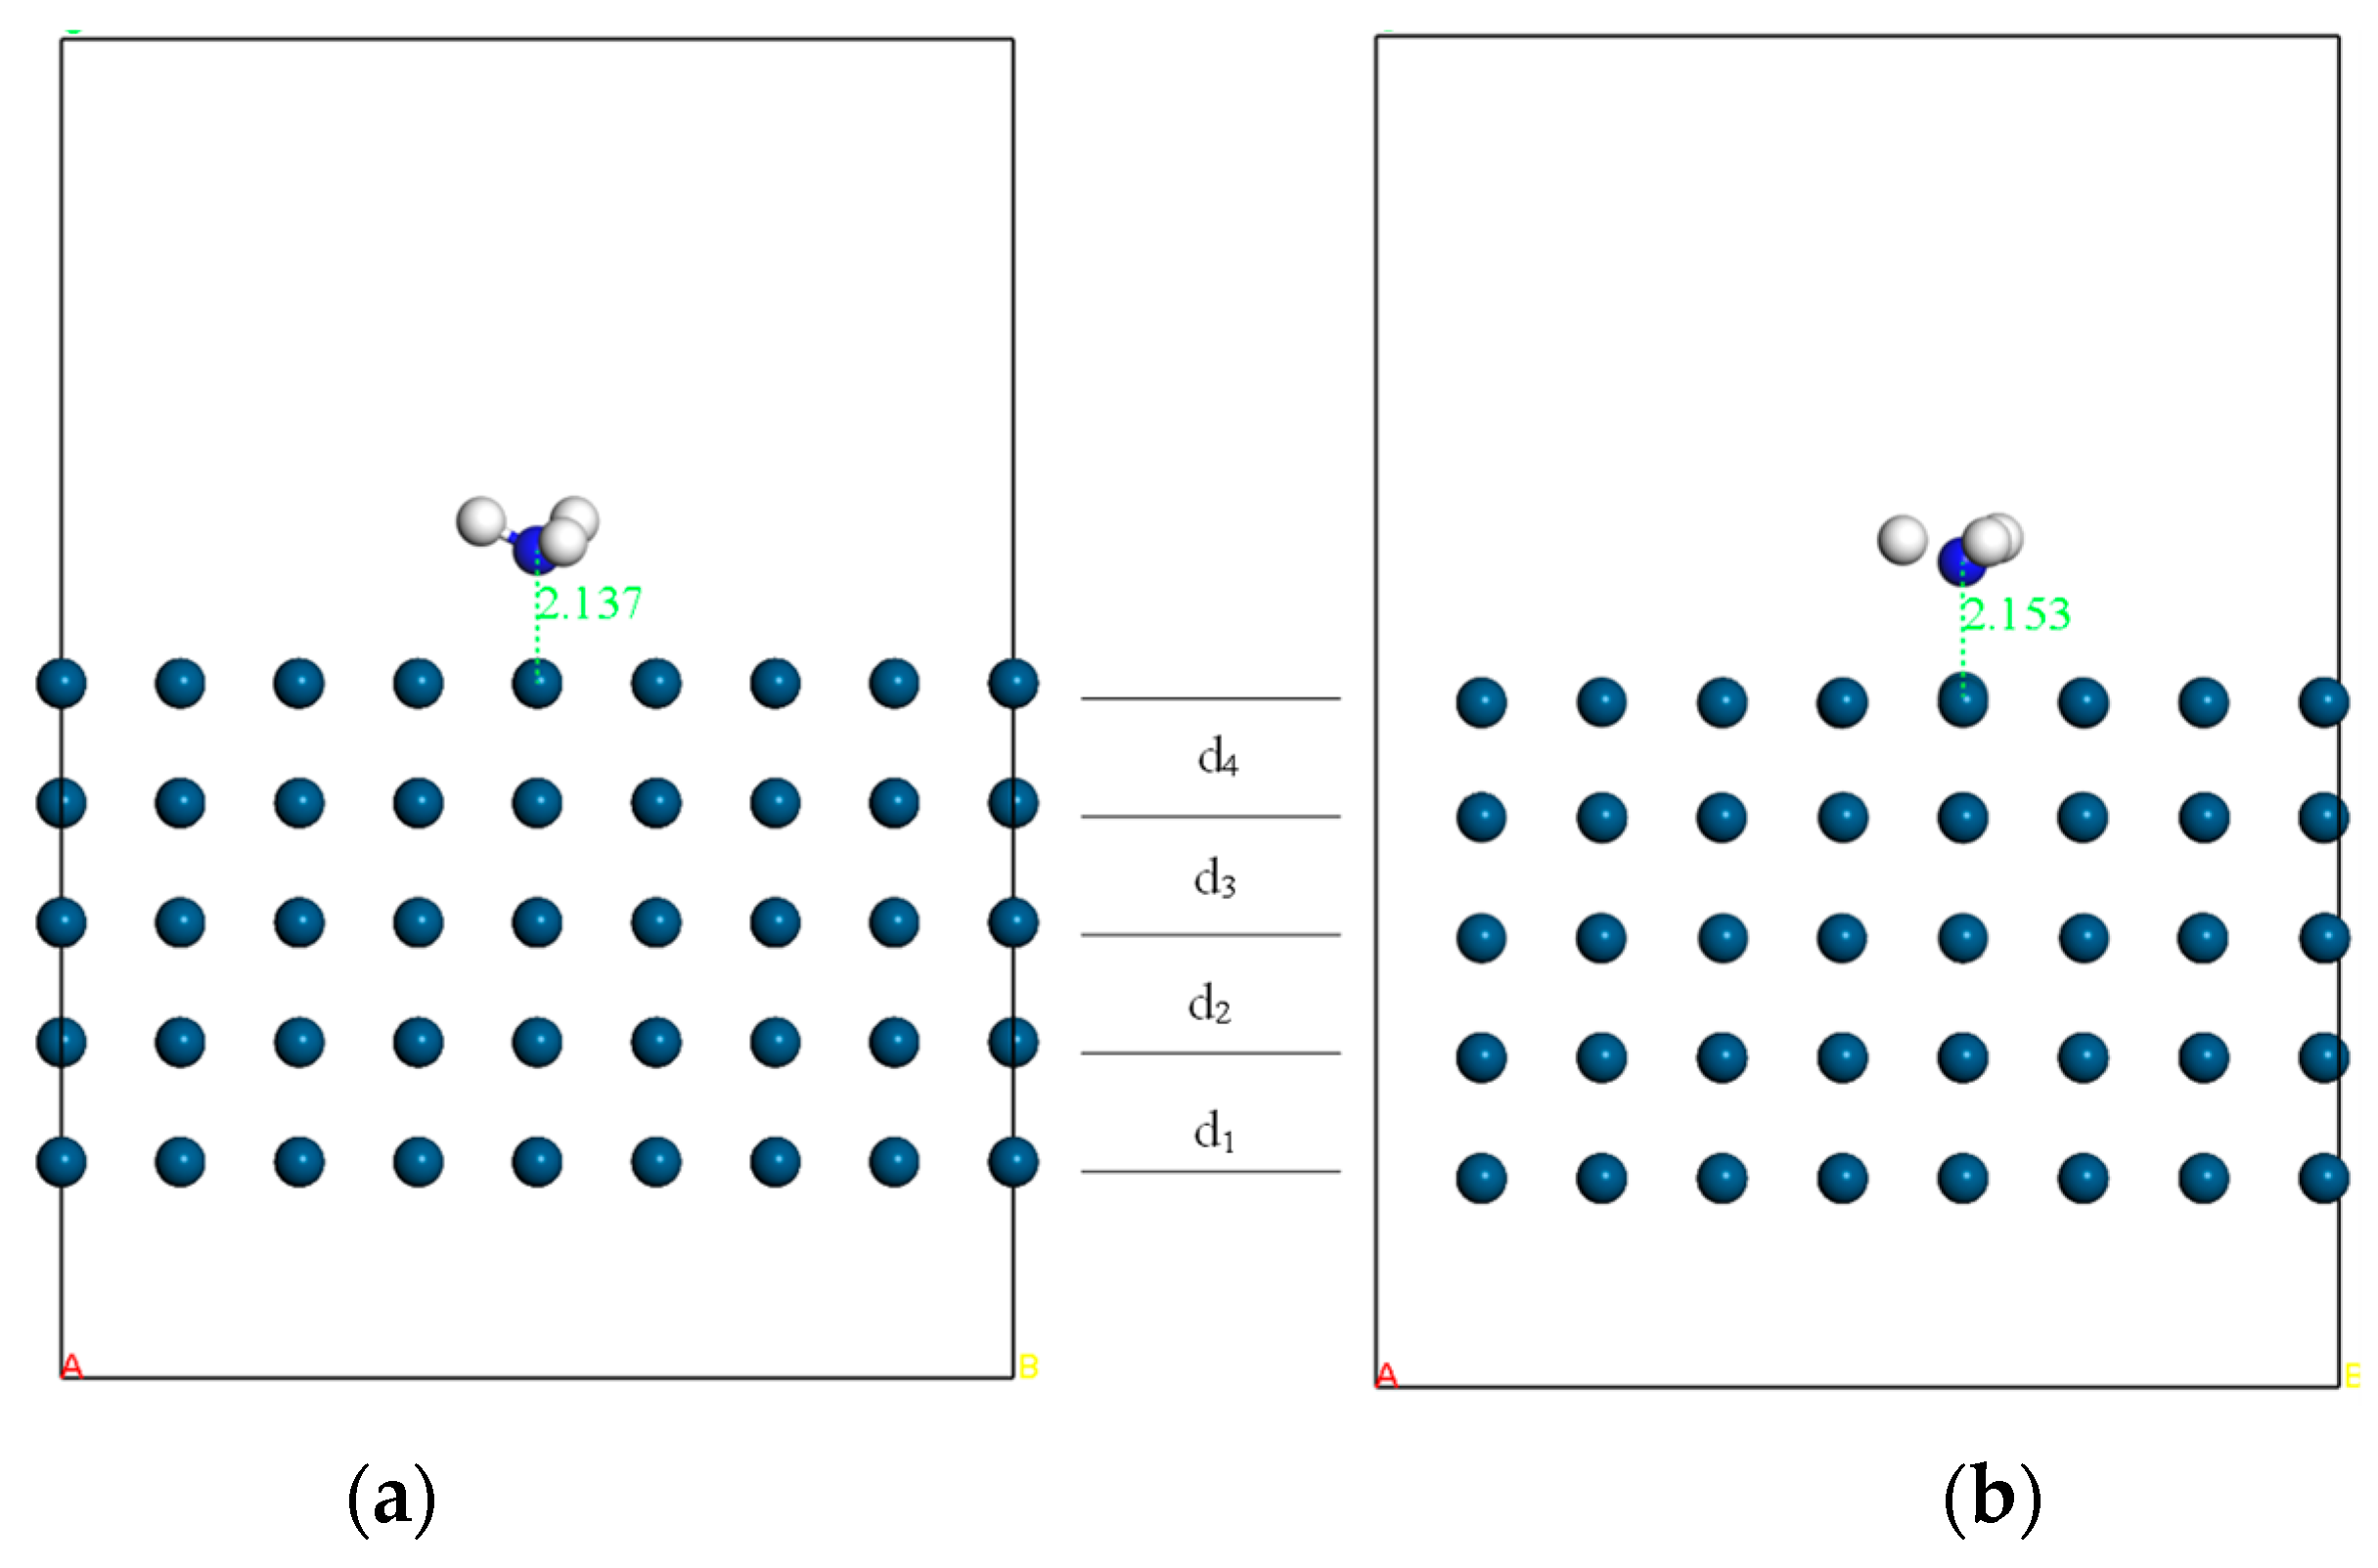
For a catalyst to perform its catalytic function, the reactant molecule must first be adsorbed on the catalyst surface. From this perspective, the adsorption behavior of NH3 on the Ir13 cluster and on the Ir(100) surface was compared. To this end, an Ir slab exposing the (100) facet was constructed by cleaving the Ir crystal, and a vacuum layer of 12 Å was introduced above the top atomic layer to generate the slab model. The slab model consisted of four atomic layers, where the bottom two layers were fixed to mimic the bulk constraint and the upper layers were fully relaxed during geometry optimization. Referring to adsorption mode 1 on the Ir13 cluster, the NH3 molecule was initially placed above a surface Ir atom on the top layer, as shown in Figure 6.
Figure 6.
Adsorption model of NH3 on the Ir(100) slab surface: (a) initial structure before geometry optimization; (b) optimized structure after relaxation. Colors represent different atoms (Ir: light blue, N: blue, H: white). The values shown indicate bond lengths (in Å) between N and Ir atoms.
To simulate the bulk constraint of the substrate, the bottom two atomic layers were fixed, whereas all remaining atoms were fully relaxed in order to obtain the lowest-energy adsorption configuration. Geometry optimization was performed using the CP2K package, and the computational settings were the same as those described above.
The optimized adsorption configuration is shown in Figure 6b. Compared with the initial structure shown in Figure 6a, the interlayer distances changed after structural relaxation, as summarized in Table 3. It can be seen that, except for the spacing between the first and second layers, all other interlayer distances decreased to some extent, with the largest variation occurring between the outermost and subsurface atomic layers.
Table 3.
Changes in interlayer distances (Å) of the Ir(100) slab before and after geometry optimization.
After optimization, the total energies of the Ir-slab-NH3 adsorption system and the clean Ir slab were calculated, and the adsorption energy was then obtained according to Equation (5). For comparison, the adsorption energy of NH3 on the Ir13 cluster is also listed in Table 4.
Table 4.
Comparison of NH3 adsorption energies on the Ir13 cluster and the Ir(100) slab surface (energy unit: eV).
The results show that the Ir13 cluster exhibits a much more negative adsorption energy for NH3 than the Ir(100) slab surface, indicating significantly stronger adsorption on the cluster model. This suggests that the Ir13 cluster has a higher affinity for NH3 adsorption than the Ir(100) surface, which may provide a more favorable prerequisite for subsequent catalytic decomposition.
The adsorption energies obtained from CP2K are expressed in Hartree. For clarity, the corresponding values in electronvolts are −12.50 eV for the Ir13–NH3 system and −1.54 eV for the Ir(100) slab.
3.3.3. Adsorption Analysis of NH3 on the Ir13 Cluster
To further clarify the bonding characteristics of NH3 adsorption on the Ir13 cluster, Bader charge analysis was performed, and the results are summarized in Table 5.
Table 5.
Bader charge analysis results for NH3 adsorption on the Ir13 cluster.
Table 5 presents the valence-electron distribution of the Ir13 cluster and the NH3 molecule before and after adsorption. Before adsorption, the total number of valence electrons in the Ir13 cluster is 117. This is because the PBE pseudopotential was adopted in the present calculations, in which each Ir atom contributes nine valence electrons (5d86s1), giving a total of 13 × 9 = 117 valence electrons for Ir13. For the NH3 molecule, the total number of valence electrons before adsorption is 8, with five contributed by the N atom and one by each H atom.
After adsorption, the number of valence electrons associated with the Ir13 cluster increases to 117.016882, whereas that associated with NH3 decreases to 7.983118. Compared with the isolated state, this indicates a net charge transfer of 0.016882 e from NH3 to the Ir13 cluster. Therefore, although the total charge remains conserved, the charge distribution is redistributed upon adsorption, suggesting the existence of an electronic interaction between NH3 and the Ir13 cluster [25].
To delve into the bonding nature between NH3 and the Ir13 cluster, we analyzed the electron localization function (ELF) for the optimized adsorption configuration [26]. ELF values span a spectrum from 0 to 1. Crucially, a pronounced ELF value between atoms signifies stronger electron localization and a heightened tendency towards covalent bonding. Conversely, a diminished ELF value points towards weaker electron sharing, indicative of interactions leaning towards the ionic or noncovalent realm.
In this work, ELF isosurfaces with values of 0.10, 0.20, and 0.05 were plotted, as shown in Figure 7. It can be seen that when the ELF isovalue increases from 0.10 to 0.20, the electron distribution between the N atom and the bonded Ir atom becomes less pronounced. Only at the lower isovalue of 0.05 does a visible electron distribution appear between the two atoms. This observation indicates that the electron localization between N and Ir is relatively weak, and that significant covalent electron sharing is absent.
Figure 7.
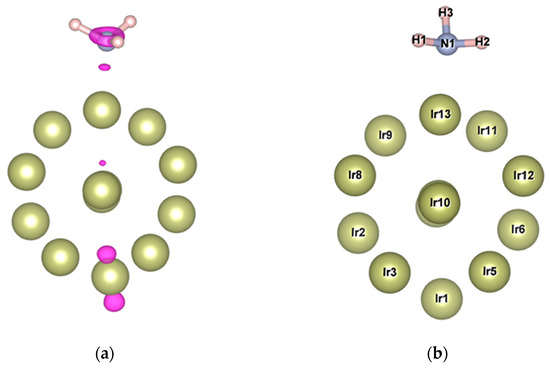
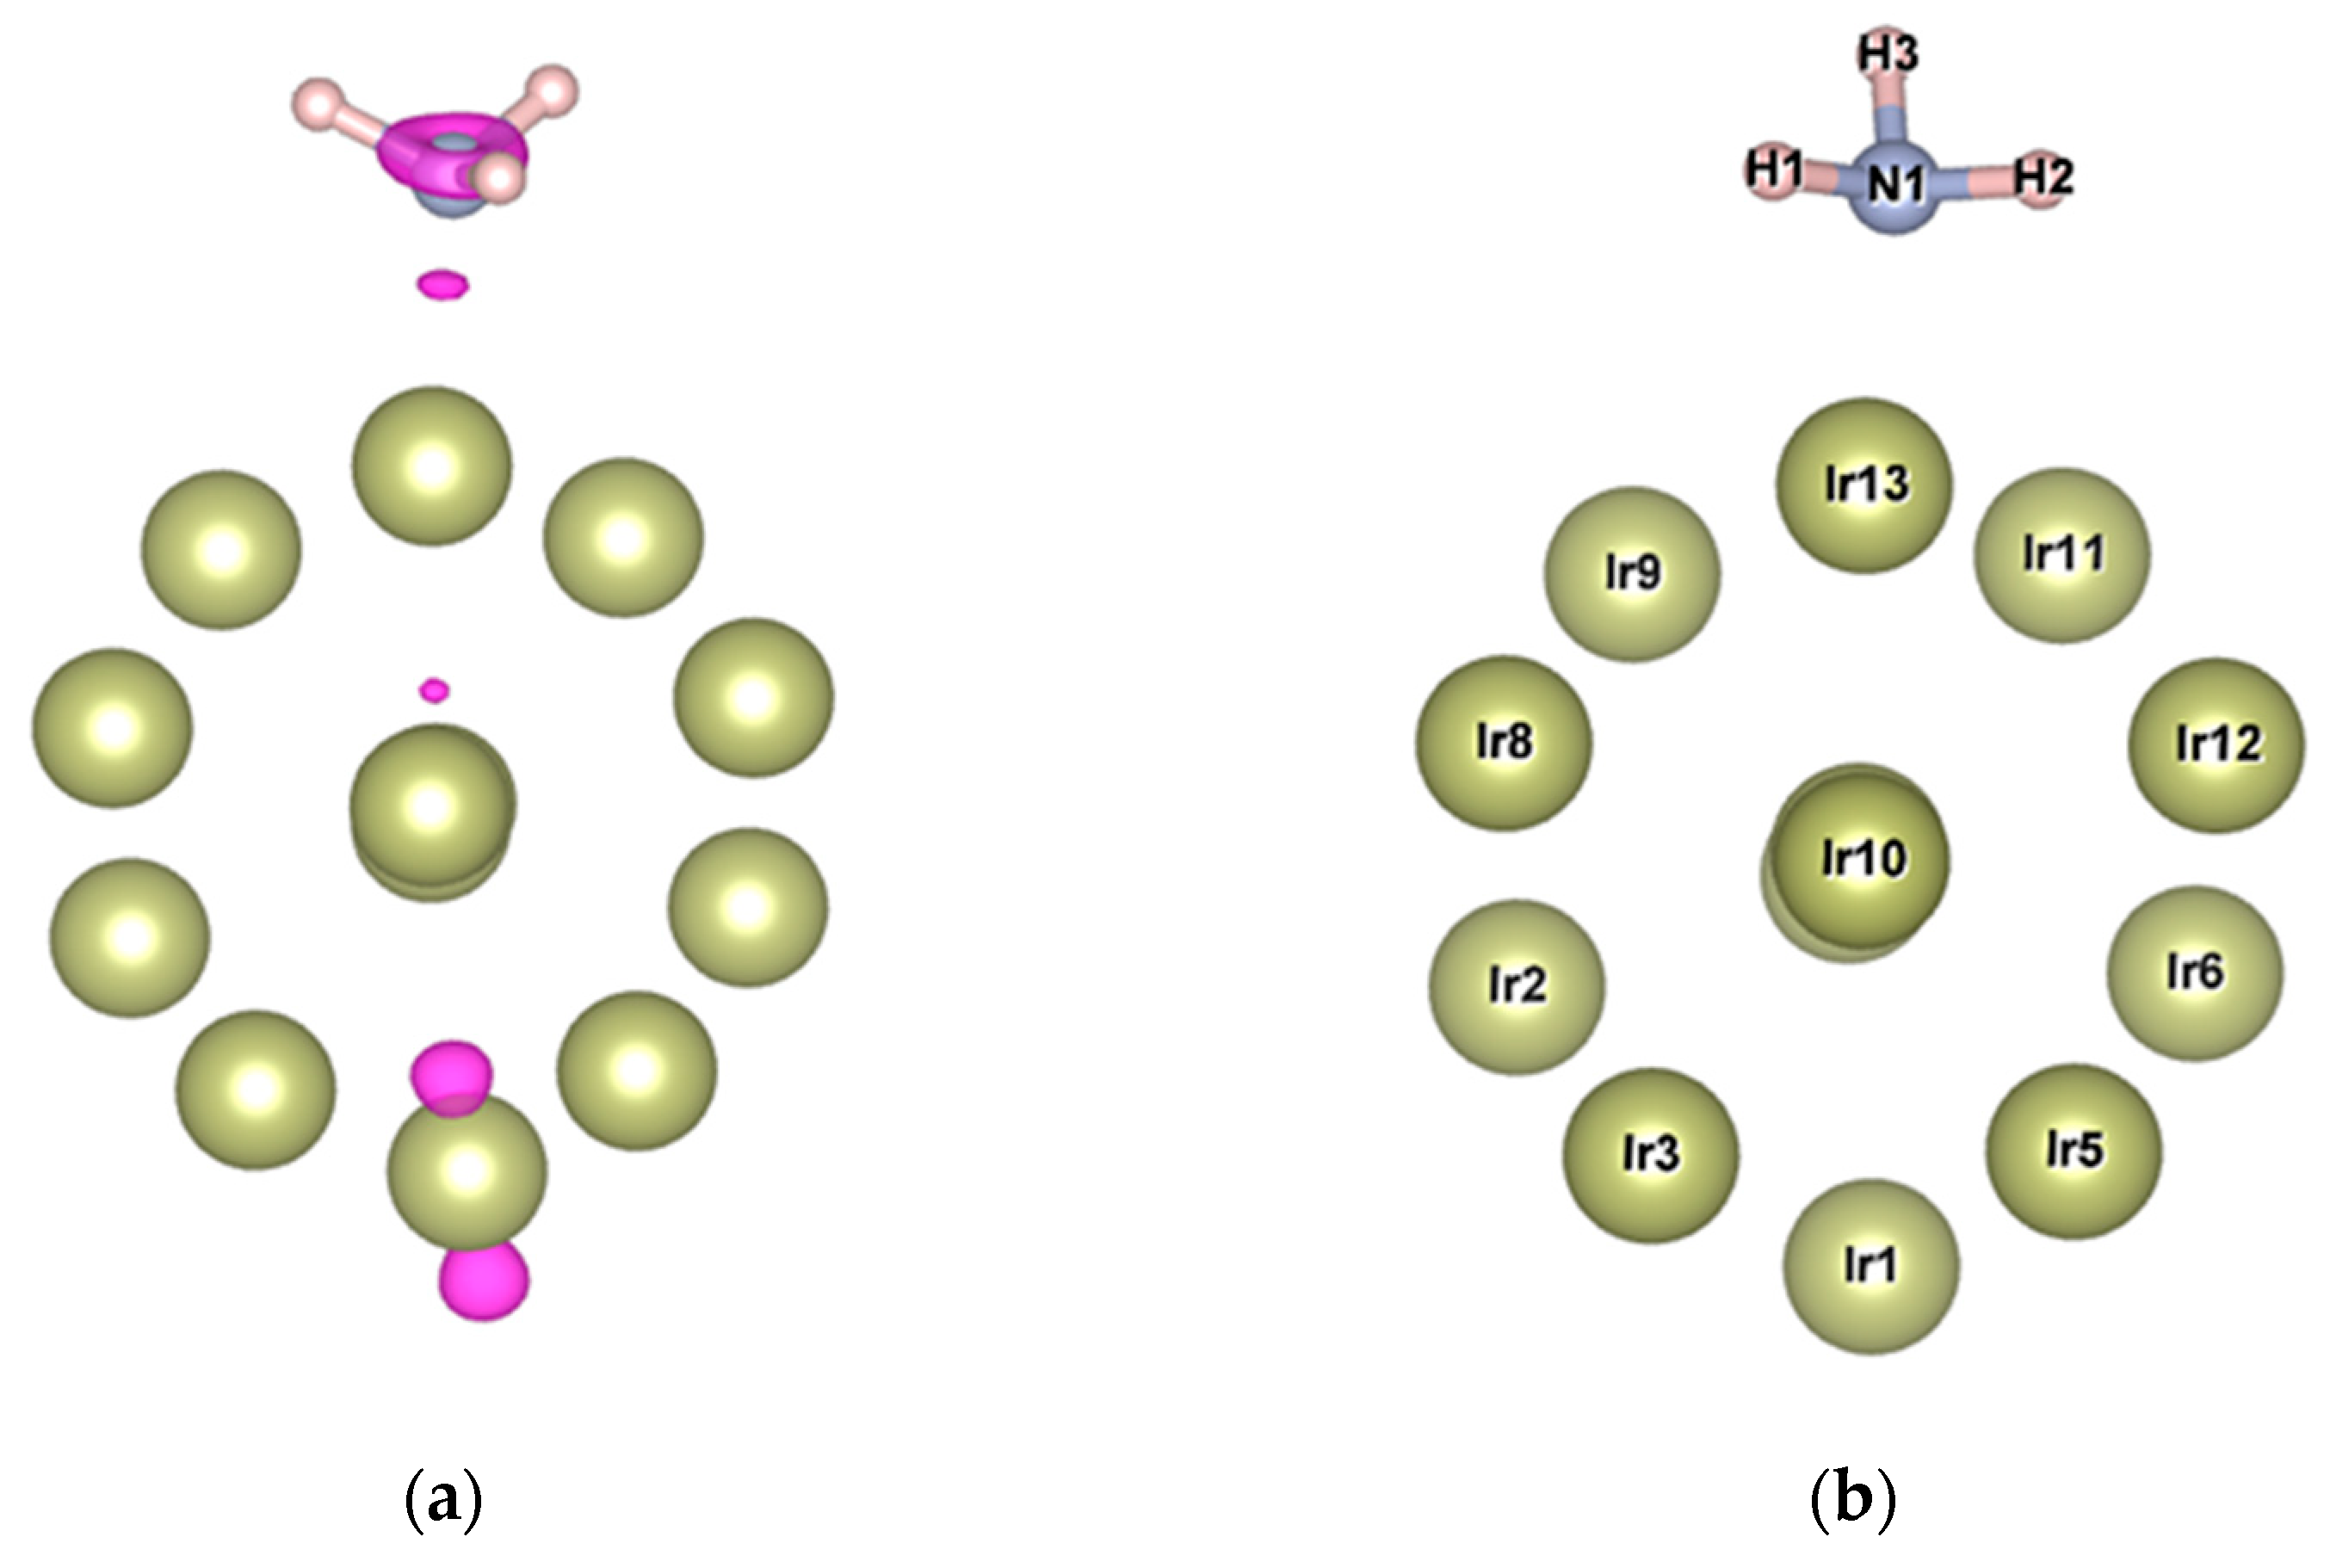
Differential charge density distribution: (a) isosurface of charge density difference (0.01 e/Å3); (b) atomic labeling. In (a), the pink regions represent charge accumulation. The atomic species shown in both (a) and (b) are Ir, N, and H, which are colored in yellow, gray, and flesh tones, respectively.
To further clarify the bonding nature between the cluster and NH3, the charge density difference was analyzed, as shown in Figure 7a. As illustrated in Figure 7b, charge accumulation is observed between the N atom and the bonded Ir atom (Ir13), suggesting the presence of covalent interaction. To further verify this, Mayer bond order analysis was performed. The calculated Mayer bond order between Ir13 and the N atom is 0.47325104, which is close to the typical value for a covalent bond (0.5). This result confirms that the interaction between NH3 and the Ir cluster is predominantly covalent in nature.
Combined with the small charge-transfer value obtained from the Bader analysis, these results suggest that NH3 adsorption on the Ir13 cluster is mainly governed by covalent interactions, with limited ionic character.
4. Conclusions
(1) The lowest-energy geometries of Irn clusters (n = 9–30) were systematically predicted using CALYPSO, demonstrating that global structure searching provides a practical route for determining stable cluster configurations when experimental characterization is challenging.
(2) Binding-energy analysis based on the Lennard–Jones potential indicates a clear size-dependent stability evolution of Irn clusters, consistent with the structural transition from more open motifs to compact three-dimensional frameworks.
(3) NH3 adsorption calculations indicate that the adsorption energy increases from −1.54 eV on the bulk slab Ir surface to −12.39 eV on Ir clusters, mainly due to the high density of low-coordinated, unsaturated surface Ir atoms that serve as active adsorption sites.
(4) The enhanced NH3 adsorption of Ir clusters suggests their potential as active components in NH3 sensing and catalytic materials; in underground coal-mine environments, such adsorption advantages may support improved sensitivity and robustness for NH3 detection under complex operating conditions.
Author Contributions
Conceptualization, X.G., Y.L. (Yongli Liu) and Y.L. (Yingwei Liu); methodology, X.G. and Y.L. (Yongli Liu); software, B.S. and Y.L. (Yingwei Liu); validation, X.G., B.S. and R.D.; formal analysis, X.G.; investigation, X.G.; resources, Y.L. (Yongli Liu) and B.S.; data curation, X.G. and J.Y.; writing—original draft preparation, X.G.; writing—review and editing, X.G., Y.L. (Yongli Liu), B.S., R.D. and Y.L. (Yue Lu); visualization, X.G.; supervision, Y.L. (Yongli Liu) and R.D.; project administration, B.S.; funding acquisition, Y.L. (Yongli Liu). All authors have read and agreed to the published version of the manuscript.
Funding
This research was funded by the Fundamental Research Funds for the Provincial Universities of Heilongjiang Province (Grant No. 2024-KYYWF-1106), and the Heilongjiang Province “Unveiling the List and Appointing the Leader” Science and Technology Research Project (Grant No. 2021ZXJ02A03).
Data Availability Statement
The data presented in this study are available on request from the corresponding author.
Acknowledgments
The authors would like to thank the reviewers and editors for their valuable comments and suggestions, which have greatly improved the quality of this manuscript. The authors used an AI-assisted language tool to improve the clarity and grammar of the English writing. The AI tool was used only for language polishing and did not contribute to the scientific content, analysis, or conclusions of the manuscript. All authors reviewed and approved the final manuscript and take full responsibility for its content.
Conflicts of Interest
The authors declare no conflicts of interest.
References
- Lucentini, I.; Garcia, X.; Vendrell, X.; Llorca, J. Review of the Decomposition of Ammonia to Generate Hydrogen. Ind. Eng. Chem. Res. 2021, 60, 18560–18611. [Google Scholar] [CrossRef] [Scilit]
- Solanki, B.S.; Lim, H.; Yoon, S.J.; Ham, H.C.; Park, H.S.; Lee, H.E.; Lee, S.H. Recent Advancement of Non-Noble Metal Catalysts for Hydrogen Production by NH3 Decomposition. Renew. Sustain. Energy Rev. 2025, 207, 114974. [Google Scholar] [CrossRef] [Scilit]
- Aizaz, U.; Ansari, M.A.; Malaibari, Z.O.; Hussain, I. Frontiers in Catalytic Ammonia Decomposition: A Cutting-Edge Tutorial and Review on Catalyst Innovation Trends and Techno-Economic Insights. Chem. Eng. J. Green Sustain. 2026, 1, 100001. [Google Scholar] [CrossRef] [Scilit]
- Jabłońska, M. Progress on Noble Metal-Based Catalysts Dedicated to the Selective Catalytic Ammonia Oxidation into Nitrogen and Water Vapor (NH3-SCO). Molecules 2021, 26, 6461. [Google Scholar] [CrossRef] [Scilit] [PubMed]
- Schüth, F.; Palkovits, R.; Schlögl, R.; Su, D.S. Ammonia as a Possible Element in an Energy Infrastructure: Catalysts for Ammonia Decomposition. Energy Environ. Sci. 2012, 5, 6278–6289. [Google Scholar] [CrossRef] [Scilit]
- Xiao, X. Theoretical Study on the Reaction Mechanism of NH3 Catalytic Decomposition and Oxidation on Ir Surfaces. Master’s Thesis, Henan Normal University, Xinxiang, China, 2011. [Google Scholar]
- Svane, A.; Gunnarsson, O. Transition-Metal Oxides in the Self-Interaction–Corrected Density-Functional Formalism. Phys. Rev. Lett. 1990, 65, 1148–1151. [Google Scholar] [CrossRef] [Scilit]
- Liu, W. Theoretical Study on the Mechanism of NH3 Synthesis on High-Index Ir Surfaces. Master’s Thesis, Shanxi Normal University, Linfen, China, 2023. [Google Scholar]
- He, C.-Z.; Wang, H.; Huai, L.-Y.; Liu, J.-Y. Mechanism of Ammonia Decomposition and Oxidation on Ir(110): A First-Principles Study. J. Chem. Phys. 2013, 138, 144703. [Google Scholar] [CrossRef] [Scilit]
- He, C.; Wang, H.; Huai, L.; Liu, J. Mechanism of Ammonia Decomposition and Oxidation on Ir(100): A First-Principles Study. J. Phys. Chem. C 2012, 116, 24035–24045. [Google Scholar] [CrossRef] [Scilit]
- Yusuf, A.; Budiantono, R.; Juangsa, F.B.; Aziz, M.; Budiyanto, M.A.; Saputro, A.G.; Mahyuddin, M.H. Insights into the Role of Metal Dopant on Ammonia Decomposition over Graphene-Supported Ni6, Ni5Pt, and Ni5Rh Clusters. Int. J. Hydrogen Energy 2025, 130, 168–175. [Google Scholar] [CrossRef] [Scilit]
- Lu, X.; Zhang, J.; Chen, W.-K.; Roldan, A. Kinetic and Mechanistic Analysis of NH3 Decomposition on Ru(0001), Ru(111) and Ir(111) Surfaces. Nanoscale Adv. 2021, 3, 1624–1632. [Google Scholar] [CrossRef] [Scilit]
- Estejab, A.; Botte, G.G. DFT Calculations of Ammonia Oxidation Reactions on Bimetallic Clusters of Platinum and Iridium. Comput. Theor. Chem. 2016, 1091, 31–40. [Google Scholar] [CrossRef] [Scilit]
- Jacobsen, C.J.H.; Dahl, S.; Clausen, B.S.; Bahn, S.; Logadottir, A.; Nørskov, J.K. Catalyst Design by Interpolation in the Periodic Table: Bimetallic Ammonia Synthesis Catalysts. J. Am. Chem. Soc. 2001, 123, 8404–8405. [Google Scholar] [CrossRef] [Scilit]
- Liu, L.; Corma, A. Metal Catalysts for Heterogeneous Catalysis: From Single Atoms to Nanoclusters and Nanoparticles. Chem. Rev. 2018, 118, 4981–5079. [Google Scholar] [CrossRef] [Scilit]
- Wang, H.; Zhang, Y.; Zhang, L.; Wang, H. Crystal Structure Prediction of Binary Alloys via Deep Potential. Front. Chem. 2020, 8, 589795. [Google Scholar] [CrossRef] [Scilit]
- Wang, Y.; Lv, J.; Zhu, L.; Ma, Y. Crystal Structure Prediction via Particle-Swarm Optimization. Phys. Rev. B 2010, 82, 094116. [Google Scholar] [CrossRef] [Scilit]
- Wang, Y.; Lv, J.; Zhu, L.; Ma, Y. CALYPSO: A Method for Crystal Structure Prediction. Comput. Phys. Commun. 2012, 183, 2063–2070. [Google Scholar] [CrossRef] [Scilit]
- Huang, W.; Cheng, C.; Feng, E. Adsorption and Decomposition of NH3 on Ir(111): A Density Functional Theory Study. Surf. Sci. 2013, 616, 29–35. [Google Scholar] [CrossRef] [Scilit]
- Huang, W.; Lai, W.; Xie, D. First-Principles Study of Decomposition of NH3 on Ir(100). Surf. Sci. 2008, 602, 1288–1294. [Google Scholar] [CrossRef] [Scilit]
- Jones, J.E. On the Determination of Molecular Fields.—II. From the Equation of State of a Gas. Proc. R. Soc. Lond. Ser. A Contain. Pap. A Math. Phys. Character 1924, 106, 463–477. [Google Scholar] [CrossRef] [Scilit]
- Rappe, A.K.; Casewit, C.J.; Colwell, K.S.; Goddard, W.A.; Skiff, W.M. UFF, a Full Periodic Table Force Field for Molecular Mechanics and Molecular Dynamics Simulations. J. Am. Chem. Soc. 1992, 114, 10024–10035. [Google Scholar] [CrossRef] [Scilit]
- Piotrowski, M.J.; Piquini, P.; Zeng, Z.; Da Silva, J.L.F. Adsorption of NO on the Rh13, Pd13, Ir13, and Pt13 Clusters: A Density Functional Theory Investigation. J. Phys. Chem. C 2012, 116, 20540–20549. [Google Scholar] [CrossRef] [Scilit]
- Lu, T.; Chen, F. Revealing the Nature of Intermolecular Interaction and Configurational Preference of the Nonpolar Molecular Dimers (H2)2, (N2)2, and (H2)(N2). J. Mol. Model. 2013, 19, 5387–5395. [Google Scholar] [CrossRef] [Scilit] [PubMed]
- Tang, W.; Sanville, E.; Henkelman, G. A Grid-Based Bader Analysis Algorithm without Lattice Bias. J. Phys. Condens. Matter 2009, 21, 084204. [Google Scholar] [CrossRef] [Scilit] [PubMed]
- Silvi, B.; Savin, A. Classification of Chemical Bonds Based on Topological Analysis of Electron Localization Functions. Nature 1994, 371, 683–686. [Google Scholar] [CrossRef] [Scilit]

Disclaimer/Publisher’s Note: The statements, opinions and data contained in all publications are solely those of the individual author(s) and contributor(s) and not of MDPI and/or the editor(s). MDPI and/or the editor(s) disclaim responsibility for any injury to people or property resulting from any ideas, methods, instructions or products referred to in the content. |
© 2026 by the authors. Licensee MDPI, Basel, Switzerland. This article is an open access article distributed under the terms and conditions of the Creative Commons Attribution (CC BY) license.