


Abstract
The formability of AA7021-T4 sheets under changing strain paths was investigated via a novel crystal plasticity model and associated experimentation. The motivation was to advance simulation tools for process design of limited-ductility 7xxx alloys, with important applications in the automotive industry. Pre-strains were applied in biaxial and plane-strain tension using Marciniak tooling, followed by uniaxial tensile testing to failure. Strain measurements were obtained by digital image correlation, while dislocation structures were characterized using high-resolution EBSD. A strain-gradient elasto-plastic self-consistent (SG-EPSC) model incorporating dislocation density-based hardening and backstress from geometrically necessary dislocations (GNDs) was employed to predict the stress–strain response and dislocation evolution. Results showed that pre-strains normalized by forming limit diagram (FLD) criteria produced comparable residual uniaxial tensile ductility, regardless of whether biaxial or plane-strain tension was applied, despite differences in absolute pre-strain levels. Both experiments and simulations revealed that GND density correlated with remaining ductility better than simple strain magnitude values. These findings indicate that AA7021-T4 retains greater formability under multiaxial strain path changes than expected from FLD-based considerations. The combined experimental–modeling approach demonstrates the value of incorporating microstructure-based variables, such as GNDs, into forming assessments of high-strength aluminum alloys, with implications for their potential use in automotive lightweighting development.
1. Introduction
Vehicle lightweighting campaigns have promoted greater use of aluminum alloys in autobody structures, where 5xxx and 6xxx series alloys have been the main choices, owing to reasonably good formability at room temperature. The 7xxx series alloys possess even higher strength/weight ratios, but formability can be a challenge at room temperature. Elevating temperatures slightly does little to improve the situation [1], though high temperature forming, while inconvenient and more costly from a production viewpoint, can result in significant formability increases [2]. In order to optimize the utility of alloys like AA7021, tools are required that can accurately predict hardening behavior throughout complex strain paths. The aim of this study is to adapt and apply a recently developed strain-gradient elastoplastic self-consistent model (SG-EPSC), with dislocation-based hardening and backstress, to multi-path deformation of AA7021 as a step towards accurate prediction of ductility exhaustion, and improved process design.
Among the 7xxx series alloys, AA7021-T4 has emerged as a candidate for automotive sheet applications due to its favorable balance of strength, corrosion resistance, and relatively improved formability in the T4 condition compared to peak-aged tempers. While AA7075 and similar high-strength alloys exhibit limited room-temperature formability, AA7021 in the naturally aged (T4) state contains predominantly shearable precipitates, which can promote enhanced strain hardening and ductility. However, the formability of AA7021-T4 under multi-path forming operations remains insufficiently understood, particularly from a microstructure-informed modeling perspective. Most prior investigations have focused on monotonic loading paths or peak-aged conditions. This gap motivates the present study.
Hardening behavior during deformation of precipitation hardened materials involved a complex combination of mechanisms. Forming limit diagrams capture the limits of uniform deformation along a given strain path, but cannot reliably be applied to segments of a multi-path forming operation due to the potential for changes in the mechanism being activated, and the non-additive nature of hardening components during these changes. For example, dislocations display several potential interactions with precipitates, each of which may or may not be reversible. Orowan posited that shearing of small precipitates during forward deformation leads to less resistance if the deformation is reversed, thus contributing to the Bauschinger effect [3]—a classic multi-strain path phenomenon. As a result, FLD-based assessments may be overly conservative when applied to multi-stage forming operations, particularly in precipitation-hardened alloys where dislocation–precipitate interactions and geometrically necessary dislocations (GNDs) evolve differently under varying strain paths. A microstructure-sensitive modeling framework is therefore required.
The strength of 7xxx alloys is primarily derived from precipitation hardening, where zinc, magnesium, and sometimes copper form strengthening precipitates. While these precipitates confer high strength, they also result in limited ductility at room temperature. Prior work on the anisotropy and ductility of AA 7021 in various tempers revealed that in the T4 condition, precipitates were fewer in number and were shearable, thus demonstrating greater ductility than the T6 condition, in which most precipitates were non-shearable [4]. This suggests a strategy of forming 7xxx series alloys in the T4 condition, similar to 6xxx series alloys. Some post-forming strengthening can occur via artificial aging during the paint bake process, with duration of approximately 25 min at 180 °C, though there is some question of whether formability is sufficient for a 7xxx series alloy, even in the T4 condition [5].
Anisotropy was greater for T4 compared to T6, as the crystallographic texture was the primary factor to explain in-plane variation in yield strength for T4, whereas the transition from shearable to non-shearable precipitates reduced the effect of texture on yield strength variation for T6. In addition to the T4 condition, the W-temper has been studied for possible room temperature forming. This temper involves solution heat treatment followed by rapid quenching, which temporarily maintains the material in a supersaturated and ductile state. Components must be formed immediately after quenching, to avoid natural aging. Artificial aging is then required, post-forming, in order to achieve desired final properties [6].
Beyond the friction caused by their direct interactions with precipitates, dislocations have complex interactions amongst themselves. Dislocations can be categorized by their local distribution as either statistically stored (SSDs) or geometrically necessary dislocations (GNDs). The dislocation hardening law in the proposed model accounts for local interactions between populations of dislocations of both types, while the strain-gradient and associated backstress components of the model capture long-range internal stresses associated with GNDs. Both interaction types can strongly influence behavior during strain path changes.
A recent study on pre-damaged microstructures in TC11 titanium alloy has demonstrated that controlled dislocation structures can enhance strength–ductility synergy by modifying subsequent deformation mechanisms [7]. These observations further support the objective of the current study of how strain-path-induced dislocation structures influence subsequent ductility in precipitation-hardened aluminum alloys.
In this study, the SG-EPSC model is applied to the formability of AA7021-T4 sheet material of 2.5 mm thickness, incorporating strain path changes from biaxial or plane-strain tension to uniaxial tension. Experiments and crystal plasticity modeling were performed, supported by high-resolution (HR) EBSD for measurement of geometrically necessary dislocation densities of base and pre-strained materials. The modeling work constitutes the first application of the recently developed mean field SG-EPSC model [8]. Such mean field models including SG-VPSC [9] have been recently developed with certain advantages to complement full field SG models [10,11]. The advantages pertain to performing macro-scale simulations to predict GNDs and underlying strain gradients. The experimental and modeling work allowed for quantifying material ductility under these forming conditions, in order to evaluate the suitability of this 7xxx series alloy for potential room-temperature fabrication of components for autobody structures.
2. Materials and Methods
Pre-strains were applied to AA7021-T4 sheets with a thickness of 2.5 mm and a nominal composition shown in Table 1 (material provided by Commonwealth Aluminum, Madison Heights, MI, USA).
Table 1.
AA 7021-T4 composition (wt.%).
The AA7021-T4 material condition involves a solution heat treatment followed by quenching and natural aging. In this temper, strengthening is primarily associated with solid solution strengthening and the presence of fine, shearable Guinier–Preston (GP) zones and η′ precipitates. In contrast to the peak-aged (T6) condition, where non-shearable η precipitates dominate and promote Orowan looping, the T4 condition favors precipitate shearing, resulting in lower initial strength, enhanced ductility and greater strain hardening capacity [4].
EBSD characterization provided an average grain size of 13.5 µm and standard deviation of 13.2 µm. The step size used for HR-EBSD measurements was 70 nm, which is small enough, compared to the average grain size, to resolve intragranular orientation gradients required for reliable GND estimation.
No transmission electron microscopy (TEM) characterization was performed in the present study; however, the precipitation state of AA7021-T4 has been documented in the literature, showing a distribution of fine shearable precipitates consistent with the observed mechanical behavior [4,12].
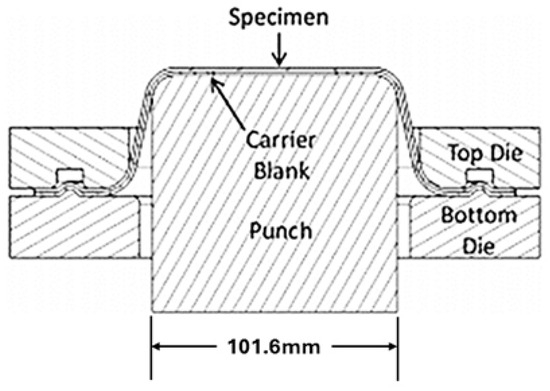
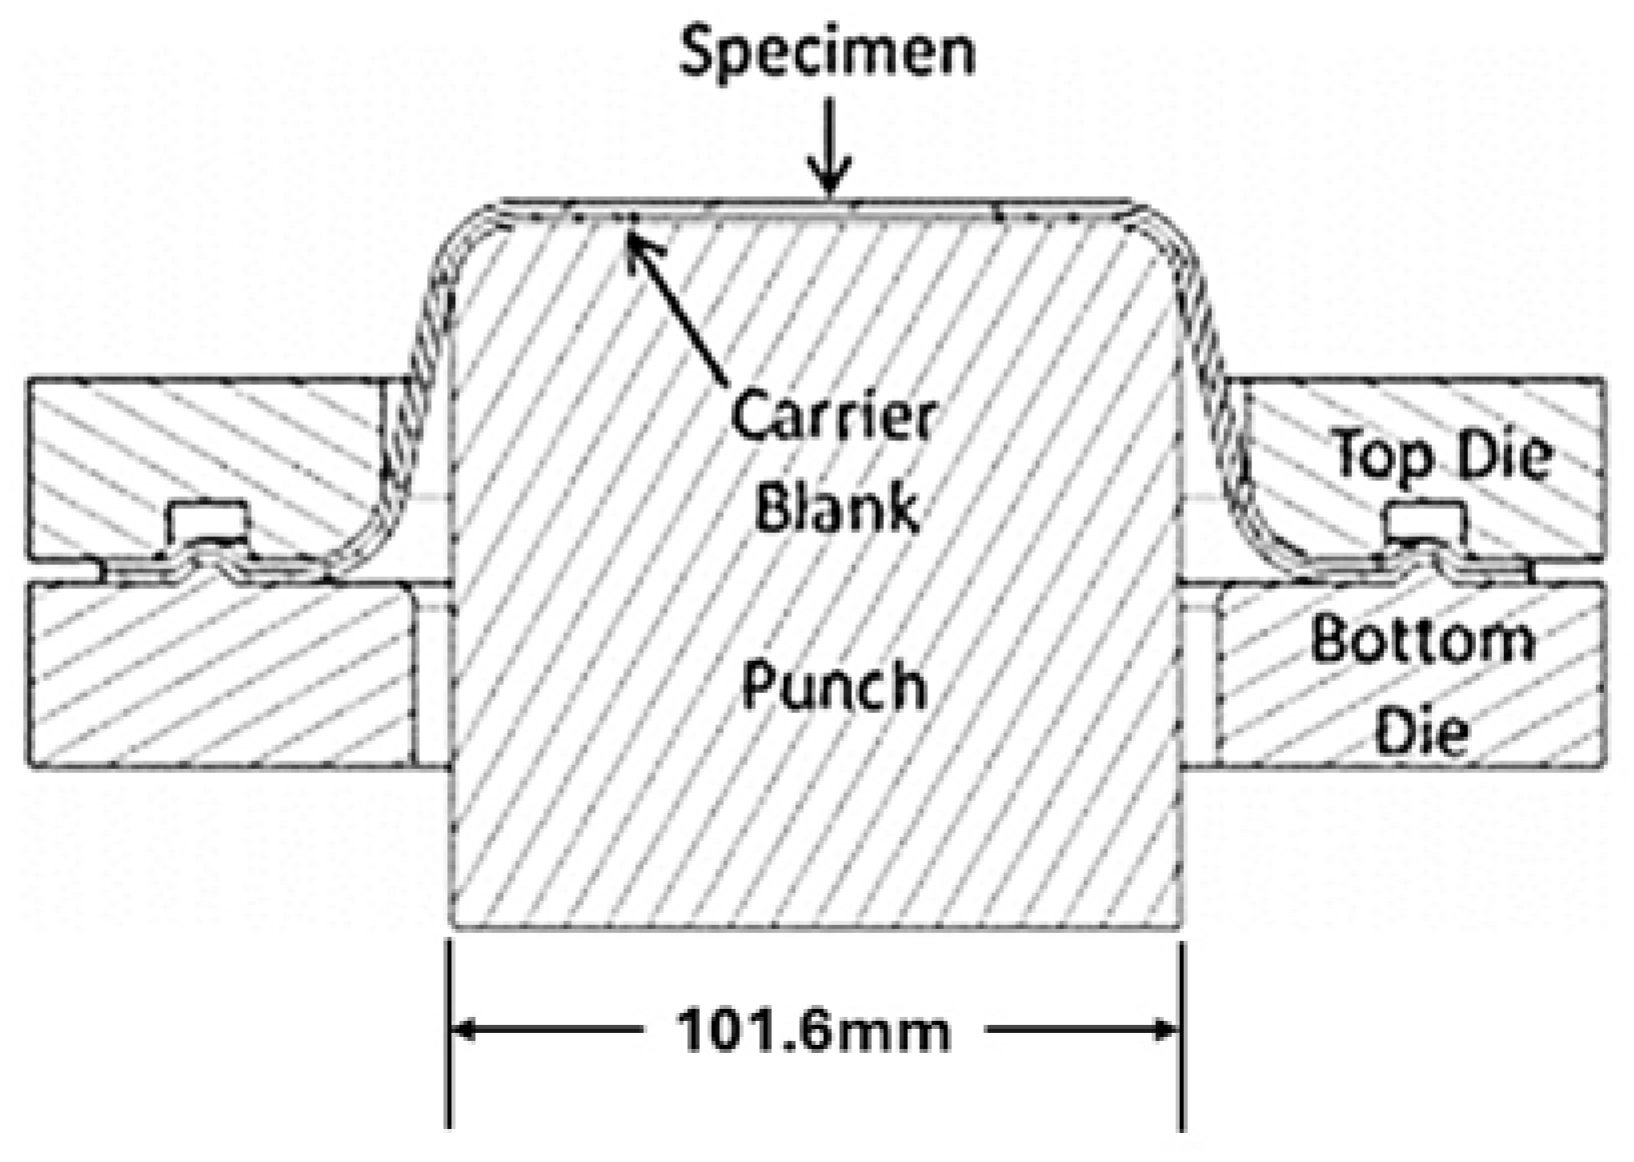
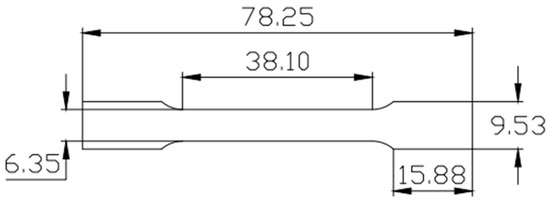
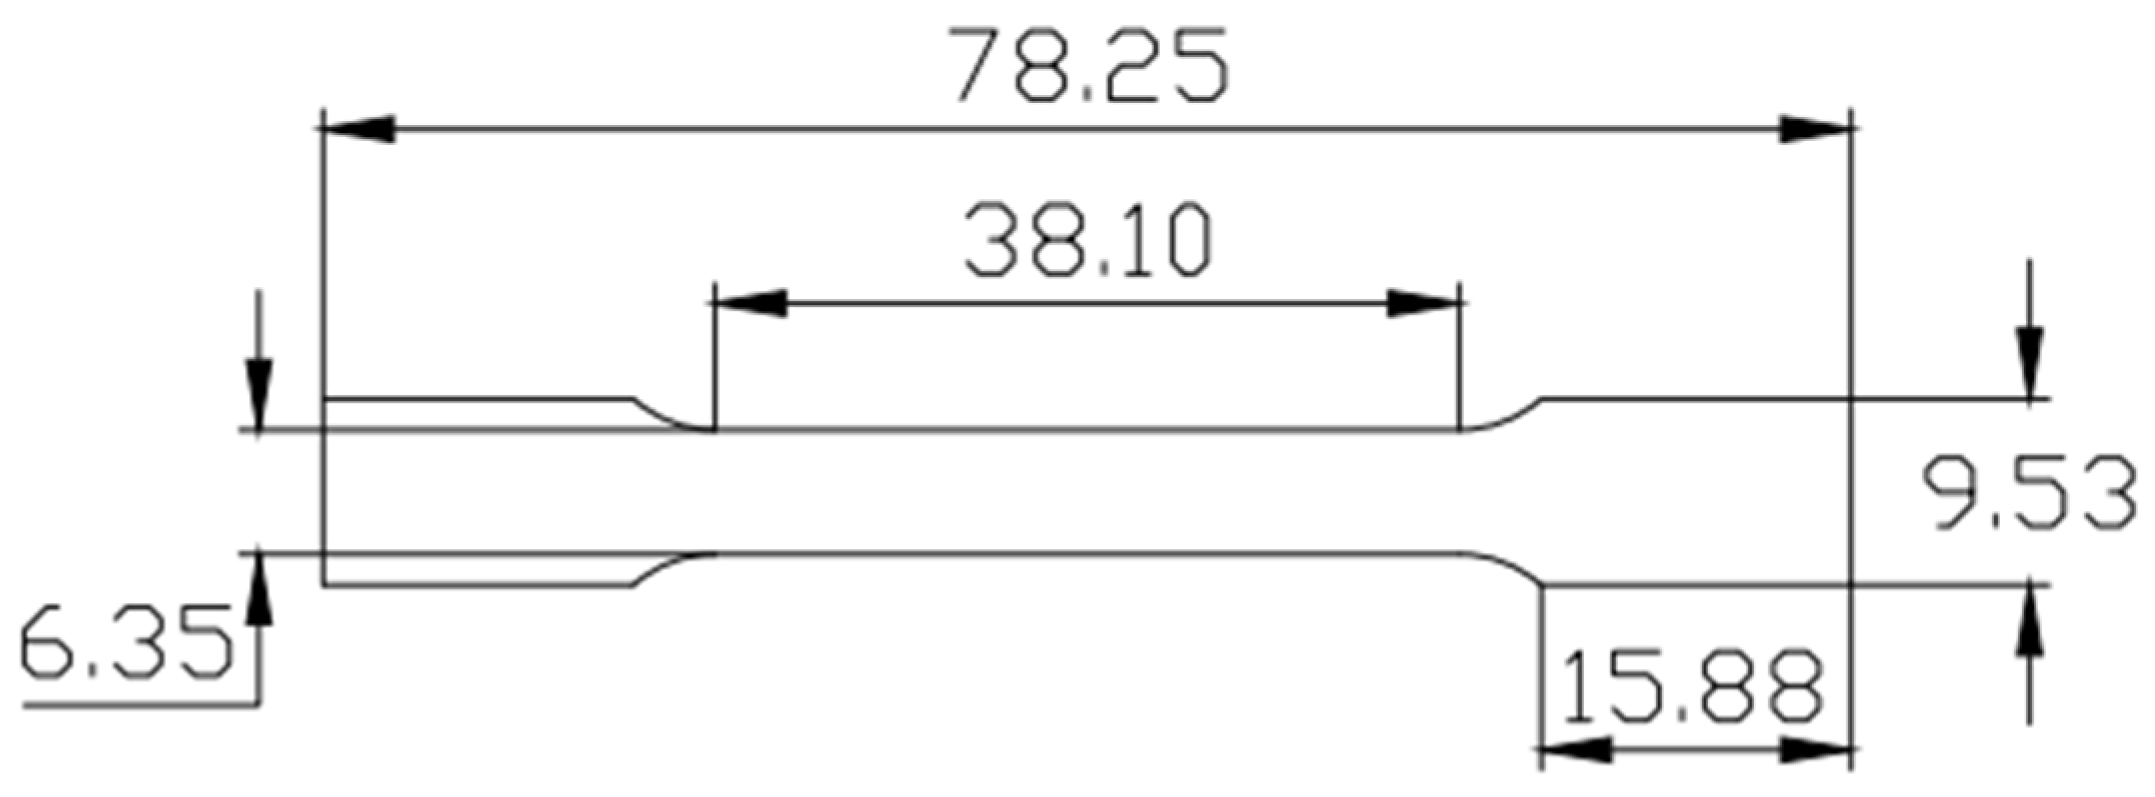
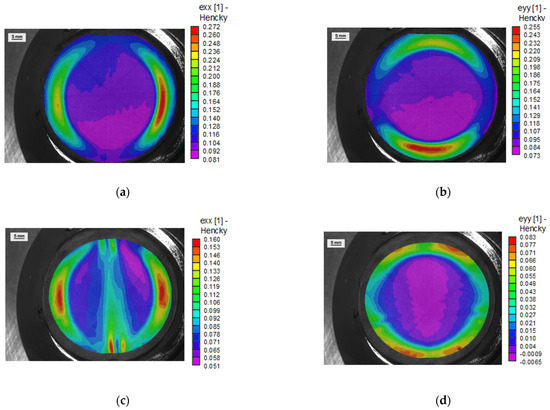
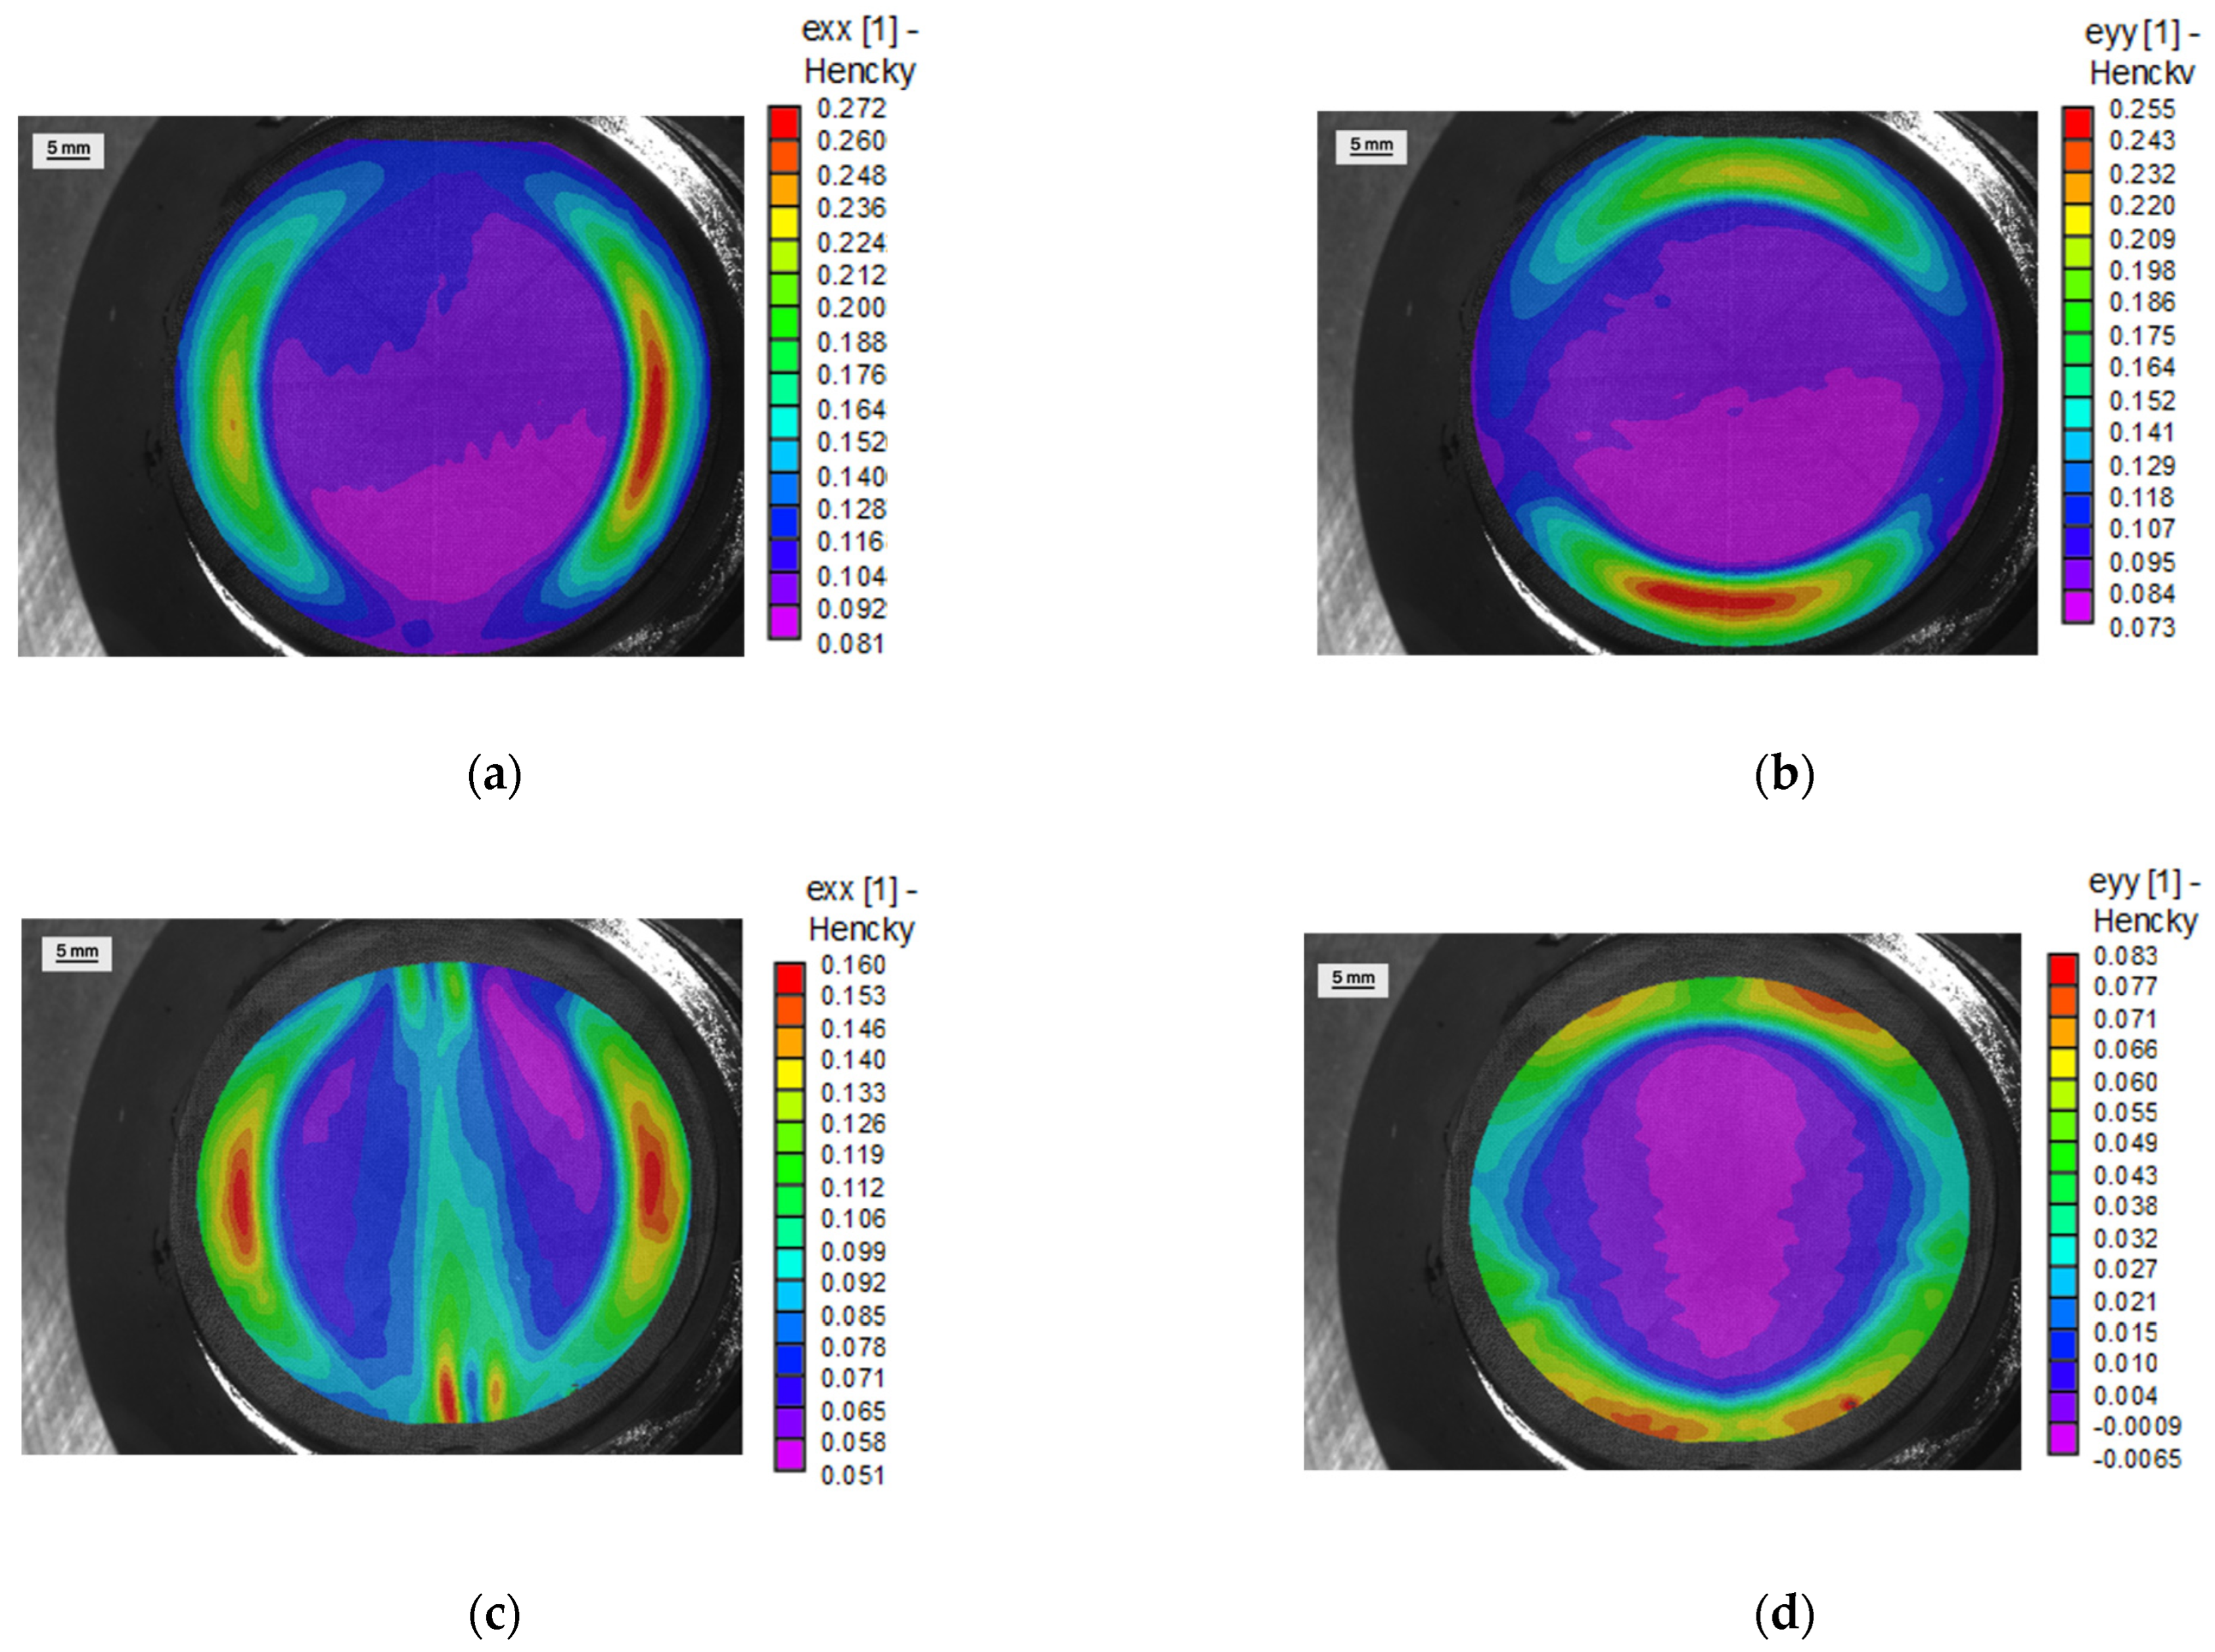
The biaxial tension and plane-strain tension pre-strains were applied using standard Marcinak tooling, as can be seen in Figure 1. Marciniak tooling (Interlaken Technology Company, Chaska, MN, USA) was used, because it employs a flat punch, so that tensile specimens can be extracted from the sheet after pre-strain. The subsize tensile specimen dimensions are shown in Figure 2. For biaxial tension, a fully clamped sheet, with dimensions of 192 mm × 192 mm, is employed, along with a mild steel carrier blank and a sheet of Teflon coated with petroleum jelly in order to promote sliding of the sheet on the tool surface. For plane-strain tension, the sheet is not fully clamped, i.e., the specimen is rectangular and promotes straining along the major strain axis, but in the minor strain direction, the strain will be close to zero, if the width is correct. In the case of the 7021-T4 sheet, a width of 135 mm (with length of 192 mm) was found, through experimentation, to provide a plane-strain condition at the start of necking. An Interlaken hydraulic press (at Commonwealth Aluminum, Madison Heights, MI, USA) was used to perform these experiments, with a 667 kN maximum clamp force and 445 kN maximum punch force. Digital image correlation (DIC), using Correlated Solutions system Vic-3d version 10.0, was employed for strain measurements during the press forming experiments. The DIC measurements allowed for quantifying the effective strains imparted to the sheets, as well as verifying the intended strain path. For biaxial tension, the strain path is relatively straightforward, but for plane-strain tension, as the path depends on the specimen geometry, the verification is important. Figure 3 shows major and minor strain maps for pre-strained specimens near the point of failure.
Figure 1.
Section view of Marciniak tooling with 101.6 mm diameter punch, used to impart biaxial and plane-strain tension pre-strains to AA 7021-T4 sheets.
Figure 2.
Dimensions of subsize tensile specimen cut from the flat portion of pre-strained Marciniak specimens (dimensions are mm).
Figure 3.
DIC strain maps for a biaxial tension pre-strain in (a) the major strain direction and (b) in the minor strain direction, just prior to necking; and plane-strain pre-strain in the (c) major strain direction and in the (d) minor strain direction just prior to necking.
Based on major true strains of about 0.09 in Figure 3a,b (middle of specimen), the equivalent strain for biaxial tension is about 0.18 . For the plane-strain case seen in Figure 3c,d with a major true strain of about 0.1, and minor strain close to zero, the equivalent strain is about 0.12 (). Further discussion of how these pre-strain levels were chosen is found later in the results section of the paper.
The specimens strained to different levels of pre-strain in uniaxial, plane-strain, and biaxial tension were also evaluated for texture and geometrically necessary dislocation (GND) content as a function of strain, to compare against the dislocation densities calculated by the model. High-resolution EBSD (HREBSD) was employed to characterize textures and to compute the GND density in the base material and the strained specimens, using OPENXY (version 2025) [13]. The microscopy specimens were removed using a diamond blade cutter, to avoid deformation of the material, and mounted in epoxy resin to be polished for EBSD scanning. The ND surface of the samples was first ground with grits of 400, 600, 800, 1200, and 1200 fine abrasive paper. The ground samples were then electropolished using an electrolyte solution of 1:9 ratio of perchloric acid and methanol under 20 volts and 2 amps at room temperature for 30 s. The polished samples were milled in an inert argon gas environment by a JEOL ion-beam cross-section polisher to remove the initial strain layer induced by polishing. The surface was first coarsely milled at 5 kV and 4.2 atm for 20 min. A second finer step removed unevenness by milling the surface at 4 kV and 6.2 atm for 5 min. The polished surface of the samples was scanned using EDAX OIM software (version 8.0), and patterns were saved for evaluation using HREBSD. Three different areas of 120 × 120 microns with 70 nm step size were scanned for GND content on each specimen.
3. Modeling Approach—SG-EPSC Framework
In the description that follows, “∙” implies a dot product, while “⊗” means a tensor product. Tensors are bold, while their components and scalars are in italic. Slip families use superscript α and slip systems use s.
The theory of the EPSC model stems from the initial works by Hill [14] but was implemented in a small strains theory code in [15]. Subsequently, the model was extended to a large strain formulation in [16]. Finally, the code advanced in a fully implicit formulation in [17]. In the EPSC model, a polycrystalline material is treated as a set of single crystals, each shaped like an ellipsoid and defined by its crystallographic orientation and weight. The response of individual crystals is homogenized via the self-consistent procedure involving a homogeneous effective medium (HEM), which represents the overall response. The formulation defines stress rate of a single crystal using
where is the Cauchy stress rate for a crystal/grain , is the fourth rank elastic stiffness tensor per grain, is the total rate of deformation stretching tensor, which is also the strain rate tensor, and is the plastic stretching tensor. The last tensor is
where is the slip system s shearing strain rate, and is the slip system symmetric Schmid tensor defined using the slip system plane normal, , and Burgers vector, .
Equation (1) can be rewritten in a simpler form that shows a linear relationship between the stress rate and strain rate of a single crystal:
and the same relationship at the aggregate level is
Here, is the stress rate of the polycrystal, is its strain rate, and is the overall elastoplastic stiffness of the polycrystal. This stiffness is calculated through an iterative process, which will be explained soon. Combining the above constitutive equations, the stiffness tensor for a single crystal, denoted as , is given by the following expression:
where is a second-rank identity tensor and is a square matrix of size corresponding to the number of active systems as
with derived as the hardening rate of the active system. is the contribution to the hardening matrix from the similar derivatives of backstress. To evolve texture during plastic deformation, the rotation rate (or spin) of a single crystal is defined by the lattice rotation rate tensor:
The applied macroscopic spin is made up of two parts: the overall spin rate W applied to the entire polycrystal, and an extra spin owing to the self-consistent formulation . This additional spin comes from solving the Eshelby inclusion problem [18], which accounts for how each crystal behaves as an inhomogeneity inside the homogeneous effective medium (HEM) under applied boundary conditions.
where is the anti-symmetric Eshelby tensor. Lastly, is the plastic spin calculated from shear strain rates and the anti-symmetric Schmid tensors, :
To ensure we are capturing the large strain deformation, the Jaumann rate of the Cauchy stress is used. This allows the model to account for the rotation of the crystal lattice relative to the global reference frame. As a result, Equations (1) and (3) are exchanged with
Similarly, Equation (4) for the polycrystal is also corrected:
The Jaumann and Cauchy stress rates on the single crystal and polycrystal levels are related in a common frame, considering the spins via
In this paper, a bar over a quantity indicates a volume average, calculated by summing each grain’s value multiplied by its relative weight, .
The equilibriums between the single crystal and polycrystal levels of stress and strain rates are solved via the interaction equation:
where is the interaction tensor:
that defines a localization tensor:
which is used to calculate the polycrystal instantaneous elastoplastic stiffness tensor from the single crystal quantities as
Since the right-hand side of Equation (16) is also a function of via Equation (15), these equations must be solved iteratively until convergence with a chosen tolerance of 0.001.
A slip system in a grain becomes active when the resolved shear stress approaches the slip resistance, also known as the critical resolved shear stress (CRSS). This occurs when the following conditions are met:
where is the CRSS. influences the driving force for activation. Backstress is usually estimated using phenomenological models. In this work, it is calculated based on geometrically necessary dislocations (GNDs), which are specific dislocations required to accommodate lattice bending, curvature, or strain gradients in crystalline materials, distinguishing them from randomly arranged “statistically stored dislocations” (SSDs). The first condition (17a) means that a slip system becomes active when its resolved shear stress reaches the yield surface. The second condition (17b) ensures that the stress stays on the yield surface as plastic deformation continues. The critical resolved shear stress (CRSS) changes during plastic deformation according to
Lastly, the shear strain rate is calculated as
The model described above simulates large-strain mechanical behavior of polycrystalline materials using the average properties of each inclusion. The mode was used for predicting and interpreting the behavior of the 7021-T79 alloy under load reversals in [19]. However, recent studies have shown that accounting for variations within each inclusion—called intra-inclusion field fluctuations—can improve accuracy [20]. These variations are captured by calculating second-moment quantities, which reflect spatial differences in properties over individual inclusions. This work builds on those improvements, especially the field fluctuations (FF) approach first introduced in the visco-plastic self-consistent (VPSC) [21,22] and then adapted for EPSC. Moreover, these advances facilitated a strain gradient (SG)-EPSC formulation [8], which is used in the present work. For completeness, we summarize the FF and SG formulations of EPSC.
3.1. Field Fluctuations (FF)-EPSC Formulation
The second-moments formulation presented here is the result of several earlier studies [22,23,24,25]. The significance of calculating the second moment of stress per grain lies in obtaining the variance per grain, which quantifies how widely the tensorial stress field is distributed around its mean value. It accounts for two main sources of stress fluctuations: variations in average grain properties within the polycrystal and variations in crystal orientation within grains.
The second moment of the stress rate is given by
The angle brackets indicate a second moment quantity. and are the polycrystal and single crystal compliances calculated by taking the inverse of the respective elastoplastic stiffness tensors from Equations (5) and (16), and is the total fluctuation of the stress rate:
In the above equation, is the mean stress rate at time for a grain, is the second moment of the stress rate induced by the average grain stress rate fields, and is the second moment of stress rate fluctuations induced by the misorientation fields. and are transpose of each other and describe the cross-covariance between the two fluctuation sources. Once the second moments of the stress rate are known, the second moments of the lattice rotation rates can also be calculated at the same time step, :
where is the dual vector of the spin tensor from Equation (7), while is owing to the misorientation fields. and are the second moments of lattice rotation rate terms caused by the intragranular stress rate and misorientation fluctuations, respectively. and are the cross-covariance terms that are transpose of each other.
Finally, the second moments of misorientation at the time step, , to the next time step, , are
where is the vector part of the incremental rotation, while is the vector part of the rotated misorientation of the misorientation vector, , using the increment in rotation, , written in the rotation matrix representation. In these calculations, the second-rank orientation and misorientation tensors are represented using quaternions, which are then simplified to their vector components. Evaluation procedures for the individual terms can be found in [20,21,25].
3.2. SG-EPSC Formulation
Using the second moments of misorientation, the SG-EPSC model is formulated to infer the evolution of geometrically necessary dislocations (GNDs). The calculation is based on Nye’s tensor, following well-established theories [26]:
where is the elastic deformation gradient of a single crystal, c, decomposed into the rotation, , and the elastic stretching, . is the grain’s Nye tensor that has been customarily accepted as an equivalent to GND density via [27,28,29,30]
where is the magnitude of the Burgers vector. Nye’s tensor can be calculated in the EPSC model after the misorientation spreads are spatially organized. The procedure for the spatial organization of the intragranular spreads, i.e., the rotation tensors, was presented in [8]. Moreover, the elastic stretch tensor is calculated from the elastic strain tensor via
The elastic strain tensor can easily be calculated at every point of the spread given the grain stress and local elastic compliance tensors. After the elastic deformation gradients are obtained at every point of the spread, each component of the tensor , is numerically interpolated to create a continuous field for calculating the curl of Das, Hofmann [31]:
Nye’s tensor is then
Given that the formulation is increments, have been introduced. The GND densities are evaluated at each grid point via
The average GND density of the grain is the average over the grid points:
Finally, the average GND density in the grain is distributed over the active slip systems in the grain using
The term on the right-hand side represents the relative slip activity, based on the shear strain rates of the active slip systems. The resulting GND density for each active system can be combined with the statistically stored dislocation (SSD) density to update the material’s hardening behavior, which will be explained shortly. It is also important to note that the computed GND density is added to an initial value assigned to each slip system,
Once the GND density is known for each slip system, a backstress model based on GNDs, proposed by [32], is used to calculate the backstress that develops on each slip system:
where is a scaling parameter and is the shear modulus. The derivative for Equation (6) is readily obtained.
3.3. Dislocation Density-Based Hardening and Twinning Formulations
This section describes a hardening law based on the evolution of dislocation densities extended to account for the effects of GND density. The slip resistance in Equation (17a) includes three components:
where is an initial slip resistance per deformation mode as a fitting constant, which includes the effects of solid solution and grain size and can be sensitive to the temperature and strain rate [33,34]. is the strain hardening term that captures the effects of both forest dislocation density and GND density on hardening:
where is an interaction parameter set at 0.9 for all simulations, and is a latent hardening interaction matrix. For FCC, it is defined with parameters to [35,36]. is the forest dislocation density, and is the total GND density.
accounts for the strain hardening with an evolving debris dislocation density, :
The total dislocation density is
where is the forward forest dislocation density on s, while and are the reversible dislocations in the s+ and s− directions. The evolution of the forest densities with shearing strains is [36,37,38]
(If )
(If )
The initial conditions are
while
is specified as an input to the model.
In the above equations, several key parameters control dislocation behavior and hardening. The parameter governs the rate at which dislocations are generated, while accounts for temperature and strain rate effects on dynamic recovery. A reversibility parameter p, set to 0.2, helps capture the behavior during load reversal. The dislocation interaction matrix is used to model interactions between slip systems, with typical values of and = 1 based on the literature [36,37,39]. The constant m, set to 0.5, controls the rate of dislocation recombination [40]. Lastly, represents the dislocation density at the point of local load reversal, as described by [38]. These parameters together allow the model to more accurately capture strain hardening and recovery behaviors under complex loading conditions. The coefficient is
where is the Boltzmann constant, is a reference strain rate, is a fitting parameter representing the effective activation enthalpy, and is the drag stress. Lastly, the debris/substructure dislocation density evolves with
where is a fitting parameter determining the number of dislocations that become debris/substructure. The debris dislocation density evolves from a very small initial value of 0.1 .
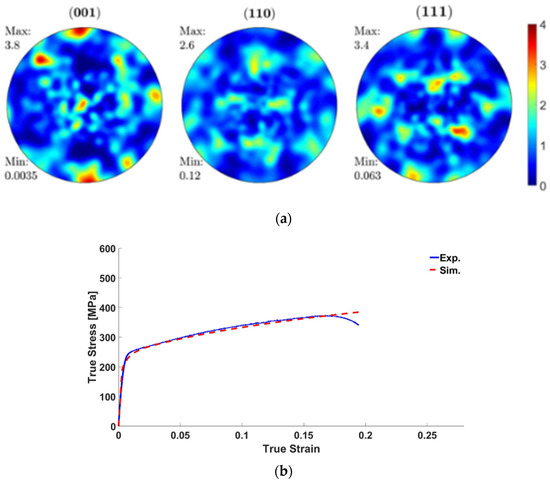
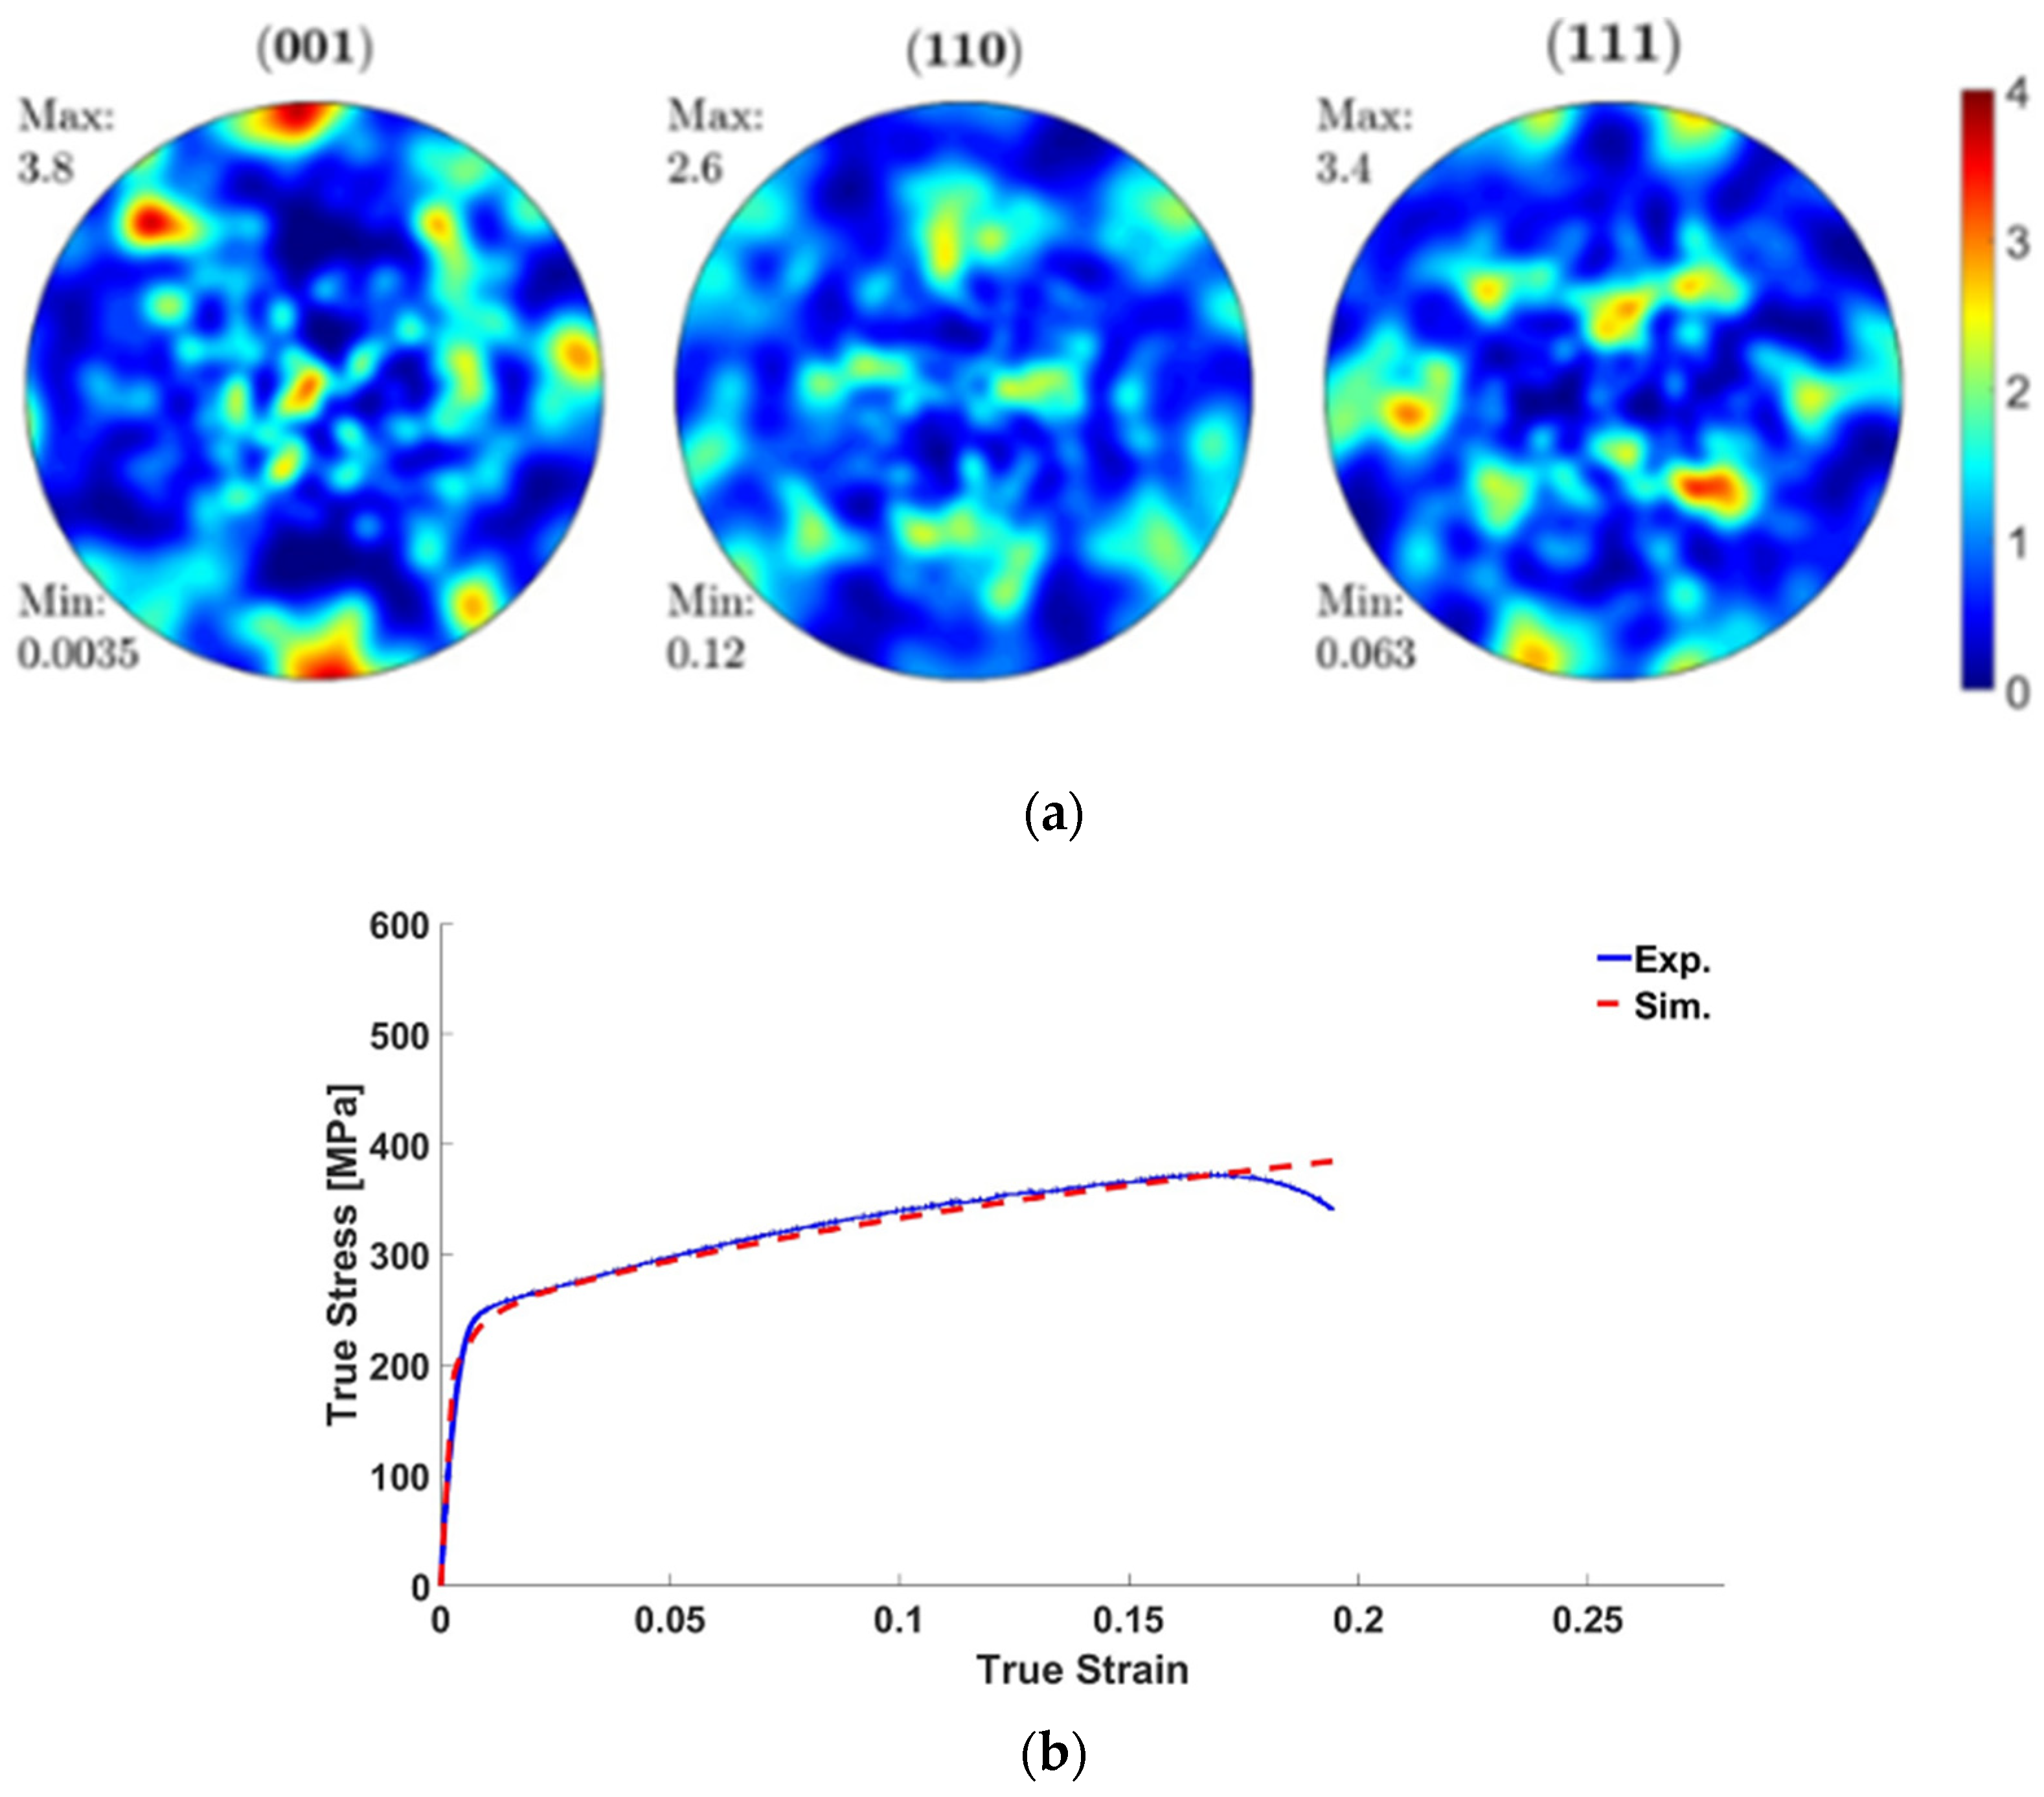
This SG-EPSC model is employed for the modeling of the two strain paths: biaxial tension to uniaxial tension (BT-UT) and plane-strain tension to uniaxial tension (PST-UT). The simulations followed the experiments where the sheet specimens were pre-stained, unloaded and then tension tested uniaxially along RD. The datasets of experimental initial GNDs and flow behavior are used to verify the model predicting the material behavior. The initial texture of the AA7021-T4 alloy is shown in Figure 4a. The texture was measured by neutron diffraction and compacted to 100 weighted orientations using the procedure developed in [41] for simulations. The model is calibrated by applying a uniaxial boundary condition and comparing with the experimental stress–strain curve in the RD direction (Figure 4b). The calibrated parameters are shown in Table 2. The model uses dislocation density-based hardening with GND evolution, and it considers backstress from the GND evolution. The present work reported the SSDs and GNDs from the simulation for the two strain paths at different pre-strained amounts.
Figure 4.
(a) Pole figures of initial texture for AA7021-T4, and (b) stress–strain curve of measured and predicted responses of AA7021-T4 along the RD.
Table 2.
Calibrated parameters for the evolution of slip resistance, latent hardening, and GND-based backstress of AA7021-T4. The single crystal elastic constants taken for the alloy are C11 = 108.2 GPa, C12 = 61.3 GPa, and C44 = 28.5 GPa.
4. Results and Discussion
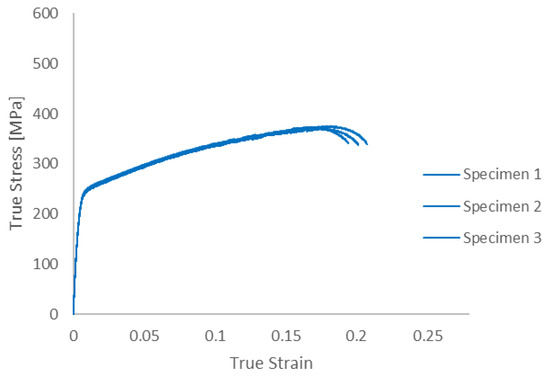
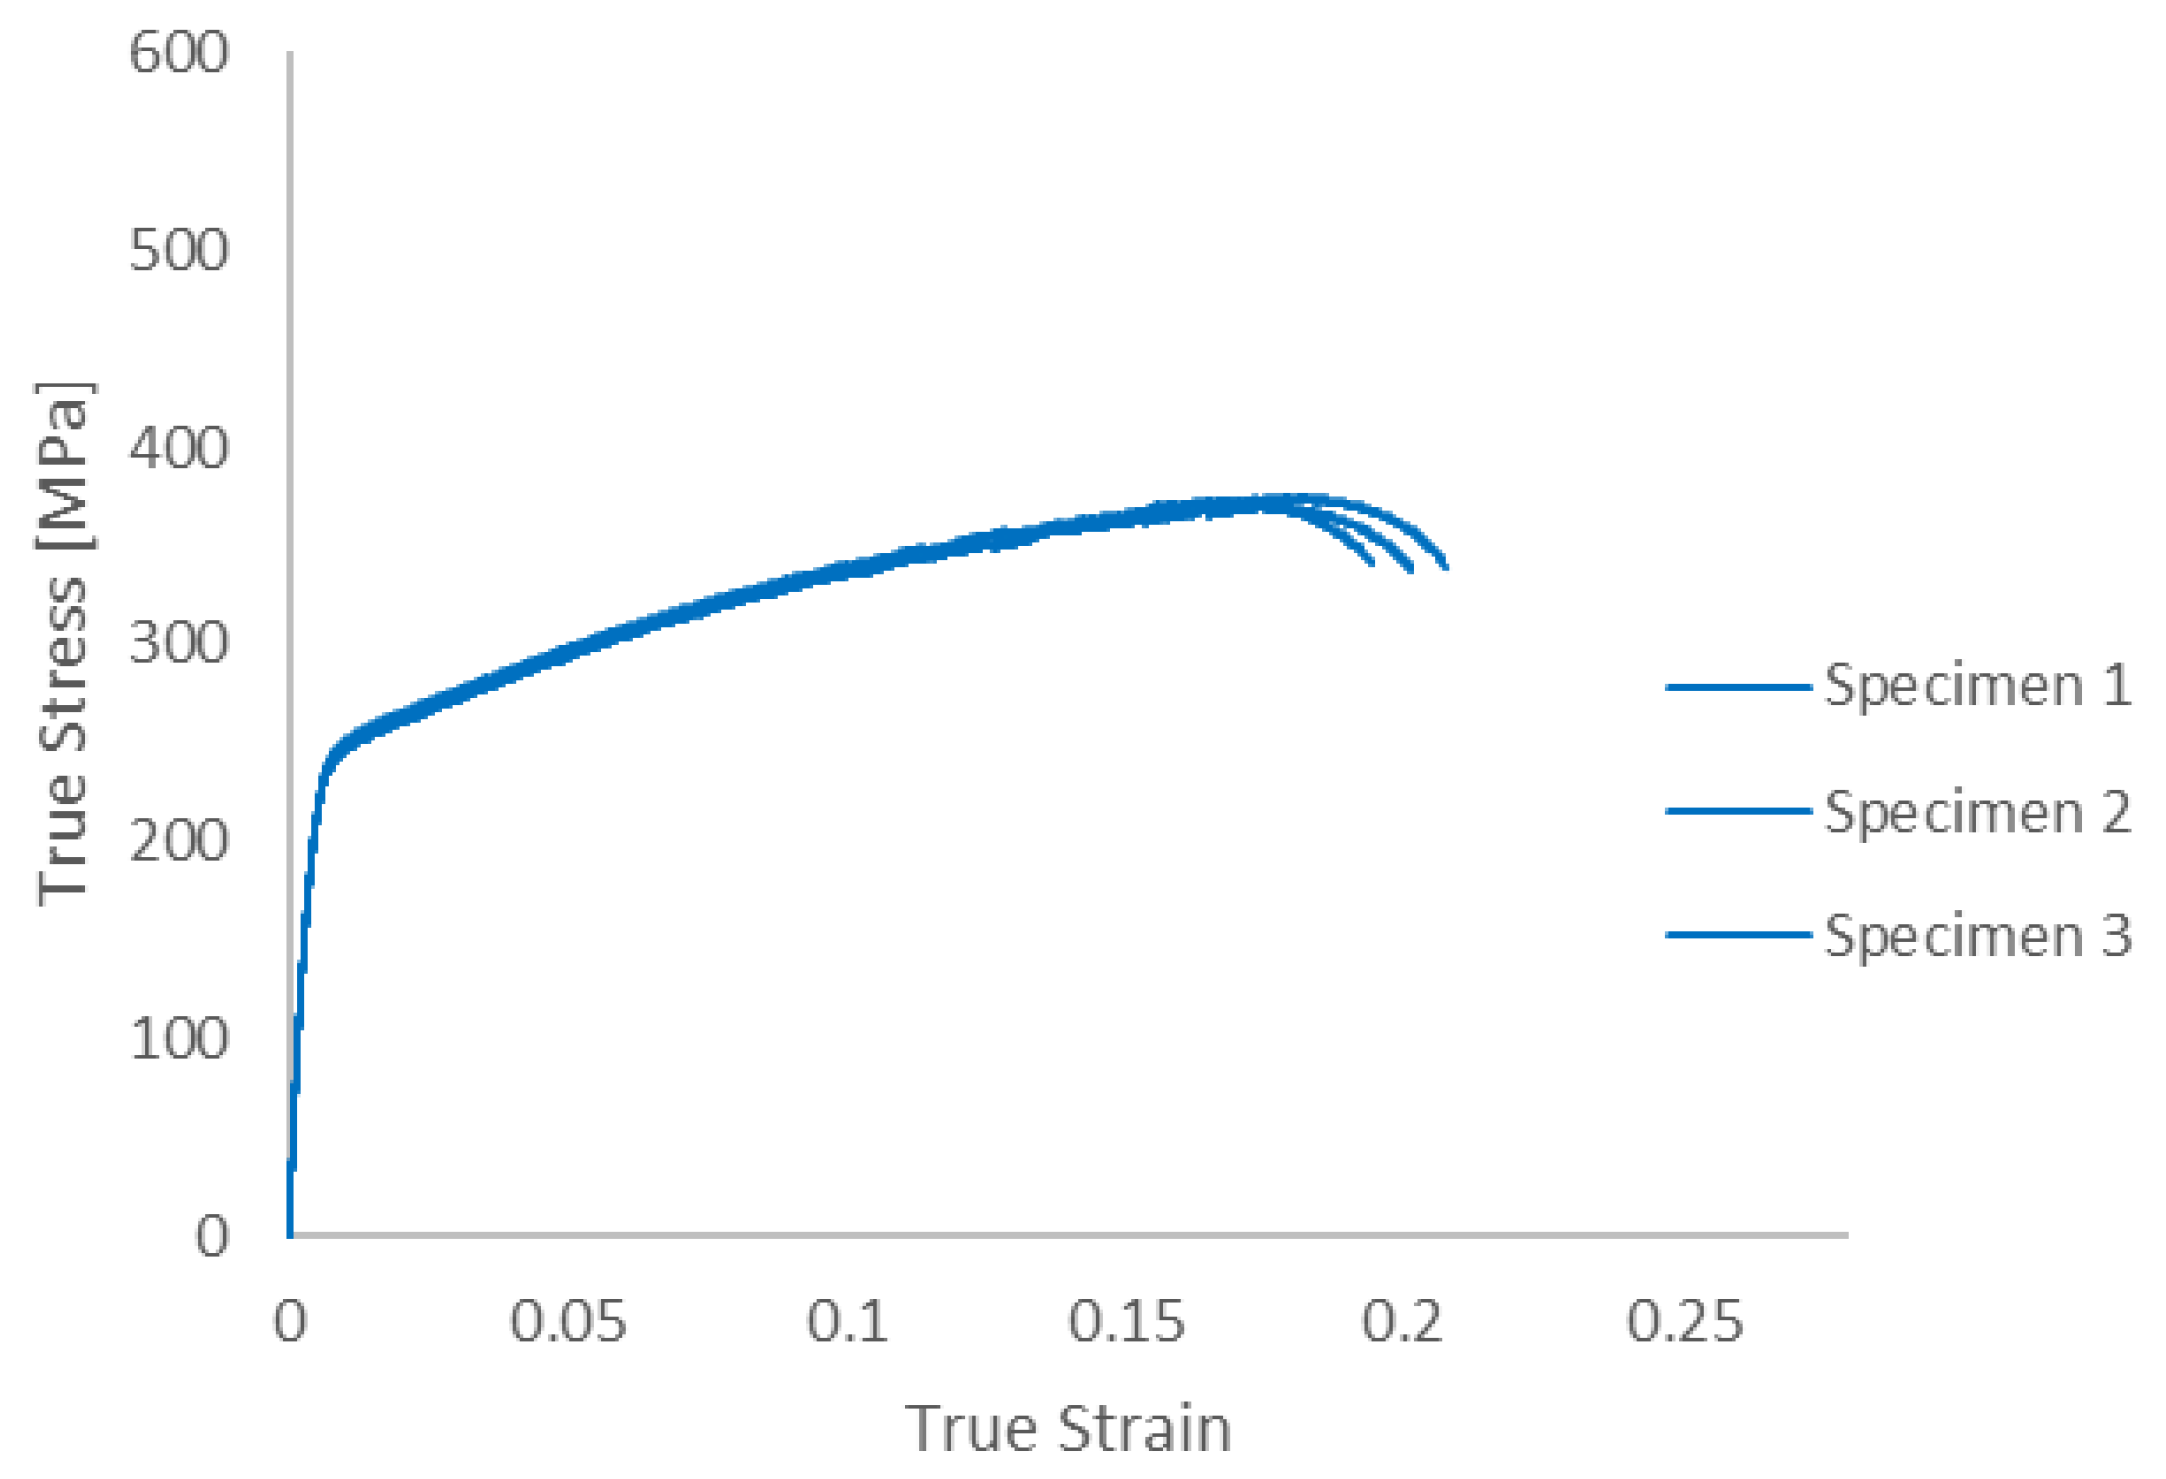
Uniaxial tension tests were first performed to establish baseline material properties. The true stress–true strain curves for three standard ASTM E8 specimens are shown in Figure 5. The yield strength averages 235 MPa, UTS averages 370 MPa and true strain at failure averages 0.2.
Figure 5.
Uniaxial tension curves for AA 7021-T4 sheet specimens. True failure strains ranged from 0.19 to 0.21.
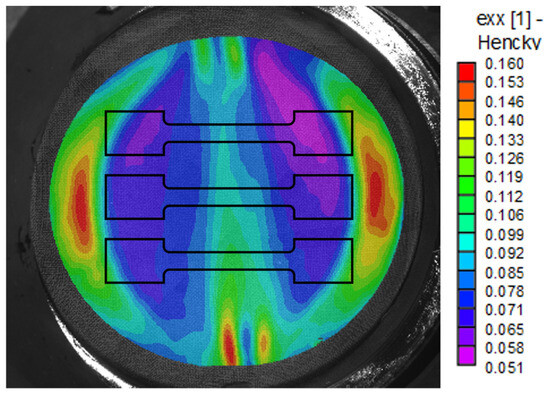
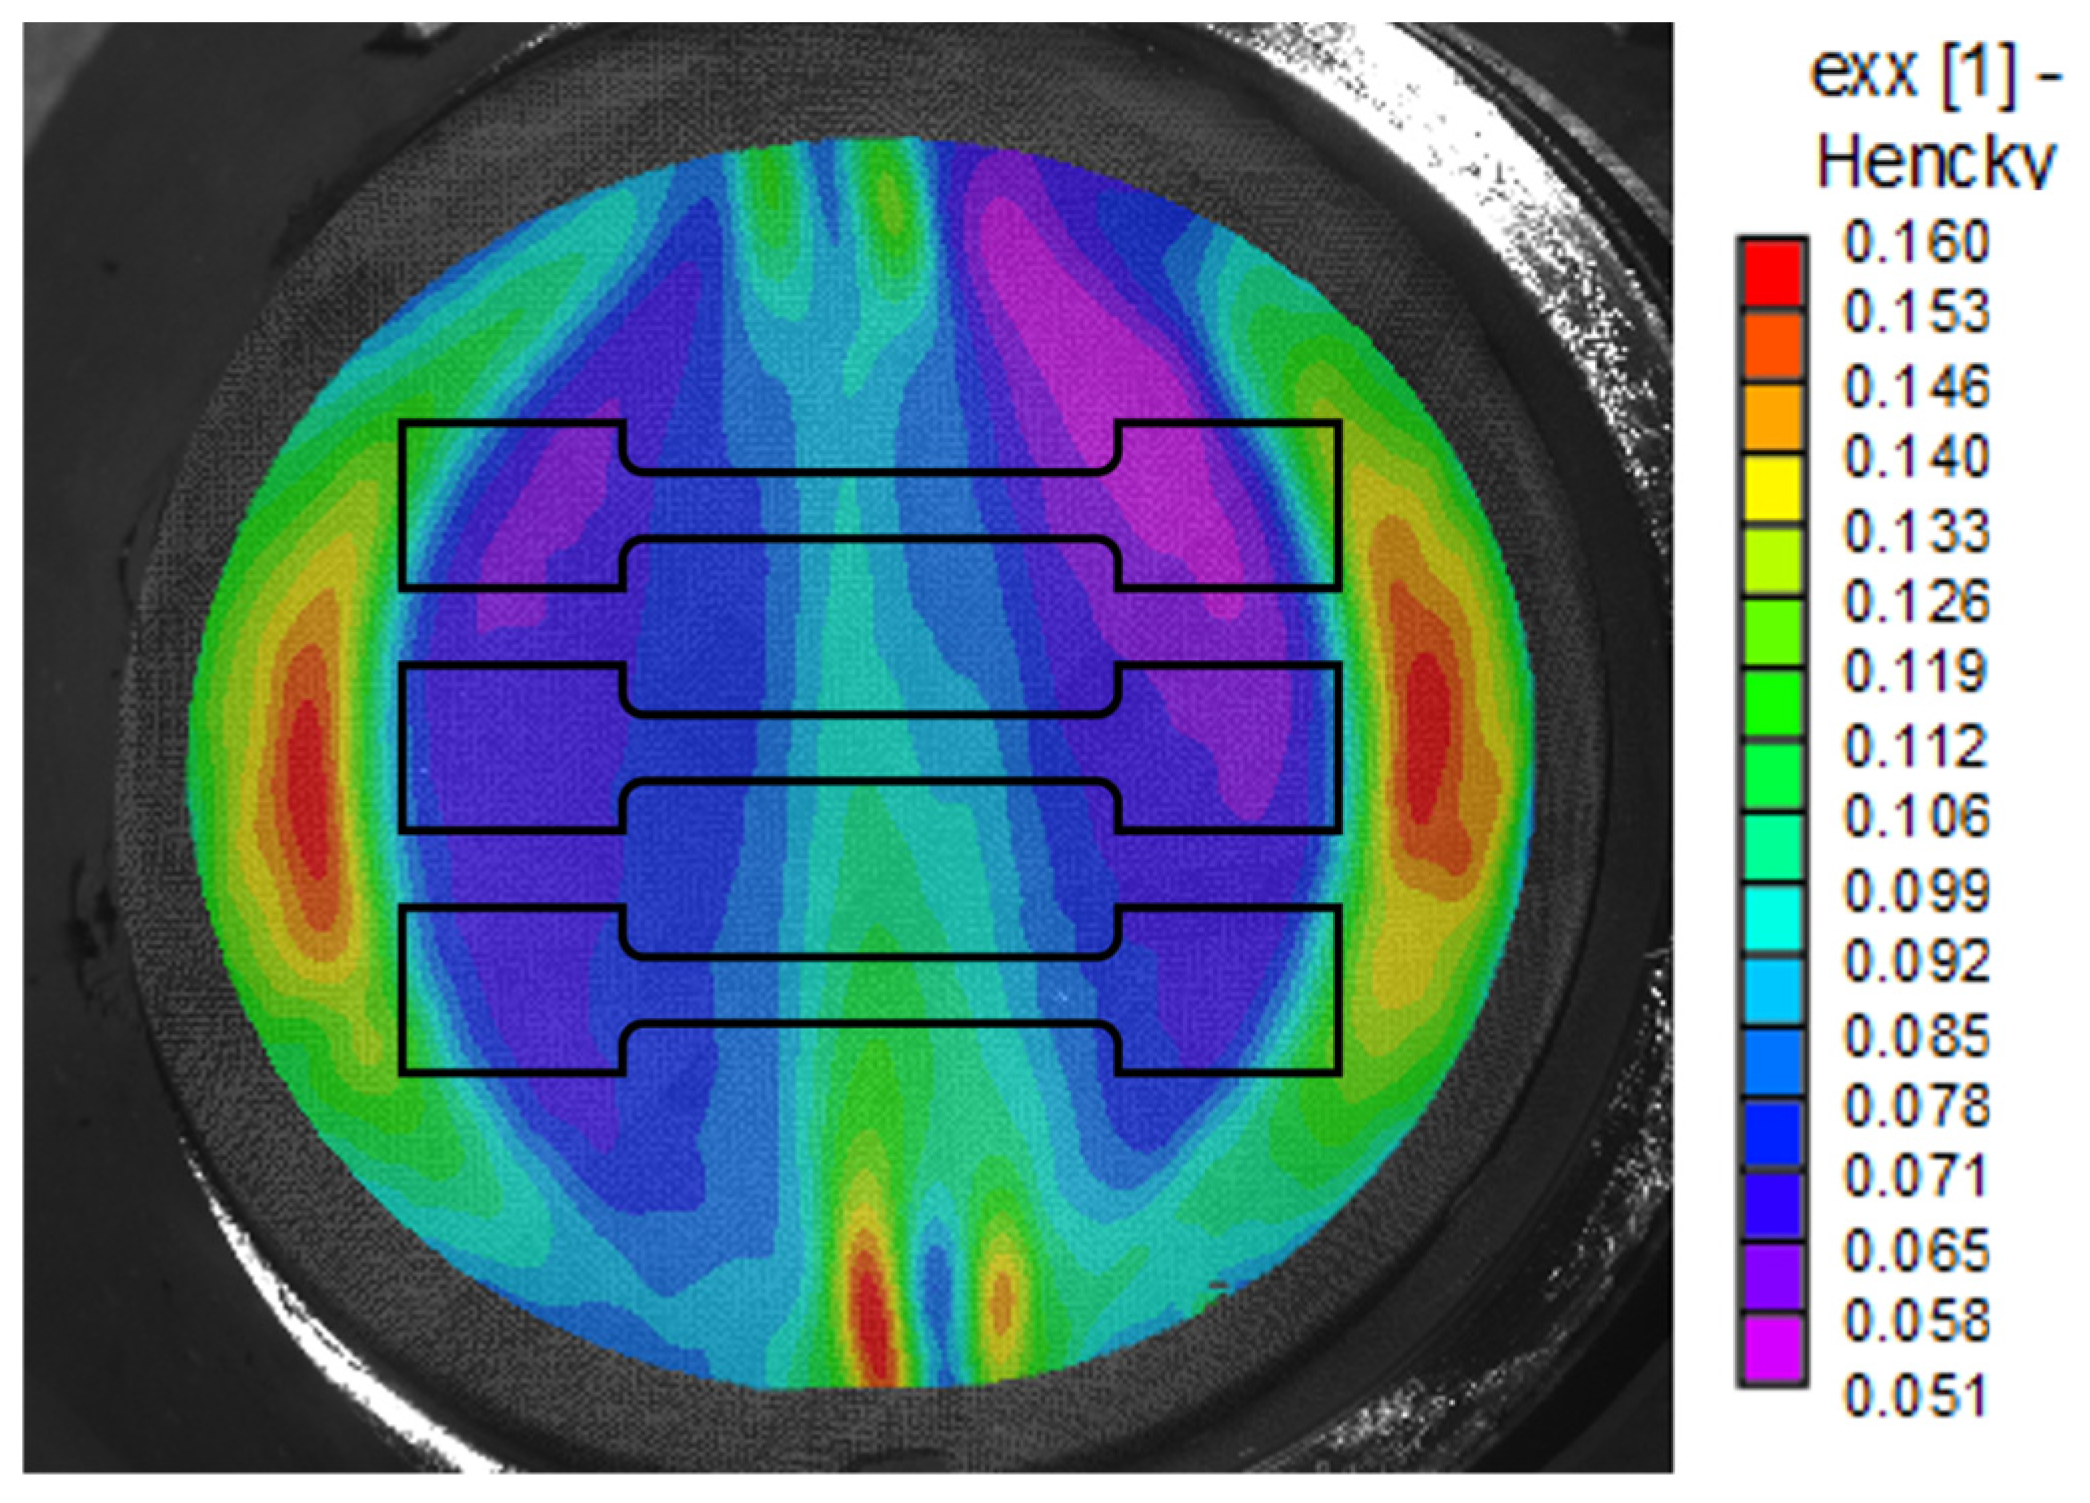
After performing the uniaxial tension tests to obtain baseline mechanical properties, the two-step process of pre-straining sheets in plane-strain and biaxial tension, then cutting small tensile specimens from the pre-strained sheets and testing them to failure, was carried out. In order to compare effective pre-strains that are relatively equivalent, based on the von Mises effective strain relationship, the target effective pre-strain for biaxial tension was about 1.73 times that of the plane-strain pre-strain. This factor was determined from the von Mises effective strain coefficients; as such, since for plane-strain tension and for biaxial tension, the ratio 2/1.15 = 1.73 was used. While it is difficult to stop the hydraulic press in order to achieve precise strain levels, the appropriate major strains, as measured in real time by DIC, were achieved with reasonable accuracy. Once the target pre-strains were reached, the specimens were stored in a freezer until tensile specimens could be cut from the pre-strained Marcinak specimens, as shown, for example, in Figure 6 for plane-strain tension. If a delay was anticipated after cutting the tensile specimens from the Marcinak specimen, the tensile specimens were stored in a freezer until they could be tested to failure, thus attempting to avoid any recovery that might occur if the pre-strained material was subjected to room-temperature conditions for an extended period of time.
Figure 6.
DIC strain map of AA7021-T4 sheet pre-strained in plane-strain tension using Marciniak tooling (as seen in Figure 1). Outlines of tensile specimens that were cut from the pre-strained sheet are shown in the middle of the flat portion of the Marcinak specimen (for plane-strain condition). The same approach was employed for the specimens pre-strained in biaxial tension.
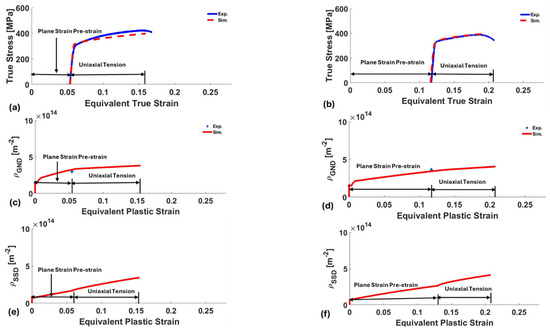
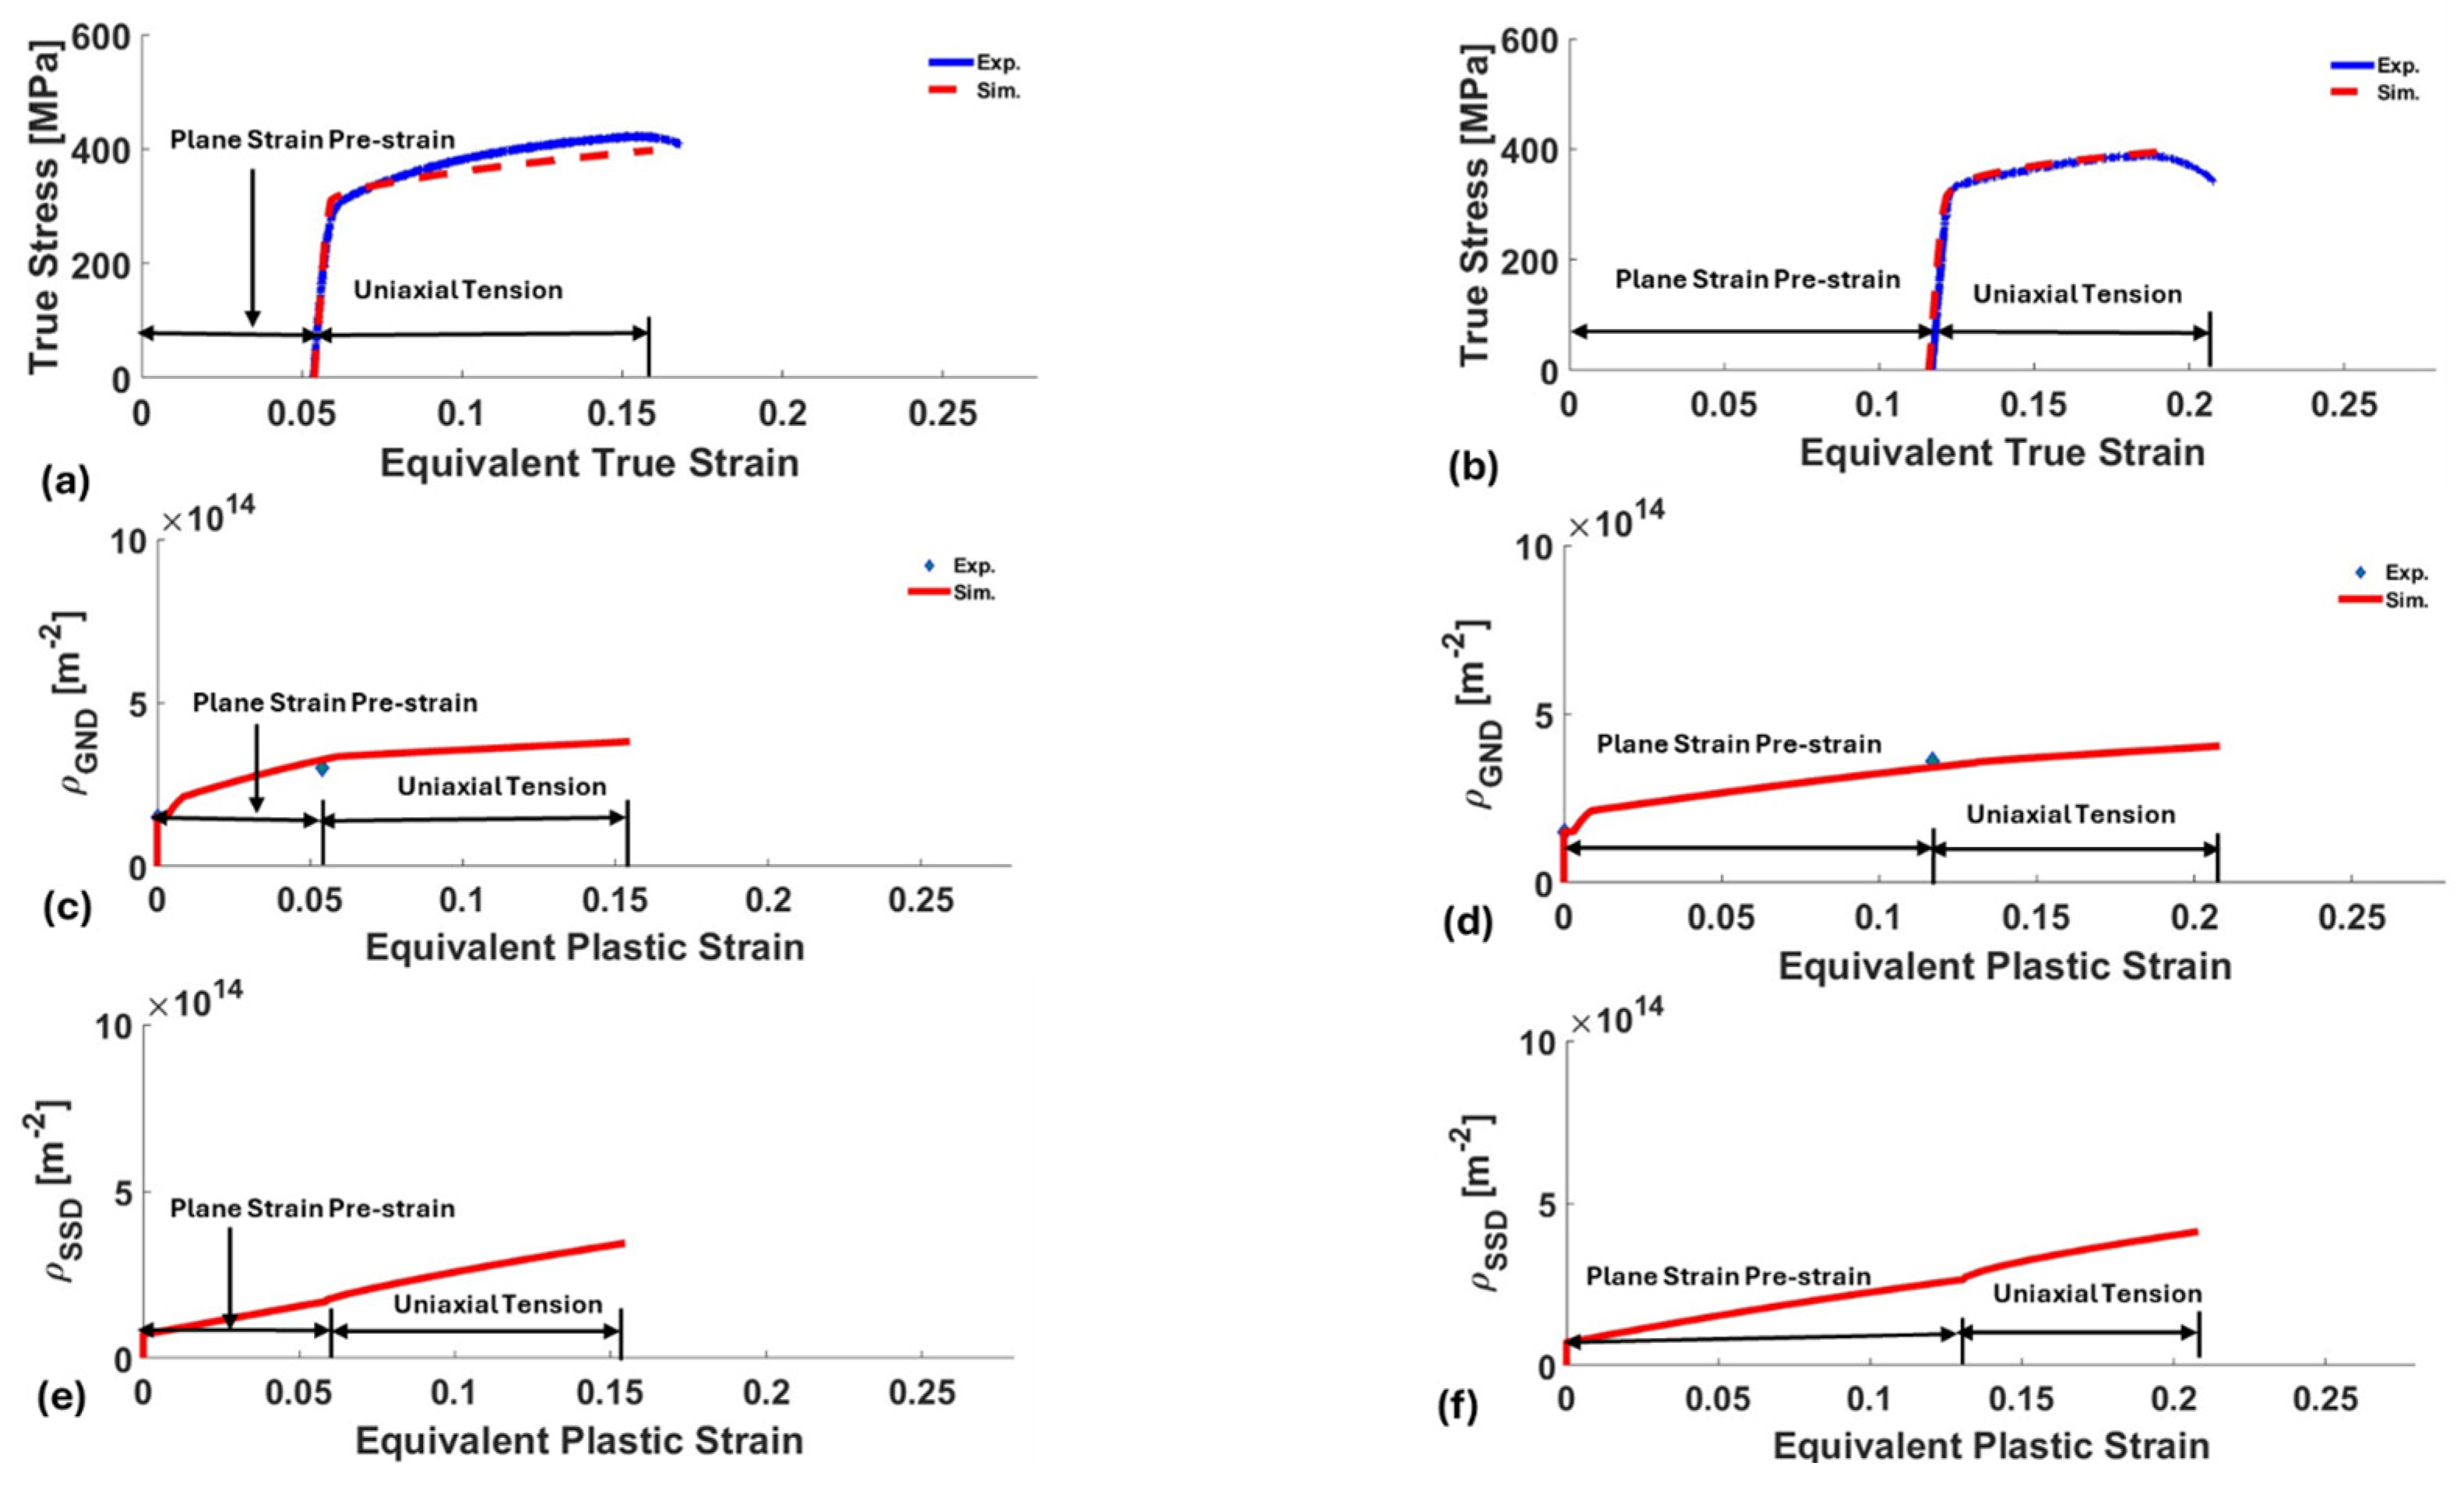
Results for specimens pre-strained in plane-strain tension are shown in Figure 7. For specimens pre-strained to 0.047 major true strain (0.054 effective strain), the subsequent uniaxial tension test in this pre-strained material (Figure 7a) resulted in a total effective strain of about 0.174, when adding together the pre-strain and the uniaxial failure strain. For the specimen pre-strained to 0.102 major true strain (0.117 effective strain), the subsequent uniaxial tension test (true strain of 0.09) resulted in a total effective strain of 0.207, as can be seen in Figure 7b. The total effective strains, with pre-strains added to subsequent uniaxial tension total strains, indicate that the plane-strain pre-strain did not result in faster exhaustion of ductility than simple uniaxial tension (effective strain at failure of about 0.2), which is surprising since plane-strain tension is typically associated with a minimum level of ductility/formability, as was seen in forming limit curves of AA 7021-T4 generated in a prior study [1]. In this prior study, the measurements provided a uniaxial major strain limit of about 0.33 (effective strain of 0.33), a plane-strain major strain limit of about 0.2 (effective strain of 0.23), and a biaxial tension major strain limit of about 0.27 (effective strain of 0.54). These values appear to be greater than the levels measured for the current alloy (i.e., uniaxial true strain of about 0.2). However, the FLD from reference [1] illustrates the v-shaped nature of typical forming limits, with the minimum formability corresponding to a plane-strain tension strain path. Given that the plane-strain pre-strain in our experiments did not reach a point where damage occurred, via formation of voids, and only uniform strain hardening was operating; then, the strain path change to uniaxial tension was able to facilitate a typical level of overall effective strain at failure, rather than a truncated amount.
Figure 7.
Comparison of experimental and predicted tensile curves after (a) 5% and (b) 11% plane-strain pre-strains. GND density evolution for the (c) 5% and (d) 11% pre-strains followed by uniaxial tension is also shown. The blue diamond in both cases represents GND density measured via HR-EBSD, indicating good agreement with the GND from the simulation. In contrast to GND density, SSD densities evolve more linearly with strain, as seen in the (e) 5% and (f) 11% cases.
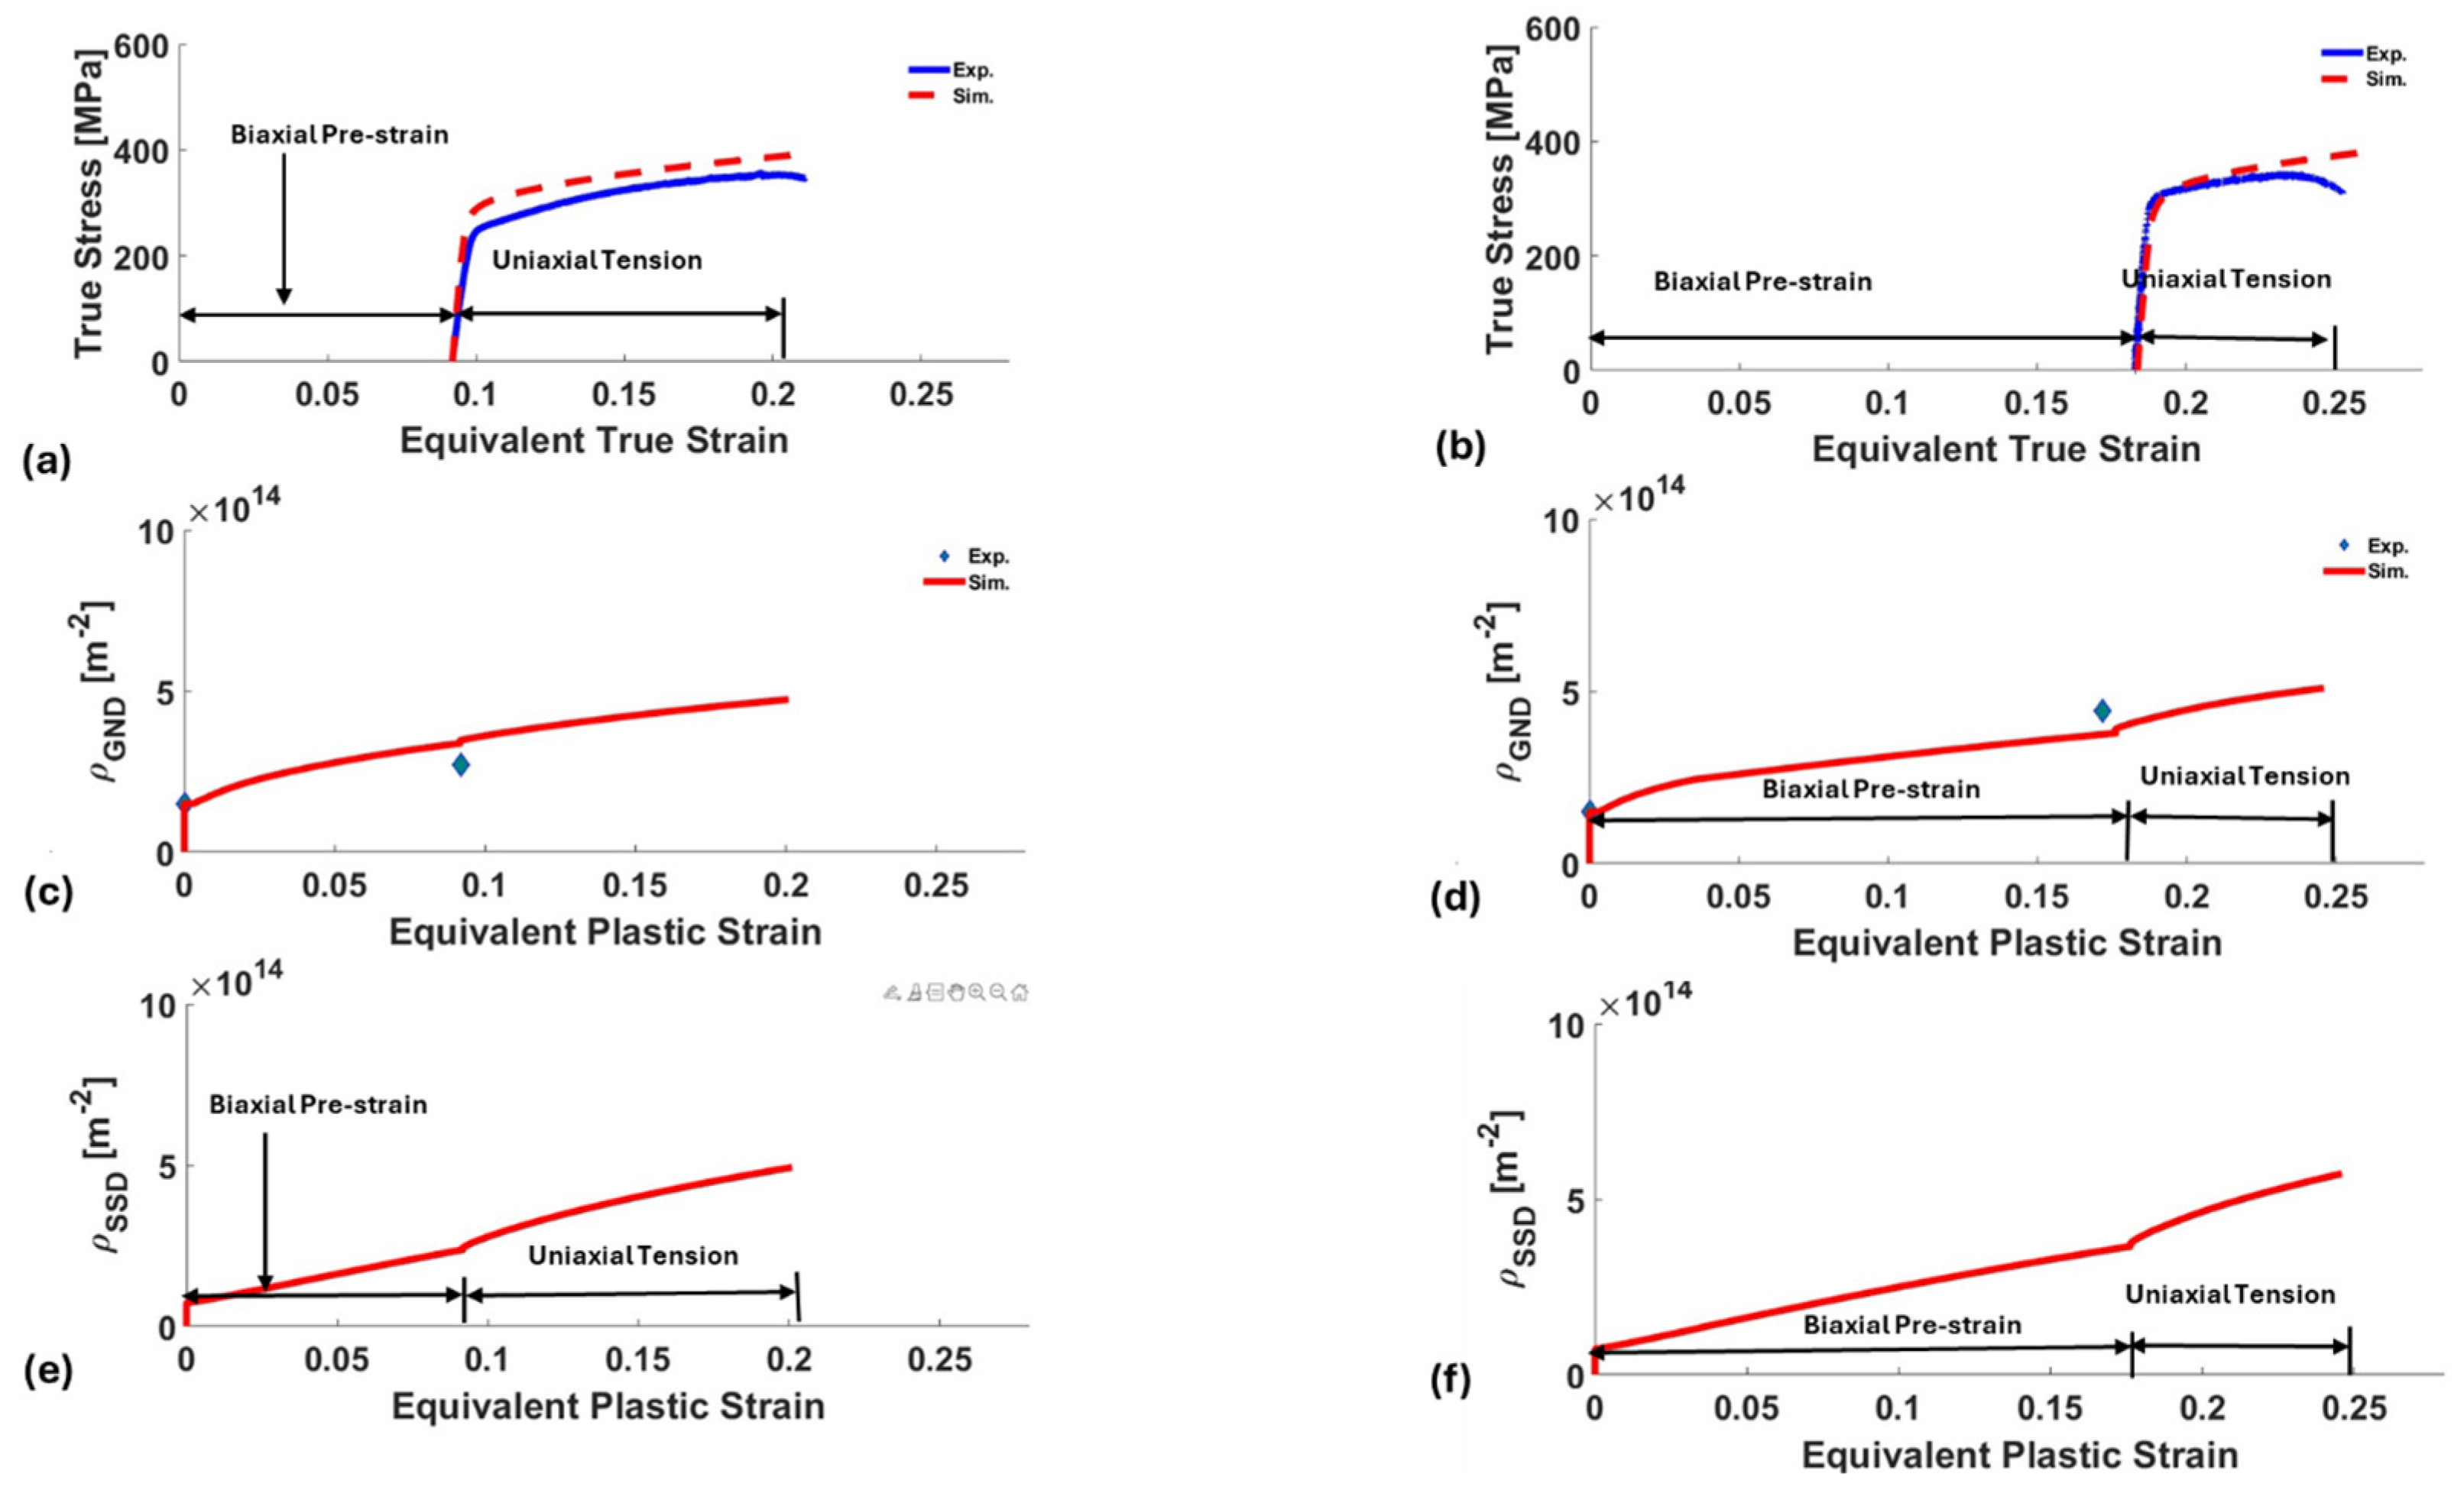
Both the GND and SSD evolutions are a function of effective strain, which can be correlated to the stress vs. strain curve. The values plotted and are sums over the slip systems and and then averaged over the grains of the AA7021-T4 polycrystal. The small jump at the beginning of the GND vs. strain curves in Figure 7 shows the transition from base material GND through the short elastic deformation region with no increase in GND, to the start of plastic strain. This increase in GND density following the strain path transition reflects the redistribution of slip activity required to accommodate the new loading direction. The change in resolved shear stress activates additional slip systems, leading to increased local incompatibility and accelerated GND generation until a new internal stress equilibrium is established. After this transition, there is a steady increase in GND with strain over the plastic portion of the curve, with a slope change at the transition between plane-strain tension and uniaxial tension. GDN densities predicted by the model matched the experimental measurements well at the end of each pre-strain level (Figure 7b,d). The rate of GND density increase was greater during plane-strain pre-strain, compared to the subsequent uniaxial tension test.
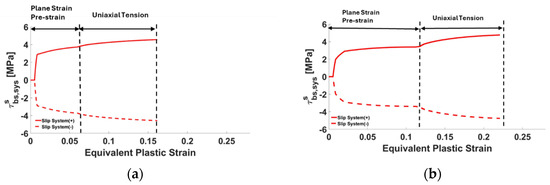
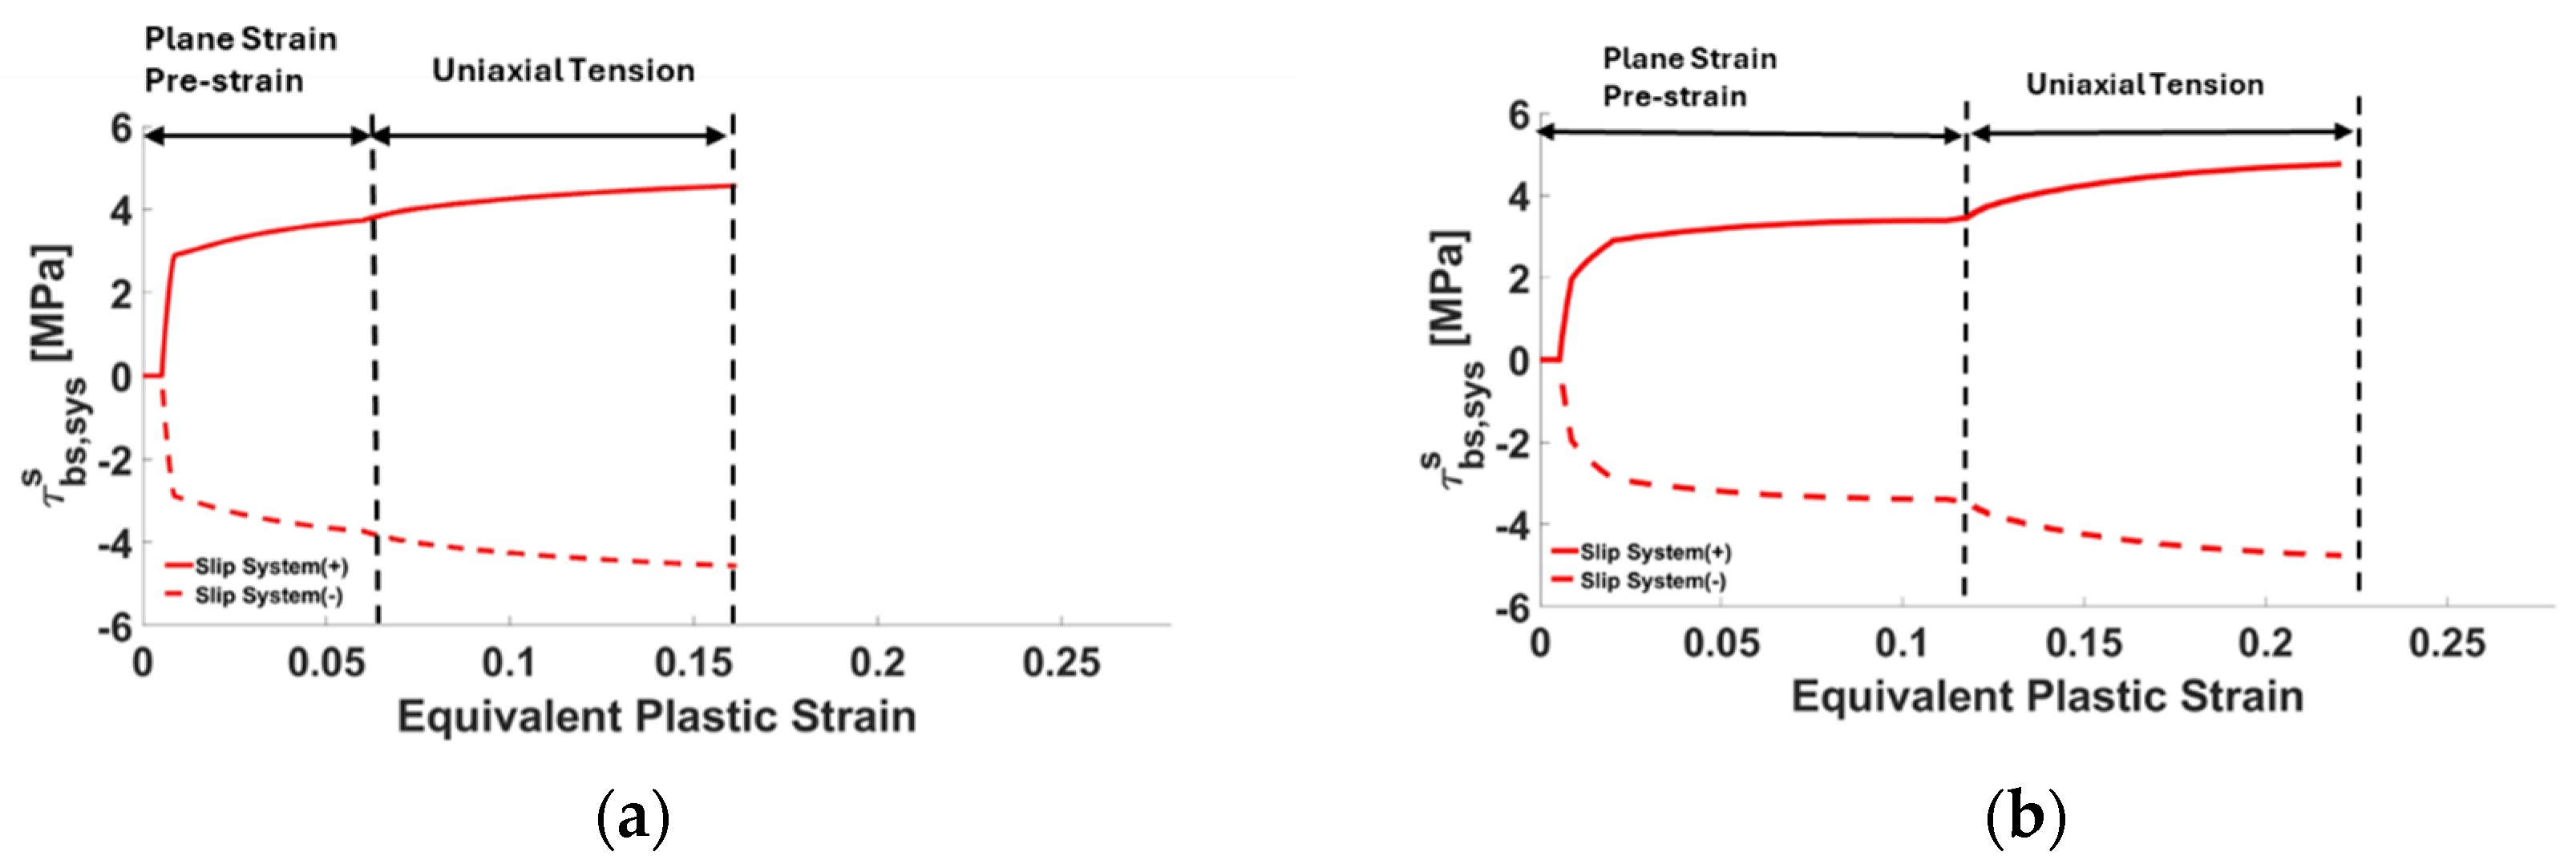
For both pre-strain levels, the backstress increases rapidly at the onset of plastic deformation during the plane-strain tension stage. This initial rapid increase reflects the strong strain gradients imposed by the plane-strain tension constraint, which promotes efficient generation of GNDs and associated long-range internal stresses. The flatter slope at higher equivalent strains during plane-strain tension shows a reduced rate of GND accumulation on the initially dominant system, consistent with the corresponding GND evolution trends shown in Figure 7. The transition to uniaxial tension shows a clear increase in backstress, which is more pronounced for the larger pre-strain case (Figure 8b). The jump reflects a redistribution of slip activity after a change in loading, requiring additional GND accumulation to accommodate the altered strain path.
Figure 8.
Evolution of backstress of the most active slip system in a randomly selected grain versus equivalent plastic strain of the macro specimen, for plane-strain tension pre-strain followed by uniaxial tension. For (a) 5% pre-strain (b) 11% pre-strain.
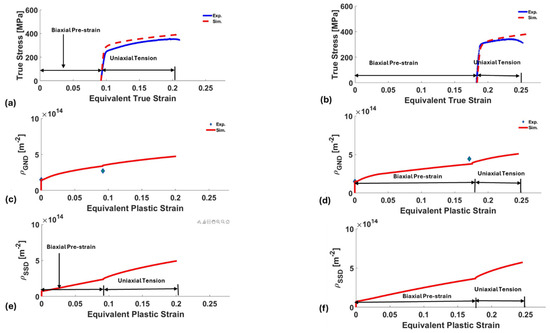
Results for sheets pre-strained in biaxial tension are shown in Figure 9. The predicted curves are regarded as good. The differences are attributed to some heterogeneities in the fields unavoidable in experiments, while homogeneous deformation boundary conditions are applied in the simulations. In these simulation cases, the total effective strain achieved for the pre-strain + uniaxial tension tests showed greater ductility than the plane-strain results from Figure 7, which is expected based on the forming limits for this alloy. A pre-strain of 0.09 effective strain yielded a subsequent uniaxial tension strain of 0.12, for a total effective strain of 0.21. A pre-strain of 0.18 yielded an additional uniaxial tensile strain of 0.07, for a total of 0.25 effective true strain.
Figure 9.
Comparison of experimental and predicted tensile curves after (a) 9% and (b) 18% biaxial tension pre-strains. GND density evolution for the (c) 9% and (d) 18% pre-strains followed by uniaxial tension. The blue diamond in both cases represents GND density measured via HR-EBSD, indicating good agreement with the GND from the simulation. SSD density evolution for the (e) 9% and (f) 18% pre-strains followed by uniaxial tension.
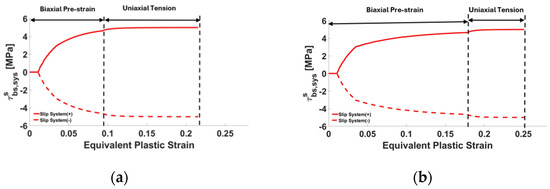
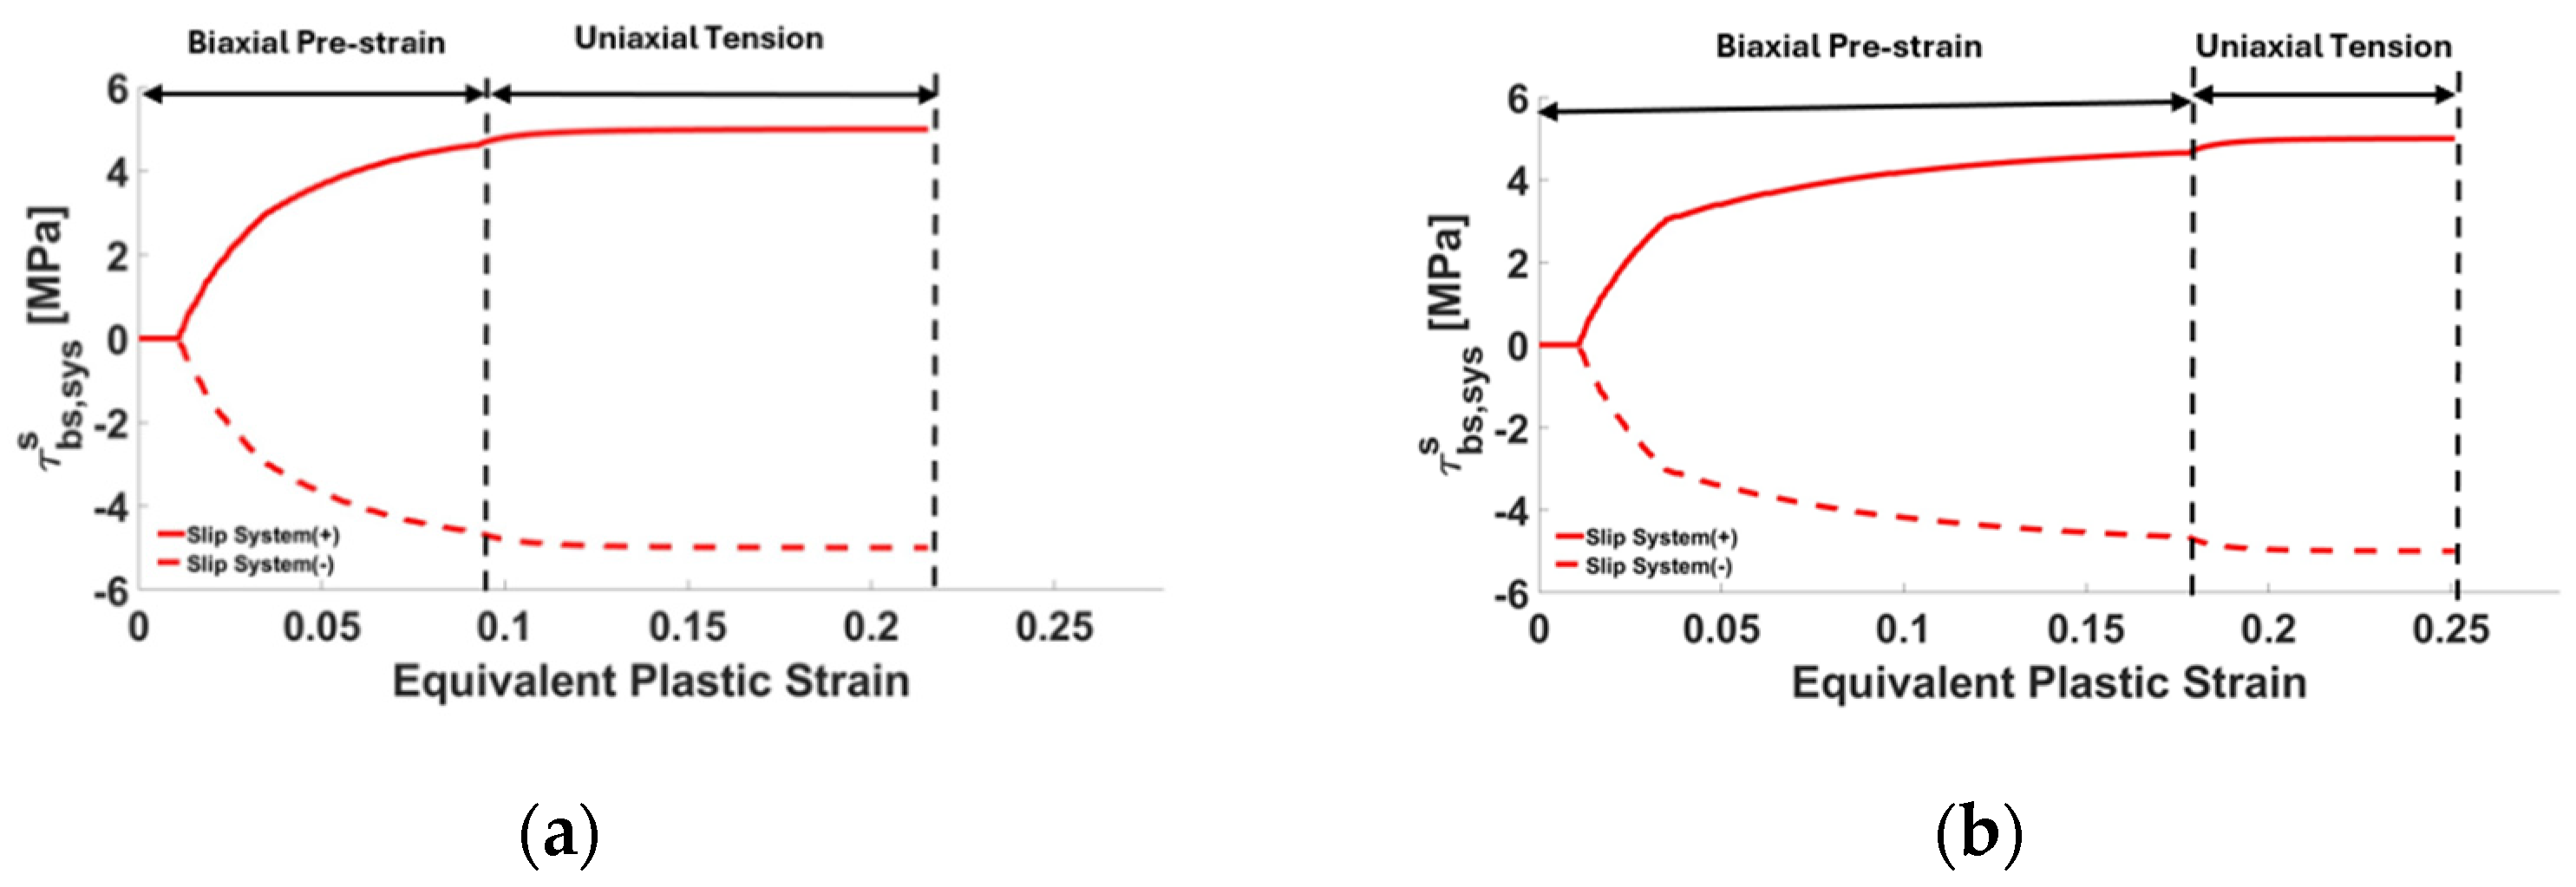
In contrast to GND density, SSD densities evolve more linearly with strain, as seen in the (e) 9% and (f) 18% cases. The backstress evolution for specimens pre-strained in biaxial tension, followed by uniaxial tension, is shown in Figure 10, plotted versus macroscopic equivalent plastic strain.
Figure 10.
Evolution of backstress in a randomly selected grain versus equivalent plastic strain of the macro specimen, for biaxial tension pre-strain followed by uniaxial tension. For (a) 9% pre-strain and (b) 18% pre-strain.
In contrast to the plane-strain pre-strain cases shown in Figure 8, the biaxial pre-strains promote a more gradual rise in backstress, with a smoother transition when the strain path switches to uniaxial tension. This indicates that biaxial tension produces a more homogeneous distribution of plastic deformation and GNDs across slip systems, resulting in a more isotropic internal stress state prior to the path change. Consequently, the redistribution of slip activity required during the transition to uniaxial tension is less abrupt, and the associated backstress evolution is smoother. Despite differences in the backstress development during the pre-strain and strain path-change stages, both plane-strain and biaxial pre-strained specimens converge to similar backstress magnitudes after the transition to uniaxial tension, saturating at about 4 MPa.
Given that the larger pre-strains imparted in biaxial tension were designed to be equivalent to the plane-strain pre-strains, from a forming limit perspective, it is interesting to note that the post pre-strain ductility in uniaxial tension is about the same in both cases. From a damage viewpoint, it appears that even though pre-strains were imparted using different strain paths, normalizing the pre-strain based on experimental forming limits for this alloy places the material in a similar condition from a damage perspective, as the “distance” from instability is similar in both cases, even though absolute pre-strains are different. This observation is partly supported by the dislocation densities measured after pre-strain and predicted by the model, i.e., the GND densities are about the same after FLD normalized equivalent pre-strains, even though absolute effective strains were different.
If stress triaxiality (η = σm/σeq) is considered when assessing the damage potential of the two pre-strain paths, the values are similar, but 15% higher in biaxial tension (η = 0.67) than in plane-strain tension (η = 0.58). As the microstructure of naturally aged AA 7021-T4 includes shearable precipitates (versus non-shearable that occur in the T6 condition and are sites for void nucleation) [4], the work hardening and associated GND densities seen in the two pre-strain cases provide equivalent conditions with respect to forming limits. Even at the higher pre-strain levels, it is unlikely that damage was initiated, in the form of voids; thus, the slightly larger triaxiality of the biaxial tension pre-strain case would not be a factor. Given that the pre-strains, even though different in magnitude, remained within the uniform strain condition (i.e., no onset of necking), it is reasonable that residual uniaxial tensile ductility was very similar for the two different pre-strain paths, being more correlated with GND density than absolute effective pre-strain levels.
5. Conclusions
The results of this study indicate that residual ductility after strain path changes is more closely linked to the development of a dislocation structure during pre-strain than to the absolute amount of pre-strain. In particular, the correlation between GND density and remaining tensile ductility suggests that GNDs provide a better measure of damage potential than strain magnitude alone. This explains why FLD-normalized pre-strains in biaxial and plane-strain tension produced similar levels of ductility, even though the imposed strain paths were different. It also suggests that traditional forming limit diagrams may be overly conservative when applied to AA7021-T4 under multiaxial forming conditions, versus monotonic deformation in plane-strain tension.
From a forming perspective, the results show that AA7021-T4 can accommodate multiaxial strain paths representative of industrial operations without exhausting ductility, as long as deformation remains in the uniform strain regime.
Finally, the good agreement between measured and predicted dislocation densities highlights the value of dislocation-based hardening laws in crystal plasticity models. Incorporating GND evolution and backstress into the SG-EPSC framework captures the strain path dependence observed experimentally and provides a basis for extending this approach to other precipitation-hardened aluminum alloys. The novel crystal plasticity framework is a powerful tool for process design of complex forming operations, aiding the ongoing campaign for lighter vehicles.
Author Contributions
Conceptualization, D.T.F., M.K. and M.P.M.; Methodology, D.T.F. and M.P.M.; Software, M.Z.S. and M.K.; Validation, M.Z.S., J.L. and M.P.M.; Formal Analysis, M.K. and M.P.M.; Investigation, M.Z.S., J.L., S.S., D.T.F., M.K. and M.P.M.; Data Curation, S.S.; Writing—Original Draft, M.P.M.; Writing—Review and Editing, M.Z.S., D.T.F. and M.K.; Supervision, David T. Fullwood, M.K. and M.P.M.; Project Administration, D.T.F., M.K. and M.P.M.; Funding Acquisition, D.T.F., M.K. and M.P.M. All authors have read and agreed to the published version of the manuscript.
Funding
This work was sponsored by the U.S. National Science Foundation under a GOALI grant CMMI-2147122 (UNH) and 2147126 (BYU).
Data Availability Statement
The original contributions presented in this study are included in the article. Further inquiries can be directed to the corresponding author.
Acknowledgments
Commonwealth Aluminum provided the sheets for this study.
Conflicts of Interest
The authors declare no conflicts of interest.
References
- Nolan, R.A. Microstructure Formability Relationships in New Generation High Strength Aluminium Automotive Alloys. Ph.D. Thesis, University of Manchester, Manchester, UK, 2015. [Google Scholar]
- Xiao, X.; Kim, C.I.; Lv, X.D.; Hwang, T.S.; Kim, Y.S. Formability and forming force in incremental sheet forming of AA7075-T6 at different temperatures. J. Mech. Sci. Technol. 2019, 33, 3795–3802. [Google Scholar] [CrossRef] [Scilit]
- Orowan, E. Symposium on the Internal Stresses in Metals and Alloys; Institute of Metals: London, UK, 1948. [Google Scholar]
- Engler, O. Effect of precipitation state on plastic anisotropy in sheets of the age-hardenable aluminium alloys AA 6016 and AA 7021. Mater. Sci. Eng. A Struct. Mater. Prop. Microstruct. Process. 2022, 830, 142324. [Google Scholar] [CrossRef] [Scilit]
- Milkereit, B.; Österreich, M.; Schuster, P.; Kirov, G.; Mukeli, E.; Kessler, O. Dissolution and Precipitation Behavior for Hot Forming of 7021 and 7075 Aluminum Alloys. Metals 2018, 8, 531. [Google Scholar] [CrossRef] [Scilit]
- Behrens, B.-A.; Hübner, S.; Vogt, H.; Golovko, O.; Behrens, S.; Nürnberger, F. Mechanical properties and formability of EN AW-7075 in cold forming processes. In Proceedings of the IOP Conference Series: Materials Science and Engineering, Virtual, 19 November 2020; Purpose-Led Publishing: Melville, NY, USA; College Park, MD, USA; Bristol, UK, 2020; p. 8. [Google Scholar]
- Guo, S.L.; Song, Y.L.; Wu, Y.H.; Hu, J.H.; Lu, J.; Wang, C.J.; Jia, Z.C.; Hua, L. Microscopic mechanism of enhanced strength-plasticity synergy in pre-damaged TC11 titanium alloys via novel electroshock treatment. J. Alloys Compd. 2026, 1052, 186139. [Google Scholar] [CrossRef] [Scilit]
- Feng, Z.; Knezevic, M. Strain-gradient elasto-plastic self-consistent crystal plasticity: Applications to predicting the evolution of geometrically necessary dislocations and size sensitive mechanical response. Acta Mater. 2025, 291, 121001. [Google Scholar] [CrossRef] [Scilit]
- Riyad, I.A.; Knezevic, M. A new strain gradient viscoplastic self-consistent crystal plasticity model for predicting geometrically necessary dislocations and length-scale dependent mechanical response. Int. J. Eng. Sci. 2025, 217, 104396. [Google Scholar] [CrossRef] [Scilit]
- Sharma, R.; Marki, R.; Webb, A.; Knezevic, M.; Miles, M.P.; Fullwood, D.T. Strain-gradient crystal plasticity model with slip-system level GND tracking: Simulation vs experiment for sequential strain path change in AA6016-T4. Materialia 2024, 38, 102304. [Google Scholar] [CrossRef] [Scilit]
- Sanderson, S.G.; Najmabad, S.I.; Sharma, R.; Neville, T.; Webb, A.; Miles, M.P.; Knezevic, M.; Fullwood, D.T. Observation and modeling of strain gradients in AA6016—Influence of length-scale, microstructure, and strain path. Mater. Charact. 2025, 222, 114843. [Google Scholar] [CrossRef] [Scilit]
- Mirihanage, W.U.; Robson, J.D.; Mishra, S.; Hidalgo-Manrique, P.; da Fonseca, J.Q.; Daniel, C.S.; Prangnell, P.B.; Michalik, S.; Magdysyuk, O.; Connolley, T.; et al. Direct observation of the dynamic evolution of precipitates in aluminium alloy 7021 at high strain rates via high energy synchrotron X-rays. Acta Mater. 2021, 205, 116532. [Google Scholar] [CrossRef] [Scilit]
- Ruggles, T.J.; Fullwood, D.T. OpenXY, Version 1.0; Brigham Young University: Provo, UT, USA, 2015. Available online: https://github.com/BYU-MicrostructureOfMaterials/OpenXY (accessed on 11 March 2026).
- Hill, R. Continuum micro-mechanics of elastoplastic polycrystals. J. Mech. Phys. Solids 1965, 13, 89–101. [Google Scholar] [CrossRef] [Scilit]
- Turner, P.A.; Tomé, C.N. A study of residual stresses in Zircaloy-2 with rod texture. Acta Metall. Mater. 1994, 42, 4143–4153. [Google Scholar] [CrossRef] [Scilit]
- Neil, C.J.; Wollmershauser, J.A.; Clausen, B.; Tomé, C.N.; Agnew, S.R. Modeling lattice strain evolution at finite strains and experimental verification for copper and stainless steel using in situ neutron diffraction. Int. J. Plast. 2010, 26, 1772–1791. [Google Scholar] [CrossRef] [Scilit]
- Zecevic, M.; Knezevic, M. An implicit formulation of the elasto-plastic self-consistent polycrystal plasticity model and its implementation in implicit finite elements. Mech. Mater. 2019, 136, 103065. [Google Scholar] [CrossRef] [Scilit]
- Eshelby, J.D. The determination of the elastic field of an ellipsoidal inclusion, and related problems. Proc R. Soc. Lond. A 1957, 241, 376–396. [Google Scholar] [CrossRef] [Scilit]
- Daroju, S.; Kuwabara, T.; Sharma, R.; Fullwood, D.T.; Miles, M.P.; Knezevic, M. Experimental characterization and crystal plasticity modeling for predicting load reversals in AA6016-T4 and AA7021-T79. Int. J. Plast. 2022, 153, 103292. [Google Scholar] [CrossRef] [Scilit]
- Feng, Z.; Knezevic, M. Field fluctuations elasto-plastic self-consistent crystal plasticity: Applications to predict texture evolution during rolling, recrystallization, and drawing processes. Mech. Res. Commun. 2025, 148, 104489. [Google Scholar] [CrossRef] [Scilit]
- Zecevic, M.; Lebensohn, R.A.; McCabe, R.J.; Knezevic, M. Modeling of intragranular misorientation and grain fragmentation in polycrystalline materials using the viscoplastic self-consistent formulation. Int. J. Plast. 2018, 109, 193–211. [Google Scholar] [CrossRef] [Scilit]
- Lebensohn, R.A.; Zecevic, M.; Knezevic, M.; McCabe, R.J. Average intragranular misorientation trends in polycrystalline materials predicted by a viscoplastic self-consistent approach. Acta Mater. 2016, 104, 228–236. [Google Scholar] [CrossRef] [Scilit]
- Lebensohn, R.A.; Tomé, C.N.; Castaneda, P.P. Self-consistent modelling of the mechanical behaviour of viscoplastic polycrystals incorporating intragranular field fluctuations. Philos. Mag. 2007, 87, 4287–4322. [Google Scholar] [CrossRef] [Scilit]
- Zecevic, M.; Lebensohn, R.A.; McCabe, R.J.; Knezevic, M. Modelling recrystallization textures driven by intragranular fluctuations implemented in the viscoplastic self-consistent formulation. Acta Mater. 2019, 164, 530–546. [Google Scholar] [CrossRef] [Scilit]
- Riyad, I.A.; Knezevic, M. Field fluctuations viscoplastic self-consistent crystal plasticity: Applications to predicting texture evolution during deformation and recrystallization of cubic polycrystalline metals. Acta Mater. 2023, 261, 119395. [Google Scholar] [CrossRef] [Scilit]
- Gurtin, M.E. A gradient theory of single-crystal viscoplasticity that accounts for geometrically necessary dislocations. J. Mech. Phys. Solids 2002, 50, 5–32. [Google Scholar] [CrossRef] [Scilit]
- Nye, J.F. Some geometrical relations in dislocated crystals. Acta Metall. 1953, 1, 153–162. [Google Scholar] [CrossRef] [Scilit]
- Leff, A.C.; Weinberger, C.R.; Taheri, M.L. Estimation of dislocation density from precession electron diffraction data using the Nye tensor. Ultramicroscopy 2015, 153, 9–21. [Google Scholar] [CrossRef] [Scilit] [PubMed]
- Gurtin, M.E.; Anand, L. A theory of strain-gradient plasticity for isotropic, plastically irrotational materials. Part II: Finite deformations. Int. J. Plast. 2005, 21, 2297–2318. [Google Scholar] [CrossRef] [Scilit]
- Arora, R.; Zhang, X.; Acharya, A. Finite element approximation of finite deformation dislocation mechanics. Comput. Methods Appl. Mech. Eng. 2020, 367, 113076. [Google Scholar] [CrossRef] [Scilit]
- Das, S.; Hofmann, F.; Tarleton, E. Consistent determination of geometrically necessary dislocation density from simulations and experiments. Int. J. Plast. 2018, 109, 18–42. [Google Scholar] [CrossRef] [Scilit]
- Kapoor, K.; Yoo, Y.S.J.; Book, T.A.; Kacher, J.P.; Sangid, M.D. Incorporating grain-level residual stresses and validating a crystal plasticity model of a two-phase Ti-6Al-4 V alloy produced via additive manufacturing. J. Mech. Phys. Solids 2018, 121, 447–462. [Google Scholar] [CrossRef] [Scilit]
- Feng, Z.; Pokharel, R.; Vogel, S.C.; Lebensohn, R.A.; Pagan, D.; Zepeda-Alarcon, E.; Clausen, B.; Martinez, R.; Gray, G.T.; Knezevic, M. Crystal plasticity modeling of strain-induced martensitic transformations to predict strain rate and temperature sensitive behavior of 304 L steels: Applications to tension, compression, torsion, and impact. Int. J. Plast. 2022, 156, 103367. [Google Scholar] [CrossRef] [Scilit]
- Beyerlein, I.J.; Tomé, C.N. A dislocation-based constitutive law for pure Zr including temperature effects. Int. J. Plast. 2008, 24, 867–895. [Google Scholar] [CrossRef] [Scilit]
- Franciosi, P.; Zaoui, A. Multislip in f.c.c. crystals a theoretical approach compared with experimental data. Acta Metall. 1982, 30, 1627–1637. [Google Scholar] [CrossRef] [Scilit]
- Khadyko, M.; Dumoulin, S.; Cailletaud, G.; Hopperstad, O.S. Latent hardening and plastic anisotropy evolution in AA6060 aluminium alloy. Int. J. Plast. 2016, 76, 51–74. [Google Scholar] [CrossRef] [Scilit]
- Kocks, U.F.; Mecking, H. Kinetics of Flow and Strain-Hardening. Acta Metall. 1981, 29, 1865–1875. [Google Scholar]
- Kitayama, K.; Tomé, C.N.; Rauch, E.F.; Gracio, J.J.; Barlat, F. A crystallographic dislocation model for describing hardening of polycrystals during strain path changes. Application to low carbon steels. Int. J. Plast. 2013, 46, 54–69. [Google Scholar] [CrossRef] [Scilit]
- Zecevic, M.; Knezevic, M. Latent hardening within the elasto-plastic self-consistent polycrystal homogenization to enable the prediction of anisotropy of AA6022-T4 sheets. Int. J. Plast. 2018, 105, 141–163. [Google Scholar] [CrossRef] [Scilit]
- Wen, W.; Borodachenkova, M.; Tomé, C.; Vincze, G.; Rauch, E.; Barlat, F.; Grácio, J. Mechanical behavior of Mg subjected to strain path changes: Experiments and modeling. Int. J. Plast. 2015, 73, 171–183. [Google Scholar] [CrossRef] [Scilit]
- Marki, R.E.; Knezevic, M. Nonlinear optimization for compact representation of orientation distributions based on generalized spherical harmonics. J. Mech. Phys. Solids 2024, 187, 105609. [Google Scholar] [CrossRef] [Scilit]

Disclaimer/Publisher’s Note: The statements, opinions and data contained in all publications are solely those of the individual author(s) and contributor(s) and not of MDPI and/or the editor(s). MDPI and/or the editor(s) disclaim responsibility for any injury to people or property resulting from any ideas, methods, instructions or products referred to in the content. |
© 2026 by the authors. Licensee MDPI, Basel, Switzerland. This article is an open access article distributed under the terms and conditions of the Creative Commons Attribution (CC BY) license.