


Abstract
To improve the stability of ohmic contacts for SiC sensor chips operating at 600 °C, SiC/Ti/TaSi2/Pt ohmic contact stacks were fabricated on n-type 4H-SiC in this work. The effects of the Ti/TaSi2/Pt thickness ratio and annealing conditions on electrode performance were systematically investigated, and the resulting electrodes were characterized via SEM, XRD and AES. The results show that a lower specific contact resistivity (SCR) (7.16 × 10⁻⁵ Ω·cm2) is obtained after the Ti/TaSi2/Pt ratio of 1:3:2 (50/150/100 nm) is rapidly annealed at 1050 °C. The SCR remains 3.05 × 10⁻⁴ Ω·cm2 after 20 h of atmospheric aging at 600 °C, and the electrode surface remains flat enough for the subsequent processes. Taken together, the XRD and AES results suggest that the formation of well-crystallized TiC/TaC and Si-enriched titanium silicides lowers the specific contact resistance, and that the thermally stable phases, such as TaC, hinder oxygen ingress, which is consistent with the observed high-temperature stability. In contrast, oxygen penetrates into the contact interface and forms TiO2, an insulating oxide that increases the contact resistance and thereby degrades the contact performance. The results provide a basis for the design of ohmic contacts for high-temperature silicon carbide sensors.
1. Introduction
Engines used in high-temperature environments require real-time detection of parameters such as temperature and pressure to ensure proper operation of the equipment, so the corresponding sensors must be resistant to high temperatures for a long period of time. The performance of Si-based sensors is stable and widely used, but the plastic deformation of Si at high temperatures and leakage of electrical current can lead to the failure of the sensors, which are not suitable for high-temperature environments [1,2]. 4H-SiC, as one of the most common SiC crystal types [3,4], has excellent properties such as wide band gap (3.2 eV), high critical electric field (3 MV/cm), and high thermal conductivity (4.9 W/(cm·K)) [5,6,7], which allow 4H-SiC-based devices to operate in high-power, high-frequency, and high-temperature environments [8], and the performance is far superior to that of the Si-based counterparts sensors. The excellent semiconductor properties of 4H-SiC improve the efficiency of high-power conversion systems in many applications (power supplies, industrial motor control, electric vehicles, power distribution, transportation, etc.) [9].
The development of silicon carbide devices applied to high-temperature environments has made significant breakthroughs within the past decade, but there are still numerous challenges, such as its difficulty in etching [10], poor high-temperature stability of the ohmic contact and difficulty in realizing high-temperature packaging solutions [11], which have directly constrained the application of silicon carbide devices. Ohmic contact, as a key process in sensor fabrication, has a direct impact on sensor output, sensitivity, and linearity [12,13], and the main reason for the degradation of sensor performance at high temperatures is the deterioration of the performance of the metal-semiconductor ohmic contact [14,15]. Ohmic contact implies that the interface contact between the metal and the semiconductor is purely resistive in character, the current voltage (I–V) characteristic should be linear [16], and the resistance needs to be as small as possible. The electrical performance of Ohmic contact is generally measured using the SCR [17], where the smaller the value, the better the electrical performance of the ohmic contact. Electrode flatness affects the preparation of subsequent process leads, so the preparation of ohmic contact electrodes with low SCR and high electrode flatness is considered as a goal. Meanwhile, in order to work at high temperature for a long time, the high-temperature stability of the ohmic contact is crucial, which requires as little change in SCR as possible after high temperature operation [18,19,20]. In order to realize the preparation of high-temperature mems sensors, the longer stable ohmic contact at 600 °C needs to be solved urgently.
For N-type SiC, various metal systems with Ni as the contact metal have been widely studied [21,22,23,24,25]. For its high temperature stability, Lei Cheng et al. investigated Ni/Al/Au as an ohmic contact metal [26], and obtained a SCR value of 2.9 × 10⁻⁴ Ω·cm2 under vacuum at 950 °C, and demonstrated the stability at 400 °C. V.V. Cuong et al. showed that the ohmic contact formed by Ni/Nb with n-type 4H-SiC was able to continue to work stably for 100 h at 400 °C under nitrogen [27]. However, there are few cases of Ni and SiC ohmic contact applied at 600 °C for a long time in the studies. In its early papers, NASA was the first to apply the Ti/TaSi2/Pt metal combination to form high-temperature ohmic contacts with SiC [28,29]. Wu Chen et al. [30] studied the high-temperature evolution of N-type 4H-SiC with two metal systems, Ti/TaSi2/Pt and Ni/W, to explain the reasons for the formation of ohmic contact and the failure mechanism, and their study pointed out that the Ni-based metal ohmic contact could not work for a long period of time at 600 °C. Although previous studies have demonstrated the feasibility of Ti-based ohmic contacts at 600 °C, this work—focusing on the n-type 4H-SiC epitaxial structure and the range of film thicknesses employed—aims to further elucidate the ohmic contact stabilization mechanisms under varying metal layer thicknesses and annealing conditions, thereby establishing a more robust foundation for practical high-temperature sensor applications.
In this study, based on SiC/Ti/TaSi2/Pt metal combinations, electrodes with different thickness ratios and annealing conditions are designed to prepare the electrodes, and 600 °C 20 h atmospheric aging tests are performed on the metal electrodes. Using the semiconductor analyzer to test the I–V characteristics and calculating SCR using the transmission line method (TLM), Scanning Electron Microscopy (SEM), X-ray Diffraction (XRD) and Auger Electron Spectroscopy (AES) are used to test the microscopic changes in the ohmic contact electrode after annealing and high-temperature aging. The effects of different metal layer thicknesses and annealing temperatures on the quality of the ohmic contact and high-temperature stability are analyzed, and the possible origins of the differences are discussed. Optimal conditions for the fabrication of Ti/TaSi2/Pt ohmic contact electrodes may be obtained through this study, which will provide a research basis for the realization of stable ohmic contact at 600 °C, thereby solving the high-temperature sensor stability issue.
2. Experimental Detail
2.1. Materials, Methods and Electrode Fabrication
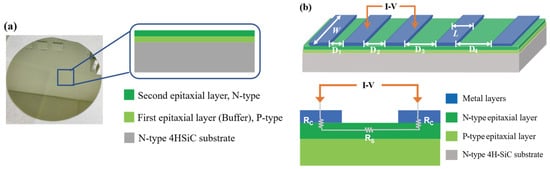
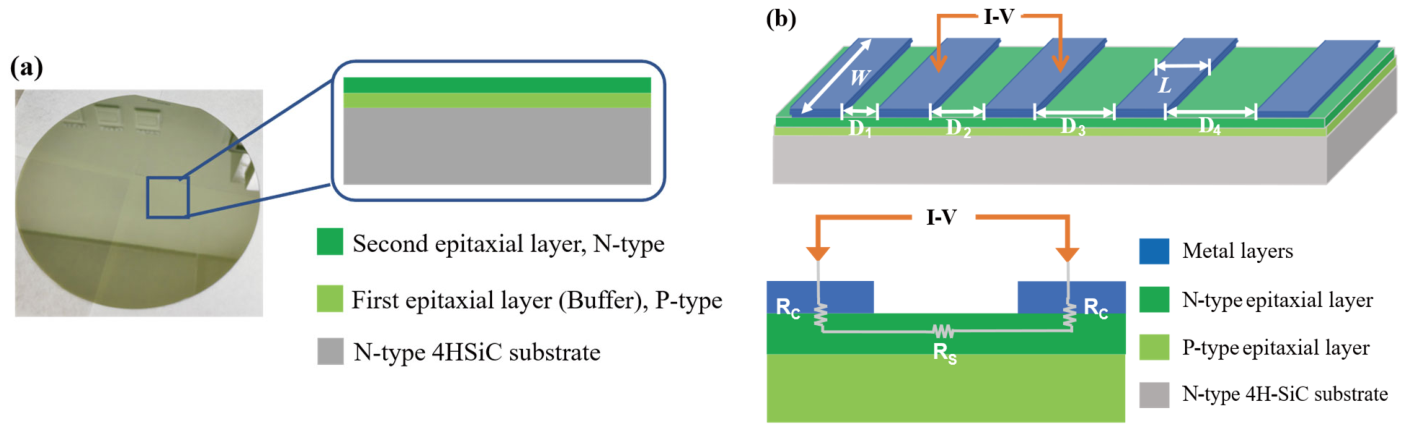
The SiC wafers for making ohmic contact are selected from the structure of NPN-type SiC epitaxial wafers produced by TYSiC Co., Ltd. China. The structure is shown in Figure 1a, with a 2 μm top epitaxial layer concentration ND of 1 × 1019 cm−3, a 2 μm buffer epitaxial layer concentration NA of 1 × 1018 cm−3, and a conductive SiC sheet as the substrate. A heavily doped epitaxial layer is selected as the substrate layer for ohmic contacts. Under this condition, charge transport is dominated by thermionic field emission (TFE), which facilitates the formation of ohmic contacts [31]. The top epitaxial layer and the buffer layer form a PN node isolation, which effectively reduces the substrate leakage current. The transmission line method (TLM) is used to fabricate the ohmic contacts to obtain the SCR, and the TLM model consists of a series of metal electrodes [32] with capital W in width and capital L in length [33] at a gradually increasing distance Dn. Figure 1b shows the structure and equivalent circuit of the transmission line method.
Figure 1.
Materials, methods and electrode fabrication. (a) Schematic of NPN-type epitaxial wafer structure; (b) Schematic of transmission line method (TLM) and equivalent circuit.
The I–V characteristic between adjacent electrodes is tested using the semiconductor analyzer to obtain the total resistance RT. The relationship between RT and electrode spacing Dn can be expressed as Equation (1):
Rc is the metal-semiconductor contact resistance and RS is the semiconductor thin-layer resistance. Using Dn as the horizontal coordinate and RT as the vertical coordinate, the experimental measurement RT-Dn should be approximately linear and the slope and intercept of the straight line can be used to obtain RS and Rc, which in turn can be used to calculate the SCR. Ultimately, the SCR value can be calculated by Equation (2):
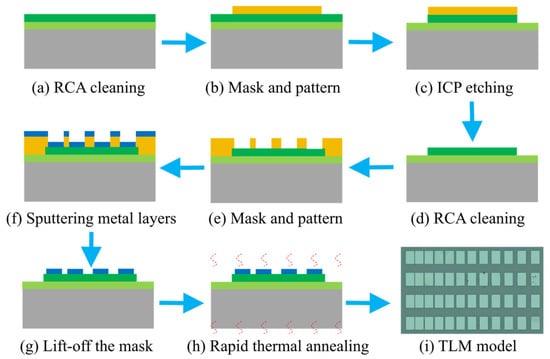
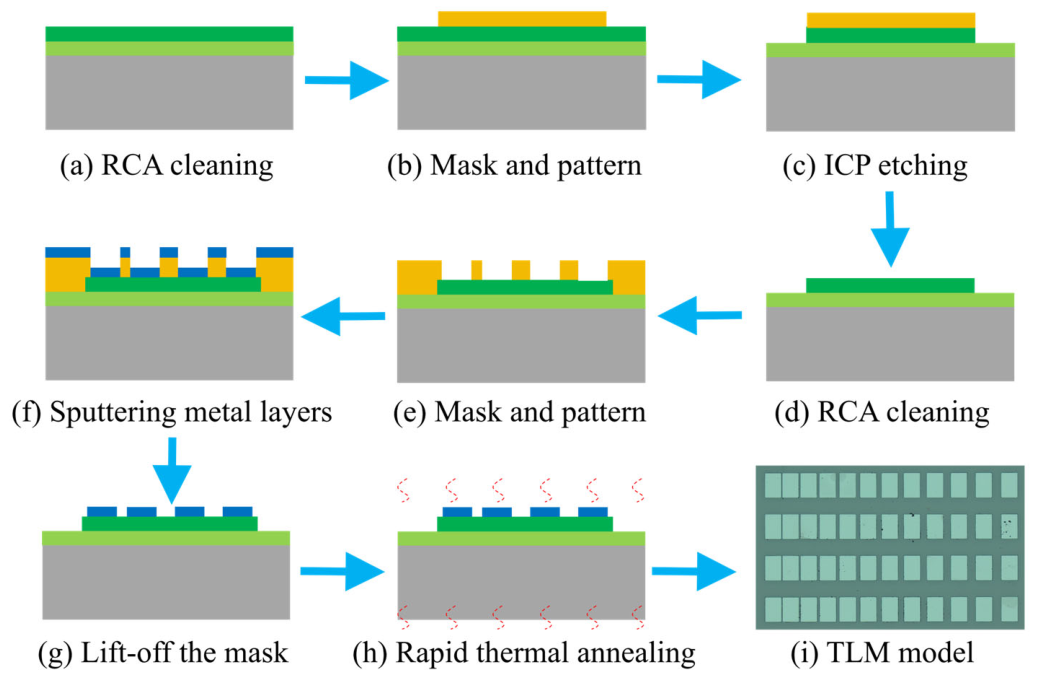
The TLM transmission line model used in this study has dimensions of 150 μm × 100 μm, with spacing from left to right of 5 μm, 10 μm, 15 μm … 55 μm. Each set of test units contains four such transmission line models. Figure 2 shows the process of TLM ohmic contact manufacturing and aging test. The standard RCA cleaning process is used to clean the NPN-type SiC wafer. Deionized water is then used to clean the surface of the sample, and the sample is then rinsed with deionized water and blown dry with nitrogen. The entire above processes are shown in (a). To avoid current dispersion, the photoresist is graphically patterned by the photolithography process, serving as a shallow etching mask for the SiC etching. The N-type layer on the surface of the SiC epitaxial wafer is etched by Inductively Coupled Plasma (ICP) etching to achieve isolation between TLMs. The entire above processes are shown in (b,c). After the etching is completed, the photoresist is removed by RCA cleaning, and the surface is treated with plasma, as shown in process (d). Subsequently, photolithography is used to pattern the photoresist, and the Ti/TaSi2/Pt multilayer film is sputtered as electrodes using the EXPLORED magnetron sputtering machine. The multilayer coating on the photoresist is eliminated through the lift-off process. The entire above processes are shown in (e–g). Finally, rapid thermal annealing (RTA) at elevated temperatures is performed in an RTP-500 V rapid thermal annealing system to form the ohmic contact, as shown in process (h). The fabricated TLM model is shown in (i). After fabricating the Ohmic contacts, the prepared electrodes were placed in a high-temperature furnace to undergo a high-temperature aging test at 600 °C under ambient pressure in order to verify their high-temperature stability.
Figure 2.
Ohmic contact manufacturing process. (a) The standard RCA cleaning solutions are Solution #3 (H2SO4:H2O2 = 3:1 at 150 °C for 30 min) and Solution #1 (NH4OH:H2O2:DIW = 1:2:7 at 60 °C for 5 min). (c) ICP etching parameters are SF6 50 sccm/O2 10 sccm/4.0 Pa/RF Power 200W. (f) Sputtering parameters are DC power 400 W/ Ar 30 sccm.
2.2. Meta-Experimental Conditions
2.2.1. Experimental Settings of Ti/TaSi2/Pt Ratios
The composition ratios of Ti:TaSi2:Pt multilayer metal electrodes were classified as 1:2:2, 1:3:2, 1:4:2, and 2:3:2 in order to investigate the ohmic contact characteristic and high-temperature stability under different component ratios. The deposition thicknesses of the ratios 1:2:2, 1:3:2, 1:4:2, and 2:3:2 were 50/100/100 nm, 50/150/100 nm, 50/200/100 nm, and 100/150/100 nm respectively.
2.2.2. Designed Annealing Temperatures
Ti/TaSi2/Pt multilayer film electrodes need to be thermally annealed at high temperatures to form ohmic contacts. In order to investigate the effects of annealing parameters on the ohmic contact characteristics and high-temperature stability, the annealing temperatures were selected and a temperature gradient was used to anneal the test pieces at 950 °C, 1000 °C, 1050 °C and 1100 °C, respectively. The RTA time was 2 min at all four temperatures, and the samples were cooled to room temperature in the RTA chamber immediately after annealing. The aged samples were subsequently kept in a box furnace at 600 °C for 20 h in ambient air at atmospheric pressure and were cooled to room temperature in air before the electrical measurements.
2.3. Characterization
The surface morphology of the electrodes was examined by scanning electron microscopy (SEM) at an accelerating voltage of 10 kV, using an InLens detector at a working distance of 8 mm and a magnification of 20,000; the specimen surface was connected to the sample holder with conductive adhesive to avoid charging caused by the p–n junction. The crystalline phases were identified by X-ray diffraction (XRD) on a Bruker D8 Discover diffractometer with Cu Kα radiation (λ = 0.15406 nm) in the θ–2θ mode; the patterns were recorded from 10° to 90° in 2θ with a step size of 0.0195°, and the phases were identified using the ICDD PDF database, with the PDF cards given in Table 2.
The AES profiles were acquired after the aging test, i.e., after 20 h at 600 °C in air, in order to determine where oxygen is retained in the electrode stack after aging; the nominal layer sequence of the deposited stack serves as the reference for the as-deposited state.
3. Results and Discussion
3.1. Variation in Ti/TaSi2/Pt Ratios
The sputtered metal electrodes were annealed by RTA at 1000 °C for 2 min, following the annealing parameters of previous studies [30]. The I–V characteristics were measured with a semiconductor characterization analyzer, and all four conditions yielded ohmic contacts. Table 1 lists the SCR after annealing for the different metal layer ratios, and the SCR reaches its minimum when the ratio of the metal layers is 1:3:2. In order to verify the high-temperature stability of the ohmic contact electrodes, the samples were tested in air at 600 °C for 20 h, and the SCR values after the aging test are also listed in Table 1. The SCR increases after 20 h, indicating that the ohmic contact characteristics deteriorate. The 1:2:2 sample yielded a non-ohmic contact. In contrast, both the 1:3:2 and 1:4:2 electrodes exhibited only minor variations in SCR after aging, indicating superior high-temperature stability. Among them, the 1:3:2 electrode maintained the lowest ρc post-test, which makes it the selected configuration in this work.
Table 1.
Specific contact resistivities of the Ti/TaSi2/Pt electrodes with different thickness ratios after RTA at 1000 °C for 2 min and after the subsequent aging test at 600 °C for 20 h in air.
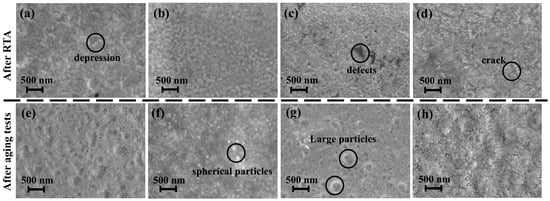
Figure 3a–h shows the surface morphology of the electrodes after RTA (a–d) and after the aging test (e–h), as observed by SEM at a magnification of 20,000. During the SEM observation the emphasis was placed on the surface morphology rather than on three-dimensional information, and the samples were connected to the sample stage with conductive adhesive because of the p–n junction. After RTA, the surface of the 1:2:2 electrode is more undulating, with large depressions and micro-cracks in some areas; the lateral sizes of these features, estimated from the magnification of the micrographs (20,000×), range from a few hundred nanometers to about one micrometer, and the micro-cracks are of the order of 100 nm wide. This result is consistent with the thermal expansion mismatch between the metal layers and the substrate during RTA, an effect that is expected to be more pronounced for a thinner TaSi2 layer. This phenomenon becomes less pronounced when TaSi2 is thickened, which is attributed to the better thermal stability of TaSi2. After increasing its thickness, the depressions on the electrode surface disappear, the particles are distributed more uniformly, the particle size is reduced, and the roughness of the metal surface decreases. When TaSi2 is thin, the high temperature annealing causes the metal electrode film to react violently, with the metal layer aggregating and appearing as a bulge in some positions, and the metal layer thinning and appearing as a depression in the surrounding positions. As TaSi2 is thickened, the thermal stability of the electrode is improved, and the outer metal layer can stably cover the contact metal at high temperatures. However, when the thickness of TaSi2 is further increased, the stress release during annealing may become insufficient at some locations, which may lead to localized film delamination and to the formation of defects, so that the number of small metal particles on the surface of the metal layer increases. When the thickness of the outer two layers of protective metal is unchanged, after the contact metal Ti is thickened, the surface flatness of the electrode decreases significantly, and even shallow cracks appear, which may be related to the different coefficients of thermal expansion of Ti and TaSi2, giving rise to a thermal stress mismatch that becomes more pronounced as the thickness of Ti increases. When the metal layer ratio is 1:3:2, the electrode surface is flatter, without obvious breakage and defects. The particles are more homogeneous, and the electrode quality is higher, which may also be one of the reasons for its lower SCR.
Figure 3.
Electrode surfaces at different Ti/TaSi2/Pt ratios. (a) 1:2:2 (50/100/100 nm), after RTA. (b) 1:3:2 (50/150/100 nm), after RTA. (c) 1:4:2 (50/200/100 nm), after RTA. (d) 2:3:2 (100/150/100 nm), after RTA. (e) 1:2:2 (50/100/100 nm), after aging test. (f) 1:3:2 (50/150/100 nm), after aging test. (g) 1:4:2 (50/200/100 nm), after aging test. (h) 2:3:2 (100/150/100 nm), after aging test.
The morphology of the electrodes changes markedly after the aging test, with a sharp increase in surface roughness and significant aggregation of surface particles. Compared to the surface after RTA, the 1:2:2 ratio metal layer shows obvious cracks and a lot of mound-like morphology. This may be a result of the long-time aging, which releases part of the film stress and allows cracking and healing of the film, while stress concentration remains in some areas and is manifested as mounded bumps. As the thickness of TaSi2 increases, the surface cracks disappear after the test and the surface tends to be complete; however, compared with the pre-test, a large number of spherical particles appear on the surface. When the thickness of TaSi2 increases to 200 nm, abnormal grain coarsening occurs after the aging test, forming large-sized particles and pinhole defects, and the surface flatness decreases dramatically. For the electrode with a metal layer thickness ratio of 2:3:2, a corrugated morphology appeared on the surface after the aging test, accompanied by a large number of particles aggregated in the depressions, which seems to be a result of the further evolution of the surface cracks after RTA, and the film enters into a destabilized state. Except for the metal electrode with a 1:3:2 ratio, which has a relatively intact surface, the surface of the electrodes with the remaining metal layer ratios shows different degrees of destabilization, such as cracks or large particle aggregates. Such destabilized electrodes seriously affect the subsequent process steps. These morphological changes are consistent with the SCR data in Table 1: the 1:2:2 and 2:3:2 samples, which develop cracks, pinholes or large particle aggregates during aging, show the largest increase in SCR, whereas the 1:3:2 sample, whose surface remains continuous, shows the smallest change.
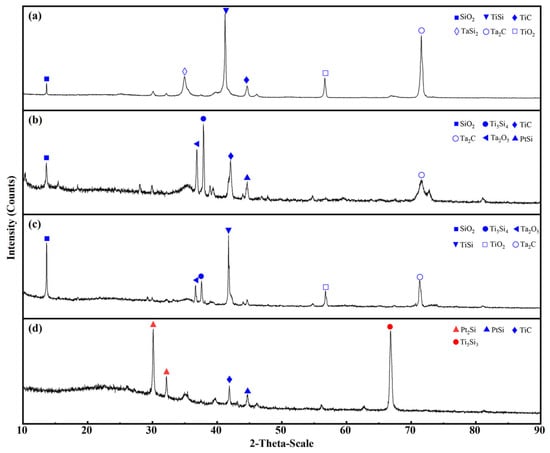
Figure 4 shows the XRD θ–2θ patterns (Bruker D8 Discover, Cu Kα) that were used to identify the reaction phases in the electrodes after high-temperature aging; the reflections used for the phase assignment are indexed in Table 2. When the TaSi2 layer was thinner (1:2:2), reflections of rutile TiO2 appeared, which indicates that oxygen penetrated the thinner TaSi2 layer and reached the Ti layer; this is consistent with the crack and mound-like morphologies observed by SEM and with the significant increase in SCR after aging. When the TaSi2 layer was increased to 150 nm (1:3:2), reflections from conductive phases, including TiC, TaC, Ti5Si4, and Pt silicides, became more prominent. This is consistent with more thorough interfacial reactions and enhanced outward diffusion of carbon; carbon atoms migrated outward from the substrate to form TiC with Ti, leaving carbon vacancies in the SiC lattice, which may be related to the formation of an ohmic contact [30]. At the same time, the formation of TaC helps block oxygen diffusion; therefore, this composition exhibits the lowest SCR both initially and after aging. When TaSi2 was further increased to 200 nm (1:4:2), Si-enriched titanium silicides and Ta carbides were still present; however, the XRD peak features and SEM-observed surface defects indicated a deterioration in the reaction/stress balance, with abnormal grain coarsening and pinholes limiting further performance improvement. When the Ti layer was thickened to 100 nm (2:3:2), reflections associated with Pt2Si and Ti5Si3 became more prominent, suggesting that an excess of Ti altered the reaction pathways and exacerbated the thermal expansion mismatch between Ti and TaSi2, resulting in rippled morphology and particle agglomeration; the SCR further increased after aging. Therefore, the differences in SCR cannot be attributed to any single compound but are better explained by the combined effects of three factors: whether a conductive carbide/silicide network forms, whether TaC oxygen blocking is effective, and whether the surface structure is stable. The advantage of the 1:3:2 composition lies in its more complete interfacial reaction, effective oxygen blocking, and well-matched coverage and structural stability.
Figure 4.
XRD θ–2θ patterns of the Ti/TaSi2/Pt electrodes with different thickness ratios after 20 h aging at 600 °C in air: (a) 1:2:2 (50/100/100 nm); (b) 1:3:2 (50/150/100 nm); (c) 1:4:2 (50/200/100 nm); (d) 2:3:2 (100/150/100 nm).
Table 2.
Crystalline phases identified in this work, the corresponding ICDD PDF cards and the reflections used for the phase assignment. The 2θ values refer to the reflections marked in Figures 4 and 6; hkl indices are given for the reflections that do not overlap with reflections of other phases. The tantalum carbide phase labeled Ta2C in Figures 4 and 6 is referred to as TaC in the text.
3.2. Annealing Temperature Variation
Section 3.1 discusses the ohmic contact characteristics of metal layers with different thickness ratios and identifies the preferred combination as Ti/TaSi2/Pt = 1:3:2, so samples with this thickness ratio were prepared and annealed at 950 °C, 1000 °C, 1050 °C and 1100 °C in order to study the effect of the annealing temperature on the electrodes.
The experiments in Section 3.1 on different metal layer thicknesses were conducted at 1000 °C and included data for metal layer thicknesses of 1:3:2; therefore, the 1000 °C data are taken directly from the results obtained in Section 3.1. The results show that ohmic contacts are formed after RTA at all four annealing temperatures. The specific contact resistance is calculated as shown in Table 3, and the smallest specific contact resistance is obtained at 1050 °C. After the samples annealed at the different temperatures were subjected to an atmospheric aging test at 600 °C for 20 h, the SCR was measured again, and the results are also listed in Table 3. All of the contacts remain ohmic after aging, as confirmed by their linear I–V characteristics; however, the SCR of the sample annealed at 1100 °C increases markedly, which indicates a pronounced degradation of the contact performance while the ohmic character is retained. The SCR of the samples annealed at 1000 °C and 1050 °C changes only slightly; the 1050 °C sample has the lowest SCR and the smallest relative change, which indicates the best thermal stability among the conditions examined.
Table 3.
Specific contact resistivities of the Ti/TaSi2/Pt (50/150/100 nm) electrodes after RTA at 950, 1000, 1050 and 1100 °C for 2 min and after the subsequent aging test at 600 °C for 20 h in air. The values for 1000 °C are those of the 1:3:2 electrode given in Table 1.
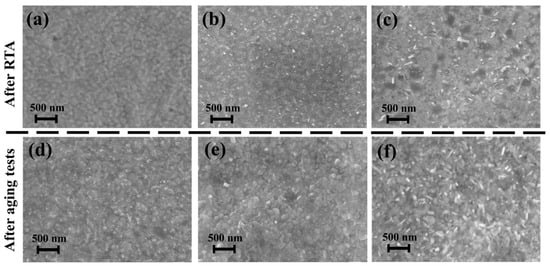
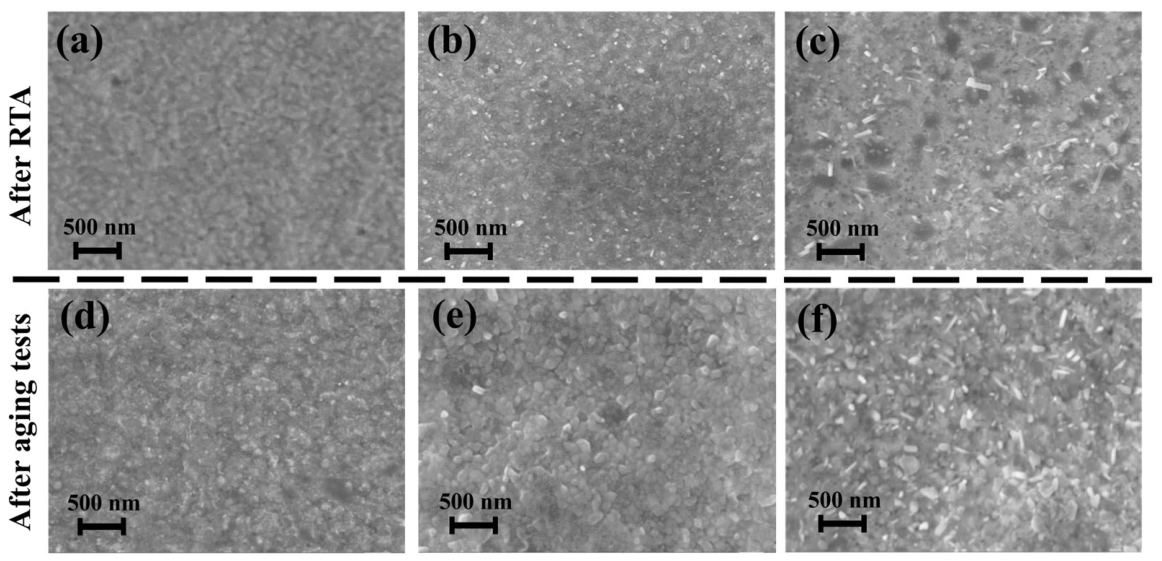
Figure 5a–c shows the surface morphology of the electrodes annealed at 950 °C, 1050 °C and 1100 °C. The data at 1000 °C are shown in Figure 3b and are not repeated here. After RTA, the surface annealed at 950 °C shows a uniform grain distribution and an overall relatively smooth appearance. Combined with the SCR results, this suggests that the surface evolution of the electrode has not yet been completed at this temperature. As the annealing temperature increases, the surface tends to become more homogeneous through normal grain growth. When the annealing temperature rises to 1050 °C, the high temperature appears to trigger secondary recrystallization (abnormal grain growth), in which some grains grow rapidly by consuming the surrounding small grains and protrude from the metal surface, so that the surface roughness increases. When the annealing temperature is further increased to 1100 °C, plate-like particles with lateral sizes of about 200–300 nm coexist with voids on the electrode surface, and the continuity of the film is destroyed, showing the characteristics of film instability, which may be the reason for the increase in SCR.
Figure 5.
SEM images of the Ti/TaSi2/Pt (50/150/100 nm) electrode surface after RTA at different annealing temperatures: (a) 950 °C, (b) 1050 °C and (c) 1100 °C; and after the subsequent aging test at 600 °C for 20 h in air: (d) 950 °C, (e) 1050 °C and (f) 1100 °C. All images were recorded at a magnification of 20,000; the scale bar is 500 nm.
Figure 5d–f shows the electrode surface morphology after 20 h at 600 °C for the different annealing temperatures. The data at 1000 °C are shown in Figure 3f and are not repeated here. Compared with the morphology before aging, the surface annealed at 950 °C shows irregular particle aggregation after the test, but the particles are small and the film surface remains continuous. According to Figure 3f, the surface annealed at 1000 °C shows a large number of spherical particles after the test, and the size and distribution are not uniform. The surface annealed at 1050 °C shows grain growth and a coarse crystalline structure after the test; the surface annealed at 1100 °C shows elongated, abnormal growth after the test, forming a large island-like structure with a large number of plate-like particles on the metal surface, and the surface roughness is high. The prolonged high-temperature exposure promotes surface diffusion and grain growth of the metal film, so the surface roughness increases further; with increasing annealing temperature, the grains formed during aging become larger, and large plate-like particles and island-like structures appear. These surface features are consistent with the SCR results in Table 3: the 1050 °C electrode, whose surface remains dense and continuous, shows the smallest change in SCR, whereas the 1100 °C electrode, in which the continuity of the film is lost, shows the largest increase. After the aging test, the electrode annealed at 1050 °C has a lower SCR and does not show obvious defects, and the electrode is dense and has the best electrode ohmic contact stability at high temperature.
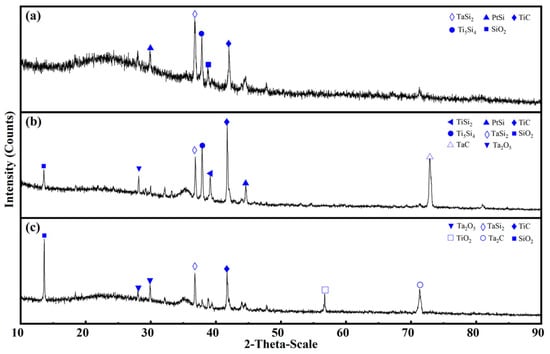
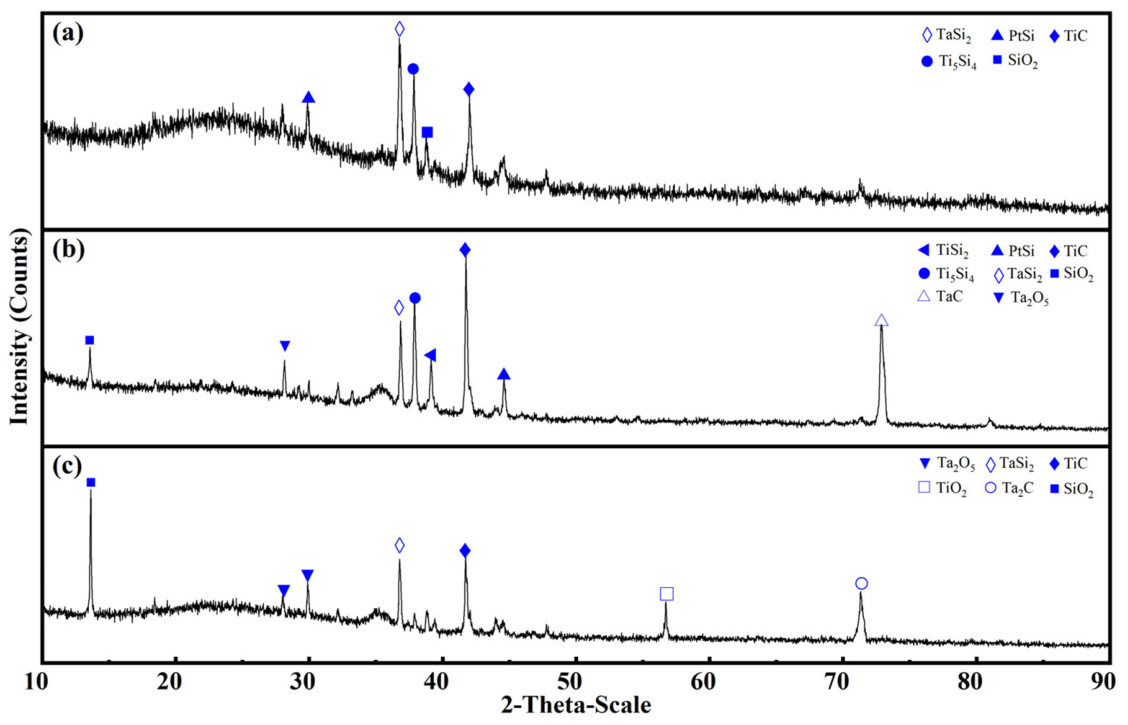
Figure 6 shows the XRD θ–2θ patterns of the electrodes annealed at different temperatures after 600 °C aging; the reflections used for the phase assignment are indexed in Table 2. At 950 °C, the reflections of the carbide and silicide phases are weak and poorly defined, which is consistent with an incomplete interfacial reaction and a poorly developed conductive network; this agrees with the relatively flat but unoptimized surface observed by SEM and with the higher SCR. At 1000 °C, reflections from TiC and Pt silicides begin to appear, but the reaction is still not optimal. At 1050 °C, reflections from TiC, TaC, TiSi2, Ti5Si4, and Pt silicides become more prominent, suggesting a more complete interfacial reaction and a better-connected conductive network. Combined with the denser and more continuous surface morphology in SEM, this is consistent with the lowest SCR and the best stability after 600 °C aging. At 1100 °C, the oxide-related reflections assigned to TiO2 and Ta2O5 become more evident, while the reflections of the conductive phases are weakened. SEM shows pronounced plate/island-like features and increased surface roughness, indicating that excessive annealing destabilizes the electrode structure and promotes oxidation.
Figure 6.
XRD θ–2θ patterns of the Ti/TaSi2/Pt (50/150/100 nm) electrodes after the aging test at 600 °C for 20 h in air, for annealing temperatures of (a) 950 °C, (b) 1050 °C and (c) 1100 °C. The phase assignments follow the ICDD PDF cards listed in Table 2.
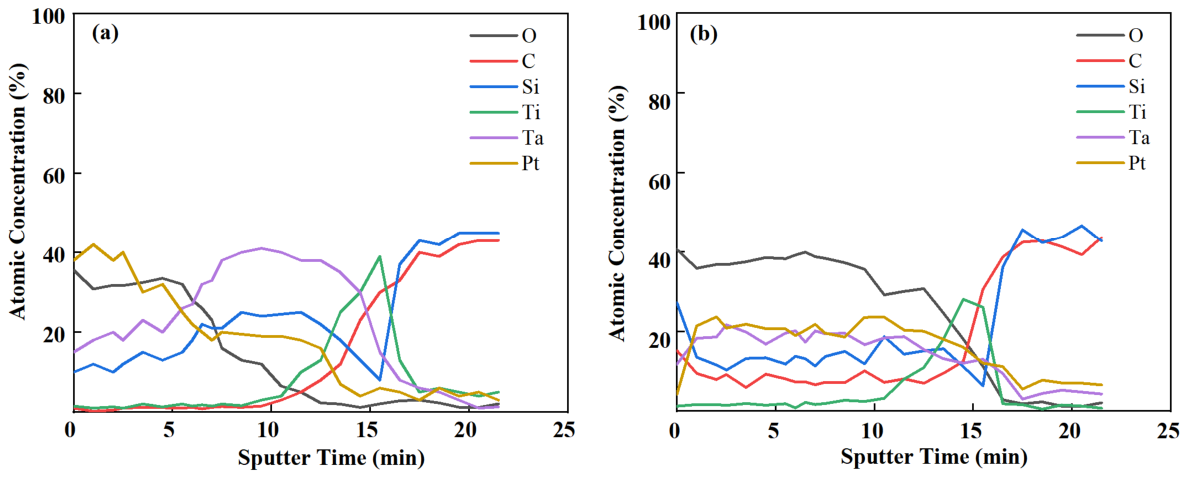
The Ti/TaSi2/Pt electrodes with thicknesses of 50/150/100 nm showed the lower SCR after rapid annealing at 1050 °C and maintained a stable performance after aging in air at 600 °C for 20 h. To examine the high-temperature atomic diffusion under these conditions, the atomic concentration distributions of the elements were measured by AES.
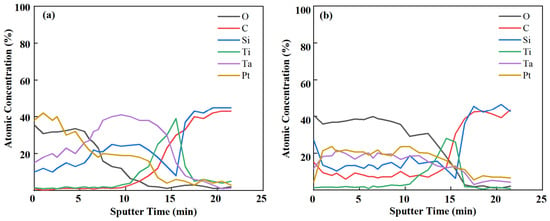
For comparison, the electrode annealed at 1100 °C and aged in air for 20 h was measured in the same way, as shown in Figure 7. The sputtering rate was 20 nm/min, the total sputtering time was 22 min, and the concentration of each element was recorded after each sputtering step to obtain the final atomic depth profile.
Figure 7.
AES depth profiles of the Ti/TaSi2/Pt (50/150/100 nm) electrodes after the aging test at 600 °C for 20 h in air, for annealing temperatures of (a) 1050 °C and (b) 1100 °C.
According to the AES results, oxygen enters the TaSi2 layer but is blocked by TaSi2 and its high-temperature reaction products in the electrode annealed at 1050 °C. Combined with the XRD results, TaC may be the key phase that blocks oxygen from entering the inner metal layer, and Pt enters the Ti layer after the high-temperature test to optimize the electrical conductivity of the electrode. The Ti element exhibits a bi-directional diffusion characteristic: inward diffusion to the SiC substrate to promote the overflow of C atoms at the interface, and outward diffusion to the TaSi2 layer to enhance the bonding of the metal layers. Near the contact interface, C atoms spill out of the interface while Ti atoms enter the interface, a process that is key to the formation of ohmic contacts. The combined effect of these atomic diffusions provides an atomic scale basis for the establishment of low-resistance ohmic contacts and is consistent with the high-temperature stability of the ohmic contacts. For the electrodes annealed at 1100 °C, oxygen from the ambient atmosphere fully penetrates the entire electrode stack and even approaches the contact interface after high-temperature aging. Meanwhile, carbon atoms out-diffuse from the substrate and reach the outermost surface. The atomic distribution within the stack becomes disordered, and elemental concentrations exhibit little variation with depth. Excessively high annealing temperatures (≥1100 °C) induce uncontrolled interdiffusion of the metal layers. During subsequent high-temperature aging in air, oxygen can more readily infiltrate the electrode, and oxide-phase formation is further promoted. These combined effects lead to sharp degradation of the ohmic contact. It should be noted that the AES profiles in Figure 7 were recorded after aging; the reference for the as-deposited state is the nominal layer sequence of the deposited stack (Ti 50 nm/TaSi2 150 nm/Pt 100 nm). The oxygen distribution discussed above is therefore the distribution remaining after 20 h at 600 °C, and the comparison is made with the nominal stack rather than with a measured as-deposited profile.
4. Discussion
The contact performance of the Ti/TaSi2/Pt system is discussed here in terms of three coupled factors: the Ti-related interfacial reactions, the protective role of the TaSi2-derived interlayer, and the stability of the capping structure. When TaSi2 is too thin, oxygen can penetrate into the Ti layer and form TiO2; the volume expansion associated with this oxidation is a plausible origin of the cracks and mound-like features, and the resulting oxide is consistent with the high SCR. When TaSi2 is sufficiently thick (150 nm) and Ti is 50 nm, XRD shows more prominent reflections from TiC, TaC, TiSi2/Ti5Si4, and Pt silicides, indicating a more complete interfacial reaction and a better-connected conductive network. The formation of TaC is particularly important because AES shows that oxygen is blocked before the main Ti-rich region at 1050 °C. Meanwhile, Ti diffuses inward to SiC and outward to TaSi2; inward Ti consumes C from SiC to form TiC, leaving carbon vacancies that favor low-resistance ohmic contact. When TaSi2 is further increased to 200 nm or Ti is increased to 100 nm, the reaction/stress balance deteriorates: abnormal grain coarsening, pinholes, rippled morphology, and particle aggregation appear, and the SCR increases after aging. The annealing temperature further modulates this balance. At 950 °C, the interfacial reactions between the individual metal layers of the electrode remain incomplete. At 1050 °C, conductive carbide/silicide phases and the TaC-related oxygen barrier are well developed, giving the lowest SCR and the best aging stability. At 1100 °C, the number of Bragg reflections from oxides such as TiO2 and Ta2O5 increases. The AES results show that oxygen penetrates into the inner electrode and overlaps with the Ti-rich regions, which indicates that oxygen ingress and the associated structural instability are the main causes of the degradation of the contact performance. Therefore, the SCR difference cannot be attributed to a single phase; it originates from the combined effects of conductive network formation, TaC-related oxygen blocking, and structural stability. The 1:3:2/1050 °C condition achieves the best balance among these factors.
The interpretation given above should be read together with the nature of the data on which it rests. SEM provides a two-dimensional view of the electrode surface, so the hillocks, cracks and voids described in Section 3 are identified from their shape and lateral size at a fixed magnification; their depth and three-dimensional distribution are not resolved, and roughness and grain-size values obtained by atomic force microscopy or by quantitative image analysis are not part of this data set. The phase assignment from XRD concerns only the crystalline phases that give rise to detectable Bragg reflections; amorphous or nanocrystalline reaction products, if present, are not detected. The AES profiles were recorded after aging, as noted in Section 3.2. The mechanisms proposed in Section 3 and in this section are therefore consistent with the observations, but they are not proven by them; within this limitation, the three independent observations—the increase in SCR (Table 1 and Table 3), the appearance of oxide-related reflections (Figure 4 and Figure 6) and the accumulation of oxygen near the interface (Figure 7)—all point to oxygen ingress as the main cause of the degradation of the contacts aged in air.
5. Conclusions
In this work, Ti/TaSi2/Pt ohmic contacts were fabricated on n-type 4H-SiC, and the effects of the Ti/TaSi2/Pt thickness ratio and annealing temperature on contact performance and 600 °C aging stability were investigated. A thinner TaSi2 layer provides insufficient oxygen blocking; oxygen enters the Ti layer and forms TiO2, causing stress concentration, cracks, and mound-like morphology, which degrades the contact. A thicker TaSi2 layer leads to abnormal grain coarsening, pinholes, and reduced surface flatness. Increasing the Ti thickness causes thermal expansion mismatch with TaSi2, resulting in rippled morphology and particle aggregation. Lower annealing temperatures leave the reaction incomplete, while excessive annealing (1100 °C) causes severe grain growth, oxide formation, and oxygen penetration, leading to contact degradation. The optimized condition is Ti/TaSi2/Pt = 1:3:2 (50/150/100 nm) annealed at 1050 °C, which yields an SCR of 7.16 × 10⁻⁵ Ω·cm2; after 20 h of aging at 600 °C in air, the SCR remains at 3.05 × 10⁻⁴ Ω·cm2, and the electrode surface remains suitable for subsequent lead bonding. XRD, SEM, and AES results indicate that more prominent TiC/TaC-related reflections, TiSi2/Ti5Si4, and Pt silicides correspond to a conductive interfacial network, while TaC formed at 1050 °C acts as an oxygen diffusion barrier. At 1100 °C, XRD shows TiO2 reflections together with weakened reflections of the conductive phases. The AES depth profile of the same sample shows oxygen penetrating the whole electrode and overlapping the Ti-rich region. Taken together, these two observations suggest that oxygen ingress and the associated structural destabilization, rather than the absence of conductive phases, are the dominant causes of the degradation at this temperature. Within the scope of the surface-sensitive and phase-sensitive data presented here, this work provides an experimental basis for designing high-temperature ohmic contacts for SiC sensors.
Author Contributions
Methodology, Y.L. and Z.L.; validation, Y.L., S.L. and J.L.; formal analysis, P.J. and Z.Z.; investigation, S.L. and J.L.; resources, C.L., J.Y., Z.Z. and T.L.; data curation, Y.L., S.L. and J.L.; writing—original draft, Y.L., C.L. and T.L.; writing—review and editing, Y.L.; supervision, J.Y. and Z.Z.; project administration, Z.L., J.Y. and P.J.; funding acquisition, Y.L., J.Y. and P.J. All authors have read and agreed to the published version of the manuscript.
Funding
This work was supported by the National Key Research and Development Program of China (Grant No. 2023YFB3208500), the Open Fund of the State Key Laboratory of Extreme Environment Optoelectronic Dynamic Measurement Technology and Instrument (Grant No. 2025-SYSJJ-01), the Science and Technology Major Program of Shanxi Province (Grant No. 202301030201003), the Key Research and Development Program of Shanxi Province (Grant No. 202302030201001), and Shanxi Province Major Science and Technology Special Project (Grant No. 202401060301011).
Informed Consent Statement
Informed consent was obtained from all subjects involved in the study.
Data Availability Statement
The data that support the findings of this study are available from the corresponding authors upon reasonable request.
Conflicts of Interest
The authors declare no conflicts of interest.
References
- Vivona, M.; Greco, G.; Bongiorno, C.; Nigro, R.L.; Scalese, S.; Roccaforte, F. Electrical and structural properties of surfaces and interfaces in Ti/Al/Ni Ohmic contacts to p-type implanted 4H-SiC. Appl. Surf. Sci. 2017, 420, 331–335. [Google Scholar] [CrossRef] [Scilit]
- Zhang, Q.; Liu, Y.; Li, H.; Wang, J.; Wang, Y.; Cheng, F.; Han, H.; Zhang, P. A Review of SiC Sensor Applications in High-Temperature and Radiation Extreme Environments. Sensors 2024, 24, 7731. [Google Scholar] [CrossRef] [Scilit] [PubMed]
- Wright, N.G.; Horsfall, A.B.; Vassilevski, K. Prospects for SiC electronics and sensors. Mater. Today 2008, 11, 16–21. [Google Scholar] [CrossRef] [Scilit]
- Zorman, C.A.; Mehregany, M. Silicon carbide for MEMS and NEMS—An overview. IEEE Sens. 2002, 2, 1109–1114. [Google Scholar] [CrossRef] [Scilit]
- Migliore, F.; Cannas, M.; Gelardi, F.M.; Pasquali, F.; Brischetto, A.; Vecchio, D.; Pirnaci, M.D.; Agnello, S. Effects of High-Temperature Treatments in Inert Atmosphere on 4H-SiC Substrates and Epitaxial Layers. Materials 2024, 17, 5761. [Google Scholar] [CrossRef] [Scilit] [PubMed]
- La Via, F.; Alquier, D.; Giannazzo, F.; Kimoto, T.; Neudeck, P.; Ou, H.; Roncaglia, A.; Saddow, S.E.; Tudisco, S. Emerging SiC Applications Beyond Power Electronic Devices. Micromachines 2023, 14, 1200. [Google Scholar] [CrossRef] [Scilit] [PubMed]
- Xie, X.; Kong, Y.; Xu, L.; Yang, D.; Pi, X. Distribution of the electrical resistivity of a n-type 4H-SiC crystal. J. Cryst. Growth 2024, 648, 127892. [Google Scholar] [CrossRef] [Scilit]
- Siddiqui, A.; Khosa, R.Y.; Usman, M. High-k dielectrics for 4H-silicon carbide: Present status and future perspectives. J. Mater. Chem. C 2021, 9, 5055–5081. [Google Scholar] [CrossRef] [Scilit]
- Chen, Z.; Huang, A.Q. Extreme high efficiency enabled by silicon carbide (SiC) power devices. Mater. Sci. Semicond. Process. 2024, 172, 108052. [Google Scholar] [CrossRef] [Scilit]
- Wang, X.; Zimmer, K.; Ehrhardt, M.; Zhang, F.; Wang, J.; Wang, P.P.; Shao, J.-H.; Liu, J.; Cao, A.; Sun, W.; et al. One-step in-situ low damage etching of SiC/SiC composites by high-temperature chemical-assisted laser processing. Ceram. Int. 2022, 48, 34472–34482. [Google Scholar] [CrossRef] [Scilit]
- Zhao, Y.; Zhao, Y.; Wang, L.; Yang, Y.; Wang, Y. Femtosecond Laser Processing Assisted SiC High-Temperature Pressure Sensor Fabrication and Performance Test. Micromachines 2023, 14, 587. [Google Scholar] [CrossRef] [Scilit] [PubMed]
- Han, S.Y.; Kim, K.H.; Kim, J.K.; Jang, H.W.; Lee, K.H.; Kim, N.; Kim, E.D.; Lee, J. Ohmic contact formation mechanism of Ni on n-type 4H-SiC. Appl. Phys. Lett. 2001, 79, 1816–1818. [Google Scholar] [CrossRef] [Scilit]
- Smith, L.L.; Bremser, M.D.; Carlson, E.P.; Weeks, T.W., Jr. Ohmic Contact Formation to Doped GaN. MRS Proc. 1995, 395, 861. [Google Scholar] [CrossRef] [Scilit]
- Henry, C.H. Semiconductor Physics: Deep Impurities In Semiconductors. A. G. Milnes. Wiley-Interscience, New York, 1973. xviii, 526 pp., illus. $24.95. Science 1974, 183, 1284. [Google Scholar] [CrossRef] [Scilit]
- Bastard, G.; Brum, J.A.; Ferreira, R. Electronic States in Semiconductor Heterostructures. Solid State Phys. 1991, 44, 229–415. [Google Scholar] [CrossRef] [Scilit]
- Neamen, D.A. Semiconductor Physics and Devices; McGraw-Hill, Inc.: New York, NY, USA, 1992. [Google Scholar]
- Berger, C.; Alquier, D.; Michaud, J.-F. How to Accurately Determine the Ohmic Contact Properties on n-Type 4H-SiC. Electronics 2024, 13, 217. [Google Scholar] [CrossRef] [Scilit]
- Li, G.; Xu, M.; Zou, D.; Cui, Y.; Zhong, Y.; Cui, P.; Cheong, K.Y.; Xia, J.; Nie, H.; Li, S.; et al. Fabrication of Ohmic Contact on N-Type SiC by Laser Annealed Process: A Review. Crystals 2023, 13, 1106. [Google Scholar] [CrossRef] [Scilit]
- Zhang, Y.; Guo, T.; Tang, X.; Yang, J.; He, Y.; Zhang, Y. Thermal stability study of n-type and p-type ohmic contacts simultaneously formed on 4H-SiC. J. Alloys Compd. 2018, 731, 1267–1274. [Google Scholar] [CrossRef] [Scilit]
- Hamad, V.A.; Tannous, T.A.; Soueidan, M.; Gremillard, L.; Fabregue, D.; Penuelas, J.; Zaatar, Y. Stable and reliable ohmic contact on p-type 4H-SiC up to 1500h of aging at 600 °C. Microelectron. Reliab. 2020, 110, 113694. [Google Scholar] [CrossRef] [Scilit]
- Cho, N.I.; Jung, K.H.; Choi, Y. Improved ohmic contact to the n-type 4H-SiC semiconductor using cobalt silicides. Semicond. Sci. Technol. 2004, 19, 306–310. [Google Scholar] [CrossRef] [Scilit]
- Michaelson, H.B. The work function of the elements and its periodicity. J. Appl. Phys. 1977, 48, 4729–4733. [Google Scholar] [CrossRef] [Scilit]
- Kuchuk, A.V.; Guziewicz, M.; Ratajczak, R.; Wzorek, M.; Kladko, V.P.; Piotrowska, A. Thermal degradation of Au/Ni2Si/n-SiC ohmic contacts under different conditions. Mater. Sci. Eng. B 2009, 165, 38–41. [Google Scholar] [CrossRef] [Scilit]
- Kuchuk, A.V.; Borowicz, P.; Wzorek, M.; Borysiewicz, M.; Ratajczak, R.; Golaszewska, K.; Kaminska, E.; Kladko, V.; Piotrowska, A. Ni-Based Ohmic Contacts to n-Type 4H-SiC: The Formation Mechanism and Thermal Stability. Adv. Condens. Matter Phys. 2016, 2016, 26. [Google Scholar] [CrossRef] [Scilit]
- Cole, M.W.; Joshi, P.C.; Hubbard, C.W.; Wood, M.C.; Ervin, M.H.; Geil, B.; Ren, F. Improved Ni based composite Ohmic contact to n-SiC for high temperature and high power device applications. J. Appl. Phys. 2000, 88, 2652–2657. [Google Scholar] [CrossRef] [Scilit]
- Lei, C.; Li, Q.; Liang, T.; Liu, R.; Li, Y.; Zhou, X.; Jia, P.; Ghaffar, A.; Xiong, J. Study of Ni/Al/Au Ohmic Contacts to p-Type 4H-SiC Applied in 600 °C Environment. J. Cryst. Growth 2022, 592, 126735. [Google Scholar] [CrossRef] [Scilit]
- Cuong, V.V.; Ishikawa, S.; Maeda, T.; Sezaki, H.; Yasuno, S.; Koganezawa, T.; Miyazaki, T.; Kuroki, S.I. High-temperature reliability of Ni/Nb ohmic contacts on 4H-SiC for harsh environment applications. Thin Solid Films 2019, 669, 306–314. [Google Scholar] [CrossRef] [Scilit]
- Okojie, R.S.; Spry, D.; Krotine, J.; Salupo, C.; Wheeler, D.R. Stable Ti/TaSi2/Pt ohmic contacts on N-type 6H-SiC epilayer at 600 °C in air. MRS Online Proceeding Libr. Arch. 2000, 622, 831. [Google Scholar] [CrossRef] [Scilit]
- Okojie, R.S.; Lukco, D.; Chen, Y.L.; Spry, D.J. Reliability assessment of Ti/TaSi2/Pt ohmic contacts on SiC after 1000 h at 600 °C. J. Appl. Phys. 2002, 91, 6553–6559. [Google Scholar] [CrossRef] [Scilit]
- Wu, C.; Fang, X.; Kang, Q.; Fang, Z.; Wu, J.; He, H.; Zhang, D.; Zhao, L.; Tian, B.; Maeda, R. Exploring the nonlinear piezoresistive effect of 4H-SiC and developing MEMS pressure sensors for extreme environments. Microsyst. Nanoeng. 2023, 9, 41. [Google Scholar] [CrossRef] [Scilit] [PubMed]
- Spera, M.; Greco, G.; Corso, D.; Di Franco, S.; Severino, A.; Messina, A.A.; Giannazzo, F.; Roccaforte, F. Ohmic Contacts on p-Type Al-Implanted 4H-SiC Layers after Different Post-Implantation Annealings. Materials 2021, 12, 3468. [Google Scholar]
- Reeves, G.K.; Harrison, H.B. Obtaining the specific contact resistance from transmission line model measurements. IEEE Electron Device Lett. 2005, 3, 111–113. [Google Scholar]
- Berger, H.H. Contact Resistance and Contact Resistivity. J. Electrochem. Soc. 1972, 119, 507–514. [Google Scholar] [CrossRef] [Scilit]

Disclaimer/Publisher’s Note: The statements, opinions and data contained in all publications are solely those of the individual author(s) and contributor(s) and not of MDPI and/or the editor(s). MDPI and/or the editor(s) disclaim responsibility for any injury to people or property resulting from any ideas, methods, instructions or products referred to in the content. |
© 2026 by the authors. Licensee MDPI, Basel, Switzerland. This article is an open access article distributed under the terms and conditions of the Creative Commons Attribution (CC BY) license.