


Abstract
The control of CO emissions from iron and steel sintering flue gas has received increasing attention. In this work, Pt-loaded Mn–Cu catalysts were prepared by a redox precipitation method to investigate the effects of Pt loading and calcination temperature on low-temperature CO oxidation activity and SO2-induced deactivation behavior. Among the tested catalysts, 1Pt/MnCu-300, containing 1 wt.% Pt and calcined at 300 °C, exhibited the highest low-temperature CO oxidation activity and achieved complete CO conversion at 75 °C. Under the specified SO2-containing test conditions, all catalysts eventually underwent severe and largely irreversible deactivation, whereas Pt loading and calcination temperature altered the transient CO-conversion decay profiles. Pt/MnCu-450 retained high CO conversion for a longer initial period during SO2 exposure than the other catalysts in the calcination-temperature series; however, this observation does not by itself demonstrate superior intrinsic SO2 tolerance because the present experiments did not quantify SO2 breakthrough, sulfur uptake, or active-site-normalized deactivation rates. Characterization results show that Pt modification increased the specific surface area, altered the Mn3+/Mn4+ ratio and surface oxygen species, promoted oxygen-vacancy formation, and enhanced CO adsorption and redox properties. These physicochemical changes are correlated with the improved low-temperature CO oxidation activity of Pt-modified Mn–Cu catalysts. This work clarifies the effects of Pt loading and calcination temperature on CO oxidation performance and on the transient response to SO2 exposure.
1. Introduction
The iron and steel industry occupies an important position in the national economy and contributes significantly to the development of society [1,2]. However, as a key step in steel production, the sintering process is the largest contributor to atmospheric emissions [3]. The main pollutants emitted include CO, SO2, NOx, and particulate matter, which significantly affect air quality. Although the emissions of conventional pollutants such as SO2, NOx, and particulate matter have met ultra-low emission standards, CO emissions, as a non-conventional pollutant, remain uncontrolled, posing a major environmental risk [4]. Therefore, CO has become a key pollutant requiring urgent control in sintering flue gas treatment [5].
Among various CO abatement technologies, catalytic oxidation, solid adsorption, and photocatalysis are widely adopted. As the optimal route, catalytic oxidation exhibits superior efficiency, cost-effectiveness, and environmental benignity [6]. Catalysts used in this process are divided into noble metal-based and non-noble metal-based catalysts according to their metal composition. Commonly used CO oxidation catalysts include noble metal catalysts, such as Pt [7], Pd [8], Au [9], Ru [10], and Ag [11], and non-noble metal catalysts, such as Cu [12,13], Co [14], and Mn [15,16]. Due to the high preparation cost of noble metal catalysts, which severely limits their large-scale application, some researchers have begun to explore and develop non-noble metal CO oxidation catalysts as substitutes for noble metal catalysts. Currently, the catalytic performance of mixed metal oxides in non-noble metal catalysts has become an important research direction in this field. Transition metals, in particular, exhibit outstanding activity in catalytic oxidation reactions. Among them, Mn–Ce, Cu–Ce, and Mn–Cu mixed oxide catalysts have received extensive research attention due to their excellent performance in CO catalytic oxidation. Yang et al. [17] synthesized a series of Ce–MnOx catalysts with different Ce/Mn ratios via coprecipitation and found that the catalyst with a Ce/Mn molar ratio of 1:1 exhibited the best performance, achieving 99.96% CO conversion at 140 °C. Ma et al. [18] constructed a CeO2–CuO symbiotic system using a citric acid complexation method and demonstrated that the CuO phase dominated the CO redox process, while CeO2 promoted oxygen vacancy formation by finely tuning the microstructure of CuO (such as unit cell volume expansion and the reduction of Cu2+ to Cu+), ultimately enhancing catalytic activity. Yang et al. [19] prepared a series of MnOx–CuO catalysts via redox precipitation, hydrothermal, and oxalate complexation methods. The results showed that the MnCu-YH catalyst prepared by the redox precipitation method exhibited the best catalytic performance, achieving 100% CO conversion at 175 °C.
Although transition metal catalysts can remove CO at a lower cost compared with noble metal catalysts, the presence of SO2 in sintering flue gas during actual industrial operation leads to their irreversible deactivation, thereby impairing catalytic performance. Li et al. [20] synthesized mesoporous Cu–Ce catalysts and found that after introducing SO2, cerium sulfate formed on the catalyst surface. The accumulation of cerium sulfate covered the active sites of the Cu–Ce catalyst, ultimately resulting in complete deactivation. Szanyi et al. [21] studied CuO/CeOx–ZrOx catalysts and found that sulfates formed mainly at the interface between CuO and CeOx–ZrOx, leading to a decrease in CO adsorption strength on Cu+ sites and a weakening of the mobility of surface-adsorbed oxygen species on the CeOx–ZrOx support. These factors collectively contributed to catalyst deactivation.
To address the deactivation of transition metal catalysts after sulfur poisoning, several strategies have been explored, including the addition of promoters [22], support modification [23], and changes in preparation methods [24]. These approaches aim to increase the surface acidity of catalysts and reduce SO2 adsorption, construct sacrificial sites to minimize contact between SO2 and active components, and adjust structural properties such as specific surface area and pore volume. Among these strategies, the addition of noble metals may modify catalytic activity and the catalyst response during exposure to SO2-containing gas streams. Among the various noble metal catalysts, Pt stands out due to its unique physical and chemical properties. Maurer et al. [25] prepared Pt/CeO2 and CeO2 catalysts and conducted a comparative study using in situ characterization and density functional theory (DFT) calculations. They found that Pt can shorten the migration distance of active species, lower the agglomeration energy barrier, and promote the in situ formation of active clusters, demonstrating that Pt possesses high catalytic activity and can promote chemical reactions at relatively low temperatures. Liu et al. [26] prepared Mn/Ti and Pt-0.5Mn/Ti catalysts and carried out a comparative study through activity tests, in situ characterization, and DFT calculations. They found that the Pt-doped catalyst maintains high catalytic activity even in a high-concentration SO2 environment, indicating that Pt has unique catalytic characteristics and can effectively resist sulfur poisoning.
Although the above studies have demonstrated that Pt possesses good catalytic performance and can influence the behavior of transition metal catalysts in sulfur-containing atmospheres, the changes in catalyst performance and the underlying mechanisms remain unclear when preparation parameters such as Pt loading and calcination temperature vary. Calcination temperature is an important preparation parameter for Mn–Cu oxide catalysts, as it can significantly affect their structural properties, surface characteristics, phase composition, and dispersion of active species, thereby influencing their catalytic performance [27,28]. Therefore, the novelty of this work lies in the systematic regulation of Pt loading and calcination temperature in Pt/MnCu catalysts for low-temperature CO oxidation under SO2-containing conditions, together with an investigation of the corresponding structure–performance relationship. In this study, a series of Pt/MnCu catalysts were prepared by a redox precipitation method to investigate the effects of Pt loading and calcination temperature on CO oxidation activity and SO2-induced deactivation behavior. The physicochemical properties of the catalysts were characterized by N2 adsorption–desorption, XRD, XPS, Raman spectroscopy, H2-TPR, and CO-TPD. By correlating these physicochemical properties with CO oxidation performance and the transient CO-conversion response during SO2 exposure, the effects of Pt modification on the catalytic performance and deactivation behavior of Mn–Cu catalysts were discussed.
2. Results and Discussion
2.1. Effect of Pt Loading and Calcination Temperature on Catalyst Activity
2.1.1. Effect of Calcination Temperature on Catalyst Activity
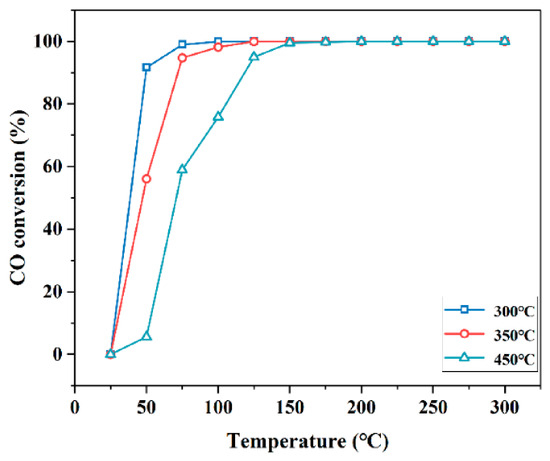
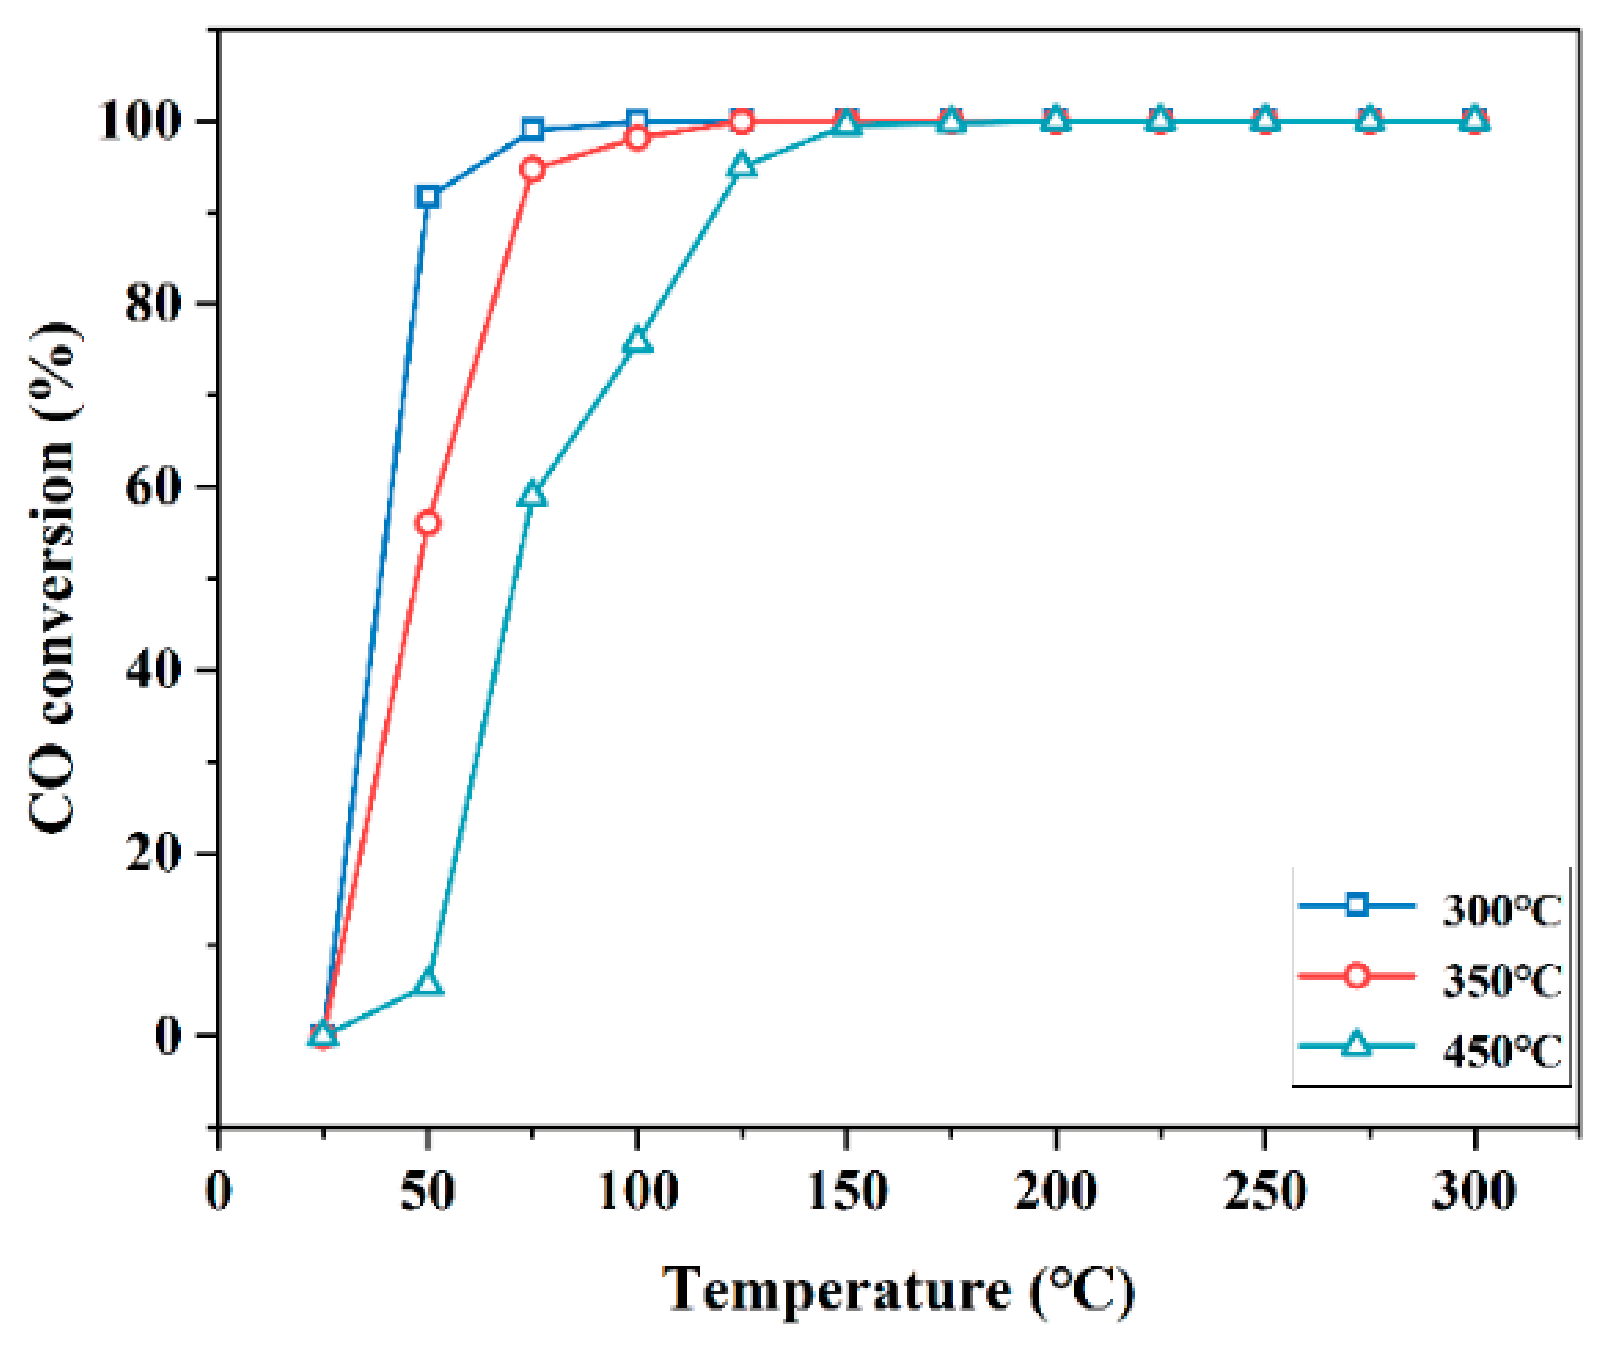
For supported catalysts, the calcination temperature is a key factor influencing catalytic activity [29]. Therefore, Pt/MnCu catalysts with a Pt loading of 1 wt.% were prepared to investigate the effect of calcination temperature on their CO oxidation activity, and the results are shown in Figure 1. From the CO activity curves, the trend of catalyst activity varying with calcination temperature can be clearly observed: as the calcination temperature gradually increased, the catalytic activity of the Pt/MnCu catalysts decreased significantly. The order of CO activity for the catalysts was Pt/MnCu-300 > Pt/MnCu-350 > Pt/MnCu-450. When the calcination temperature was 300 °C, the catalyst exhibited the best low-temperature CO oxidation activity, achieving 100% CO conversion at 75 °C. In contrast, the Pt/MnCu-350 and Pt/MnCu-450 catalysts required relatively higher temperatures to achieve complete conversion, reaching 100% at 125 °C and 150 °C, respectively. This result indicates that an excessively high calcination temperature will lead to a decrease in catalyst activity, specifically manifesting as an increase in the temperature required for complete CO conversion. This phenomenon can be attributed to the fact that an excessively high calcination temperature tends to cause agglomeration of active component particles [30], reducing the number of active sites and consequently leading to a decline in CO catalytic performance.
Figure 1.
CO activity of 1Pt/MnCu catalysts prepared at different calcination temperatures.
2.1.2. Effect of Pt Loading on Catalyst Activity
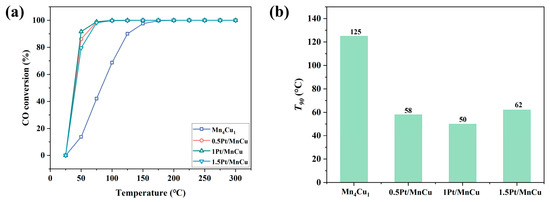
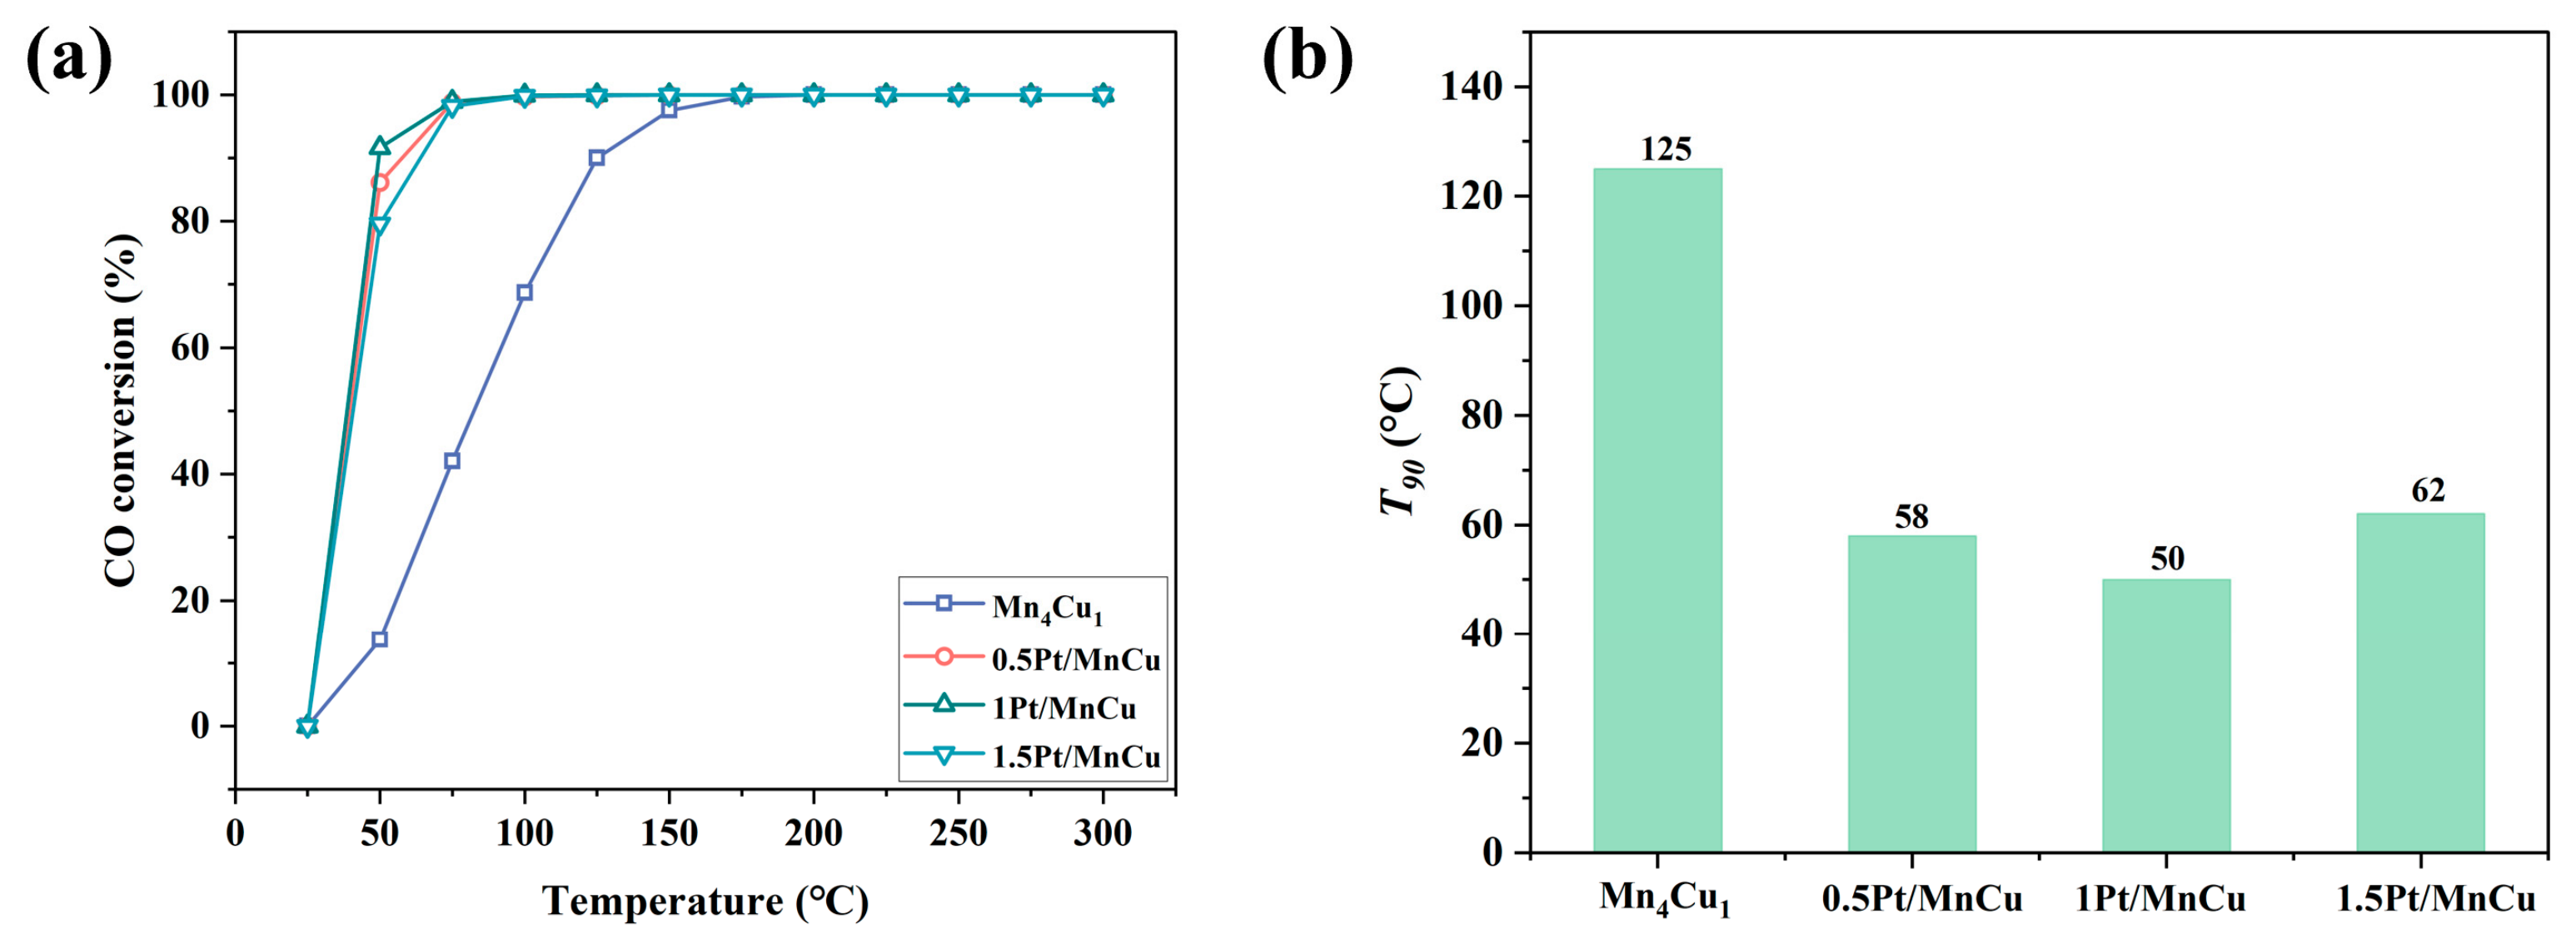
The CO oxidation activities of Mn4Cu1, 0.5Pt/MnCu, 1Pt/MnCu, and 1.5Pt/MnCu catalysts were evaluated in the temperature range of 25–300 °C. The CO activity curves and T90 values are shown in Figure 2. The results indicated that, compared with the pristine Mn4Cu1 catalyst without Pt doping, all three Pt-doped catalysts exhibited significantly enhanced catalytic activity. As the Pt loading increased, the catalytic activity of the Pt/MnCu catalysts first increased and then decreased. The order of CO activity for the four catalysts was 1Pt/MnCu > 0.5Pt/MnCu > 1.5Pt/MnCu > Mn4Cu1. From the T90 plot, 1Pt/MnCu demonstrated outstanding performance, achieving 90% CO conversion at 50 °C, which fully proved its optimal low-temperature catalytic performance. Further analysis of the temperature required for 100% CO conversion revealed that 1Pt/MnCu, 0.5Pt/MnCu, and 1.5Pt/MnCu all achieved complete conversion at a relatively low temperature of 75 °C, whereas Mn4Cu1 required a temperature as high as 175 °C. This result indicates that Pt-loaded catalysts possess stronger low-temperature catalytic ability. Among them, the 1Pt/MnCu catalyst exhibited the best catalytic activity in the CO oxidation reaction, as it not only efficiently promoted the oxidation of CO at low temperatures with high conversion, but also maintained good catalytic performance at high temperatures.
Figure 2.
(a) CO oxidation activity of Mn–Cu-based and Pt/MnCu catalysts. (b) T90 values of Mn–Cu-based and Pt/MnCu catalysts.
2.2. Effect of Pt Loading and Calcination Temperature on SO2-Induced Deactivation Behavior
2.2.1. Effect of Pt Loading on SO2-Induced Deactivation Behavior
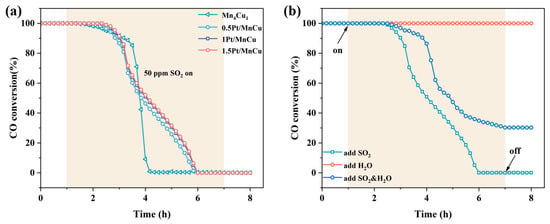
The stability tests were conducted at 250 °C with a total gas flow rate of 150 mL min−1 using 100 mg of catalyst. For the SO2-induced deactivation behavior, 50 ppm SO2 was introduced into the feed gas, while 10% H2O was introduced for the water-tolerance tests. For the combined H2O + SO2 tests, the feed gas contained 10% H2O and 50 ppm SO2. The SO2-exposure experiments monitor CO conversion as a function of time. Because SO2 concentration at the reactor outlet, total sulfur uptake, and active-site-normalized deactivation rates were not measured, these tests are used to compare transient deactivation profiles rather than to determine intrinsic SO2 tolerance.
Figure 3a shows the changes in catalytic activity of Pt/MnCu catalysts with different Pt loadings after the introduction of SO2 at 250 °C. Upon SO2 introduction, the CO conversion of all catalysts gradually decreased and eventually reached very low or zero values, indicating severe deactivation under the tested conditions. The lack of recovery after SO2 removal suggests that the deactivation was largely irreversible. These observations demonstrate susceptibility to SO2-induced deactivation. For the Mn4Cu1 catalyst, within the first 2 h after SO2 introduction, the catalytic activity decreased slowly, with CO conversion remaining above 90%, demonstrating that it maintained relatively high catalytic efficiency in a short period. However, within the subsequent 1 h, the catalyst activity dropped sharply, with CO conversion rapidly falling to 0%. Moreover, the activity did not recover after stopping SO2 introduction, indicating complete and irreversible deactivation of the catalyst. This is likely due to the strong interaction between SO2 and the active sites on the catalyst surface, forming stable sulfates and altering the catalyst structure, which prevents it from returning to its initial active state [31].
Figure 3.
Transient CO conversion responses of (a) Pt/MnCu catalysts with different Pt loadings during SO2 exposure and (b) 1Pt/MnCu in the presence of SO2, H2O, or both SO2 and H2O.
After Pt loading, CO conversion remained above 99% during the first 1.6 h of SO2 exposure. This observation indicates an initially slower decline in CO conversion under the specified exposure conditions, rather than directly demonstrating enhanced intrinsic SO2 tolerance. In the subsequent 1 h, the order of the decreasing rate of catalytic activity for catalysts with different Pt loadings was 0.5Pt/MnCu > 1Pt/MnCu ≈ 1.5Pt/MnCu > Mn4Cu1. After 3.4 h, the order of the decreasing rate became Mn4Cu1 > 0.5Pt/MnCu > 1Pt/MnCu ≈ 1.5Pt/MnCu. Specifically, 0.5Pt/MnCu, 1Pt/MnCu, and 1.5Pt/MnCu became completely and irreversibly deactivated after 5 h of SO2 introduction. These results indicate that Pt loading significantly affected the transient CO conversion response and deactivation behavior during SO2 exposure. Although the Pt-containing catalysts maintained high CO conversion for a longer initial period, all catalysts eventually underwent severe and largely irreversible deactivation under the tested conditions. Therefore, these results are interpreted as differences in SO2-induced deactivation behavior rather than direct evidence of enhanced intrinsic sulfur tolerance. Among the Pt-loaded catalysts, 1Pt/MnCu and 1.5Pt/MnCu exhibited comparable CO-conversion retention during SO2 exposure.
In addition to SO2, actual sintering flue gas also contains about 10% H2O, which may affect the catalytic activity. Therefore, to investigate the influence of complex atmospheres on catalytic activity, stability comparison experiments were conducted under different atmospheres at 250 °C, and the results are shown in Figure 3b. When only 10% H2O was introduced, the CO conversion of the 1Pt/MnCu catalyst did not change significantly (remaining above 99%), indicating that the catalyst exhibited good stability in the presence of water vapor. In a mixed atmosphere containing both 10% H2O and 50 ppm SO2, the CO conversion of the catalyst increased compared with that in SO2 alone. This result indicates that the presence of H2O altered the transient CO conversion response under SO2-containing conditions. However, the present experiments do not allow the underlying mechanism to be identified unambiguously.
2.2.2. Effect of Calcination Temperature on SO2-Induced Deactivation Behavior
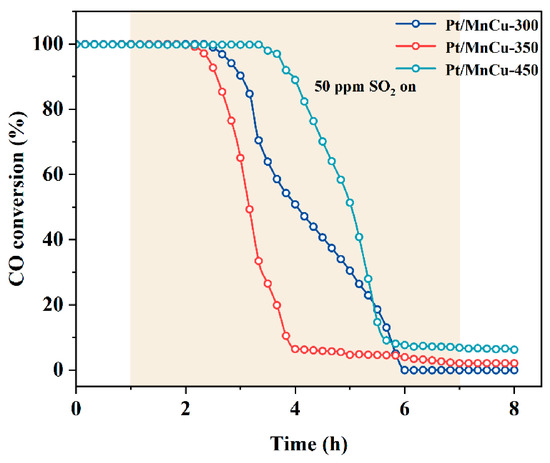
Figure 4 shows the changes in catalytic activity of Pt/MnCu catalysts with different calcination temperatures after the introduction of 50 ppm SO2. The catalytic activities of all tested catalysts decreased to varying extents, with the order of decreasing rate being Pt/MnCu-350 > Pt/MnCu-300 > Pt/MnCu-450.
Figure 4.
Transient CO-conversion responses of Pt/MnCu catalysts calcined at different temperatures during exposure to 50 ppm SO2.
Specifically, for the Pt/MnCu-350 catalyst, the CO conversion remained above 90% within the first 1.5 h after SO2 introduction, exhibiting relatively stable CO oxidation performance during the initial period. However, after 1.5 h, the catalyst activity decreased sharply, with CO conversion rapidly dropping to about 6%. Over the subsequent 3 h, it continued to decrease slowly and finally stabilized at 2%. After stopping SO2 introduction, the activity did not recover, indicating severe and irreversible deactivation under the tested conditions. For the Pt/MnCu-300 catalyst, the CO conversion also remained above 90% within the first 2 h after SO2 introduction, showing relatively stable initial CO-conversion performance. However, after 4 h, the CO conversion dropped to 0%, and the catalyst became almost completely deactivated. No activity change occurred within the following 1 h, and the activity did not recover after stopping SO2 introduction, also indicating severe and irreversible deactivation. For the Pt/MnCu-450 catalyst, the CO conversion remained stable above 90% within the first 3 h after SO2 introduction, showing relatively better CO-conversion retention during the initial SO2 exposure period. Over the next 1.5 h, the CO conversion dropped to about 9%, and then slowly decreased to 6% over the subsequent 1.5 h. After stopping SO2 introduction, the catalytic activity remained at 6%.
Overall, Pt/MnCu-450 maintained high CO conversion for a longer initial period under the tested SO2 exposure conditions, followed by Pt/MnCu-300 and Pt/MnCu-350. These results indicate that calcination temperature affects the transient CO-conversion response and SO2-induced deactivation behavior of the catalysts, with the observed retention showing a non-monotonic dependence on calcination temperature. However, the present results do not by themselves establish differences in intrinsic SO2 tolerance, since SO2 breakthrough, sulfur uptake, and active-site-normalized deactivation rates were not directly measured.
Pt/MnCu-300 exhibited the highest low-temperature CO oxidation activity, whereas Pt/MnCu-450 retained high CO conversion for a longer initial period during SO2 exposure. Therefore, Pt/MnCu-300 was selected for subsequent characterization specifically to elucidate the origin of the enhanced low-temperature CO oxidation activity associated with Pt modification, rather than as an overall or intrinsically more SO2-tolerant catalyst.
2.3. Catalyst Characterization Results
2.3.1. Pore Structure Properties
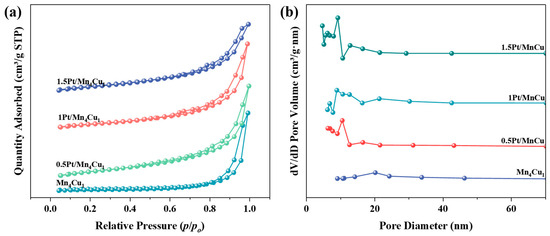
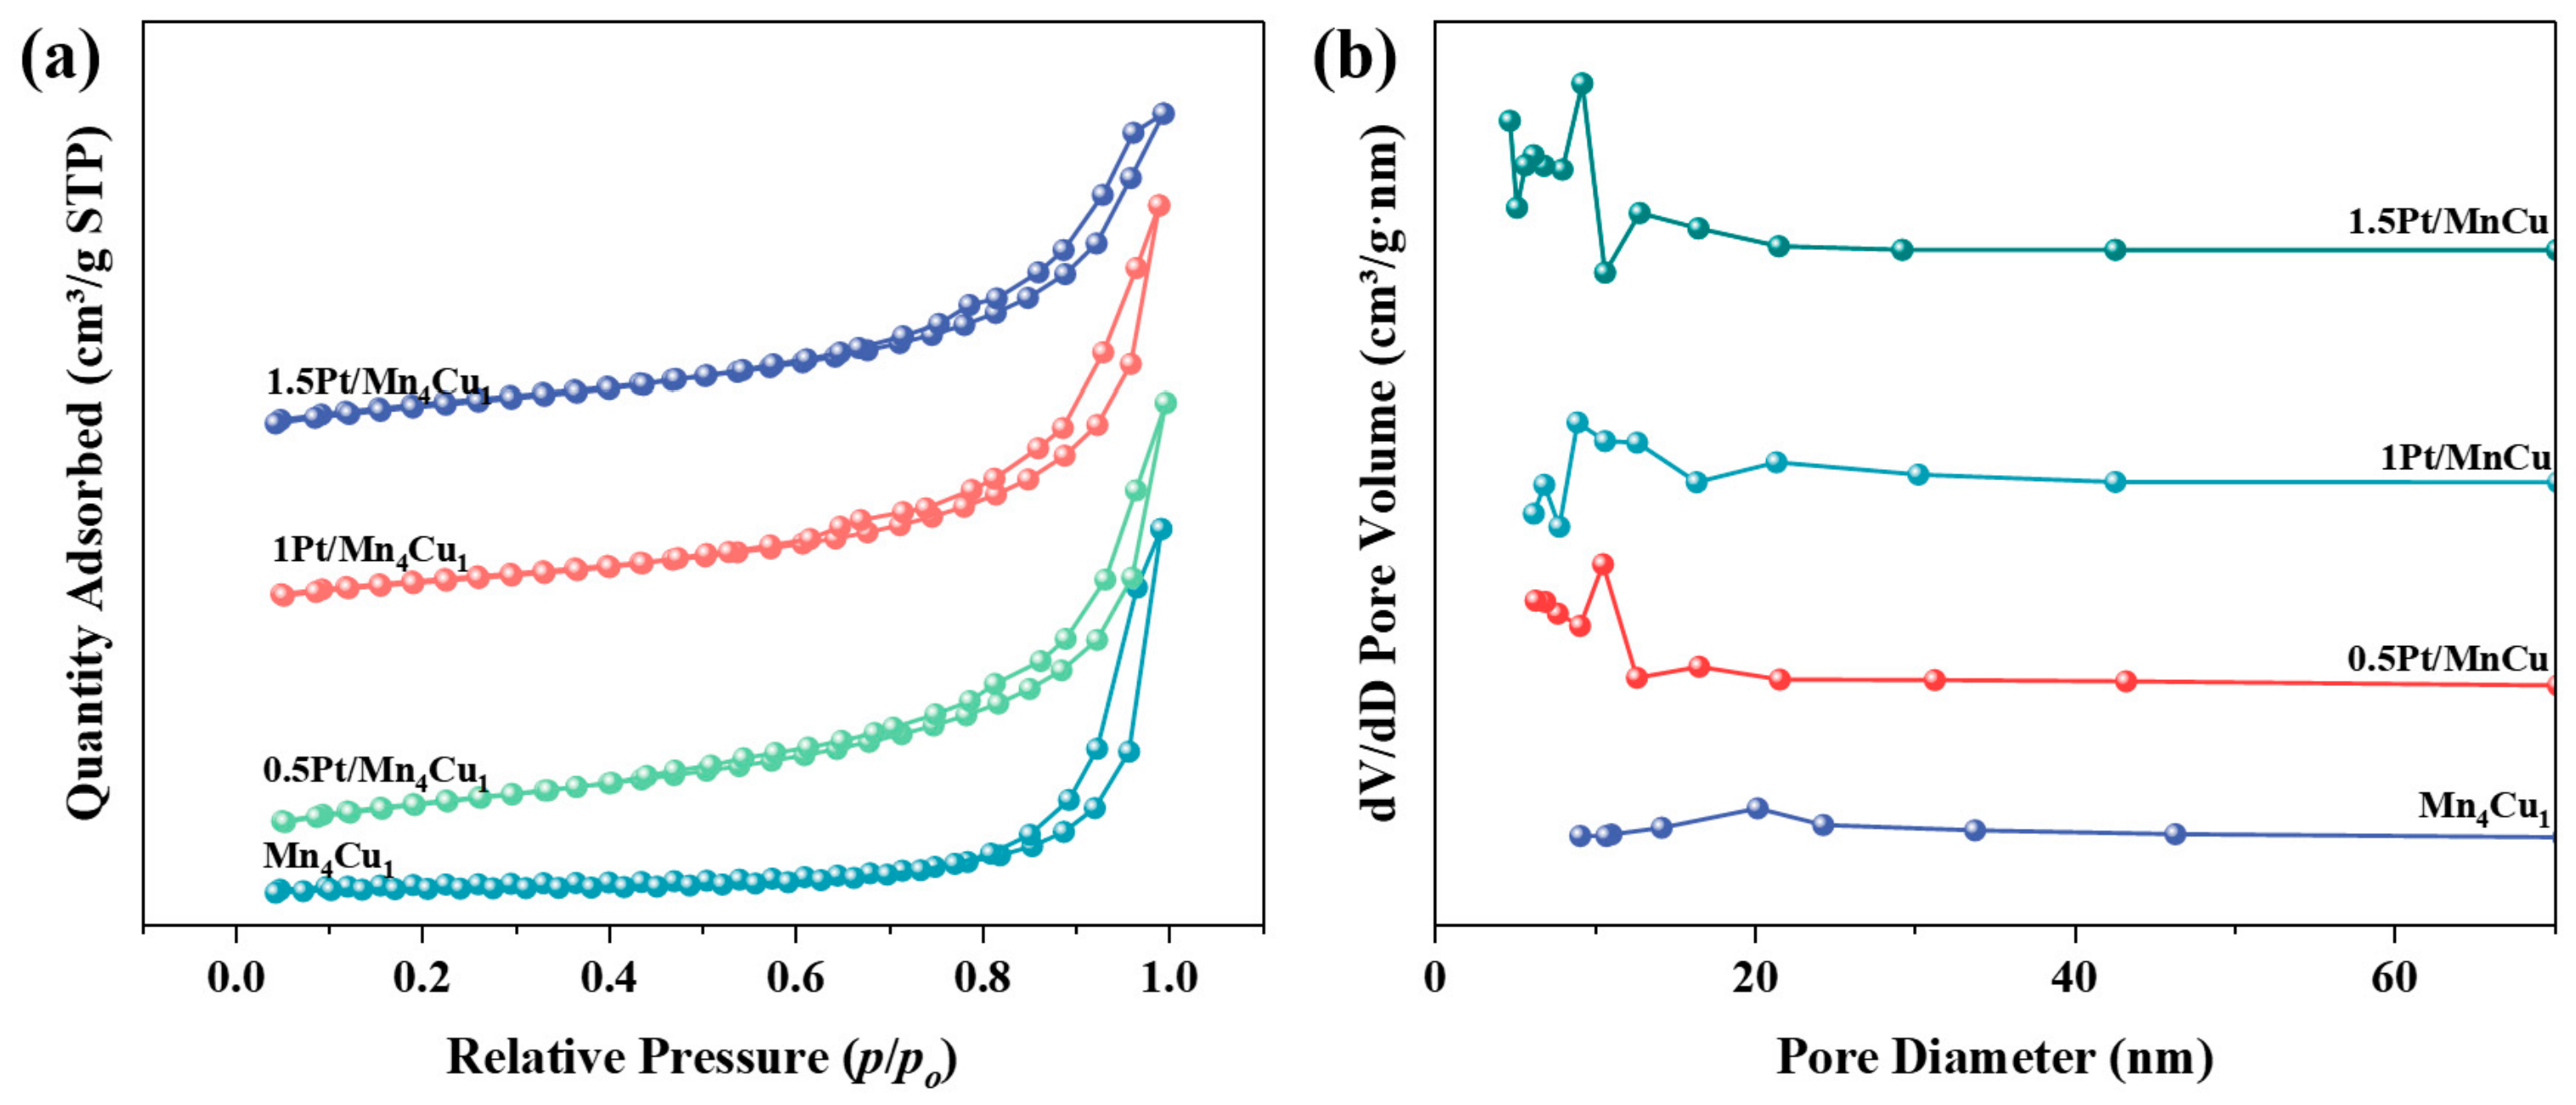
N2 adsorption–desorption technique was employed to characterize the catalysts and investigate the specific surface area and pore structure properties of Pt/MnCu catalysts with different Pt loadings. The results are shown in Figure 5 and Table 1.
Figure 5.
(a) N2 adsorption–desorption isotherms and (b) pore size distribution of Pt/MnCu catalysts with different Pt loadings.
Table 1.
Pore structure characteristics of Pt/MnCu catalysts with different Pt loadings.
As shown in Figure 5, all catalysts exhibited type IV isotherms with H3 hysteresis loops, indicating a significant increase in adsorption volume at high pressure and an irregular pore structure [32]. Further analysis revealed that the average pore diameter of all catalysts ranges from 2 to 50 nm, indicating the formation of a mesoporous structure. Yi et al. [33] demonstrated through experiments that such a pore structure facilitates heterogeneous reactions, allowing reactant molecules to diffuse more easily into the internal pores of the catalyst and increasing the contact opportunity between reactants and catalyst active sites.
From Table 1, it can be seen that the 1Pt/MnCu catalyst has the smallest average pore diameter and a relatively large pore volume. The order of BET specific surface area was 1Pt/MnCu (147.83 m2/g) > 1.5Pt/MnCu (125.14 m2/g) > 0.5Pt/MnCu (115.65 m2/g) > Mn4Cu1 (45.53 m2/g), which was completely consistent with the order of catalytic activity. Compared with Mn4Cu1, all Pt-modified catalysts exhibited substantially higher specific surface areas, which may be attributed to Pt-induced changes in the surface and pore structures, favoring the formation or preservation of mesopores. The highest BET surface area was observed for 1Pt/MnCu, suggesting that 1 wt% Pt may provide a favorable balance for pore development, whereas further Pt loading may induce structural changes or partial aggregation, leading to a decrease in accessible surface area. The increased specific surface area may facilitate the contact between reactant molecules and the catalyst surface and thus contribute to the enhanced CO oxidation activity [34]. However, the variation in catalytic activity does not simply follow the BET surface area, indicating that the improved performance is not solely determined by textural properties but rather results from the combined effects of surface structure and chemical characteristics induced by Pt modification. The surface-area-normalized reaction rates were calculated at 50 °C, and the corresponding values were 2.95 × 10⁻⁴ molCO·m−2·h−1 for 0.5Pt/MnCu, 2.57 × 10⁻⁴ molCO·m−2·h−1 for 1.5Pt/MnCu, 2.44 × 10⁻⁴ molCO·m−2·h−1 for 1Pt/MnCu, and 1.41 × 10⁻⁴ molCO·m−2·h−1 for Mn4Cu1. These results provide an additional comparison of catalytic activity after normalization by the BET surface area. Compared with the macroscopic activity reflected by CO conversion, the surface-area-normalized rates further indicate that Pt modification enhances the CO oxidation activity on a unit-BET-surface-area basis rather than simply improving the apparent performance through an increase in surface area. Notably, although 1Pt/MnCu exhibits the highest CO conversion, its normalized reaction rate is slightly lower than those of 0.5Pt/MnCu and 1.5Pt/MnCu, suggesting that its superior apparent performance is also associated with its relatively high BET surface area. Therefore, both CO conversion and surface-area-normalized reaction rates were considered in evaluating the catalytic performance of the catalysts.
2.3.2. Phase Analysis
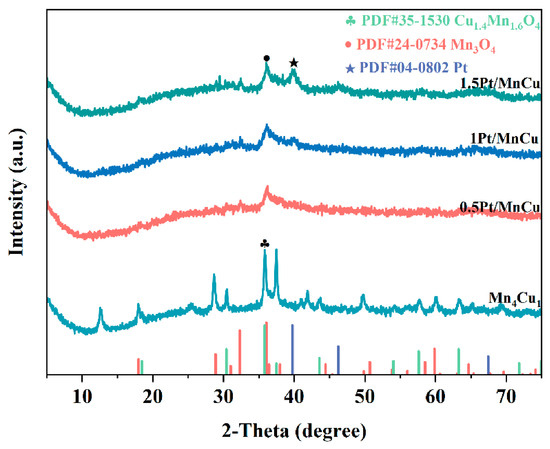
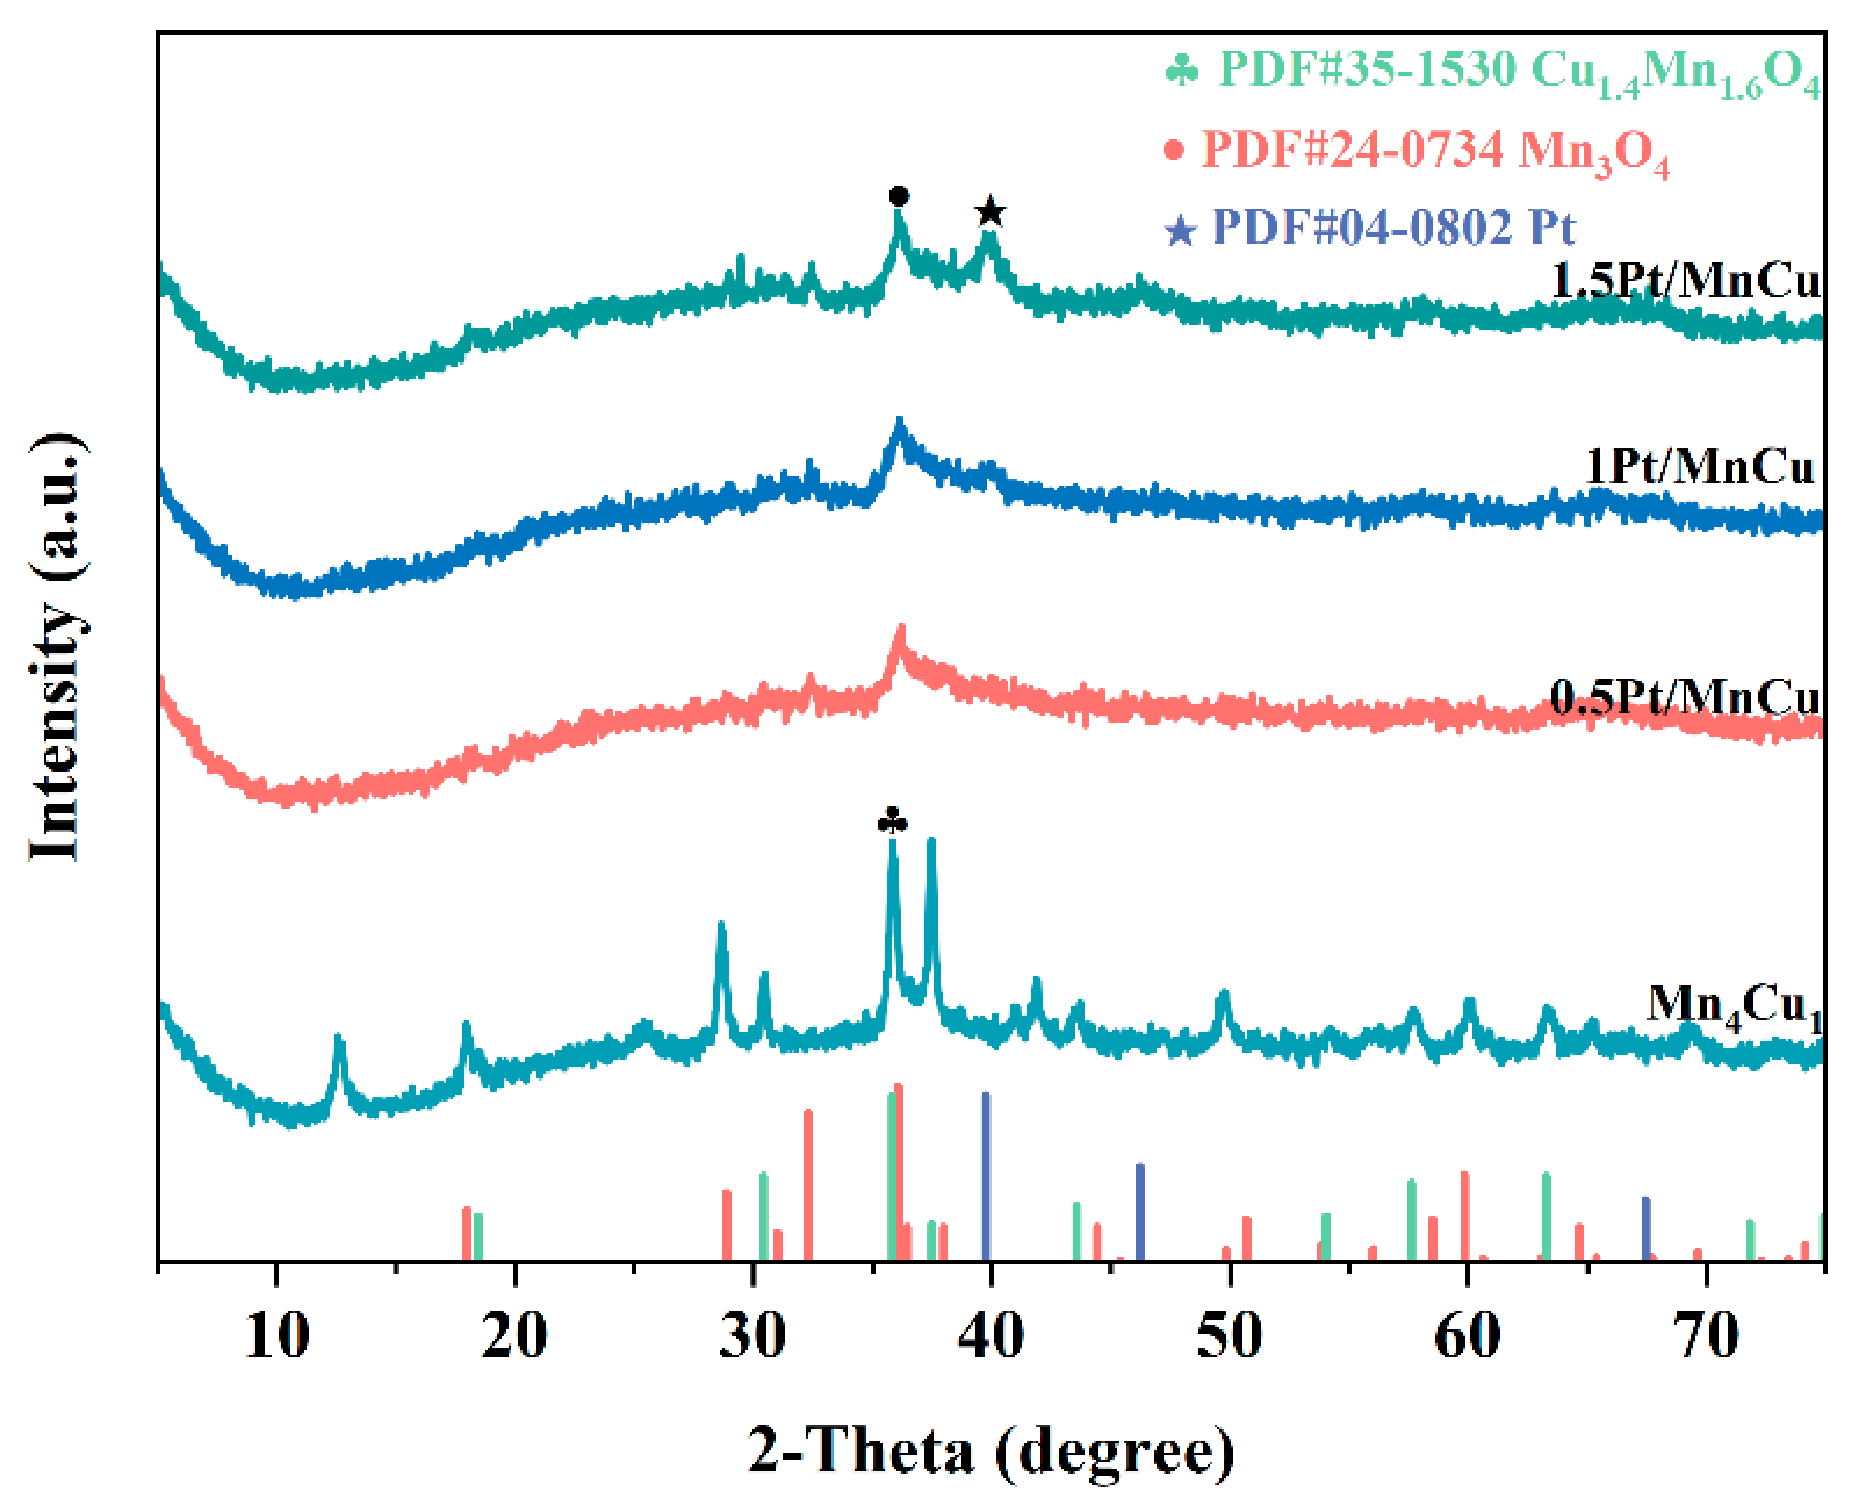
XRD was employed to characterize the catalysts and investigate the effect of Pt loading on the phase structure of Pt/MnCu catalysts. The results are shown in Figure 6. Mn4Cu1 exhibited a characteristic diffraction peak of the spinel Cu1.4Mn1.6O4 phase at 35.8° (PDF#35-1530). After Pt loading, the XRD patterns changed significantly: the characteristic diffraction peak of the Cu1.4Mn1.6O4 phase at 35.8° disappeared, and instead, a characteristic diffraction peak of the Mn3O4 phase appeared at 36.2° (PDF#24-0734). This is attributed to the interaction between manganese and copper oxides, which alters the valence state of Mn and the crystal form of MnOx, thereby enhancing catalytic performance [35].
Figure 6.
XRD patterns of Pt/MnCu catalysts with different Pt loadings.
As the Pt loading increased to 1.0 wt.%, this diffraction feature appeared extremely faint, indicating that the Pt species had low crystallinity and potentially structural defects. However, when the Pt loading was further increased to 1.5 wt.%, a characteristic diffraction peak of Pt appeared in the XRD pattern (PDF#04-0802), indicating that Pt species began to agglomerate beyond a certain Pt loading, forming Pt particles with a certain crystal structure. Wang et al. [35] demonstrated through experiments that uniformly dispersed Pt species and defects were beneficial to the catalytic performance. Agglomeration may lead to a reduction in active sites on the catalyst surface, thereby adversely affecting catalytic performance [36].
2.3.3. Elemental Analysis
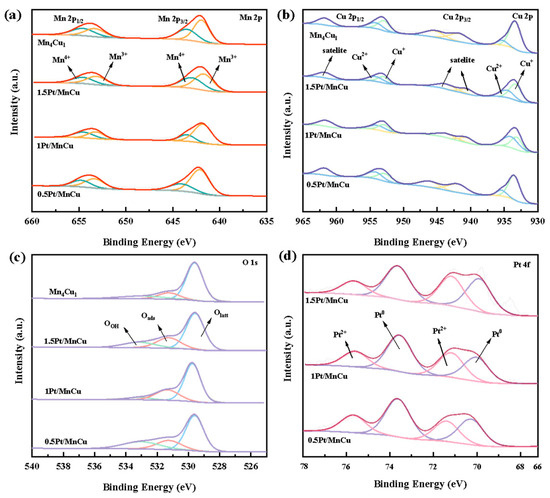
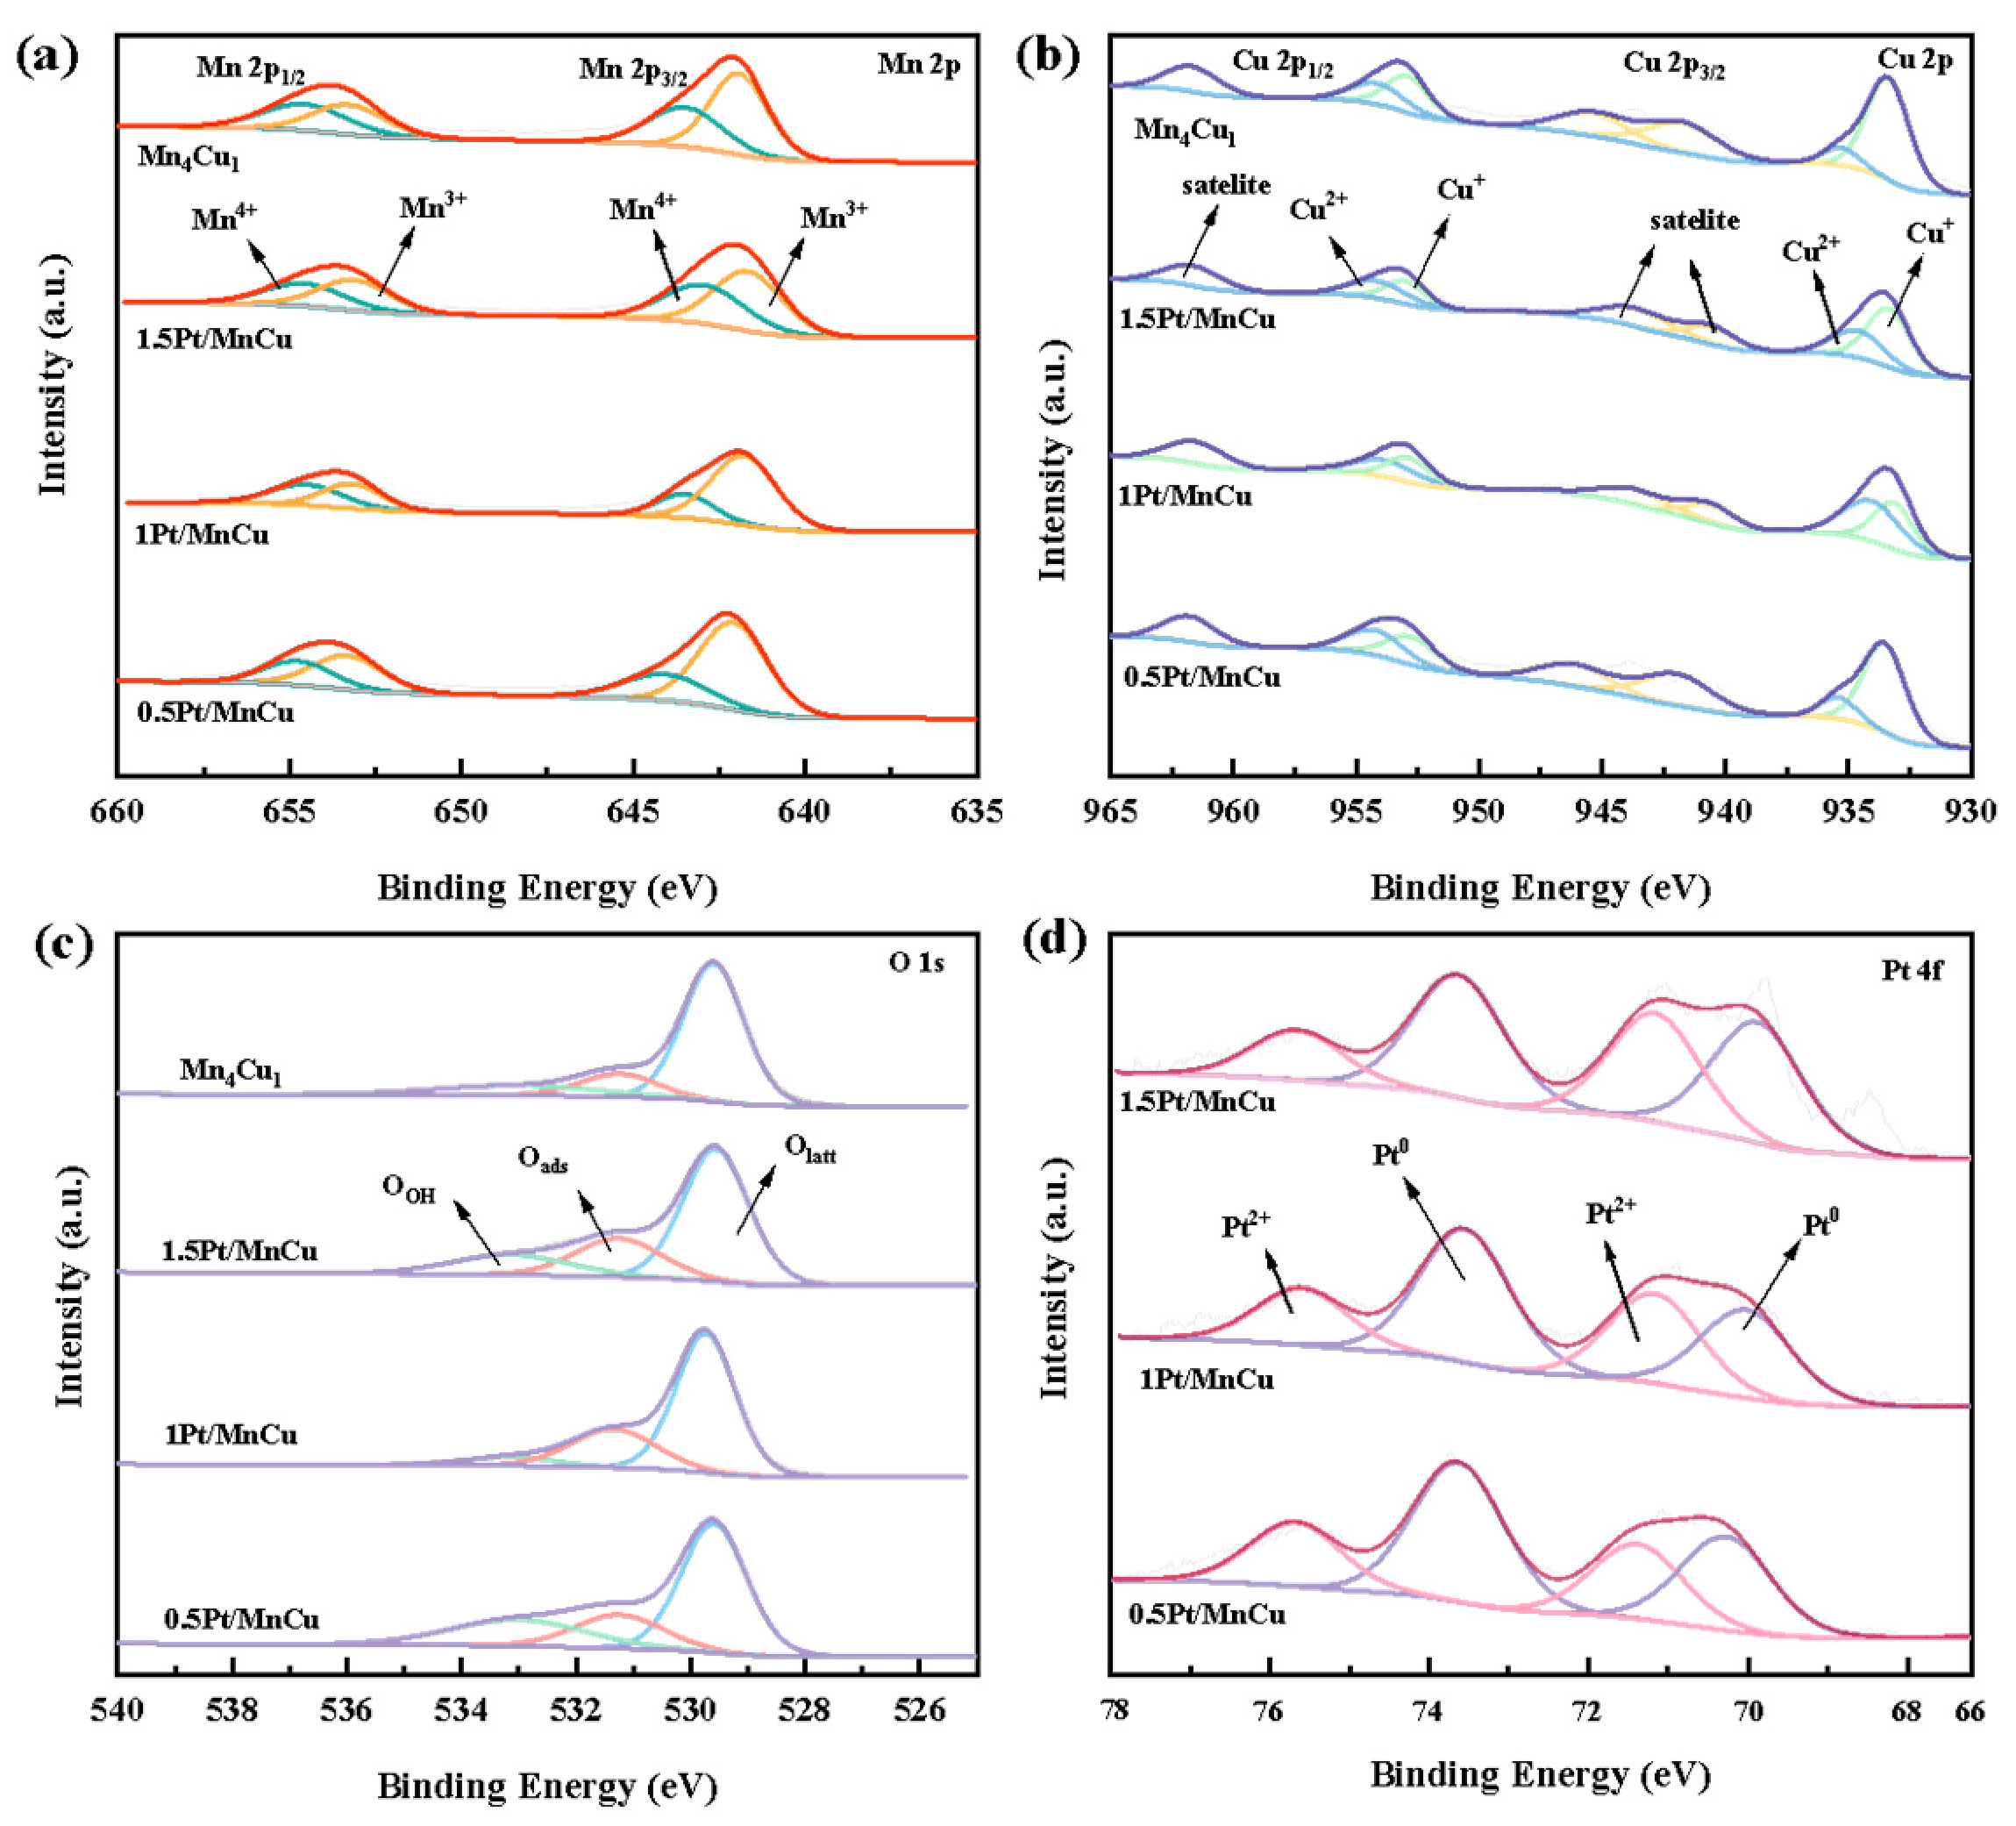
XPS was employed to investigate the effect of Pt loading on the surface chemical properties and metal valence states of the catalysts. The Mn 2p, Cu 2p, O 1s, and Pt 4f spectra of all catalysts are shown in Figure 7. Combined with the peak fitting results and corresponding peak areas, the proportions of surface Mn3+, Oβ, and Cu+ were quantitatively analyzed, and the results are listed in Table 2.
Figure 7.
XPS spectra of Pt/MnCu catalysts with different Pt loadings. (a) Mn 2p spectra and Mn valence states; (b) Cu 2p spectra and Cu valence states; (c) O 1s spectra and surface oxygen species; (d) Pt 4f spectra and Pt valence states.
Table 2.
Surface element characteristics and H2 consumption of Pt/MnCu catalysts with different Pt loadings.
As shown in Figure 7a, the Mn 2p spectra displayed Mn 2p1/2 and Mn 2p3/2 spin–orbit peaks at 642.3 eV and 654 eV. To further clarify the specific valence state distribution of Mn, the Mn 2p1/2 peak and the Mn 2p3/2 peak were fitted into two independent peaks, respectively. The fitted peaks at 641.7–642.1 eV and 653.1–653.3 eV were attributed to Mn3+ species, whereas the peaks at 643.5–644.2 eV and 654.5–654.8 eV corresponded to Mn4+ species [37,38].
As shown in Table 2, compared with Mn4Cu1, the Pt-loaded catalysts all exhibited an increase in the proportion of Mn3+. The order of Mn3+ proportion was 1Pt/MnCu (0.71) > 0.5Pt/MnCu (0.68) > 1.5Pt/MnCu (0.64) > Mn4Cu1 (0.59). It can be seen that as Pt loading increased, the Mn3+ proportion of Pt/MnCu catalysts first increased and then decreased, with the highest Mn3+ proportion achieved at a Pt loading of 1 wt.%. The above results clearly showed that the order of Mn3+ proportion was completely consistent with the order of catalytic activity. Studies have shown that Mn3+ can induce the formation of oxygen vacancies, a process that involves maintaining electrostatic balance, as shown in Equation (1) [39]:
where V0 represents an oxygen vacancy.
The presence of Mn3+ can modify the local chemical environment of the catalyst and influence the Mn–O bonding characteristics, which may affect the oxygen storage and release behavior. The higher Mn3+ content observed for 1Pt/MnCu was accompanied by more pronounced oxygen-vacancy-related characteristics, suggesting a correlation between the surface Mn valence state and defect-related properties. The relatively favorable surface chemical properties of 1Pt/MnCu may contribute to its enhanced CO oxidation activity by facilitating oxygen activation and the subsequent oxidation of CO.
The Cu 2p spectra of all catalysts exhibited multiple peaks, as shown in Figure 7b. The Cu 2p spectra exhibited four main peaks and three satellite peaks, which belonged to the Cu 2p3/2 orbital peak (933.2–935.4 eV) and its satellite peak (940.7–946.2 eV) and the Cu 2p1/2 orbital peak (953–954.2 eV) and its satellite peak (961.7–962 eV), respectively. The Cu 2p1/2 peak was fitted into two independent peaks with binding energies of 953 eV and 954.3 eV, corresponding to the characteristic peaks of Cu+ and Cu2+, respectively [40]. Similarly, the Cu 2p3/2 peak was also deconvoluted into two peaks with binding energies of 933.5 eV and934.7 eV, corresponding to the characteristic peaks of Cu+ and Cu2+, respectively [40]. In summary, the Cu 2p XPS spectra revealed that the catalyst surfaces contain both Cu2+ and Cu+ species, implying the coexistence of CuO and Cu2O in all samples. Furthermore, Table 2 shows that 1Pt/MnCu had the highest proportion of Cu2+. According to the redox cycle of Mn3+ + Cu2+ ↔ Mn4+ + Cu+, a higher Cu2+ content promotes the presence of more Mn3+, which facilitates the CO oxidation reaction, consistent with the analysis results of the Mn 2p spectra.
To investigate the oxygen species on the catalyst surface, the O 1s spectra of all catalysts are shown in Figure 7c. Based on the experimental results of Liu et al. [41], the peak at a lower binding energy (approximately 528.7 eV) is assigned to lattice oxygen (Oα), while the peak at a higher binding energy (approximately 530.9 eV) is attributed to adsorbed oxygen (Oβ). According to Chen et al. [42], the peak at 533.4 eV represents surface hydroxyl oxygen (Oλ). Yan et al. [43] reported that Oβ possesses higher mobility than Oα, which can accelerate the redox cycle and thereby promote CO catalytic oxidation. The proportion of surface-adsorbed oxygen species to total surface oxygen was obtained by calculating the peak area percentages, as listed in Table 2. Compared with Mn4Cu1, all Pt-loaded catalysts showed an increase in Oβ proportion. As the Pt loading increased, the Oβ proportion of Pt/MnCu catalysts first increased and then decreased, with the order being 1Pt/MnCu (0.26) > 1.5Pt/MnCu (0.2) > 0.5Pt/MnCu (0.18) > Mn4Cu1 (0.13). Compared with the other catalysts, 1Pt/MnCu, which exhibited excellent catalytic activity, had the highest surface-adsorbed oxygen species content, indicating that it adsorbed more oxygen species. Furthermore, by comparing the binding energies of Oβ and Oα among different catalysts, it is found that the Pt-loaded Pt/MnCu catalysts exhibit lower binding energies, making the oxygen species more easily activated to participate in chemical reactions, which is more favorable for CO oxidation. Therefore, the higher activity of oxygen species in Pt/MnCu further explains why Pt/MnCu catalysts exhibit higher catalytic activity than Mn4Cu1.
To investigate the effect of Pt loading on the morphology and valence state distribution of Pt species on the catalyst surface, XPS analysis was performed on the Pt 4f orbital characteristic peaks, as shown in Figure 7d. All samples were deconvoluted into four characteristic peaks: the peaks at binding energies of 73.8 and 70.4 eV corresponded to metallic Pt0 species; the peaks at 71.6 and 75.5 eV were assigned to the Pt2+ oxidation state [44,45]. The above results indicate that the surfaces of the 0.5Pt/MnCu, 1.5Pt/MnCu and 1Pt/MnCu catalysts contained a coexistence of Pt0 and Pt2+ species. Notably, the lower binding energy of Pt2+ in 1Pt/MnCu suggests that Pt doping enhances the metal–metal interactions [44]. It should be noted that the Pt 4f deconvolution presented here is intended primarily for qualitative identification of the possible Pt chemical states rather than quantitative determination of their relative proportions. Therefore, the fitted peak components should be interpreted with caution, and the deconvolution is used only as supporting information for the discussion of the Pt chemical state.
2.3.4. Raman Analysis
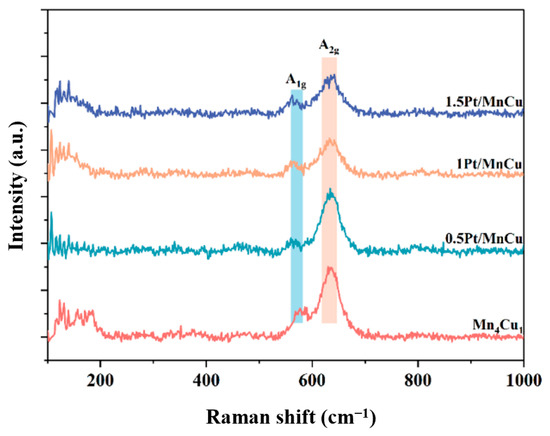
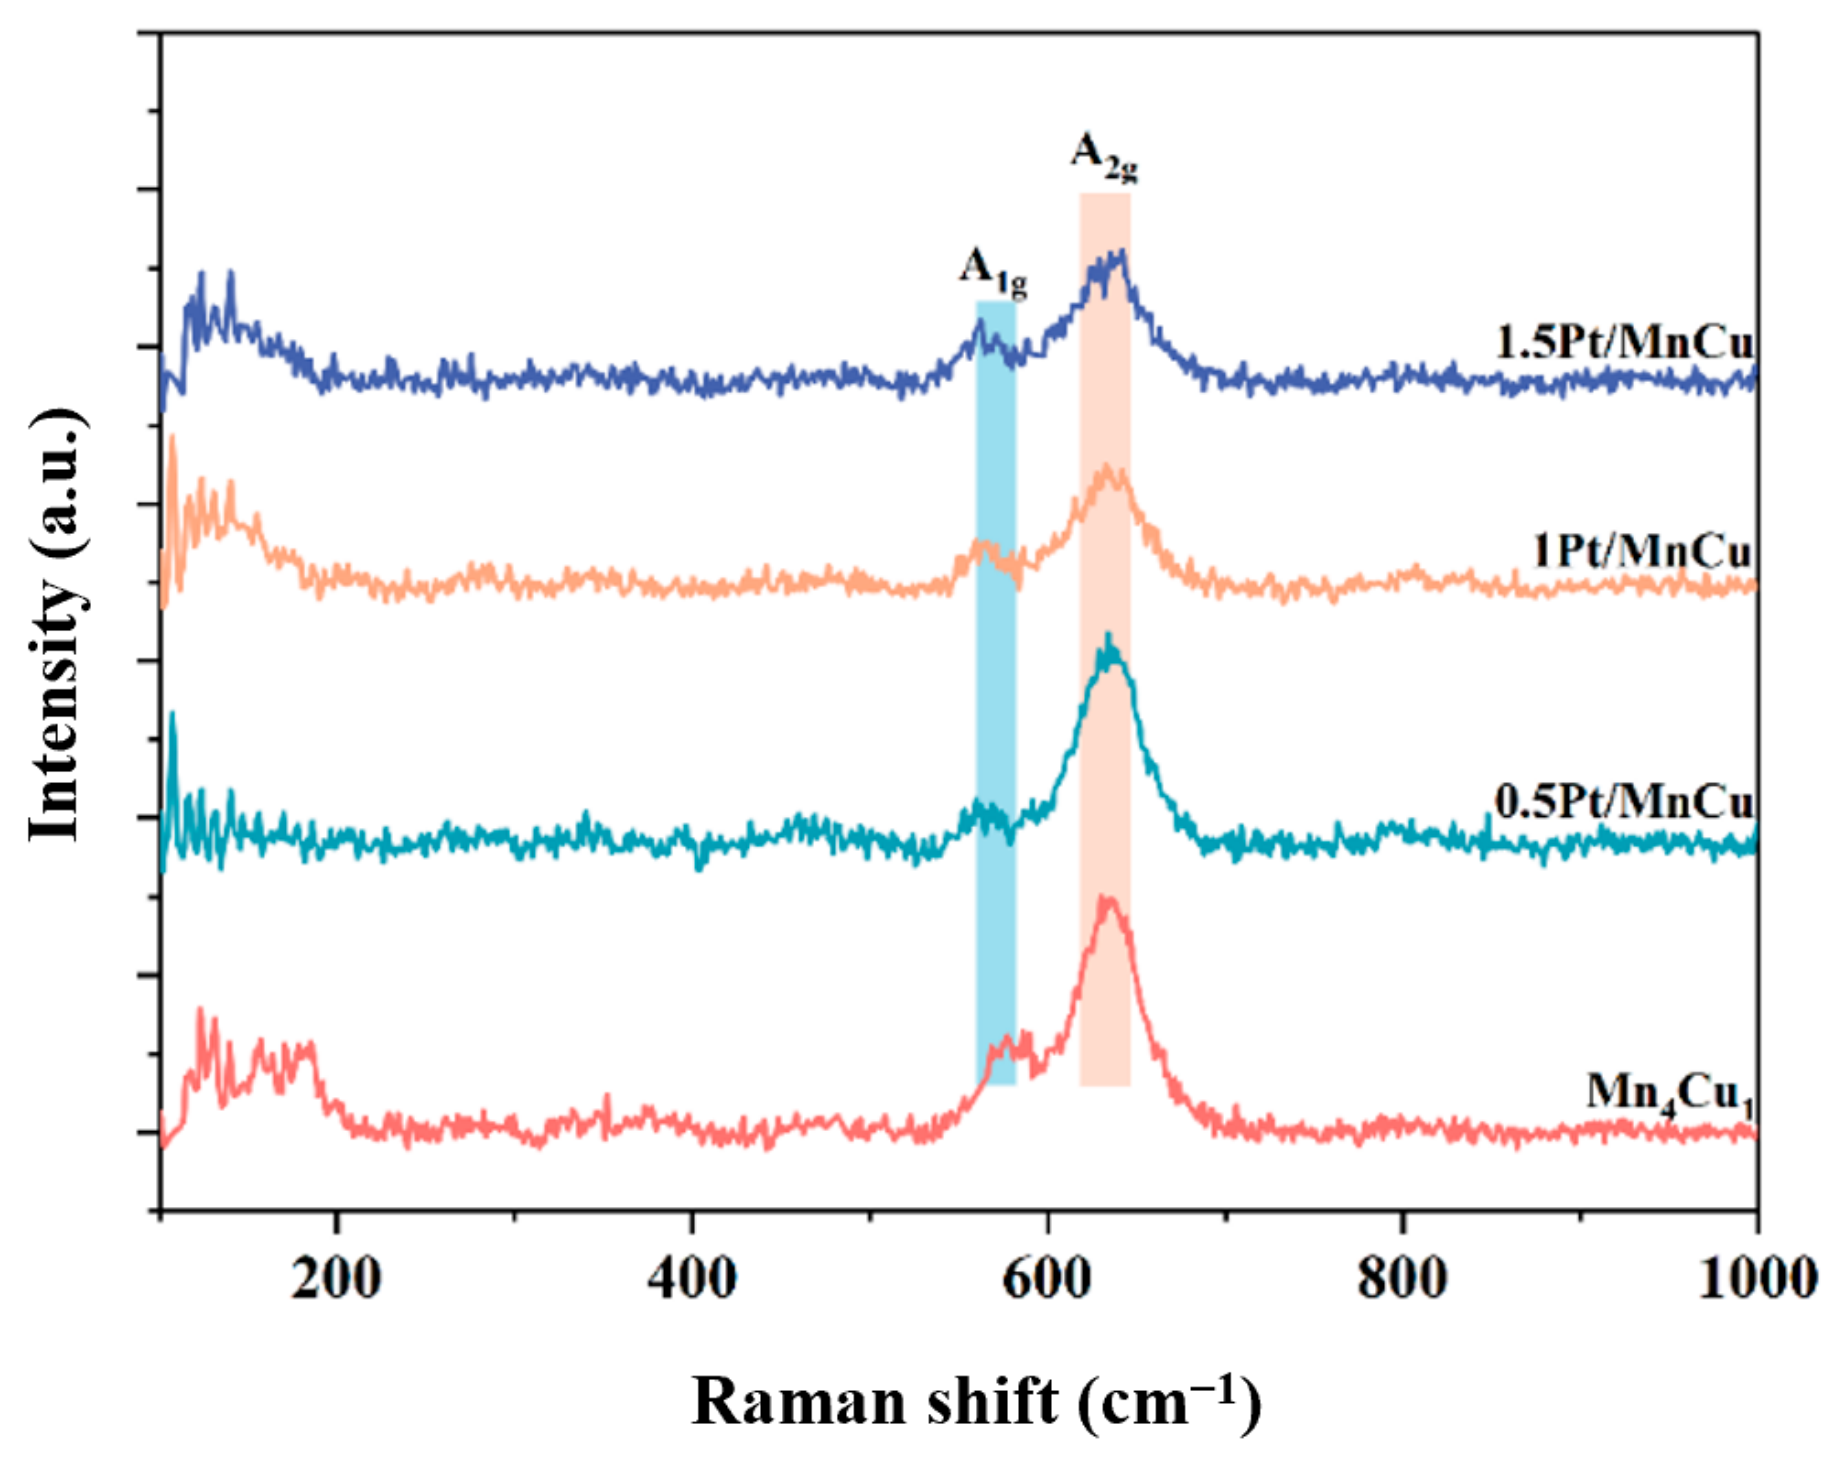
Raman spectroscopy was employed to analyze the effect of Pt loading on the vibration of Mn–O bonds and the interaction between Pt and Mn in the catalysts. The results are shown in Figure 8. All catalysts exhibited a distinct feature, namely a main peak located at 640 cm−1. Additionally, two peak bands appeared at 571 cm−1 and 640 cm−1, labeled as A1g and A2g, respectively. These bands corresponded to different Raman absorption peaks, specifically the Mn–O chain stretching vibration and the vibration of Mn–O perpendicular to the direction of the [MnO6] octahedral double chains [46].
Figure 8.
Raman spectra of Pt/MnCu catalysts with different Pt loadings.
The A2g band of the Pt-loaded catalysts shifted to higher wavenumbers, indicating that the addition of metallic Pt caused a change in the vibration mode of the [MnO6] octahedra. This implies a strong interaction between Pt and Mn in the catalyst system, which may affect the nature of the Mn–O bonds and alter the structural characteristics of the catalyst [47]. This change suggests that the introduction of Pt may enhance the interaction between Mn and oxygen, thereby influencing the activity and stability of the catalyst.
2.3.5. Redox Analysis
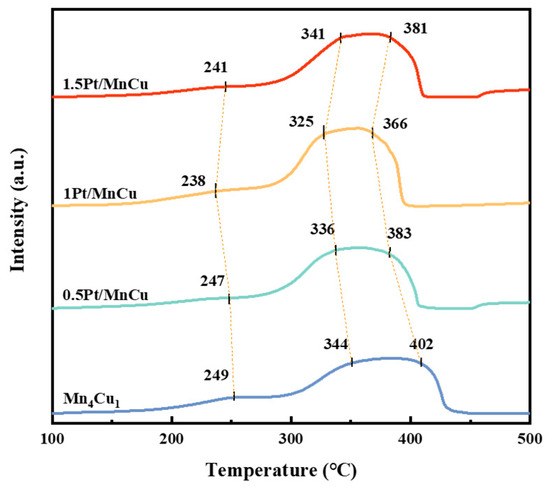
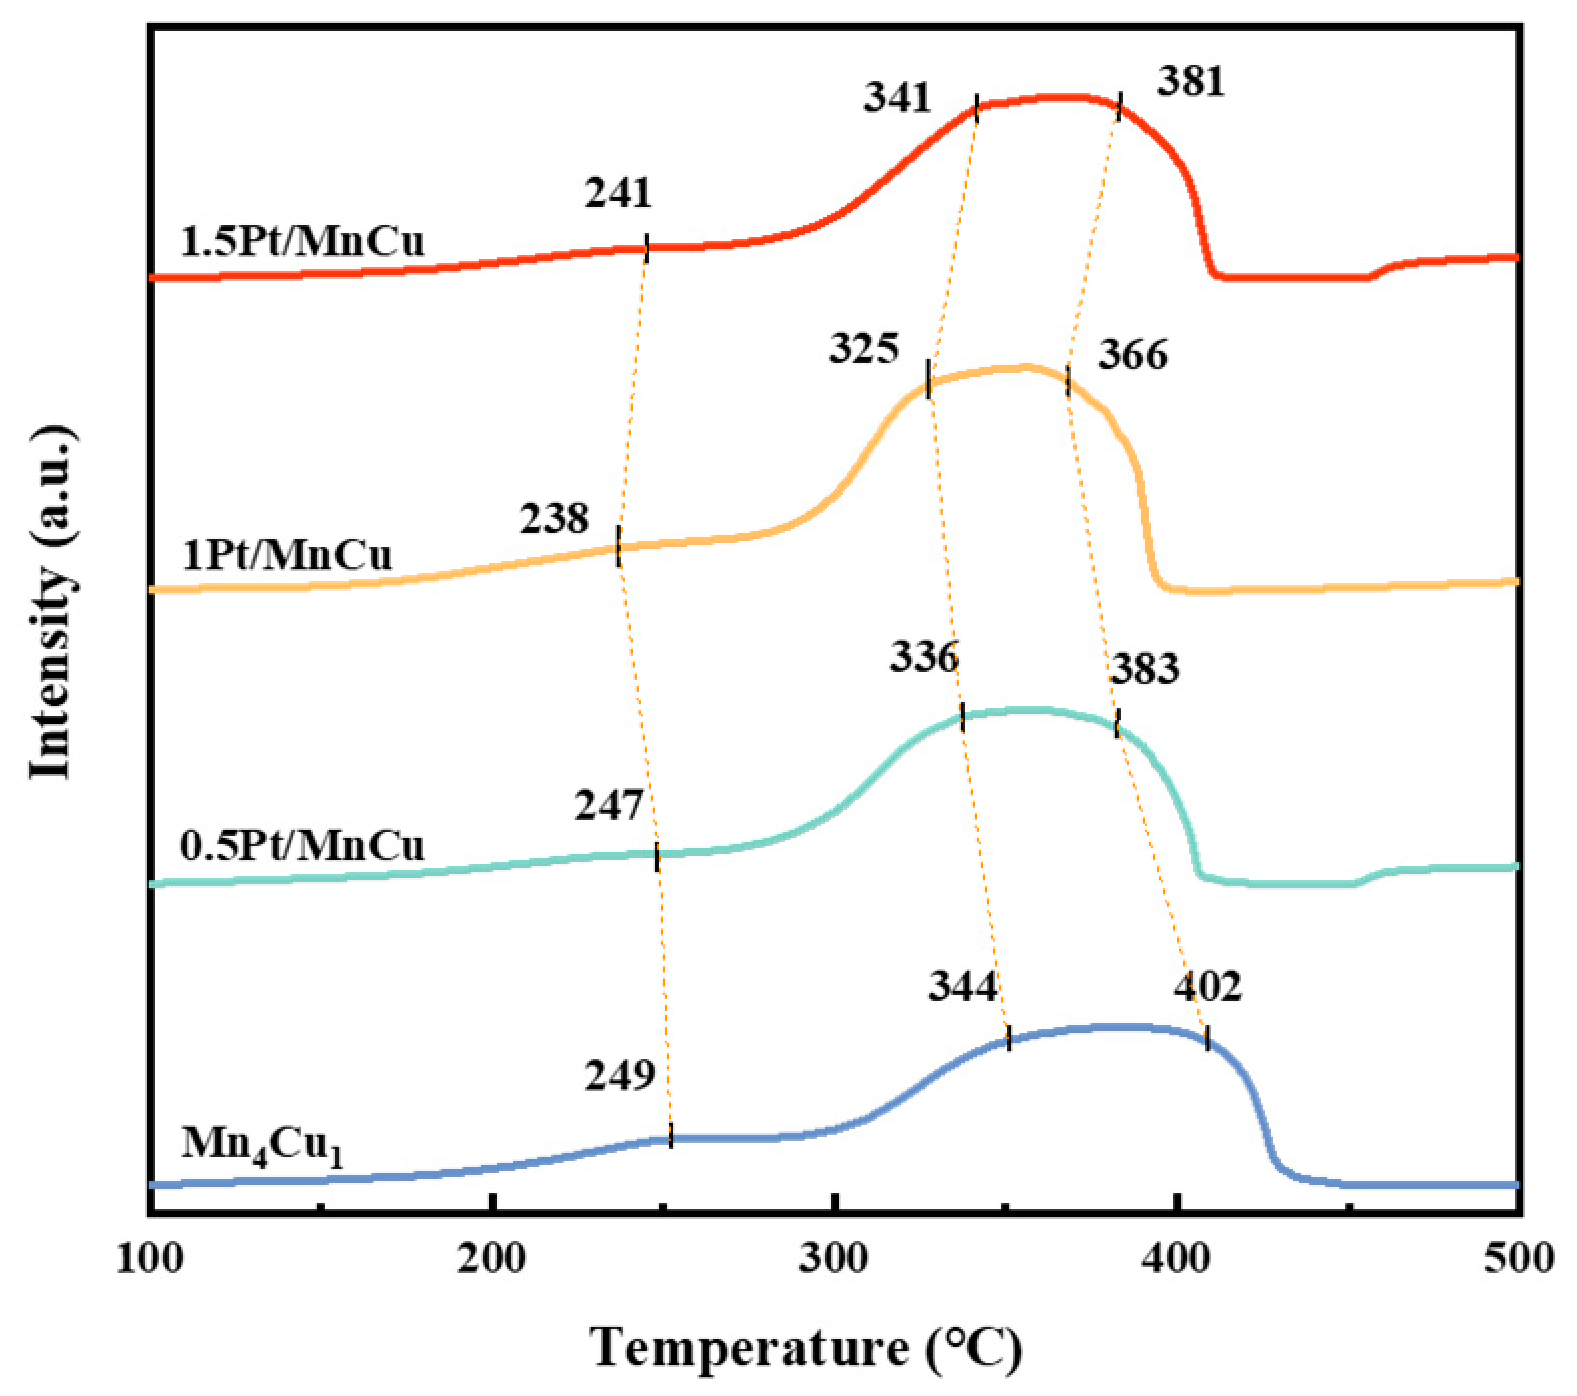
To evaluate the reducibility of the catalysts after Pt loading, H2-TPR experiments were conducted, and the results are shown in Figure 9. The low-temperature peak corresponds to the Cu2+/Cu+ → Cu0 transition. Subsequent peaks represent the stepwise reduction of manganese species (Mn4+ → Mn3+ and Mn3+ → Mn2+) [43,48,49]. As shown in Figure 9 and Table 2, 1Pt/MnCu exhibited the lowest reduction peak temperature, and the reduction peak temperatures of all samples loaded with Pt shifted toward lower temperatures. This indicates that the catalysts could undergo reduction reactions at lower temperatures. The H2 consumption after Pt loading followed the order: 1Pt/MnCu (0.96 mmol·g−1) > 0.5Pt/MnCu (0.88 mmol·g−1) > 1.5Pt/MnCu (0.85 mmol·g−1) > Mn4Cu1 (0.77 mmol·g−1). The increase in H2 consumption suggests that the catalysts can react with more hydrogen during the reduction process, indicating that more reducible species exist on the catalyst surface, or that these reducible species are more easily reduced.
Figure 9.
H2-TPR of Pt/MnCu catalysts with different Pt loadings.
Considering the shift of the reduction peaks to lower temperatures and the increase in H2 consumption, it can be seen that the redox ability of the catalysts is significantly improved after Pt loading. Lower reduction temperatures and higher H2 consumption both indicate that the catalysts are more active in redox reactions and can participate more efficiently. The 1Pt/MnCu exhibited the lowest reduction peak temperature and the highest hydrogen consumption, indicating that it had the strongest redox capacity, which was closely related to its high activity. Together with the XPS results, these observations suggest that Pt modification altered the redox-related surface properties of the catalyst, which may contribute to the improved low-temperature CO oxidation activity.
2.3.6. CO Adsorption Performance Analysis
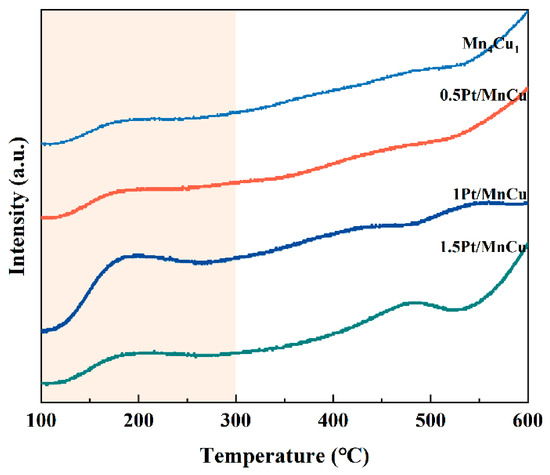
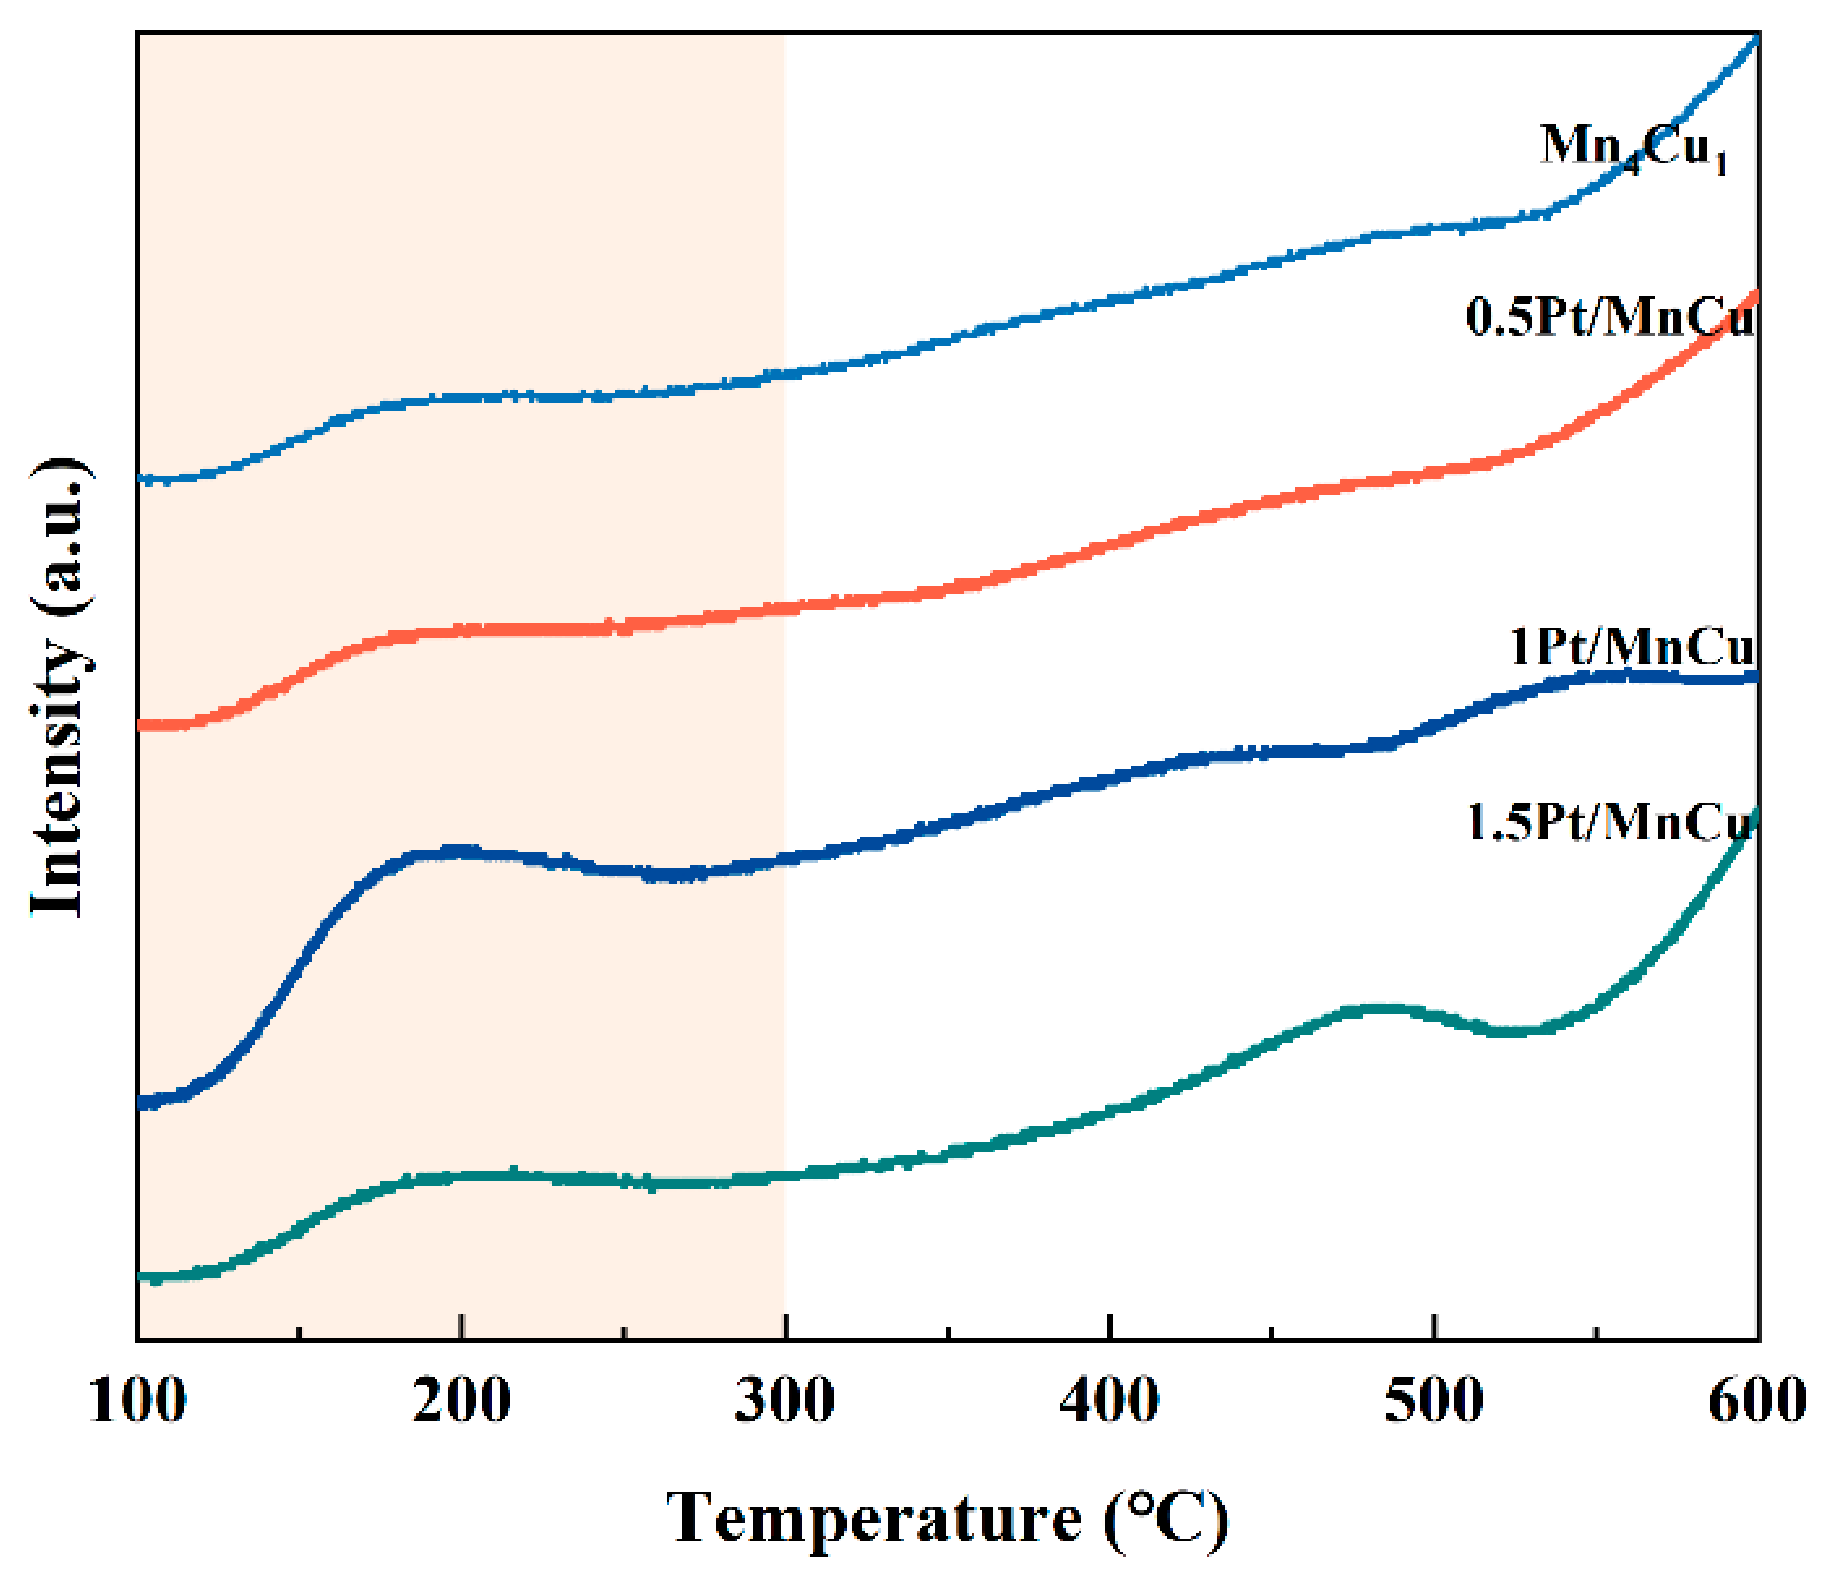
To deeply investigate the surface characteristics and CO activation ability of the Pt/MnCu catalysts, the adsorption–desorption behavior of the catalysts was systematically analyzed by CO-TPD, and the results are shown in Figure 10. All catalysts exhibited an initial CO2 desorption peak in the temperature range of 100–300 °C. After Pt loading, the CO consumption peak intensity of all catalysts increased compared with the Mn4Cu1 catalyst, with 1Pt/MnCu showing a significantly higher CO consumption peak intensity than the other catalysts. In addition, the peak width of 1Pt/MnCu was considerably larger. According to the experimental results of Padilla et al. [50], this observation indicates that the catalyst contains more CO adsorption sites, thereby confirming its superior CO adsorption and desorption capability.
Figure 10.
CO-TPD of Pt/MnCu catalysts with different Pt loadings.
Overall, 1Pt/MnCu exhibited the highest low-temperature CO oxidation activity and favorable transient CO-conversion retention during SO2 exposure. Although 1.5Pt/MnCu showed a comparable SO2-induced deactivation behavior, the higher Pt loading did not provide a further improvement in low-temperature activity. Considering the high cost of Pt, 1Pt/MnCu was selected as the practically preferred Pt loading. Thus, its selection reflects a balance among low-temperature catalytic activity, the observed SO2-induced deactivation behavior, and Pt utilization efficiency.
3. Experimental Section
3.1. Catalyst Preparation
Pt/MnCu catalysts with different calcination temperatures and different Pt loadings were prepared using a redox precipitation method. Solution A was obtained by dissolving 0.5 g of NaOH (Aladdin Biochemical Technology Co., Ltd., Shanghai, China) in 20 mL of a mixed solution of ethanol (Sinopharm Group Co., Ltd., Beijing, China) and deionized water (China University of Petroleum (East China), Qingdao, China). Solution B was made by dissolving 1.52 g of KMnO4 (Sinopharm Group Co., Ltd., Beijing, China) and 0.38 g of Cu(CH3COO)2 (Sinopharm Group Co., Ltd., Beijing, China) in 200 mL of deionized water. A certain amount of 0.2 mol/L chloroplatinic acid solution (Shanghai Macklin Biochemical Co., Ltd., Shanghai, China) was added dropwise to Solution B to obtain Solution C. Subsequently, under peristaltic pump (Longer Precision Pump Co., Ltd., Baoding, China) conditions, Solution A was slowly added dropwise to Solution C, followed by mixing and stirring for 2 h to obtain Suspension D. Next, Suspension D was transferred to a Teflon-lined autoclave (Yanzheng Instrument Co., Ltd., Shanghai, China) and subjected to hydrothermal treatment at 140 °C for 12 h. After the reaction was completed, precipitate E was collected by centrifugation and washed repeatedly with deionized water until the wash solution reached neutrality, thereby removing residual ions. Finally, the washed precipitate E was dried in an oven (Shanghai Lichen Instrument Technology Co., Ltd., Shanghai, China) at 80 °C for 12 h and then divided equally into two portions and placed in a muffle furnace (Hebi Hengke Instrument and Meter Co., Ltd., Hebi, China) for calcination in an air atmosphere under different conditions. For the first portion, with the Pt loading controlled at 1 wt.%, only the calcination temperature was varied, and the catalyst was calcined at 300 °C, 350 °C, and 450 °C for 2 h. The obtained catalysts were denoted as Pt/MnCu-300, Pt/MnCu-350, and Pt/MnCu-450, respectively. For the second portion, with the calcination temperature controlled at 300 °C, only the Pt loading was varied, and the catalyst was calcined at 0.5 wt.%, 1 wt.%, and 1.5 wt.% for 2 h. The obtained catalysts were labeled as 0.5Pt/MnCu, 1Pt/MnCu, and 1.5Pt/MnCu, respectively.
3.2. Catalytic Activity Evaluation
The catalytic activity evaluation system mainly consisted of three parts: a gas distribution system, a temperature-programmed reaction system, and an analysis and measurement system. In the gas distribution section, N2 (Qingdao Xinkeyuan Technology Co., Ltd., Qingdao, China), CO (Qingdao Xinkeyuan Technology Co., Ltd., Qingdao, China), O2 (Qingdao Xinkeyuan Technology Co., Ltd., Qingdao, China), and SO2 (Qingdao Xinkeyuan Technology Co., Ltd., Qingdao, China) flowed from their respective branches and merged into a single gas line for mixing. The total flow rate of the feed gas was controlled at 150 mL/min, consisting of 1% CO, 16% O2, 50 ppm SO2, and 10% H2O, with N2 as the balance gas. The gas hourly space velocity (GHSV) was adjusted by varying the catalyst mass.
The catalytic activity for CO oxidation was evaluated as follows. First, a layer of quartz wool was placed in the middle of a quartz tube, and then 100 mg of catalyst sample was loaded into the tube. Next, the quartz tube was vertically fixed onto a fixed-bed reactor (inner diameter = 8.00 mm). Subsequently, the feed gas was introduced at a total flow rate of 150 mL/min. The catalytic activity tests for CO oxidation over all catalysts were carried out in the temperature range of 25–300 °C, with one data point recorded every 25 °C. The reaction temperature was controlled by two thermocouples located at the center of the fixed bed. Finally, an MGA6plus infrared flue gas analyzer (MRU Messgeräte GmbH, Neckarsulm, Germany) was used to sample and analyze the inlet and outlet gases. The catalytic activity of the catalyst was evaluated by CO conversion, which was calculated from the CO concentrations at the inlet and outlet at each temperature. The CO conversion was obtained from Equation (2):
where [CO]in represents the CO concentration in the inlet gas (ppm) and [CO]in denotes the CO concentration in the outlet gas (ppm).
3.3. Characterization Methods
- (1)
- N2 adsorption–desorption analysis
First, a certain amount of catalyst sample was weighed and placed into an ASAP 2020 physical adsorption instrument (Micromeritics Instrument Corporation, Norcross, GA, USA). Subsequently, the sample was subjected to degassing treatment under vacuum at 300 °C for 4 h. After the sample cooled to room temperature, it was reweighed, and the net mass of the sample after degassing was recorded. Following the above pretreatment, the sample was placed in a liquid nitrogen environment (77 K), and its pore structure characteristics were measured using N2 adsorption–desorption isotherms. Finally, the specific surface area of the sample was calculated using the BET equation, and the pore size distribution and pore volume data were analyzed using the BJH model.
- (2)
- X-ray diffraction (XRD) analysis
A D/max-2500PC X-ray diffractometer (Rigaku Corporation, Tokyo, Japan) was used to detect the phase composition of the catalysts, with Cu Kα radiation (λ = 0.15418 nm) as the excitation source. The scanning range was 2θ = 5–75°, and the resolution was less than 0.12°.
- (3)
- X-ray photoelectron spectroscopy (XPS) analysis
The surface elemental composition and valence states of the catalysts were analyzed using a K-alpha250Xi X-ray photoelectron spectrometer (Thermo Fisher Scientific, Waltham, MA, USA). A monochromatic Al Kα X-ray source was employed, and the C 1s peak (Eb = 284.6 eV) was used as a reference to calibrate the binding energies of other elements on the catalyst surface.
- (4)
- Raman spectroscopy
A DXR laser Raman spectrometer (Thermo Fisher Scientific, Waltham, MA, USA) was used to characterize the surface structure of the catalysts. During the measurement, the laser wavelength was set to 532 nm, the power was 100 mW, and the scanning range was 100–2000 cm−1.
- (5)
- H2 temperature-programmed reduction (H2-TPR) analysis
A FINESORB-3010 chemisorption analyzer (Finetec Instruments Co., Ltd., Quzhou, China) equipped with a thermal conductivity detector (TCD) was used to evaluate the redox properties of the catalysts, with the TCD recording signals in real time and continuously monitoring hydrogen consumption. First, 0.1 g of catalyst was placed in an Ar atmosphere at 200 °C for pretreatment for 1 h. After the pretreatment, the sample was cooled to room temperature, and a mixed gas of 5% H2/Ar (Qingdao Xinkeyuan Technology Co., Ltd., Qingdao, China) at a flow rate of 30 mL·min−1 was introduced. Subsequently, the temperature-programmed reduction process was carried out at a heating rate of 10 °C·min−1 up to 800 °C.
- (6)
- CO temperature-programmed desorption (CO-TPD) analysis
A FINESORB-3010 chemisorption analyzer (Finetec Instruments Co., Ltd., Quzhou, China) was used to analyze the oxygen species and their content on the catalysts by CO temperature-programmed desorption. First, 0.1 g of catalyst was placed in an Ar atmosphere at 200 °C for pretreatment for 1 h. After the pretreatment, the sample was cooled to room temperature, and a mixed gas of 5% CO/Ar at a flow rate of 30 mL·min−1 was introduced. The adsorption process was carried out under this atmosphere for 1 h. Subsequently, the temperature was increased to 800 °C at a heating rate of 10 °C·min−1, and the TCD recorded signals in real time.
4. Conclusions
This study investigated the effects of different Pt loadings and calcination temperatures on the CO oxidation activity and SO2-induced deactivation behavior of Pt/Mn–Cu catalysts. Subsequently, by varying the Pt loading and employing various characterization techniques, including pore structure analysis, phase analysis, and Raman spectroscopy, the effects of Pt modification on the physicochemical properties and SO2-induced deactivation behavior of Mn–Cu catalysts were further analyzed. The specific findings are as follows:
- (1)
- Both Pt loading and calcination temperature significantly affect the CO oxidation activity of the catalysts. As the Pt loading increased, the catalytic activity of the Pt/MnCu catalysts first increased and then decreased, with 1Pt/MnCu exhibiting the best activity. As the calcination temperature increased, the catalytic activity of the Pt/MnCu catalysts gradually decreased. The 1Pt/MnCu-300 catalyst showed excellent low-temperature activity, achieving 100% CO conversion at 75 °C.
- (2)
- Pt loading and calcination temperature affected the transient CO-conversion response during SO2 exposure. After a period of SO2 introduction, all tested catalysts eventually underwent severe and largely irreversible deactivation, while the Pt-loaded catalysts exhibited different CO-conversion decay profiles compared with the pristine Mn4Cu1 catalyst. Among the catalysts with different calcination temperatures, Pt/MnCu-450 retained high CO conversion for the longest initial period under the tested SO2 exposure conditions. These results indicate that Pt loading and calcination temperature affect the SO2-induced deactivation behavior of the catalysts, but do not by themselves demonstrate differences in intrinsic SO2 tolerance. Furthermore, the presence of H2O affected the CO-conversion response under SO2-containing conditions, although the specific mechanism requires further investigation.
- (3)
- The pore structure and phase composition of the catalysts are substantially modified by the introduction of Pt. N2 adsorption–desorption studies revealed that Pt loading increased the specific surface area and promoted the development of a mesoporous structure, which may facilitate the contact probability between gas molecules and catalyst active sites, thereby contributing to superior catalytic performance. XRD studies demonstrated that after Pt loading, the interaction between manganese and copper oxides was associated with changes in the Mn valence state and crystal structure of MnOx. The XRD results also indicated that Pt-related species exhibited low crystallinity at low Pt loading, while the diffraction features became more pronounced with increasing Pt loading.
- (4)
- The introduction of Pt was associated with changes in the surface properties, redox behavior, and CO adsorption characteristics of the catalysts. XPS results showed that Pt loading altered the surface elemental composition and surface oxygen-related characteristics, while H2-TPR results indicated changes in the redox behavior of the Mn–Cu oxide after Pt modification. Raman analysis further showed that Pt modification was associated with changes in the structural characteristics of the catalyst. CO-TPD results indicated that Pt loading altered the CO adsorption behavior of the catalysts. These changes in the physicochemical properties are collectively associated with the observed differences in low-temperature CO oxidation activity.
Author Contributions
Conceptualization, P.Z.; methodology, Y.J.; software, P.L. and Y.S.; validation, P.Z.; investigation, Y.S. and P.L.; data curation, Y.S. and X.S.; writing—original draft preparation, P.Z., Y.S., and Z.Y.; writing—review and editing, P.Z., P.L., and Z.Y.; project administration, Y.Y. and Z.Y.; funding acquisition, Y.J., Y.Y., and Z.Y. All authors have read and agreed to the published version of the manuscript.
Funding
This work was supported by the National Key Research and Development Program of China (No.2022YFC3703403), the National Natural Science Foundation of China (52476143, U25B20102), the Development Plan for Youth Innovation Teams in Higher Education Institutions of Shandong Province (2023KJ064), the Shandong SMEs Innovation Capability Enhancement Project (2025TSGCCZZB0231), and the Fundamental Research Funds for the Central Universities (26CX07002A).
Data Availability Statement
The original contributions presented in the study are included in the article. Further inquiries can be directed to the corresponding author.
Conflicts of Interest
The authors declare no conflicts of interest.
References
- Shi, S.; Li, H.; Tang, H.; Liu, Y. A study of the impact of de-capacity policies on industry capacity utilization paths: Evidence from the Chinese steel industry. PLoS ONE 2023, 18, e0295613. [Google Scholar] [CrossRef] [Scilit]
- Wen, W.; Deng, Z.; Ma, X.; Xing, Y.; Pan, C.; Liu, Y.; Zhang, H.; Tharaka, W.A.N.D.; Hua, T.; Shen, L. Analysis of the synergistic benefits of typical technologies for pollution reduction and carbon reduction in the iron and steel industry in the Beijing–Tianjin–Hebei region. Sci. Rep. 2024, 14, 12413. [Google Scholar] [CrossRef] [Scilit]
- Wang, S.; Liu, J.; Yi, H.; Tang, X.; Yu, Q.; Zhao, S.; Gao, F.; Zhou, Y.; Zhong, T.; Wang, Y. Trends in air pollutant emissions from the sintering process of the iron and steel industry in the Fenwei Plain and surrounding regions in China, 2014–2017. Chemosphere 2022, 291, 132917. [Google Scholar] [CrossRef] [Scilit]
- Hu, J.; Li, H.; Liu, J.; Du, S. Review of Intelligent Modeling for Sintering Process Under Variable Operating Conditions. Processes 2025, 13, 180. [Google Scholar] [CrossRef] [Scilit]
- Ishida, T.; Murayama, T.; Taketoshi, A.; Haruta, M. Importance of Size and Contact Structure of Gold Nanoparticles for the Genesis of Unique Catalytic Processes. Chem. Rev. 2020, 120, 464–525. [Google Scholar] [CrossRef] [Scilit]
- Soliman, N.K. Factors affecting CO oxidation reaction over nanosized materials: A review. J. Mater. Res. Technol. 2019, 8, 2395–2407. [Google Scholar] [CrossRef] [Scilit]
- Lee, S.; Lin, C.; Kim, S.; Mao, X.; Kim, T.; Kim, S.-J.; Gorte, R.J.; Jung, W. Manganese Oxide Overlayers Promote CO Oxidation on Pt. ACS Catal. 2021, 11, 13935–13946. [Google Scholar] [CrossRef] [Scilit]
- Spezzati, G.; Benavidez, A.D.; DeLaRiva, A.T.; Su, Y.; Hofmann, J.P.; Asahina, S.; Olivier, E.J.; Neethling, J.H.; Miller, J.T.; Datye, A.K.; et al. CO oxidation by Pd supported on CeO2(100) and CeO2(111) facets. Appl. Catal. B Environ. 2019, 243, 36–46. [Google Scholar] [CrossRef] [Scilit]
- Lu, R.; He, L.; Wang, Y.; Gao, X.-Q.; Li, W.-C. Promotion effects of nickel-doped Al2O3-nanosheet-supported Au catalysts for CO oxidation. Chin. J. Catal. 2020, 41, 350–356. [Google Scholar] [CrossRef] [Scilit]
- Fang, C.; Jiang, X.; Hu, J.; Song, J.; Sun, N.; Zhang, D.; Kuai, L. Ru Nanoworms Loaded TiO2 for Their Catalytic Performances toward CO Oxidation. ACS Appl. Mater. Interfaces 2021, 13, 5079–5087. [Google Scholar] [CrossRef] [Scilit]
- Xu, J.; Zhang, J.; Peng, H.; Xu, X.; Liu, W.; Wang, Z.; Zhang, N.; Wang, X. Ag supported on meso-structured SiO2 with different morphologies for CO oxidation: On the inherent factors influencing the activity of Ag catalysts. Microporous Mesoporous Mater. 2017, 242, 90–98. [Google Scholar] [CrossRef] [Scilit]
- Khan, W.U.; Yu, I.K.M.; Sun, Y.; Polson, M.I.J.; Golovko, V.; Lam, F.L.Y.; Ogino, I.; Tsang, D.C.W.; Yip, A.C.K. Size-activity threshold of titanium dioxide-supported Cu cluster in CO oxidation. Environ. Pollut. 2021, 279, 116899. [Google Scholar] [CrossRef] [Scilit]
- Li, X.; Ren, S.; Chen, Z.; Chen, L.; Wang, M.; Wang, L.; Wang, A. Promoting mechanism of CuO on catalytic performance of CeFe catalyst for simultaneous removal of NOx and CO. Fuel 2023, 347, 128435. [Google Scholar] [CrossRef] [Scilit]
- Genty, E.; Brunet, J.; Poupin, C.; Ojala, S.; Siffert, S.; Cousin, R. Influence of CO addition on the toluene total oxidation over Co based mixed oxide catalysts. Appl. Catal. B Environ. 2019, 247, 163–172. [Google Scholar] [CrossRef] [Scilit]
- Liu, C.; Gong, L.; Dai, R.; Lu, M.; Sun, T.; Liu, Q.; Huang, X.; Huang, Z. Mesoporous Mn promoted Co3O4 oxides as an efficient and stable catalyst for low temperature oxidation of CO. Solid State Sci. 2017, 71, 69–74. [Google Scholar] [CrossRef] [Scilit]
- Ren, S.; Li, X.; He, C.; Chen, L.; Wang, L.; Li, F. Surface tailoring on bifunctional CuOx/MnO2 catalyst to promote the selective catalytic reduction of NO with NH3 and oxidation of CO with O2. Sep. Purif. Technol. 2024, 346, 127471. [Google Scholar] [CrossRef] [Scilit]
- Yang, J.; Li, J.; Kang, J.; Liu, W.; Kuang, Y.; Tan, H.; Yu, Z.; Yang, L.; Yang, X.; Yu, K.; et al. Preparation of Ce-MnOx Composite Oxides via Coprecipitation and Their Catalytic Performance for CO Oxidation. Nanomaterials 2023, 13, 2158. [Google Scholar] [CrossRef] [Scilit]
- Ma, J.; Jin, G.; Gao, J.; Li, Y.; Dong, L.; Huang, M.; Huang, Q.; Li, B. Catalytic effect of two-phase intergrowth and coexistence CuO–CeO2. J. Mater. Chem. A 2015, 3, 24358–24370. [Google Scholar] [CrossRef] [Scilit]
- Yang, Z.; Sun, Y.; Li, P.; Zhang, S.; Sun, X.; Cheng, S.; Jiang, Y. High-performance MnOx-CuO catalysts for low-temperature CO oxidation: Metal interaction and reaction mechanism. Mol. Catal. 2025, 576, 114945. [Google Scholar] [CrossRef] [Scilit]
- Li, Z.; Chen, J.; Jiang, M.; Li, L.; Zhang, J.; Duan, W.; Wen, J.; Wang, H.; Liu, M.; Zhang, Q.; et al. Study on SO2 Poisoning Mechanism of CO Catalytic Oxidation Reaction on Copper–Cerium Catalyst. Catal. Lett. 2022, 152, 2729–2737. [Google Scholar] [CrossRef] [Scilit]
- Szanyi, J.; Mei, D.; Varga, T.; Peden, C.H.F.; Heo, I.; Oh, S.; Kim, C.H. Where Does the Sulphur Go? Deactivation of a Low Temperature CO Oxidation Catalyst by Sulphur Poisoning. Catal. Lett. 2018, 148, 1445–1450. [Google Scholar] [CrossRef] [Scilit]
- Xu, T.; Liu, X.; Zhu, T.; Feng, C.; Hu, Y.; Tian, M. New insights into the influence mechanism of H2O and SO2 on Pt–W/Ti catalysts for CO oxidation. Catal. Sci. Technol. 2022, 12, 1574–1585. [Google Scholar] [CrossRef] [Scilit]
- Jia, B.; Guo, J.; Luo, H.; Shu, S.; Fang, N.; Li, J. Study of NO removal and resistance to SO2 and H2O of MnOx/TiO2, MnOx/ZrO2 and MnOx/ZrO2–TiO2. Appl. Catal. A Gen. 2018, 553, 82–90. [Google Scholar] [CrossRef] [Scilit]
- Cao, F.; Xiang, J.; Su, S.; Wang, P.; Sun, L.; Hu, S.; Lei, S. The activity and characterization of MnOx–CeO2–ZrO2/γ-Al2O3 catalysts for low temperature selective catalytic reduction of NO with NH3. Chem. Eng. J. 2014, 243, 347–354. [Google Scholar] [CrossRef] [Scilit]
- Jiang, J.; Zou, Y.; Li, X.; Zhao, Y.; Zhao, Z.; Liu, X.; Zhu, T. The influence of H2O and SO2 on the mechanism of CO oxidation over low noble metal loading catalysts. Catal. Sci. Technol. 2025, 16, 438–449. [Google Scholar] [CrossRef] [Scilit]
- Liu, X.; Zou, Y.; Li, X.; Xu, T.; Cen, W.; Li, B.; Zhu, T. Ultralow Doping of Mn Species into Pt Catalyst Enhances the CO Oxidation Performance in the Presence of H2O and SO2. ACS Catal. 2023, 13, 14580–14597. [Google Scholar] [CrossRef] [Scilit]
- Dey, S.; Dhal, G.C.; Mohan, D.; Prasad, R. The choice of precursors in the synthesizing of CuMnOx catalysts for maximizing CO oxidation. Int. J. Ind. Chem. 2018, 9, 199–214. [Google Scholar] [CrossRef] [Scilit]
- Cui, Y.; Song, H.; Shi, Y.; Ge, P.; Chen, M.; Xu, L. Enhancing the Low-Temperature CO Oxidation over CuO-Based α-MnO2 Nanowire Catalysts. Nanomaterials 2022, 12, 2083. [Google Scholar] [CrossRef] [Scilit]
- Wu, H.; Zou, M.; Guo, L.; Ma, F.; Mo, W.; Yu, Y.; Mian, I.; Liu, J.; Yin, S.; Tsubaki, N. Effects of calcination temperatures on the structure–activity relationship of Ni–La/Al2O3 catalysts for syngas methanation. RSC Adv. 2020, 10, 4166–4174. [Google Scholar] [CrossRef] [Scilit]
- Zhu, S.; Wang, Y.; Lu, J.; Lu, H.; He, S.; Song, D.; Luo, Y.; Liu, J. Study of the Metal–Support Interaction and Electronic Effect Induced by Calcination Temperature Regulation and Their Effect on the Catalytic Performance of Glycerol Steam Reforming for Hydrogen Production. Nanomaterials 2021, 11, 3149. [Google Scholar] [CrossRef] [Scilit]
- Liu, Y.; Wang, N.; Xie, H.; Sun, Y.; Yang, K.; Zhang, L.; Yang, C.; Ge, C. Promotion of SO2 resistance of Ce–La/TiO2 denitrification catalysts by V doping. RSC Adv. 2024, 14, 2264–2276. [Google Scholar] [CrossRef] [Scilit]
- Ma, X.; Wen, J.; Guo, H.; Ren, G. Facile template fabrication of Fe-Mn mixed oxides with hollow microsphere structure for efficient and stable catalytic oxidation of 1,2-dichlorobenzene. Chem. Eng. J. 2020, 382, 122940. [Google Scholar] [CrossRef] [Scilit]
- Yi, H.; Xie, X.; Tang, X.; Zhao, S.; Yang, K.; Huang, Y.; Yang, Z. Demonstration of low-temperature toluene degradation mechanism on hydrotalcite-derived oxides with ultrasonic intervention. Chem. Eng. J. 2019, 374, 370–380. [Google Scholar] [CrossRef] [Scilit]
- Zhu, H.; Chen, Y.; Wang, Z.; Liu, W.; Wang, L. Catalytic oxidation of CO over mesoporous copper-doped ceria catalysts via a facile CTAB-assisted synthesis. RSC Adv. 2018, 8, 14888–14897. [Google Scholar] [CrossRef] [Scilit]
- Wang, Y.; Zhang, L.; Guo, L. Enhanced Toluene Combustion over Highly Homogeneous Iron Manganese Oxide Nanocatalysts. ACS Appl. Nano Mater. 2018, 1, 1066–1075. [Google Scholar] [CrossRef] [Scilit]
- Pang, S.; Dou, X.; Zhao, W.; Bai, S.; Wan, B.; Wang, T.; Yang, J.-H. A Review on the Design Strategies of Copper-Based Catalysts for Enhanced Activity and Stability in Methanol Reforming to Hydrogen. Nanomaterials 2025, 15, 1118. [Google Scholar] [CrossRef] [Scilit]
- Zhai, X.; Jing, F.; Li, L.; Jiang, X.; Zhang, J.; Ma, J.; Chu, W. Toluene catalytic oxidation over the layered MOx−δ-MnO2 (M = Pt, Ir, Ag) composites originated from the facile self-driving combustion method. Fuel 2021, 283, 118888. [Google Scholar] [CrossRef] [Scilit]
- Dong, C.; Qu, Z.; Qin, Y.; Fu, Q.; Sun, H.; Duan, X. Revealing the Highly Catalytic Performance of Spinel CoMn2O4 for Toluene Oxidation: Involvement and Replenishment of Oxygen Species Using In Situ Designed-TP Techniques. ACS Catal. 2019, 9, 6698–6710. [Google Scholar] [CrossRef] [Scilit]
- Jia, J.; Zhang, P.; Chen, L. The effect of morphology of α-MnO2 on catalytic decomposition of gaseous ozone. Catal. Sci. Technol. 2016, 6, 5841–5847. [Google Scholar] [CrossRef] [Scilit]
- Zhang, H.; Zhao, X.; Wang, S.; Zeng, S.; Su, H. Change of Cu+ species and synergistic effect of copper and cerium during reduction-oxidation treatment for preferential CO oxidation. Appl. Surf. Sci. 2018, 441, 754–763. [Google Scholar] [CrossRef] [Scilit]
- Liu, T.; Wei, L.; Yao, Y.; Dong, L.; Li, B. La promoted CuO-MnOx catalysts for optimizing SCR performance of NO with CO. Appl. Surf. Sci. 2021, 546, 148971. [Google Scholar] [CrossRef] [Scilit]
- Chen, W.; Xu, J.; Huang, F.; Zhao, C.; Guan, Y.; Fang, Y.; Hu, J.; Yang, W.; Luo, Z.; Guo, Y. CO oxidation over CuOx/TiO2 catalyst: The importance of oxygen vacancies and Cu+ species. Appl. Surf. Sci. 2023, 618, 156539. [Google Scholar] [CrossRef] [Scilit]
- Yan, L.; Gu, Y.; Han, L.; Wang, P.; Li, H.; Yan, T.; Kuboon, S.; Shi, L.; Zhang, D. Dual Promotional Effects of TiO2-Decorated Acid-Treated MnOx Octahedral Molecular Sieve Catalysts for Alkali-Resistant Reduction of NOx. ACS Appl. Mater. Interfaces 2019, 11, 11507–11517. [Google Scholar] [CrossRef] [Scilit]
- Kim, G.J.; Kwon, D.W.; Hong, S.C. Effect of Pt Particle Size and Valence State on the Performance of Pt/TiO2 Catalysts for CO Oxidation at Room Temperature. J. Phys. Chem. C 2016, 120, 17996–18004. [Google Scholar] [CrossRef] [Scilit]
- Tang, X.; Yu, A.; Yang, Q.; Yuan, H.; Wang, Z.; Xie, J.; Zhou, L.; Guo, Y.; Ma, D.; Dai, S. Significance of Epitaxial Growth of PtO2 on Rutile TiO2 for Pt/TiO2 Catalysts. J. Am. Chem. Soc. 2024, 146, 3764–3772. [Google Scholar] [CrossRef] [Scilit]
- Wang, F.; Deng, J.; Impeng, S.; Shen, Y.; Yan, T.; Chen, G.; Shi, L.; Zhang, D. Unraveling the effects of the coordination number of Mn over α-MnO2 catalysts for toluene oxidation. Chem. Eng. J. 2020, 396, 125192. [Google Scholar] [CrossRef] [Scilit]
- Li, J.-R.; Zhang, W.-P.; Li, C.; He, C. Efficient catalytic degradation of toluene at a readily prepared Mn-Cu catalyst: Catalytic performance and reaction pathway. J. Colloid Interface Sci. 2021, 591, 396–408. [Google Scholar] [CrossRef] [Scilit]
- Luo, M.; Cheng, Y.; Peng, X.; Pan, W. Copper modified manganese oxide with tunnel structure as efficient catalyst for low-temperature catalytic combustion of toluene. Chem. Eng. J. 2019, 369, 758–765. [Google Scholar] [CrossRef] [Scilit]
- Sreekanth, P.M.; Peña, D.A.; Smirniotis, P.G. Titania Supported Bimetallic Transition Metal Oxides for Low-Temperature SCR of NO with NH3. Ind. Eng. Chem. Res. 2006, 45, 6444–6449. [Google Scholar] [CrossRef] [Scilit]
- Padilla, R.; Benito, M.; Rodríguez, L.; Serrano-Lotina, A.; Daza, L. Platinum supported catalysts for carbon monoxide preferential oxidation: Study of support influence. J. Power Sources 2009, 192, 114–119. [Google Scholar] [CrossRef] [Scilit]

Disclaimer/Publisher’s Note: The statements, opinions and data contained in all publications are solely those of the individual author(s) and contributor(s) and not of MDPI and/or the editor(s). MDPI and/or the editor(s) disclaim responsibility for any injury to people or property resulting from any ideas, methods, instructions or products referred to in the content. |
© 2026 by the authors. Licensee MDPI, Basel, Switzerland. This article is an open access article distributed under the terms and conditions of the Creative Commons Attribution (CC BY) license.