


Abstract
Public-source evidence is widely used to assess exposed IoT and IIoT systems, yet its survival across successive stages of non-intrusive inference is rarely measured. This study examines how far an observer confined to public data can follow an evidence chain from a reachable host toward vulnerability and adversary-technique interpretation without privileged access, exploitation, or direct target interaction. Using a fixed, non-representative population of 227 public hosts constructed from IoT-23 network traffic, we measured evidence survival from surface observability through service and product evidence, CPE acceptance, and CVE resolution. The reported figures describe this constructed population rather than internet-facing IoT systems at large. The largest loss came first: only 58 hosts were externally observable, making observability the dominant constraint within this setting. A second source mainly deepened evidence for already visible hosts rather than recovering the blind region. Severity and exploitation-likelihood evidence survived at the CVE level, but technique-level interpretation was not pursued beyond the predefined external-observer model. We conclude that, within this measurement setting, external evidence-to-risk inference is bounded chiefly by observability and that distinct evidence layers should be measured separately rather than merged into a single risk signal.
1. Introduction
The number of IoT and IIoT devices that now sit on public networks is hard to overstate. Cameras, routers, building controllers, industrial gateways, and a long tail of cheaper embedded hardware are reachable from the open internet, often with little hardening and rarely with anyone watching them closely. This is not a new observation. Mirai showed years ago how quickly weak default credentials on consumer devices could be turned into a botnet of real consequence [1], and honeypot studies such as IoTPOT documented that the compromise of these devices was not occasional but routine [2]. Labelled traffic captures like IoT-23 made the malicious side of this activity concrete and reproducible for researchers [3]. Surveys of the operating systems running on low-end devices keep returning to the same finding, which is that the vulnerabilities are persistent and the patching is slow [4]. Detection work has grown around exactly this problem, with recent hybrid architectures combining structural and temporal models to flag botnet behavior in IoT traffic [5]. So the exposure surface is large and heterogeneous, and the security posture across it is uneven. What is less settled is how much of that exposure an outside party can actually see.
That qualification matters because most of what we know about this surface comes from looking at it from the outside. Internet-wide scanning tools made it possible to enumerate reachable hosts at scale, with ZMap demonstrating that the entire IPv4 space could be probed in a matter of hours [6]. OSINT services and search engines that index banner and service metadata extended this further, and work evaluating Shodan against industrial control systems showed both that such systems are findable and that the picture is partial and method-dependent [7]. We have leaned on this kind of passive, non-intrusive collection ourselves, building automated OSINT pipelines for digital-asset discovery and exposure assessment, and the recurring lesson there was that the external view is uneven before any analysis even begins [8]. This is the point that tends to get lost. The external view is not the system itself. It is whatever the scan happened to catch, in whatever window it ran, filtered through whatever the service chose to expose. External observability, in other words, is the central constraint on everything that follows, and we want to name it early rather than treat it as a footnote.
Observable exposure only becomes useful when it can be tied to something actionable. A banner on its own says little. The standard route is to normalize whatever product and version evidence the banner carries into a Common Platform Enumeration entry [9], then use that CPE to retrieve known vulnerabilities through the CVE catalog [10] and the National Vulnerability Database [11]. Severity can be read off the CVSS score [12], and exploitation likelihood is a separate question again, which is worth keeping distinct, because a high severity score is not the same thing as a vulnerability that is actually being used. The empirical work on zero-day attacks made this concrete some time ago, showing that exploitation in the wild follows its own timeline, largely uncoupled from when a vulnerability is catalogued or how severe it looks on paper [13]. We make that distinction deliberately. In earlier work on cryptojacking risk, we found that treating a severity figure as if it were a risk estimate quietly overstated the threat, since the probability that a given weakness is reached and abused depends on far more than its rated severity [14]. Severity, exploitation likelihood, and risk are three different things, and collapsing them into one number is a habit the field should resist.
Even with a clean CVE in hand, there is a gap that the vulnerability records do not close. A CVE tells you what is broken. It does not, as a rule, tell you how an adversary uses the break in practice. Bridging that gap means mapping vulnerabilities onto attack behavior, and the natural target is the MITRE ATT&CK framework [15], which catalogues techniques in operational terms. The framework was built precisely to express adversary behavior as analyzable techniques rather than isolated indicators, and the methodology for turning it into detection logic is well documented [16]. The trouble is that the mapping from a vulnerability to a technique is sparse. Efforts like BRON have tried to stitch the threat data sources together into a navigable graph [17], and broader surveys of attack projection and forecasting confirm that the connective tissue between vulnerability records and adversary behavior is thin [18]. Our own attempts to reconstruct attack vectors over ATT&CK structure ran into the same wall from the other side, since the technique labels have to be supplied by something other than the CVE record itself [19]. CVE records were never designed to encode technique use systematically, so the CVE to ATT&CK step is less a lookup than an inference, and a fragile one.
Put these pieces in sequence, and they form a chain. A device exposes a service, the service reveals a product and version, the product and version resolve to a CPE, the CPE retrieves CVEs, CVEs may support tentative ATT&CK technique inference only when additional semantic links or external mappings are available, and the techniques, in the most optimistic case, hint at an actor family. The full chain, in conceptual and data-free form, is shown in Figure 1. Each link depends on the one before it. What we noticed, reading across the OSINT-and-vulnerability literature, is that studies tend to treat enrichment as a matter of adding information. More sources, more fields, more coverage. What they rarely ask is how far that chain actually survives before the evidence runs out, and where exactly it breaks. The framing is almost always additive. It is seldom about attrition.
Figure 1.
Evidence-to-risk inference chain under constrained external observability. The chain follows evidence from public hosts to observable services, product/version evidence, accepted CPEs, and CVEs. ATT&CK is shown as a conceptual extension beyond the implemented evidence chain rather than as a populated empirical stage.
That gap is what this paper takes up. We study how far an external inference chain survives under constrained, non-intrusive observability, and where along the chain the evidence is lost. The observer model is deliberately adversarial in posture but limited in means, using only free and openly available reconnaissance, the kind of view an outside party would have without privileged access or active exploitation. We build this view over an IoT/IIoT-oriented graph and follow the chain link by link, measuring not a final risk score but the depth to which inference can be carried at all. Our central finding, which we state plainly because it surprised us at first, is that the steepest loss does not happen at CPE matching or at CVE retrieval, where one might expect it. It happens right at the start, at the observability boundary itself, where the host population drops from 227 to 58 before any vulnerability matching even begins. The implemented evidence chain ends at the CVE layer; extending it to ATT&CK would require an additional semantic mapping method beyond the predefined observer model.
The contributions of this work are as follows. We define an external-observer model informed by an adversarial perspective grounded in non-intrusive, freely available OSINT, and make its limits explicit rather than assumed. We formalize an external evidence-to-risk inference chain as the conceptual backbone of the standardized exposure-assessment procedure, and we measure evidence survival along it as a funnel rather than reporting only terminal outcomes. We show, on a curated set of public IoT/IIoT endpoints derived from an IoT-23-oriented workflow, that the dominant evidence loss is an observability effect and not a matching effect, and we quantify the before-and-after gains from OSINT enrichment in terms of metadata completeness, which carries the hypothesis more cleanly than risk-score deltas, which we find to be directional but small. We identify the CVE-to-ATT&CK transition as a boundary of the implemented observer model and distinguish direct CVE-level evidence from technique-level interpretations that require an additional mapping resource or expert inference.
The rest of the paper is organized around that chain. Materials and Methods describes the dataset provenance, the staged graph construction, the OSINT enrichment, the CPE and CVE resolution procedure, the scoring and denominator rules, and the statistical testing plan. Results presents the host-level funnel, the CPE resolution audit, the CVE evidence, and the enrichment deltas with their significance tests. Discussion interprets the observability bottleneck and the CVE to the ATT&CK boundary for both defenders and adversaries, and sets out the limitations. Conclusions states what was shown and what the next step should be. We have chosen not to include a separate related-work section, and instead position the relevant literature here and in the methods, where it can stay close to the design decisions it informs.
2. Materials and Methods
2.1. Study Design and Inference Chain
The method is organized around a single inference chain, the same one introduced conceptually in Figure 1, which runs from a reachable host outward toward an attributed adversary behavior: PublicHosts → Observable hosts → Service → Product/Version → Accepted CPE [9] → CVE [10,11] → ATT&CK [15]. We treat this chain as a standardized external security-analysis framework rather than as a behavioral model of how attackers identify and exploit weaknesses in practice. Real attackers may infer vulnerabilities through default credentials, exposed administrative interfaces, configuration errors, protocol behavior, firmware analysis, or direct interaction without resolving a CPE or CVE. The present chain instead formalizes one auditable route from externally observable service evidence to normalized product identification and catalogue-based vulnerability resolution. Its purpose is therefore to measure evidence survival within a reproducible risk-assessment procedure, not to claim that all attacker reasoning follows the sequence PublicHost → Service → CPE → CVE. Each link is a precondition for the next, and each depends on evidence that an external observer may or may not actually possess. The question we ask of it is therefore not the usual one. Rather than asking what vulnerabilities a fully instrumented internal audit would surface, we ask how far the evidence survives as it travels outward, link by link, when the only thing available is what an outside party can see without privileged access.
That shift matters more than it might first appear. It moves the unit of interest from risk in the abstract to risk inferability under constrained external observability, which is a narrower and, we think, more honest target. The underlying host evidence in this study is derived from an IoT-23-oriented workflow [3], a body of labelled IoT traffic that lets us ground the chain in real devices rather than synthetic ones. A vulnerability that exists on a device but cannot be observed, named, or resolved from the outside is real, but it is not inferable, and the gap between those two things is precisely what an external assessment has to live with. So the chain is read as a sequence of survival conditions, and the empirical interest lies in where, and how sharply, survival falls away.
One link in particular is left deliberately unbuilt. The ATT&CK terminus [15], where a vulnerability would be connected to the technique an adversary uses to exploit it, is retained as a conceptual extension of the chain but is not implemented as an empirical stage in this study. We treat it as a boundary of the predefined observer model rather than as evidence that CVE-to-ATT&CK mapping is impossible. Crossing this boundary would require an additional mapping layer, such as a CVE2ATT&CK model, the BRON graph, or manual expert annotation, none of which is included in the present study. The experiments therefore operationalize the implemented part of the chain as a sequence of evidence-survival tests, each designed to determine how much externally observable information remains available at successive stages of inference.
2.2. Data Model and Denominator Control
Most of the trouble in this kind of assessment comes from one quiet mistake, and it is worth naming before anything else. The denominator slips. Someone counts hosts at one step, counts vulnerabilities at the next, and then sets the two numbers side by side as though they answered to the same population. They do not. A per-CVE probability gets read as if it describes a host. A host that turns up in some reputation feed gets treated as though that told you something about a specific vulnerability sitting on it. None of those comparisons mean what they appear to mean, because the unit underneath the sentence has changed while nobody was watching.
Since the chain we follow is measured in genuinely different units from one link to the next, we pin those units down first, and we state plainly what the denominator is for every layer. That is really all this subsection does. It fixes the base population, it keeps the units of analysis apart, it explains why there are two endpoint partitions rather than one, and it ties each enrichment source to the sample it was actually run over and to nothing wider.
The base population is 227 public IP hosts taken from the Stage-1 graph produced by the IoT-23-oriented workflow [3]. In this study, the Stage-1 graph is the baseline traffic-derived graph constructed before OSINT enrichment; it contains PublicHost nodes, their traffic-observed ServiceEndpoint nodes, and provenance links to the corresponding IoT-23 scenario and malware family nodes. Section 2.4 describes its construction and subsequent Stage-2 enrichment in detail. These 227 hosts are where the inference chain begins, and they form the denominator for the first observability step.
The 227 PublicHost nodes should therefore be interpreted as traffic-derived hosts observed within the selected IoT-23-oriented workflow, rather than as a representative sample of IoT/IIoT deployments or internet-facing IoT devices more generally. Consequently, the observability boundary measured in this study is conditional on this constructed population, the selected external sources, and the collection window; it identifies where evidence was lost under the present design rather than estimating a universal observability rate for IoT/IIoT systems.
The units themselves have to be held apart, and they resist it, because in casual reading they slide into one another. A host, which we identify by its IP, is not a service endpoint. One host might present several endpoints to the outside, or it might present none that an external observer can reach at all. A service endpoint, in turn, is not a CPE, since product and version evidence becomes a Common Platform Enumeration entry [9] only when it is specific enough to accept, and a fair amount of it never gets there.
A CPE is not a CVE either. A single accepted CPE can pull back many vulnerability records through the CVE catalog [10] and the National Vulnerability Database [11], or it can pull back a few, or none. And standing apart from all of these is the source-query sample, by which we just mean the actual set of hosts, or the actual set of CVEs, submitted to a given source. The reason for being this fussy is the error named a moment ago, the one where a measurement made in one unit quietly answers a question posed in another. It bites hardest after the CVE stage, where two layers that both feel like they are about threat turn out to sit on opposite sides of a unit boundary, and Table 1 is where we force that into the open.
Table 1.
Evidence layers, units of analysis, and denominator control across the external evidence-to-risk inference chain. The final two columns state the evidential firewall, namely what each layer can and cannot support.
Service endpoints enter the analysis under two partitions, and this is the part that trips readers if it is not said out loud, so let us say it. Both partitions are legitimate. They do not line up one-to-one, and we make no assumption that they do. The first partition asks how an endpoint got into the graph in the first place. On that accounting, 491 endpoints come from the Stage-1 traffic-derived construction, and 192 are osint_only, meaning they were added during enrichment, which totals 683.
The second partition asks a different question. It asks which source is attesting the endpoint right now, and on that accounting 473 are attested from Zeek-derived traffic and 210 from Shodan [7], which also totals 683. Same population, same sum, two different axes cutting through it, one of them about provenance and the other about what is vouching for the endpoint at present. An endpoint origin does not settle which source currently speaks to it. Fold the two together, and you misstate both how the graph was built and what evidence actually stands behind a given endpoint, so we keep them separate from here on.
Then there is the question of bounding each source to its own sample, and the samples are not the same size, deliberately. Shodan [7] was queried over the full population of 227 hosts because it served as the primary single-source view, and the first evidence-survival step could only be measured meaningfully if every host in the base population was examined. Censys [20], OTX [23], VirusTotal [24], and GreyNoise [25] are all bounded to a pre-registered sample of 100 hosts, frozen by seed before a single query was issued, made up of 58 that Shodan could see and 42 that it could not. Those two strata are reported on their own and never pooled, since the fraction drawn from each is different and pooling them would quietly distort the rates. The exploitation and severity layer, which is EPSS [21] together with CISA KEV [22] and the CVSS score [12], is held to the 263 distinct CVEs that actually reached the CVE stage, for the plain reason that a per-CVE figure has nothing to attach to on a host that resolved no vulnerability. Table 1 lays this out, each layer with its sources, its unit, the denominator it answers to, and the limits of what it is allowed to claim.
The last two layers occupy roughly the same downstream stretch of the chain, yet they answer different questions in different units, and the table keeps them apart on purpose. The exploitation and severity layer is a per-CVE measurement. EPSS [21] gives a daily-recomputed exploitation probability, which we record together with its model date because the value is not timeless, CISA KEV [22] adds a binary known-exploited flag, and the CVSS score [12] carries the rated severity. The reputation and threat-intelligence layer is a per-host measurement instead. OTX [23], VirusTotal [24], and GreyNoise [25] report whether an IP is visible in community threat-intelligence and scanner-reputation systems, and we treat the three as sensors of one host-level context dimension rather than as separate axes. The firewall between the two layers is strict, and we hold to it. A host showing up in a reputation source tells us nothing about the exploitation relevance of any CVE resolved on it, and a CVE carrying an EPSS or KEV signal tells us nothing about whether the host is noticed by any threat-intelligence source.
That is exactly what later lets us ask a clean question, namely whether visibility in one dimension is associated with visibility in another, without the association turning out to be an artefact of a shared denominator. The design supports an association reading and not a causal one, and the result is reported in those terms. GreyNoise [25] needs one caveat to be carried forward into the results. Absence from it means only that an address has not been seen scanning, which is the ordinary state of most exposed devices, so its silence should be read as silence and nothing more, neither evidence that a host is clean nor evidence that it is compromised.
2.3. Experimental Protocol and Evidence-Survival Tests
Section 2.2 fixed the base population, separated the units of analysis, and tied each evidence layer to the sample it was collected over. What follows uses that scaffolding rather than rebuilding it. The protocol is a set of evidence-survival tests, four of them, each one positioned at a different stage of the inference chain and each measured against its own denominator, so that no test silently borrows the population of another. The external observer represented by these tests follows a non-intrusive, OSINT-driven discovery posture consistent with prior Shodan-based exposure and vulnerability-assessment workflows [8,26], learning only what public sources happen to expose. The job of this section is to say, for each experiment, what it measures, over which population, and which hypothesis it is built to test. The verdicts themselves belong to the Results.
The first experiment is the single-source observability funnel, and it runs over the full base population of 227 public hosts [7]. It follows what one external sensor recovers as the chain advances, from public host to observable host, then to product and version evidence, then to an accepted CPE [9], and finally to a CVE [10,11]. Each stage is read as a fraction of the one before it and of the initial 227, so the funnel shows not only how much survives but where the steepest loss falls. Experiment 1 is designed to test H1, the claim that evidence survival degrades sharply along the chain and that the largest attrition arrives early, at the observability and service-resolution stages, well before vulnerability matching. Placing the funnel over the whole population rather than over the observable subset is what lets the first step speak at all, since a survival rate measured only among hosts already seen would hide exactly the loss H1 is about.
The second experiment is the second-source observability test, and it is bounded to a pre-registered stratified sample of 100 hosts, frozen by seed before any query was issued and made up of 58 hosts Shodan could see and 42 it could not. Censys [20] is queried over that frozen sample, and the two strata are reported on their own rather than pooled, because their sampling fractions differ and pooling them would distort the rates. The first stratum asks a depth question, whether a second source adds evidence where a host is already visible, and the second asks a breadth question, whether it recovers hosts the first source missed entirely. Experiment 2 is designed to test H2, the claim that multi-source enrichment increases coverage without eliminating chain attrition. The frozen sample matters here beyond Experiment 2, since Experiment 4 inherits the same 100 hosts and the same strata, so the pre-registration fixes one denominator that two experiments share.
The third experiment is the post-CVE evidence-quality test, and it is restricted to the 263 distinct CVEs that actually reached the CVE stage. Over those CVEs it reads three per-CVE signals: exploitation probability from EPSS [21], known-exploited status from CISA KEV [22], and severity from CVSS [12]. The first two are exploitation-relevance measures and the third is a severity measure, and the experiment keeps them apart rather than folding them into a single threat number. CVSS is used here for its severity value but remains a vulnerability-resolution source in the sense fixed by Section 2.2, retained as the NVD severity baseline rather than relocated into the exploitation layer. Experiment 3 is designed to test the downstream half of H3, the question of whether exploitation and severity evidence survives once a CVE has been resolved. Restricting it to the 263 resolved CVEs is deliberate, since a per-CVE score has nothing to attach to on a host that resolved no vulnerability, and reporting it over any larger population would invent a denominator the measurement does not have.
The fourth experiment is the host-level reputation and threat-intelligence test, and it runs over the same frozen 100-host sample as Experiment 2. Three sources are queried per host, OTX [23], VirusTotal [24], and GreyNoise [25], and they are treated as sensors of one host-level context dimension rather than as separate axes. Experiment 4 is not framed as a test of H1 to H3. It is an extension that asks whether visibility in one dimension is associated with visibility in another, specifically whether hosts that are observable at the surface are also the hosts that carry threat-intelligence signals. The design supports an association reading and not a causal one, and the result extends across evidence dimensions rather than propagating along them, a distinction the Results section holds to carefully. GreyNoise carries the caveat already stated, that absence means only not-observed-scanning and is neither evidence of cleanliness nor of compromise.
Read together, the five rows of Table 2 make the section’s organizing rule visible. Each test answers to a population it can actually speak for—the full 227 hosts for the single-source funnel, the frozen hundred for the two sample-bounded tests, and the 263 resolved CVEs for the post-CVE layer—and no row is allowed to lean on the denominator of another.
Table 2.
Denominator-controlled experimental design. Each evidence-survival test is positioned at a stage of the inference chain, measured against its own controlled population, and tied to the hypothesis it is designed to test.
The conceptual chain includes a possible transition from CVEs to ATT&CK techniques, but no experiment is defined for that transition. The present protocol ends at the CVE layer because dedicated mapping resources and manual expert interpretation are outside the predefined observer model. The absence of technique-level results is therefore a scope boundary and is not treated as evidence that CVE-to-ATT&CK mapping cannot be achieved.
That discipline is what lets the Results section report survival, depth, breadth, exploitation relevance, and cross-dimensional association side by side without the comparisons quietly shifting unit beneath the reader. The experiments are reported in that order in Section 3.
2.4. Graph Construction and Evidence Enrichment
The three subsections above describe what the chain is, how its denominators are held apart, and how the experiments interrogate it, but they do not yet say how the graph itself was assembled. This subsection closes that gap. The construction proceeds in two stages, a Stage-1 graph built from labelled traffic and a Stage-2 graph that enriches it with external evidence, and the governing principle throughout is that enrichment annotates existing structure rather than inventing it. Figure 2 shows the workflow in operational form, as a counterpart to the conceptual chain of Figure 1, and Table 3 states the rule applied at each stage. The Stage-1 graph begins with the IoT-23-derived workflow [3], whose traffic is processed by the Zeek monitor, the platform first introduced as Bro [27], to determine which hosts were contacted and which services they exposed. From this, we obtain a directed graph whose primary nodes are public hosts and the service endpoints attached to them, together with a provenance layer of scenario and malware-family nodes that records where each host was observed. In the assembled graph this amounts to 227 PublicHost nodes and 683 ServiceEndpoint nodes, with PublicHost connected to ServiceEndpoint by an exposure relation and to the family layer by a derivation relation, so that every host carries both its services and its origin.
Figure 2.
Graph construction and enrichment workflow. The threat-intelligence lane (right) is attached to host nodes only and never enters the CVE-level evidence chain; the ATT&CK terminus is shown as a conceptual extension beyond the implemented evidence chain.
Table 3.
Graph construction and enrichment rules. Each stage names the object it consumes, the source or process applied, the action taken on the graph, and the object or attribute produced. The table records graph actions and does not repeat the evidence layers of Table 1 or the experimental protocol of Table 2.
Enrichment then grows the graph in a controlled way, and the endpoint population is where this is most visible. The Stage-1 construction supplies a set of endpoints recovered directly from traffic, and the OSINT enrichment pass adds further endpoints that traffic alone did not reveal, so that the Stage-2 endpoint set is the union of the two. Writing the Stage-1 endpoint set as and the set added during enrichment as , the Stage-2 set is:
The same 683 endpoints can be decomposed a second way, not by where they entered the graph but by which source currently attests them. This source decomposition is independent of the origin decomposition above and is not assumed to align with it:
The two equations partition the same set along different axes: one records provenance and the other records the attesting source, and a given endpoint’s position in one says nothing about its position in the other. When Shodan enrichment runs over the full population, it either updates an endpoint already present or adds a new endpoint, and this is the mechanism by which the 192 enrichment-origin endpoints enter. Censys is treated differently. It is not folded into this construction pass at all but reserved as a bounded second source over the pre-registered hundred-host sample, used to test depth and breadth in Experiment 2 and never propagated into the product-to-CPE-to-CVE chain, which is why Figure 2 places it to one side rather than in the spine.
Vulnerability evidence is attached only where product evidence is specific enough to support it. Of the enriched service records, 111 carry product and version evidence, and these are the only endpoints submitted to CPE matching. Matching follows the CPE Name Matching specification [28], which defines the one-to-one comparison of a candidate name against the dictionary, and each candidate is classified under a fixed acceptance rule into one of three outcomes: accepted, ambiguous, or unresolved, with only accepted names carrying forward. Among the 111 product-evidence endpoints, this yields 41 accepted, 26 ambiguous, and 44 unresolved, and the figure of 41 accepted endpoints is the gate through which the vulnerability layer is reached. Accepted CPEs are then resolved against the CVE catalogue [10] and the National Vulnerability Database [11], attaching vulnerability records as CVE nodes linked to their endpoints, with the CVSS score [12] carried as the severity attribute on each record. In the assembled graph, this produces 263 distinct CVE nodes joined by 946 HAS_CVE links, since one accepted CPE commonly resolves to many vulnerabilities. The exploitation layer is added last on the CVE side, with EPSS [21] writing an exploitation probability and its model date onto every CVE node and the CISA Known Exploited Vulnerabilities catalogue [22] flagging the four CVEs that are known to be exploited.
Host-level threat-intelligence context is attached on a separate track, and the separation is enforced in the graph structure itself rather than only in the analysis. OTX [23], VirusTotal [24], and GreyNoise [25] are queried per host over the hundred-host sample, and their signals are written onto the PublicHost nodes as reputation context, never onto CVE nodes, so that a host can carry threat-intelligence evidence and a CVE can carry exploitation evidence without either being mistaken for the other. This is the construction-side form of the firewall set out in Section 2.2, and Figure 2 renders it as a parallel lane that descends from PublicHost and never enters the CVE-level evidence chain. The whole pipeline is built to be auditable. Every enrichment record is stamped with its source, its query time, and its access tier, raw responses are preserved as returned, deduplication is idempotent so that a repeated query cannot inflate the graph, and a collection manifest records the run. The pre-registered sample is frozen by seed before any query is issued, and the scenario and family provenance nodes retained from Stage-1 keep each host traceable to its origin in the labelled data, so that the graph can be reconstructed and checked rather than merely trusted.
With the graph constructed and enriched under these rules, and its provenance preserved at every stage, the evidence base is fixed and the experiments of Section 2.3 can be run against it. The results follow in Section 3.
3. Results
3.1. Surface Observability: Single-Source Funnel and Second-Source Recovery
This subsection reports the surface-observability part of the chain, which is where Experiments 1 and 2 sit. We first report the single-source Shodan funnel over the full 227-host population, and then use the Censys sample to ask whether a second observability source mainly deepens the evidence that is already visible or recovers the hosts that the first source missed. The two tests share a subject, the externally observable surface of the host population, and they are reported together because the second only makes sense against the baseline established by the first (Figure 3).
Figure 3.
External observability degradation across the evidence chain. (a) Shodan single-source funnel over the full 227-host population, from public hosts to CVE-resolved hosts under Shodan evidence; the largest drop (−74.4%, 169 hosts) occurs at the first observability step. (b) Censys second-source test over the frozen 100-host sample, with strata reported separately: the depth stratum (58 Shodan-visible hosts) tests whether a second source deepens already visible evidence, and the breadth stratum (42 Shodan-invisible hosts) tests whether it recovers part of the Shodan-blind region. Censys denominators are the sample strata (58 and 42), not the 227-host population; strata are not pooled.
The Shodan funnel is shown in Figure 3a, and it falls steeply at the very first step. Of the 227 public hosts that enter the chain, only 58 return any externally observable service through Shodan, a survival of 25.6 percent. The remaining 169 hosts are contacted in the underlying traffic but expose nothing that a single external observer can read, whether because they sit behind address translation, answer only to the parties they initiated contact with, or were transient by the time of observation. This is the dominant loss in the entire chain, and it lands before any vulnerability reasoning has begun. The pattern is consistent with the more specific finding that single-source active scanning systematically undercounts hosts that are nonetheless genuinely reachable and in use [29], as well as with the broader observation in the internet-measurement literature that only a small fraction of allocated, active addresses respond to external probing [30]. Beyond this initial step, the funnel continues to narrow, but never again as sharply.Of the 58 observable hosts, 41 carry product evidence, a survival of 70.7 percent; of those, 22 yield at least one accepted CPE, 53.7 percent; and of those, 20 resolve to a CVE, 90.9 percent. The shape matters as much as the endpoints. Once a host is observable and its product is named precisely enough to accept, the rest of the chain is comparatively forgiving, and almost everything that reaches the CPE stage continues to a CVE.
One detail of the funnel is worth stating plainly because it recurs in the second-source test. No host in the population yields version evidence from Shodan at all. A product is often recoverable, a service banner will name the software, but the version string that CPE matching most depends on is simply not exposed at the surface, and the funnel therefore narrows to product evidence rather than product-and-version evidence. This is not a quirk of one source, as the Censys results show. The stagewise counts and corresponding survival rates are summarized in Table 4.
Table 4.
Shodan single-source evidence survival across the inference chain, reported at the host level over the full 227-host population. Survival from the previous stage is the share of the preceding stage; survival from the initial stage is the share of the 227 public hosts.
Figure 3b reports the Censys test over the pre-registered 100-host sample, with the 58 Shodan-visible hosts forming the depth stratum and the 42 Shodan-invisible hosts the breadth stratum, the two reported separately because their sampling fractions differ. In the depth stratum, the second source is strong. Censys returns a service for 56 of the 58 hosts, 96.6 percent, and product evidence for 40, 69.0 percent, figures that closely track what Shodan already saw. This is corroboration more than expansion. The two engines, scanning the same reachable surface on their own schedules, mostly agree about which hosts are visible and what they are, which is consistent with empirical comparisons of the two platforms at the network edge [29]. In the breadth stratum, the picture is the opposite. Of the 42 hosts that Shodan could not see, Censys recovered a service for only 5, 11.9 percent, and product evidence for only 2, 4.8 percent. A second independent observer, querying the same blind region, repairs almost none of it. And in neither stratum does Censys return version evidence for a single host, which confirms that the version gap seen in the Shodan funnel is a property of external observation itself rather than of any one tool. The corresponding second-source results for the two strata are summarized in Table 5.
Table 5.
Censys bounded second-source test over the pre-registered 100-host sample. The two strata are reported separately, not pooled, because their sampling fractions differ; denominators are the stratum sizes (58 and 42), not the 227-host population.
Taken together, the two experiments locate the dominant loss precisely. It is not a late failure of vulnerability matching but an early boundary of observability. Shodan exposes 58 of 227 hosts, and the second-source Censys test largely reinforces that visible region rather than recovering the blind one, deepening confidence in the hosts already seen while returning only a small fraction of those missed. This is the result Experiment 1 was designed to test, and it supports H1 in its strong form: evidence survival degrades sharply along the chain, and the steepest single loss arrives first, at the observability step, well before product resolution, CPE acceptance, or CVE retrieval. It also gives H2 its answer, though a qualified one. A second source does improve coverage, but the improvement is concentrated almost entirely in depth, in corroborating and slightly enriching hosts that were already visible, and not in breadth, where the Shodan-invisible region remains very nearly as dark to Censys as it was to Shodan. Multi-source enrichment, on this evidence, sharpens the visible part of the picture without meaningfully enlarging it.
3.2. Post-CVE Evidence Quality and the ATT&CK Interpretation Boundary
This subsection reports what survives once a CVE has been resolved, and it is measured over a single, fixed denominator: the 263 distinct CVEs that the chain retrieved. Every figure below is a share of those 263, and the three per-CVE measures are kept apart from one another rather than combined into a single score, in keeping with the separation established in Methods and Materials. We report severity first, then exploitation relevance, and then the technique step, because the three degrade very differently and the contrast between them is the result.
Severity evidence is, at this stage, abundant. The National Vulnerability Database returned a CVSS score [12] for every one of the 263 resolved CVEs, a coverage of 100 percent, and the scores sit high: the median CVSS was 7.5 and 156 of the 263 CVEs, 59.3 percent, fall in the high or critical bands at or above 7.0, with 39 rated critical. An external observer who reaches the CVE layer is therefore not short of a severity signal. If anything, severity is the most complete and least discriminating evidence in the chain, present for everything and elevated for most of it, which is consistent with prior work showing that remediation prioritized by severity alone is inefficient and that modelled exploitation likelihood is a stronger basis for triage [31].
Exploitation relevance, measured by the Exploit Prediction Scoring System (EPSS) [21], was also available for all 263 CVEs, but its shape differs markedly from severity. The median EPSS was 0.048, so a typical resolved CVE carries a low modelled probability of near-term exploitation. The distribution, shown in Figure 4, is strongly right-skewed rather than uniformly low, and the tail is not negligible. Of the 263 CVEs, 102 reached an EPSS of at least 0.1, an elevated group that is 38.8 percent of the total; 51 reached at least 0.5, a high-likelihood group of 19.4 percent; and 10 sat at or above 0.9, an extreme tail of 3.8 percent. These are not isolated cases. Exploitation relevance, in other words, partly survives the CVE stage, concentrated in a substantial minority of vulnerabilities rather than spread evenly or confined to a handful. The CISA Known Exploited Vulnerabilities (KEV) catalog [22] is much stricter, and it should be read as such. It flagged 4 of the 263 CVEs, 1.5 percent, as confirmed known-exploited. This small number is not a measure of how many vulnerabilities are exploitable but of how few are catalogued as having been exploited in the wild, which is the specific and deliberately conservative thing the KEV flag records.
Figure 4.
Quantitative denominator structure and EPSS distribution. (a) Quantitative relationships among the principal units of analysis, from 227 PublicHost nodes and 683 ServiceEndpoint nodes through 111 product-evidence endpoints and CPE-matching outcomes to 263 distinct CVE nodes connected by 946 HAS_CVE links. The panel makes the changes in unit and denominator explicit. (b) EPSS distribution over the 263 resolved CVEs. The histogram shows the median EPSS of 0.048 and descriptive thresholds at 0.1, 0.5, and 0.9, corresponding to 102, 51, and 10 CVEs, respectively.
The implemented evidence chain ends at the CVE layer. Although the 263 resolved CVEs could serve as inputs to a separate CVE-to-ATT&CK mapping process [15], no dedicated mapping resource, graph-based method, or manual expert procedure was evaluated in this study. Bridging CVEs to ATT&CK techniques has required dedicated language models trained on manually annotated data, while the available ground truth remains limited and unevenly distributed across techniques [32]. Accordingly, no technique-level results are reported, and this absence is treated as a boundary of the predefined observer model rather than as evidence that CVE-to-ATT&CK mapping is infeasible. Table 6 therefore reports only the CVE-level evidence evaluated in this study and identifies ATT&CK interpretation as outside the implemented protocol.
Table 6.
Post-CVE evidence quality over the 263 resolved CVEs. Each row is a share of the same denominator; exploitation, severity, and known-exploited status are reported separately. The final row identifies ATT&CK technique interpretation as outside the implemented protocol rather than as an empirical outcome.
Taken together, the CVE-level results show that severity and exploitation-relevance evidence remain available after vulnerability resolution. Technique-level interpretation was not evaluated within the implemented protocol and therefore cannot be assessed as either successful or unsuccessful. Extending the analysis from CVEs to ATT&CK techniques would require an additional mapping layer outside the observer model tested here.
3.3. Host-Level Reputation and Threat-Intelligence Visibility
This subsection reports the reputation and threat-intelligence layer, the one host-level dimension that sits beside the chain rather than along it. Three sources were queried per host across the pre-registered 100-host sample: OTX [23], VirusTotal [24], and GreyNoise [25]. The question here is not how far evidence survives, but whether visibility in this dimension is related to visibility at the surface. Because the threat-intelligence signal is attached to host nodes and never to CVE nodes, as per Methods and Materials, the comparison that follows is a clean one between two host-level measurements rather than an artefact of any shared denominator. We contrast the 58 Shodan-visible hosts of the sample with the 42 Shodan-invisible ones. Throughout, associations are summarized by the phi coefficient with bootstrap confidence intervals [33], and because the cell counts are small, they are tested with Fisher’s exact test rather than the chi-square approximation [34].
The raw counts are modest, which is itself worth stating plainly. Across the 100 hosts, OTX returned a signal for 21, VirusTotal for 22, and their union, any threat-intelligence signal at all, covered 23. GreyNoise was almost silent, returning a positive for a single host. Threat-intelligence presence is therefore a minority condition in this sample, and any association has to be read against that scarcity rather than around it.
The main result is a positive association between surface observability and threat-intelligence visibility. Taking a loose definition of threat-intelligence presence, a signal from either OTX or VirusTotal, 19 of the 58 Shodan-visible hosts carried such a signal, 32.8 percent, against only 4 of the 42 Shodan-invisible hosts, 9.5 percent. The difference is a risk difference of 23.2 percentage points and an odds ratio of 4.63, and it is unlikely under independence, with Fisher exact p = 0.008 and phi = 0.273, whose bootstrap 95 percent confidence interval of 0.100 to 0.432 excludes zero. Hosts that an external scanner can see, in other words, are also the hosts that community threat-intelligence sources are more likely to have flagged, and the two kinds of visibility concentrate together.
The association holds under stricter definitions, which is the point of testing more than one. Requiring a signal from both OTX and VirusTotal rather than either, 16 of the 58 visible hosts qualify, 27.6 percent, against the same 4 of 42 invisible hosts, 9.5 percent, with Fisher p = 0.041 and phi = 0.223. A more conservative reading still, counting only hosts that VirusTotal flagged with at least two malicious engine detections, sharpens the contrast rather than dissolving it: 6 of the 58 visible hosts reach that threshold, 10.3 percent, while none of the 42 invisible hosts do, 0.0 percent, with Fisher p = 0.038. Every host in the sample carrying two or more malicious detections is, without exception, a Shodan-visible host. The effect sizes across the three definitions sit close together, between phi = 0.22 and phi = 0.27, and all three tests fall below 0.05, so the association is not an artifact of one permissive choice of what counts as threat-intelligence presence.
GreyNoise is reported for completeness but supports no inference here. It returned a positive for one host out of a hundred, and that host was Shodan-visible, so the table records a phi of 0.086, but with a Fisher exact p of 1.0 the value reflects a single observation rather than any association, and we do not interpret it as evidence of one. Scanner-reputation visibility, on this sample, is simply too sparse to relate to anything, which is consistent with the caveat carried from Methods and Materials, that absence from GreyNoise is the ordinary condition of most hosts and carries no information about them. The host-level threat-intelligence results by observability stratum are summarized in Table 7.
Table 7.
Host-level reputation and threat-intelligence visibility by Shodan observability, over the 100-host sample (58 Shodan-visible, 42 Shodan-invisible). Each row is an independent definition of threat-intelligence presence. Fisher’s exact test is used throughout; φ is the effect size. GreyNoise is reported for completeness, and its φ is not interpreted as evidence of association.
Taken together, the results establish a host-level association rather than a chain-survival result, which is why this layer was set apart from Experiments 1 through 3 in the design. Surface observability and threat-intelligence visibility are not independent: the hosts an external observer can see are disproportionately the hosts that reputation and threat-intelligence sources have also noticed, and the relationship survives loose, strict, and conservative definitions of what threat-intelligence presence means. The finding is an association and is reported as one. The design supports the statement that these two dimensions of visibility co-occur more often than chance would predict, and it does not support any claim that observability causes threat-intelligence attention or the reverse, a distinction the following section takes up.
4. Discussion
4.1. The Observability Boundary as the Dominant Bottleneck
The clearest result of this study is where the evidence chain fails first. Of the 227 public hosts that entered the chain, only 58 returned any externally observable service, and the remaining attrition along the chain, through product evidence, CPE acceptance, and CVE resolution, never again removed so large a share at a single step. This is the finding that H1 was framed to test, and the data support it in its strong form: evidence survival degrades sharply along the chain, and the steepest single loss arrives first, at the observability step, before the chain has begun to reason about vulnerabilities at all. The dominant loss is therefore not a failure of vulnerability matching or of any later inference, but a boundary of observation itself. An external observer loses most of the population at the moment it tries to see it. This dominance is an internal comparison across stages of the defined study population: it shows that the first-stage loss was larger than later losses within this experiment, but it does not imply that 25.6% is a general observability rate for internet-facing IoT or IIoT deployments.
This is, in one sense, an expected result, and it is worth saying so plainly rather than presenting the boundary as a surprise. Internet measurement has long held that the externally visible portion of the network is a fraction of what is actually deployed, with much of the address space either unresponsive to external probing or hidden behind translation and filtering [30]. Our finding is consistent with that picture and gives it a specific shape along an inference chain: the 74% of hosts lost at the first step are not absent from the network, since they were contacted in the underlying traffic, but absent from the view that a single external source can construct. The contribution here is not the existence of the boundary, which is known, but its position. By measuring survival stage by stage against a fixed population, the boundary can be located precisely at the observability step rather than diffused across the chain, and its dominance over every later loss can be quantified rather than assumed.
The result also sharpens a methodological point that prior single-source assessments have raised in passing. Work comparing scan-based visibility against fuller traffic analysis has shown that relying on one external source systematically undercounts hosts that are genuinely reachable and in use, so that a single scanner’s silence is not evidence of a host’s absence [29]. Our funnel makes that undercount the central quantity rather than a caveat. When the first and largest loss in an evidence-to-risk chain is the observability step, any assessment that begins from what a single source can see has already discarded most of its population before it computes anything, and the downstream precision of the method cannot recover what was never observed. The order of magnitude matters: a chain that loses three of every four hosts at the outset is bounded far more by what it can see than by how well it reasons about what it sees.
There is a security reading of this boundary as well, and it cuts in a direction that warrants careful attention. The hosts that remain visible are not a random remnant of the population; they are the ones exposing services to the outside, which is the same surface that adversaries reach. Measurement of externally observable IoT deployments has shown that the devices most exposed to opportunistic compromise are precisely those left reachable and misconfigured at the surface, and that this exposed surface, rather than the hidden interior, is where attacks concentrate [35]. The observability boundary, therefore, does not separate the relevant hosts from the irrelevant ones. It separates the externally legible hosts, which both a defender’s external assessment and an attacker’s reconnaissance can act upon, from the rest, which neither can see well from outside. What an external observer loses at this boundary is real, but the surviving 58 hosts are also the population that external risk assessment is actually about, and the chain that follows is an account of how much can be learned about that exposed surface and where even that learning runs out.
The strength and position of this boundary also mark where further work could most usefully be pushed. Because the loss measured here is specific to the sources queried, an open question is whether additional non-intrusive vantage points, such as passive DNS, certificate transparency logs, or further independent scan sources, move the observability boundary outward or merely reconfirm the same visible set from new angles. The second-source evidence reported next bears directly on that question, and the broader answer would determine whether the boundary is a property of any one observer’s tooling or a more fundamental limit of external, non-intrusive observation.
4.2. Multi-Source Enrichment Deepens the Visible Surface More than It Recovers the Blind Region
If the observability boundary is the dominant bottleneck, the natural question is whether it can be repaired by looking again with a different instrument. Experiment 2 was framed to test H2, the claim that adding a second observability source improves coverage. The data qualify that claim rather than simply confirming it: a second source helps where the first already saw, and barely helps where the first was blind.
The two strata make the distinction precise. Among the 58 hosts that Shodan could already see, Censys [20] returned a service for 56 of them and product evidence for 40, figures that track closely what the first source had already recovered. Among the 42 hosts that Shodan could not see, Censys returned a service for only 5 and product evidence for 2. The same instrument, applied to the same hundred hosts, behaves almost like a confirming witness in the visible stratum and recovers very little in the invisible one. Coverage does improve, so the evidence supports H2 only in a restricted sense: the improvement is concentrated where it adds the least new information and is nearly absent where it would have mattered most.
This pattern is consistent with what is known about how these engines relate to one another. An empirical comparison of Censys and Shodan from the network edge has found that, while the two differ in freshness and operational detail, they largely converge on which hosts and services are externally visible [36]. Our depth stratum reproduces that convergence directly: where one engine sees, the other sees much the same thing. What our breadth stratum adds is the complementary and less comfortable half of the picture. The convergence is not only on what is visible but, in large part, on what is invisible: the hosts one engine misses are mostly the hosts the other misses too, because both are reading the same externally exposed surface and neither can reach far past it. Two independent observers querying the same blind region recover a little, the five hosts Censys added, but they do not average out into broad new coverage; they mostly reconfirm a shared boundary.
4.3. Severity, Exploitation Likelihood, and Technique Interpretation Remain Separate Evidence Layers
The results return repeatedly to a single methodological commitment, that the evidence an external observer gathers does not reduce to one quantity. Several kinds of signals appear in this study, and the temptation in risk work is to fuse them into a single score: how severe a vulnerability is, how likely it is to be exploited, whether a host carries any reputation or threat-intelligence trace, and which adversary technique a vulnerability might serve. The findings argue against that fusion, not on principle but because the signals behave differently when measured, and collapsing them would discard exactly the distinctions that carry information.
Severity and exploitation likelihood are separated most clearly at the CVE layer. Over the 263 resolved CVEs, severity was both abundant and high, with a CVSS score available for every one and a majority rated high or critical, while exploitation likelihood was sparse and concentrated, with a low median EPSS and a heavy tail. Known-exploited status was sparser still, with the KEV catalog flagging only a handful, which is the conservative thing that flag is designed to record rather than a measure of how few vulnerabilities are exploitable. These are not interchangeable readings of one underlying danger. A vulnerability can be severe and unlikely to be exploited, or modestly severe and squarely in the exploitation tail, and the population here contains both. This is consistent with prior work on remediation prioritization, which found that ranking by severity alone is inefficient and that modelled exploitation likelihood is a better guide to where attention should go [31]. Our contribution is to show the same separation surviving at the end of an external evidence chain: even when an observer recovers both signals for the same CVE, they point in different directions often enough that merging them would erase the divergence rather than summarize it.
The host-level threat-intelligence dimension is different again, and it must not be folded into the per-CVE measures, even though both feel like risks. The severity and exploitation signals are properties of a vulnerability; the reputation signal is a property of a host. They live on different units, are measured over different denominators, and answer different questions. A CVE’s EPSS score says nothing about whether the host carrying it has been flagged by a community feed, and the threat-intelligence association reported here, between surface observability and reputation visibility, says nothing about the severity of any vulnerability those hosts expose. The data model kept these on separate footings throughout, attaching exploitation evidence to vulnerability nodes and reputation evidence to host nodes, and the results vindicate that separation. The one association we did find runs between two host-level visibilities, not between a host-level and a vulnerability-level quantity, which is exactly the kind of relationship the separation permits one to state cleanly rather than the kind it would have blurred.
The practical reading is that a single composite risk score, computed by an external observer from these sources, would be a category error rather than a convenience. The point is not new in principle: empirical work has shown that severity scores alone are a poor guide to which vulnerabilities are actually exploited, so that prioritizing by a high severity rating can be little better than selecting vulnerabilities at random [37]. Our results extend that caution from the per-vulnerability case to the multi-dimensional one. A composite would average a per-vulnerability severity, a per-vulnerability exploitation probability, and a per-host reputation trace into a number whose denominator shifts beneath it, and the resulting figure would be impossible to interpret because its constituents answer to different populations. The discipline this paper recommends is not that these signals are unimportant but that they are non-fungible. Each is worth collecting, and each is worth reporting on its own footing, and keeping them apart is what allowed the genuine relationships, the severity-exploitation divergence and the observability-reputation association, to be seen at all.
Existing vulnerability-assessment and risk-prioritization methods generally begin after the relevant evidence has already been identified. CVSS scores the severity of a known vulnerability, EPSS estimates exploitation likelihood for an identified CVE, and attack-graph or asset-criticality methods typically assume that an asset inventory and system context are available. The present approach addresses the earlier stage on which those methods depend: whether an external observer can recover the host, service, product, CPE, and CVE evidence required to apply them at all. It should therefore be understood not as a competing risk score but as a coverage-and-confidence layer for existing assessment methods. It indicates how much of an externally derived risk estimate rests on observed evidence and where apparent absence may instead reflect loss of observability.
This distinction has three practical uses. First, it changes how a clean external scan should be interpreted. Few findings may indicate either a well-secured host or a host that was never externally observable, and the evidence-survival funnel separates those cases. Second, the evidence quality recovered at intermediate stages can qualify downstream prioritization. For example, an EPSS- or CVSS-based ranking supported by an accepted CPE match has a documented evidential basis, whereas an ambiguous product mapping should be treated as insufficient for downstream vulnerability prioritization. Third, the stage-by-stage losses help scope investment. Because the largest attrition in this study occurred before vulnerability reasoning, improving visibility and asset discovery may yield more value than refining matching or scoring methods over the already visible subset. In this way, the approach complements conventional methods by measuring the coverage and confidence of their inputs, while leaving severity, exploitation likelihood, impact, and asset criticality to the methods designed to estimate them.
The present study did not implement a CVE-to-ATT&CK mapping stage. Consequently, no realized technique mapping was produced from the collected evidence alone. Dedicated mapping resources and graph-based methods can extend this chain [32]; therefore, the present result should be interpreted as a boundary of the predefined observer model rather than as evidence that technique-level mapping is infeasible.
This is the point at which the present approach separates most sharply from work that begins inside the system. Methods that assess the criticality of elements within a known system model can reason about the role each element plays and how its compromise would matter, because they assume access to the system’s internal structure [38]. The external observer has no such access. It cannot see which technique a vulnerability would serve in a particular deployment, because it cannot see the deployment, only the vulnerability’s public identity. The contrast is not that one approach is better, but that they answer questions on opposite sides of the access boundary: internal criticality presumes the system is known and asks what matters within it, while external assessment presumes that the system is opaque and measures how far public evidence can support inference.
The ATT&CK interpretation boundary is therefore not an empirical failure at the end of the pipeline, but an instance of this subsection’s broader claim: each evidence layer answers a different question, and evidence available at one layer does not directly provide interpretation at the next. The hypothesis is supported within the scope of the predefined observer model. Exploitation and severity evidence survive at the CVE layer, often in usable quantity, but CVE resolution alone does not provide a technique label directly; technique-level interpretation requires an additional mapping or expert-inference layer that was not evaluated in this study. The implemented chain delivers the observer to a vulnerability and its likelihood of exploitation. Extending the analysis to technique-level interpretation would require an additional mapping method or expert inference layer that was outside the scope of the present study.
4.4. Limitations
The findings reported here hold within a specific and deliberately bounded setting, and it is worth marking the edges of that setting precisely, since several of them shape what the results can and cannot be taken to mean.
The first concerns the population itself. The 227 hosts derive from an IoT-23-oriented workflow rather than a random internet-wide sample, so the study measures evidence survival within a constructed external-observer setting and does not estimate global prevalence. The funnel describes how much evidence survives along the chain for this population, not what fraction of all internet-facing IoT devices would survive a comparable analysis, and the percentages should be read in that light. One additional caveat concerns public resolver or infrastructure addresses that may appear in traffic-derived host sets. Where a globally shared service such as 8.8.8.8 enters the graph, its external exposure does not represent a device controlled by the observed IoT or IIoT environment, and such addresses are better treated as infrastructure artefacts of communication than as local exposed assets. This does not affect the survival pattern, which concerns the population in aggregate, but it bears on the interpretation of any individual host.
The second concerns time. Every source consulted here, Shodan, Censys, EPSS, KEV, OTX, VirusTotal, and GreyNoise, is time-dependent, and a different collection window could return different banners, different EPSS scores, and different threat-intelligence presence. The measurements are therefore a snapshot, and while the structural finding, that the dominant loss is at the observability boundary, is unlikely to depend on the exact window, the specific counts would shift with another collection date.
The third concerns source access. Shodan was queried across the full 227 hosts, while Censys, OTX, VirusTotal, and GreyNoise were bounded to the pre-registered 100-host sample. This was a deliberate, denominator-controlled design, and the strata were never pooled, but it does limit what can be claimed about full-population multi-source recovery. The depth-and-breadth result holds for the sample as measured; extending it to the entire population would require querying the additional sources at full scale.
The fourth concerns the observer model. The study excludes active exploitation, credentialed access, internal telemetry, authenticated scanning, and manual fingerprinting by design, because its question is what a non-intrusive external observer can infer. That choice defines the contribution but also bounds it: evidence that is hidden at the surface, including version-level detail, may well exist and be recoverable by intrusive or privileged means, even though it is not externally inferable. The absence of such evidence in the results is an absence from external observation, not from the systems themselves.
The fifth concerns CPE and CVE matching. Product and version ambiguity affects whether a CPE can be accepted, and the acceptance rule used here is conservative. Ambiguous or unresolved cases may carry real vulnerabilities that were not carried forward, so the CVE-resolved count is a lower bound on what a more permissive or manually assisted matching process might surface, at the cost of more false matches.
The sixth concerns the ATT&CK layer. No realized CVE-to-ATT&CK mapping was constructed. The study did not evaluate dedicated mapping resources, graph-based approaches, or manual expert mapping. The absence of technique-level results therefore reflects the boundary of the predefined observer model and should not be interpreted as evidence that such mappings cannot be produced by other methods.
The seventh concerns the association. The relationship between surface observability and threat-intelligence visibility is host-level, sample-bounded, and non-causal. It shows that the two visibilities co-occur more often than chance would predict, not that either causes the other, and not that the hosts in question were compromised or exploited. One statistical detail bears noting here. The conservative VirusTotal threshold, defined as malicious detections of two or more, produced a sparse two-by-two table with a zero cell, so that result is reported primarily through exact counts and Fisher’s exact test; the risk ratios, odds ratios, and bootstrap intervals around it should be read cautiously and are not used as substantive evidence. The association across the loose and strict definitions, where the cells are better populated, is the more robust statement.
5. Conclusions
This study asked how much of the evidence needed for risk inference survives when an observer is confined to public, non-intrusive sources and forbidden from touching the target. To answer it, we followed a fixed population of 227 public hosts along an external evidence chain, from surface observability through service and product evidence, CPE acceptance, and CVE resolution, to the point where adversary-technique interpretation would begin, measuring at each step how much evidence remained against a controlled denominator. The design treated the question as one of measurement rather than prediction, asking not what risk a host carries but how far an external observer can see before the evidence runs out.
The measurements locate the limits of that view with some precision. The largest single loss falls at the very first step, where only 58 of the 227 hosts returned any externally observable service, so that the dominant constraint on external inference is observability itself rather than any later reasoning. A second independent source deepened the evidence for hosts already visible but recovered very little of the blind region, which means multi-source enrichment sharpens what is seen more than it widens what can be seen. At the CVE layer, severity and exploitation-likelihood evidence survived in usable quantity, with CVSS scores available for every resolved CVE and EPSS showing a substantially elevated tail. Technique-level interpretation was not evaluated within the implemented protocol and would require an additional CVE-to-ATT&CK mapping layer or expert-inference process. Across the host-level dimension, threat-intelligence visibility was associated with surface observability, the hosts an external scanner could see being disproportionately the ones reputation sources had also noticed, though this remained a host-level co-occurrence and not a causal or compromise claim.
The contribution is the measurement itself and the discipline that made it interpretable. Rather than building another risk-scoring pipeline that fuses signals into a single number, this work measured evidence survival stage by stage under strict denominator control, keeping host-level and vulnerability-level evidence on separate footings so that each loss could be attributed to a specific boundary and each association stated cleanly. What the study offers is therefore an account of where external evidence-to-risk inference succeeds and where additional mapping or expert interpretation becomes necessary.
Several directions follow naturally. Whether version-level evidence, absent from every source here, can be recovered by any non-intrusive external means remains open and would determine how precisely external observation can identify what it sees. Broadening the source set beyond those used here, and repeating the collection across multiple time windows, would test whether the observability boundary is a property of particular tooling or a more durable limit. The implemented external evidence chain reached CVE-level severity and exploitation-likelihood evidence but did not extend to ATT&CK technique interpretation, which would require an additional mapping layer beyond the observer model evaluated here.
Author Contributions
Conceptualization, T.B.; methodology, T.B.; investigation, T.B.; software, K.K.; validation, K.K. and A.S.; formal analysis, A.S.; data curation, A.S.; resources, A.S.; writing—original draft preparation, T.B.; writing—review and editing, T.B., K.K., A.S. and Y.V.; visualization, K.K. and Y.V.; supervision, Y.V.; project administration, Y.V.; funding acquisition, Y.V. All authors have read and agreed to the published version of the manuscript.
Funding
This research is funded by JSC “Institute of Digital Engineering and Technology”, subsidiary organization of Satbayev University, Almaty, Kazakhstan.
Data Availability Statement
All data generated or analyzed during this study are included in this published article.
Conflicts of Interest
The authors declare no conflicts of interest.
References
- Antonakakis, M.; April, T.; Bailey, M.; Bernhard, M.; Bursztein, E.; Cochran, J.; Durumeric, Z.; Halderman, J.A.; Invernizzi, L.; Kallitsis, M.; et al. Understanding the Mirai Botnet. In Proceedings of the 26th USENIX Security Symposium, Vancouver, BC, Canada, 16–18 August 2017; pp. 1093–1110. [Google Scholar]
- Pa Pa, Y.M.; Suzuki, S.; Yoshioka, K.; Matsumoto, T.; Kasama, T.; Rossow, C. IoTPOT: Analysing the Rise of IoT Compromises. In Proceedings of the 9th USENIX Workshop on Offensive Technologies (WOOT), Washington, DC, USA, August 2015. [Google Scholar]
- Garcia, S.; Parmisano, A.; Erquiaga, M.J. IoT-23: A Labeled Dataset with Malicious and Benign IoT Network Traffic, Version 1.0.0 [Data Set]; Zenodo: Geneva, Switzerland, 2020. [Google Scholar] [CrossRef] [Scilit]
- Al-Boghdady, A.; Wassif, K.; El-Ramly, M. The Presence, Trends, and Causes of Security Vulnerabilities in Operating Systems of IoT’s Low-End Devices. Sensors 2021, 21, 2329. [Google Scholar] [CrossRef] [Scilit] [PubMed]
- Babenko, T.; Kolesnikova, K.; Bakhtiyarova, Y.; Yeskendirova, D.; Sansyzbay, K.; Sysoyev, A.; Kruchinin, O. Hybrid GNN–LSTM Architecture for Probabilistic IoT Botnet Detection with Calibrated Risk Assessment. Computers 2026, 15, 26. [Google Scholar] [CrossRef] [Scilit]
- Durumeric, Z.; Wustrow, E.; Halderman, J.A. ZMap: Fast Internet-Wide Scanning and Its Security Applications. In Proceedings of the 22nd USENIX Security Symposium, Washington, DC, USA, 14–16 August 2013; pp. 605–620. [Google Scholar]
- Bodenheim, R.; Butts, J.; Dunlap, S.; Mullins, B. Evaluation of the Ability of the Shodan Search Engine to Identify Internet-Facing Industrial Control Systems. Int. J. Crit. Infrastruct. Prot. 2014, 7, 114–123. [Google Scholar] [CrossRef] [Scilit]
- Babenko, T.; Kolesnikova, K.; Abramkina, O.; Vitulyova, Y. Automated OSINT Techniques for Digital Asset Discovery and Cyber Risk Assessment. Computers 2025, 14, 430. [Google Scholar] [CrossRef] [Scilit]
- Cheikes, B.A.; Waltermire, D.; Scarfone, K. Common Platform Enumeration: Naming Specification Version 2.3; NIST Interagency Report 7695; National Institute of Standards and Technology: Gaithersburg, MD, USA, 2011. [CrossRef] [Scilit]
- MITRE. CVE: Common Vulnerabilities and Exposures; The MITRE Corporation: McLean, VA, USA; Available online: https://www.cve.org/ (accessed on 15 June 2026).
- National Institute of Standards and Technology. National Vulnerability Database (NVD); NIST: Gaithersburg, MD, USA. Available online: https://nvd.nist.gov/ (accessed on 15 June 2026).
- FIRST. Common Vulnerability Scoring System Version 3.1: Specification Document; Forum of Incident Response and Security Teams: 2019. Available online: https://www.first.org/cvss/v3.1/specification-document (accessed on 15 June 2026).
- Bilge, L.; Dumitraş, T. Before We Knew It: An Empirical Study of Zero-Day Attacks in the Real World. In Proceedings of the 2012 ACM Conference on Computer and Communications Security (CCS), Raleigh, NC, USA, 16–18 October 2012; pp. 833–844. [Google Scholar] [CrossRef] [Scilit]
- Babenko, T.; Kolesnikova, K.; Panchenko, M.; Abramkina, O.; Kiktev, N.; Meish, Y.; Mazurchuk, P. Risk Assessment of Cryptojacking Attacks on Endpoint Systems: Threats to Sustainable Digital Agriculture. Sustainability 2025, 17, 5426. [Google Scholar] [CrossRef] [Scilit]
- Strom, B.E.; Applebaum, A.; Miller, D.P.; Nickels, K.C.; Pennington, A.G.; Thomas, C.B. MITRE ATT&CK: Design and Philosophy; The MITRE Corporation: McLean, VA, USA, 2018; revised 2020. [Google Scholar]
- Strom, B.E.; Battaglia, J.A.; Kemmerer, M.S.; Kupersanin, W.; Miller, D.P.; Wampler, C.; Whitley, S.M.; Wolf, R.D. Finding Cyber Threats with ATT&CK-Based Analytics; Technical Report MTR170202; The MITRE Corporation: Annapolis, MD, USA, 2017. [Google Scholar]
- Hemberg, E.; Kelly, J.; Shlapentokh-Rothman, M.; Reinstadler, B.; Xu, K.; Rutar, N.; O’Reilly, U.-M. Linking Threat Tactics, Techniques, and Patterns with Defensive Weaknesses, Vulnerabilities and Affected Platform Configurations for Cyber Hunting. arXiv 2020, arXiv:2010.00533. [Google Scholar]
- Husák, M.; Komárková, J.; Bou-Harb, E.; Čeleda, P. Survey of Attack Projection, Prediction, and Forecasting in Cyber Security. IEEE Commun. Surv. Tutor. 2019, 21, 640–660. [Google Scholar] [CrossRef] [Scilit]
- Vitulyova, Y.; Babenko, T.; Kolesnikova, K.; Kiktev, N.; Abramkina, O. A Hybrid Approach Using Graph Neural Networks and LSTM for Attack Vector Reconstruction. Computers 2025, 14, 301. [Google Scholar] [CrossRef] [Scilit]
- Durumeric, Z.; Adrian, D.; Mirian, A.; Bailey, M.; Halderman, J.A. A Search Engine Backed by Internet-Wide Scanning. In Proceedings of the 22nd ACM SIGSAC Conference on Computer and Communications Security (CCS), Denver, CO, USA, 12–16 October 2015; pp. 542–553. [Google Scholar] [CrossRef] [Scilit]
- Jacobs, J.; Romanosky, S.; Edwards, B.; Adjerid, I.; Roytman, M. Exploit Prediction Scoring System (EPSS). Digit. Threat. Res. Pract. 2021, 2, 20. [Google Scholar] [CrossRef] [Scilit]
- Cybersecurity and Infrastructure Security Agency. Known Exploited Vulnerabilities Catalog; CISA: Washington, DC, USA. Available online: https://www.cisa.gov/known-exploited-vulnerabilities-catalog (accessed on 14 June 2026).
- AT&T Cybersecurity. AlienVault Open Threat Exchange (OTX); AT&T Cybersecurity (LevelBlue). Available online: https://otx.alienvault.com (accessed on 19 June 2026).
- VirusTotal; Google (Chronicle Security/Google Cloud): Dublin, Ireland; Available online: https://www.virustotal.com (accessed on 19 June 2026).
- GreyNoise Intelligence. GreyNoise Community API; GreyNoise Intelligence: Washington, DC, USA; Available online: https://docs.greynoise.io/ (accessed on 18 June 2026).
- Genge, B.; Enăchescu, C. ShoVAT: Shodan-Based Vulnerability Assessment Tool for Internet-Facing Services. Secur. Commun. Netw. 2016, 9, 2696–2714. [Google Scholar] [CrossRef] [Scilit]
- Paxson, V. Bro: A System for Detecting Network Intruders in Real-Time. Comput. Netw. 1999, 31, 2435–2463. [Google Scholar] [CrossRef] [Scilit]
- Parmelee, M.; Booth, H.; Waltermire, D.; Scarfone, K. Common Platform Enumeration: Name Matching Specification Version 2.3; NIST Interagency Report 7696; National Institute of Standards and Technology: Gaithersburg, MD, USA, 2011. [CrossRef] [Scilit]
- Barbieri, G.; Conti, M.; Tippenhauer, N.O.; Turrin, F. Assessing the Use of Insecure ICS Protocols via IXP Network Traffic Analysis. In Proceedings of the 2021 International Conference on Computer Communications and Networks (ICCCN), Athens, Greece, 19–22 July 2021; pp. 1–9. [Google Scholar] [CrossRef] [Scilit]
- Heidemann, J.; Pradkin, Y.; Govindan, R.; Papadopoulos, C.; Bartlett, G.; Bannister, J. Census and Survey of the Visible Internet. In Proceedings of the 8th ACM SIGCOMM Conference on Internet Measurement (IMC), Vouliagmeni, Greece, 20–22 October 2008; pp. 169–182. [Google Scholar] [CrossRef] [Scilit]
- Jacobs, J.; Romanosky, S.; Adjerid, I.; Baker, W. Improving Vulnerability Remediation Through Better Exploit Prediction. J. Cybersecur. 2020, 6, tyaa015. [Google Scholar] [CrossRef] [Scilit]
- Grigorescu, O.; Nica, A.; Dascalu, M.; Rughinis, R. CVE2ATT&CK: BERT-Based Mapping of CVEs to MITRE ATT&CK Techniques. Algorithms 2022, 15, 314. [Google Scholar] [CrossRef] [Scilit]
- Cohen, J. Statistical Power Analysis for the Behavioral Sciences, 2nd ed.; Lawrence Erlbaum Associates: Hillsdale, NJ, USA, 1988. [Google Scholar]
- Agresti, A. Categorical Data Analysis, 3rd ed.; Wiley: Hoboken, NJ, USA, 2013. [Google Scholar]
- Srinivasa, S.; Pedersen, J.M.; Vasilomanolakis, E. Open for Hire: Attack Trends and Misconfiguration Pitfalls of IoT Devices. In Proceedings of the 21st ACM Internet Measurement Conference (IMC’21), Virtual, 2 November 2021; pp. 195–215. [Google Scholar] [CrossRef] [Scilit]
- Bennett, C.; Abdou, A.; van Oorschot, P.C. Empirical Scanning Analysis of Censys and Shodan. In Proceedings of the NDSS Workshop on Measurements, Attacks, and Defenses for the Web (MADWeb), Virtual, 25 February 2021. [Google Scholar] [CrossRef] [Scilit]
- Allodi, L.; Massacci, F. Comparing Vulnerability Severity and Exploits Using Case-Control Studies. ACM Trans. Inf. Syst. Secur. 2014, 17, 1–20. [Google Scholar] [CrossRef] [Scilit]
- Hnatiienko, H.; Hnatiienko, V.; Zulunov, R.; Babenko, T.; Myrutenko, L. Method for Determining the Level of Criticality Elements When Ensuring the Functional Stability of the System Based on Role Analysis of Elements. In Proceedings of the Cybersecurity Providing in Information and Telecommunication Systems (CPITS-2024), Kyiv, Ukraine, 28 February 2024; CEUR-WS: Aachen, Germany, 2024; Volume 3654, pp. 301–311. [Google Scholar]
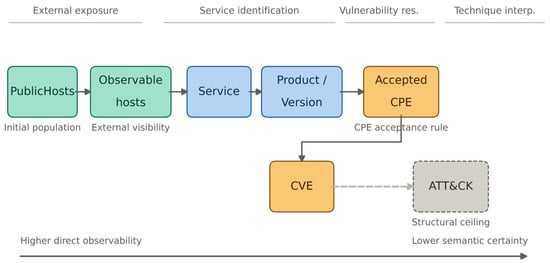
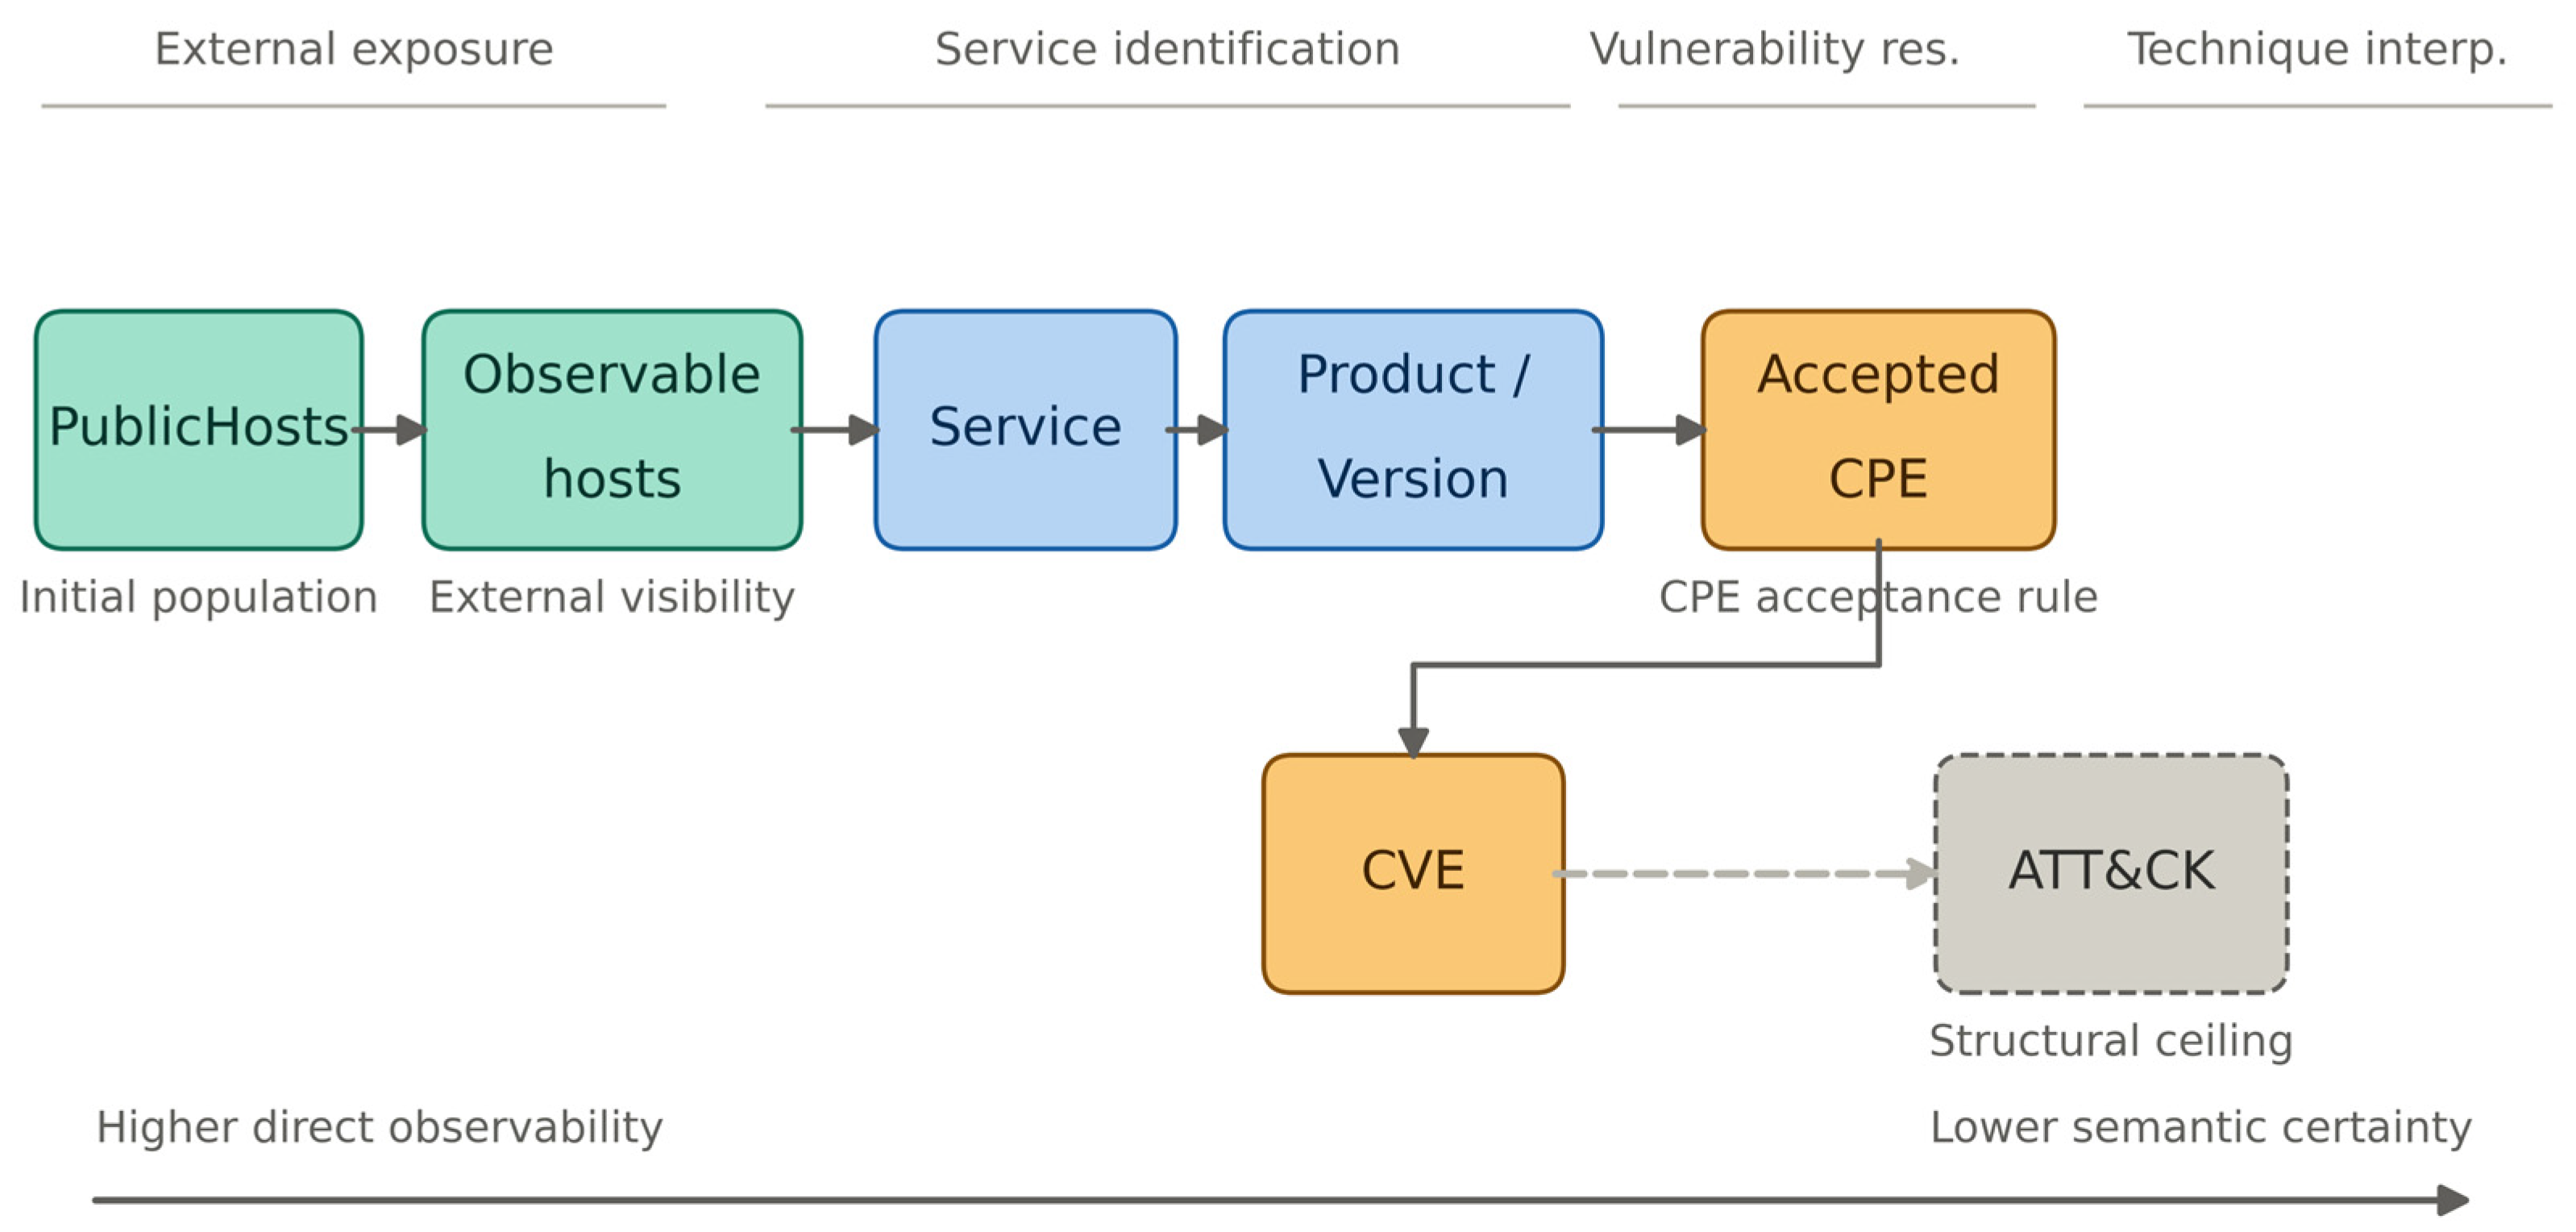
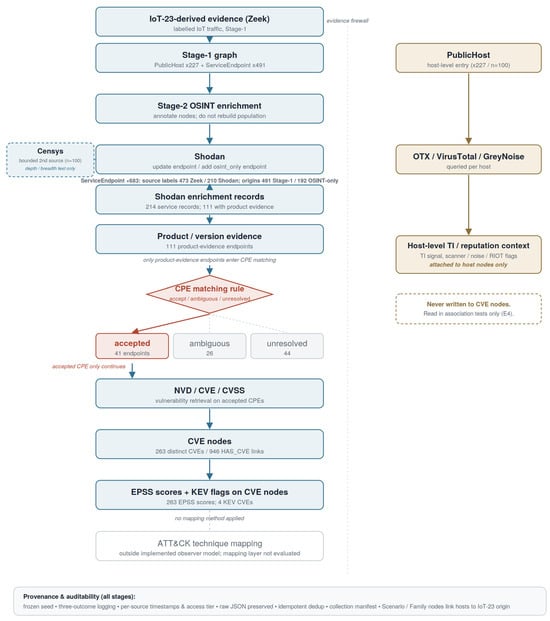
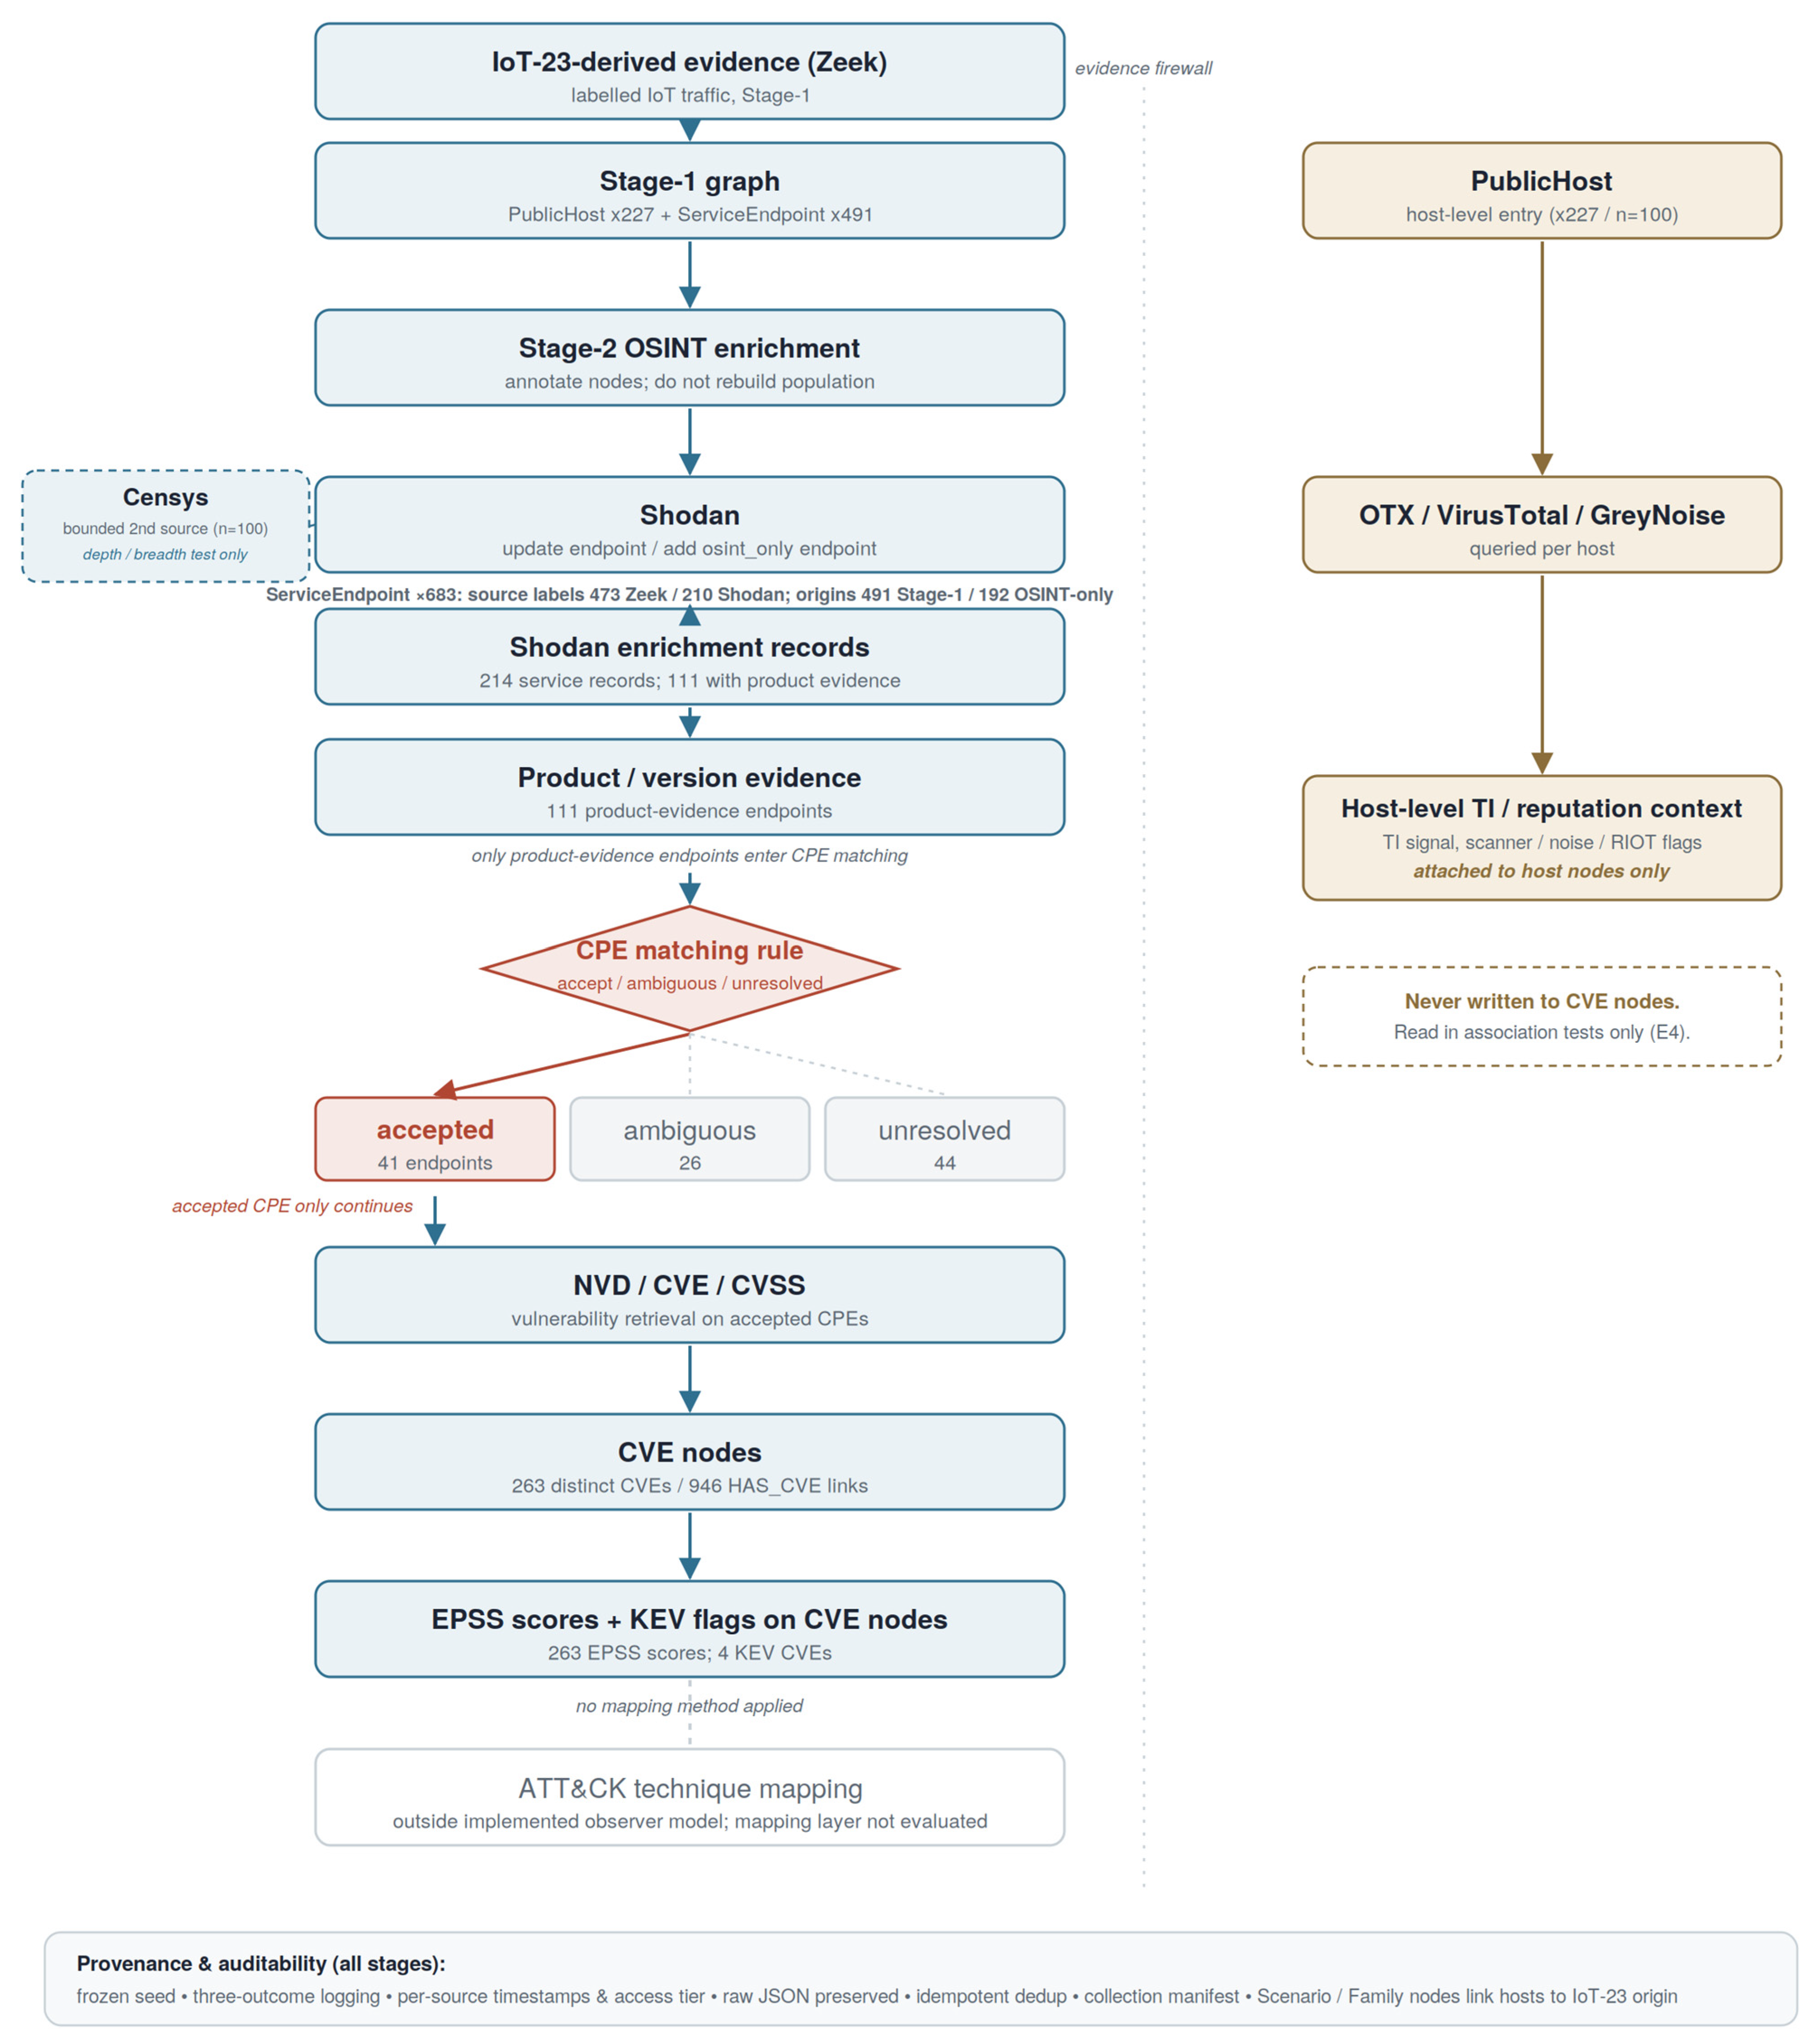
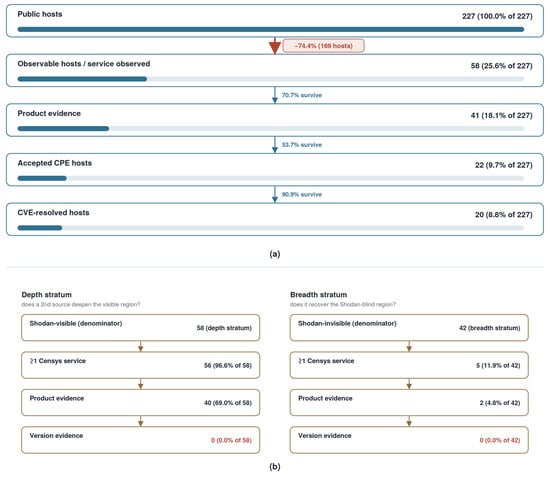
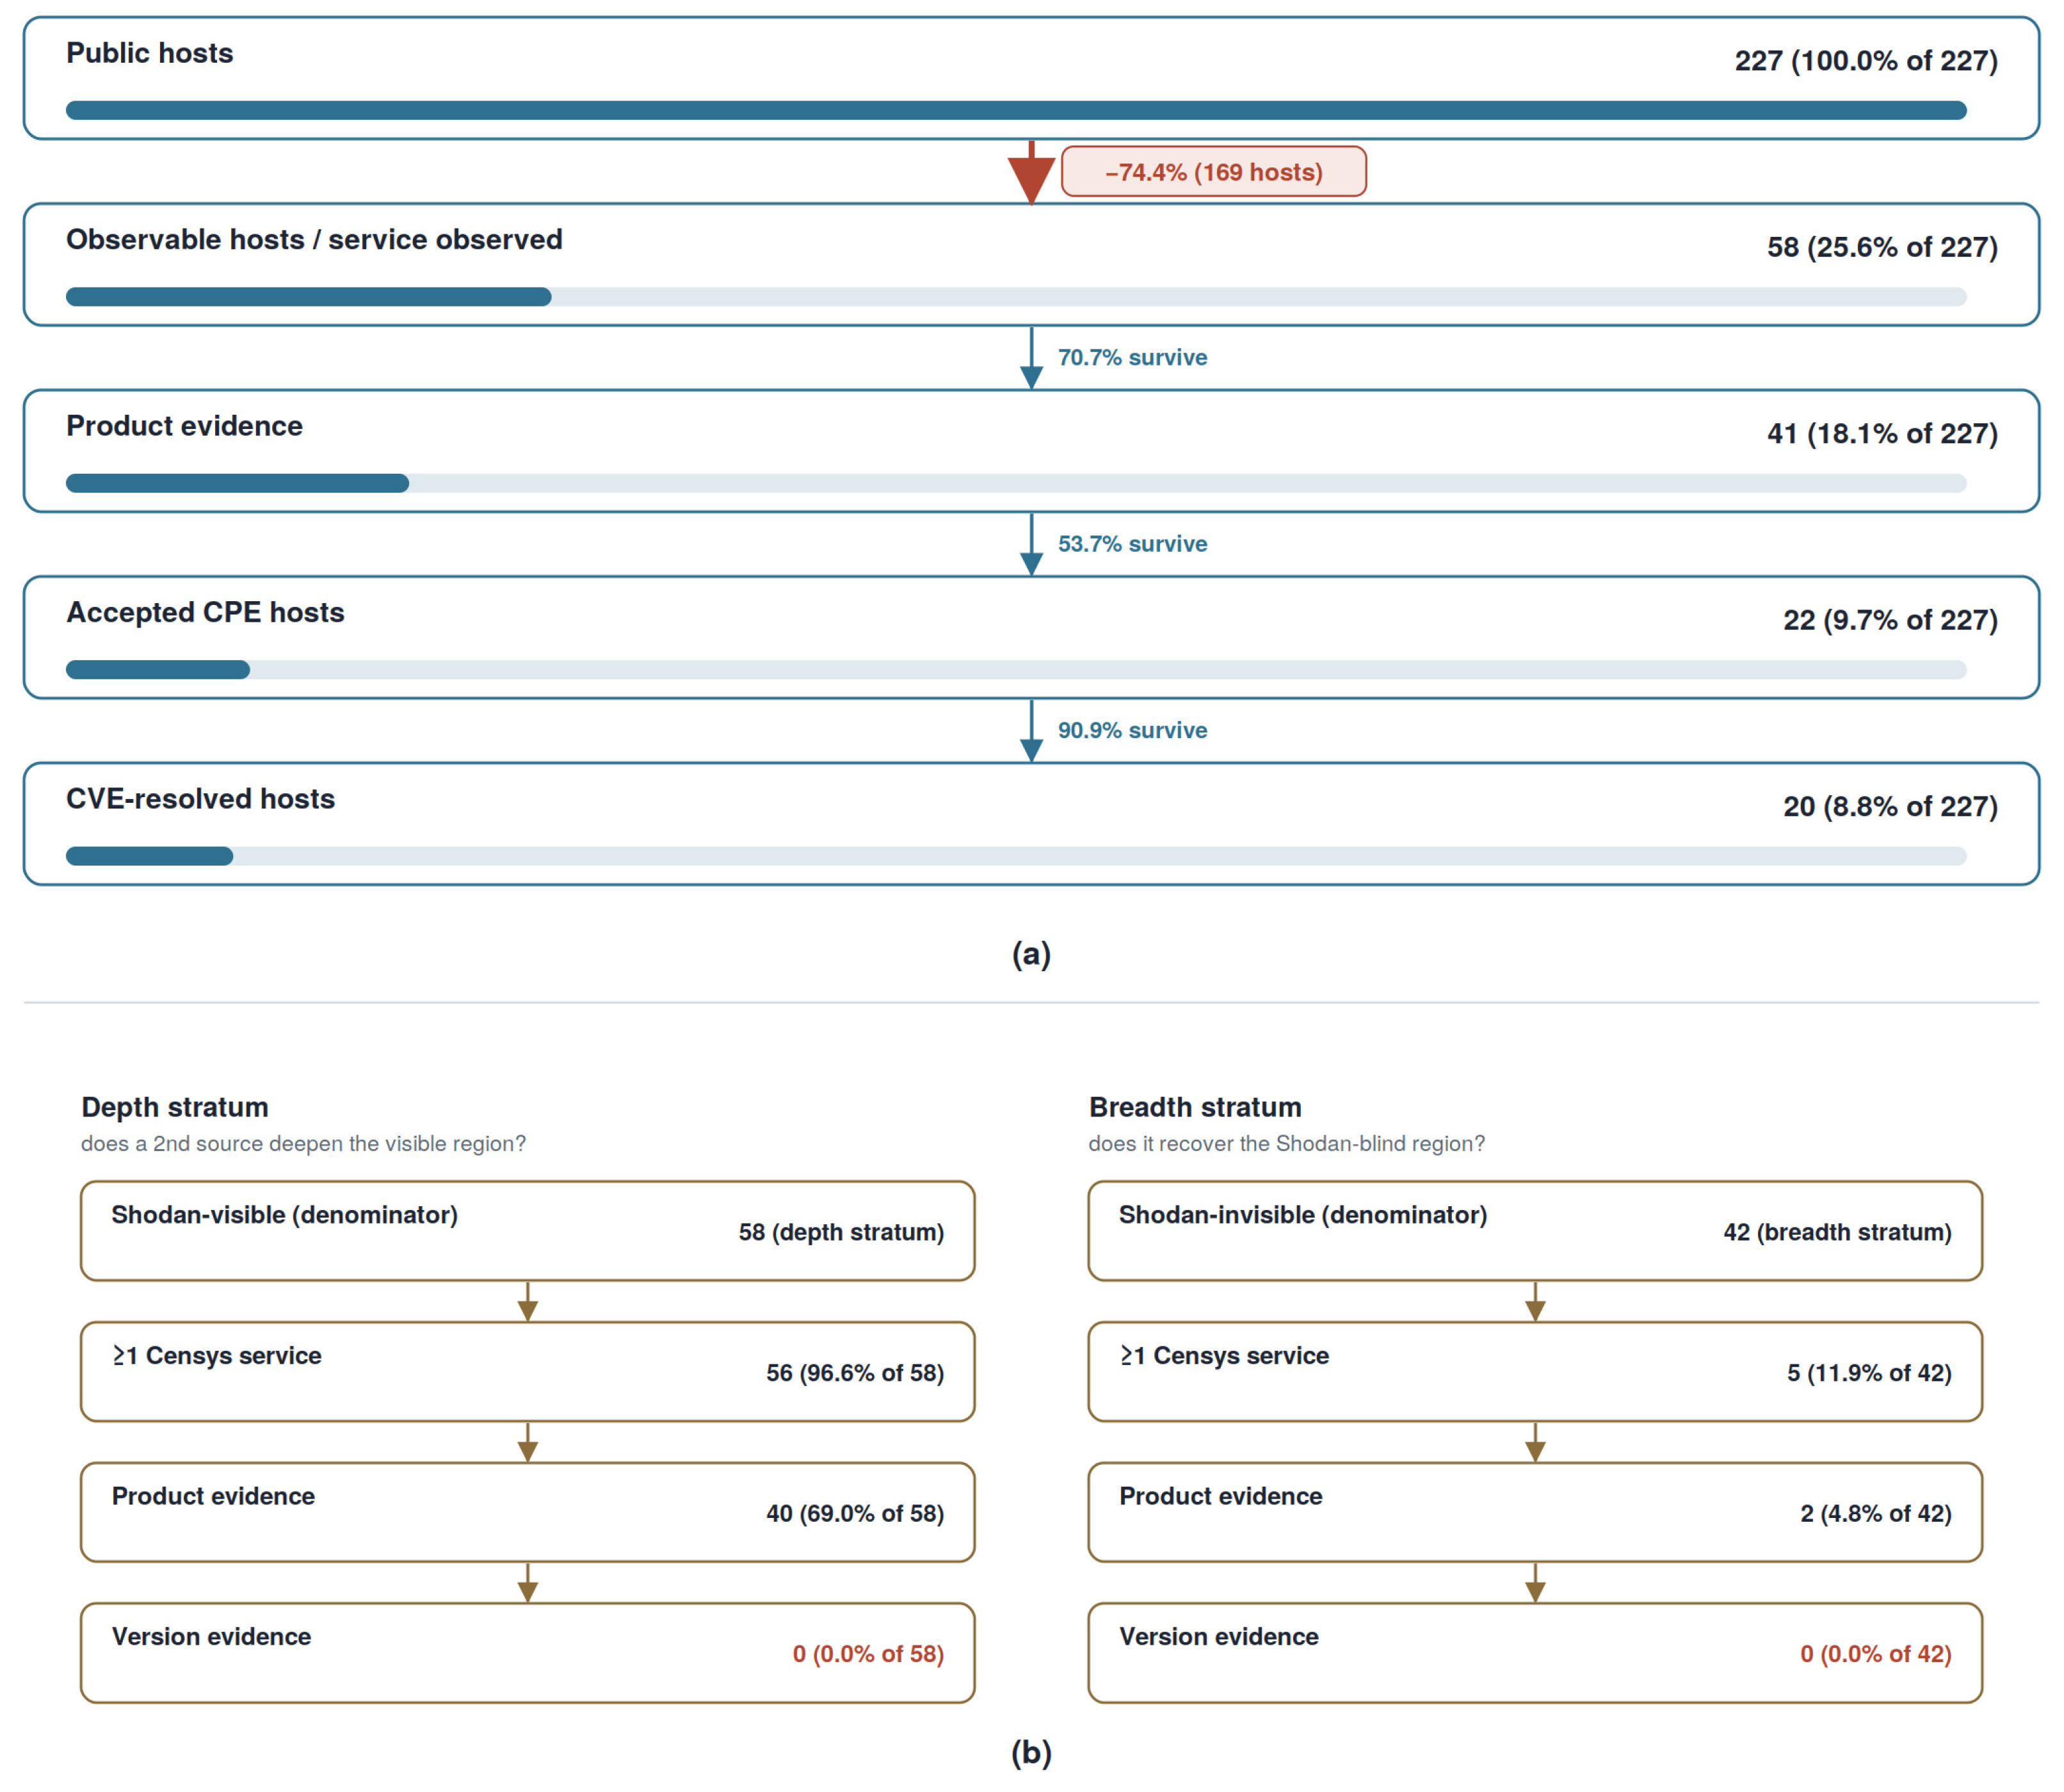
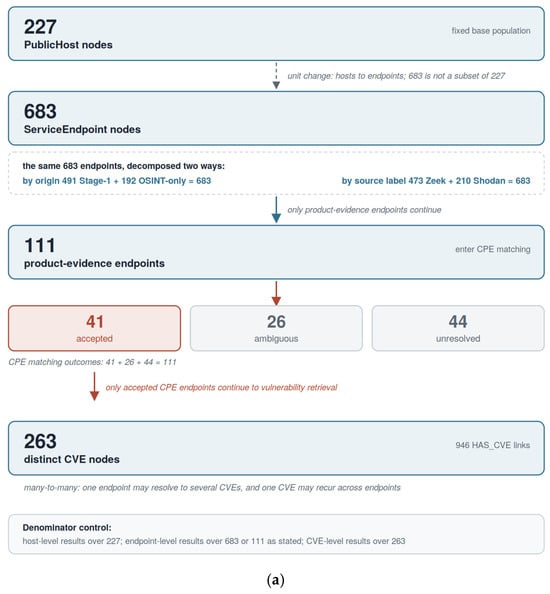
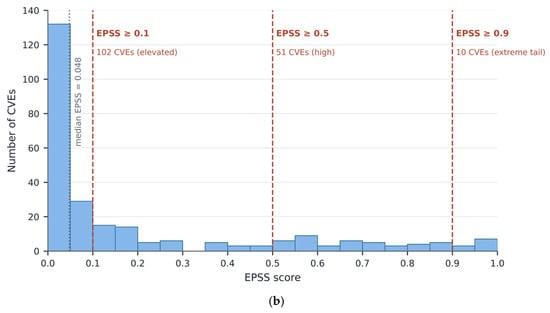
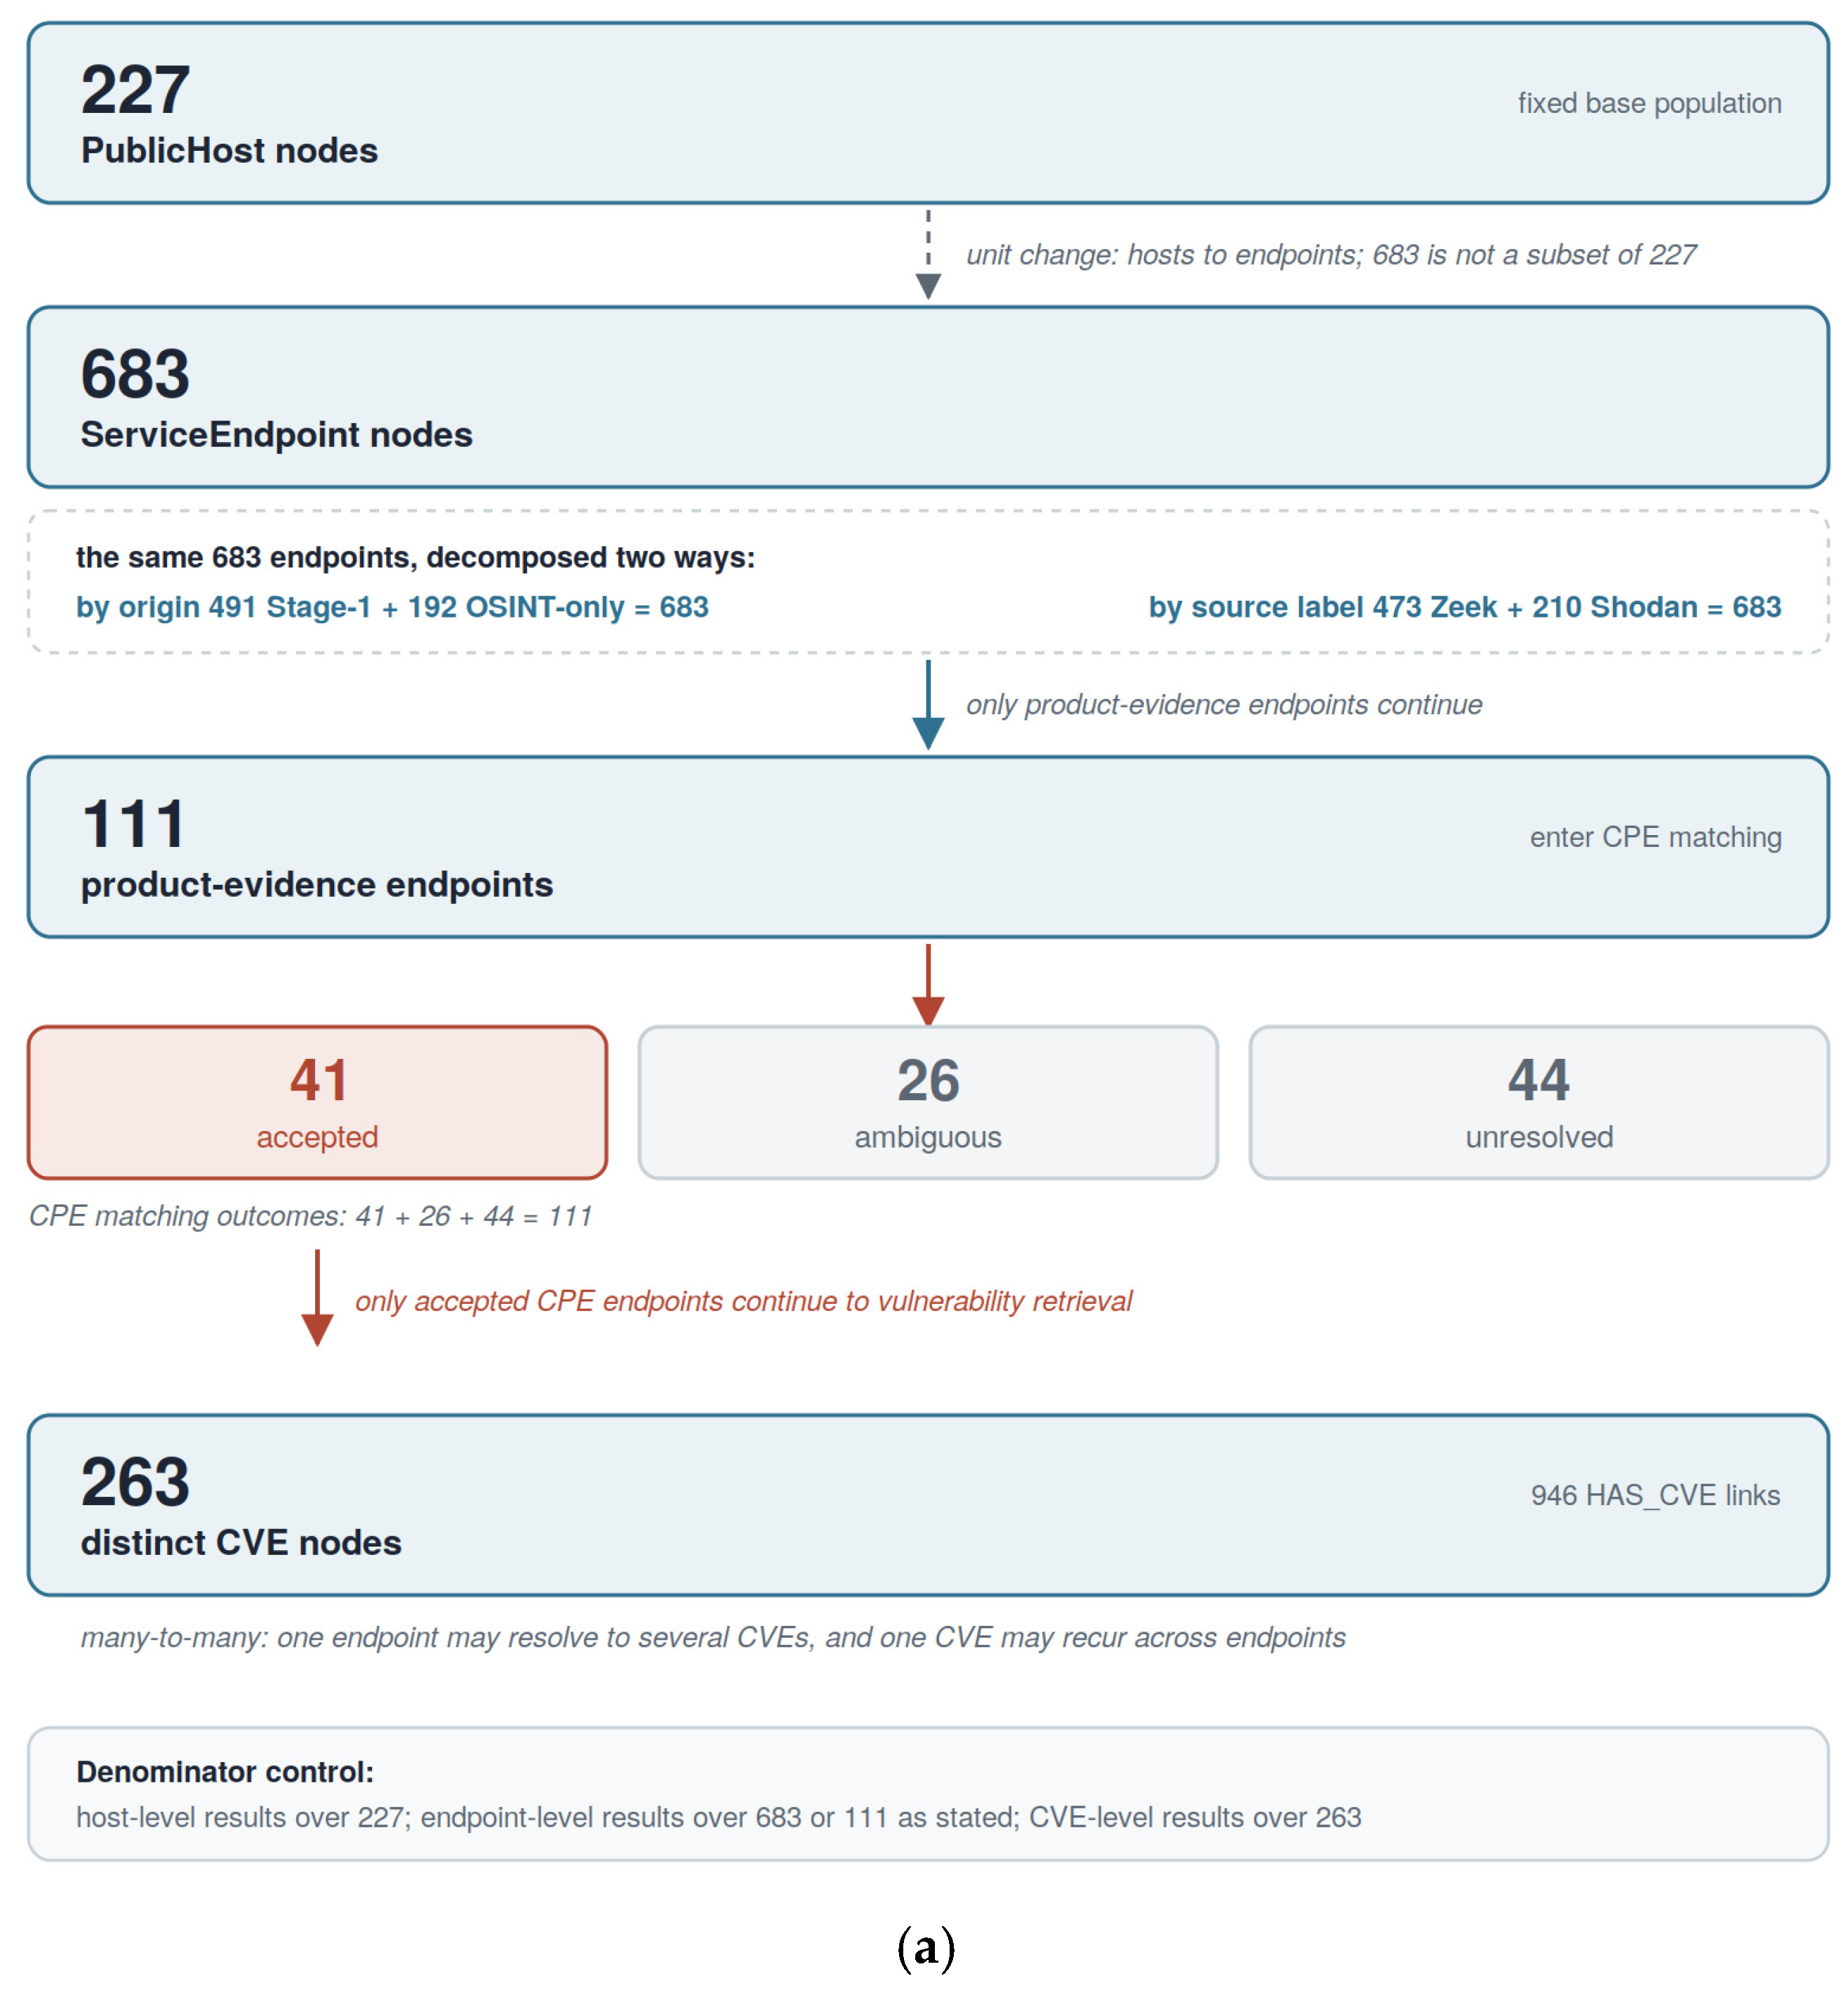
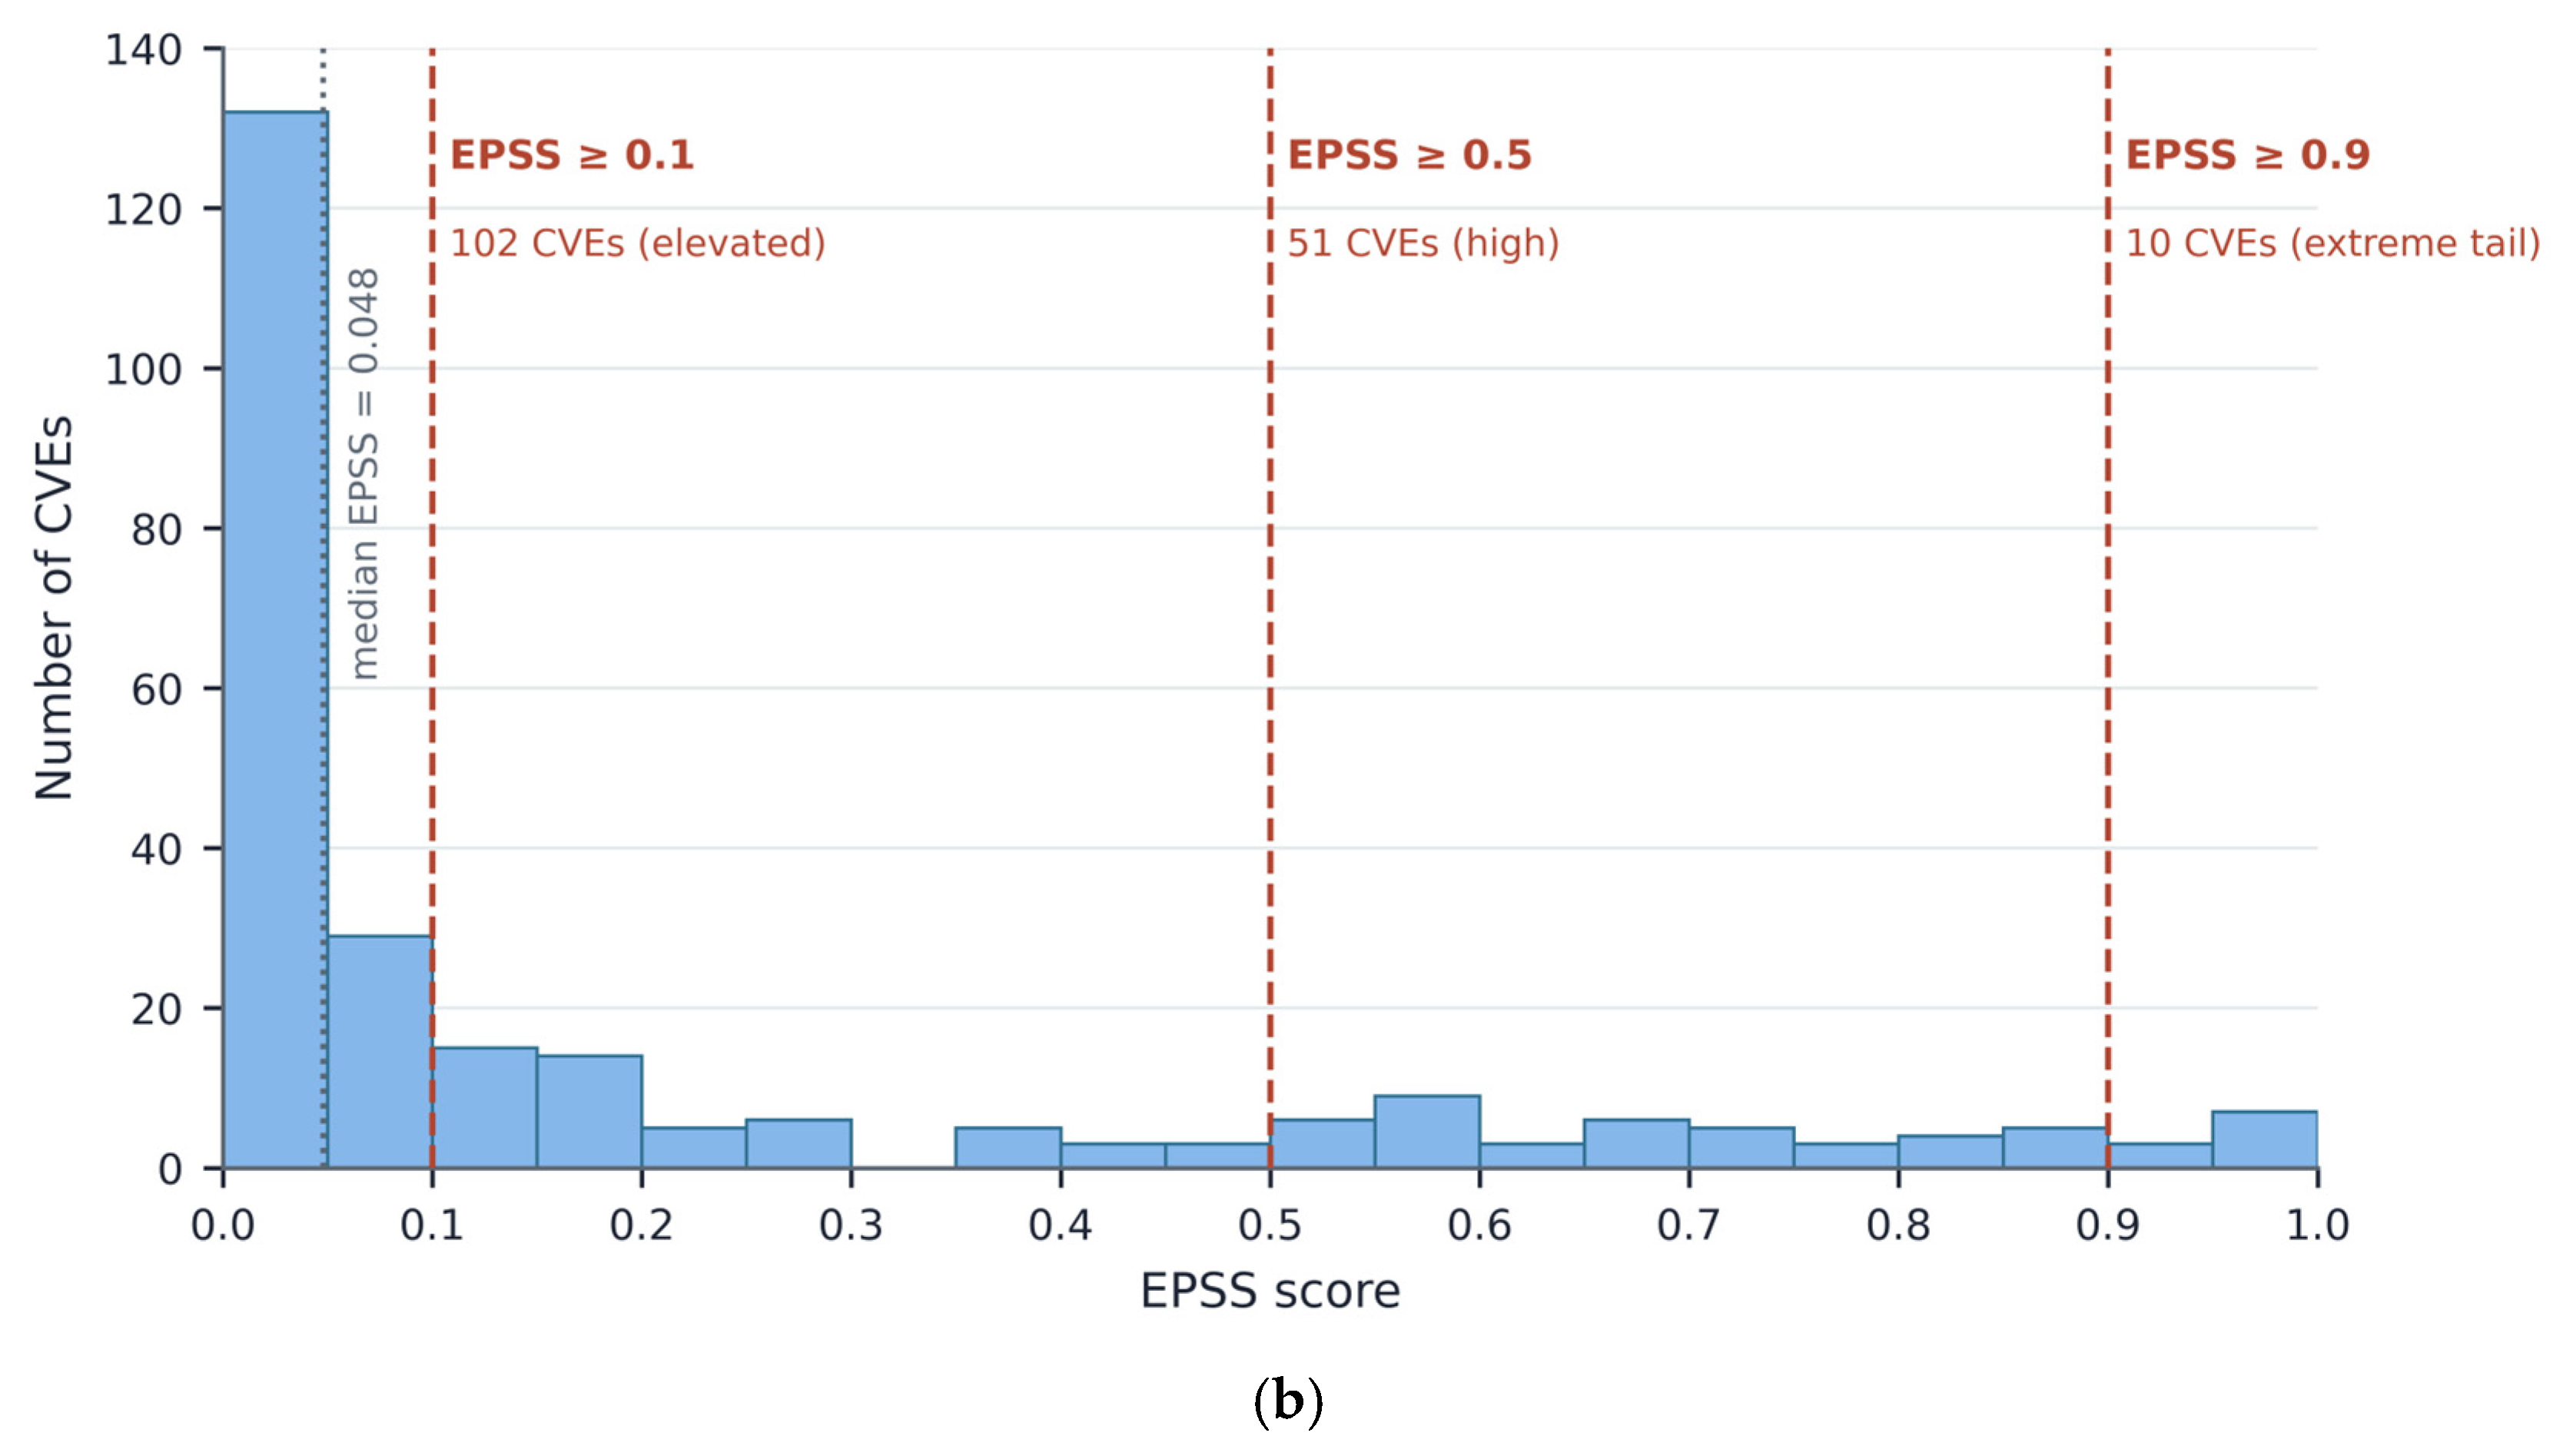

Disclaimer/Publisher’s Note: The statements, opinions and data contained in all publications are solely those of the individual author(s) and contributor(s) and not of MDPI and/or the editor(s). MDPI and/or the editor(s) disclaim responsibility for any injury to people or property resulting from any ideas, methods, instructions or products referred to in the content. |
© 2026 by the authors. Licensee MDPI, Basel, Switzerland. This article is an open access article distributed under the terms and conditions of the Creative Commons Attribution (CC BY) license.