


Abstract
Childhood undernutrition, overweight, and obesity coexist in Mexico, but anthropometric classification alone does not characterize the broader context accompanying each child’s nutritional phenotype. We developed and evaluated an interpretable machine learning framework for concurrent four-class nutritional status classification and individualized feature profiling using data on 8268 children younger than 72 months from the 2018–2023 Mexican National Health and Nutrition Survey (ENSANUT). Nutritional status was defined according to World Health Organization weight-for-height standards. The primary analysis used 78 predictors, including current child weight and height but excluding body mass index and anthropometry-derived z-scores; a 76-predictor ablation step removed weight and height before model development. Multinomial logistic regression, calibrated LinearSVC, random forest, XGBoost, soft voting, and a stacked neural network ensemble were evaluated using leakage-aware preprocessing, repeated stratified five-fold cross-validation, an independent internal hold-out sample, and ENSANUT 2023 as a later survey-wave evaluation. In the internal hold-out sample, XGBoost achieved the highest macro-F1 (0.736) and macro-average precision (0.757), whereas the stacked ensemble achieved the highest balanced accuracy (0.823). In ENSANUT 2023, XGBoost retained the highest macro-F1 (0.680) and macro-average precision (0.762), while the stacked ensemble achieved the highest macro-AUC (0.977). Removing current weight and height markedly reduced performance across all models, demonstrating substantial dependence on outcome-defining anthropometry. Probability calibration varied across algorithms, with substantial calibration-in-the-large deviations for the stacked ensemble. SHAP and repeated LIME analyses of the complete ensemble confirmed the dominant contribution of current anthropometry while identifying additional contextual contributions. The framework should therefore be interpreted as a methodological proof of concept for concurrent anthropometry-informed classification and feature profiling, not as a replacement for WHO growth standards or as prediction of future nutritional status. External and longitudinal validation are required before clinical use.
1. Introduction
Childhood undernutrition, overweight, and obesity coexist in Mexico and remain important public health challenges. The prevalence of childhood excess weight has increased substantially in recent decades, while undernutrition continues to primarily affect children younger than five years of age [1,2,3,4]. Excess weight during childhood is associated with an increased risk of non-communicable diseases later in life, whereas undernutrition may adversely affect growth and development [2,4]. Nutritional assessment during early childhood should therefore preserve clinically distinct categories across the nutritional status spectrum rather than reducing nutritional status to a binary classification.
Childhood nutritional status is multifactorial and reflects the interaction between dietary, behavioral, family, socioeconomic, perinatal, and early-life characteristics [3,4,5,6,7,8,9,10,11,12,13,14,15]. Poor diet quality, insufficient physical activity, inadequate sleep, parental obesity, feeding practices, and socioeconomic and family conditions have all been associated with childhood nutritional outcomes [3,4,5,6,7,8,9,10,11,12,13,14,15]. Several of these characteristics may be clinically relevant because children assigned to the same anthropometric nutritional status category may nevertheless differ substantially in their broader individual context. Identifying these differences may therefore provide a more comprehensive description of nutritional phenotype beyond anthropometric category alone and may help support more individualized counseling by highlighting contextual characteristics that warrant further clinical assessment.
World Health Organization (WHO) growth standards remain the reference for classifying nutritional status in young children and should not be replaced by machine learning models [16]. However, an anthropometric classification alone does not describe which family, socioeconomic, dietary, feeding, sleep, activity-related, or other contextual characteristics accompany an individual child’s nutritional phenotype. Machine learning methods can integrate heterogeneous information across these domains and may therefore provide model-based contextual feature profiles alongside conventional anthropometric assessment. Previous studies have applied machine learning to childhood obesity, metabolic risk, electronic health records, multiomics data, and maternal–child information, with promising discrimination capability [17,18,19,20]. Nevertheless, many studies have focused on binary obesity outcomes, longitudinal prediction, selected clinical populations, or data sources that differ substantially from population-based preschool surveys.
Several methodological challenges remain when machine learning is applied to this setting. Missing data and marked class imbalance may substantially influence performance estimates, whereas preprocessing performed outside training partitions may introduce information leakage. Furthermore, when current child weight and height are supplied to a classifier whose reference outcome is itself defined from weight-for-height standards, strong discrimination capability may partly reflect direct access to measurements used to define the outcome rather than independent information from contextual predictors. For this reason, performance with current weight and height should be interpreted separately from the performance demonstrated when these measurements are excluded. Similarly, the usefulness of an interpretable ensemble depends on explaining the complete model rather than only individual component classifiers, and local explanations should be evaluated for reproducibility across repeated perturbations [21,22,23,24,25,26].
We hypothesized that an interpretable stacked machine learning framework integrating anthropometric, demographic, socioeconomic, perinatal, feeding, dietary, sleep, physical activity, behavioral, and family-related information could classify concurrent multiclass nutritional-status and generate individualized model-based feature profiles for Mexican infants and preschool children. Accordingly, this study aimed to develop and evaluate a stacked ensemble for concurrent classification of undernutrition, normal weight, overweight, and obesity using data from repeated cross-sectional ENSANUT survey waves conducted between 2018 and 2023; compare neural stacking with individual base learners, soft voting, and a gradient-boosting classifier; quantify the dependence of performance on current child weight and height; assess discrimination, calibration, and transportability to the later ENSANUT 2023 survey wave; and explain the complete stacked ensemble using SHapley Additive exPlanations (SHAP) and repeated Local Interpretable Model-agnostic Explanations (LIME). Because ENSANUT does not provide longitudinal follow-up of the same children, the present analysis addresses nutritional status at the time of assessment rather than predictions of future nutritional status or growth trajectories.
This article is a substantially revised and expanded version of our previous MICAI 2025 conference paper [27].
2. Materials and Methods
2.1. Study Design and Data Source
This article presents a proof-of-concept model-development study based on a secondary analysis of repeated cross-sectional, population-based survey data. The study was designed to develop, evaluate, and interpret a stacked ensemble machine learning framework for concurrent multiclass nutritional status classification and individualized feature profiling of Mexican infants and preschool children.
Data were obtained from the Mexican National Health and Nutrition Survey (Encuesta Nacional de Salud y Nutrición, ENSANUT) datasets collected in 2018, 2021, 2022, and 2023 [28]. These surveys provide population-based information on health, nutrition, sociodemographic characteristics, household conditions, feeding practices, sleep, physical activity, and anthropometric measurements in the Mexican population.
Because ENSANUT consists of repeated cross-sectional survey waves and does not provide longitudinal follow-up of the same children, predictor information and nutritional status were obtained from the same survey assessment. Accordingly, the present analysis addresses concurrent nutritional status classification and individualized feature profiling rather than predictions of future nutritional status. No index date, future outcome measurement date, or prediction horizon was therefore defined.
The final analytic dataset comprised 8268 children younger than 72 months. After excluding administrative fields, imputation indicators, calculated energy variables, and child anthropometric indices directly derived from the measurements defining the outcome, the primary modeling configuration comprised 78 predictors covering demographic, socioeconomic, geographic, perinatal, anthropometric, nutritional, feeding, sleep, physical activity, behavioral, and family-related domains.
The modeling task comprised supervised four-class classification of current nutritional status according to World Health Organization (WHO) growth standards. Reporting emphasized transparent descriptions of the temporal structure, data partitions, preprocessing procedures, model-development workflow, and evaluation samples to distinguish the present concurrent classification task from longitudinal prognostic modeling.
2.2. Study Population
Eligible records corresponded to children younger than 72 months of age, of any sex, with non-missing age, sex, current body weight, and height information sufficient to determine the corresponding WHO weight-for-height z-score and assign the child to one of the four nutritional-status categories.
Records were excluded when reported conditions could substantially alter growth patterns or nutritional status independently of the usual determinants evaluated in the study. These conditions included congenital malformations; genetic or metabolic disorders; untreated endocrine diseases; heart, kidney, or liver failure; malabsorption syndromes; severe motor-development disorders; eating disorders; cystic fibrosis; bronchopulmonary dysplasia; renal tubular acidosis; post-transplant status; immunodeficiency; chronic diarrhea; or other chronic conditions directly affecting growth.
The participant selection process from the initial 142,727 ENSANUT 2018–2023 records to the final analytic sample of 8268 children is summarized in Figure 1. The flow diagram summarizes exclusions related to age, medical conditions affecting growth, inability to define the nutritional status outcome, and other applicable eligibility criteria.
Figure 1.
Participant-selection flow from the pooled ENSANUT 2018–2023 records to the final analytic sample. A total of 142,727 records were assessed for eligibility. After application of the prespecified inclusion and exclusion criteria, 8268 children younger than 72 months were included in the final analytic sample. A total of 134,459 records were excluded because one or more eligibility criteria were not met. Category-specific exclusion counts were not retained in the final harmonized analytic dataset. ENSANUT, Encuesta Nacional de Salud y Nutrición; WHO, World Health Organization.
2.3. Outcome Definition
The outcome was current nutritional status, represented as a four-class categorical variable defined using weight-for-height z-scores according to the 2006 WHO Child Growth Standards. Children were classified as having undernutrition when the weight-for-height z-score was below −2 standard deviations (SD); normal weight when the z-score ranged from −2 to +2 SD; overweight when the z-score was greater than +2 and up to +3 SD; and obesity when the z-score was greater than +3 SD.
No binary transformation of the outcome was performed because the objective was to preserve clinically distinct nutritional status categories across both ends of the nutritional spectrum rather than focus exclusively on excess weight.
Because nutritional status and predictor variables originated from the same cross-sectional ENSANUT assessment, the outcome represents nutritional status at the time of observation and not a future event or longitudinal growth outcome.
2.4. Predictor Variables
Predictor variables were selected based on previous evidence regarding factors associated with childhood nutritional status, biological plausibility, clinical relevance, and availability across the harmonized ENSANUT survey waves. Candidate predictors covered child demographic characteristics; parental age and anthropometric characteristics; parental educational level; household composition; socioeconomic characteristics; geographic context; perinatal and early-life characteristics; prenatal care; delivery mode; infant feeding; breastfeeding and formula-feeding variables; complementary feeding; dietary composition; sleep; mobility and physical-activity-related indicators; and family history of obesity. A complete description of the predictors, their coding, and corresponding domains is provided in Table S1.
Because the outcome was defined according to WHO weight-for-height standards, predictor selection required particular attention to variables mathematically related to the reference classification. Body mass index (BMI) and child anthropometric indices derived from weight, height, age, or sex—including BMI z-score, weight-for-age z-score, height-for-age z-score, and weight-for-height z-score—were excluded from the modeling matrix. These variables represent mathematical transformations of measurements involved in defining the nutritional status outcome and would therefore introduce additional deterministic dependence between predictors and the reference classification.
Current child weight and height were retained in the primary predictor configuration as directly observed anthropometric measurements. Their inclusion reflects the intended concurrent setting of the framework, in which anthropometric measurements are already available as part of routine nutritional assessment. Additionally, the purpose of the framework is not to replace WHO growth standards, but to characterize how the observed nutritional phenotype is accompanied by demographic, family, socioeconomic, perinatal, feeding, dietary, sleep, activity, and contextual characteristics.
Nevertheless, because current weight and height also directly contribute to the calculation of the WHO weight-for-height reference outcome, their inclusion creates an expected dependence between the predictor matrix and the classification target. Their contribution was therefore explicitly examined through a prespecified anthropometry-free ablation analysis and was not interpreted as independent predictive information.
Two calculated energy variables were also excluded. Estimated daily energy expenditure was derived from age- and sex-based equations, whereas calculated daily energy intake incorporated dietary observations together with age- and sex-related adjustments. Because these variables represented engineered summaries of information already available through their component predictors, they were excluded to reduce redundancy and improve interpretability.
Child age and sex were retained as routinely available demographic characteristics. Parental anthropometric measurements were also retained because they describe family-related characteristics and are not mathematical components of the child’s concurrent nutritional status classification. Feeding practices, dietary composition, perinatal characteristics, sleep, behavioral characteristics, socioeconomic factors, household characteristics, and geographic variables were retained when available in the harmonized datasets.
Administrative identifiers, the survey-wave indicator, variables generated exclusively for data management, and missingness or imputation indicators were excluded from the predictor matrix. After these exclusions, the primary modeling configuration comprised 78 predictors.
To quantify the extent to which classification performance depended on the raw anthropometric measurements used to define the reference outcome, a secondary anthropometry-free ablation configuration was prespecified. Current child weight and height were removed before any missing data preprocessing, producing a 76-predictor configuration. Consequently, weight and height could neither contribute directly to classification nor indirectly contribute to the imputation of other variables. BMI, child anthropometric z-scores, calculated energy variables, administrative variables, and imputation indicators remained excluded from both configurations.
The 78-predictor configuration was designated as the primary concurrent-classification configuration because it represents the setting in which current anthropometry data is available and individualized feature profiling is performed in the context of the observed nutritional phenotype. The 76-predictor configuration was treated as a secondary ablation comparator designed to quantify classification performance when the model had no access to current child weight or height. Both configurations were processed independently from the missing data stage onward and used the same participant partitions, model-development procedures, performance measures, and random seeds.
2.5. Missing Data Assessment and Imputation Strategy
Missing data were evaluated before model development to characterize their extent and structure and to guide selection of the imputation strategy. Overall predictor missingness was quantified, and Little’s test was used to assess compatibility with a missing completely at random (MCAR) mechanism. Variable-specific missingness indicators were additionally examined in relation to observed participant characteristics. These analyses were used to characterize the missing data structure rather than to establish a definitive missingness mechanism for every variable.
Candidate imputation strategies were compared exclusively within the internal training portion of ENSANUT 2018–2022 and before definitive model evaluation. Naturally occurring missing values were retained. For predictors containing natural missingness, 10% of values that were originally observed were additionally masked using a fixed random seed, thereby creating known reference values while retaining the naturally incomplete structure of the training data.
Five approaches were evaluated: simple median/mode imputation, scaled k-nearest-neighbor imputation, iterative chained-equation imputation, iterative random-forest-based imputation, and a denoising autoencoder.
Reconstruction performance was evaluated only at artificially masked positions for which the original value was known. For continuous variables, mean absolute error (MAE) and root mean squared error (RMSE) were calculated separately for each variable and normalized using the corresponding training-sample standard deviation before macro-averaging. This prevented predictors measured on larger numerical scales from disproportionately influencing the aggregate error. Categorical variables were evaluated using per-variable reconstruction accuracy.
Because reconstruction accuracy alone may not indicate preservation of information relevant to the final classification task, downstream classification performance was evaluated in parallel. Each candidate imputation strategy was assessed using five-fold stratified cross-validation within the internal training sample and the same class-balanced multinomial logistic-regression classifier. In every fold, the imputation procedure was fitted exclusively using the corresponding training observations and subsequently applied without refitting to the validation observations. Downstream balanced accuracy, macro-F1-score, one-vs.-rest macro-AUC, and macro-average precision were calculated.
Iterative chained-equation imputation provided the most favorable overall balance between reconstruction and downstream performance. It achieved a macro-normalized RMSE of 0.728 and macro-normalized MAE of 0.511, the highest categorical reconstruction accuracy (0.892), the highest downstream balanced accuracy (0.771), and a macro-F1-score of 0.587 with the lowest fold-to-fold variability among the evaluated strategies. It was therefore selected before definitive model training and evaluation.
The selected procedure generated one completed predictor matrix within each training partition rather than multiple independently imputed datasets subsequently combined using Rubin’s rules. It is therefore referred to throughout the manuscript as iterative chained-equation imputation (MICE-style) rather than classical multiple imputation.
In all subsequent analyses, imputation was incorporated within the model-development workflow rather than applied once to the pooled dataset. For every cross-validation fold, the imputer was fitted exclusively using the corresponding training observations and then applied to the validation observations. For the internal hold-out evaluation, the imputer was fitted using the internal training data only. For the later-wave evaluation, it was fitted exclusively using ENSANUT 2018–2022 and then applied to ENSANUT 2023. The outcome variable was never supplied to the imputation procedure.
The 76-predictor anthropometry-free analysis used a separate imputation workflow in which current child weight and height had already been removed before imputation.
2.6. Model Training and Evaluation
The model was developed using the predictor configurations defined in Section 2.4 and the missing data workflow described in Section 2.5. Nutritional status was treated as a supervised four-class classification problem comprising normal weight, undernutrition, overweight, and obesity.
A prespecified two-level evaluation strategy was used. ENSANUT 2018, 2021, and 2022 constituted the development sample (n = 7077), whereas ENSANUT 2023 was reserved from the outset as an independent later survey-wave evaluation sample (n = 1191). No ENSANUT 2023 observations were used for imputation method selection, hyperparameter selection, model fitting, probability calibration, or stacking meta-learner development.
Within the 2018–2022 development sample, an internal 80:20 stratified split was generated using random seed 42. The 80% subset (n = 5661) was used for imputation method selection, hyperparameter selection, base-model development, and stacking, whereas the remaining 20% (n = 1416) constituted an independent internal hold-out sample. All preprocessing operations, including missing data imputation and predictor standardization when required, were estimated exclusively from the relevant training observations and subsequently applied without refitting to validation or evaluation observations.
Because the outcome distribution was markedly imbalanced, class weighting was incorporated into algorithms supporting weighted learning. Multinomial logistic regression and LinearSVC used balanced class weights, random forest used balanced subsample weighting, and balanced observation weights were supplied during XGBoost fitting. Oversampling and synthetic minority-generation procedures were not used, thereby preserving the observed class distribution in all evaluation samples.
Four supervised classifiers were evaluated. Multinomial logistic regression (MLR), calibrated linear support vector machine (LinearSVC), and random forest (RF) constituted the three base learners of the stacked ensemble. Extreme Gradient Boosting (XGBoost) was included as a contemporary standalone comparator for tabular data. XGBoost was not incorporated into the neural stacking architecture, allowing the original three-model ensemble to be compared with a modern gradient-boosting algorithm and with a simpler probability-averaging strategy.
For multinomial logistic regression, predictors were standardized using StandardScaler, with scaling parameters estimated exclusively from the corresponding training partition. Logistic regression used L2 regularization, the lbfgs solver, balanced class weights, a maximum of 5000 iterations, and random seed 42. Candidate inverse regularization strengths were C = 0.5, 1.0, and 3.0.
The support vector machine was implemented using LinearSVC with L2 regularization, squared-hinge loss, balanced class weights, a maximum of 5000 iterations, and random seed 42. Candidate inverse regularization strengths were C = 0.1, 0.5, and 1.0. Because LinearSVC does not directly produce class probabilities, sigmoid probability calibration was performed using CalibratedClassifierCV with three-fold internal cross-validation. Standardization and LinearSVC were incorporated within a single pipeline supplied to the calibration procedure, ensuring that both scaling and classifier fitting occurred within the corresponding calibration–training partitions. Neither the internal hold-out observations nor ENSANUT 2023 observations were used to fit the classifier or probability calibrator.
Random forest models were evaluated across combinations of 200 or 400 trees; maximum tree depths of 5, 12, or unrestricted depth; and minimum terminal-leaf sizes of 1 or 2 observations. Balanced subsample class weighting and random seed 42 were used. Predictor standardization was not applied to tree-based models.
XGBoost models were evaluated using 400 boosting iterations, maximum tree depths of 3 or 5, and learning rates of 0.03 or 0.05. The subsampling and column-sampling proportions were both 0.80, minimum child weight was 1, and L2 regularization was 1.0. Balanced observation weights were calculated using the class distribution of the corresponding training partition.
Hyperparameter selection was performed exclusively within the internal training sample using repeated stratified five-fold cross-validation with three repetitions, yielding 15 validation partitions for each candidate configuration. Imputation was independently fitted within every training fold and subsequently applied to the corresponding validation fold. Candidate configurations were ranked primarily according to mean macro-F1-score, with macro-average precision and macro-AUC used as secondary criteria.
The repeated cross-validation procedure used C = 3.0 for MLR, C = 0.1 for calibrated LinearSVC, 400 trees with maximum depth 5 and minimum leaf size 2 for RF, and 400 boosting iterations with maximum depth 5 and learning rate 0.05 for XGBoost. These specifications were frozen before evaluation in either independent evaluation sample.
A simple soft voting ensemble was included to determine whether probability averaging alone could account for any benefit observed with stacking. For each observation, the four-class probability vectors generated using MLR, calibrated LinearSVC, and RF were averaged using equal weights. XGBoost was not included in soft voting so that comparison with the neural meta-learner retained the same three component learners.
The stacked ensemble used the same three base classifiers. To prevent the neural network meta-learner from being trained on in-sample base-model predictions, out-of-fold class probabilities were generated using repeated stratified five-fold cross-validation with three repetitions. Within each repetition, every observation received predictions from models that had not been fitted using that observation. The three out-of-fold probability vectors obtained for each participant across repetitions were averaged before creation of the meta-learning dataset. Each base learner generated probabilities for four nutritional status classes. Concatenating the probability vectors from MLR, calibrated LinearSVC, and RF therefore generated 12 meta-features for each participant.
The meta-learner was a feedforward neural network with three hidden layers containing 64, 32, and 16 neurons, each using rectified linear unit activation. The output layer comprised four neurons with softmax activation. For training, the Adam optimizer with a learning rate of 0.001 and sparse categorical cross-entropy loss was used. Balanced class weights were applied and twenty percent of the out-of-fold meta-training observations were used as an internal validation subset for early stopping. Training was allowed for a maximum of 60 epochs using a batch size of 32, with patience of seven epochs; weights corresponding to the lowest validation loss were restored.
For internal hold-out evaluation, the selected imputation procedure and frozen base classifiers were refitted using the complete internal training subset and then applied to the untouched 20% hold-out sample. The three base-model probability vectors were concatenated to produce the 12 meta-features supplied to the previously trained neural meta-learner.
A second evaluation was used to assess transportability across survey waves. After all methodological decisions and hyperparameters had been frozen, the entire modeling workflow was repeated using all ENSANUT 2018–2022 observations as the development sample. Fold-specific imputation and repeated out-of-fold predictions were regenerated using only earlier waves, and a new stacking meta-training dataset was constructed. The base classifiers were then refitted using all 2018–2022 observations and applied to ENSANUT 2023. Thus, ENSANUT 2023 remained independent of preprocessing, model selection, parameter estimation, and ensemble development.
Because ENSANUT comprises different cross-sectional participants in each wave, this second evaluation was interpreted as later-wave transportability, not longitudinal prediction and external clinical validation.
The primary 78-predictor configuration and the secondary 76-predictor anthropometry-free configuration used identical participant partitions, frozen hyperparameters, model architectures, random seeds, and performance measures but independent preprocessing pipelines.
Model performance was assessed using overall accuracy, balanced accuracy, macro-precision, macro-recall, macro-F1-score, one-vs.-rest macro-area under the receiver operating characteristic curve (macro-AUC), and macro-average precision. Per-class precision, recall, F1-score, one-vs.-rest AUC, and average precision were additionally calculated for normal weight, undernutrition, overweight, and obesity. Confusion matrices, class-specific precision–recall curves, and ROC curves were generated for the independent evaluation samples.
Because normal-weight children constituted the majority of the analytic sample, overall accuracy was not treated as sufficient evidence of classification performance. Balanced accuracy, macro-F1, class-specific precision and recall, and average precision were emphasized when interpreting performance in less frequent nutritional status categories.
Uncertainty was quantified separately in the internal hold-out and ENSANUT 2023 samples using non-parametric participant-level bootstrap resampling. One thousand bootstrap samples were produced with replacement from observed outcomes and their corresponding fixed model predictions. Performance measures were recalculated in each valid resample, and percentile-based 95% confidence intervals were defined by the 2.5th and 97.5th percentiles. Models were not retrained during bootstrap resampling; these intervals therefore quantify evaluation-sample uncertainty conditional on the fitted models.
Probability calibration was assessed separately for each nutritional status category using a one-vs.-rest approach in both evaluation samples. Calibration curves were used to compare mean predicted probabilities with observed class frequencies across ten equal-frequency probability groups. Calibration-in-the-large was estimated using an intercept with the coefficient of the logit-transformed predicted probability fixed at 1, whereas calibration slopes were estimated through logistic recalibration of the class indicator against the logit-transformed predicted probability. Ideal calibration corresponds to an intercept of 0 and slope of 1. Ninety-five percent confidence intervals were obtained from 1000 participant-level bootstrap resamples. No post hoc recalibration was performed using either evaluation sample.
2.7. Statistical Analysis
Descriptive analyses were performed using the original, non-imputed ENSANUT values as recorded in the harmonized dataset. No missing data imputation was applied to the descriptive analyses or to the corresponding between-group comparisons. For each variable, summaries and statistical comparisons were based on participants with an observed value for that variable.
Participant characteristics were summarized separately across the four nutritional status categories. Continuous variables were described using medians and minimum–maximum ranges and compared using the Kruskal–Wallis test. Categorical variables were summarized using frequencies and percentages and compared using a single global Pearson chi-square test for each variable. When sparse contingency-table cells made the asymptotic chi-square approximation inappropriate, a Monte Carlo-based global test was used. For categorical variables with missing observations, values were reported as n/N available (%), with the number of participants with available data used as the denominator. Reported p-values represent overall comparisons across the four nutritional status groups and were not calculated separately for individual levels of multi-category variables.
These descriptive analyses were distinct from the machine learning workflow. Missing predictor values used for model development and evaluation were handled separately using the training-partition-specific imputation procedure described in Section 2.5.
The harmonized modeling dataset did not contain the complete set of survey-design variables required to reproduce the multistage ENSANUT sampling design consistently across all pooled survey waves. Consequently, descriptive statistics and hypothesis tests were unweighted and refer exclusively to the analytic sample; they should not be interpreted as nationally representative estimates.
The statistical procedures used to summarize model performance are described in detail in Section 2.6. Briefly, multiclass and class-specific AUCs were calculated using a one-vs.-rest framework, and average precision was calculated for each nutritional status category and at the macro level. Ninety-five percent confidence intervals for model-performance estimates were obtained using 1000 non-parametric participant-level bootstrap resamples of the observed outcomes and corresponding fixed model predictions. Models were not retrained during bootstrap resampling. No formal pairwise hypothesis tests were performed to establish statistical superiority among modeling strategies. Bolding in the performance tables was used only to identify numerically favorable or otherwise relevant values, as specified in the corresponding table footnotes, and should not be interpreted as evidence of statistical significance or superiority.
2.8. Explainability Analysis
Model interpretability was evaluated using SHapley Additive exPlanations (SHAP) and Local Interpretable Model-agnostic Explanations (LIME). The explainability framework targeted the complete stacked neural network ensemble, rather than an individual base classifier.
The final ensemble fitted using ENSANUT 2018–2022 was used for explainability analyses, and explanations were generated exclusively for observations from the independent ENSANUT 2023 survey wave. The explainability procedures operated on the completed 78-predictor matrix produced by the imputation strategy fitted exclusively using ENSANUT 2018–2022. Consequently, feature attribution began at the completed predictor space; the imputation algorithm itself was not included within the attribution model.
A model-agnostic wrapper was constructed around the complete stacked classifier. For each input observation, the wrapper generated four-class probability vectors from MLR, calibrated LinearSVC, and RF; concatenated these vectors into the 12 meta-features required by the neural network meta-learner; and returned the final four-class probability distribution. SHAP and LIME therefore explained the output of the full stacked ensemble.
Global feature contributions were evaluated using model-agnostic permutation-based SHAP. A random sample of up to 100 completed observations from ENSANUT 2018–2022 was used as the background distribution. Up to 200 observations from ENSANUT 2023 were selected using class-stratified sampling, with approximately equal class representation whenever the available sample size permitted.
SHAP values were calculated separately for each nutritional status category. For each predictor and class, global importance was summarized using the mean absolute SHAP value across the explained ENSANUT 2023 observations. Relative SHAP importance was calculated by dividing the mean absolute SHAP value for each predictor by the sum of mean absolute SHAP values across all 78 predictors for that class and multiplying by 100. Relative importance therefore represents the percentage of total mean absolute SHAP magnitude attributable to each predictor within the corresponding nutritional status category. Exact numerical ties in relative SHAP importance were assigned the same rank and were not interpreted as meaningful differences. Because relative importance was obtained using post hoc normalization of mean absolute SHAP magnitudes, this percentage preserves the proportional distribution and ranking of global absolute attribution but not the signed local additivity property of the original SHAP values.
Because current child weight and height were expected to account for a substantial proportion of full-model attribution, a secondary contextual-feature summary was generated by excluding weight and height from the normalization denominator and renormalizing the remaining contributions to 100%. This summary was used only to characterize the relative distribution of contextual contributions and was not interpreted as SHAP importance from a separately fitted model.
LIME was used to characterize individual-level explanations generated by the same stacked ensemble. Ten ENSANUT 2023 children were randomly selected from each observed nutritional status category, producing 40 cases. For each child, LIME was used to explain the probability assigned to the class predicted by the stacked ensemble. Completed ENSANUT 2018–2022 observations served as the reference distribution for perturbation generation.
For each selected child, 20 explanations were produced using different prespecified random seeds. Each repetition generated 5000 perturbed observations, and the 15 predictor terms with the largest absolute local contributions were retained. Local-surrogate fidelity was recorded for every repetition.
Stability was quantified using the 10 most influential predictors from each repeated explanation. Pairwise Jaccard similarity was calculated across the 20 top-10 feature sets for each child. Predictor inclusion frequency was defined as the proportion of repetitions in which a predictor appeared among the top 10, and directional stability was evaluated using sign concordance, defined as the proportion of repetitions in which an included predictor retained the same direction of contribution.
SHAP and LIME were interpreted as complementary descriptions of model behavior. SHAP was used to summarize class-specific global attribution patterns, whereas LIME was used to characterize individual explanations and their reproducibility. Neither method was interpreted as identifying causal effects, etiological determinants, effective interventions, or independent clinical risk factors. The explanations characterize how the fitted ensemble used available information and are intended to complement, rather than replace, WHO growth standards assessment or clinical judgment.
2.9. Software, Code, and Reproducibility
All final analyses were conducted in Python 3.13.15 using Jupyter notebooks executed in the Google Colab computational environment. Data management and numerical processing were performed primarily using NumPy 2.1.3 and pandas 2.2.3. Machine learning preprocessing, iterative imputation, stratified data splitting, cross-validation, predictor standardization, probability calibration, model evaluation, confusion matrices, and bootstrap procedures were implemented primarily using scikit-learn 1.6.1. XGBoost 3.4.1 was used for gradient boosting. The stacked neural network meta-learner was implemented using TensorFlow 2.20.0 and Keras. Global model interpretation used SHAP 0.52.0, whereas local explanations were generated using the LIME package. Statistical support functions were implemented where required using statsmodels 0.15.0.
The analytical workflow preserved separation between development and evaluation data. ENSANUT 2023 was reserved from the outset as an independent later-wave evaluation sample, while imputation method selection, hyperparameter selection, and model development were restricted to ENSANUT 2018–2022. The internal hold-out sample was similarly excluded from preprocessing estimation and model selection.
Imputation was incorporated into the resampling workflow rather than being performed once on the complete dataset. Predictor standardization was likewise estimated only from appropriate training data. For calibrated LinearSVC, standardization and classification were contained within the pipeline supplied to the calibration procedure.
Hyperparameter selection used repeated stratified five-fold cross-validation with three repetitions. Out-of-fold stacking inputs were likewise generated using repeated five-fold cross-validation, ensuring that the neural meta-learner was trained only on base-model predictions produced for observations excluded from the corresponding base-model fit.
A fixed random seed of 42 was used whenever it was supported by the corresponding procedure. Procedures requiring repeated stochastic realizations used prespecified seed sequences to permit reproducibility without using an identical random state for every repetition.
Computationally intensive procedures were implemented using checkpointed and resumable workflows. Fold-specific imputed datasets, hyperparameter search results, out-of-fold predictions, model artifacts, bootstrap summaries, calibration outputs, SHAP results, and repeated LIME were saved following each relevant analytical unit.
A final automated audit confirmed that the outcome was never supplied to the imputer, ENSANUT 2023 was not used to select the imputation strategy or hyperparameters, imputation was nested within out-of-fold training partitions, the primary configuration contained 78 predictors including current weight and height but no derived child anthropometric indices, and the anthropometry-free configuration contained 76 predictors without current weight or height.
The original ENSANUT datasets are publicly accessible through their corresponding official repositories. Analysis notebooks, predictor definitions, model specifications, software version information, numerical outputs, and supplementary reproducibility materials were organized for release with the manuscript, subject to journal file size limitations and any restrictions associated with the redistribution of source survey data.
2.10. Institutional Review Board Statement
This study was conducted in accordance with the Declaration of Helsinki. The analyses reported in this manuscript used exclusively secondary, de-identified, publicly available ENSANUT survey data. No direct contact with participants occurred, no new biological samples or clinical information were collected, and the authors did not have access to identifiable personal information. Consequently, no additional institutional review board approval was required for the present secondary analysis. The original ENSANUT surveys were conducted under their corresponding ethical and institutional approvals.
The present proof-of-concept study forms part of a broader institutional research and technological development protocol that includes a subsequent phase using retrospective electronic health records from pediatric patients treated at the Instituto Nacional de Pediatría. The future phase will use repeated longitudinal clinical measurements to investigate the prediction of nutritional status trajectories. The institutional protocol was reviewed and approved by the Research Committee and Research Ethics Committee of the Instituto Nacional de Pediatría under approval number 2025/012, dated 27 March 2025.
2.11. Informed Consent Statement
Informed consent was not required for the analyses reported in the present manuscript because only secondary, de-identified, publicly available ENSANUT survey datasets were used. The authors had no direct contact with participants and no access to identifiable personal information, individual clinical records, images, videos, or biological samples.
For the subsequent institutional phase involving retrospective pediatric electronic health records, informed consent requirements will be addressed in accordance with the protocol approved by the Research Committee and Research Ethics Committee of the Instituto Nacional de Pediatría under approval number 2025/012.
2.12. Use of Generative Artificial Intelligence
During manuscript preparation and revision, ChatGPT (OpenAI; GPT-5.6 Sol; ChatGPT web interface; accessed September 2026) was used to assist with English-language editing, manuscript organization, refinement of scientific wording, and computational troubleshooting. The tool was also used to assist in reviewing and refining analytical code; however, all code was executed independently by the authors, and all analytical outputs were obtained directly from the authors’ computational environment.
Generative artificial intelligence was not used to generate or fabricate study data, determine the study results, independently perform the statistical analyses, or make autonomous scientific or clinical judgments. All AI-assisted suggestions, including text and code, were critically reviewed, modified when necessary, and verified by the authors against the original data, analytical outputs, scientific literature, and study methods. The authors take full responsibility for the accuracy, integrity, interpretation, and final content of the manuscript.
3. Results
3.1. Missing Data Assessment and Imputation Performance
The analytic predictor dataset had an overall missingness of 22.36%. Little’s MCAR test was statistically significant (p < 0.001), indicating that the overall missing data pattern was not compatible with a missing completely at random mechanism. Missing values were therefore not assumed to occur completely at random in subsequent analyses.
Five candidate imputation approaches were compared within the internal training data using controlled reconstruction and downstream classification performance. The reconstruction analysis included 16 continuous and 16 categorical predictors with naturally occurring missing values. Reconstruction metrics were calculated only for artificially masked observations whose original values were known. Continuous-variable errors were normalized within each variable before macro-averaging to prevent predictors measured on larger numerical scales from disproportionately influencing the comparison.
The iterative random-forest-based approach achieved the lowest reconstruction errors, with a macro-NRMSE of 0.667 and macro-NMAE of 0.432. Iterative chained-equation imputation (MICE-style) ranked second for both measures (macro-NRMSE, 0.728; macro-NMAE, 0.511) and achieved the highest categorical reconstruction accuracy (0.892), closely followed by the random-forest-based approach (0.890). The autoencoder, k-nearest-neighbor, and simple-imputation approaches showed higher normalized reconstruction errors (Table 1).
Table 1.
Comparative performance of evaluated imputation strategies.
Downstream classification showed that lower reconstruction error did not necessarily correspond to better preservation of information relevant to nutritional status classification. MICE-style imputation achieved the highest mean balanced accuracy (0.771) and a macro-F1-score of 0.587 ± 0.015, with the lowest fold-to-fold variability among the five approaches. The autoencoder achieved the numerically highest macro-F1-score (0.589 ± 0.017), but its reconstruction performance was poorer than that of MICE-style imputation. K-nearest-neighbor imputation achieved the highest macro-AUC (0.955) and macro-average precision (0.679), whereas the random-forest-based approach, despite having the lowest reconstruction error, produced the lowest downstream macro-F1-score (0.578) and balanced accuracy (0.754).
Considering reconstruction error, categorical reconstruction accuracy, downstream classification performance, and cross-validation stability jointly, iterative chained-equation imputation provided the most balanced overall performance and was selected before definitive model training and evaluation. All subsequent imputations were fitted exclusively within the corresponding training partitions, as described in Section 2.5.
3.2. Participant Characteristics
The final analytic sample comprised 8268 infants and preschool children younger than 72 months. Nutritional status was classified according to WHO weight-for-height z-scores as normal weight in 7592 children (91.82%), undernutrition in 120 (1.45%), overweight in 378 (4.57%), and obesity in 178 (2.15%). These proportions are unweighted and describe the analytic sample only; they should not be interpreted as nationally representative prevalence estimates.
Participant characteristics according to nutritional status category are shown in Table 2. Age differed across the four groups (p < 0.001), with median ages of 38 months in children with normal weight, 30.5 months in those with undernutrition, 44.5 months in those with overweight, and 50 months in those with obesity. As expected, current weight, height, weight-for-age z-score, and weight-for-height z-score also differed across nutritional status categories (all p < 0.001). The comparison for weight-for-height z-score is descriptive because this measurement was used to define the outcome categories.
Table 2.
Unweighted characteristics of the analytic sample according to nutritional-status category.
Maternal age did not differ statistically across nutritional status groups (p = 0.060), whereas maternal weight (p < 0.001), paternal age (p = 0.001), and paternal weight (p < 0.001) differed across groups. Median maternal and paternal weights were generally higher among children classified as overweight or obese than among those with normal weight or undernutrition.
Global categorical comparisons showed a difference in sex distribution across nutritional status categories (p = 0.043). Boys represented 50.71% of children with normal weight, 58.33% of those with undernutrition, 48.68% of those with overweight, and 58.99% of those with obesity. The overall distribution of parental educational level did not differ statistically across groups when all eight recorded categories were considered simultaneously using the Monte Carlo global test (p = 0.062).
Among participants with available parental-obesity information, maternal obesity differed across nutritional status groups (p < 0.001), as did paternal obesity (p = 0.013). Feeding type also differed globally across groups (Monte Carlo p = 0.001). Mixed feeding represented the most frequent recorded feeding category in all groups, whereas exclusive formula feeding was uncommon. Because parental-obesity and feeding variables contained missing observations, percentages for these variables were calculated using the number of participants with available data as the denominator.
3.3. Internal Hold-Out Model Performance
All six modeling strategies were evaluated in the independent internal hold-out sample comprising 1416 participants from the ENSANUT 2018–2022 development data. Performance differed substantially according to whether overall accuracy or class-balanced metrics were considered (Table 3). No single model achieved the most favorable value across all performance measures.
Table 3.
Performance of the models in the independent internal hold-out set.
XGBoost achieved the highest overall accuracy (0.9555), macro-precision (0.7907), macro-F1-score (0.7357), and macro-average precision (0.7568); its balanced accuracy was 0.6965 and macro-AUC was 0.9623. The soft voting ensemble also showed high overall accuracy (0.9414), with balanced accuracy of 0.6636 and macro-F1-score of 0.6618.
The stacked neural network ensemble showed a different performance profile. Although its overall accuracy was lower (0.8757), it achieved the highest balanced accuracy and macro-recall among all evaluated models (both 0.8228), reflecting greater sensitivity across the four nutritional status categories. Its macro-F1-score was 0.6109, macro-AUC was 0.9606, and macro-average precision was 0.6192. The lower macro-precision (0.5392) indicated that the gain in minority-class sensitivity was accompanied by a greater number of false-positive classifications.
Among the individual base learners, multinomial logistic regression provided a comparatively balanced hard classification performance, with an accuracy of 0.9004, balanced accuracy of 0.7812, and macro-F1-score of 0.6351. The calibrated LinearSVC achieved high overall accuracy (0.9329) and the highest macro-AUC (0.9641), but substantially lower balanced accuracy (0.4148) and macro-F1-score (0.4358). Random forest showed lower discrimination and a class-balanced performance, with an accuracy of 0.7867, balanced accuracy of 0.5722, macro-F1-score of 0.4312, and macro-AUC of 0.8484.
Bootstrap confidence intervals were generally wider for class-balanced performance measures than for overall accuracy, particularly for models with limited sensitivity to minority classes (Table 3).
Class-specific performance further illustrated the different trade-offs between XGBoost and the stacked ensemble (Table 4). XGBoost produced comparatively balanced precision and recall, with class-specific F1-scores ranging from 0.629 for undernutrition to 0.982 for normal weight. However, undernutrition recall was 0.524, indicating that approximately half of the undernourished children in the hold-out sample were not identified.
Table 4.
Class-specific performance of XGBoost and the stacked neural-network ensemble in the internal hold-out sample.
The stacked ensemble prioritized sensitivity across minority classes. Recall was 0.886 for normal weight, 0.857 for undernutrition, 0.677 for overweight, and 0.871 for obesity. This higher minority-class sensitivity was accompanied by substantially lower precision for undernutrition (0.198) and overweight (0.367). In particular, the ensemble correctly identified 18 of the 21 children with undernutrition but also classified 73 normal-weight children as undernourished. For obesity, the ensemble correctly classified 27 of 31 cases, yielding a recall of 0.871 and precision of 0.600.
Thus, XGBoost provided the highest overall macro-F1 and macro-average precision, whereas the stacked neural network ensemble provided the highest average recall across the four nutritional status categories. This distinction was especially relevant in this highly imbalanced setting, where improved sensitivity to rare categories resulted in reduced positive predictive precision.
Confusion matrices, one-vs.-rest precision–recall curves, and one-vs.-rest receiver operating characteristic curves for all six modelling strategies are shown in Figure 2, Figure 3 and Figure 4, respectively.
Figure 2.
Confusion matrices for the six 78-predictor modelling strategies in the independent internal hold-out sample. Panels show multinomial logistic regression (A), calibrated LinearSVC (B), random forest (C), XGBoost (D), soft voting (E), and the stacked neural-network ensemble (F). Rows represent reference nutritional-status categories and columns represent predicted categories. Cell values indicate the number of participants in each reference–prediction combination, whereas color intensity represents the proportion within each reference category. The internal hold-out sample comprised 1416 participants.
Figure 3.
One-vs.-rest precision–recall curves for the six 78-predictor modelling strategies in the independent internal hold-out sample. Panels show multinomial logistic regression (A), calibrated LinearSVC (B), random forest (C), XGBoost (D), soft voting (E), and the stacked neural-network ensemble (F). Each panel displays precision–recall curves for the four nutritional-status categories considered separately under a one-vs.-rest framework: normal weight, undernutrition, overweight, and obesity. The average precision (AP) for each class is reported in the corresponding legend. The internal hold-out sample comprised 1416 participants.
Figure 4.
One-vs.-rest receiver operating characteristic curves for the six 78-predictor modelling strategies in the independent internal hold-out sample. Panels show multinomial logistic regression (A), calibrated LinearSVC (B), random forest (C), XGBoost (D), soft voting (E), and the stacked neural-network ensemble (F). Each panel presents receiver operating characteristic curves for normal weight, undernutrition, overweight, and obesity under a one-vs.-rest framework. Class-specific areas under the curve (AUCs) are reported in the corresponding legends. The diagonal reference line represents performance expected by chance. The internal hold-out sample comprised 1416 participants.
3.4. Repeated Cross-Validation and Hyperparameter Selection
Hyperparameters were selected within the internal training sample using repeated stratified five-fold cross-validation with three repetitions, yielding 15 validation folds for each candidate configuration. Missing data imputation and all required preprocessing procedures were re-estimated independently within each training fold. Candidate configurations were ranked primarily according to mean macro-F1-score, with macro-average precision and macro-AUC used as secondary criteria.
For multinomial logistic regression, increasing the inverse regularization parameter from C = 0.5 to C = 3.0 progressively improved class-balanced performance. The selected configuration, C = 3.0, achieved a mean macro-F1-score of 0.6199 ± 0.0286, balanced accuracy of 0.7774 ± 0.0397, macro-AUC of 0.9599 ± 0.0114, and macro-average precision of 0.6941 ± 0.0492.
For calibrated LinearSVC, C = 0.1 was selected according to the prespecified macro-F1 criterion. This configuration achieved a mean macro-F1-score of 0.4159 ± 0.0271, balanced accuracy of 0.3836 ± 0.0270, macro-AUC of 0.9668 ± 0.0079, and macro-average precision of 0.6891 ± 0.0306. Although larger C values produced slightly higher macro-AUC and macro-average precision, they resulted in lower macro-F1 and balanced accuracy and were therefore not selected.
The selected random forest configuration used 400 trees, a maximum depth of 5, and a minimum leaf size of 2. It achieved a mean macro-F1-score of 0.4332 ± 0.0197, balanced accuracy of 0.5372 ± 0.0358, macro-AUC of 0.8332 ± 0.0220, and macro-average precision of 0.4435 ± 0.0356. Deeper or unrestricted forests increased macro-AUC but reduced macro-F1 and balanced accuracy, indicating poorer hard classification performance across the four nutritional status categories.
For XGBoost, the selected configuration used 400 boosting iterations, a maximum depth of 5, and learning rate of 0.05. It achieved the highest mean macro-F1-score among the tuned classifiers, at 0.6781 ± 0.0499, together with balanced accuracy of 0.6271 ± 0.0525, macro-AUC of 0.9651 ± 0.0121, and macro-average precision of 0.7355 ± 0.0441.
Importantly, expanding hyperparameter evaluation from the initial five-fold procedure to repeated five-fold cross-validation with three repetitions did not change the selected configuration for any classifier. The same hyperparameters were selected for multinomial logistic regression, calibrated LinearSVC, random forest, and XGBoost, supporting the stability of the model selection procedure before evaluation in the independent internal hold-out and ENSANUT 2023 samples. The selected hyperparameter configurations and their repeated cross-validation performance are summarized in Table 5.
Table 5.
Repeated stratified five-fold cross-validation performance of the selected model configurations.
3.5. Later-Wave Transportability and Bootstrap Uncertainty
The complete modeling workflow was subsequently refitted using all ENSANUT 2018–2022 observations and evaluated exclusively using the independent ENSANUT 2023 survey wave (n = 1191). No 2023 observations were used for imputation method selection, hyperparameter selection, preprocessing estimation, probability calibration, base-model fitting, or development of the stacking meta-learner development. Because ENSANUT consists of repeated cross-sectional surveys involving different participants at each wave, this analysis was interpreted as an assessment of later-wave transportability rather than longitudinal prediction or external clinical validation.
Performance patterns in ENSANUT 2023 were broadly consistent with those observed in the internal hold-out sample, although differences between models remained evident (Table 6). XGBoost achieved the highest overall accuracy (0.9463), macro-precision (0.6902), macro-F1-score (0.6803), and macro-average precision (0.7624); its balanced accuracy was 0.6718 and macro-AUC was 0.9725.
Table 6.
Performance of the models in the independent ENSANUT 2023 survey wave.
Multinomial logistic regression and the stacked neural network ensemble showed the highest class-balanced recall in the later survey wave. MLR achieved a balanced accuracy of 0.7775, macro-F1-score of 0.5984, macro-AUC of 0.9627, and macro-average precision of 0.6624. The stacked ensemble achieved a closely similar balanced accuracy of 0.7753, with macro-F1-score of 0.5831, macro-AUC of 0.9767, and macro-average precision of 0.6690. The stacked ensemble therefore preserved comparatively high sensitivity across nutritional status categories, although this remained accompanied by lower macro-precision (0.5391).
The calibrated LinearSVC retained high overall accuracy (0.9328) and macro-AUC (0.9740), but its balanced accuracy was only 0.3615 and macro-F1-score was 0.3839. Random forest showed the lowest overall accuracy (0.7330), macro-F1-score (0.4081), and macro-AUC (0.8112). Soft voting achieved an intermediate performance, with accuracy of 0.9362, balanced accuracy of 0.6166, macro-F1-score of 0.6289, and macro-AUC of 0.9729.
Comparison with the internal hold-out results showed that the principal model-performance patterns were preserved across survey waves. For XGBoost, macro-F1 decreased from 0.7357 in the internal hold-out sample to 0.6803 in ENSANUT 2023, while balanced accuracy decreased from 0.6965 to 0.6718. For the stacked ensemble, balanced accuracy decreased from 0.8228 to 0.7753 and macro-F1 from 0.6109 to 0.5831, whereas macro-AUC increased from 0.9606 to 0.9767 and macro-average precision increased from 0.6192 to 0.6690. MLR showed the smallest change in balanced accuracy, from 0.7812 to 0.7775.
Class-specific performance further demonstrated the trade-off between sensitivity and precision in the rare nutritional status categories. In ENSANUT 2023, the stacked ensemble achieved recalls of 0.893 for normal weight, 0.867 for undernutrition, 0.796 for overweight, and 0.545 for obesity; precision was 0.995, 0.194, 0.368, and 0.600, respectively. Thus, 13 of the 15 children with undernutrition were identified, although the low prevalence of undernutrition resulted in substantial false-positive classification and correspondingly low precision. XGBoost showed a different balance, with recalls of 0.977, 0.400, 0.537, and 0.773 for normal weight, undernutrition, overweight, and obesity, respectively, and higher precision for the three minority categories.
Participant-level bootstrap resampling showed wider uncertainty for balanced and macro-averaged performance measures than for overall accuracy, reflecting the small number of participants in the minority classes. For the stacked ensemble, balanced accuracy was 0.775 (95% CI, 0.699–0.844), macro-F1 was 0.583 (95% CI, 0.511–0.638), macro-AUC was 0.977 (95% CI, 0.969–0.982), and macro-average precision was 0.669 (95% CI, 0.597–0.739). For XGBoost, macro-F1 was 0.680 (95% CI, 0.598–0.746) and macro-average precision was 0.762 (95% CI, 0.684–0.830). These intervals indicate that performance estimates for the minority categories remain imprecise despite generally preserved discrimination in the later survey wave (Table 6).
3.6. Probability Calibration
Probability calibration differed substantially across modeling strategies and did not necessarily parallel discrimination performance. Calibration was evaluated separately for each nutritional status category using a one-vs.-rest approach in both the internal hold-out sample and the independent ENSANUT 2023 survey wave.
In the internal hold-out sample, XGBoost showed calibration slopes closest to the ideal value of 1 across all four classes. Slopes were 0.932 for normal weight, 0.838 for undernutrition, 0.903 for overweight, and 0.925 for obesity. Calibration-in-the-large (CITL) intercepts were 0.657, −0.472, −0.659, and 0.053, respectively. Thus, although some systematic differences between mean predicted and observed class frequencies remained, the dispersion of XGBoost probabilities was comparatively close to the ideal calibration slope.
The calibrated LinearSVC showed CITL intercepts close to zero in the internal hold-out sample, ranging from −0.118 to 0.282. However, its calibration slopes were consistently greater than 1, ranging from 1.47 to 2.48. This pattern indicates that the predicted probabilities were insufficiently dispersed despite mean predicted probabilities being comparatively close to the observed class frequencies.
Calibration of the stacked neural network ensemble showed a different pattern. In the internal hold-out sample, the observed versus mean predicted frequencies were 0.917 versus 0.767 for normal weight, 0.015 versus 0.098 for undernutrition, 0.046 versus 0.091 for overweight, and 0.022 versus 0.044 for obesity. Corresponding CITL intercepts were 3.459 (95% CI, 3.179–3.741), −3.562 (95% CI, −4.104 to −3.079), −1.291 (95% CI, −1.637 to −0.970), and −1.676 (95% CI, −2.196 to −1.227), respectively. These values indicate a systematic underestimation of the normal-weight class probability and overestimation of the three minority-class probabilities. Calibration slopes for undernutrition, overweight, and obesity were 0.872, 0.837, and 1.208, respectively. The normal-weight calibration slope was numerically unstable because of near-separation in the predicted probabilities and was therefore not considered clinically interpretable.
Similar patterns were observed in the independent ENSANUT 2023 survey wave. XGBoost again produced slopes relatively close to 1, with values of 1.126 for normal weight, 0.945 for undernutrition, 1.197 for overweight, and 0.927 for obesity. Its CITL intercepts were 0.663, −0.786, −0.555, and −0.203, respectively. The calibrated LinearSVC continued to show small CITL intercepts (−0.130 to 0.187) but slopes greater than 1, ranging from 1.30 to 3.07.
For the stacked ensemble in ENSANUT 2023, observed versus mean predicted frequencies were 0.924 versus 0.757 for normal weight, 0.013 versus 0.076 for undernutrition, 0.045 versus 0.131 for overweight, and 0.018 versus 0.035 for obesity. CITL intercepts were 3.522 (95% CI, 3.215–3.836), −3.469 (95% CI, −4.146 to −2.925), −1.938 (95% CI, −2.341 to −1.601), and −1.106 (95% CI, −1.688 to −0.661), respectively. Calibration slopes were 1.022 for overweight and 1.236 for obesity, whereas slope estimates for normal weight and undernutrition were numerically unstable because of near-separation and extreme probability patterns.
Overall, these findings indicate that discrimination and probability calibration captured distinct properties of model performance. In particular, the stacked neural-network ensemble maintained strong class-balanced discrimination but its raw probability outputs showed substantial calibration-in-the-large deviations and should therefore not be interpreted as calibrated estimates of absolute class probability. XGBoost showed more consistent calibration slopes across classes, although its CITL estimates also demonstrated residual systematic miscalibration. No post-hoc recalibration was performed in either evaluation sample.
Class-specific calibration curves for the six models in the internal hold-out sample are shown in Figure 5. Corresponding calibration curves for ENSANUT 2023 are provided in Figure S1, and complete class-specific observed frequencies, mean predicted probabilities, CITL intercepts, calibration slopes, and 95% bootstrap confidence intervals are reported in Table S3.
Figure 5.
Class-specific calibration curves for the six 78-predictor modelling strategies in the independent internal hold-out sample. Panels show multinomial logistic regression (A), calibrated Linear SVC (B), random forest (C), XGBoost (D), soft voting (E), and the stacked neural-network ensemble (F). Within each panel, calibration curves are shown for the four nutritional-status categories under a one-vs.-rest framework: normal weight, undernutrition, overweight, and obesity. The dashed diagonal line indicates ideal calibration, where mean predicted probabilities equal observed class frequencies. Deviation from the diagonal indicates miscalibration. The internal hold-out sample comprised 1416 participants.
3.7. Ablation Analysis Excluding Current Child Weight and Height
To quantify the extent to which concurrent nutritional status classification depended on current child anthropometry, the complete modeling workflow was repeated after removing weight and height before imputation and all subsequent preprocessing. This reduced the predictor set from 78 to 76 variables while preserving the same participant partitions, model specifications, hyperparameters, random seeds, and evaluation procedures.
Removing current weight and height produced a substantial reduction in classification performance across all modeling strategies in both evaluation samples (Table 7). In the internal hold-out sample, macro-AUC values decreased from 0.849 to 0.964 with the 78-predictor configuration to 0.598–0.643 with the 76-predictor configuration. Macro-average precision similarly decreased to approximately 0.266 to 0.301 across the six models.
Table 7.
Effect of removing current child weight and height on model performance.
For multinomial logistic regression, balanced accuracy decreased from 0.781 to 0.334 and macro-F1 from 0.635 to 0.185. XGBoost, which had achieved the highest macro-F1 in the primary analysis, decreased from 0.736 to 0.305, while its macro-AUC decreased from 0.962 to 0.639. The calibrated LinearSVC produced a balanced accuracy of 0.250 and classified all internal hold-out observations as normal weight, resulting in zero recall for undernutrition, overweight, and obesity.
The stacked neural network ensemble was particularly unstable after removing weight and height in the internal hold-out sample. Its balanced accuracy decreased from 0.823 to 0.313, macro-F1 from 0.611 to 0.024, macro-AUC from 0.961 to 0.633, and macro-average precision from 0.619 to 0.280. Its overall accuracy was only 0.025, reflecting a marked shift toward minority-class predictions rather than useful balanced classification.
The same general pattern was reproduced in the independent ENSANUT 2023 survey wave. MLR balanced accuracy decreased from 0.778 to 0.312 and macro-F1 from 0.598 to 0.150. XGBoost macro-F1 decreased from 0.680 to 0.299, while macro-AUC declined from 0.973 to 0.612. Calibrated LinearSVC again classified all participants as normal weight, yielding a balanced accuracy of 0.250 despite an overall accuracy of 0.924. Soft voting showed a similar majority-class-dominant pattern, with a balanced accuracy of 0.258.
For the stacked ensemble in ENSANUT 2023, balanced accuracy decreased from 0.775 to 0.340, macro-F1 from 0.583 to 0.154, macro-AUC from 0.977 to 0.572, and macro-average precision from 0.669 to 0.265. The class-specific performance confirmed that the 76-predictor configuration did not retain reliable separation of the four WHO nutritional status categories.
Overall, these findings demonstrate that the high discrimination observed in the primary 78-predictor analysis depended strongly on the availability of current child weight and height. The remaining demographic, family, socioeconomic, perinatal, feeding, dietary, sleep, activity, and behavioral variables alone were insufficient to reproduce concurrent WHO weight-for-height categories with comparable performance. Accordingly, the primary model should be interpreted as a concurrent anthropometry-informed classification and feature-profiling framework rather than as evidence that contextual predictors independently determine nutritional status or can replace WHO growth standard assessment.
3.8. Explainability Findings
Global SHAP analysis of the complete stacked neural network ensemble showed that current child weight and height dominated the model’s class-specific attribution patterns in the independent ENSANUT 2023 survey wave. Together, these two anthropometric measurements accounted for 59.52% of total mean absolute SHAP magnitude for normal-weight classification, 72.78% for undernutrition, 53.94% for overweight, and 71.32% for obesity. This pattern was consistent with the marked loss of discrimination observed in the anthropometry-free ablation analysis.
For normal-weight classification, current weight contributed 33.06% of total relative SHAP importance and current height 26.47%, followed by age (5.08%), paternal weight (2.02%), and sex (2.01%). For undernutrition, current weight and height accounted for 41.75% and 31.04%, respectively, followed by age (2.76%), sex (2.06%), and estimated milk-related energy intake (1.73%). For overweight, current weight contributed 29.97%, height 23.97%, and age 6.71%, followed by maternal height (1.99%) and dietary protein proportion (1.92%). For obesity, current weight accounted for 44.82% of total attribution and height for 26.50%, followed by age (3.39%), maternal height (2.14%), and breastfeeding duration (1.74%) (Table 8).
Table 8.
Leading class-specific predictors according to mean absolute SHAP values.
Because weight and height accounted for a large proportion of total attribution, a secondary normalization step was performed after excluding these two variables from the denominator. Under this contextual-only normalization, age remained the most prominent remaining feature for all four classes, accounting for 12.55% of contextual attribution for normal weight, 10.12% for undernutrition, 14.57% for overweight, and 11.81% for obesity. Other relatively prominent contextual contributors differed by class. Paternal weight, sex, and milk-related energy intake were among the leading remaining features for normal weight; sex and milk-related energy intake were prominent for undernutrition; maternal height, dietary protein proportion, and milk-related energy intake were prominent for overweight; and maternal height, breastfeeding duration, and paternal weight were prominent for obesity. These percentages represent the redistribution of attribution after excluding weight and height and should not be interpreted as importance estimates from a separately fitted anthropometry-free model.
LIME provided complementary individual-level explanations for 40 ENSANUT 2023 participants, with 10 cases selected from each observed nutritional status category. Each case was explained 20 times using different random seeds, resulting in 800 local explanations. The stability of the top-10 feature sets was moderate overall. The mean pairwise Jaccard similarity was 0.482 ± 0.108, with class-stratified means of 0.342 for normal-weight cases, 0.476 for undernutrition, 0.549 for overweight, and 0.562 for obesity.
Current height was the most consistently retained feature in repeated LIME, appearing among the top 10 in an average of 94.0% of repetitions across the 40 cases and in at least 90% of repetitions for 37 cases. Current weight appeared in an average of 78.6% of repetitions and in at least 90% of repetitions for 29 cases. Age and sex appeared in an average of 74.0% and 67.0% of repetitions, respectively. Paternal weight, dietary protein proportion, breastfeeding duration, milk-related energy intake, and maternal height were also recurrent local contributors, although their inclusion frequencies varied considerably between individuals.
Directional stability was substantially greater than feature-set stability. Among feature–case combinations that appeared in the top 10 in at least half of the 20 repeated explanations, mean sign concordance was 0.997 and the median was 1.00. Thus, when a feature was repeatedly selected as locally influential, the direction of its contribution was generally highly reproducible, even though the composition of the complete top-10 set varied across perturbation samples.
Local-surrogate fidelity also varied markedly across cases. Mean LIME fidelity across all 800 explanations was 0.326, with a median of 0.178. Mean fidelity was 0.028 for cases selected from the normal-weight group, 0.569 for undernutrition, 0.260 for overweight, and 0.447 for obesity. The particularly low fidelity observed for normal-weight cases indicates that a simple local linear surrogate did not adequately approximate the stacked ensemble in several regions of the predictor space. LIME should therefore be interpreted cautiously and primarily as descriptive local approximations rather than definitive representations of the ensemble’s decision process.
Taken together, SHAP and repeated LIME analyses consistently identified current child anthropometry as central to the fitted ensemble, while also showing class- and individual-specific contributions from age, parental anthropometrics, feeding characteristics, dietary composition, sex, and other contextual variables. However, neither SHAP nor LIME establishes causal effects, independent clinical risk factors, or intervention targets. The explanations characterize how the fitted ensemble used the available information to generate concurrent nutritional status classifications. The complete quantitative results for LIME explanation stability, predictor inclusion frequency, directional concordance, and local-surrogate fidelity are provided in Table S5.
4. Discussion
This study evaluated an interpretable stacked machine learning framework for concurrent multiclass nutritional status classification and individualized feature profiling in Mexican infants and preschool children using repeated cross-sectional ENSANUT data. The main objective was not to replace conventional anthropometric assessment, but to determine whether heterogeneous demographic, family, socioeconomic, perinatal, feeding, dietary, sleep, activity, and anthropometric information could be integrated within a transparent multiclass framework while explicitly examining the methodological consequences of missing data, class imbalance, outcome-related anthropometry, probability calibration, and model explainability. Taken together, the findings indicate that machine learning performance in this setting must be interpreted in relation to the information available to the model, particularly the extent to which current anthropometric measurements overlap conceptually and mathematically with the reference nutritional status definition.
A central issue in the present analysis is the role of current child weight and height. WHO growth standards remain the clinical reference for classifying nutritional status in young children, and a machine learning model supplied with the measurements used to construct that reference cannot be assumed to provide independent diagnostic information [16,23]. The ablation analysis was therefore essential for interpreting the primary modeling results. The marked deterioration observed when current weight and height were removed indicates that the strong discrimination of the anthropometry-informed models was driven to a substantial extent by direct access to the measurements underlying the concurrent nutritional status phenotype to a substantial extent. This finding limits any claim that machine learning improves the diagnosis of undernutrition, overweight, or obesity beyond direct application of WHO growth standards.
This distinction directly addresses the practical question of what an interpretable machine learning framework might add when clinicians can already identify nutritional status using standard growth charts. The potential contribution is not the replacement or automation of anthropometric classification, which can already be established efficiently using routine anthropometric measurements and WHO growth standards. Rather, its potential clinical role would begin after nutritional status has already been established using WHO growth standards. At that point, the model-based profile could highlight contextual characteristics that contributed to the ensemble output and may warrant further clinical exploration, such as parental anthropometry, feeding history, dietary composition, sleep, physical activity, socioeconomic characteristics, or other available factors. Such information could help characterize heterogeneity among children within the same anthropometric category and potentially support a more individualized clinical assessment and counseling process. These characteristics represent features used by the fitted model and should currently be considered descriptive contextual information whose clinical usefulness requires prospective evaluation.
The comparison between modeling strategies also illustrates why a single summary metric is insufficient in a markedly imbalanced multiclass problem. The narrower confidence intervals observed for overall accuracy likely reflect the predominance of the normal-weight category in the evaluation sample, whereas estimates that give greater weight to minority classes were more uncertain. Models that favor the majority normal-weight category may achieve apparently strong overall accuracy while providing limited recognition of less common nutritional conditions. Conversely, methods designed to improve sensitivity to minority categories may generate more false-positive classifications. These trade-offs explain why overall accuracy, balanced accuracy, macro-F1, class-specific precision and recall, average precision, and discrimination measures provide different and complementary information. In this context, no modeling strategy should be regarded as universally preferable solely because it performs best on one metric. Model selection for eventual clinical use would instead require explicit consideration of the relative consequences of missed cases and false-positive referrals.
The comparison between neural stacking, soft voting, individual base classifiers, and gradient boosting provides an additional methodological perspective. Stacking is attractive because it can integrate complementary probability patterns from classifiers with different inductive biases. Nevertheless, greater architectural complexity does not necessarily translate into greater clinical usefulness. The performance of XGBoost and the simpler soft voting comparator demonstrates that strong tabular data classification can also be obtained without a neural meta-learner. The principal contribution of the stacked framework is therefore not evidence that neural stacking is inherently superior, but the demonstration that ensemble aggregation strategies can produce different sensitivity–precision trade-offs and should be compared against strong simpler alternatives before additional complexity is justified.
Probability calibration further reinforces this point. Discrimination describes whether a model ranks observations appropriately, whereas calibration describes whether predicted probabilities correspond to observed class frequencies. These properties can diverge substantially. In the present study, models with strong discrimination did not necessarily provide well-calibrated probability estimates across nutritional status categories, particularly for minority classes. Class weighting may contribute to this behavior because increasing the influence of uncommon categories during training can improve sensitivity while altering the relationship between predicted probabilities and their observed population frequencies. Consequently, probability outputs from the present models should not be interpreted as absolute individual risks or probabilities of disease. Any future decision-support application would require independent calibration assessment and, if necessary, recalibration in the intended clinical population.
The missing data analysis also warrants careful interpretation. A substantial proportion of predictor information was incomplete, and the overall missingness pattern was not compatible with a simple MCAR assumption. Imputation is necessary to make use of partially observed multivariable data, but it does not eliminate the possibility of bias introduced by systematic missingness. The comparison of several imputation approaches using normalized reconstruction performance and downstream classification provided a pragmatic basis for selecting the final iterative chained-equation strategy. Importantly, imputation was fitted within the relevant training partitions in the definitive workflow, reducing information leakage between development and evaluation data. This represents an important methodological improvement over pooled preprocessing. Nevertheless, even a leakage-aware imputation strategy cannot recover information that was never observed or guarantee unbiased reconstruction when missingness depends on unmeasured characteristics. Imputation should therefore be viewed as a principled handling strategy rather than a solution to the missing data mechanism itself.
Evaluation using ENSANUT 2023 provides information about the consistency of the modeling framework across a later survey wave collected within the same national survey system. This method is stronger than relying exclusively on a single random split because it introduces temporal and sampling differences between development and evaluation data. However, it should not be interpreted as longitudinal prediction, because different children participated in each ENSANUT wave, nor as external clinical validation, because the surveys share related measurement procedures, variable definitions, and population context. The later-wave analysis therefore supports short-term transportability within the ENSANUT setting but does not establish generalizability to pediatric hospitals, primary-care clinics, other countries, or future individual growth trajectories.
The explainability analysis extends the study beyond performance evaluation by targeting the complete stacked ensemble rather than an isolated base classifier. This distinction is important because explanations derived from a component model cannot automatically be attributed to the final ensemble. Global SHAP attribution confirmed the dominant role of current anthropometry while also identifying class-specific contextual contributions. Repeated LIME analysis provided complementary individual-level information and, importantly, allowed explanation stability to be quantified rather than assumed. The finding that directional agreement was generally greater than feature-set stability illustrates that local explanations may preserve the direction of recurrent contributions while varying in which predictors are selected as most influential. Variation in local-surrogate fidelity further indicates that LIME does not approximate the ensemble equally well for all observations. These findings support using local explanations cautiously and argue against presenting a single LIME profile as a definitive explanation of an individual classification.
SHAP and LIME findings should also be separated from biological or causal interpretation [25,29]. A feature may receive high attribution because it is mathematically related to the outcome, correlated with other measurements, or useful to the fitted classifier within the available dataset. This does not establish that the feature causes a nutritional condition or that modifying it would change the child’s outcome. For example, parental anthropometry, feeding practices, dietary characteristics, socioeconomic indicators, or geographic variables may contribute to model prediction without representing independent intervention targets. The appropriate interpretation is therefore that these variables helped the fitted model distinguish between concurrent nutritional status categories in combination with other available information.
Compared with previous machine learning studies of childhood obesity and metabolic risk, the present work contributes several methodological elements that are particularly relevant to pediatric nutritional research [17,18,19,20]. First, the results preserve undernutrition, normal weight, overweight, and obesity rather than simplifying the task into a binary excess-weight classification. Second, the analysis explicitly separates an anthropometry-informed configuration from a configuration that excludes current weight and height, making the dependence on outcome-defining measurements transparent. Third, missing data processing was compared empirically and nested within model-development partitions. Fourth, neural stacking was evaluated against its individual components, soft voting, and XGBoost rather than in isolation. Fifth, discrimination was complemented by precision–recall analysis, calibration, bootstrap uncertainty, and later-wave evaluation. Finally, explainability was applied to the complete ensemble and the reproducibility of local explanations was quantified. The novelty therefore lies less in proposing machine learning as a substitute for growth assessment and more in establishing a framework for evaluating what such models actually learn, how dependent they are on anthropometry, and how reliably their outputs can be interpreted.
Related cross-sectional studies support the use of machine learning as a tool for the contextual characterization of current pediatric weight status rather than exclusively for forecasting future outcomes. Using ENSANUT 2018 data, Silva Sepúlveda and Boman [30] applied multimodal machine learning to investigate obesogenic-environment features and complex patterns associated with pediatric overweight and obesity in Mexico, including household and environmental characteristics associated with the observed phenotype. Similarly, Peng et al. [31] used cross-sectional Youth Risk Behavior Surveillance System data together with random forest, XGBoost, and SHAP to characterize the behavioral and lifestyle features associated with current adolescent obesity. These studies illustrate a complementary role for interpretable machine learning in examining heterogeneous characteristics associated with an established nutritional phenotype. The present study extends this approach by preserving four nutritional status categories, explicitly quantifying dependence on concurrent anthropometry, and evaluating both global and individual model explanations.
The present study also substantially extends our previous MICAI 2025 conference work [27]. Whereas the conference study framed the task as prediction of future nutritional status, the present analysis recognizes the repeated cross-sectional structure of ENSANUT and reformulates the problem as concurrent nutritional status classification. The revised framework additionally incorporates leakage-aware training-partition-specific missing data imputation, comparison of five imputation strategies using normalized reconstruction and downstream classification performance, repeated stratified five-fold cross-validation for model selection and stacking, XGBoost and soft voting comparators, later-wave evaluation using ENSANUT 2023, bootstrap confidence intervals, class-specific precision–recall analysis, formal probability-calibration assessment, an anthropometry-free ablation analysis, and SHAP and repeated LIME analyses of the complete stacked ensemble. These additions substantially expand the methodological evaluation, interpretability analyses, and clinical interpretation beyond the conference version.
Several strengths of this study should be considered alongside its limitations. The analysis used a large national survey dataset and preserved clinically distinct nutritional status categories. The modeling workflow separated development, internal hold-out evaluation, and later-wave evaluation; incorporated training-specific imputation and preprocessing; used repeated cross-validation for hyperparameter selection; and evaluated both discrimination and calibration. This study also directly addressed the dependence on current anthropometry rather than treating high predictive performance as sufficient evidence of clinical utility.
Nevertheless, this study remains a methodological proof of concept. ENSANUT is cross-sectional, and no child-level longitudinal outcome was available; consequently, the models cannot predict future nutritional trajectories. Minority categories were represented by relatively few participants, particularly undernutrition, producing greater uncertainty in class-specific estimates. Survey measurements may be affected by recall error, measurement variability, harmonization differences across waves, and residual missing data bias. In addition, the harmonized modeling dataset did not retain all variables necessary to reproduce the complete complex survey design across pooled ENSANUT waves, so descriptive estimates refer to the analytic sample rather than nationally representative prevalence.
In this study, we also did not evaluate clinical decision thresholds, decision-curve utility, subgroup fairness, healthcare-resource consequences, or patient outcomes. Calibration was assessed within ENSANUT-derived evaluation samples and requires confirmation in independent clinical populations. Although the explainability analyses suggest a potential role for contextual profiling and individualized counseling, whether these profiles meaningfully improve clinical assessment, counseling, intervention selection, or shared decision-making has not yet been established. The poor performance of the anthropometry-free models further indicates that the contextual variables available in ENSANUT cannot, by themselves, substitute for conventional anthropometric assessment.
Rather than focusing on whether machine learning can reproduce a concurrent WHO nutritional status label, future research should address a different question. The more clinically relevant objective is whether longitudinal clinical information can be used to identify future nutritional deterioration before it becomes evident through standard growth assessment. A subsequent phase of this project will use repeated pediatric electronic health record measurements to investigate temporal growth trajectories and future nutritional status transitions. Such work should incorporate strictly training-nested preprocessing, independent external validation, probability recalibration where necessary, subgroup fairness analyses, clinically meaningful decision thresholds, and assessment of incremental value beyond conventional growth charts. Only if a model provides reproducible information that changes or improves clinical decision-making beyond existing anthropometric standards would implementation as a preventive decision-support tool be justified.
5. Conclusions
In this study, we developed and evaluated an interpretable machine learning framework for concurrent multiclass nutritional status classification in Mexican infants and preschool children using repeated cross-sectional ENSANUT data. The analysis showed that model performance depended strongly on the availability of current child weight and height data, which are also used to define the WHO weight-for-height reference outcome. Accordingly, the high discrimination achieved by the anthropometry-informed models should not be interpreted as evidence that machine learning provides a superior diagnosis to WHO growth standards or that contextual characteristics alone can reliably reproduce current nutritional status categories.
The comparison of individual classifiers, soft voting, gradient boosting, and neural stacking demonstrated different trade-offs between overall classification performance, minority-class sensitivity, precision, and probability calibration. Explainability analyses of the complete stacked ensemble confirmed the dominant contribution of current anthropometry while also identifying age, parental anthropometrics, feeding, dietary, and other contextual characteristics that contributed to individual model outputs. These explanations describe model behavior and individualized feature profiles but do not establish causal relationships or intervention targets.
The principal contribution of this work is therefore methodological: it provides a transparent framework for evaluating multiclass nutritional status models while explicitly addressing missing data handling, class imbalance, calibration, later-wave transportability, dependence on outcome-defining anthropometry, and the stability of model explanations. In its current form, the framework should be considered a proof of concept rather than a clinical decision-support tool. Future studies should determine whether longitudinal models using repeated clinical measurements can provide reproducible and clinically useful information beyond conventional growth assessment, supported by independent external validation, appropriate recalibration, fairness assessment, and evaluation of incremental clinical utility evaluation.
Supplementary Materials
The following supporting information can be downloaded at: https://www.mdpi.com/article/10.3390/computers15110762/s1, Figure S1: Class-specific calibration curves for the six 78-predictor modelling strategies in the independent ENSANUT 2023 survey wave; Table S1: Complete predictor specification for the primary 78-predictor configuration and the anthropometry-free 76-predictor configuration; Table S2: Complete class-specific performance of the six 78-predictor modelling strategies in the independent internal hold-out sample and ENSANUT 2023 survey wave; Table S3: Class-specific calibration results for the six 78-predictor modelling strategies in the internal hold-out sample and ENSANUT 2023 survey wave; Table S4: Detailed performance of the anthropometry-free 76-predictor models in the internal hold-out sample and ENSANUT 2023 survey wave; Table S5: Quantitative stability and fidelity of repeated LIME explanations for the stacked neural-network ensemble in ENSANUT 2023; File S1: Jupyter notebook implementing the complete leakage-aware analysis workflow, including imputation benchmarking, repeated cross-validation, model development, later-wave evaluation, calibration, anthropometry-free ablation, SHAP, and repeated LIME analyses; File S2: Analysis audit manifest and software-version information supporting computational reproducibility.
Author Contributions
Conceptualization, A.G.G.-G. and E.H.M.-T.; methodology, A.G.G.-G.; software, A.G.G.-G. and E.H.M.-T.; validation, E.H.M.-T.; formal analysis, A.G.G.-G.; investigation, A.G.G.-G.; resources, A.G.G.-G.; data curation, A.G.G.-G.; writing—original draft preparation, A.G.G.-G.; writing—review and editing, A.G.G.-G. and E.H.M.-T.; visualization, A.G.G.-G.; supervision, E.H.M.-T.; project administration, A.G.G.-G. All authors have read and agreed to the published version of the manuscript.
Funding
This research received no external funding. The APC was funded by the Instituto Nacional de Pediatría (2021/060 Fiscal Resources Program E022).
Data Availability Statement
The original Mexican National Health and Nutrition Survey datasets analyzed in this study are publicly available from the official ENSANUT data repository: https://ensanut.insp.mx (accessed on 11 August 2026). The Jupyter notebook, data dictionary, and trained-model artifacts generated during the study will be made available as Supplementary Materials, subject to journal file-size limits. The processed analysis dataset may be shared upon reasonable request, subject to the data-use conditions of the original ENSANUT datasets.
Acknowledgments
The authors acknowledge the institutions responsible for the Mexican National Health and Nutrition Survey for making the survey datasets publicly available. During the preparation of this manuscript, the authors used ChatGPT (OpenAI, GPT-5.6 Sol) for English-language editing, manuscript organization, and refinement of scientific wording. The authors reviewed and edited the output and take full responsibility for the content of this publication.
Conflicts of Interest
The authors declare no conflicts of interest.
Abbreviations
The following abbreviations are used in this manuscript:
| AI | Artificial intelligence |
| AUC | Area under the receiver operating characteristic curve |
| BMI | Body mass index |
| CI | Confidence interval |
| ENSANUT | Mexican National Health and Nutrition Survey |
| LIME | Local Interpretable Model-agnostic Explanations |
| MAE | Mean absolute error |
| MCAR | Missing completely at random |
| RMSE | Root mean squared error |
| ROC | Receiver operating characteristic |
| SHAP | Shapley Additive exPlanations |
| WHO | World Health Organization |
| z-score | Standardized score |
References
- World Health Organization. Obesity and Overweight. Health Topics. Available online: https://www.who.int/news-room/fact-sheets/detail/obesity-and-overweight (accessed on 11 August 2026).
- Jebeile, H.; Kelly, A.; O’Malley, G.; Baur, L. Obesity in children and adolescents: Epidemiology, causes, assessment, and management. Lancet Diab. Endocrinol. 2022, 10, 351–365. [Google Scholar] [CrossRef] [Scilit] [PubMed]
- UNICEF; World Health Organization; World Bank Group. Levels and Trends in Child Malnutrition: UNICEF/WHO/World Bank Group Joint Child Malnutrition Estimates: Key Findings of the 2025 Edition; World Health Organization: Geneva, Switzerland, 2025. [Google Scholar]
- Cuevas-Nasu, L.; Muñoz-Espinosa, A.; Shamah-Levy, T.; García-Feregrino, R.; Gómez-Acosta, L.M.; Ávila-Arcos, M.A.; Rivera-Dommarco, J. Estado de nutrición de niñas y niños menores de cinco años en México. Ensanut 2022. Salud Publica Mex. 2023, 65, s211–s217. [Google Scholar] [CrossRef] [Scilit] [PubMed]
- World Health Organization. Healthy Diet. Health Topics. Available online: https://www.who.int/news-room/fact-sheets/detail/healthy-diet (accessed on 11 August 2026).
- World Health Organization. Guidelines on Physical Activity, Sedentary Behavior and Sleep for Children Under 5 Years of Age; World Health Organization: Geneva, Switzerland, 2019. [Google Scholar]
- Guthold, R.; Stevens, G.; Riley, L.; Bull, C.F. Global trends in insufficient physical activity among adolescents: A pooled analysis of 298 population-based survey with 1.6 million participants. Lancet Child Adolesc. Health 2020, 4, 23–35. [Google Scholar] [CrossRef] [Scilit] [PubMed]
- Cartanyà-Hueso, A.; Lidón-Moyano, C.; Marcn-Sánchez, J.C.; González-Marrón, A.; Pérez-Marcn, H.; Martínez-Sánchez, J.M. Association between recreational screen time and excess weight and obesity assessed with three sets of criteria in Spanish residents aged 2–14 years. An. Pediatría 2022, 97, 333–341. [Google Scholar] [CrossRef] [Scilit]
- Reilly, J.J.; Armstrong, J.; Dorosty, A.R.; Emme, P.M.; Ness, A.; Rogers, I.; Steer, C.; Sherriff, A. Early life risk factors for obesity in childhood: Cohort study. BMJ 2005, 330, 1357. [Google Scholar] [CrossRef] [Scilit] [PubMed]
- Bonuck, K.; Chervin, R.D.; Howe, L.D. Sleep-disordered breathing, sleep duration, and childhood overweight: A longitudinal cohort study. J. Pediatr. 2015, 166, 632–639. [Google Scholar] [CrossRef] [Scilit] [PubMed]
- Touchette, E.; Petit, D.; Tremblay, R.E.; Boivin, M.; Falissard, B.; Genolini, C.; Montplaisir, J.Y. Associations between sleep duration patterns and overweight/obesity at age 6. Sleep 2008, 31, 1507–1514. [Google Scholar] [CrossRef] [Scilit] [PubMed]
- Sharf, R.J.; DeBoer, M.D. Sleep timing and longitudinal weight gain in 4-and 5-year-old children. Pediatr. Obes. 2015, 10, 141–148. [Google Scholar] [CrossRef] [Scilit] [PubMed]
- Blundell, J.E.; Cooling, J. Routes to obesity: Phenotypes, food choices and activity. Br. J. Nutr. 2000, 83, S33–S38. [Google Scholar] [CrossRef] [Scilit] [PubMed]
- Chen, J.; Jin, L.; Wang, F.; Huang, K.; Wu, W.; Chen, R.; Maimaiti, M.; Chen, S.; Cao, B.; Zhu, M.; et al. Risk factors for obesity and overweight in Chinese children: A nationwide survey. Obesity 2022, 30, 1842–1850. [Google Scholar] [CrossRef] [Scilit] [PubMed]
- Cu, F.L.; Villarreal, E.; Rangel, B.; Galicia, L.; Vargas, E.; Martinez, L. Risk factor for overweight and obesity in infants. Rev. Chil. Nutr. 2015, 42, 139–144. [Google Scholar] [CrossRef] [Scilit]
- World Health Organization. WHO Child Growth Standards: Length/Height-For-Age, Weight-For-Age, Weight-For-Length, Weight-For-Height and Body Mass Index-For-Age: Methods and Development; World Health Organization: Geneva, Switzerland, 2006. [Google Scholar]
- Pérez-Muñoz, C.; Carretero-Bravo, J.; Ortega-Martín, E.; Ramos-Fiol, B.; Ferriz-Mas, B.; Díaz-Rodríguez, M. Interventions in the first 1000 days to prevent childhood obesity: A systematic review and quantitative content analysis. BMC Public Health 2022, 22, 2367. [Google Scholar] [CrossRef] [Scilit] [PubMed]
- Pope, K.; Whitcomb, C.; Vu, M.; Macon Harrison, L.; Gittelsohn, J.; Ward, D.; Erinosho, T. Barriers, facilitators, and opportunities to promote healthy weight behaviors among preschool-aged children in two rural U.S. communities. BMC Public Health 2023, 23, 53. [Google Scholar] [CrossRef] [Scilit] [PubMed]
- Torres-Martos, A.; Anguita-Ruiz, A.; Bustos-Aibar, M.; Ramírez-Mena, A.; Arteaga, M.; Bueno, G.; Leis, R.; Aguilera, C.M.; Alcalá, R.; Alcalá-Fdez, J. Multiomics and eXplainable artificial intelligence for decision support in insulin resistance early diagnosis: A pediatric population-based longitudinal study. Artif. Intell. Med. 2024, 156, 102962. [Google Scholar] [CrossRef] [Scilit] [PubMed]
- Gupta, M.; Thao-Ly, T.; Bunnel, T.; Beheshti, R. Obesity prediction with EHR data: A deep learning approach with interpretable elements. ACM Trans. Comput. Healthc. 2022, 3, 32. [Google Scholar] [CrossRef] [Scilit]
- Sterne, J.A.; White, I.R.; Carlin, J.B.; Spratt, M.; Royston, P.; Kenward, M.G.; Wood, A.M.; Carpenter, J.R. Multiple imputation for missing data in epidemiological and clinical research: Potential and pitfalls. BMJ. 2009, 338, b2393. [Google Scholar] [CrossRef] [Scilit] [PubMed]
- Collins, G.S.; Moons, K.G.M.; Dhiman, P.; Riley, R.D.; Beam, A.L.; Van Calster, B.; Ghassemi, M.; Liu, X.; Reitsma, J.B.; van Smeden, M.; et al. TRIPOD+AI statement: Updated guidance for reporting clinical prediction models that use regression or machine learning methods. BMJ. 2024, 385, e078378. [Google Scholar] [CrossRef] [Scilit] [PubMed]
- Kapoor, S.; Narayanan, A. Leakage and the reproducibility crisis in machine-learning-based science. Patterns 2023, 4, 100804. [Google Scholar] [CrossRef] [Scilit] [PubMed]
- Wolpert, D.H. Stacked generalization. Neural Netw. 1992, 5, 241–259. [Google Scholar] [CrossRef] [Scilit]
- Ribeiro, M.T.; Singh, S.; Guestrin, C. “Why should I trust you?”: Explaining the predictions of any classifier. In Proceedings of the 22nd ACM SIGKDD International Conference on Knowledge Discovery and Data Mining; Association for Computing Machinery: New York, NY, USA, 2016; pp. 1135–1144. [Google Scholar] [CrossRef] [Scilit]
- Hammond, R.; Athanasiadou, R.; Curado, S.; Aphinyanaphongs, Y.; Abrams, C.; Messito, M.J.; Gross, R.; Katzow, M.; Jay, M.; Razavian, N.; et al. Predicting childhood obesity using electronic health records and publicly available data. PLoS ONE 2019, 14, e0215571. [Google Scholar] [CrossRef] [Scilit] [PubMed]
- González-Garay, A.G.; Macias, E.H.; Pérez, I. Efficacy of a Multi-class AI Ensemble Model in Preschoolers to Predict Nutritional Status at School Age in Mexico. In Advances in Soft Computing, Proceedings of the 24th Mexican International Conference on Artificial Intelligence, MICAI 2025, Guanajuato, Mexico, 3 November 2025; Martínez-Villaseñor, L., Ed.; Lecture Notes in Artificial Intelligence; Springer Nature: Cham, Switzerland, 2026; Volume 16222, pp. 436–444. [Google Scholar] [CrossRef] [Scilit]
- Instituto Nacional de Salud Pública. Encuesta Nacional de Salud y Nutrición (ENSANUT). Available online: https://ensanut.insp.mx (accessed on 10 September 2026).
- Lundberg, S.M.; Lee, S.-I. A unified approach to interpreting model predictions. Adv. Neural Inf. Process. Syst. 2017, 30, 4765–4774. [Google Scholar]
- Silva Sepulveda, R.; Boman, M. Multimodal machine learning for analysing multifactorial causes of disease—The case of childhood overweight and obesity in Mexico. Front. Public Health 2025, 12, 1369041. [Google Scholar] [CrossRef] [Scilit] [PubMed]
- Peng, Y.; Xu, Z.; Du, S.; Hou, T.; Yan, J. SHAP-enhanced machine learning identifies modifiable obesity predictors across adolescent weight groups: A 2021 YRBSS analysis. PLoS ONE 2025, 20, e0334502. [Google Scholar] [CrossRef] [Scilit] [PubMed]
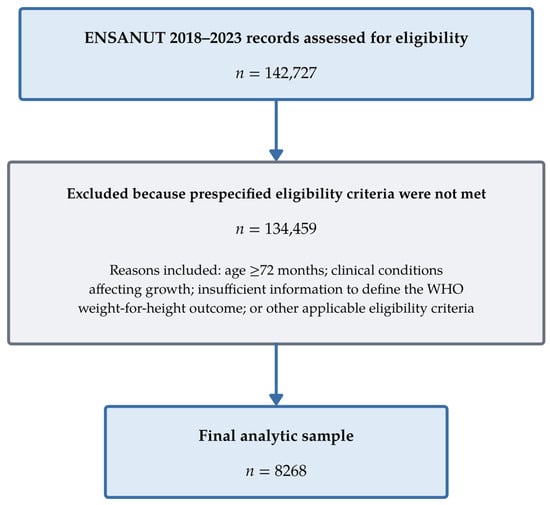
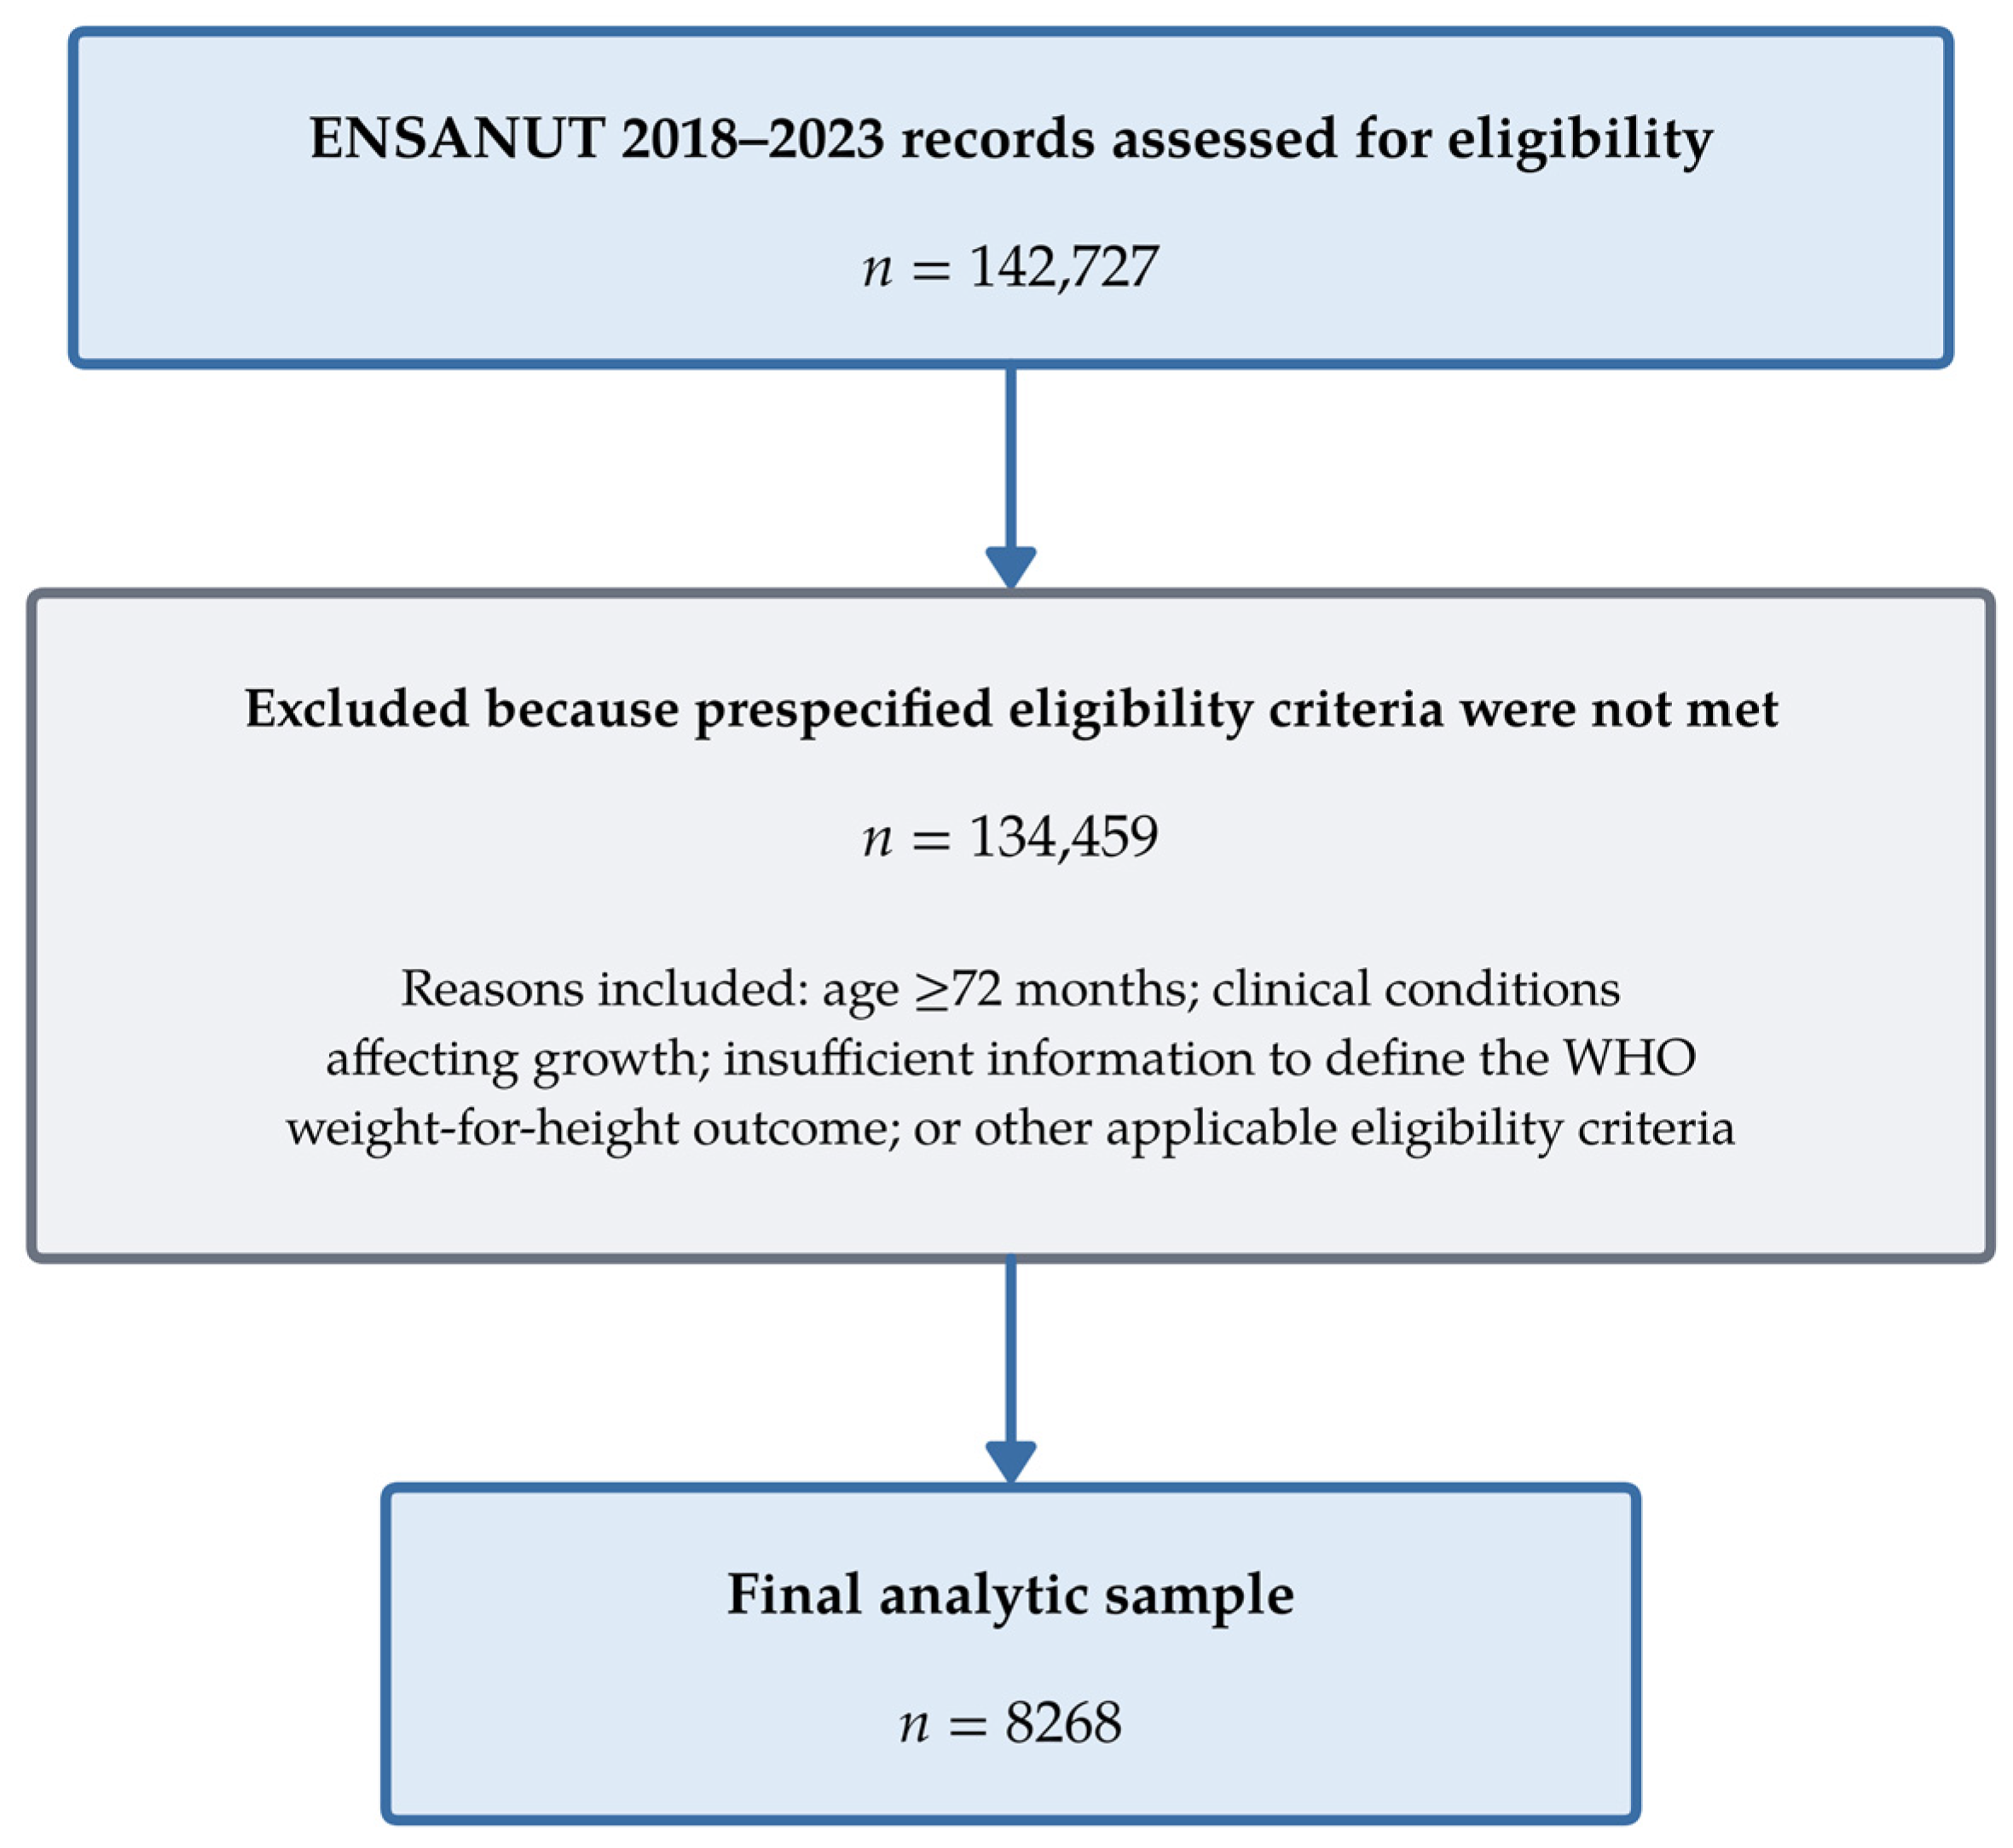
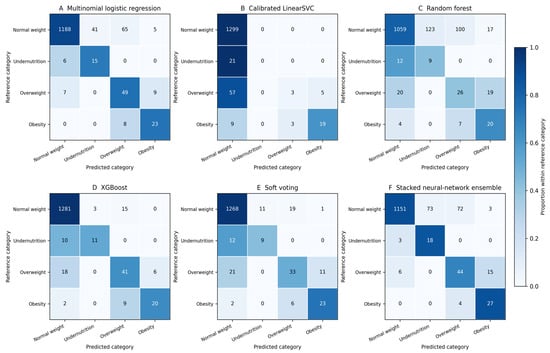
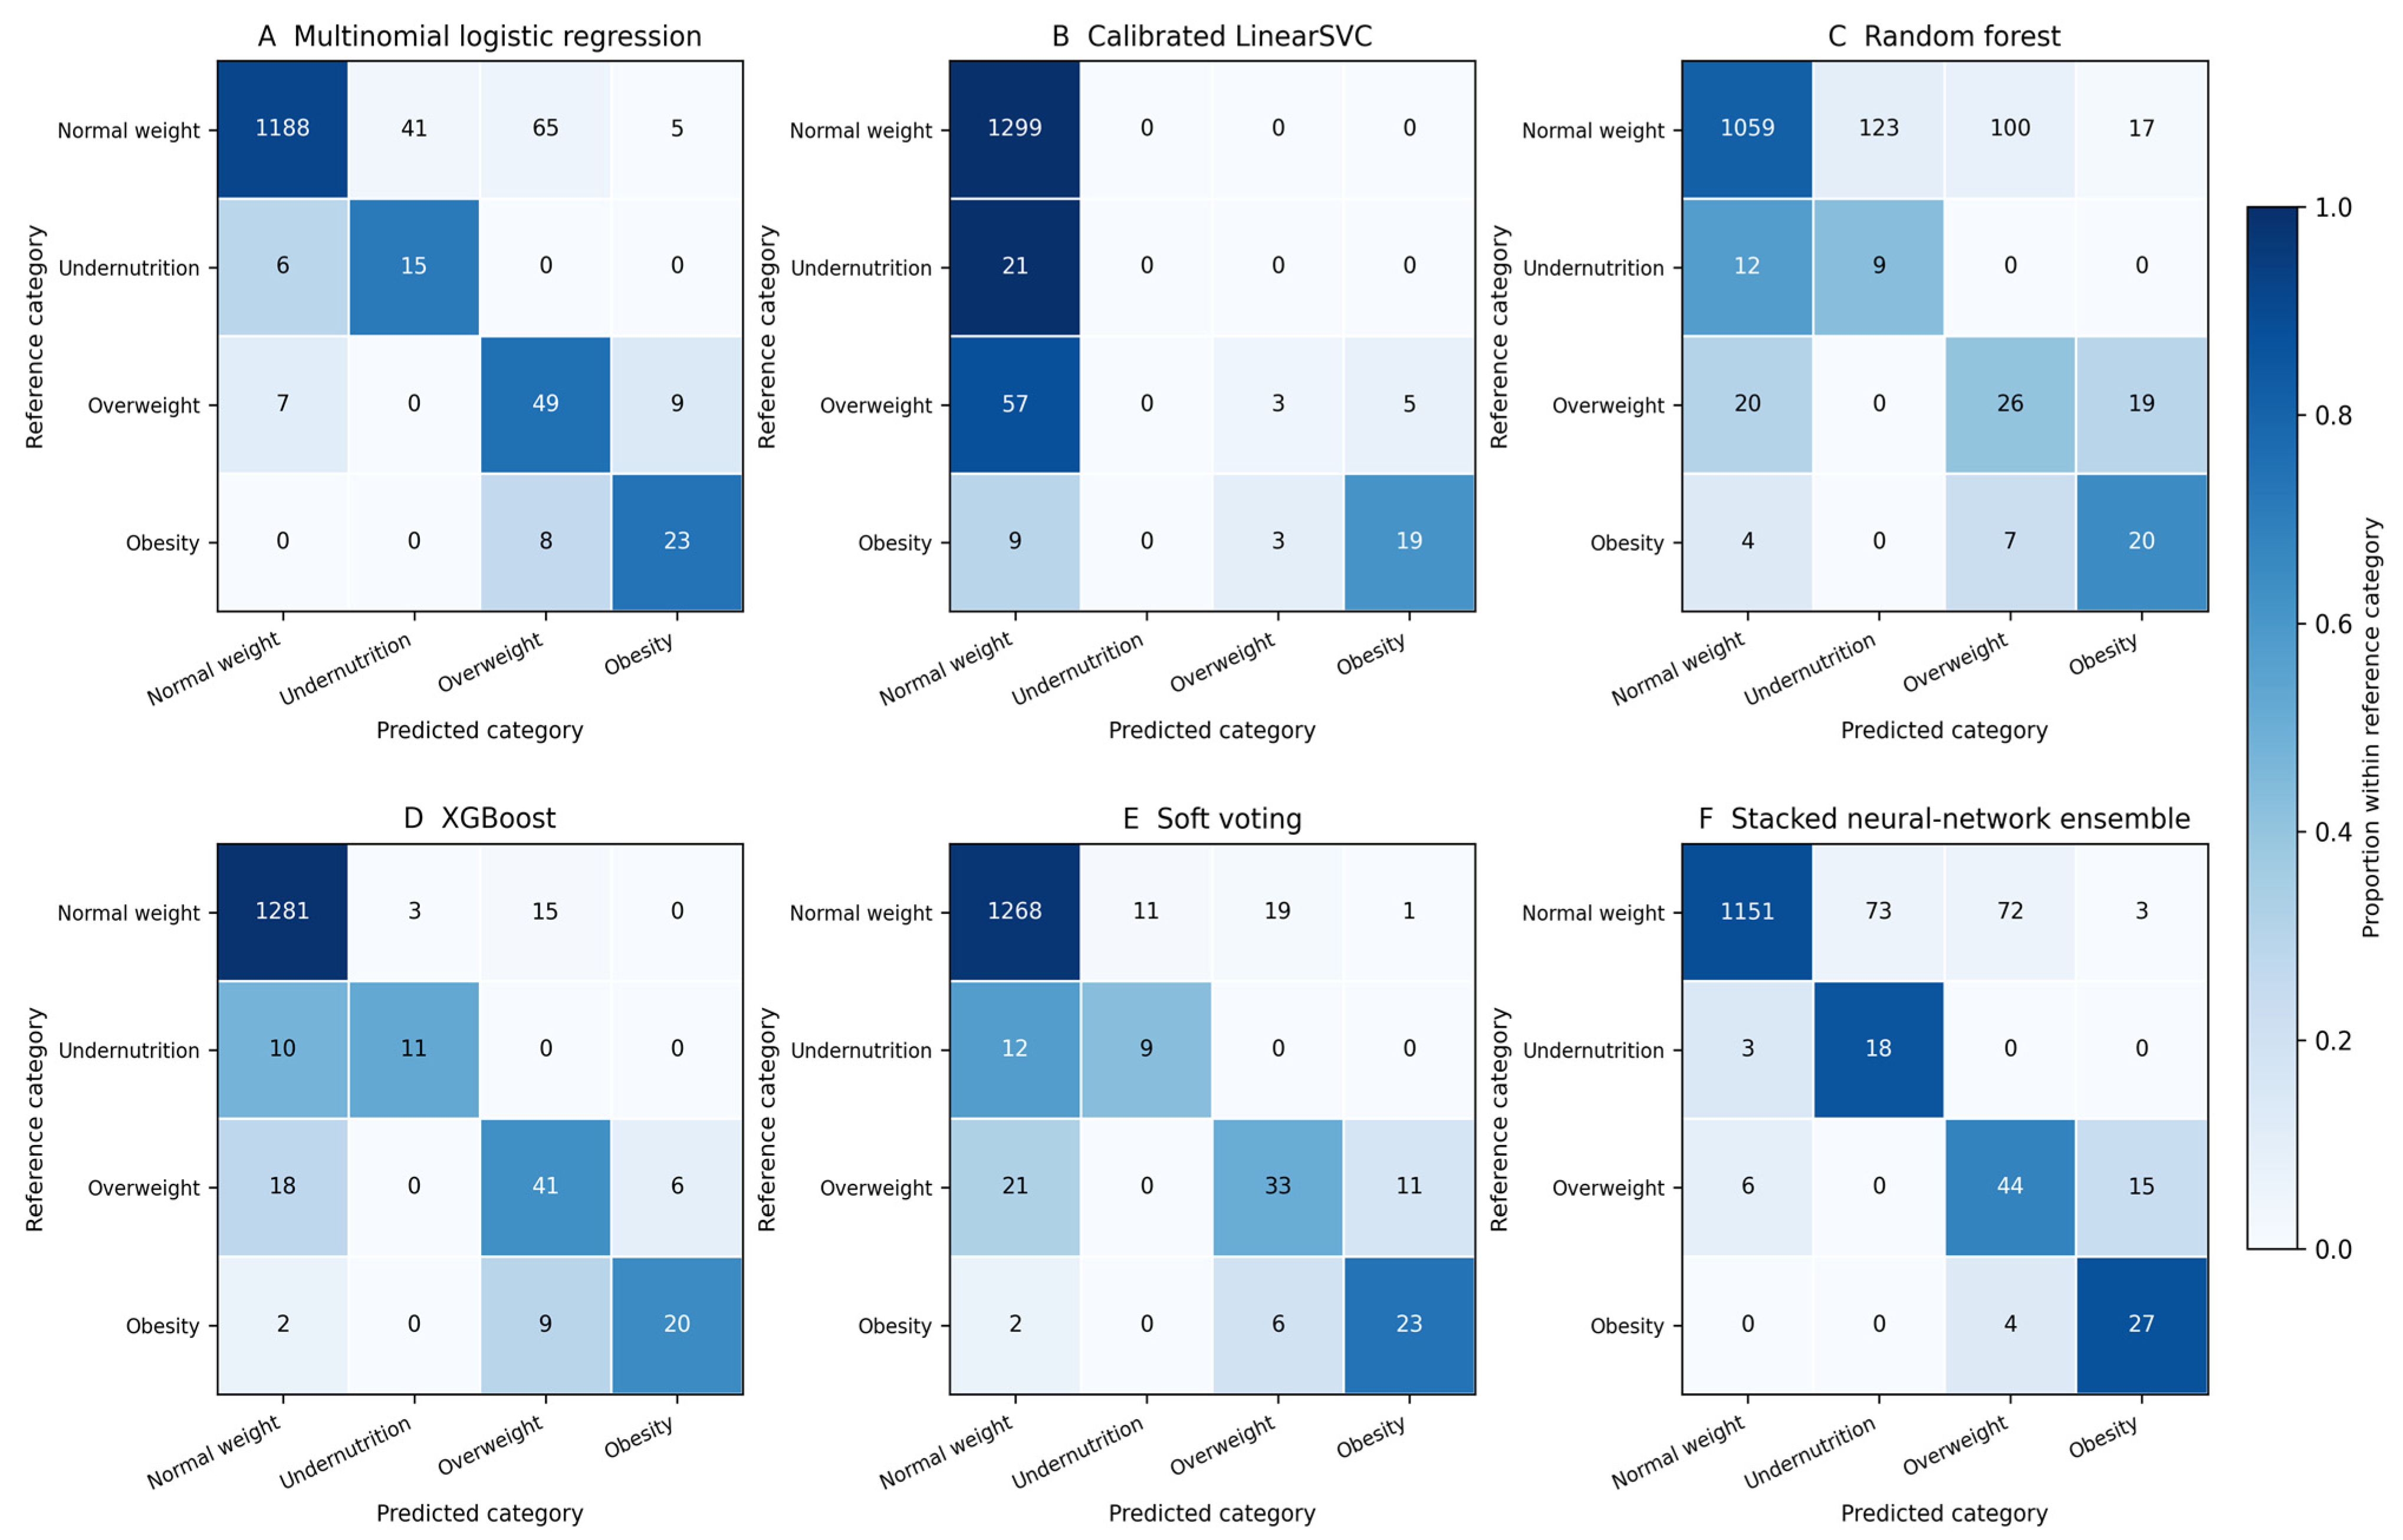
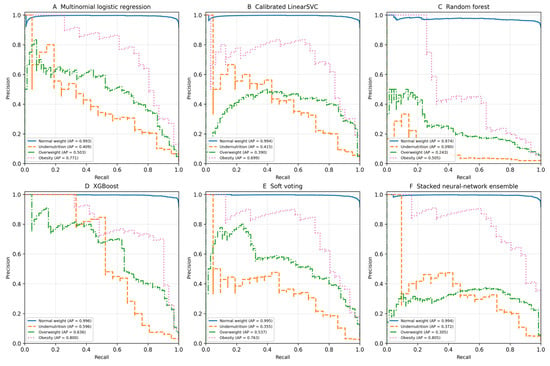
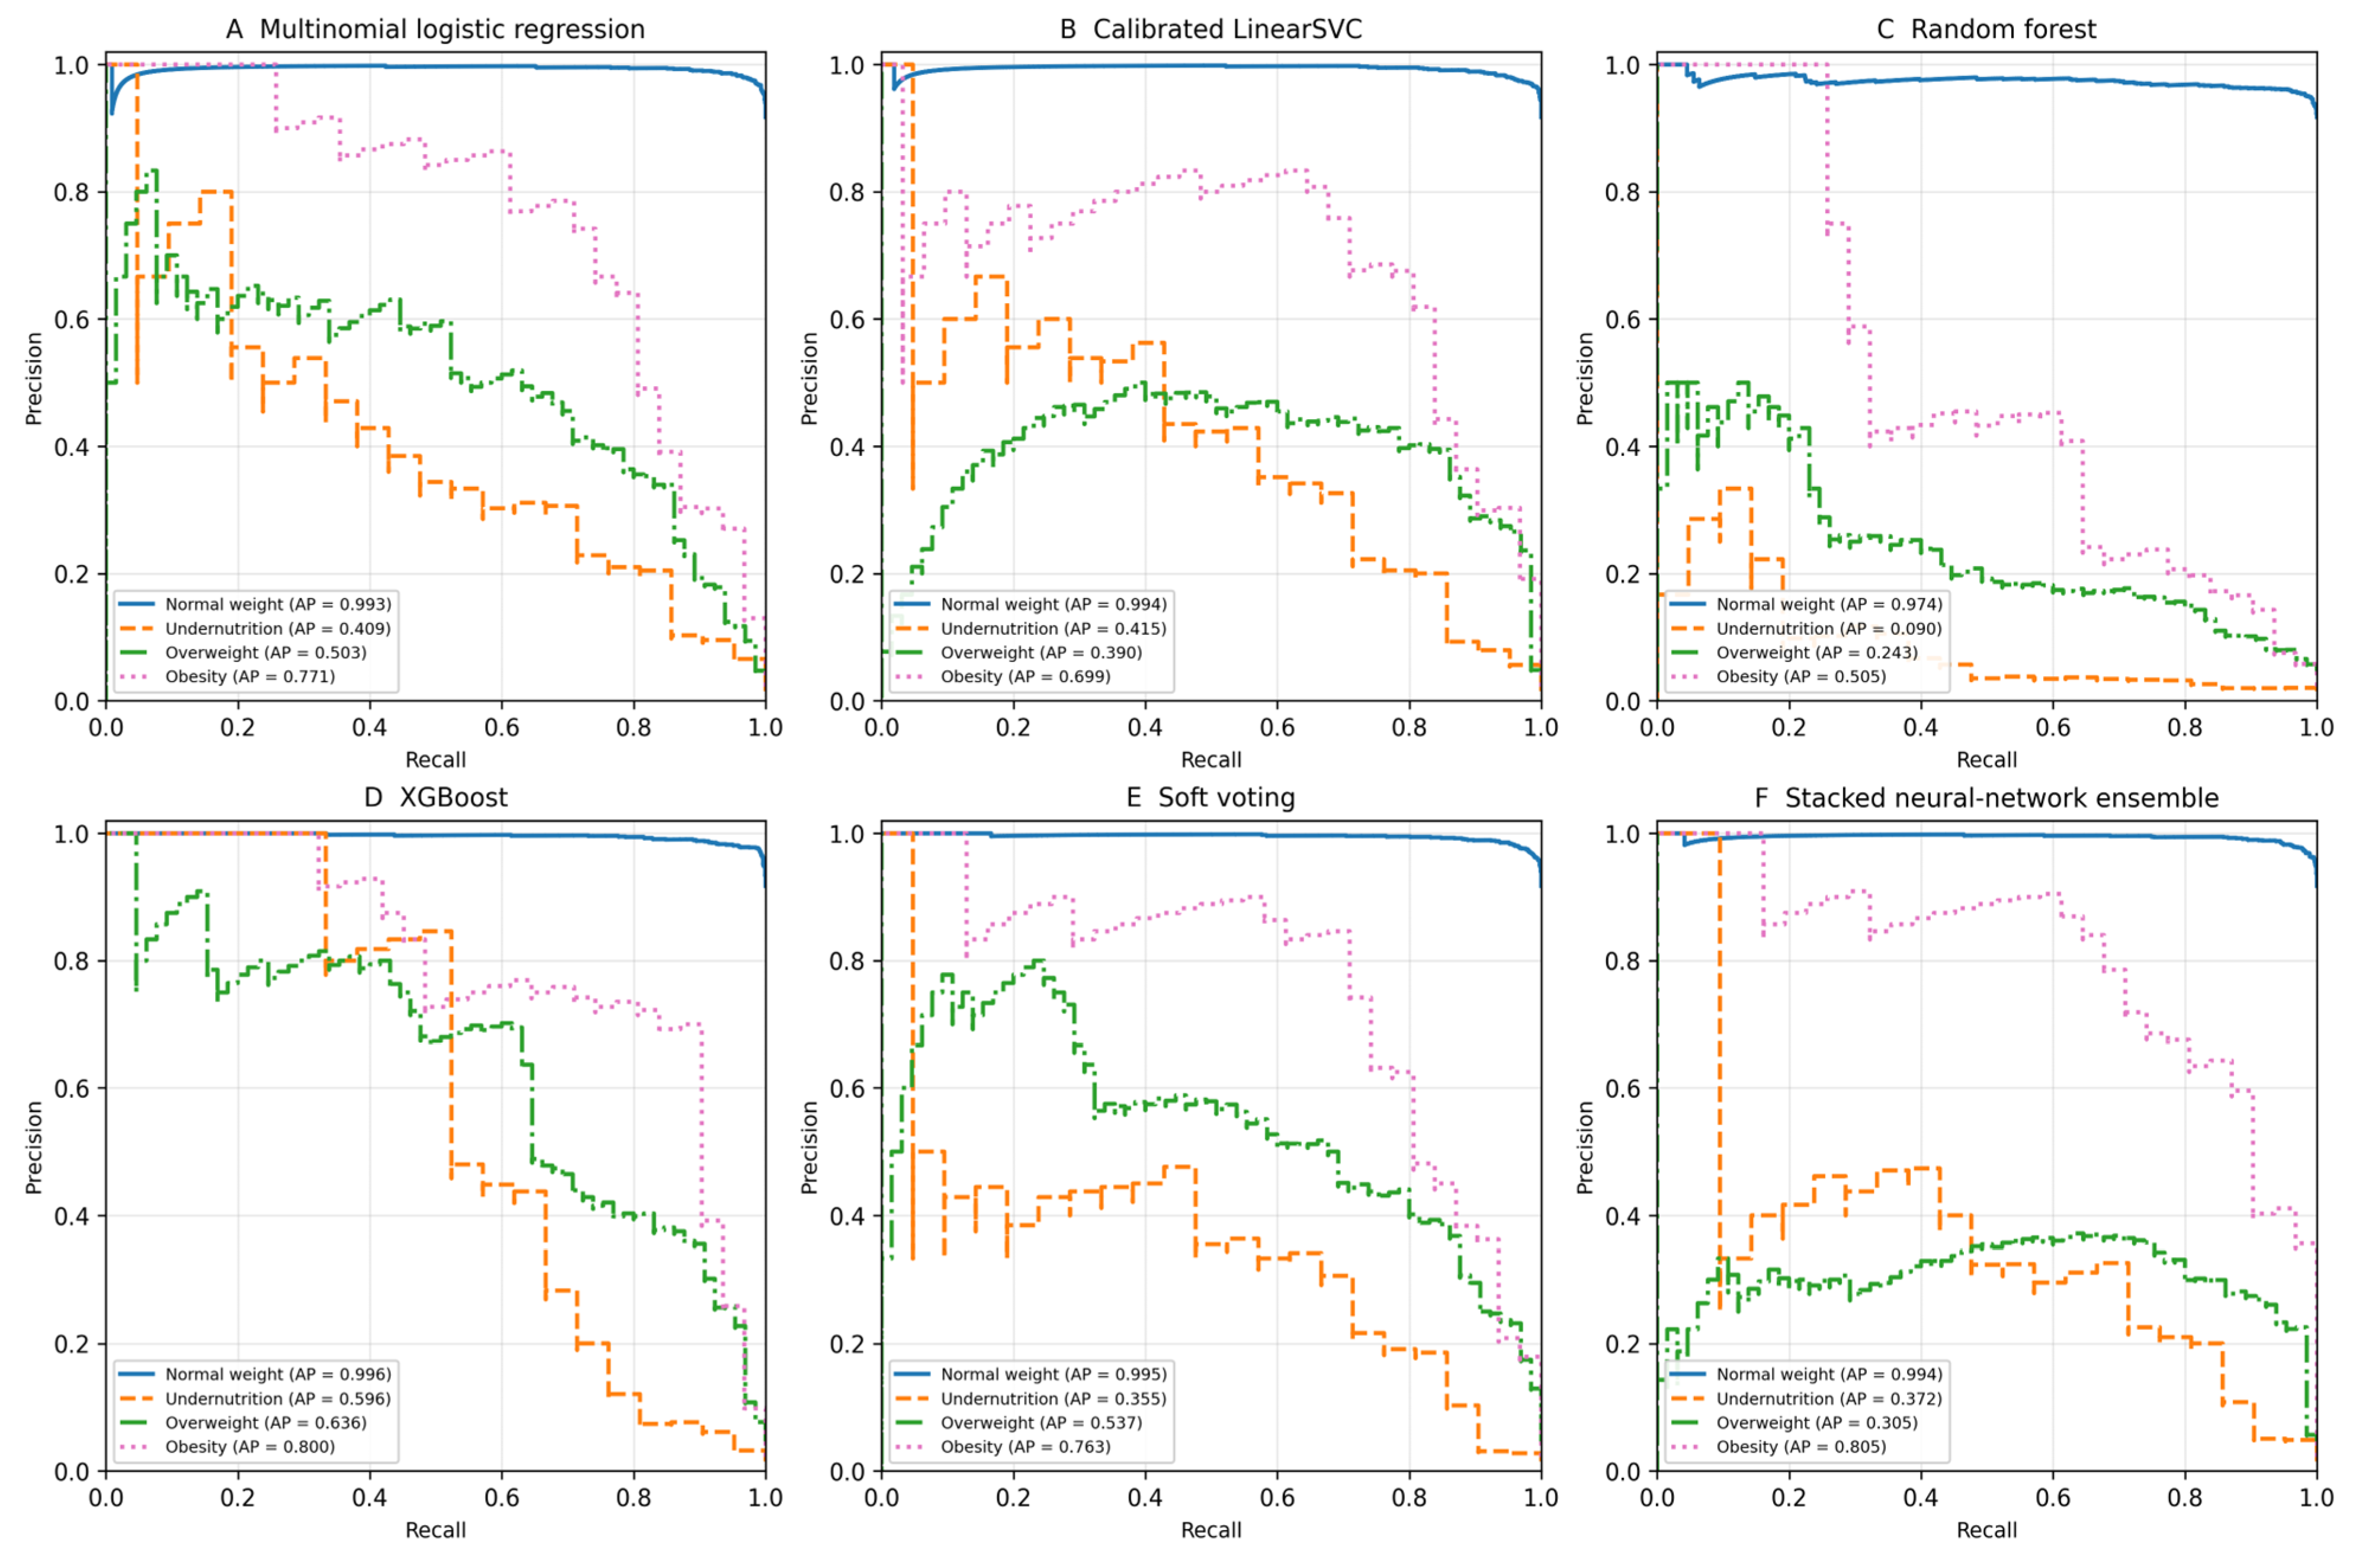
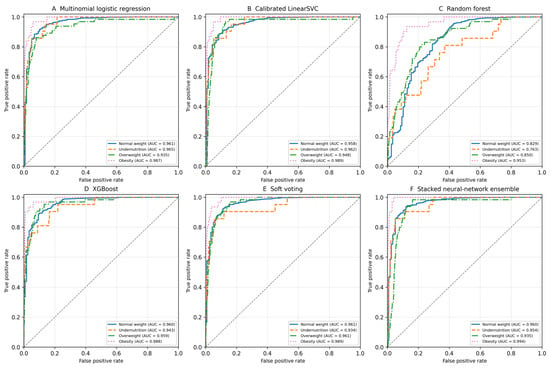
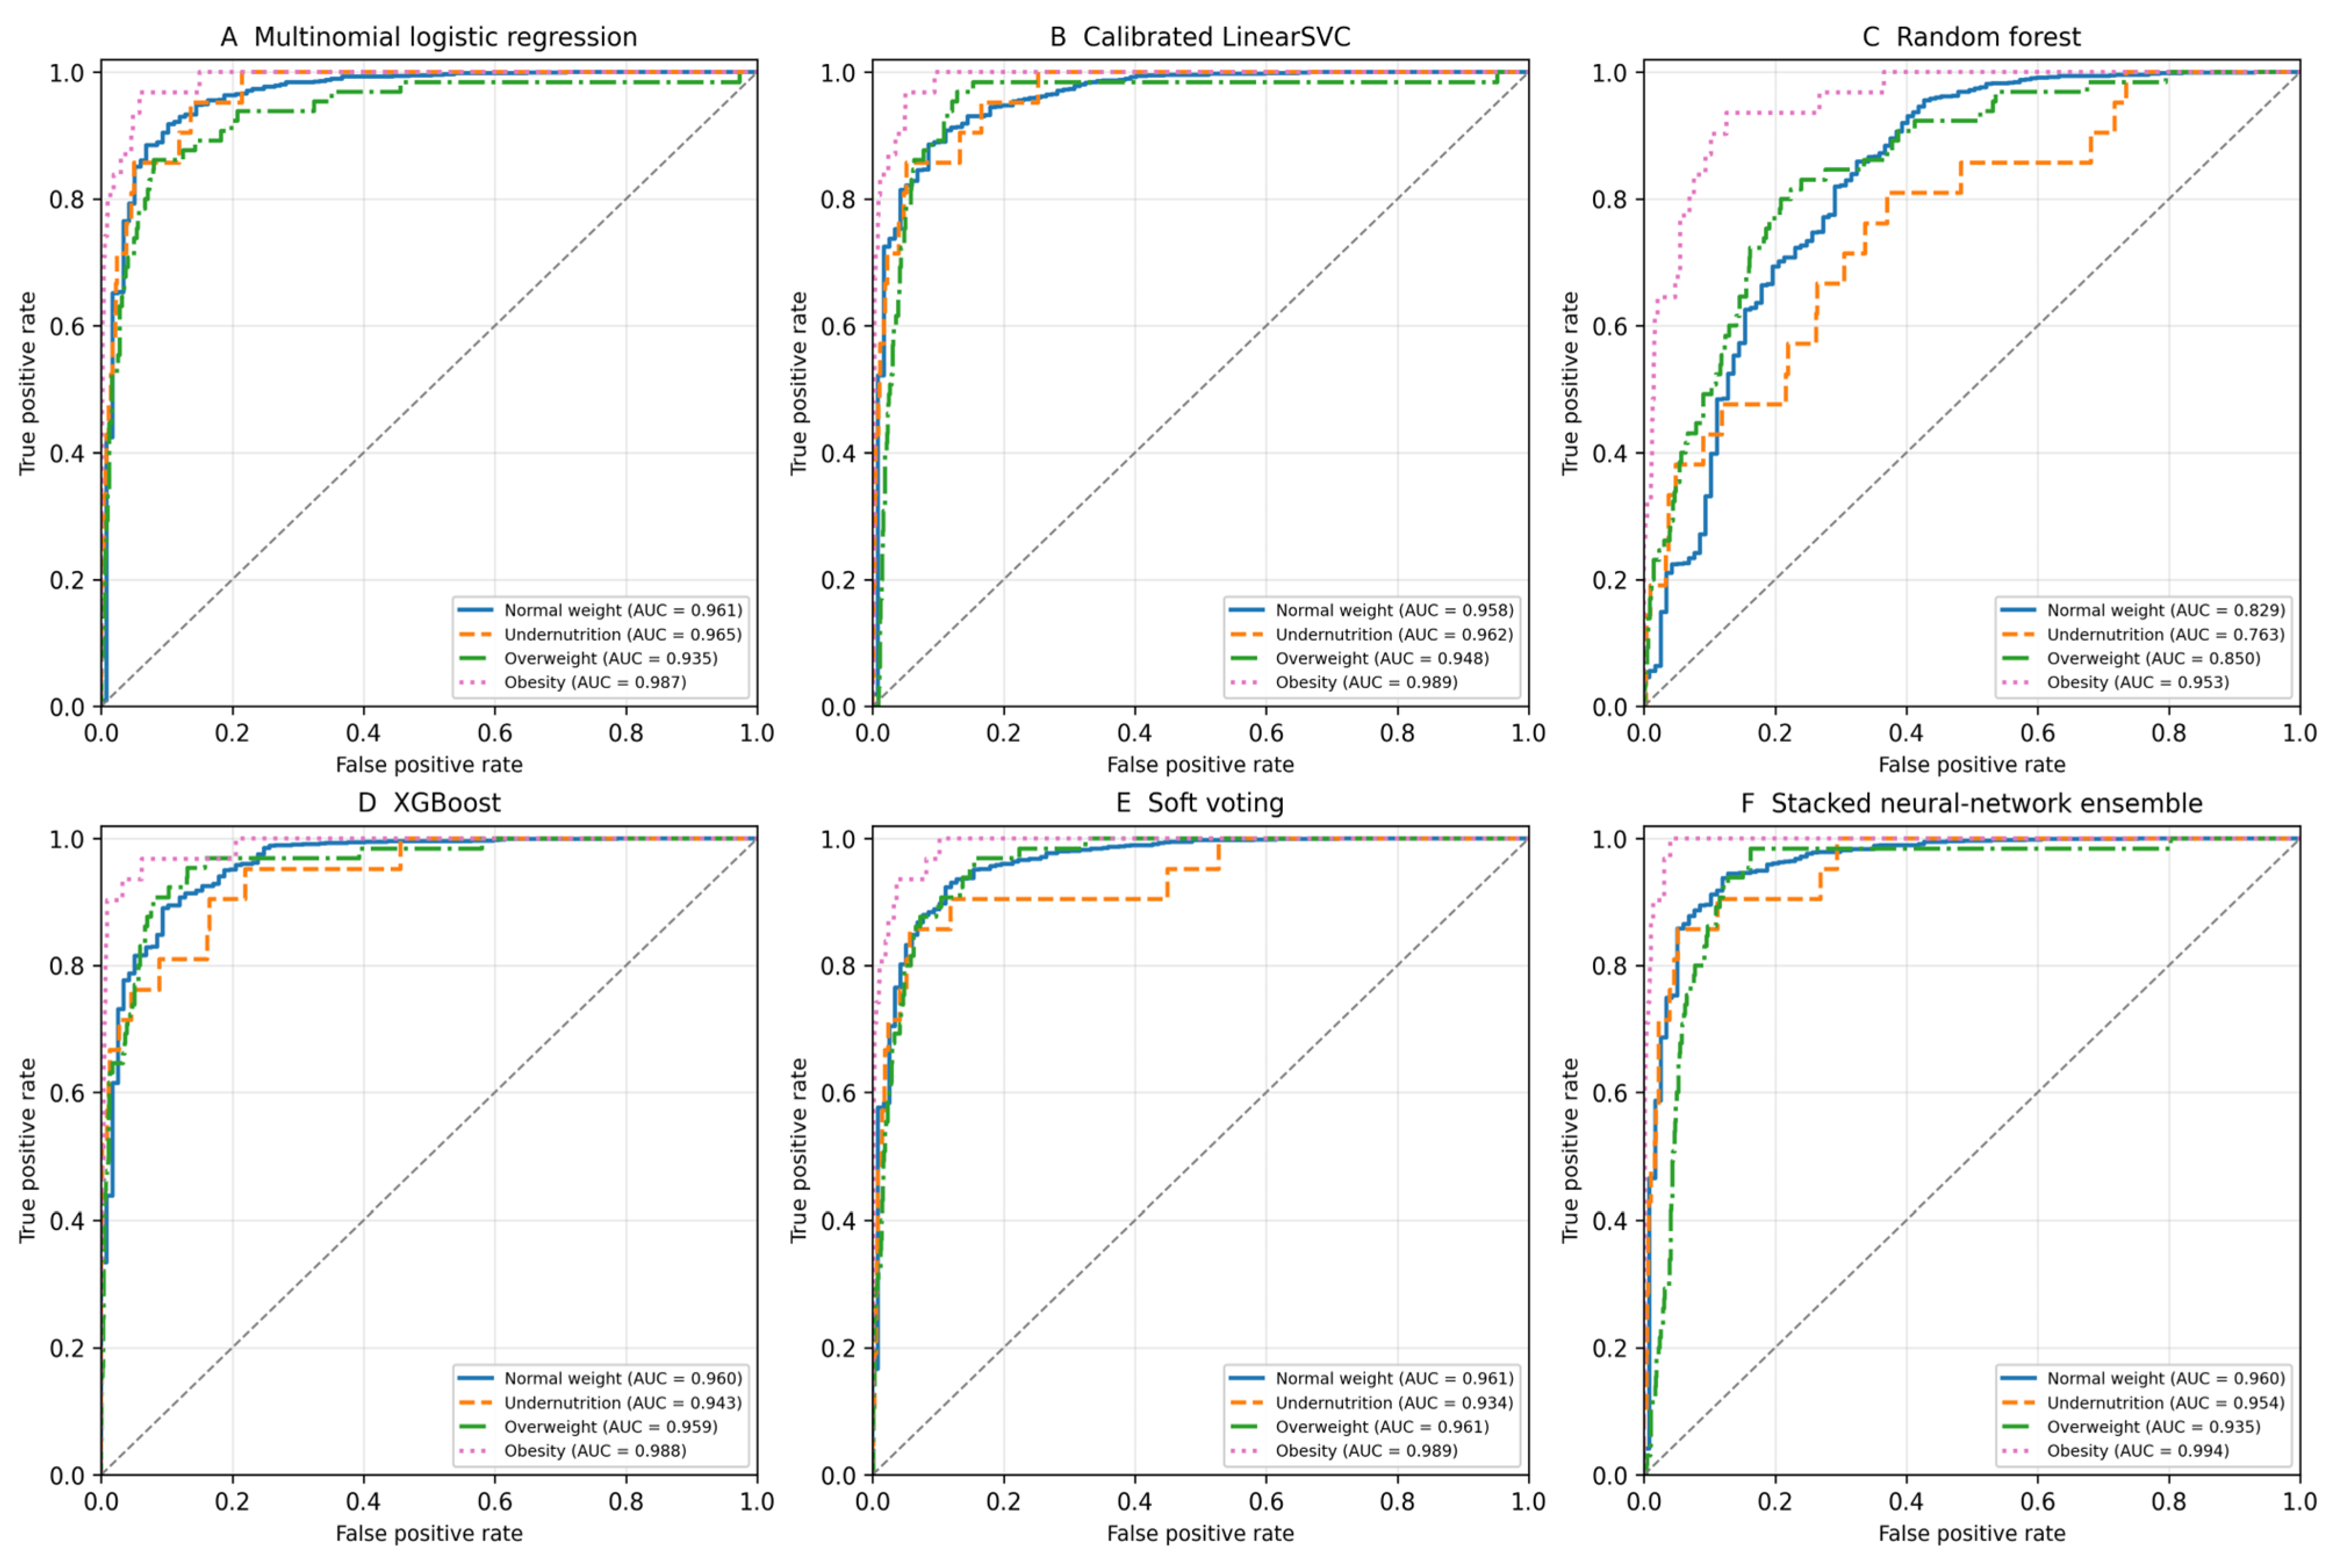
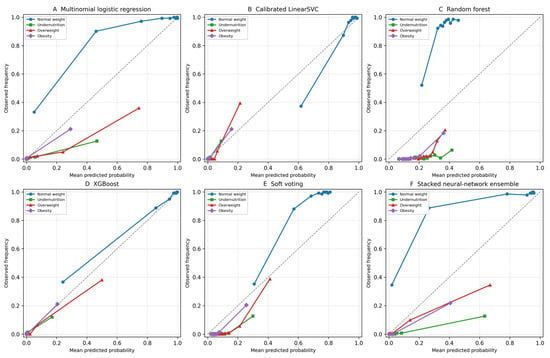
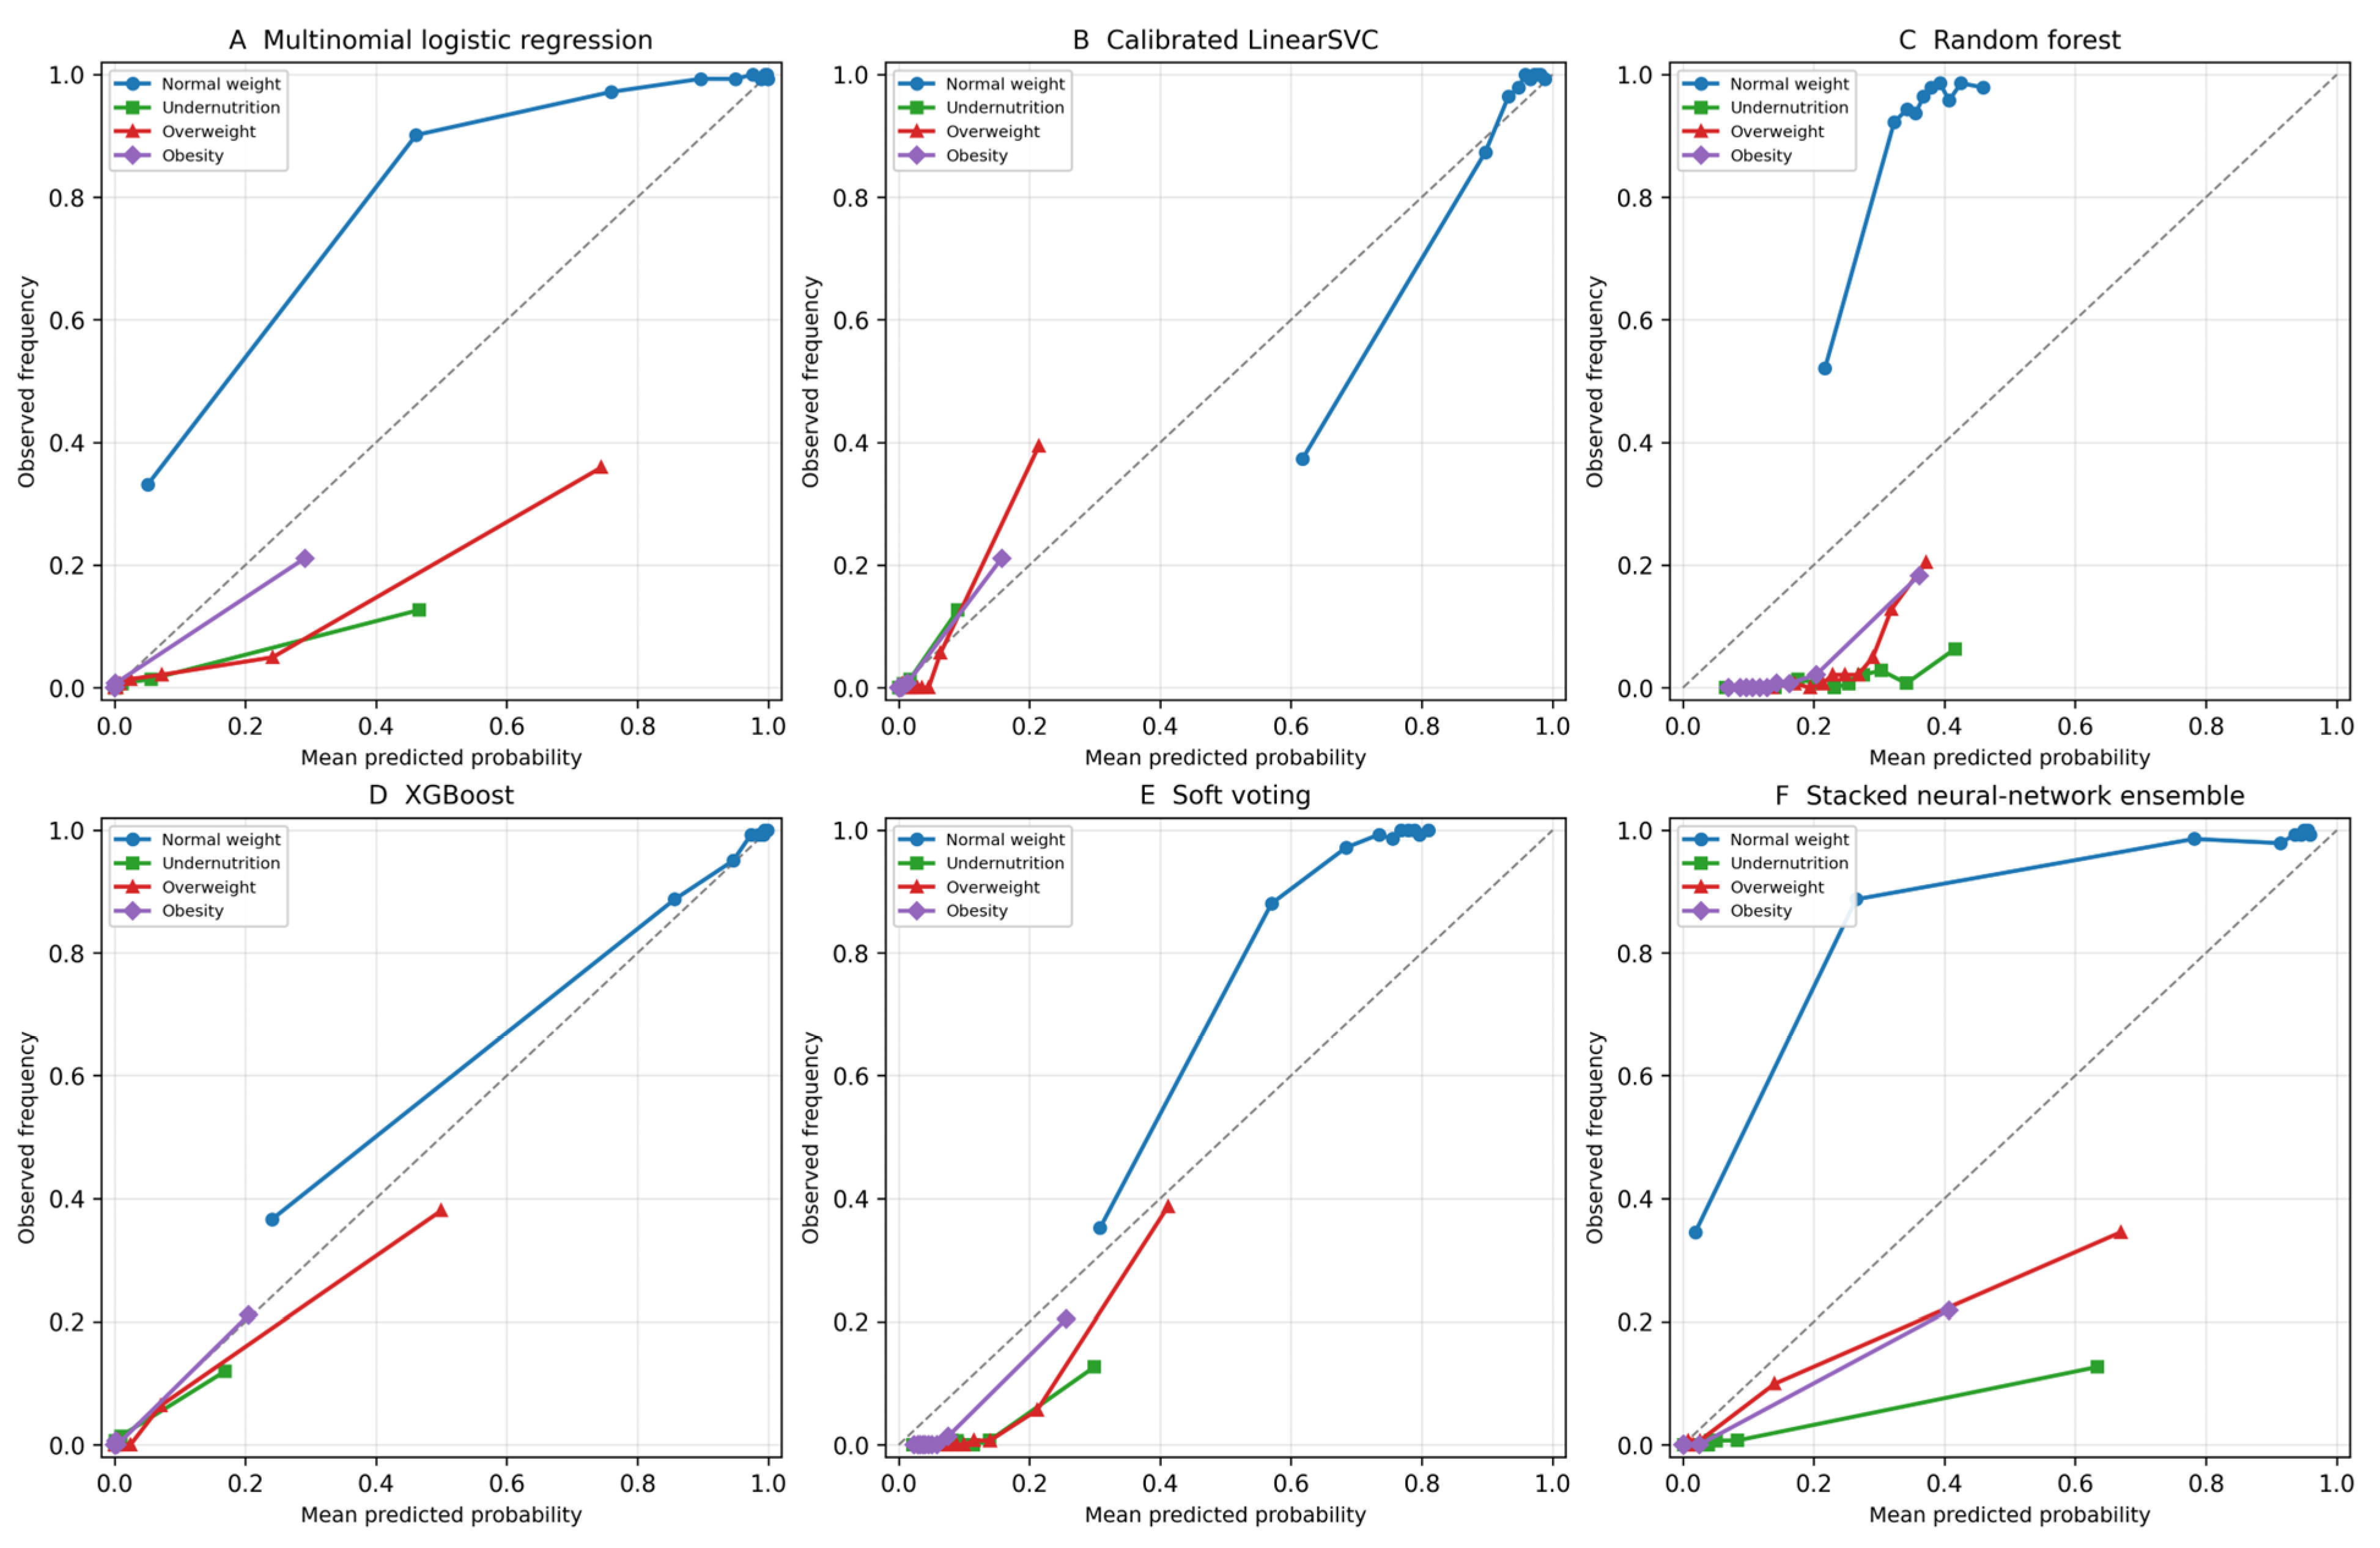

Disclaimer/Publisher’s Note: The statements, opinions and data contained in all publications are solely those of the individual author(s) and contributor(s) and not of MDPI and/or the editor(s). MDPI and/or the editor(s) disclaim responsibility for any injury to people or property resulting from any ideas, methods, instructions or products referred to in the content. |
© 2026 by the authors. Licensee MDPI, Basel, Switzerland. This article is an open access article distributed under the terms and conditions of the Creative Commons Attribution (CC BY) license.