


Simple Summary
Pancreatic cancer is among the deadliest cancers, and patients respond differently to treatment. A gene activity test called PurIST classifies pancreatic tumors as classical or basal-like and rates its confidence in each call as strong, likely, or lean. Clinical trials are using this test to guide chemotherapy, yet it has not been systematically evaluated in Appalachia, a largely rural region with a high cancer burden and limited access to specialized care. We evaluated the distribution of PurIST tumor subtype predictions across tumors from 780 patients at 13 cancer centers. Subtype frequencies did not differ by region. However, Appalachian tumors were more often classified with strong confidence, although sequencing metrics were often better in non-Appalachian regions. Appalachian patients were younger at clinical record creation, were more likely to report smoking and less likely to report drinking alcohol. A small-sample exploratory analysis showed that older patients were more likely to have basal-like tumors than classical tumors. Understanding differences in expected patient demographics and population-specific variability in PurIST can help direct future PurIST implementation and development tailored to real-world populations from different regions.
Abstract
Background/Objectives: Pancreatic ductal adenocarcinoma (PDAC) is a deadly malignancy with poor prognosis. A transcriptomic-based algorithm called Purity Independent Subtyping of Tumors (PurIST) relies on transcriptomic expression of a defined set of genes to stratify PDAC into classical and basal-like molecular subtypes and assigns a confidence level to the subtypes as either “strong,” “likely,” or “lean.” In this retrospective study, we apply PurIST to Appalachian and non-Appalachian patient cohorts and assess differences between the two groups. Methods: This 13-site study includes 780 PDAC patients. Patients were divided into Appalachian and non-Appalachian cohorts according to Appalachian Regional Commission guidelines, and differences in PurIST classification, tobacco use, and alcohol use were analyzed. Results: Individuals from Appalachian regions were more likely to receive a subtype classification from PurIST with “strong” confidence as opposed to “likely” or “lean” (p = 0.018). Although all sequencing passed quality control, there were significantly more individuals with borderline sequencing metrics in Appalachia (p = 0.0015) and removing those individuals resulted in non-significant differences in PurIST confidence levels between the two populations (p = 0.11). We did not observe any significant difference between basal and classical subtype classification in Appalachia (p = 0.15). The age at clinical record creation in Appalachia was significantly younger than non-Appalachian regions (p = 0.00052), and an exploratory analysis showed that individuals aged ≥84 were significantly more likely to have basal-like tumor classifications (p = 0.0012). Appalachian patients were more likely to have a history of smoking (p = 0.018) and less likely to report alcohol consumption (p = 0.00023). Conclusions: We conducted the largest comparison of the PurIST algorithm in Appalachia to date and found that PurIST is more likely to have higher confidence in molecular subtype classifications for Appalachian PDAC tumors compared to non-Appalachian tumors, which may partly be due to the quality control thresholds for sequencing. If PurIST is to be considered as a prognostic or decision-making tool for PDAC patients, we must account for variability in sequencing and expression patterns between different populations and institutions.
1. Introduction
Pancreatic ductal adenocarcinoma (PDAC) has a 5-year survival of ~13% in the United States and remains a leading cause of cancer mortality, resulting in ~50,000 deaths per year [1]. Current chemotherapy regimens include modified 5-fluorouracil, oxaliplatin, leucovorin, and irinotecan (mFOLFIRINOX) [2,3], NALIRIFOX [4,5,6], or gemcitabine with albumin-bound paclitaxel [7]. Inconsistent treatment outcomes have driven efforts to develop biologically guided strategies for prognosis and chemotherapy selection, which rely on accurate tumor subtype classification. The Purity Independent Subtyping of Tumors (PurIST) classifier [8], a single-sample classifier for pancreatic cancer, relies on top scoring of relative ranks of gene expression magnitudes compared to previously defined PDAC transcriptomic expression profiles [9,10,11] to stratify PDAC tumor samples into classical and basal-like molecular subtypes. In retrospective studies utilizing the PurIST classifier, patients with basal-like tumors had worse outcomes, regardless of which first-line chemotherapy was received [12,13]. Ongoing prospective clinical trials are utilizing PurIST to guide clinical chemotherapy decisions and prognosis [14,15]. While these studies have been conducted in large-volume retrospective cohorts, the applicability of PurIST to real-world patient cohorts in regionally defined areas such as Appalachia has not yet been established.
The Appalachian region stretches across 13 states, extending from northern Mississippi to southern New York [16]. Appalachian patients are often localized to rural areas, and many people live two or more hours away from tertiary care facilities and/or National Cancer Institute-designated Comprehensive Cancer Centers [17]. Although there has been a notable reduction in all-cause and cancer mortality nationwide, the decline of cancer mortality in Appalachia has occurred at a slower rate [18]. High cancer burden in the Appalachian population has been linked to health behaviors, social determinants of health, and diminished access to tertiary care facilities [18,19]. Additional contributing factors include screening rate disparities, high obesity rates, increased tobacco use, unfavorable economic conditions, environmental exposures, and regional lack of primary care physicians [18,19,20,21,22]. It is unclear if population-specific molecular and transcriptomic risk factors drive prognosis and treatment response in Appalachia. Therefore, this work assesses the PurIST algorithm in Appalachia to determine if population-specific biases should be considered to ensure that the standard of care and patient outcomes are comparable in this region compared to the rest of the United States. Here, we outline differences in cancer risk factors and molecular subtypes observed between Appalachian and non-Appalachian populations.
2. Materials and Methods
2.1. Cohort Design
2.1.1. ORIEN Avatar Project
The Oncology Research Information Exchange Network (ORIEN) [23] is an alliance of United States cancer centers established in 2014. All ORIEN alliance members utilize a standard Total Cancer Care ® (TCC) protocol or biospecimen collection protocol that share common core elements with the TCC protocol [24]. TCC-consented patients with biospecimens available and who meet eligibility criteria may be included into the ORIEN Avatar Project, which includes research use only grade RNA sequencing and a collection of deep longitudinal clinical data with lifetime follow up. Some patients have more available annotated clinical data than others.
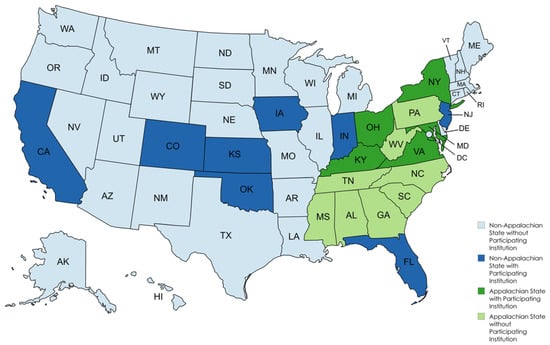
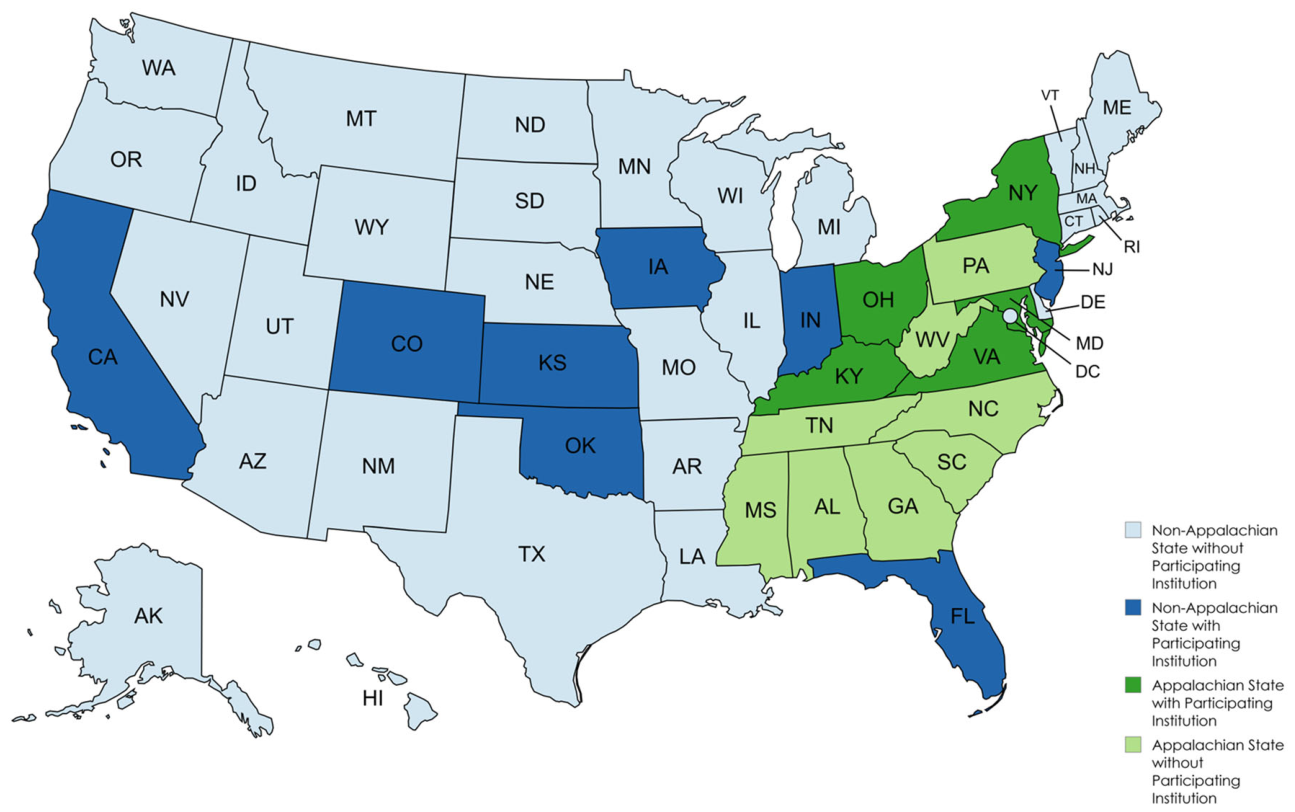
This 13-site retrospective study includes 780 ORIEN PDAC patients with data collected via the TCC protocol. This protocol is a longitudinal study which collects tissue and blood biospecimens as well as clinical data via ORIEN with Aster Insights (Figure 1; Table 1). The ORIEN sequencing program standardizes data collection and sequencing across collection sites to minimize potential batch or site effects.
Figure 1.
Map of the United States denoting Appalachian and non-Appalachian states according to Appalachian Regional Commission guidelines. Appalachian states with participating ORIEN institutions are dark green. Non-Appalachian states with participating ORIEN institutions are dark blue.
Table 1.
Participating ORIEN Institutions.
Although the ORIEN network includes data from patients diagnosed with cancer at any age, this study focused exclusively on adults (age ≥ 18), who were capable of signing informed consent and research authorization forms in either English or Spanish. Enrolled patients also must have received clinical care at a participating ORIEN institution and have been diagnosed with PDAC. No other inclusion criteria were used (Table 2).
Table 2.
Patient inclusion criteria. No additional inclusion or exclusion criteria were used.
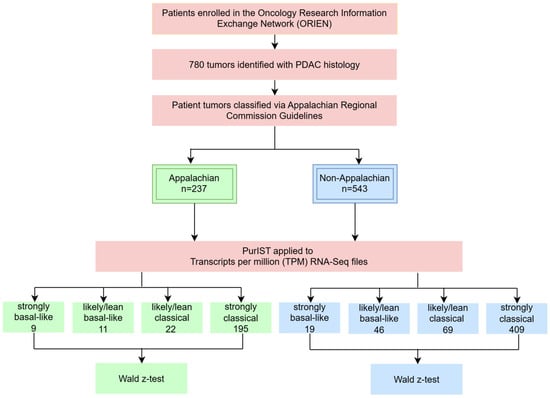
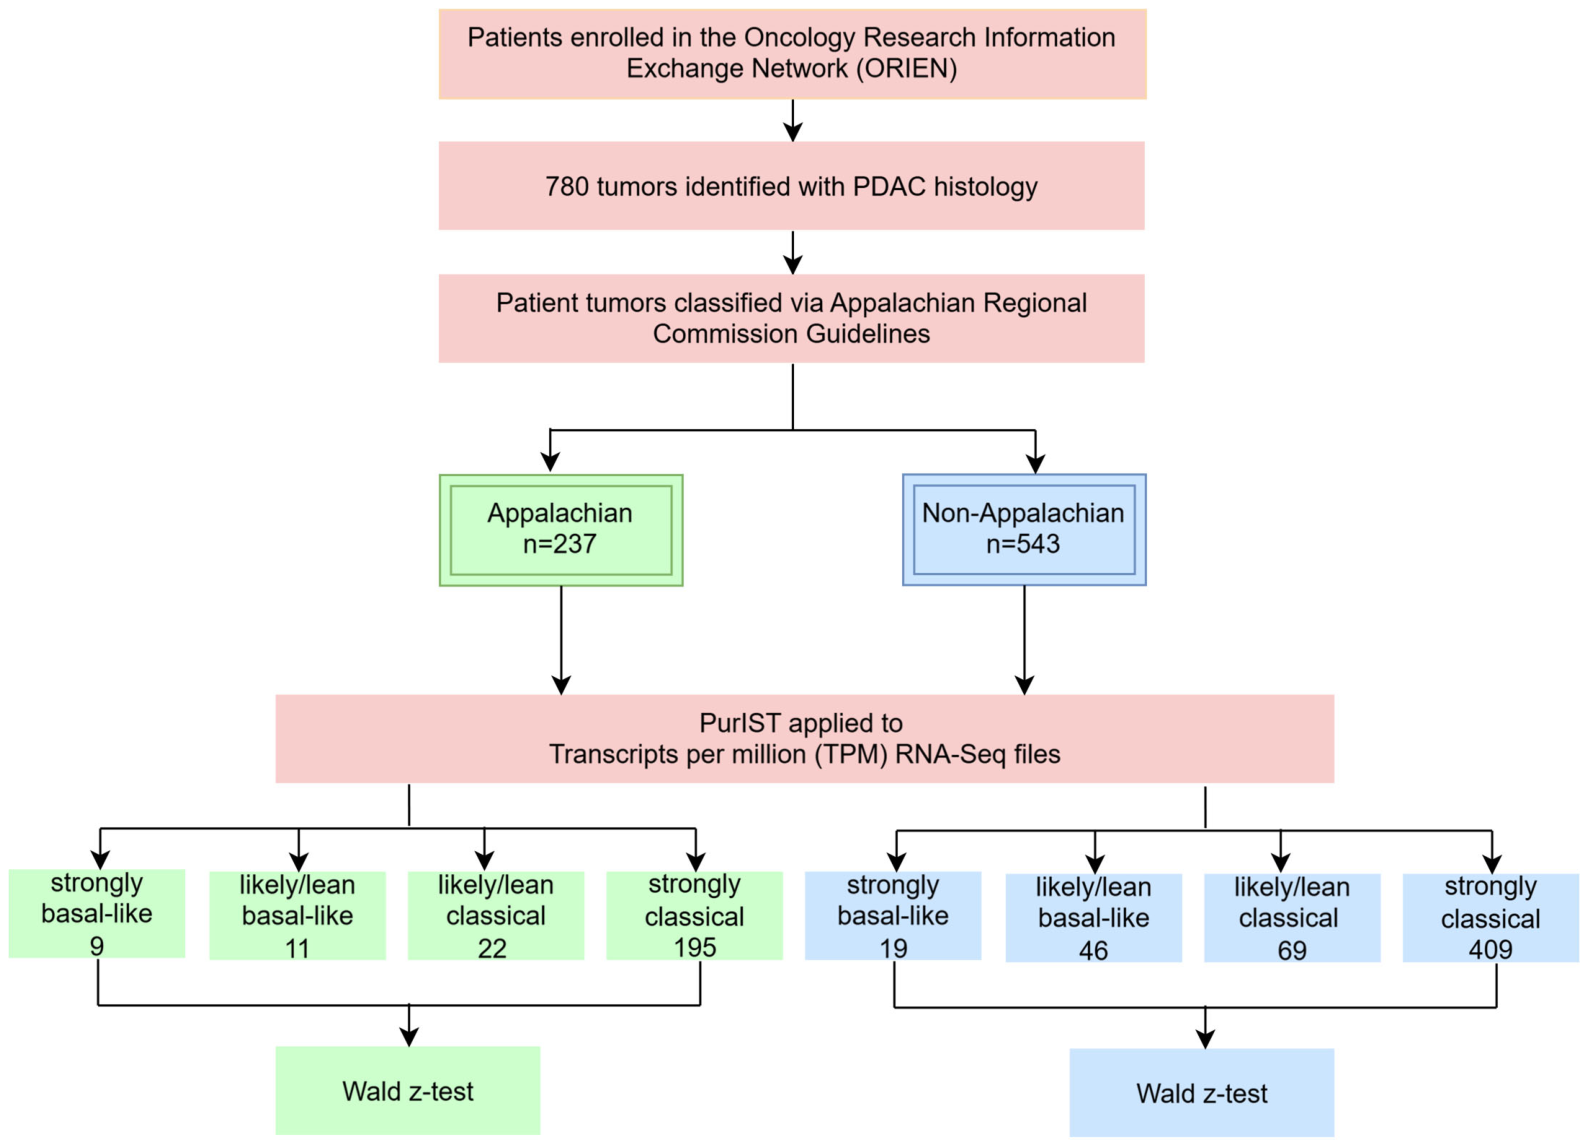
Patients with PDAC histology were divided into two cohorts, Appalachian and non-Appalachian, following guidelines from the Appalachian Regional Commission, which defined Appalachia as a 206,000-square-mile region spanning 13 states [16] (Figure 1). Specifically, individuals who received treatment at a site that was labeled as “Appalachian,” “From site with Appalachia regions,” “Partially,” or “Yes” were considered Appalachian. Individuals receiving treatment at a site labeled as “From site entirely out of Appalachia” or “No” were considered non-Appalachian. Figure 2 diagrams the study overview and includes the number of tumors analyzed from each region and their corresponding PurIST classifications.
Figure 2.
Study Overview. PurIST, purity independent subtyping of tumors. Samples that PurIST classified with confidence levels of “lean” and “likely” were combined due to the limited number of samples classified as “lean.” Pink boxes show steps that are done to all samples. Green boxes show steps that are unique to Appalachian patients. Blue boxes show steps that are unique to non-Appalachian patients.
Since previous studies have linked smoking and heavy drinking to differences in PDAC incidence rates [25], we used a Wald z-test analysis comparing differences in the self-reported incidence of tobacco and alcohol use from individuals within our cohort from Appalachian regions compared with non-Appalachian regions.
Although there were 814 sample IDs (SLIDs), 34 individuals were sequenced multiple times. To account for sample inflation, we matched the duplicate ORIEN Avatar IDs to the SLIDs and ensured that only the first entry was included in downstream analyses. We determined that this choice would have no effect on downstream analyses since all 34 individuals had the same reported PurIST molecular subtype classification regardless of when the sample was collected.
2.1.2. Running the PurIST Algorithm
The PurIST algorithm and all associated resource files were downloaded from https://github.com/naimurashid/PurIST on 21 July 2025. PurIST includes a pre-defined list of 16 genes: ANXA10, BCAR3, C16orf74, CLDN18, CLRN3, DDC, GATA6, GPR87, ITGA3, KRT5, KRT6A, LGALS4, PTGES, REG4, S100A2, SLC40A1. Quality control (QC) metrics for the RNA-seq data were previously computed by Aster Insights, and Table 3 shows the QC thresholds that were set.
Table 3.
Quality control thresholds for RNA-seq data.
None of the samples failed any QC metric; however, 59 samples had a FLAG for at least one metric. The QC thresholds were set by the ORIEN network and indicate optimal sequencing metrics. A FLAG means that the sequencing had borderline QC metrics yet still passed the low QC threshold. While we recognize that the likelihood of unintended sequencing issues increases when QC metrics are in the FLAG threshold as opposed to the PASS threshold, we also wanted to evaluate a real-world scenario in which PurIST was applied to research-grade sequencing data. Therefore, we assessed if the samples with sequencing FLAGs were more likely to show outlier expression values than samples without FLAGs, which might indicate a systematic issue that could limit the PurIST algorithm from returning accurate results. We performed an outlier assessment for each of the 16 genes required by the PurIST algorithm using the transcripts per million (TPM) values. We found that 125 out of 814 total samples (including individuals who were sequenced multiple times since some, but not all, of those individuals had a FLAG for one sample and PASS for another) had outlier gene expression for at least one gene. Of those 125 samples, 12/125 (9.6%) had a FLAG in the QC metric column, whereas 47/689 (6.82%) of the samples without any outlier gene expression had a FLAG in the QC metric column. There was no significant difference between those two groups (p = 0.27). However, there was a significant difference between the proportion of Appalachian (29/237; 12.2%) and non-Appalachian (30/543; 5.5%) individuals with a FLAG in the QC metric column (p = 0.0015; Odds ratio = 2.38 [95% CI = 1.40–4.07]). Although samples with a FLAG still passed QC, we assessed whether our main findings would change based on including or excluding those samples from our analyses.
As suggested in the PurIST GitHub documentation (https://github.com/naimurashid/PurIST#important-note-for-rna-seq; Accessed 12 November 2026), PurIST was run using the TPM values to classify tumors on a continuum that natively reports molecular subtypes as strong classical, likely classical, lean classical, lean basal-like, likely basal-like, and strong basal-like. A Wald z-test was used to determine if the distribution of classical and basal-like tumors observed among patients from Appalachia differed from non-Appalachian patients, if molecular subtypes differed in older individuals, and if the PurIST score confidence differed by geographic location. Odds ratios were calculated from the contingency table by first calculating the odds of each variable for each population and then calculating the ratio of those odds. For smoking and alcohol consumption, individuals with unknown values were removed from the z-test analyses but are still reported in the tables. Additionally, the “Current” and “Former/Ever” categories were combined for the z-tests yet separated for the tables.
2.2. Statistical Analyses
All Wald z-test p-values, odds ratios, and confidence intervals were calculated using MedCalc v24.0.4 [26]. Since the Shapiro–Wilk test for normality [27] showed that the distribution of age at clinical record creation across the ORIEN cohort are not normally distributed (all tests have p < 0.05), the Mann–Whitney U nonparametric test [28] was calculated using scipy version 1.16.0 [29] in Python version 3.12.8. Fourteen individuals were originally labeled as “Age 90 or older” and were changed to “90” for these comparisons. The age at last contact was used for three individuals from non-Appalachian regions that were annotated as “Age Unknown/Not Recorded” for the age at clinical record creation.
Some of the reported analyses could be considered post hoc comparisons and would require correcting for multiple hypothesis testing or making the alpha value (α) more stringent. We evaluated the number basal-like and classical tumors at 30 thresholds spanning age 60 to 90, which corresponds with a median age at pancreatic cancer diagnosis of 71 years of age [30]. Using a Bonferroni correction, α is set to 0.05/30 = 0.0017.
Combining the “likely” and “lean” groups is post hoc, yet necessary due to very few individuals having tumors classified with “lean” (9 Appalachian and 32 non-Appalachian; ~5% of all classifications) and “likely” (24 Appalachian and 83 non-Appalachian; ~14% of all classifications) confidence. In comparison, 204 Appalachian and 428 non-Appalachian (~81% of all classifications) had “strong” confidence. Therefore, due to relatively small sample sizes in the “lean” and “likely” groups and to limit the effects of class imbalance, “likely” and “lean” groups were combined for all analyses. However, we opted to keep the “likely” and “lean” groups separated in each table for transparency. Due to the limited available sample size and potential for overfitting, multivariable analyses were not conducted.
G*POWER version 3.1 [31] confirms 0.80 power to detect an effect size ≥ 0.10 for a standard 2 × 2 contingency table when the sample size = 780 and α = 0.05 using a goodness-of-fit test; 0.95 power is obtained with effect sizes ≥ 0.13. For the age analyses, G*POWER version 3.1 confirms 0.80 power to detect effect sizes ≥0.10 when the total sample size = 780; 0.95 power is obtained with effect sizes ≥ 0.128.
3. Results
Of the 780 patients included in the study population and assessed using PurIST, 237 were from Appalachia and 543 were from outside of the Appalachian region. A Mann–Whitney U test showed that the distribution of ages at clinical record creation in Appalachia (mean age = 64.40 ± 12.60) was significantly lower than non-Appalachian regions (mean age = 68.0 ± 12.40; Mann–Whitney U p = 0.00052). However, individuals in Appalachia had a non-significant difference in the age at last contact compared to non-Appalachian regions (Appalachian age at last contact: 66.19 ± 12.35; non-Appalachian age at last contact: 68.05 ± 12.02; p = 0.078). There was not a significant difference in the female–male ratio in Appalachia (103:134; 43.5% female) compared to non-Appalachian regions (269:274; 49.5% female; p = 0.12; odds ratio = 1.28 [95% CI = 0.94–1.74]).
The observed difference in the proportion of Appalachian tumors classified as the classical molecular subtype was not significantly different than non-Appalachian tumors (p = 0.15). A total of 695 (89.10%) were classified as classical (604 strong classical, including 195 Appalachian and 409 non-Appalachian) and 85 (10.90%) were classified as basal-like (28 strong basal-like, including 9 Appalachian and 19 non-Appalachian) (Table 4).
Table 4.
PurIST Tumor Molecular Subtype Classification with Confidence Level. Number of tumor subtypes by region with and without excluding sequencing FLAGs.
A z-test showed that individuals in Appalachia were significantly more frequently classified with a “strong” confidence in the reported molecular subtype (either classical or basal-like) compared to individuals from non-Appalachian regions; conversely, tumors of individuals from non-Appalachian regions were significantly more frequently classified with lower confidence “likely” or “lean” subtype classifications (p = 0.018; odds ratio = 1.66 [95% CI = 1.09–2.53]).
Regional differences in individuals with a sequencing FLAG exist: 29/237 (12.2%) of Appalachian and 30/543 (5.5%) of non-Appalachian samples had sequencing FLAGs (p = 0.0015; odds ratio= 2.38 [95% CI = 1.40–4.07]). Excluding individuals with a sequencing FLAG resulted in non-significant differences in high-confidence molecular subtypes between Appalachian individuals and non-Appalachian individuals (p = 0.11; odds ratio = 1.43 [95% CI = 0.9252–2.22]).
In total, PurIST classifications with “strong” confidence designations were made for 204 out of 237 (86.1%) Appalachian and 428 out of 543 (78.8%) of non-Appalachian individuals. This study could not assess the clinical relevance of the differences between “strong” and “likely/lean” subtype classifications due to most individuals lacking longitudinal data regarding clinical treatment and outcomes.
Additionally, Appalachian patients were significantly more likely to report a history of smoking (Current/Former/Ever 59.6% in Appalachia vs. 49.9% in non-Appalachian regions; p = 0.018; odds ratio = 1.48 [95% CI = 1.07–2.05]; Table 5) and less likely to report a history of alcohol consumption (Current/Former/Ever 50.5% in Appalachia vs. 65.6% in non-Appalachian regions; p = 0.00023; odds ratio = 0.53 [95% CI = 0.38–0.75]; Table 6).
Table 5.
Reported Smoking Status in ORIEN Cohort. Patient smoking status by region. Appalachian patients were significantly more likely to report a history of smoking (Current/Former/Ever 59.6% in Appalachia vs. 49.9% in non-Appalachian regions; p = 0.018; odds ratio = 1.48 [95% CI = 1.07–2.05]).
Table 6.
Reported Alcohol Use in ORIEN Cohort. Patient reported alcohol use by region. Appalachian patients were less likely to report alcohol consumption (Current/Former/Ever 50.5% in Appalachia vs. 65.6% in non-Appalachian regions; p = 0.00023; odds ratio = 0.53 [95% CI = 0.38–0.75]).
Significantly more basal-like tumors were identified in individuals with age at clinical record creation ≥ 84 (Table 7; p = 0.0012; odds ratio = 3.04 [95% CI: 1.55–5.95]). Excluding individuals with a sequencing FLAG resulted in age ≥ 84 was still significantly associated with basal-like tumors in the ORIEN cohort (p = 0.0016; odds ratio = 3.11 [95% CI: 1.54–6.27]) when α = 0.0017.
Table 7.
PDAC Tumor Subtypes by Age at Clinical Record Creation. Individuals age ≥84 are more likely to have a basal-like PDAC molecular tumor subtype than a classical subtype with (p = 0.0012; odds ratio = 3.037 [95% CI: 1.55–5.95]) or without including sequencing FLAG samples (p = 0.0016; odds ratio = 3.11 [95% CI: 1.54–6.27]).
4. Discussion
Our analysis includes the first real-world evaluation of the PurIST classifier using the ORIEN cohort, and the only systematic analysis of PurIST in the Appalachian region to date. Appalachia is a historically understudied region with distinct socioeconomic, demographic, and environmental challenges which may influence tumor biology and treatment response [32]. Patients in Appalachia often experience substantially limited specialty cancer care, often due to geographic disparities [33,34]. Prior PurIST evaluations have not accounted for the possibility of regional differences, and our findings begin to address this by accounting for demographic variability. Other historically underrepresented racial, ethnic, and geographically defined populations may also benefit from further PurIST analysis to assess diagnostic outcomes in each population.
When we applied the PurIST classifier to Appalachian and non-Appalachian cohorts, we found that a larger proportion of Appalachian tumors were able to be successfully classified into either strongly basal-like or strongly classical compared to non-Appalachian tumors. Significantly fewer patients were likely to be classified into lean or likely categories. One hypothesis is that this could reflect stronger subtype-defining expression patterns or greater transcriptional polarization in Appalachia, although this interpretation requires additional validation in larger cohorts. All samples passed QC. However, removing samples that were flagged for borderline QC metrics did change the interpretation of our results, indicating that samples with borderline QC metrics might impact PurIST output or the result may be due to a limited sample size.
An exploratory analysis of older patients showed that individuals age ≥84 were significantly more likely to have PDAC tumors classified as basal-like compared to classical. Although this finding contrasts with prior large molecular subtyping studies [12,13] that did not identify associations of age with subtype, this raises the possibility that older patients may exhibit basal-like transcriptional characteristics.
Additionally, although known cancer risk factors such as smoking and alcohol use are more prevalent in Appalachian regions [19,20], Appalachian PDAC patients in the ORIEN network were less likely to report alcohol use than non-Appalachian patients. While Appalachian patients were more likely to report a history of smoking than non-Appalachian patients, the difference in reporting alcohol consumption is unclear. If true, the higher PDAC mortality rate in Appalachia [20] may be associated with additional variables beyond that of alcohol use.
When evaluating our entire cohort, there was a non-significant increase in the expression of the classical subtype across all populations. This finding is consistent with prior published retrospective analyses [12,13]. Unlike those previous studies, the observed differences in tumor molecular subtypes were not significant, which could at least partially be explained by our study not filtering patients by ECOG status. Prior and ongoing large-scale PurIST analyses, along with the PASS-01 trial [35] and retrospective analysis of the COMPASS trial cohort [36], restrict their analyses to patients with ECOG of 0–1, which may also explain the higher proportion of classical tumor subtypes observed in our cohort. Historically, individuals with ECOG 0–1 are considered candidates for intensive cytotoxic chemotherapy and are more likely to be eligible for clinical trials [7]. Restricting by ECOG status may not accurately reflect which patients could be offered PurIST as a test in the medical oncology clinical setting. Furthermore, ECOG status was not available for a proportion of our patients and thus excluding patients on the basis of ECOG from this study would have limited the statistical power of our analyses. Since PurIST is currently available to order as a test by medical oncologists in clinical practice without requiring ECOG status [37], we felt that our inclusion criteria most accurately reflected the real-world PurIST use case.
Our inclusion criteria were specifically designed to test population-specific differences in PurIST molecular subtyping using real-world data, which does not always include germline sequencing. Therefore, unlike previous studies [12,13] which excluded individuals with germline alterations in BRCA1, BRCA2, PALB2, and other DNA damage repair genes, our study did not exclude those individuals. By casting a wider net using more inclusive criteria, our study captures clinical variability observed in routine management of patients with PDAC and is more representative of a real-world population of patients who could be offered PurIST as a clinical test.
Limitations and Future Directions
Though our study included several participating institutions from the Appalachian states of Ohio, Kentucky, Virginia, New York, and Maryland, there were no participating institutions from Pennsylvania, West Virginia, Tennessee, North Carolina, South Carolina, Mississippi, Alabama, and Georgia. This is an inherent limitation of our study that cannot be overcome through the ORIEN network. Future clinical integration and data sharing policies should be explored to include those additional states and additional sites within each state, with particular attention to West Virginia, as West Virginia is the only US state in which all counties are considered Appalachian.
Although this study presents the largest comparison of PurIST molecular subtyping in the Appalachian region to date, we recognize that the ORIEN dataset has a limited number of PDAC patients from Appalachia, which may result in either false positive or false negative findings based on potential recruitment biases. To minimize selection bias, all PDAC patients were offered the opportunity to participate in ORIEN, and all available samples were included in this work. We recognize that patients still needed to travel to academic research centers and have adequate samples for sequencing, which cannot fully rule out selection bias. Future research expanding the collection of additional transcriptomic data from both Appalachian and non-Appalachian PDAC patients will help ensure that the PurIST algorithm provides equitable results to all populations.
Given the limited available sample size and relatively few basal-like tumors classified in both the Appalachian (20 tumors) and non-Appalachian (65 tumors) regions, we could not adjust for potential confounding variable without risking overfitting the model to our dataset. Therefore, many confounding factors might influence these results and should be considered in future retrospective analyses. With a larger sample size, we could appropriately adjust our analyses for age, sex, race, ethnicity, smoking, alcohol use, disease stage, institution, state, county, sample type (primary vs. metastasis), treatment history, germline variants, histological characteristics, tumor cellularity, and other demographic variables. Those factors could also potentially be added to PurIST in future iterations of the algorithm.
We also recognize that the available smoking history data were limited to pre-defined categories that may not adequately reflect differences between casual and heavy smokers. Pack-years would be a more appropriate measurement and could provide additional insight into differences in PDAC risk.
Additionally, a statistical difference in PurIST classifications with strong confidence may not result in a clinically meaningful difference in treatment compared to individuals with a lean/likely classification. Although our study was not designed to evaluate treatment outcomes, the observed regional differences in PurIST classification confidence suggest that population-specific variation may influence how molecular subtyping performs across patient groups. Given the observed differences in reported smoking and alcohol use in Appalachia and the widespread genome-wide impact of both smoking and alcohol use on DNA methylation [38], it is possible that regional differences in lifestyle choices might at least partially explain the observed differences in PurIST molecular tumor subtype confidence based on gene expression profiles. Recent therapeutic advances in PDAC, including improved overall and progression-free survival with daraxonrasib in patients with KRAS-mutant metastatic tumors [39], heighten the need to ensure molecular stratification guides the most appropriate treatment selection for all individuals. Future studies should assess whether treatment response differs between tumors assigned “strong” versus “likely/lean” subtype classifications and whether current molecular subtyping approaches adequately stratify PDAC risk and therapeutic benefit in Appalachian and other understudied populations.
5. Conclusions
We conducted the largest comparison of the PurIST algorithm in Appalachia to date. Although our analyses still included a relatively small sample size from Appalachia and sequencing metrics were often better in non-Appalachian regions, we found that Appalachian tumors were significantly more likely than non-Appalachian tumors to receive a strong-confidence PurIST classification, whether classical or basal-like. We also found that older patients aged ≥84 were significantly more likely to exhibit the basal-like tumor subtype, although future work should validate this finding given the limited sample size in our cohort. Importantly, our dataset reflects the clinical variability seen in real-world patient populations, rather than narrowly defined clinical trial cohorts. These results underscore the importance of considering population-specific factors when implementing PurIST as a prognostic or treatment selection tool for PDAC patients. Future research should continue to address regional and demographic variability to ensure effective clinical decision-making, including clearer interpretation of the differences between PurIST classifications with lean, likely, or strong confidence.
Author Contributions
Conceptualization, C.M.W., R.A.P., M.J.C., D.B.A. and J.B.M.; methodology, C.M.W. and J.B.M.; software, C.M.W. and J.B.M.; validation, C.M.W. and J.B.M.; formal analysis, C.M.W. and J.B.M.; investigation, C.M.W., R.A.P., N.L., C.K., M.J.C., J.K., P.K.P., D.B.A. and J.B.M.; resources, M.J.C., J.K., E.B.T., T.B.d.C., A.M., R.J.R., P.M.B., C.H.F.C., M.R., D.V., D.W.K., M.L.C., D.B.A. and J.B.M.; data curation, C.M.W., R.J.R. and J.B.M.; writing—original draft preparation, C.M.W., R.A.P., N.L., C.K., M.J.C., J.K., P.K.P., E.B.T., T.B.d.C., A.M., R.J.R., P.M.B., C.H.F.C., M.R., D.V., D.W.K., M.L.C., D.B.A. and J.B.M.; writing—review and editing, C.M.W., R.A.P., N.L., C.K., M.J.C., J.K., PKP, E.B.T., T.B.d.C., A.M., R.J.R., P.M.B., C.H.F.C., M.R., D.V., D.W.K., M.L.C., D.B.A. and J.B.M.; visualization, C.M.W. and J.B.M.; supervision, C.M.W., M.J.C., D.B.A. and J.B.M.; project administration, C.M.W., M.J.C., D.B.A. and J.B.M.; funding acquisition, C.M.W. and J.B.M. All authors have read and agreed to the published version of the manuscript.
Funding
This project was funded by a Markey Cancer Center Scientist in Training Award to CMW from the University of Kentucky.
Institutional Review Board Statement
The Institutional Review Board determined that this study qualifies for Exemption Category 4 because it uses only de-identified data for secondary analyses.
Informed Consent Statement
Informed consent was obtained from all subjects involved in the study through the 13 sites involved in ORIEN.
Data Availability Statement
The data used in this research was generated through private funding by Aster Insights in collaboration with ORIEN. Requests for access to the data used in this study can be submitted to ResearchDataRequest@AsterInsights.com.
Acknowledgments
The authors would like to acknowledge the contributions of research participants involved in ORIEN, without which, this work would not be possible.
Conflicts of Interest
RJR and MLC are currently employed by Aster Insights, which is a private company researching ways to accelerate cancer drug discovery and precision medicine. The funders had no role in the design of the study; in the collection, analyses, or interpretation of data; in the writing of the manuscript; or in the decision to publish the results.
Abbreviations
The following abbreviations are used in this manuscript:
| PDAC | Pancreatic ductal adenocarcinoma |
| ECOG | Eastern Cooperative Oncology Group |
| ORIEN | Oncology Research Information Exchange Network |
| PurIST | Purity Independent Subtyping of Tumors |
| mFOLFIRINOX | modified 5-fluorouracil, oxaliplatin, leucovorin, and irinotecan |
| TCC | Total Cancer Care ® |
| SLID | Sample ID |
| QC | Quality control |
| TPM | Transcripts per million |
References
- Murphy, P.K.; Sellers, M.E.; Bonds, S.H.; Scott, S. The SEER Program’s longstanding commitment to making cancer resources available. JNCI Monogr. 2024, 2024, 118–122. [Google Scholar] [CrossRef] [Scilit] [PubMed]
- Katz, M.H.; Shi, Q.; Meyers, J.; Herman, J.M.; Chuong, M.; Wolpin, B.M.; Ahmad, S.; Marsh, R.; Schwartz, L.; Behr, S. Efficacy of preoperative mFOLFIRINOX vs mFOLFIRINOX plus hypofractionated radiotherapy for borderline resectable adenocarcinoma of the pancreas: The A021501 phase 2 randomized clinical trial. JAMA Oncol. 2022, 8, 1263–1270. [Google Scholar] [PubMed]
- Conroy, T.; Desseigne, F.; Ychou, M.; Bouché, O.; Guimbaud, R.; Bécouarn, Y.; Adenis, A.; Raoul, J.-L.; Gourgou-Bourgade, S.; de la Fouchardière, C.; et al. FOLFIRINOX versus Gemcitabine for Metastatic Pancreatic Cancer. N. Engl. J. Med. 2011, 364, 1817–1825. [Google Scholar] [CrossRef] [Scilit] [PubMed]
- Wang, Y.; Liu, J.; Wang, J.; Liu, X.; Zhang, J.; Chen, D. Comparative efficacy and safety of NALIRIFOX versus other first-line chemotherapy regimens in metastatic pancreatic ductal adenocarcinoma: A retrospective study. Ther. Adv. Med. Oncol. 2026, 18, 17588359261449092. [Google Scholar] [CrossRef] [Scilit] [PubMed]
- George, T.J.; Lin, T.; Nassour, I.; Rogers, S.C.; Jang, T.; Sahin, I.; Ramnaraign, B.H.; Fabregas, J.; Hitchcock, K.; Liu, G. Use of liposomal irinotecan with 5-FU and oxaliplatin (NALIRIFOX) in neoadjuvant pancreatic adenocarcinoma: NEO-Nal-IRI trial. Oncologist 2026, 31, oyag250. [Google Scholar] [CrossRef] [Scilit] [PubMed]
- Wainberg, Z.A.; Melisi, D.; Macarulla, T.; Pazo Cid, R.; Chandana, S.R.; De La Fouchardière, C.; Dean, A.; Kiss, I.; Lee, W.J.; Goetze, T.O.; et al. NALIRIFOX versus nab-paclitaxel and gemcitabine in treatment-naive patients with metastatic pancreatic ductal adenocarcinoma (NAPOLI 3): A randomised, open-label, phase 3 trial. Lancet 2023, 402, 1272–1281. [Google Scholar] [CrossRef] [Scilit] [PubMed]
- National Comprehensive Cancer Network (NCCN). NCCN Clinical Practice Guidelines in Oncology: Pancreatic Adenocarcinoma; NCCN: Montgomery, PA, USA, 2025. [Google Scholar]
- Rashid, N.U.; Peng, X.L.; Jin, C.; Moffitt, R.A.; Volmar, K.E.; Belt, B.A.; Panni, R.Z.; Nywening, T.M.; Herrera, S.G.; Moore, K.J.; et al. Purity Independent Subtyping of Tumors (PurIST), A Clinically Robust, Single-sample Classifier for Tumor Subtyping in Pancreatic Cancer. Clin. Cancer Res. 2020, 26, 82–92. [Google Scholar] [CrossRef] [Scilit] [PubMed]
- Moffitt, R.A.; Marayati, R.; Flate, E.L.; Volmar, K.E.; Loeza, S.G.; Hoadley, K.A.; Rashid, N.U.; Williams, L.A.; Eaton, S.C.; Chung, A.H.; et al. Virtual microdissection identifies distinct tumor- and stroma-specific subtypes of pancreatic ductal adenocarcinoma. Nat. Genet. 2015, 47, 1168–1178. [Google Scholar] [CrossRef] [Scilit] [PubMed]
- Collisson, E.A.; Sadanandam, A.; Olson, P.; Gibb, W.J.; Truitt, M.; Gu, S.; Cooc, J.; Weinkle, J.; Kim, G.E.; Jakkula, L.; et al. Subtypes of pancreatic ductal adenocarcinoma and their differing responses to therapy. Nat. Med. 2011, 17, 500–503. [Google Scholar] [CrossRef] [Scilit] [PubMed]
- Bailey, P.; Chang, D.K.; Nones, K.; Johns, A.L.; Patch, A.M.; Gingras, M.C.; Miller, D.K.; Christ, A.N.; Bruxner, T.J.; Quinn, M.C.; et al. Genomic analyses identify molecular subtypes of pancreatic cancer. Nature 2016, 531, 47–52. [Google Scholar] [CrossRef] [Scilit] [PubMed]
- Wenric, S.; Sangli, C.; Guittar, J.; Islam, F.; Zander, A.; Hyun, W.S.; Davison, M.J.; Mayhew, M.G.; Beebe, K.; Beauchamp, K.; et al. Real-World Validation of the Purity Independent Subtyping of Tumors Classifier for Informing Therapy Selection in Pancreatic Ductal Adenocarcinoma. JCO Precis. Oncol. 2025, 9, e2500197. [Google Scholar] [CrossRef] [Scilit] [PubMed]
- Singh, H.; Xiu, J.; Kapner, K.S.; Yuan, C.; Narayan, R.R.; Oberley, M.; Farrell, A.; Surana, R.; Huffman, B.M.; Perez, K.; et al. Clinical and Genomic Features of Classical and Basal Transcriptional Subtypes in Pancreatic Cancer. Clin. Cancer Res. 2024, 30, 4932–4942. [Google Scholar] [CrossRef] [Scilit] [PubMed]
- Basal-Like PDAC Treated with Gemcitabine, Erlotinib, and Nab-Paclitaxel (PANGEA Trial). Available online: https://clinicaltrials.gov/study/NCT06483555 (accessed on 22 February 2026).
- PurIST Classification-Guided Adaptive Neoadjuvant Chemotherapy by RNA Expression Profiling of EUS Aspiration Samples (PANCREAS). Available online: https://clinicaltrials.gov/study/NCT04683315 (accessed on 22 February 2026).
- Appalachian Regional Commission. About the Appalachian Region. Available online: https://www.arc.gov/about-the-appalachian-region/ (accessed on 27 February 2026).
- Shriver, P.S.; Sahar, L.; Wills, D.L.V.; Adams, V.D.; Fleury, E.M. Assessing populations with access to National Cancer Institute-funded sites using local distance-based service areas. J. Clin. Transl. Sci. 2025, 9, e218. [Google Scholar] [CrossRef] [Scilit] [PubMed]
- Burus, T.; Hull, C.P.; Kuhs, L.A.K.; Gao, T.; Brainson, F.C.; Evers, M.B. Examining Geographic Disparity: Variation in Cancer Outcomes Within Appalachia. J. Am. Coll. Surg. 2025, 240, 425–436. [Google Scholar] [CrossRef] [Scilit] [PubMed]
- Cassim, E.; McDonald, H.; Harper, M.; Chen, Q.; Lin, M.; Patel, R.; Cavnar, M.; Pandalai, P.; Huang, B.; Hull, P.C. Treatment at an Academic Medical Center Eliminates Survival Disparities for Appalachian Kentuckians with Pancreatic Ductal Adenocarcinoma. J. Appalach. Health 2024, 6, 6. [Google Scholar] [CrossRef] [Scilit] [PubMed]
- Blackley, D.; Behringer, B.; Zheng, S. Cancer Mortality Rates in Appalachia: Descriptive Epidemiology and an Approach to Explaining Differences in Outcomes. J. Community Health 2012, 37, 804–813. [Google Scholar] [CrossRef] [Scilit] [PubMed]
- Borgemenke, S.; Hughes, S.A. Social Determinants and Health Disparities Pertaining to Diabetes in Appalachia. J. Prim. Care Community Health 2023, 14, 21501319231192327. [Google Scholar] [CrossRef] [Scilit] [PubMed]
- Hudson, L.; Burus, T.; Park, L.; Huang, B.; Hull, C.P.; Vanderford, L.N. Cancer disparities in Appalachian Kentucky. J. Rural Health 2024, 40, 87–95. [Google Scholar] [CrossRef] [Scilit] [PubMed]
- Churchman, M.L.; Lu, X.; McKean, D.M.; Radmacher, M.D.; Zhang, Q.; Rounbehler, R.J.; Tan, A.C.; Shaw, T.I.; Obermayer, A.; Grass, G.D. The Oncology Research Information Exchange Network (ORIEN)-Building a Real-World Collaborative, Patient-driven Infrastructure for Discovery Research and Precision Oncology. Res. Sq. 2026, rs.3, rs-7077810. [Google Scholar] [CrossRef] [Scilit] [PubMed]
- INST UNM 1521: Total Cancer Care Protocol: A Lifetime Partnership with Patients Who Have or May be at Risk of Having Cancer. 2019. Available online: https://clinicaltrials.gov/study/NCT03977402 (accessed on 22 February 2026).
- Rassy, E.; Delaloge, S.; Slaouti, Y.; Pudlarz, T.; Lekens, B.; Boilève, A.; Michiels, S.; Karimi, M. Identifying health conditions associated with an increased risk of pancreatic ductal adenocarcinoma at medium term in nationwide electronic health records of primary care physicians. Br. J. Cancer 2025, 133, 1317–1325, Correction in Br. J. Cancer 2026, 135, 1178. [Google Scholar] [CrossRef] [Scilit] [PubMed]
- Calculator, O.R. MedCalc Software Ltd. Available online: https://www.medcalc.org/en/calc/odds_ratio.php (accessed on 27 October 2026).
- Ghasemi, A.; Zahediasl, S. Normality tests for statistical analysis: A guide for non-statisticians. Int. J. Endocrinol. Metab. 2012, 10, 486. [Google Scholar] [CrossRef] [Scilit] [PubMed]
- McKnight, P.E.; Najab, J. Mann-whitney U test. In The Corsini Encyclopedia of Psychology; John Wiley & Sons, Ltd.: London, UK, 2010. [Google Scholar] [CrossRef] [Scilit]
- Gommers, R.; Virtanen, P.; Haberland, M.; Burovski, E.; Reddy, T.; Weckesser, W.; Oliphant, T.E.; Nelson, A.; Cournapeau, D.; Roy, P. scipy/scipy: SciPy 1.16. 3. Zenodo. 2025. Available online: https://zenodo.org/records/17467817 (accessed on 22 February 2026).
- Luo, D.; Li, Y.; Yu, X.; Ji, L.; Gong, X. Early onset pancreatic cancer: A review. Transl. Oncol. 2025, 52, 102239. [Google Scholar] [CrossRef] [Scilit] [PubMed]
- Faul, F.; Erdfelder, E.; Buchner, A.; Lang, A.-G. Statistical power analyses using G* Power 3.1: Tests for correlation and regression analyses. Behav. Res. Methods 2009, 41, 1149–1160. [Google Scholar] [CrossRef] [Scilit] [PubMed]
- Sabharwal, K.; Garcia, O.; Miller, C.R. Appalachia’s worsening disparities in cancer mortality should be viewed as a regional manifestation of widening global disparities in health outcomes rather than a uniquely American phenomena. Lancet Reg. Health-Am. 2024, 37, 100861. [Google Scholar] [CrossRef] [Scilit] [PubMed]
- Segel, E.J.; Hollenbeak, S.C.; Gusani, J.N. Rural-Urban Disparities in Pancreatic Cancer Stage of Diagnosis: Understanding the Interaction With Medically Underserved Areas. J. Rural Health 2020, 36, 476–483. [Google Scholar] [CrossRef] [Scilit] [PubMed]
- Yao, N.; Alcalá, E.H.; Anderson, R.; Balkrishnan, R. Cancer Disparities in Rural Appalachia: Incidence, Early Detection, and Survivorship. J. Rural Health 2017, 33, 375–381. [Google Scholar] [CrossRef] [Scilit] [PubMed]
- Knox, J.J.; O’kane, G.; King, D.; Laheru, D.; Habowski, A.N.; Yu, K.; Perez, K.; Aguirre, A.J.; Coyne, Z.; Harvey, H. PASS-01: Randomized phase II trial of modified FOLFIRINOX versus gemcitabine/nab-paclitaxel and molecular correlatives for previously untreated metastatic pancreatic cancer. J. Clin. Oncol. 2025, 43, 3355–3368, Correction in J. Clin. Oncol. 2025, 43, 3325. [Google Scholar] [CrossRef] [Scilit] [PubMed]
- Knox, J.J.; Jang, G.H.; Grant, R.C.; Zhang, A.; Ma, L.; Elimova, E.; Jang, R.; Moore, M.; Biagi, J.; Tehfe, M.; et al. Whole genome and transcriptome profiling in advanced pancreatic cancer patients on the COMPASS trial. Nat. Commun. 2025, 16, 5919. [Google Scholar] [CrossRef] [Scilit] [PubMed]
- GeneCentric. PurIST. Available online: https://genecentric.com/purist/ (accessed on 7 November 2026).
- Carreras-Gallo, N.; Dwaraka, V.B.; Cáceres, A.; Smith, R.; Mendez, T.L.; Went, H.; Gonzalez, J.R. Impact of tobacco, alcohol, and marijuana on genome-wide DNA methylation and its relationship with hypertension. Epigenetics 2023, 18, 2214392. [Google Scholar] [CrossRef] [Scilit] [PubMed]
- O’Reilly, E.M.; Wainberg, Z.A.; Hendifar, A.E.; Borad, M.J.; Pietrantonio, F.; Pant, S.; Hammel, P.; Cremolini, C.; Manji, G.A.; Oberstein, P.E.; et al. Daraxonrasib or Chemotherapy in Previously Treated Metastatic Pancreatic Cancer. N. Engl. J. Med. 2026, 395, 325–337. [Google Scholar] [CrossRef] [Scilit] [PubMed]

Disclaimer/Publisher’s Note: The statements, opinions and data contained in all publications are solely those of the individual author(s) and contributor(s) and not of MDPI and/or the editor(s). MDPI and/or the editor(s) disclaim responsibility for any injury to people or property resulting from any ideas, methods, instructions or products referred to in the content. |
© 2026 by the authors. Licensee MDPI, Basel, Switzerland. This article is an open access article distributed under the terms and conditions of the Creative Commons Attribution (CC BY) license.