


Simple Summary
Pancreatic cancer is one of the deadliest cancers, and most patients survive less than two years after diagnosis. Doctors know that certain genetic changes are common in these tumors, but these changes do not fully explain why some patients live much longer than others. We studied whether combinations of genetic changes, rather than single ones, better predict how aggressively a tumor behaves. Analyzing thousands of patient tumors from public databases, we found that a change in one gene, ARID1A, was not harmful on its own but was linked to markedly shorter survival when it occurred with a change in a second gene, TP53. Tumors carrying both changes shared a distinctive biology involving faster growth, greater invasiveness, and altered signaling. These findings identify a high-risk group of patients that could be recognized through routine tumor testing and point to specific existing drugs worth testing in this group.
Abstract
Background/Objectives: Genomic profiling has become central to understanding prognosis in pancreatic ductal adenocarcinoma (PDAC), yet the canonical drivers KRAS, TP53, SMAD4, and CDKN2A do not fully explain survival heterogeneity, and the prognostic impact of co-occurring alterations remains incompletely characterized. Methods: We performed integrated genomic, transcriptomic, proteomic, phosphoproteomic, and immune deconvolution analyses of publicly available PDAC datasets. Un-supervised clustering of survival extremes in MSK-IMPACT identified a subgroup enriched for concurrent TP53 and ARID1A mutations. Results: ARID1A was mutated in 7–8% of tumors across cohorts, of which 66–72% were TP53 co-mutated. Co-mutated tumors had the shortest overall survival of any subgroup (median 21.4 vs. 34.8 months in non-co-mutated tumors; log-rank p < 0.001), a pattern that persisted in the full MSK-IMPACT cohort and in independent multi-cohort validation. Transcriptomic analysis showed enrichment of MYC target, EMT, and E2F/cell-cycle programs alongside coordinated suppression of oxidative phosphorylation and lipid metabolism, with EMT tracking more closely with ARID1A mutation and cell-cycle programs with TP53 mutation. Immune deconvolution identified reduced plasma cell infiltration in co-mutated tumors. Proteomic profiling recapitulated EMT, hypoxia, and TNF-α/NF-κB enrichment, and kinase-substrate enrichment analysis inferred increased mTOR and MEK1 activity. Conclusions: These findings are hypothesis-generating and suggest that TP53 + ARID1A co-mutated PDAC represents a prognostically distinct subtype, with candidate therapeutic vulnerabilities in MAPK, mTOR, and proteostasis pathways that warrant validation in larger cohorts and functional studies.
1. Introduction
Pancreatic ductal adenocarcinoma (PDAC) is a lethal disease, ranking as the third leading cause of cancer deaths in the United States and predicted to become the second leading cause by 2030 [1,2]. Five-year overall survival remains approximately 13%, and even the minority of patients who undergo resection have a 5-year survival of only about 25% [3,4]. This poor prognosis reflects late presentation, early metastatic dissemination, and a dense desmoplastic, immunosuppressive tumor microenvironment that limits the efficacy of chemotherapy and immunotherapy. PDAC arises most commonly from pancreatic intraepithelial neoplasia (PanIN), and more than 70% of tumors arise in the pancreatic head, with the disease peaking in the seventh decade of life, consistent with a long latency during which genetic alterations accumulate in the ductal epithelium [5].
Genomic studies have identified gain-of-function KRAS mutations in ~90% of PDAC cases, and these mutations are among the earliest events in tumorigenesis, detectable in most low-grade PanINs [6]. Mutant KRAS constitutively signals through the RAF-MEK-ERK and PI3K-AKT-mTOR cascades to drive proliferation, survival, and metabolic reprogramming. Because nearly all PDAC shares this dependence on MAPK signaling, identifying co-occurring alterations that modify pathway activity may help explain why PDAC tumors with similar KRAS status differ in behavior and response to MEK or KRAS inhibition [7].
Although oncogenic KRAS activation is an early event in pancreatic neoplasia, progression to invasive pancreatic ductal adenocarcinoma (PDAC) involves the accumulation of additional genetic and epigenetic alterations, particularly those affecting the tumor suppressor genes CDKN2A, TP53, and SMAD4 [8,9]. CDKN2A is inactivated in approximately 90% of PDACs through homozygous deletion, mutation accompanied by loss of the wild-type allele, or promoter hypermethylation. Loss of its protein product p16INK4a relieves inhibition of CDK4/6, permitting RB phosphorylation and G1/S cell-cycle progression, while alterations affecting p14ARF can additionally impair p53-dependent cell cycle arrest. TP53, altered in approximately 80% of PDACs, contributes to genomic instability through disruption of DNA damage responses, cell-cycle regulation, and apoptosis. SMAD4 is inactivated in just over 50% of resected PDACs, disrupting canonical transforming growth factor-β (TGF-β) signaling and facilitating tumor invasion and immune evasion. Collectively, these alterations cooperate with oncogenic KRAS to promote malignant progression [8]. Yet, these alterations alone do not explain the wide variability in patient survival, motivating a search for additional co-occurring drivers that refine prognosis and reveal new therapeutic targets.
ARID1A, a core subunit of the switch/sucrose non-fermentable (SWI/SNF) chromatin remodeling complex, has emerged as one such candidate [10]. It is mutated in ~6% of PDAC, and its loss promotes acinar-to-ductal metaplasia and cooperates with oncogenic KRAS to accelerate tumorigenesis in mouse models [10,11,12]. ARID1A-deficient tumors have shown distinct transcriptional and epigenetic programs that may shape immune infiltration and treatment response [13,14,15]. However, the genomic context in which ARID1A mutations most strongly influence prognosis remains incompletely understood.
In this study, we performed integrated genomic, transcriptomic, proteomic, phosphoproteomic, and immune deconvolution analyses of PDAC using publicly available datasets to examine the effects of ARID1A, both singularly and in context with other driver mutations, on PDAC biology and patient outcomes. We show that ARID1A mutation alone was not sufficient to drive adverse outcomes; rather, co-occurring ARID1A and TP53 mutations were associated with significantly worse survival, suggesting a cooperative interaction between chromatin remodeling dysfunction and impaired genomic integrity. Multi-omic profiling further identified activation of epithelial–mesenchymal transition (EMT) and MYC target programs, reduced plasma cell infiltration, and hyperactivation of mechanistic target of rapamycin (mTOR) and mitogen-activated protein kinase kinase 1 (MEK1) signaling as candidate features driving the aggressiveness of TP53 + ARID1A co-mutated tumors. In an exploratory screen of a limited number of cell lines, MEK1 inhibition appeared to have a greater effect in cancer cells harboring ARID1A + TP53 co-mutation. These data are hypothesis-generating and suggest a potential therapeutic vulnerability in this PDAC genomic subgroup that can be further validated in future large panels and in vivo models.
2. Materials and Methods
Data and cohort selection: Clinical and genomic data were obtained from the Memorial Sloan Kettering Integrated Mutation Profiling of Actionable Cancer Targets pancreatic ductal adenocarcinoma (PDAC) cohort (MSK-IMPACT), Memorial Sloan Kettering—50,000 patient cohort (MSK-50K), Queensland Centre of Medical Genomics (QCMG), Clinical Proteomic Tumor Analysis Consortium (CPTAC), TCGA/ICGC Pan-Cancer Analysis of Whole Genomes (PCAWG), TCGA Pan-Cancer Atlas 2018 (TCGA PanCan), and Broad Institute Cancer Cell Line Encyclopedia (CCLE) [16,17,18,19,20,21,22,23]. Survival analyses were performed across clinically annotated PDAC/pancreatic adenocarcinoma cohorts using available diagnostic labels.
All data files were obtained from cBioPortal [24,25,26]. All analyses were performed using R version 4.6.0 and Python version 3.11.9. Software and package versions used for computational analyses included scikit-learn 1.5.2, GSEAPy version 1.1.13, limma version 3.68.4, and CIBERSORTx web version.
Unsupervised genomic substructure analysis: We selected a pre-specified cohort from the MSK-IMPACT dataset to identify the association between specific genomic alterations and the clinical outcome of the patients. The samples chosen for analysis were surgically resected non-metastatic primary tumors with no known neoadjuvant chemotherapy. Patients in the first and last quartiles of overall survival months were defined as “long-term survivor” and “short-term survivor”. Only these patients were included in the clustering analysis. To resolve heterogeneity within survival extremes, we constructed a mixed-data dissimilarity matrix using Gower distance to integrate mutation counts per gene and continuous CNV features per gene [27]. This matrix was used as input for construction of a K-nearest neighbor (KNN) graph using the scikit-learn Python library [28]. The KNN graph was constructed using K = 15 nearest neighbors. Leiden community detection was applied to identify genomic subclusters from the KNN graph, using a resolution parameter of 1.15, and the results were plotted in a Uniform Manifold Approximation and Projection (UMAP) graph for visualization [29,30].
Logistic regression: To further identify predictive genomic features, we applied L1-regularized (Lasso) logistic regression using scikit-learn with balanced class weighting to the same cohort defined in the unsupervised genomic substructure analysis [28]. Selected features represented the most parsimonious set of gene alterations associated with “long-term” or “short-term” survival. Model performance was assessed by repeated stratified 5-fold cross-validation (20 repeats).
Survival and statistical analysis: Survival outcomes were analyzed using Kaplan–Meier estimation and the log-rank test. The primary assessment used the pre-specified unsupervised-clustering cohort; an expanded assessment included all MSK-IMPACT primary tumor samples. An independent cohort (QCMG, CPTAC, PCAWG, TCGA PanCan) was used to validate the expanded MSK-IMPACT findings, with a sensitivity analysis adding non-overlapping MSK-50K samples. Median overall survival was estimated by Kaplan–Meier curves and compared pairwise against the co-mutated group using the log-rank test. Univariate Cox proportional hazards regression was performed, with hazard ratios against the co-mutated group plotted as a forest plot.
Tumor mutation burden (TMB) analysis: Available nonsynonymous tumor mutational burden (TMB) values, expressed as mutations per megabase (mutations/Mb), were obtained from the MSK-IMPACT cohort described in Section 3.2. Samples without available TMB measurements were excluded from this analysis. TMB distributions were compared between TP53/ARID1A co-mutated tumors and three comparison groups: non-co-mutated tumors, TP53-only mutated tumors, and ARID1A-only mutated tumors. Each comparison was performed independently using a two-sided Mann–Whitney U test.
Transcriptomic analysis: Transcriptomic data were obtained from QCMG, CPTAC, and TCGA PanCan. For transcriptomic analyses, where histology-driven expression differences may introduce greater biological confounding, we applied stricter cohort-specific histologic filtering where available. We restricted QCMG, CPTAC, and TCGA PanCan transcriptomic analysis to primary tumors with a histological signature of “Pancreatic Ductal Adenocarcinoma” or “Pancreatic Adenocarcinoma, Ductal Type”. “Data_mrna_seq_v2_rsem_zscores_ref_all_samples.txt” files from CPTAC, QCMG, and TCGA PanCan were aggregated to form a combined analysis cohort. TP53 + ARID1A co-mutated patients’ samples were compared against those in non-co-mutated (~(TP53 + ARID1A)), TP53-only mutated, and ARID1A-only mutated groups. Differential expression p values were calculated from Linear Models for Microarray Data Empirical Bayes Statistics for Differential Expression (Limma eBayes) and corrected using the Benjamini–Hochberg procedure to account for false discovery rate (BH-FDR) [31,32]. Gene Set Enrichment Analysis (GSEA) was computed from Limma eBayes results using the GSEAPy package, which generated a Normalized Enrichment Score (NES), reflecting the magnitude of pathway enrichment, and an FDR-corrected q-value [33,34,35]. Leading-edge genes, which identify the top contributors to pathway-level differences, were identified using the built-in leading edge analysis tools in GSEAPy. Epithelial and mesenchymal transcriptional programs were evaluated using GSEA with the Kohn epithelial (KOHN_EMT_EPITHELIAL) and mesenchymal (KOHN_EMT_MESENCHYMAL) gene-expression signatures obtained from MSigDB. These signatures were developed from cancer cell-line transcriptional profiles initially characterized by Kohn et al. and subsequently defined by Rajapakse et al. [36,37]. The TP53 and ARID1A interaction, which assesses which genes are up- or downregulated more than what is expected from the linear combination of TP53-only mutation and ARID1A-only mutation, was assessed using the interaction formula: TP53 + ARID1A—(TP53 only + ARID1A only—Neither). The Interaction Coefficient matrix generated using the interaction formula was assessed using Limma eBayes and GSEA to elucidate both individual gene-level differences and pathway-level differences.
Immune cell deconvolution: CPTAC and TCGA PanCan mRNA data were used to perform immune cell deconvolution. Immune cell composition was estimated from bulk RNA-seq data using CIBERSORTx with absolute mode enabled, B-mode batch correction applied, and quantile normalization disabled [38]. Expression matrices were first transformed from Log2 format into linear format and then inputted into the CIBERSORTx website (https://cibersortx.stanford.edu/ (accessed on 14 June 2026). Tumor samples with TP53 + ARID1A co-mutation, no TP53 + ARID1A co-mutation, TP53-only mutation, and ARID1A-only mutation were identified from the deconvolution matrix in both cohorts. Cell types with an excessive fraction of zeros (greater than 25% and less than 3 non-zero values) were excluded from analysis. Fractional differences across different cell types of tumors in different mutational status groups were compared using Welch’s t-test and corrected using BH-FDR. A studentized permutation analysis was additionally performed as a sensitivity analysis for comparisons involving very small subgroups (shown in code repository). Cell fraction data of CPTAC and TCGA PanCan were then z-scored within each cohort and then pooled. Cell fractional analysis was performed again using the pooled data and a BH-FDR-corrected Welch’s t-test. Cell fractional analysis was restricted only to cell types that were not excluded via zero-inflation criteria in both cohorts.
Proteomic and phosphoproteomic analysis: Proteomic and phosphoproteomic data were obtained from CPTAC. Only tumors with a histological signature of “Pancreatic Ductal Adenocarcinoma” were included in the analysis. Proteomic differences between TP53 + ARID1A co-mutated tumors, non-co-mutated tumors, TP53-only mutated tumors, and ARID1A-only mutated tumors were assessed using CPTAC mass spectrometry-derived, Log2-transformed protein abundance ratio data (data_protein_quantification.txt). Limma eBayes with BH-FDR correction was used to assess protein-level differences across different mutational subgroups [39]. Gene names associated with each protein were used to construct a GSEA pathway-level analysis as described in the transcriptomics analysis.
Phosphorylation differences between TP53 + ARID1A co-mutated, non-co-mutated, TP53-only, and ARID1A-only tumors were assessed using phosphosite and matched parent-protein log-ratio data (data_phosphoprotein_quantification.txt; data_protein_quantification.txt). Phosphosite IDs were parsed into gene, residue, accession, and multi-site flags, with parent proteins matched by accession (gene-symbol fallback where needed) and duplicated protein-gene rows collapsed by sample-wise median. Each comparison was tested without parent-protein adjustment using Limma eBayes, requiring at least three non-missing measurements per group [40]. Sites with a matched parent protein were additionally fitted with a per-site model (phosphosite ~ mutation_group + parent_protein) using Limma eBayes with robust variance moderation, with BH-FDR correction applied per comparison. Kinase-substrate enrichment analysis (KSEA) was then performed on the protein-matched phosphorylation data to approximate upstream kinase activity, yielding z-scores and FDR-corrected q values across comparisons [41]. The KSEA was performed using KSEAapp 2.0.
Cell line analysis: Publicly available Cancer Cell Line Encyclopedia (CCLE) data generated by the Broad Institute and accessed through cBioPortal were used for transcriptomic and drug-response analyses. CCLE cell lines were restricted to primary exocrine pancreatic adenocarcinoma models with SAMPLE_TYPE classified as Primary, PRIMARY_SITE as Pancreas, LINEAGE_SUBTYPE as exocrine, CANCER_TYPE as Pancreatic Cancer, and CANCER_TYPE_DETAILED as Pancreatic Adenocarcinoma. Cell lines carrying a TP53 or ARID1A variant classified as silent or synonymous were excluded before group assignment.
RNA-sequencing expression data were obtained from CCLE as reads per kilobase of transcript per million mapped reads (RPKM)-based z scores standardized relative to all CCLE samples. Differential expression between mutation groups was analyzed using the limma framework, consistent with the analysis applied to bulk-tumor transcriptomic data.
Area under the dose–response curve (AUC) and half-maximal inhibitory concentration (IC50) data were obtained from the CCLE cBioPortal treatment-response matrices. Drug-response AUC was defined as the area under the fitted sigmoidal dose–response curve, estimated from drug-screening measurements using a mixed-effects model. AUC summarizes response across the tested concentration range, with lower values interpreted as greater drug sensitivity and higher values as relative resistance. Repeated measurements were arithmetically averaged within each compound–cell-line pair before group-level analysis. A compound was eligible when both AUC and IC50 were available for at least three co-mutated and three non-co-mutated cell lines.
For the drug-response-shift analysis, the AUC coordinate for each compound was defined as:
and the IC50 coordinate was defined as:
Compounds showing concordant improvement in both measures were ranked using the exploratory combined efficacy score:
MEK1-directed compounds were identified from CCLE drug annotations whose target field contained “MEK1.” Repeated AUC measurements were averaged within each compound–cell-line pair before analysis. Each inhibitor was evaluated separately using a one-sided Wilcoxon rank-sum test to assess whether AUC values were lower in the co-mutated group. p values were adjusted for multiple comparisons across the five MEK inhibitors using the Benjamini–Hochberg procedure to control the false discovery rate (FDR), with an FDR-adjusted p value (q) < 0.05 considered statistically significant.
Generative AI usage: Generative AI tools, including ChatGPT (GPT5–GPT6.1), Gemini 3–3.6, and Claude Opus 4.6, were used to aid in code-writing, support method development, and manuscript editing. Analysis code generated or assisted by generative AI was reviewed and verified by the authors prior to use.
Data and code availability: The code used to analyze data and generate figures can be found at: https://github.com/Heliomycete/Concurrent-TP53-and-ARID1A-Mutations-Define-a-Distinct-Aggressive-Molecular-Subtype-of-PDAC-.git, accessed on 26 October 2026. The links to cBioPortal datasets used in the study are included in the github repository.
3. Results
3.1. Discovery of a High-Risk Subgroup Defined by TP53 + ARID1A Co-Mutation
To identify genomic features associated with short-term survival after resection, we applied unsupervised clustering to MSK-IMPACT data, stratifying patients into short-term (<12.5 months) and long-term (>33.3 months) survival extremes. The cohort was restricted to the patients whose stage at diagnosis and disease status at sequencing were not metastatic. Clustering identified five clusters, one of which (Cluster 4) was markedly enriched for short survivors and had significantly lower median OS than all other clusters combined (log-rank p = 0.030; Figure 1A–D). Cluster 4 was distinguished by a significantly higher co-occurrence of TP53 and ARID1A mutations (Fisher’s exact p < 0.001) (Figure 1E,F), and Lasso logistic regression prioritized ARID1A mutation as a key feature associated with worse survival, though model performance exhibited limited predictive power (mean balanced accuracy 0.53 ± 0.047; Figure 1G). In the entire cohort of patients, ARID1A mutations occurred in 8.2% of tumors (n = 53), of which 69.8% were co-mutated with TP53 (n = 37; Figure 1H). Compared with other patients, patients with TP53 + ARID1A co-mutated tumors had the poorest overall survival of any subgroup, with significantly worse OS than non-co-mutated tumors (log-rank p < 0.001) and TP53-only tumors (p = 0.002), and a trend toward worse OS than ARID1A-only tumors (p = 0.122) (Figure 1I–M). Median OS was 21.4 months in co-mutated tumors versus 34.8 months in non-co-mutated, 34.5 months in TP53-only, and 49.2 months in ARID1A-only tumors. Compared with TP53/ARID1A co-mutated tumors, non-co-mutated tumors were associated with a significantly lower hazard of death in both univariable and multivariable Cox proportional hazards models (Figure 1N,O). The majority of ARID1A mutations in this cohorts are truncating mutations (frameshift or nonsense), and the proportion of truncating mutations in the co-mutated group is not statistically different from that of the not co-mutated group (Figure 1P,Q). There are significantly more patients with more than 1 mutation variant of ARID1A in the co-mutated group (Fisher’s exact, p = 0.005), although the absolute difference is only 2 patients (Figure 1R).
Figure 1.
Identification of TP53 and ARID1A mutation statuses as genetic factors associated with reduced survival. Patients from the MSK-IMPACT 2024 dataset who underwent surgical resection without known neoadjuvant therapy were stratified by survival outcome. The top 25th percentile of survival time is defined as long-term survival and bottom 25th percentile of survival time is defined as short-term survival. The top and bottom 25% of patients are included in clustering and logistic regression. (A) UMAP embedding of patients colored by Leiden cluster assignment (Clusters 0–4). Each point represents a patient, and the spatial grouping reflects similarity in somatic mutation and copy number alteration profiles. (B) Bar chart showing the fraction of short survivors within each Leiden cluster. Cluster 4 showed the highest fraction of short survivors compared to all other clusters. (C) Kaplan–Meier (KM) overall survival curves stratified by Leiden cluster. (D) Median overall survival (OS) estimation of cluster 4 compared against cluster 0, 1, 2, and 3 combined. (Error bar denoting 95% confidence interval) (E) Mutation frequency of key genes across Leiden clusters. Features are ranked by their range across clusters, defined as the highest cluster-level alteration frequency minus the lowest cluster-level alteration frequency. Ten features with the largest ranges are plotted. (F) Two-sided Fisher’s exact test on the proportion of patients with ARID1A and TP53 co-mutation in Leiden cluster 4 versus all other clusters combined. (G) Logistic regression analysis of genomic features associated with short-term survival, displayed as log-odds coefficients. (H) Distribution of TP53 and ARID1A mutation status across the full cohort (total n = 647). Groups. (I–K) KM curves for overall survival comparing ARID1A-mutated patients (Altered, n = 53) versus wild-type (WT, n = 594), TP53-mutated patients (Altered, n = 482) versus WT (n = 165), and ARID1A and TP53 co-mutation (Altered, n = 37) versus all others (WT, n = 610). (L) KM curve directly comparing TP53 + ARID1A co-mutation (n = 37) against TP53 only (n = 445) and ARID1A only (n = 16) single-mutant groups. (M) Estimation of median OS of different mutation groups compared against TP53 + ARID1A co-mutation (Error bar denoting 95% confidence interval). * p < 0.05; ** p < 0.01; *** p < 0.001. (N) Forest plot from univariate Cox proportional hazards regression using TP53 + ARID1A co-mutation as the reference group. Shown are reduced hazard ratios (HRs) for the comparison groups. (O) Forest plot from multivariate Cox proportional hazards regression using TP53 + ARID1A co-mutation as the reference group. Full model adjusts for age, sex, stage (borderline resectable vs. resectable), KRAS mutation status, SMAD4 mutation status, and CDKN2A status. Parsimonious model adjusts for age and stage. Shown are reduced hazard ratios (HRs) for the comparison groups. (P) Proportions of ARID1A and TP53 mutation types in the co-mutated group and not co-mutated group in tumors harboring these mutations. (Q) Two-sided Fisher’s exact test on the proportion of patients with truncating versus non-truncating ARID1A or TP53 mutations in the co-mutated group and not co-mutated group. (R) Two-sided Fisher’s exact test on the proportion of patients with one versus more than 1 ARID1A or TP53 mutations in the co-mutated group and not co-mutated group.
3.2. Full MSK-IMPACT Cohort Analysis and Independent Validation
To test whether this co-mutation phenotype generalizes beyond the previously defined cohort, we examined the full MSK-IMPACT cohort (including neoadjuvant-treated and metastatic disease), an independent verification cohort (QCMG, TCGA PanCan-PCAWG 2020, TCGA PanCan-2018, CPTAC), and an expanded verification cohort incorporating non-overlapping MSK-50K cases. The samples now include primary tumors from patients with metastatic disease at diagnosis and at sequencing. Across all three cohorts, ARID1A mutations occurred in 7–8% of tumors, of which 66–72% were co-mutated with TP53, consistent with the discovery cohort (Figure 2H). In the full MSK-IMPACT cohort, TP53 + ARID1A co-mutation remained significantly associated with worse OS than non-co-mutated tumors (log-rank p = 0.003) and both single-mutant groups (p = 0.015 for both; Figure 2A–F), with median OS of 16.1 months versus 22.7–27.8 months in comparator groups. Multivariate Cox-PH analysis adjusting for age, sex, stage, and mutation status revealed results largely consistent with the univariate Cox-PH model (Figure 2G). The independent verification cohort showed the same directional pattern (11.86 months, 95% CI: 7.43–13.80 in co-mutated tumors vs. 19.78 months, 95% CI: 17.31–21.73 in the non-co-mutated group) that strengthened to statistical significance after adding MSK-50K cases (log-rank p = 0.027 vs. non-co-mutated tumors; Figure 2I–P and Figure S1C). Because disease stage was not documented in a format consistent with the primary cohort, the original multivariable Cox proportional hazards model could not be directly replicated. Instead, a Cox proportional hazards model stratified by cohort origin was applied to the pooled validation cohorts (Figure 2O). Like the previously defined cohort, the majority of ARID1A mutations in the expanded cohorts are truncating mutations (frameshift or nonsense), and the proportion of truncating mutations in the co-mutated group is not statistically different from that of the not co-mutated group (Figure 2Q,R). There are significantly more patients with more than 1 mutation variant of ARID1A in the co-mutated group (Fisher’s exact, p = 0.001), although the absolute difference is only 4 patients (Figure 2S).
Figure 2.
Expanded analysis of the association of tumor TP53 and ARID1A mutation status and patient survival. The analysis of TP53 and ARID1A co-mutated tumors was expanded to all PDAC patients in the MSK-IMPACT 2024 dataset whose genomic information originates from the primary tumor. The same tumor genotype was analyzed in an independent cohort combined from QCMG, TCGA PanCan PCAWG, TCGA PanCan 2018, and CPTAC datasets. (A–C) KM curves for overall survival comparing ARID1A-mutated patients (Altered, n = 117) versus wild-type (WT, n = 1257), TP53-mutated patients (Altered, n = 1029) versus WT (n = 335), and ARID1A + TP53 co-mutation (Altered, n = 77) versus all others (WT, n = 1287) in MSK-IMPACT 2024 datasets. (D) KM curve comparing TP53 + ARID1A co-mutated (n = 77), TP53-only mutated (n = 952), and ARID1A-only mutated (n = 35) patients in MSK-IMPACT 2024 datasets. (E) Estimation of median OS of different mutation groups compared against TP53 + ARID1A co-mutation (Error bar denoting 95% confidence interval). (F) Forest plot from univariate Cox proportional hazards regression using TP53 + ARID1A co-mutation as the reference group. Shown are reduced hazard ratios (HRs) for the comparison groups in the expanded MSK-IMPACT 2024 datasets. * indicates p < 0.05, ** indicates p < 0.01. (G) Forest plot from multivariate Cox proportional hazards regression using TP53 + ARID1A co-mutation as the reference group. Shown are reduced hazard ratios (HRs) for the comparison groups in MSK-IMPACT 2024 datasets. Full model adjusts for age, sex, stage (metastatic/borderline resectable vs. resectable), treatment status (neoadjuvant/no-confirmed neoadjuvant, resected vs. not resected), KRAS mutation status, SMAD4 mutation status, and CDKN2A status. Parsimonious model adjusts for age, sex, stage, and KRAS mutation status. Shown are reduced hazard ratios (HRs) for the comparison groups. (H) Pie chart showing the distribution of TP53 and ARID1A mutation status across the full MSK-IMPACT 2024 cohort. (H–P) The same analysis pipeline applied to combined independent validation cohort consist of QCMG, TCGA PanCan PCAWG, TCGA PanCan 2018, and CPTAC datasets (Q) Proportions of ARID1A and TP53 mutation types in the co-mutated group and not co-mutated group in tumors harboring these mutations. (R) Two-sided Fisher’s exact test on the proportion of patients with truncating versus non-truncating ARID1A or TP53 mutations in the co-mutated group and not co-mutated group. (S) Two-sided Fisher’s exact test on the proportion of patients with one versus more than 1 ARID1A or TP53 mutations in the co-mutated group and not co-mutated group.
3.3. TP53 + ARID1A Co-Mutation Is Associated with Higher Tumor Mutational Burden and Distinct Transcriptomic Signatures
To investigate the molecular basis of the co-mutation phenotype, we first compared tumor mutational burden (TMB) across mutation-defined subgroups. Co-mutated tumors exhibited a higher median TMB (5.19 mutations/Mb) than TP53-only tumors (3.46 mutations/Mb), ARID1A-only tumors (4.32 mutations/Mb), and tumors harboring neither mutation (2.59 mutations/Mb). The differences were statistically significant when comparing co-mutated tumors against non-co-mutated tumors, TP53-only tumors, and tumors harboring neither mutation (all p < 0.001, Mann–Whitney U tests), but not against ARID1A-only tumors (Supplementary Figure S2P,Q). Then, we performed GSEA on mRNA expression data from a combined, z-scored, CPTAC/QCMG/TCGA cohort. EMT was significantly elevated in TP53 + ARID1A co-mutated tumors versus non-co-mutated tumors (FDR q < 0.05) and versus TP53-only tumors (FDR q < 0.05), but not versus ARID1A-only tumors, suggesting that ARID1A mutation may contribute more strongly to EMT pathway activation. To minimize the potential contribution of stromal extracellular matrix-associated genes to EMT enrichment, we additionally performed GSEA using the Kohn epithelial and mesenchymal gene-expression signatures. Compared with other mutational subgroups, TP53/ARID1A co-mutant tumors generally exhibited increased mesenchymal signature enrichment and decreased epithelial signature enrichment, with the latter reaching statistical significance compared with TP53-only tumors (FDR q < 0.05; Figure 3H). Conversely, E2F Targets were significantly elevated versus non-co-mutated and ARID1A-only tumors, but not versus TP53-only tumors, suggesting that TP53 mutation may contribute more strongly to E2F/cell-cycle pathway dysregulation (Figure 3A–C). Myc Targets V1 was the most robustly elevated pathway in TP53 + ARID1A co-mutated tumors, reaching FDR q < 0.05 across all three pairwise comparisons (Figure 3D), with leading-edge genes enriched for RNA processing, translation initiation, and proteasomal turnover (e.g., SSB, TARDBP, EIF3J, EIF4G2, PSMA4, PSMB2; Figure 3E–G).
Figure 3.
Transcriptomic characterization of TP53 + ARID1A co-mutated tumors. To investigate the biological basis underlying the worsened survival associated with TP53 + ARID1A co-mutation, mRNA expression data from three independent datasets (CPTAC, QCMG, TCGA) were analyzed. RSEM expected counts were z-scored within each dataset and combined into a supercohort for downstream analyses. (A–C) Gene Set Enrichment Analysis (GSEA) pathway enrichment bubble plots comparing TP53 + ARID1A co-mutated vs. not co-mutated, vs. TP53 mutated alone, and vs. ARID1A mutated alone. Bubble position on the x-axis indicates NES direction (right = elevated in co-mutated), bubble size reflects the percentage of genes in the gene set, and color indicates FDR q-value. (D) Heatmap summarizing selected significant Hallmark pathways across all three pairwise GSEA comparisons. Each cell displays the FDR q-value for that comparison. Pathways were included if they met either of the following criteria: FDR q-value < 0.25 in all three comparisons, OR FDR q-value < 0.05 in at least one comparison. Pathways in bold meet the criterion of FDR q < 0.05 in at least two of the three comparisons. Myc Targets V1 pathway is boxed as it meets the criterion of FDR q < 0.05 and is directionally consistent in all three comparisons. Cell color reflects NES (red = elevated, FDR < 0.25; blue = decreased, FDR < 0.25; pale red = increased, FDR > 0.25; pale blue = decreased, FDR > 0.25). * indicates FDR < 0.25, ** indicates FDR < 0.05. (E–G) Leading edge bar charts for the Myc Targets V1 pathway plotting the Log2 Fold Change in individual genes driving pathway enrichment in each comparison. Solid red indicates that the gene is elevated in the double-mutant group across all three comparisons and is among the top 20 genes by Log2 Fold magnitude; pale red indicates the gene is elevated in the double-mutant group across in that specific comparison. (H) Gene set enrichment analysis (GSEA) using the Kohn epithelial and mesenchymal gene-expression signatures.
Conversely, several metabolic pathways, including oxidative phosphorylation, fatty acid metabolism, cholesterol homeostasis, and xenobiotic metabolism, were consistently decreased in co-mutated tumors, with interaction analyses suggesting non-additive suppression beyond either mutation alone (Figure 3D and Figure S2I–N). Together, these results suggest the possibility that TP53 + ARID1A co-mutation is associated with coordinated activation of proliferative, inflammatory, and EMT-associated transcriptional programs alongside suppression of metabolic and biosynthetic pathways, with ARID1A mutation contributing more to the EMT signal and TP53 mutation more to proliferative signaling.
3.4. Immune Compositional Changes Identified by Deconvolution Analysis
Bulk tumor composition (stromal score, immune score, tumor purity) was similar across mutation groups, suggesting the absence of a major compositional confound (Supplementary Figure S3B,C) [42]. CIBERSORTx deconvolution identified reduced plasma cell infiltration as the most directionally consistent immune change in TP53 + ARID1A co-mutated tumors, reaching significance in CPTAC (p = 0.007 vs. non-co-mutated; p = 0.026 vs. TP53-only) and trending in the same direction in TCGA and pooled analyses (Figure 4A–F,H–J). Macrophage M0 and resting mast cell fractions showed similar but less statistically robust directional trends (Figure 4G). These findings suggest that co-mutated tumors undergo selective immune remodeling characterized primarily by reduced plasma cell infiltration.
Figure 4.
Immune cell deconvolution via CIBERSORTx. CIBERSORTx was applied to bulk RNA-seq data from CPTAC and TCGA separately to estimate immune composition of the double mutant tumors and compare it against 3 other groups (Not double-mutant, only TP53 mutated, only ARID1A mutated). (A–C) Horizontal bar charts showing the raw mean difference in immune cell absolute fractions between TP53 + ARID1A co-mutated vs. not co-mutated, TP53 mutated, and ARID1A mutated in CPTAC cohort for all evaluable cell types. Statistical significance evaluated by Welch’s t test and corrected by BH-FDR. Significance indicated in red (BH-FDR p = 0.001). (D–F) Same analysis as (A–C) applied to the TCGA cohort. (G) Side-by-side grouped bar charts comparing the raw mean differences in immune cell fractions between CPTAC (blue) and TCGA (orange) for each of the three pairwise comparisons, restricted to cell types that showed the same direction of change in both cohorts. (H,I) Violin plots showing plasma cell absolute fractions in CPTAC and TCGA across all three pairwise comparisons. Statistical significance evaluated by Welch’s t test and corrected by BH-FDR. (J) Violin plots showing pooled z-scored plasma cell fractions (CPTAC + TCGA) across all three pairwise comparisons. Statistical significance evaluated by Welch’s t test and corrected by BH-FDR. In (H–J) The lines indicate median and circles indicate CIBERSORT estimated absolute plasma cell fraction in each tumor sample.
3.5. Proteomic and Phosphoproteomic Analyses Identify EMT- and Inflammation-Related Pathway Enrichment and Suggest Elevated mTOR/MEK1 Signaling
We subsequently analyzed CPTAC proteome and phosphoproteome data (4 co-mutated, 131 non-co-mutated, 97 TP53-only, and 4 ARID1A-only tumors; Supplementary Figure S4K). Few individual proteins passed FDR significance given the small co-mutated group, though EMB was significantly increased and PDSS2, ABCB8, and ZC3H18 were significantly decreased in co-mutated tumors compared with non-co-mutated tumors (Supplementary Figure S4A–C). Pathway-level GSEA recapitulated the transcriptomic findings, with recurrent enrichment of EMT, hypoxia, myogenesis, and TNF-α/NF-κB signaling across comparisons (Figure 5A–C), and leading-edge proteins including ANGPTL4, IGFBP3, DES, LAMB3, and NINJ1 repeatedly elevated in co-mutated tumors (Figure 5D–G).
Figure 5.
Proteomic and phosphoproteomic Analysis of TP53 + ARID1A Co-mutation. To characterize molecular differences associated with TP53 + ARID1A co-mutation beyond the transcriptome, mass spectrometry-based proteomics and phosphoproteomics data from the CPTAC dataset, the only available cohort with mass spectrometry data, were analyzed. (A–C) GSEA bubble plots comparing TP53 + ARID1A co-mutated vs. not co-mutated, vs. TP53 mutated alone, and vs. ARID1A mutated alone patients using proteomic data. Bubble position on the x-axis indicates NES direction (right = elevated in co-mutated), bubble size reflects the percentage of genes in the gene set, and color indicates FDR q-value. (D–F) Top 5 leading-edge driver proteins in the TP53 + ARID1A co-mutated vs. not co-mutated, vs. TP53 mutated alone, and vs. ARID1A mutated alone for Hypoxia (red), Myogenesis (orange/gold), and TNF-Alpha Signaling Via NF-kB (dark orange) pathways. Solid color indicates the gene is among the top 5 upregulated in all 3 comparisons. (G) Heatmap summarizing selected significant Hallmark pathways across all three proteome GSEA pairwise comparisons (columns: vs. not co-mutated; vs. TP53 only; vs. ARID1A only). Coloring and pathway inclusion criteria mirror Figure 3E (FDR q < 0.25 in all three comparisons OR FDR q < 0.05 in at least one). * indicates FDR < 0.25, ** indicates FDR < 0.05. (H) Heatmap summarizing the top coordinately increased KSEA kinases across all three pairwise comparisons. Each cell displays the KSEA z-score and FDR for that kinase in each comparison. mTOR and MEK1 are boxed as they meet the criterion of FDR q < 0.05 and are directionally consistent in all three comparisons. * indicates FDR < 0.25, ** indicates FDR < 0.05.
KSEA identified a coordinated increase in inferred kinase activity in co-mutated tumors, with mTOR and MEK1 showing the most consistent enrichment across all three comparisons, suggesting MAPK and PI3K/AKT/mTOR activation as a core feature of the co-mutated state (Figure 5H and Figure S4H–J). Additional kinases (JAK2, RET, AKT1, DYRK2, AMPKA1, BRAF, p90RSK, ATR) were most prominent when comparing co-mutated to ARID1A-only tumors, suggesting that TP53 co-mutation broadens activation of growth-factor, metabolic-stress, and DNA-damage-response signaling within an ARID1A-altered background.
3.6. Transcriptomic and Drug Sensitivity Analysis of PDAC Cell Lines with TP53 + ARID1A Co-Mutation
To further investigate whether the molecular features associated with TP53/ARID1A co-mutation in primary PDAC tumors were recapitulated in vitro, we analyzed publicly available pancreatic cancer cell-line data from the Broad Institute, accessed through cBioPortal. Among 26 primary PDAC cell lines sampled from the pancreas, four harbored concurrent TP53 and ARID1A mutations, 14 harbored TP53 mutations alone, two harbored ARID1A mutations alone, and six harbored neither mutation. Given the limited number of ARID1A-only cell lines, subsequent analyses compared the co-mutated subgroup with either all non-co-mutated cell lines or the TP53-only subgroup. GSEA of RNA-sequencing data revealed significantly increased enrichment of MYC Targets V1, E2F Targets, and G2M Checkpoint signatures in co-mutated cell lines. In contrast, several immune-related signatures exhibited significantly reduced enrichment. Notably, the Hallmark Epithelial–Mesenchymal Transition (EMT) signature was significantly reduced in both comparisons, contrasting with its increased enrichment in primary tumor samples. Further examination using the Kohn epithelial and mesenchymal signatures revealed nonsignificant reductions in both signatures (Figure 6A–D).
Figure 6.
Cell lines derived from primary PDAC tumors sampled from pancreas. The lineage subtype is restricted to exocrine. (A,B) GSEA pathway enrichment bubble plots comparing TP53 + ARID1A co-mutated vs. not co-mutated and vs. TP53 mutated alone with RNA-Seq data. Bubble position on the x-axis indicates NES direction (right = elevated in co-mutated), bubble size reflects the percentage of genes in the gene set, and color indicates FDR q-value. (C) Heatmap summarizing selected significant Hallmark pathways across the two pairwise GSEA comparisons. Each cell displays the FDR q-value for that comparison. Pathways were included if FDR < 0.05. ** indicates FDR < 0.05. (D) Gene set enrichment analysis (GSEA) using the Kohn epithelial and mesenchymal gene-expression signatures. (E) Top five compounds with the lowest mean drug-response AUC in TP53 + ARID1A co-mutated cancer cell lines. AUC is the normalized area under the fitted sigmoidal concentration–viability curve across the tested drug concentrations (range, 0–1); lower AUC indicates greater drug sensitivity. Repeated screens were averaged within each compound–cell-line pair. (F) Drug-response area under the curve (AUC) values were compared between TP53 + ARID1A co-mutated and non-co-mutated pancreatic cancer cell lines. Each MEK inhibitor was evaluated independently using a one-sided Wilcoxon rank-sum test to assess whether AUC values were lower in the co-mutated group. p values were adjusted for multiple comparisons across the five inhibitors using the Benjamini–Hochberg false discovery rate (FDR) procedure. (The line within each box represents the median AUC, and each point represents the AUC for an individual cell line after averaging repeated screens for the same compound cell-line pair.) (G) Drug-response shifts between TP53–ARID1A co-mutated and non-co-mutated CCLE pancreatic cancer cell lines. Each point represents an eligible compound with at least three non-missing AUC and IC50 measurements per mutation group. The x-axis shows the difference in arithmetic mean AUC (non-co-mutated minus co-mutated), whereas the y-axis shows the log2 ratio of geometric mean IC50 values (non-co-mutated/co-mutated). Red points identify the five compounds showing concordant improvement in both measures with the highest combined efficacy score, calculated as the geometric mean of the AUC and IC50 response ratios.
We next examined publicly available pharmacological screening data to identify potential therapeutic vulnerabilities associated with TP53 and ARID1A co-mutation. Compounds exhibiting the lowest area under the dose–response curve (AUC) values in co-mutated cell lines included sepantronium bromide (survivin pathway and redox-activated oxidative DNA damage), trametinib (MEK1/2 inhibition), thapsigargin (Ca2+-ATPase inhibition and endoplasmic reticulum stress), dacinostat (histone deacetylase inhibition), and bleomycin (DNA damage) [43,44,45,46,47,48,49] (Figure 6E). Given the increased inferred MEK1 activity identified by kinase-substrate enrichment analysis (KSEA) in co-mutated primary tumors, we further investigated whether MEK1/2 inhibitors exhibited greater activity against co-mutated cell lines. All five MEK1/2 inhibitors evaluated exhibited lower AUC values in co-mutated cell lines compared with the non-co-mutated subgroup, although only two reached nominal statistical significance and none reached corrected statistical significance (Figure 6F). Finally, we compared differences in log2-transformed half-maximal inhibitory concentration (IC50) and AUC values between co-mutated and non-co-mutated cell lines across the screened compounds. The five leading compounds based on the geometric mean differences included three MEK1/2 inhibitors (trametinib, CI-1040, and PD0325901), the histone deacetylase inhibitor vorinostat, and dimethyloxalylglycine (DMOG), a compound associated with hypoxia-inducible factor (HIF) stabilization [50,51,52] (Figure 6G).
4. Discussion
In this study, we identified that TP53 + ARID1A co-mutated PDAC represents a clinically aggressive and biologically distinct molecular subset. Across discovery and validation cohorts, co-mutated tumors showed inferior overall survival compared with non-co-mutated tumors. Multi-omic profiling indicated that this adverse phenotype is not explained by either mutation alone, but instead reflects a convergent state associated with EMT, proliferative and proteotoxic stress, metabolic remodeling, inflammatory signaling, tumor microenvironment reorganization, and inferred mTOR/MEK kinase activation.
These findings are consistent with, and extend, prior mechanistic work on ARID1A in PDAC. ARID1A encodes a core SWI/SNF subunit linked to lineage control, DNA damage response, and immune signaling across cancers, and its loss has been shown to promote EMT and sensitize PDAC models to proteotoxic stress [53,54]. Ferri-Borgogno et al. described a paradoxical role for ARID1A in restraining pancreatic carcinogenesis, in which loss impairs early tumor fitness unless tumors acquire a rare “escaper” mechanism of TP53 loss in mouse models [55]. Wang et al. also reported that, compared to TP53-mutated pancreatic cancer cells, ARID1A and TP53 co-mutated cell lines exhibited more mesenchymal morphology, enhanced anchorage-independent growth, and increased hallmark EMT gene expression [56]. Our clinical data may provide a human correlate: ARID1A-mutant tumors were frequently co-mutated with TP53, and this co-mutated subset showed the strongest adverse survival phenotype, supporting that TP53 mutation functions as one such escape event in humans as well, permitting ARID1A-deficient tumors to tolerate chromatin disruption and bypass checkpoint constraints. EMT enrichment tracked more closely with ARID1A alteration while proliferative pathway enrichment (E2F targets, G2/M checkpoint) tracked more closely with TP53 mutation. This is consistent with a model in which ARID1A dysfunction facilitates acinar cell fate reprogramming toward a more aggressive phenotypic state, which may subsequently undergo clonal expansion driven in part by the proliferative advantage conferred by TP53 alteration [57]. However, these findings should be interpreted with caution, as bulk RNA sequencing of PDAC tumors captures substantial stromal contributions that may inflate the observed enrichment of the Hallmark EMT signature [58]. Although the Kohn epithelial and mesenchymal signatures provide complementary evidence, they do not fully eliminate this potential confounding.
Phosphoproteomic analysis revealed consistently increased inferred MEK1 and mTOR activity in co-mutated tumors across all three comparisons. These findings suggest enhanced MAPK/MEK and mTOR signaling in the co-mutated group. Interestingly, PIK3CA, a kinase in the mTOR signaling pathway, is implicated in TP53/ARID1A-co-altered endometrial cancer [59]. MEK activation was accompanied by enrichment of MYC target pathways, consistent with MYC induction downstream of MAPK signaling. This occurred alongside increased mTOR activity and elevated proteotoxic-stress proteins, suggesting that the resulting increase in protein synthesis exceeds the cell’s folding and degradation capacity. A similar MYC/mTORC1 program has recently been linked to greater aggressiveness in KRAS G12D-mutant PDAC organoid models [60]. This convergence suggests that MYC-associated anabolic and proteostatic stress may represent a recurrent mechanism of aggressive PDAC biology across distinct genetic contexts, and nominates proteostasis, mTOR/MAPK, and DNA damage response pathways as candidate therapeutic dependencies.
Metabolic remodeling, immune dysregulation, and microenvironmental changes further characterize the co-mutated state. Downregulation of oxidative phosphorylation, fatty acid metabolism, and related pathways alongside increased hypoxia suggests broader metabolic disruption under stress-adapted conditions, notably contrasting with reports that ARID1A-deficient PDAC can be sensitive to fatty acid synthase inhibition—a discrepancy that may reflect differences between ARID1A loss alone versus TP53 + ARID1A co-mutation, or bulk-tissue confounding by stromal composition [61].
Co-mutated tumors were also enriched for interferon response, TNF-α signaling via NF-κB, TGF-β signaling, and inflammatory response pathways. Leading-edge and interaction analyses implicated inflammatory mediators including IL1A, G0S2, PHLDA1, CXCL6, SMAD3, KLF10, and PTX3. PTX3 is notable because it has been described as a stromally derived biomarker for PDAC detection [62]. IL31RA was also increased in co-mutated tumors, which is also notable given the established role of IL-31 receptor signaling in not only cancer invasion but also sensory-neuron activation, although its functional relevance in PDAC remains speculative [63,64]. Reduced plasma cell infiltration was accompanied by altered expression of CLDN18, TM4SF5, BCAR3, and WNT10A, increased EMB expression, and proteomic changes in NINJ1, LAMB3, and PALLD. Together, these findings suggest changes in immune infiltration, cell motility, and stromal remodeling that may contribute to desmoplasia and perineural invasion, consistent with previous single-cell and spatial transcriptomic studies [65,66,67,68,69,70,71,72]. Because these signals derive from bulk profiling of a small co-mutated group, they should be regarded as hypothesis-generating.
Cell-line transcriptomic analysis revealed increased enrichment of MYC Targets V1/V2, E2F Targets, and G2/M Checkpoint pathways in ARID1A/TP53 co-mutated models, consistent with the proliferative transcriptional programs observed in primary tumors. This concordance across primary tumors and cell-line models suggests that these proliferative signatures may reflect tumor-cell-associated transcriptional alterations rather than solely microenvironmental contributions. However, EMT-associated transcriptional profiles differed between the two settings. While primary tumors exhibited increased mesenchymal and decreased epithelial signatures, co-mutated cell lines showed reduced Hallmark EMT enrichment and generally lower Kohn epithelial and mesenchymal signatures compared with other subgroups. This discrepancy may reflect stromal contributions to bulk tumor transcriptomic profiles, particularly from cancer-associated fibroblasts, as well as phenotypic adaptation or selection under in vitro culture conditions and the absence of tumor–stromal interactions [73]. Together, these findings suggest that proliferative transcriptional programs associated with ARID1A/TP53 co-mutation may be relatively conserved, whereas EMT-associated phenotypes appear more context-dependent.
These findings situate TP53 + ARID1A co-mutated PDAC within established molecular subtype frameworks. The EMT, hypoxia, MYC, inflammatory, and stromal remodeling signatures overlap conceptually with aggressive basal-like/squamous transcriptomic subtypes and with Moffitt et al.’s tumor-intrinsic basal-like and activated-stroma subtypes, both of which carry adverse prognostic implications [18,74]. This raises the possibility that TP53 + ARID1A co-mutation represents a genetic route into these aggressive transcriptional states. From a therapeutic perspective, KSEA suggested increased MEK1 and mTOR signaling in ARID1A/TP53 co-mutated tumors. Consistent with the inferred MEK1 activation, pharmacological profiling revealed a trend toward greater sensitivity to the MEK1/2 inhibitors CI-1040 and PD0325901 in co-mutated cell lines, suggesting that MAPK/MEK signaling may represent a potential therapeutic vulnerability. Additionally, elevated ATR-associated stress-response signaling warrants further investigation, given previous reports of sensitivity to ATR inhibition in ARID1A-deficient tumors and WEE1 inhibition in ARID1A/TP53 co-altered colorectal cancer [75,76]. However, these findings remain exploratory, and further validation in genetically defined PDAC models is necessary to establish whether these signaling alterations confer actionable therapeutic dependencies.
Several limitations should be noted. The MSK cohort was annotated as pancreatic adenocarcinoma rather than uniformly histology-confirmed PDAC, and as a result the independent survival validation followed the same convention, though molecular analyses were restricted to histology-confirmed cases where available. The Leiden-based clustering analysis is dependent on MSK-IMAPCT data available on cBioPortal prior to the May 2026 update. ARID1A and TP53 co-mutation status was determined from bulk tumor sequencing and therefore does not establish whether both mutations coexist within the same malignant cells or are present across all tumor cells. The relatively small number of ARID1A and TP53 co-mutated tumors, particularly in the transcriptomic (n = 12) and proteomic/phosphoproteomic (n = 4) analyses, limits statistical power and warrants cautious interpretation of the findings. Bulk tumor profiling cannot fully separate tumor-intrinsic biology from stromal composition, immune infiltration, tumor purity, or treatment history. KSEA infers kinase activity from phosphosite substrates and should not be interpreted as direct enzymatic measurement. ARID1A alterations may also differ functionally by mutation type, zygosity, and protein loss. The proposed TP53-mediated “escape” model remains hypothesis-generating; definitive causality will require isogenic TP53/ARID1A perturbation models, phosphosite-level validation, spatial pathology, and drug-sensitivity experiments.
5. Conclusions
In conclusion, TP53 + ARID1A co-mutation defines an aggressive PDAC subset characterized by potential coordinated EMT, proliferative and proteotoxic stress, metabolic remodeling, inflammatory signaling, microenvironmental reorganization, and mTOR/MEK-centered kinase activation. These data extend prior experimental models of ARID1A biology in pancreatic cancer and support a model in which TP53 mutation enables ARID1A-deficient tumors to escape growth constraints. Given that this co-mutation recurs across cancer types, it may represent a conserved mechanism of aggressive tumor evolution warranting further mechanistic and translational study.
Supplementary Materials
The following supporting information can be downloaded at: https://www.mdpi.com/article/10.3390/cancers18223607/s1, Supplementary Figures S1–S4. Supplementary Figure S1. Independent Verification Cohort with MSK-50K Added. Non-overlapping patients from the MSK-50K dataset were incorporated into the independent validation cohort. This expanded cohort spans five datasets: QCMG, TCGA PanCan-PCAWG 2020, TCGA PanCan-2018, CPTAC, and MSK-50K. (A–C) KM curve for overall survival comparing ARID1A-mutated (Altered, n = 53) versus WT (n = 662), TP53-mutated (Altered, n = 468) versus WT (n = 247), ARID1A + TP53 co-mutation (Altered, n = 35) versus all others (WT, n = 680), and patients in the expanded independent cohort. (D) KM curve comparing TP53 + ARID1A co-mutated (n = 35), TP53-only mutated (n = 433), and ARID1A-only mutated (n = 18) patients. (E) Dot plot showing median OS estimates (months) across mutation groups in the expanded independent cohort. (F) Forest plot from univariate Cox proportional hazards regression using TP53 + ARID1A co-mutation as the reference group. ∗ p < 0.05. (G) Pie chart showing the distribution of TP53 and ARID1A mutation status in the expanded independent verification cohort. (H) KM curves showing overall survival by individual cohort in the expanded verification set. Supplementary Figure S2. Confounder Assessment and Supporting Transcriptomic Analyses. Prior to differential gene expression and pathway analyses, age at diagnosis and sex composition were compared across the four mutation groups in the mRNA supercohort (CPTAC, QCMG, TCGA combined) to assess potential confounding. (A–C) Box plot comparing age at diagnosis comparing TP53 + ARID1A co-mutated tumors vs. ARID1A-only mutated tumors, and vs. TP53-only mutated patients. (D) Stacked bar chart showing sex composition (male [blue] vs. female [red]) across the four mutation subgroups. (E) Volcano plot showing differential gene expression between TP53 + ARID1A co-mutated and not co-mutated patients. x-axis = Log2 Fold Change; y-axis = −log10 FDR-adjusted p-value. Red dots = significantly upregulated in co-mutated; blue dots = significantly downregulated; gray = not significant. Top 5 up and down significantly regulated genes by Log2 fold change annotated on the graph. (F) Bar chart showing all genes that are significantly differentially expressed between TP53 + ARID1A co-mutated tumors versus not co-mutated tumors as indicated in (E). (G,H) Volcano plot showing differential gene expression between TP53 + ARID1A co-mutated vs. TP53-only mutated tumors and ARID1A-only mutated tumors. No gene passed FDR-corrected significance. Top 5 up and down regulated genes by Log2 fold change annotated on the graph. (I) Volcano plot of TP53 × ARID1A interaction coefficients for all genes (x = interaction coefficient; y = −log10 FDR-adjusted p-value. This analysis quantifies how much of the co-mutated gene expression signature exceeds what would be predicted from the additive effects of TP53 and ARID1A mutations alone. No gene passed FDR-corrected significance. Top 5 up and down regulated genes by Log2 fold change annotated on the graph. (J) GSEA bubble plot using TP53 × ARID1A interaction coefficients as the ranking metric, testing whether entire Hallmark pathways are synergistically elevated or decreased in the co-mutated state beyond additive expectations. (K) Top 20 genes in TNF-Alpha Signaling Via NF-kB pathway whose elevation exceeds what would be predicted from the additive effects of TP53 and ARID1A mutations alone in TP53 and ARID1A interaction analysis (ARID1A x TP53). (L–N) Leading edge bar charts for the TNF-Alpha Signaling Via NF-kB pathway across each pairwise comparison. Bars are color-coded as follows: gold = gene appeared in Panel I (synergistic interaction) and is in the top leading-edge genes across all three comparisons; pale orange = gene appeared in Panel I but only in one specific comparison; solid red = gene is in the leading edge across all three comparisons but was not identified in Panel I; pale red = gene is unique to that specific comparison group only. (O) Dataset composition for each mutation-status comparison group used in the mRNA supercohort. (P) Violin plot comparing TMB (nonsynonymous) in primary tumors between TP53 + ARID1A co-mutated and not TP53 + ARID1A co-mutated patients in MSK-IMPACT dataset. **** p < 0.0001. (Q) Violin plot comparing TMB across all four mutation groups in primary tumors: TP53 + ARID1A, TP53 alone, ARID1A alone, and neither mutated. TP53 + ARID1A median TMB = 5.19 mutations/Mb, TP53 alone median TMB = 3.46 mutations/Mb, ARID1A alone median TMB = 4.32 mutations/Mb, and neither mutated median TMB = 2.59 mutations/Mb. Two-sided Mann-Whitney U test. Supplementary Figure S3. CIBERSORTx Evaluability, ESTIMATE Scores, and Pooled Z-Score Comparisons. (A) Heatmap displaying the fraction of samples with an absolute immune cell fraction of exactly zero (zero-inflation) for all 22 CIBERSORTx cell types, shown separately for CPTAC (left) and TCGA (right), stratified by mutation group. Color intensity reflects the proportion of samples with a zero value. Cell types below the black dashed line are not evaluated at all. Pooled Z-score analysis only used cell types above the grey dashed line. (B,C) Box plots of ESTIMATE stromal score, immune score, and inferred purity in CPTAC and TCGA, stratified by mutation group (TP53 + ARID1A, ARID1A-only, TP53-only, not TP53 + ARID1A co-mutated). Pairwise comparisons are shown with p-values. (D–F) Pooled z-score mean differences for TP53 + ARID1A co-mutated vs. not co-mutated, vs. TP53-only, and vs. ARID1A-only for all evaluable cell types. Supplementary Figure S4. Detailed Proteome and Phosphoproteome Analysis Results. The supplementary figure provides volcano plots displaying raw differential protein and phosphosite abundance prior to pathway-level GSEA and KSEA analyses. (A–C) Volcano plot of proteome differential expression between TP53 + ARID1A co-mutated vs. not co-mutated, vs. TP53-only mutated, vs. ARID1A-only mutated tumors. x-axis = Log2 Fold Change; y-axis = −log10(FDR-adjusted p-value). Red dots = significantly upregulated in co-mutated (FDR < 0.05); blue dots = significantly downregulated; gray = not significant. Significantly changed genes and top 5 non-significantly up or down regulated genes by Log2 Fold change magnitude are annotated in the graph. (D,E) Volcano plot of phosphoproteome differential phosphorylation between TP53 + ARID1A co-mutated vs. not co-mutated, vs. TP53-only mutated, vs. ARID1A-only mutated tumors. Top 5 significantly up or down regulated phosphorylation sites are annotated in the graph. If no significance, 5 non-significantly up or down regulated genes by Log2 Fold change magnitude are annotated in the graph. (H–J) Kinase-Substrate Enrichment Analysis (KSEA) dot plot for TP53 + ARID1A co-mutated vs. not co-mutated, vs.TP53 mutated alone, and vs. ARID1A mutated alone. (K) Horizontal bar chart illustrating sample sizes available for proteome (blue) and phosphoproteome (green) analysis in CPTAC by mutation group.
Author Contributions
Conceptualization, A.Z., S.M. and E.R.C.; methodology, A.Z. and E.R.C.; software, A.Z. and S.A.M.; validation, A.Z. and S.A.M.; formal analysis, A.Z. and S.A.M.; investigation, A.Z.; resources, A.Z., S.M., S.A.M. and R.B.; data curation, S.M. and A.Z.; writing—original draft preparation, A.Z., S.M. and S.A.M.; writing—review and editing, A.Z., S.M., S.A.M., R.B. and E.R.C.; visualization, A.Z. and R.B.; supervision, R.B. and E.R.C. All authors have read and agreed to the published version of the manuscript.
Funding
This research received no external funding.
Institutional Review Board Statement
Not applicable.
Informed Consent Statement
Not applicable.
Data Availability Statement
The code used to analyze data and generate figures can be found at: https://github.com/Heliomycete/Concurrent-TP53-and-ARID1A-Mutations-Define-a-Distinct-Aggressive-Molecular-Subtype-of-PDAC-.git, accessed on 26 October 2026. The links to cBioPortal datasets used in the study are included in the github repository.
Acknowledgments
The authors thank Bing Zhang, for his review of the computational analyses. During the preparation of this manuscript, the authors used ChatGPT (GPT5–GPT6.1), Gemini 3–3.6, and Claude Opus 4.6 for the purposes of code writing, method development, and manuscript editing. The authors have reviewed and edited the output and take full responsibility for the content of this publication.
Conflicts of Interest
The authors declare no conflicts of interest.
Abbreviations
The following abbreviations are used in this manuscript:
| BH-FDR | Benjamini–Hochberg false discovery rate |
| CPTAC | Clinical Proteomic Tumor Analysis Consortium |
| EMT | Epithelial–mesenchymal transition |
| GSEA | Gene set enrichment analysis |
| KNN | K-nearest neighbor |
| KSEA | Kinase-substrate enrichment analysis |
| Lasso | Least absolute shrinkage and selection operator |
| Limma eBayes | Linear Models for Microarray Data Empirical Bayes |
| MEK1 | Mitogen-activated protein kinase kinase 1 |
| MSK-50K | Memorial Sloan Kettering 50,000-patient cohort |
| MSK-IMPACT | Memorial Sloan Kettering Integrated Mutation Profiling of Actionable Cancer Targets |
| mTOR | Mechanistic target of rapamycin |
| NES | Normalized enrichment score |
| PCAWG | Pan-Cancer Analysis of Whole Genomes |
| PDAC | Pancreatic ductal adenocarcinoma |
| QCMG | Queensland Centre of Medical Genomics |
| SWI/SNF | Switch/sucrose non-fermentable |
| UMAP | Uniform Manifold Approximation and Projection |
| CI | Confidence interval |
| CNV | Copy number variation |
| FDR | False discovery rate |
| ICGC | International Cancer Genome Consortium |
| MAPK | Mitogen-activated protein kinase |
| NF-κB | Nuclear factor kappa B |
| OS | Overall survival |
| PI3K/AKT | Phosphoinositide 3-kinase/protein kinase B |
| TCGA | The Cancer Genome Atlas |
| TGF-β | Transforming growth factor beta |
| TNF-α | Tumor necrosis factor alpha |
References
- Stoffel, E.M.; Brand, R.E.; Goggins, M. Pancreatic Cancer: Changing Epidemiology and New Approaches to Risk Assessment, Early Detection, and Prevention. Gastroenterology 2023, 164, 752–765. [Google Scholar] [CrossRef] [Scilit]
- Park, W.; Chawla, A.; O’Reilly, E.M. Pancreatic cancer: A review. JAMA 2021, 326, 851–862. [Google Scholar] [CrossRef] [Scilit]
- Rahib, L.; Coffin, T.; Kenner, B. Factors Driving Pancreatic Cancer Survival Rates. Pancreas 2025, 54, e530–e536. [Google Scholar] [CrossRef] [Scilit]
- Principe, D.R.; Underwood, P.W.; Korc, M.; Trevino, J.G.; Munshi, H.G.; Rana, A. The Current Treatment Paradigm for Pancreatic Ductal Adenocarcinoma and Barriers to Therapeutic Efficacy. Front. Oncol. 2021, 11, 688377. [Google Scholar] [CrossRef] [Scilit]
- Hahn, S.; Lüttges, J.; Klöppel, G. Where and When Does Pancreatic Carcinoma Start? Med. Klin. 2004, 99, 191–195. [Google Scholar] [CrossRef] [Scilit]
- Luo, J. KRAS mutation in pancreatic cancer. Semin. Oncol. 2021, 48, 10–18. [Google Scholar] [CrossRef] [Scilit]
- Pradeep, R.; Isbeih, N.J.; Abraham, F.F.; Noori, E.; Yeung, Z.P.; Kundranda, M.N. KRAS Inhibition in Pancreatic Ductal Adenocarcinoma. J. Clin. Med. 2026, 15, 873. [Google Scholar] [CrossRef] [Scilit]
- Hayashi, A.; Hong, J.; Iacobuzio-Donahue, C.A. The pancreatic cancer genome revisited. Nat. Rev. Gastroenterol. Hepatol. 2021, 18, 469–481. [Google Scholar] [CrossRef] [Scilit]
- Ying, H.; Kimmelman, A.C.; Bardeesy, N.; Kalluri, R.; Maitra, A.; DePinho, R.A. Genetics and biology of pancreatic ductal adenocarcinoma. Genes Dev. 2024, 39, 36–63. [Google Scholar] [CrossRef] [Scilit]
- Kimura, Y.; Fukuda, A.; Ogawa, S.; Maruno, T.; Takada, Y.; Tsuda, M.; Hiramatsu, Y.; Araki, O.; Nagao, M.; Yoshikawa, T.; et al. ARID1A Maintains Differentiation of Pancreatic Ductal Cells and Inhibits Development of Pancreatic Ductal Adenocarcinoma in Mice. Gastroenterology 2018, 155, 194–209.e2. [Google Scholar] [CrossRef] [Scilit]
- Wang, S.C.; Nassour, I.; Xiao, S.; Zhang, S.; Luo, X.; Lee, J.; Li, L.; Sun, X.; Nguyen, L.H.; Chuang, J.-C.; et al. SWI/SNF component ARID1A restrains pancreatic neoplasia formation. Gut 2018, 68, 1259–1270. [Google Scholar] [CrossRef] [Scilit]
- Livshits, G.; Alonso-Curbelo, D.; Morris, J.P.; Koche, R.; Saborowski, M.; Wilkinson, J.E.; Lowe, S.W. Arid1a restrains Kras-dependent changes in acinar cell identity. eLife 2018, 7, e35216. [Google Scholar] [CrossRef] [Scilit]
- Bakr, A.; Della Corte, G.; Veselinov, O.; Kelekçi, S.; Chen, M.-J.M.; Lin, Y.-Y.; Sigismondo, G.; Iacovone, M.; Cross, A.; Syed, R.; et al. ARID1A regulates DNA repair through chromatin organization and its deficiency triggers DNA damage-mediated anti-tumor immune response. Nucleic Acids Res. 2024, 52, 5698–5719. [Google Scholar] [CrossRef] [Scilit]
- Shen, J.; Ju, Z.; Zhao, W.; Wang, L.; Peng, Y.; Ge, Z.; Nagel, Z.D.; Zou, J.; Wang, C.; Kapoor, P.; et al. ARID1A deficiency promotes mutability and potentiates therapeutic antitumor immunity unleashed by immune checkpoint blockade. Nat. Med. 2018, 24, 556–562. [Google Scholar] [CrossRef] [Scilit]
- Li, J.; Wang, W.; Zhang, Y.; Cieślik, M.; Guo, J.; Tan, M.; Green, M.D.; Wang, W.; Lin, H.; Li, W.; et al. Epigenetic driver mutations in ARID1A shape cancer immune phenotype and immunotherapy. J. Clin. Investig. 2020, 130, 2712–2726. [Google Scholar] [CrossRef] [Scilit]
- Varghese, A.M.; Perry, M.A.; Chou, J.F.; Nandakumar, S.; Muldoon, D.; Erakky, A.; Zucker, A.; Fong, C.; Mehine, M.; Nguyen, B.; et al. Clinicogenomic landscape of pancreatic adenocarcinoma identifies KRAS mutant dosage as prognostic of overall survival. Nat. Med. 2025, 31, 466–477. [Google Scholar] [CrossRef] [Scilit]
- Bandlamudi, C.; Muldoon, D.; de Bruijn, I.; Zhang, M.; Gormally, M.V.; Harrold, E.C.; Nandakumar, S.; Smith, S.A.; Jeng, M.Y.; Woods, S.; et al. Cancer type-specific variation in patterns of driver alterations across 50,000 tumors. Cancer Cell 2026, 44, 1045–1062.e6. [Google Scholar] [CrossRef] [Scilit]
- Bailey, P.; Chang, D.K.; Nones, K.; Johns, A.L.; Patch, A.-M.; Gingras, M.-C.; Miller, D.K.; Christ, A.N.; Bruxner, T.J.C.; Quinn, M.C.; et al. Genomic analyses identify molecular subtypes of pancreatic cancer. Nature 2016, 531, 47–52. [Google Scholar] [CrossRef] [Scilit]
- Cao, L.; Huang, C.; Cui Zhou, D.; Hu, Y.; Lih, T.M.; Savage, S.R.; Krug, K.; Clark, D.J.; Schnaubelt, M.; Chen, L.; et al. Proteogenomic characterization of pancreatic ductal adenocarcinoma. Cell 2021, 184, 5031–5052.e26. [Google Scholar] [CrossRef] [Scilit]
- The ICGC/TCGA Pan-Cancer Analysis of Whole Genomes Consortium. Pan-cancer analysis of whole genomes. Nature 2020, 578, 82–93. [Google Scholar] [CrossRef] [Scilit]
- Hutter, C.; Zenklusen, J.C. The Cancer Genome Atlas: Creating Lasting Value beyond Its Data. Cell 2018, 173, 283–285. [Google Scholar] [CrossRef] [Scilit]
- Raphael, B.J.; Hruban, R.H.; Aguirre, A.J.; Moffitt, R.A.; Yeh, J.J.; Stewart, C.; Robertson, A.G.; Cherniack, A.D.; Gupta, M.; Getz, G.; et al. Integrated Genomic Characterization of Pancreatic Ductal Adenocarcinoma. Cancer Cell 2017, 32, 185–203.e13. [Google Scholar] [CrossRef] [Scilit]
- Ghandi, M.; Huang, F.W.; Jané-Valbuena, J.; Kryukov, G.V.; Lo, C.C.; McDonald, E.R., III; Barretina, J.; Gelfand, E.T.; Bielski, C.M.; Li, H.; et al. Next-generation characterization of the Cancer Cell Line Encyclopedia. Nature 2019, 569, 503–508. [Google Scholar] [CrossRef] [Scilit]
- de Bruijn, I.; Kundra, R.; Mastrogiacomo, B.; Tran, T.N.; Sikina, L.; Mazor, T.; Li, X.; Ochoa, A.; Zhao, G.; Lai, B.; et al. Analysis and visualization of longitudinal genomic and clinical data from the AACR Project GENIE Bio-pharma Collaborative in cBioPortal. Cancer Res. 2023, 83, 3861–3867. [Google Scholar] [CrossRef] [Scilit]
- Gao, J.; Aksoy, B.A.; Dogrusoz, U.; Dresdner, G.; Gross, B.E.; Sumer, S.O.; Sun, Y.; Jacobsen, A.; Sinha, R.; Larsson, E.; et al. Integrative Analysis of Complex Cancer Genomics and Clinical Profiles Using the cBioPortal. Sci. Signal. 2013, 6, pl1. [Google Scholar] [CrossRef] [Scilit]
- Cerami, E.; Gao, J.; Dogrusoz, U.; Gross, B.E.; Sumer, S.O.; Aksoy, B.A.; Jacobsen, A.; Byrne, C.J.; Heuer, M.L.; Larsson, E.; et al. The cBio cancer genomics portal: An open platform for exploring multidimensional cancer genomics data. Cancer Discov. 2012, 2, 401–404, Erratum in Cancer Discov. 2012, 2, 960. https://doi.org/10.1158/2159-8290.CD-12-0326. [Google Scholar] [CrossRef] [Scilit] [PubMed] [PubMed Central]
- Gower, J.C. A General Coefficient of Similarity and Some of Its Properties. Biometrics 1971, 27, 857. [Google Scholar] [CrossRef] [Scilit]
- Pedregosa, F.; Varoquaux, G.; Gramfort, A.; Michel, V.; Thirion, B.; Grisel, O.; Blondel, M.; Prettenhofer, P.; Weiss, R.; Dubourg, V.; et al. Scikit-learn: Machine learning in Python. J. Mach. Learn. Res. 2011, 12, 2825–2830. [Google Scholar]
- Traag, V.A.; Waltman, L.; Van Eck, N.J. From Louvain to Leiden: Guaranteeing well-connected communities. Sci. Rep. 2019, 9, 5233. [Google Scholar] [CrossRef] [Scilit]
- McInnes, L.; Healy, J.; Saul, N.; Großberger, L. UMAP: Uniform Manifold Approximation and Projection. J. Open Source Softw. 2018, 3, 861. [Google Scholar] [CrossRef] [Scilit]
- Ritchie, M.E.; Phipson, B.; Wu, D.; Hu, Y.; Law, C.W.; Shi, W.; Smyth, G.K. limma powers differential expression analyses for RNA-sequencing and microarray studies. Nucleic Acids Res. 2015, 43, e47. [Google Scholar] [CrossRef] [Scilit]
- Benjamini, Y.; Hochberg, Y. Controlling the False Discovery Rate: A Practical and Powerful Approach to Multiple Testing. J. R. Stat. Soc. Ser. B Methodol. 1995, 57, 289–300. [Google Scholar] [CrossRef] [Scilit]
- Fang, Z.; Liu, X.; Peltz, G. GSEApy: A comprehensive package for performing gene set enrichment analysis in Python. Bioinformatics 2022, 39, btac757. [Google Scholar] [CrossRef] [Scilit]
- Mootha, V.K.; Lindgren, C.M.; Eriksson, K.-F.; Subramanian, A.; Sihag, S.; Lehar, J.; Puigserver, P.; Carlsson, E.; Ridderstråle, M.; Laurila, E.; et al. PGC-1α-responsive genes involved in oxidative phosphorylation are coordinately downregulated in human diabetes. Nat. Genet. 2003, 34, 267–273. [Google Scholar] [CrossRef] [Scilit]
- Subramanian, A.; Tamayo, P.; Mootha, V.K.; Mukherjee, S.; Ebert, B.L.; Gillette, M.A.; Paulovich, A.; Pomeroy, S.L.; Golub, T.R.; Lander, E.S.; et al. Gene set enrichment analysis: A knowledge-based approach for interpreting genome-wide expression profiles. Proc. Natl. Acad. Sci. USA 2005, 102, 15545–15550. [Google Scholar] [CrossRef] [Scilit]
- Kohn, K.W.; Zeeberg, B.M.; Reinhold, W.C.; Pommier, Y. Gene Expression Correlations in Human Cancer Cell Lines Define Molecular Interaction Networks for Epithelial Phenotype. PLoS ONE 2014, 9, e99269. [Google Scholar] [CrossRef] [Scilit]
- Rajapakse, V.N.; Luna, A.; Yamade, M.; Loman, L.; Varma, S.; Sunshine, M.; Iorio, F.; Sousa, F.G.; Elloumi, F.; Aladjem, M.I.; et al. CellMinerCDB for Integrative Cross-Database Genomics and Pharmacogenomics Analyses of Cancer Cell Lines. iScience 2018, 10, 247–264. [Google Scholar] [CrossRef] [Scilit]
- Newman, A.M.; Steen, C.B.; Liu, C.L.; Gentles, A.J.; Chaudhuri, A.A.; Scherer, F.; Khodadoust, M.S.; Esfahani, M.S.; Luca, B.A.; Steiner, D.; et al. Determining cell type abundance and expression from bulk tissues with digital cytometry. Nat. Biotechnol. 2019, 37, 773–782. [Google Scholar] [CrossRef] [Scilit]
- Kammers, K.; Cole, R.N.; Tiengwe, C.; Ruczinski, I. Detecting significant changes in protein abundance. EuPA Open Proteom. 2015, 7, 11–19. [Google Scholar] [CrossRef] [Scilit]
- van Ooijen, M.P.; Jong, V.L.; Eijkemans, M.J.C.; Heck, A.J.R.; Andeweg, A.C.; Binai, N.A.; van den Ham, H.-J. Identification of differentially expressed peptides in high-throughput proteomics data. Brief. Bioinform. 2018, 19, 971–981. [Google Scholar] [CrossRef] [Scilit]
- Casado, P.; Rodriguez-Prados, J.-C.; Cosulich, S.C.; Guichard, S.; Vanhaesebroeck, B.; Joel, S.; Cutillas, P.R. Kinase-Substrate Enrichment Analysis Provides Insights into the Heterogeneity of Signaling Pathway Activation in Leukemia Cells. Sci. Signal. 2013, 6, rs6. [Google Scholar] [CrossRef] [Scilit]
- Yoshihara, K.; Shahmoradgoli, M.; Martínez, E.; Vegesna, R.; Kim, H.; Torres-Garcia, W.; Treviño, V.; Shen, H.; Laird, P.W.; Levine, D.A.; et al. Inferring tumour purity and stromal and immune cell admixture from expression data. Nat. Commun. 2013, 4, 2612. [Google Scholar] [CrossRef] [Scilit]
- Nakahara, T.; Takeuchi, M.; Kinoyama, I.; Minematsu, T.; Shirasuna, K.; Matsuhisa, A.; Kita, A.; Tominaga, F.; Yamanaka, K.; Kudoh, M.; et al. YM155, a Novel Small-Molecule Survivin Suppressant, Induces Regression of Established Human Hormone-Refractory Prostate Tumor Xenografts. Cancer Res. 2007, 67, 8014–8021, Correction in Cancer Res. 2012, 72, 3886. https://doi.org/10.1158/0008-5472.CAN-12-1648. [Google Scholar] [CrossRef] [Scilit]
- Wani, T.H.; Surendran, S.; Jana, A.; Chakrabarty, A.; Chowdhury, G. Quinone-Based Antitumor Agent Sepantronium Bromide (YM155) Causes Oxygen-Independent Redox-Activated Oxidative DNA Damage. Chem. Res. Toxicol. 2018, 31, 612–618. [Google Scholar] [CrossRef] [Scilit]
- Gilmartin, A.G.; Bleam, M.R.; Groy, A.; Moss, K.G.; Minthorn, E.A.; Kulkarni, S.G.; Rominger, C.M.; Erskine, S.; Fisher, K.E.; Yang, J.; et al. GSK1120212 (JTP-74057) Is an Inhibitor of MEK Activity and Activation with Favorable Pharmacokinetic Properties for Sustained In Vivo Pathway Inhibition. Clin. Cancer Res. 2011, 17, 989–1000, Correction in Clin. Cancer Res. 2012, 18, 2413. https://doi.org/10.1158/1078-0432.CCR-12-0606. [Google Scholar] [CrossRef] [Scilit]
- Thastrup, O.; Cullen, P.J.; Drobak, B.K.; Hanley, M.R.; Dawson, A.P. Thapsigargin, a tumor promoter, discharges intracellular Ca2+ stores by specific inhibition of the endoplasmic reticulum Ca2(+)-ATPase. Proc. Natl. Acad. Sci. USA 1990, 87, 2466–2470. [Google Scholar] [CrossRef] [Scilit]
- Atadja, P.; Gao, L.; Kwon, P.; Trogani, N.; Walker, H.; Hsu, M.; Yeleswarapu, L.; Chandramouli, N.; Perez, L.; Versace, R.; et al. Selective Growth Inhibition of Tumor Cells by a Novel Histone Deacetylase Inhibitor, NVP-LAQ824. Cancer Res. 2004, 64, 689–695. [Google Scholar] [CrossRef] [Scilit]
- Chen, J.; Ghorai, M.K.; Kenney, G.; Stubbe, J. Mechanistic studies on bleomycin-mediated DNA damage: Multiple binding modes can result in double-stranded DNA cleavage. Nucleic Acids Res. 2008, 36, 3781–3790. [Google Scholar] [CrossRef] [Scilit]
- Li, M.; Baumeister, P.; Roy, B.; Phan, T.; Foti, D.; Luo, S.; Lee, A.S. ATF6 as a Transcription Activator of the Endoplasmic Reticulum Stress Element: Thapsigargin Stress-Induced Changes and Synergistic Interactions with NF-Y and YY1. Mol. Cell. Biol. 2000, 20, 5096–5106. [Google Scholar] [CrossRef] [Scilit]
- Barrett, S.D.; Bridges, A.J.; Dudley, D.T.; Saltiel, A.R.; Fergus, J.H.; Flamme, C.M.; Delaney, A.M.; Kaufman, M.; Lepage, S.; Leopold, W.R.; et al. The discovery of the benzhydroxamate MEK inhibitors CI-1040 and PD 0325901. Bioorg. Med. Chem. Lett. 2008, 18, 6501–6504. [Google Scholar] [CrossRef] [Scilit]
- Richon, V.M.; Emiliani, S.; Verdin, E.; Webb, Y.; Breslow, R.; Rifkind, R.A.; Marks, P.A. A class of hybrid polar inducers of transformed cell differentiation inhibits histone deacetylases. Proc. Natl. Acad. Sci. USA 1998, 95, 3003–3007. [Google Scholar] [CrossRef] [Scilit]
- Elvidge, G.P.; Glenny, L.; Appelhoff, R.J.; Ratcliffe, P.J.; Ragoussis, J.; Gleadle, J.M. Concordant Regulation of Gene Expression by Hypoxia and 2-Oxoglutarate-Dependent Dioxygenase Inhi-bition: The Role of HIF-1α, HIF-2α, and Other Pathways. J. Biol. Chem. 2006, 281, 15215–15226. [Google Scholar]
- Mittal, P.; Roberts, C.W.M. The SWI/SNF complex in cancer—Biology, biomarkers and therapy. Nat. Rev. Clin. Oncol. 2020, 17, 435–448. [Google Scholar] [CrossRef] [Scilit]
- Tomihara, H.; Carbone, F.; Perelli, L.; Huang, J.K.; Soeung, M.; Rose, J.L.; Robinson, F.S.; Deribe, Y.L.; Feng, N.; Takeda, M.; et al. Loss of ARID1A Promotes Epithelial–Mesenchymal Transition and Sensitizes Pancreatic Tumors to Proteotoxic Stress. Cancer Res. 2020, 81, 332–343. [Google Scholar] [CrossRef] [Scilit]
- Ferri-Borgogno, S.; Barui, S.; McGee, A.M.; Griffiths, T.; Singh, P.K.; Piett, C.G.; Ghosh, B.; Bhattacharyya, S.; Singhi, A.; Pradhan, K.; et al. Paradoxical Role of AT-rich Interactive Domain 1A in Restraining Pancreatic Carcinogenesis. Cancers 2020, 12, 2695. [Google Scholar] [CrossRef] [Scilit]
- Wang, W.; Friedland, S.C.; Guo, B.; O’dEll, M.R.; Alexander, W.B.; Whitney-Miller, C.L.; Agostini-Vulaj, D.; Huber, A.R.; Myers, J.R.; Ashton, J.M.; et al. ARID1A, a SWI/SNF subunit, is critical to acinar cell homeostasis and regeneration and is a barrier to transformation and epithelial-mesenchymal transition in the pancreas. Gut 2018, 68, 1245–1258. [Google Scholar] [CrossRef] [Scilit]
- Zhang, X.; Du, Y.; Behrens, A.; Lan, L. Emerging insights into lineage plasticity in pancreatic cancer initiation, progression, and therapy resistance. Dev. Cell 2025, 60, 2391–2406. [Google Scholar] [CrossRef] [Scilit]
- Szabo, P.M.; Vajdi, A.; Kumar, N.; Tolstorukov, M.Y.; Chen, B.J.; Edwards, R.; Ligon, K.L.; Chasalow, S.D.; Chow, K.-H.; Shetty, A.; et al. Cancer-associated fibroblasts are the main contributors to epithelial-to-mesenchymal signatures in the tumor microenvironment. Sci. Rep. 2023, 13, 3051. [Google Scholar] [CrossRef] [Scilit]
- Reske, J.J.; Wilson, M.R.; Holladay, J.; Siwicki, R.A.; Skalski, H.; Harkins, S.; Adams, M.; Risinger, J.I.; Hostetter, G.; Lin, K.; et al. Co-existing TP53 and ARID1A mutations promote aggressive endometrial tumorigenesis. PLoS Genet. 2021, 17, e1009986. [Google Scholar] [CrossRef] [Scilit]
- McIntyre, C.A.; Grimont, A.; Park, J.; Meng, Y.; Sisso, W.J.; Seier, K.; Jang, G.H.; Walch, H.; Aveson, V.G.; Falvo, D.J.; et al. Distinct clinical outcomes and biological features of specific KRAS mutants in human pancreatic cancer. Cancer Cell 2024, 42, 1614–1629.e5. [Google Scholar] [CrossRef] [Scilit]
- Kuo, T.; Hou, Y.; Shan, Y.; Chen, L.; Hung, W. Arid1a deficiency sensitises pancreatic cancer to fatty acid synthase inhibition. Clin. Transl. Med. 2025, 15, e70394. [Google Scholar] [CrossRef] [Scilit]
- Goulart, M.R.; Watt, J.; Siddiqui, I.; Lawlor, R.T.; Imrali, A.; Hughes, C.; Saad, A.; ChinAleong, J.; Hurt, C.; Cox, C.; et al. Pentraxin 3 is a stromally-derived biomarker for detection of pancreatic ductal adenocarcinoma. npj Precis. Oncol. 2021, 5, 61. [Google Scholar] [CrossRef] [Scilit]
- Cevikbas, F.; Wang, X.; Akiyama, T.; Kempkes, C.; Savinko, T.; Antal, A.; Kukova, G.; Buhl, T.; Ikoma, A.; Buddenkotte, J.; et al. A sensory neuron–expressed IL-31 receptor mediates T helper cell–dependent itch: Involvement of TRPV1 and TRPA1. J. Allergy Clin. Immunol. 2014, 133, 448–460.e7. [Google Scholar] [CrossRef] [Scilit]
- Davidi, S.; Fremder, E.; Kan, T.; Raviv, Z.; Timaner, M.; Karin, N.; Hershkovitz, D.; Arohneim, A.; Shaked, Y. The antiangiogenic role of the pro-inflammatory cytokine interleukin-31. Oncotarget 2017, 8, 16430–16444. [Google Scholar] [CrossRef] [Scilit]
- Jung, D.E.; Kim, J.M.; Kim, C.; Song, S.Y. Embigin is overexpressed in pancreatic ductal adenocarcinoma and regulates cell motility through epithelial to mesenchymal transition via the TGF-β pathway. Mol. Carcinog. 2015, 55, 633–645. [Google Scholar] [CrossRef] [Scilit]
- Tomita, Y.; Horiuchi, K.; Kano, K.; Tatsukawa, T.; Matsuo, R.; Hayasaka, T.; Yoshida, Y.; Kabara, M.; Yasuda, S.; Nakajima, K.; et al. Ninjurin 1 mediates peripheral nerve regeneration through Schwann cell maturation of NG2-positive cells. Biochem. Biophys. Res. Commun. 2019, 519, 462–468. [Google Scholar] [CrossRef] [Scilit]
- Zhang, H.; Pan, Y.-Z.; Cheung, M.; Cao, M.; Yu, C.; Chen, L.; Zhan, L.; He, Z.-W.; Sun, C.-Y. LAMB3 mediates apoptotic, proliferative, invasive, and metastatic behaviors in pancreatic cancer by regulating the PI3K/Akt signaling pathway. Cell Death Dis. 2019, 10, 230. [Google Scholar] [CrossRef] [Scilit]
- Asano, E.; Maeda, M.; Hasegawa, H.; Ito, S.; Hyodo, T.; Yuan, H.; Takahashi, M.; Hamaguchi, M.; Senga, T. Role of Palladin Phosphorylation by Extracellular Signal-Regulated Kinase in Cell Migration. PLoS ONE 2011, 6, e29338. [Google Scholar] [CrossRef] [Scilit]
- Dolskii, A.; dos Santos, S.A.A.; Andrake, M.; Franco-Barraza, J.; Dunbrack, R.L.; Cukierman, E. Exploring the potential role of palladin in modulating human CAF/ECM functional units. Cytoskeleton 2024, 82, 175–185. [Google Scholar] [CrossRef] [Scilit]
- Gordon, E.R.; Wright, C.A.; James, M.; Cooper, S.J. Transcriptomic and functional analysis of ANGPTL4 overexpression in pancreatic cancer nominates targets that reverse chemoresistance. BMC Cancer 2023, 23, 524. [Google Scholar] [CrossRef] [Scilit]
- Yan, H.H.; Jung, K.H.; Lee, J.E.; Son, M.K.; Fang, Z.; Park, J.H.; Kim, S.J.; Kim, J.Y.; Lim, J.H.; Hong, S.-S. ANGPTL4 accelerates KRASG12D-Induced acinar to ductal metaplasia and pancreatic carcinogenesis. Cancer Lett. 2021, 519, 185–198. [Google Scholar] [CrossRef] [Scilit]
- Chen, M.-M.; Gao, Q.; Ning, H.; Chen, K.; Gao, Y.; Yu, M.; Liu, C.-Q.; Zhou, W.; Pan, J.; Wei, L.; et al. Integrated single-cell and spatial transcriptomics uncover distinct cellular subtypes involved in neural invasion in pancreatic cancer. Cancer Cell 2025, 43, 1656–1676.e10. [Google Scholar] [CrossRef] [Scilit]
- Kang, Y.; Zhang, R.; Suzuki, R.; Li, S.-Q.; Roife, D.; Truty, M.J.; Chatterjee, D.; Thomas, R.M.; Cardwell, J.; Wang, Y.; et al. Two-dimensional culture of human pancreatic adenocarcinoma cells results in an irreversible transition from epithelial to mesenchymal phenotype. Lab. Investig. 2014, 95, 207–222. [Google Scholar] [CrossRef] [Scilit]
- Moffitt, R.A.; Marayati, R.; Flate, E.L.; Volmar, K.E.; Loeza, S.G.H.; Hoadley, K.A.; Rashid, N.U.; Williams, L.A.; Eaton, S.C.; Chung, A.H.; et al. Virtual microdissection identifies distinct tumor- and stroma-specific subtypes of pancreatic ductal adenocarcinoma. Nat. Genet. 2015, 47, 1168–1178. [Google Scholar] [CrossRef] [Scilit]
- Williamson, C.T.; Miller, R.; Pemberton, H.N.; Jones, S.E.; Campbell, J.; Konde, A.; Badham, N.; Rafiq, R.; Brough, R.; Gulati, A.; et al. ATR inhibitors as a synthetic lethal therapy for tumours deficient in ARID1A. Nat. Commun. 2016, 7, 13837. [Google Scholar] [CrossRef] [Scilit]
- Zhang, C.; Zhu, Y.; Ai, L.; Wang, J.; Yu, S.; Wang, Y.; Xu, X.; Liu, M.; Yu, Y.; Zhu, M.; et al. Targeting WEE1 in ARID1A/TP53 Concurrent Mutant Colorectal Cancer by Exploiting R-Loop Accumulation and DNA Repair Deficiencies. Adv. Sci. 2025, 13, e12074. [Google Scholar] [CrossRef] [Scilit]
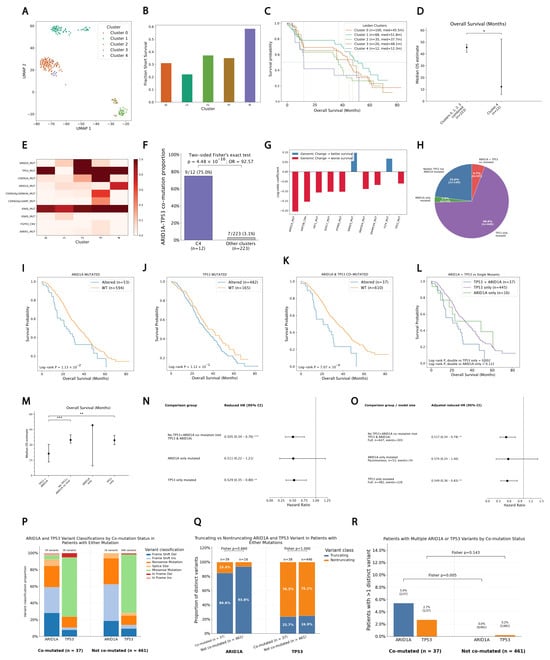
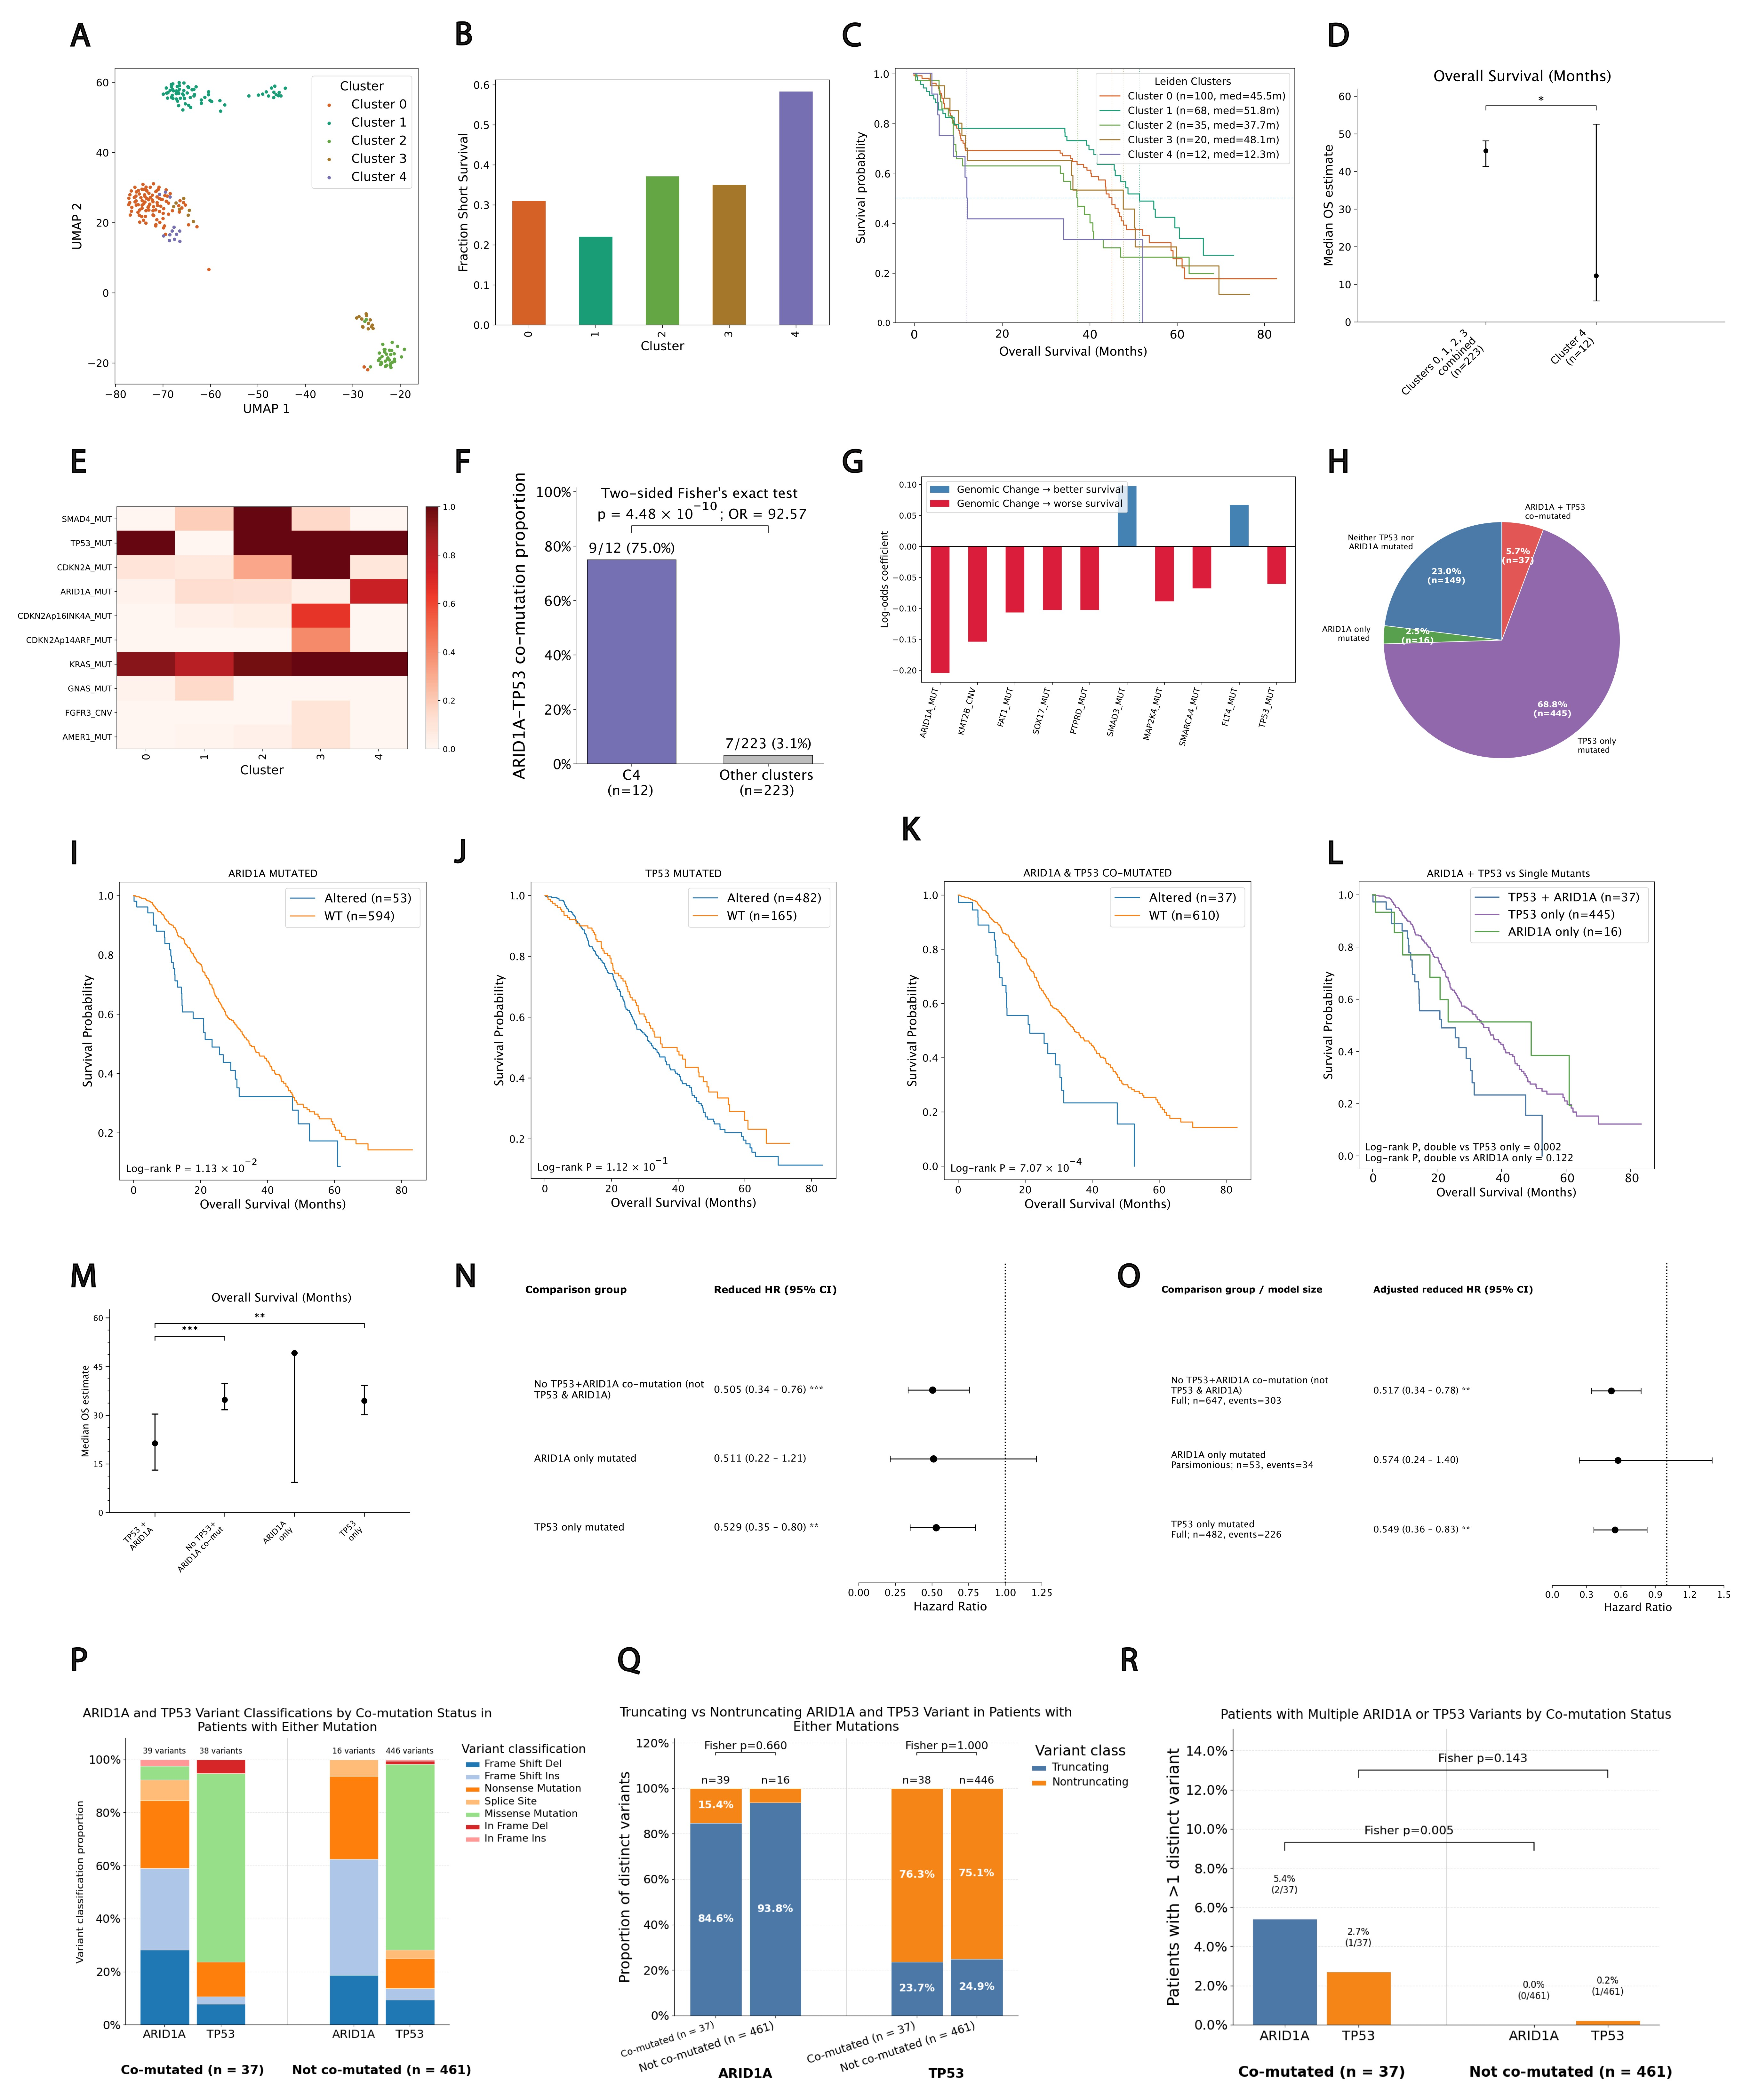
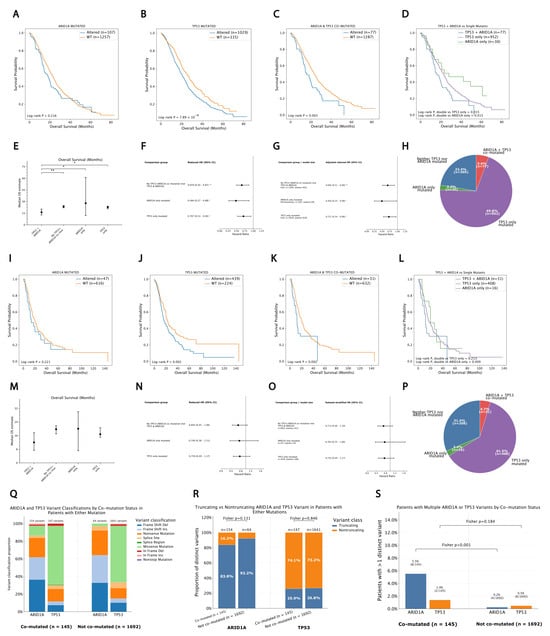
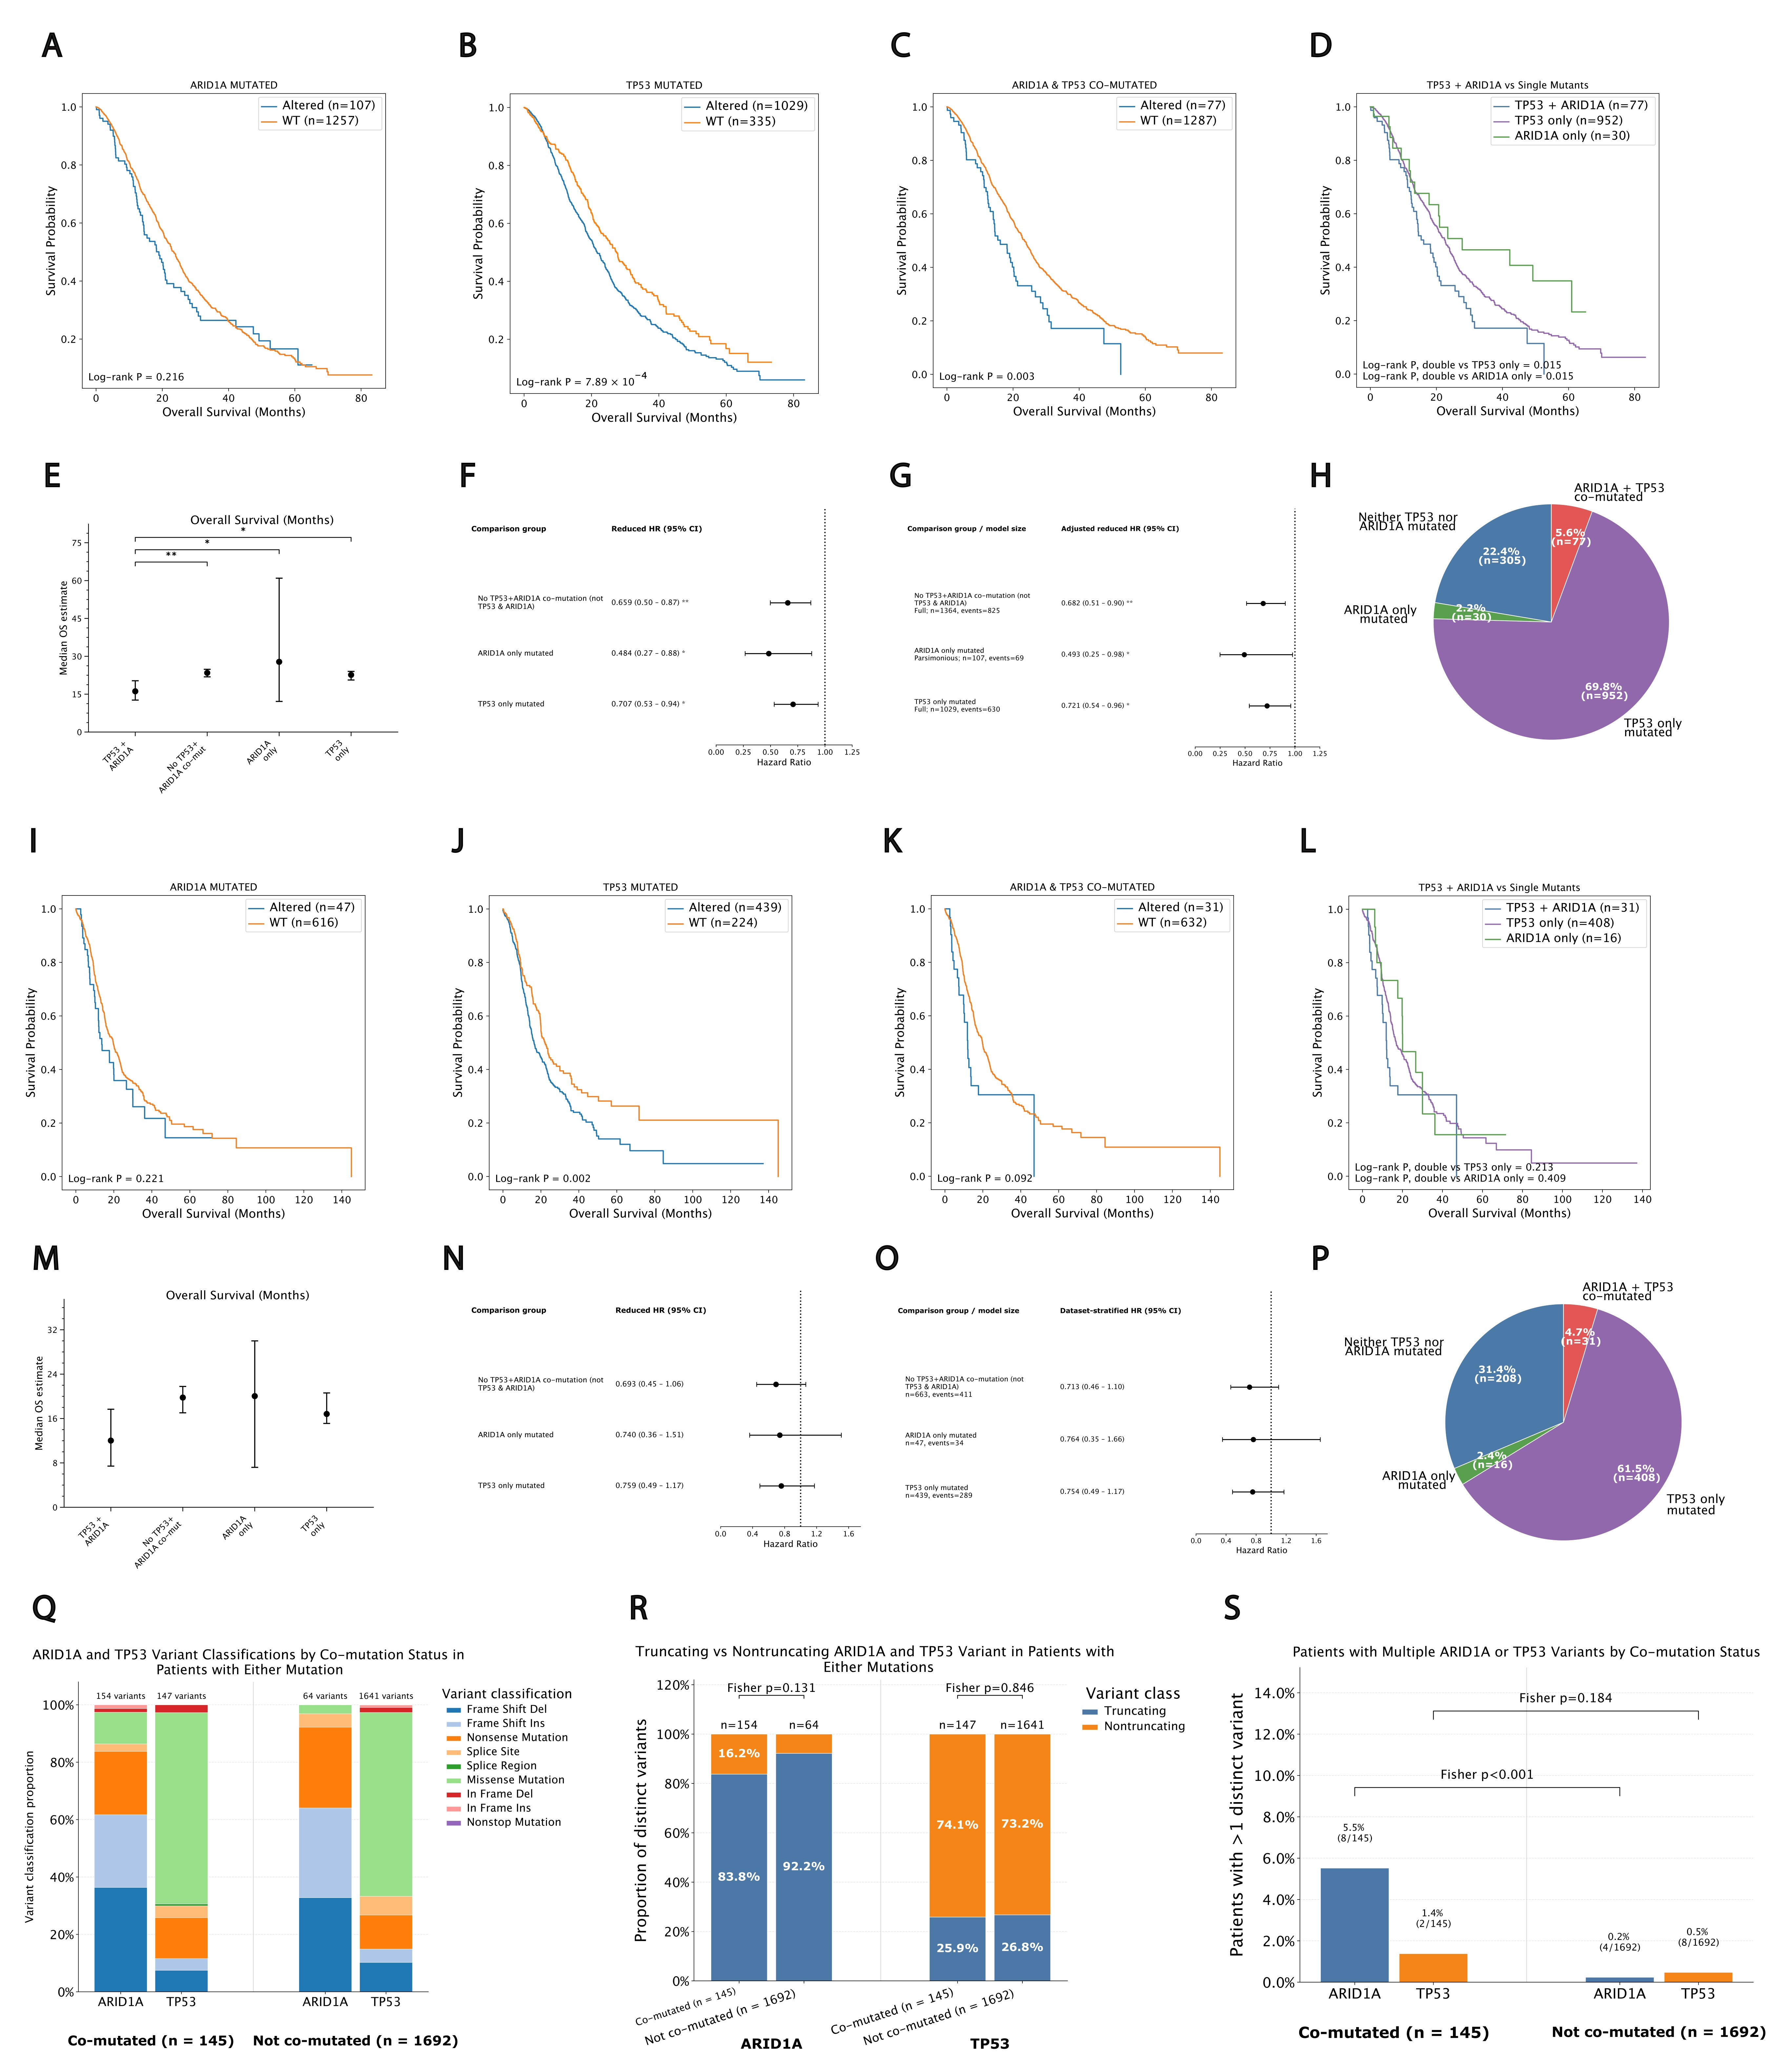
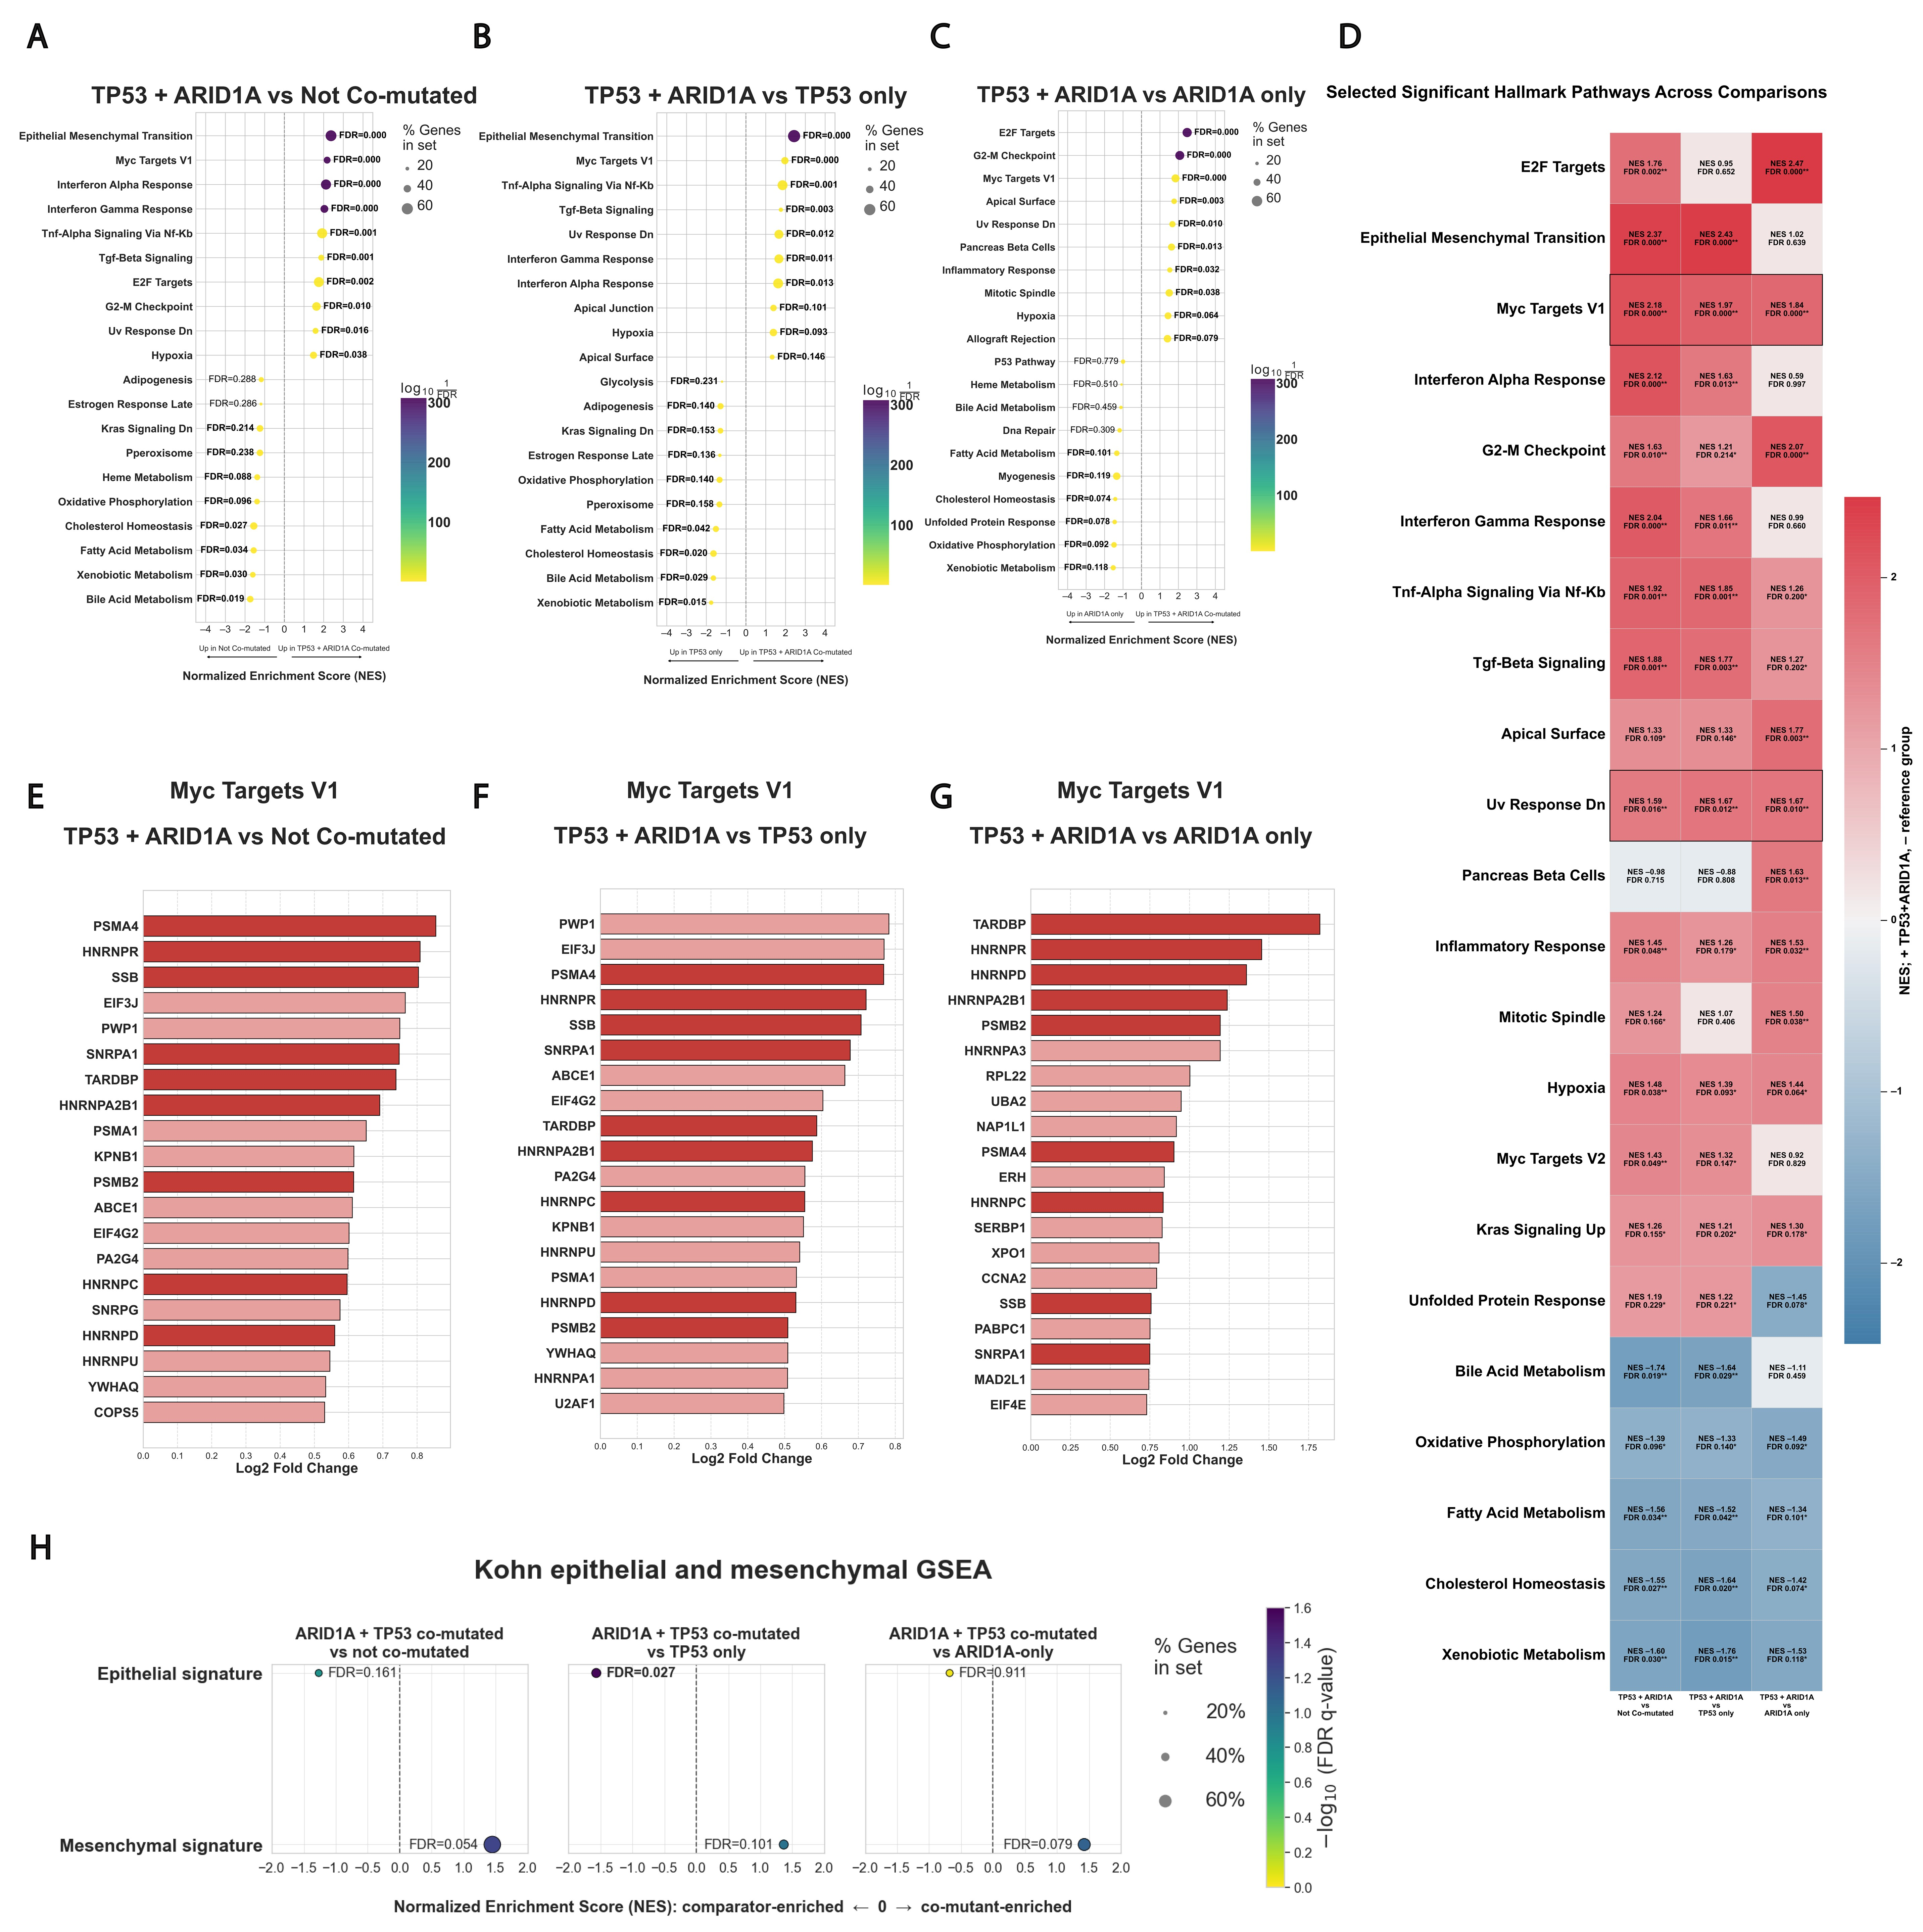
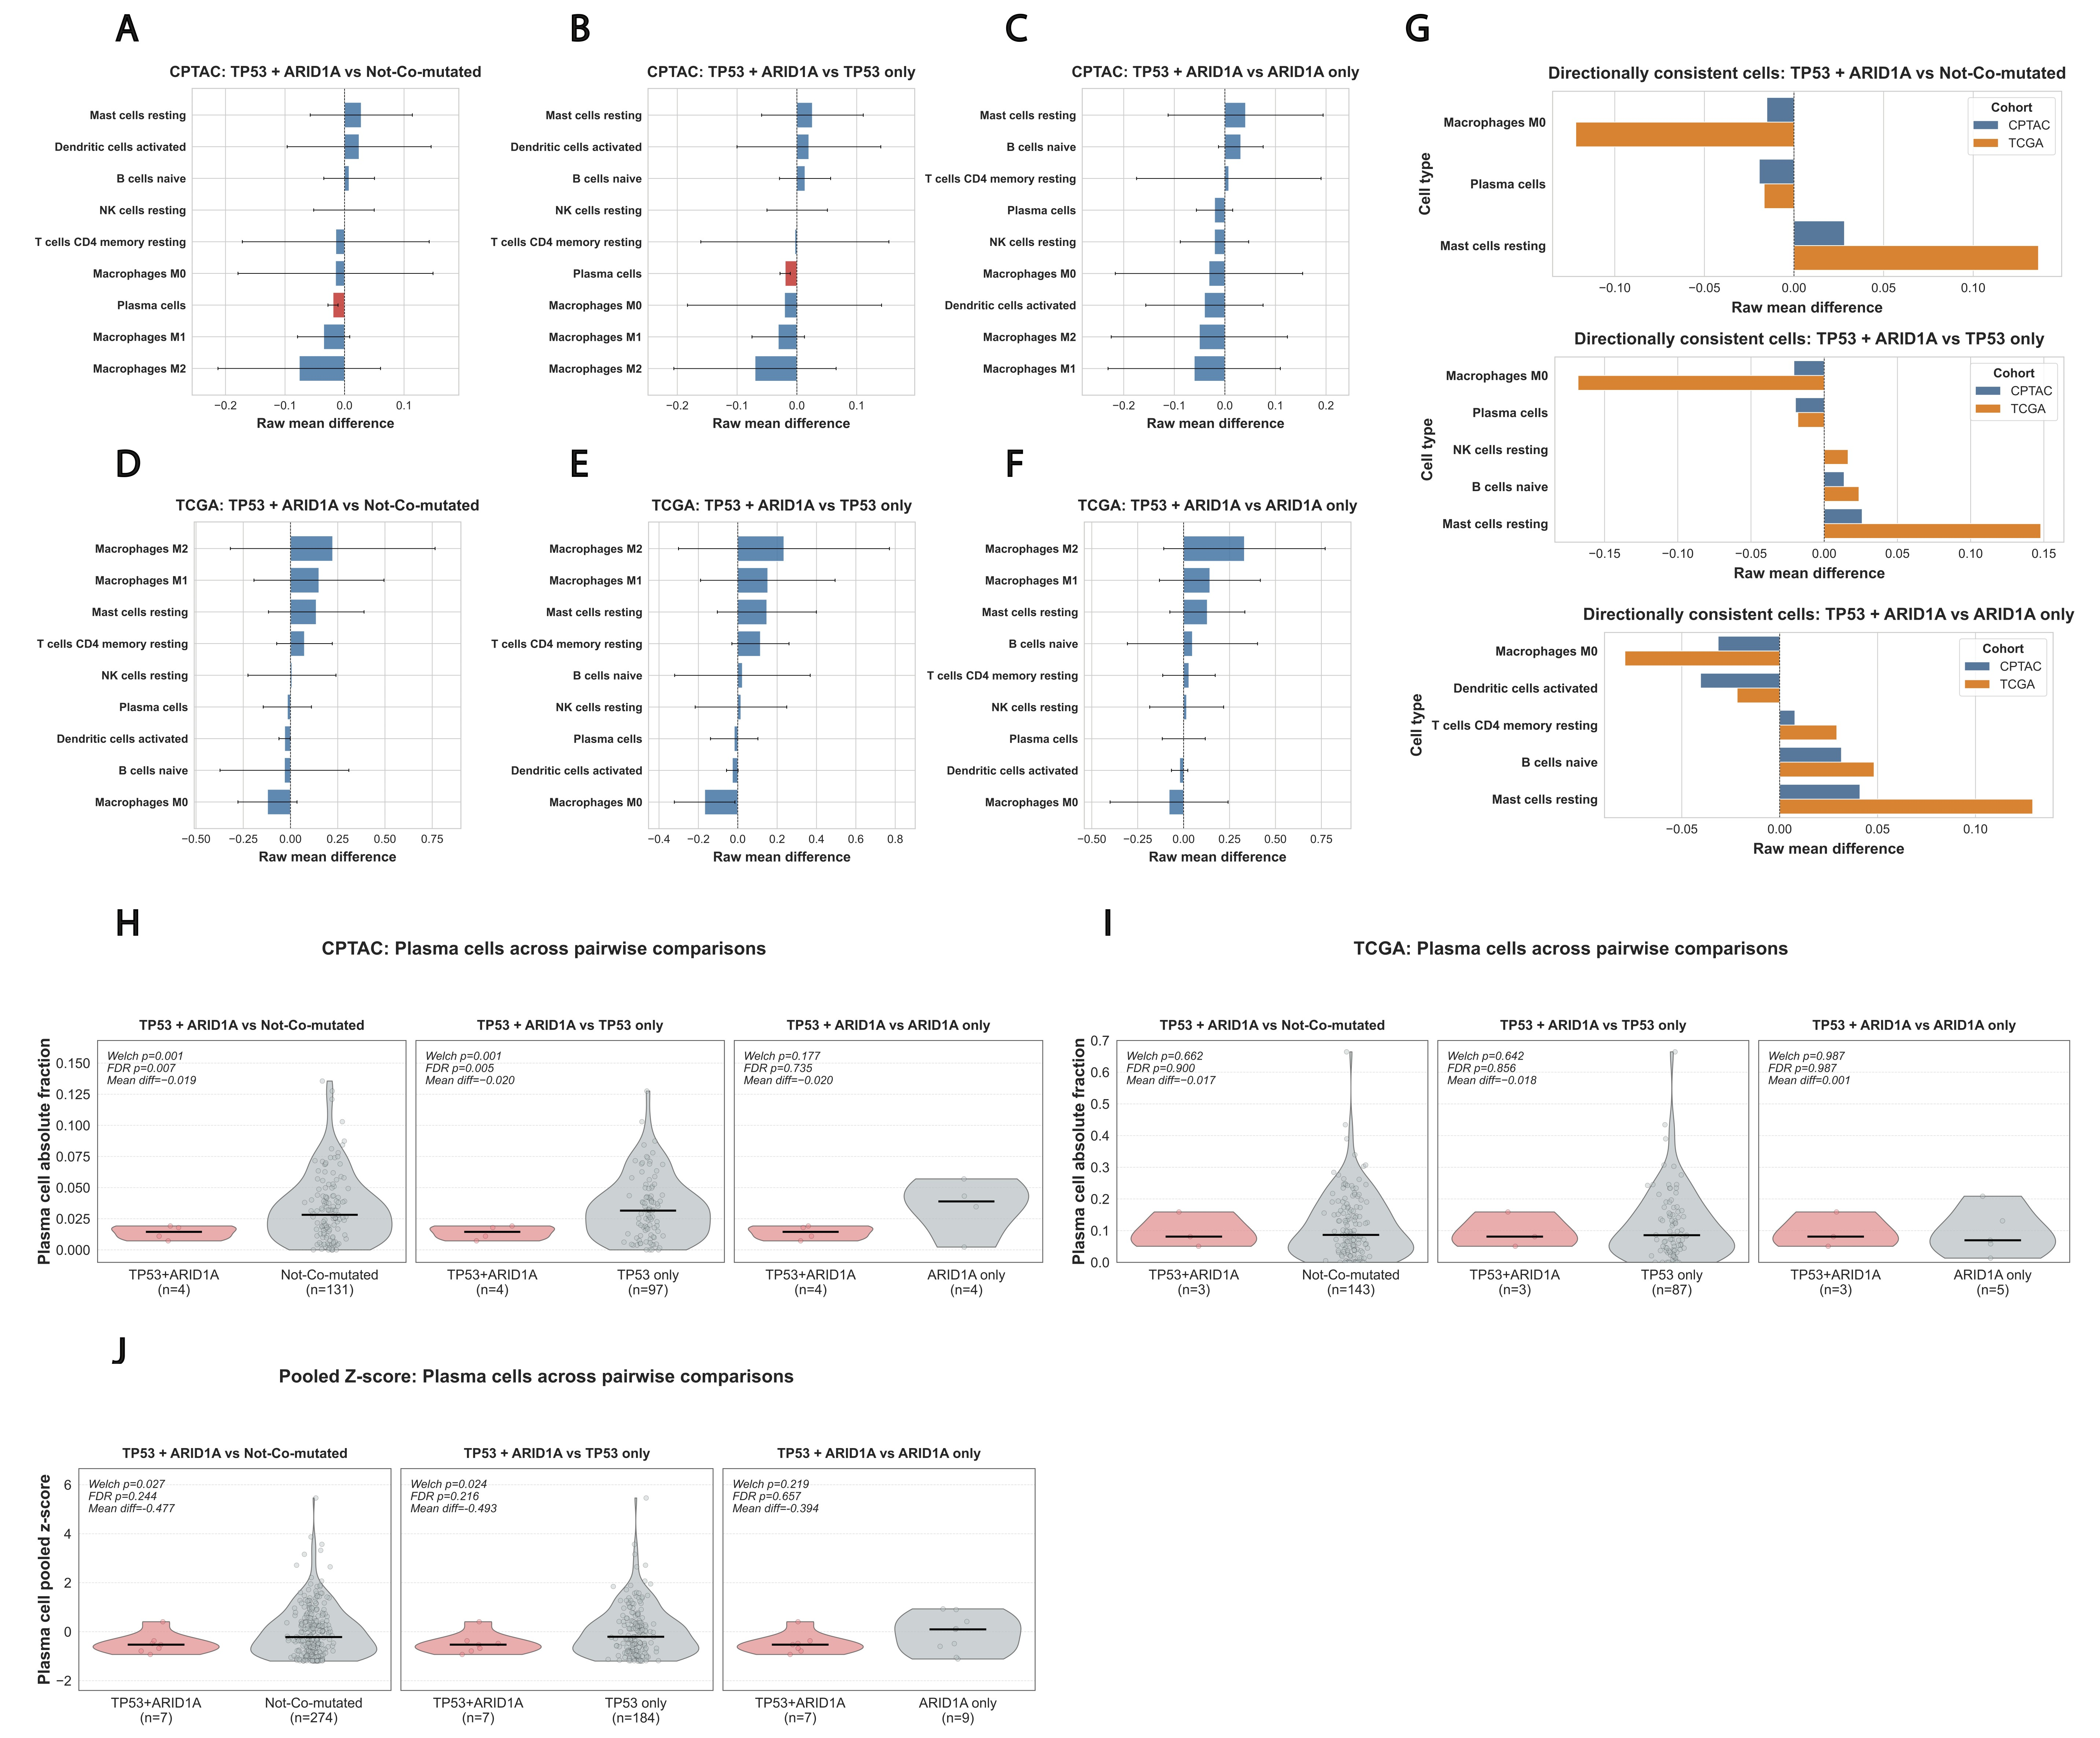
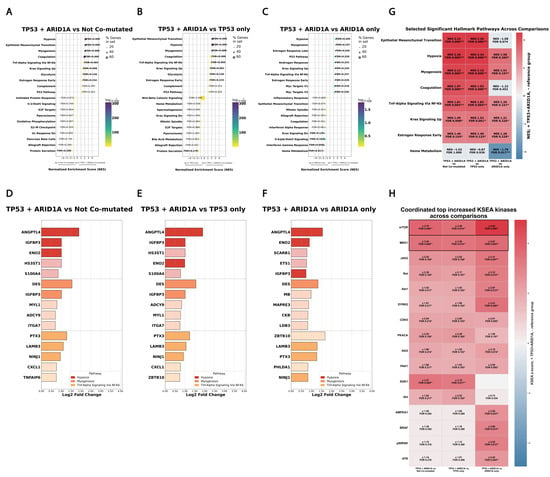
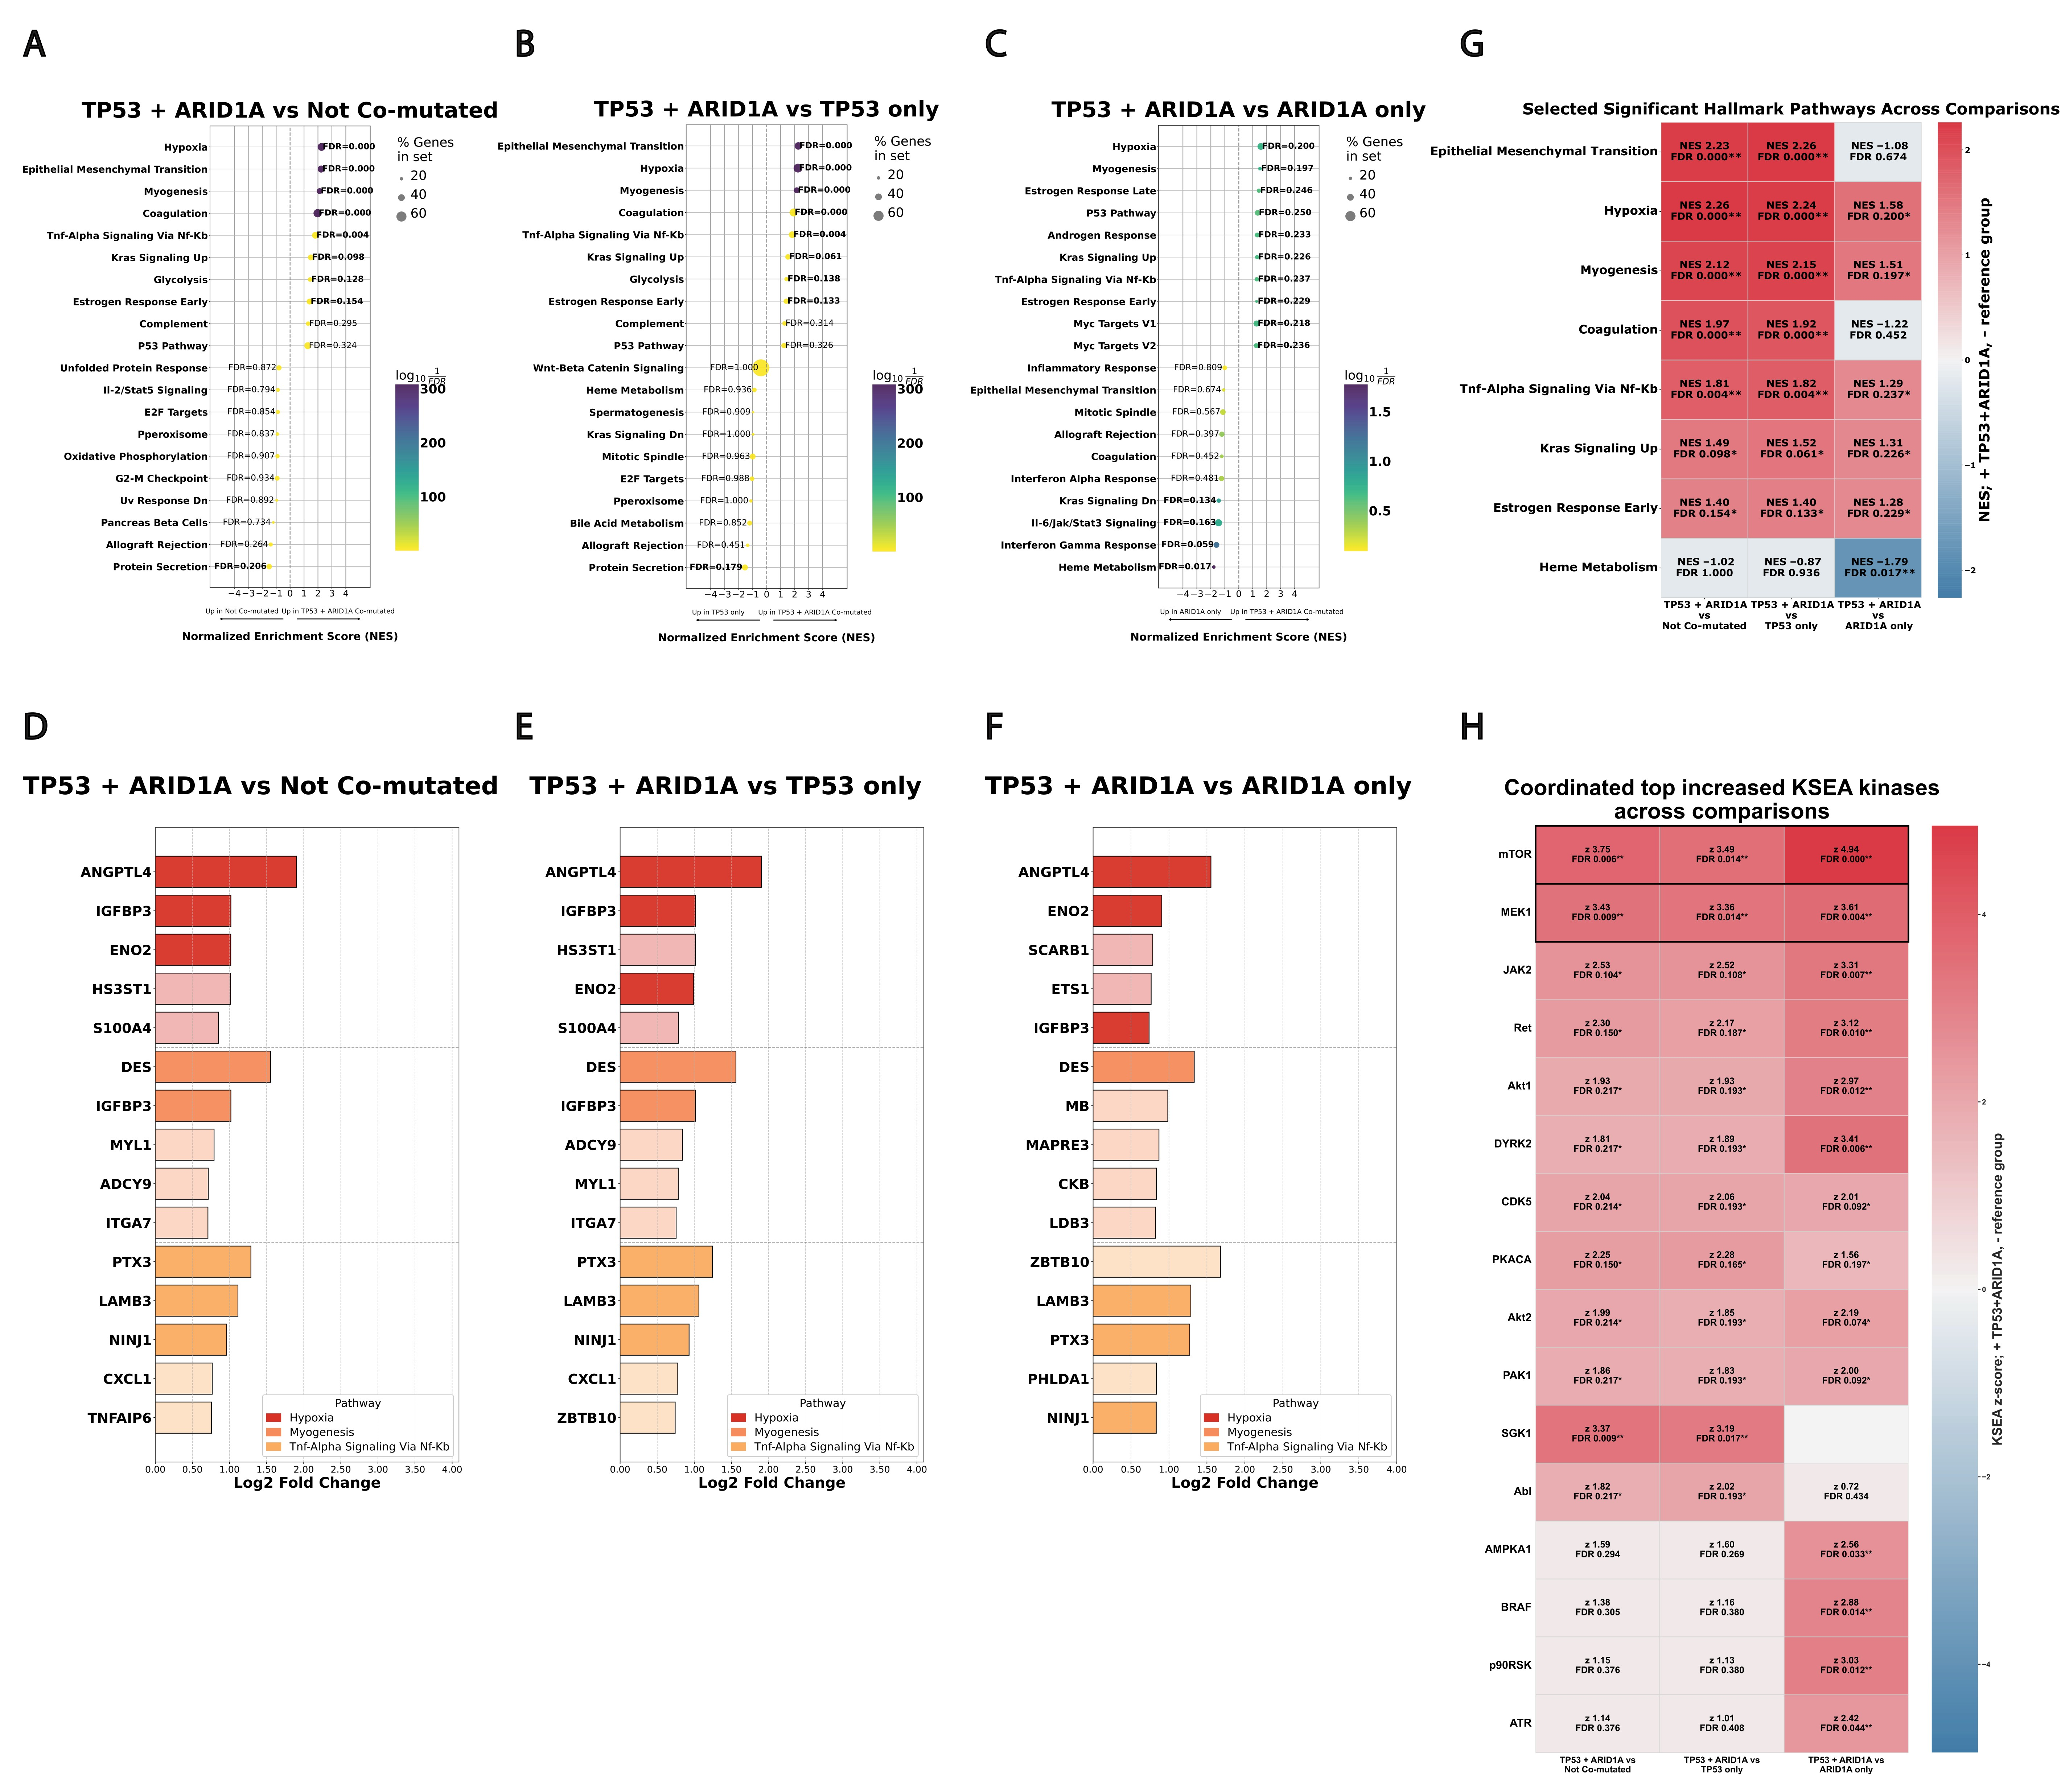
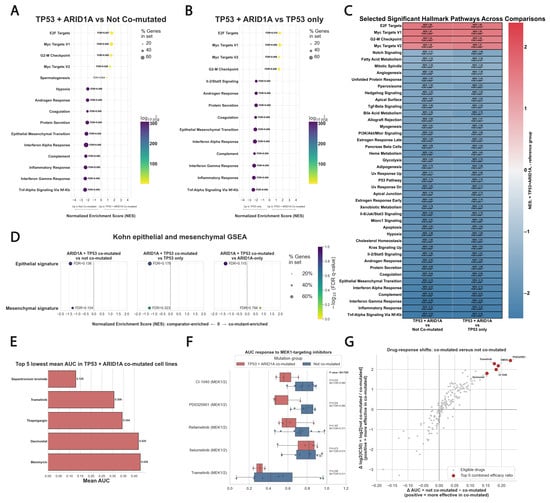
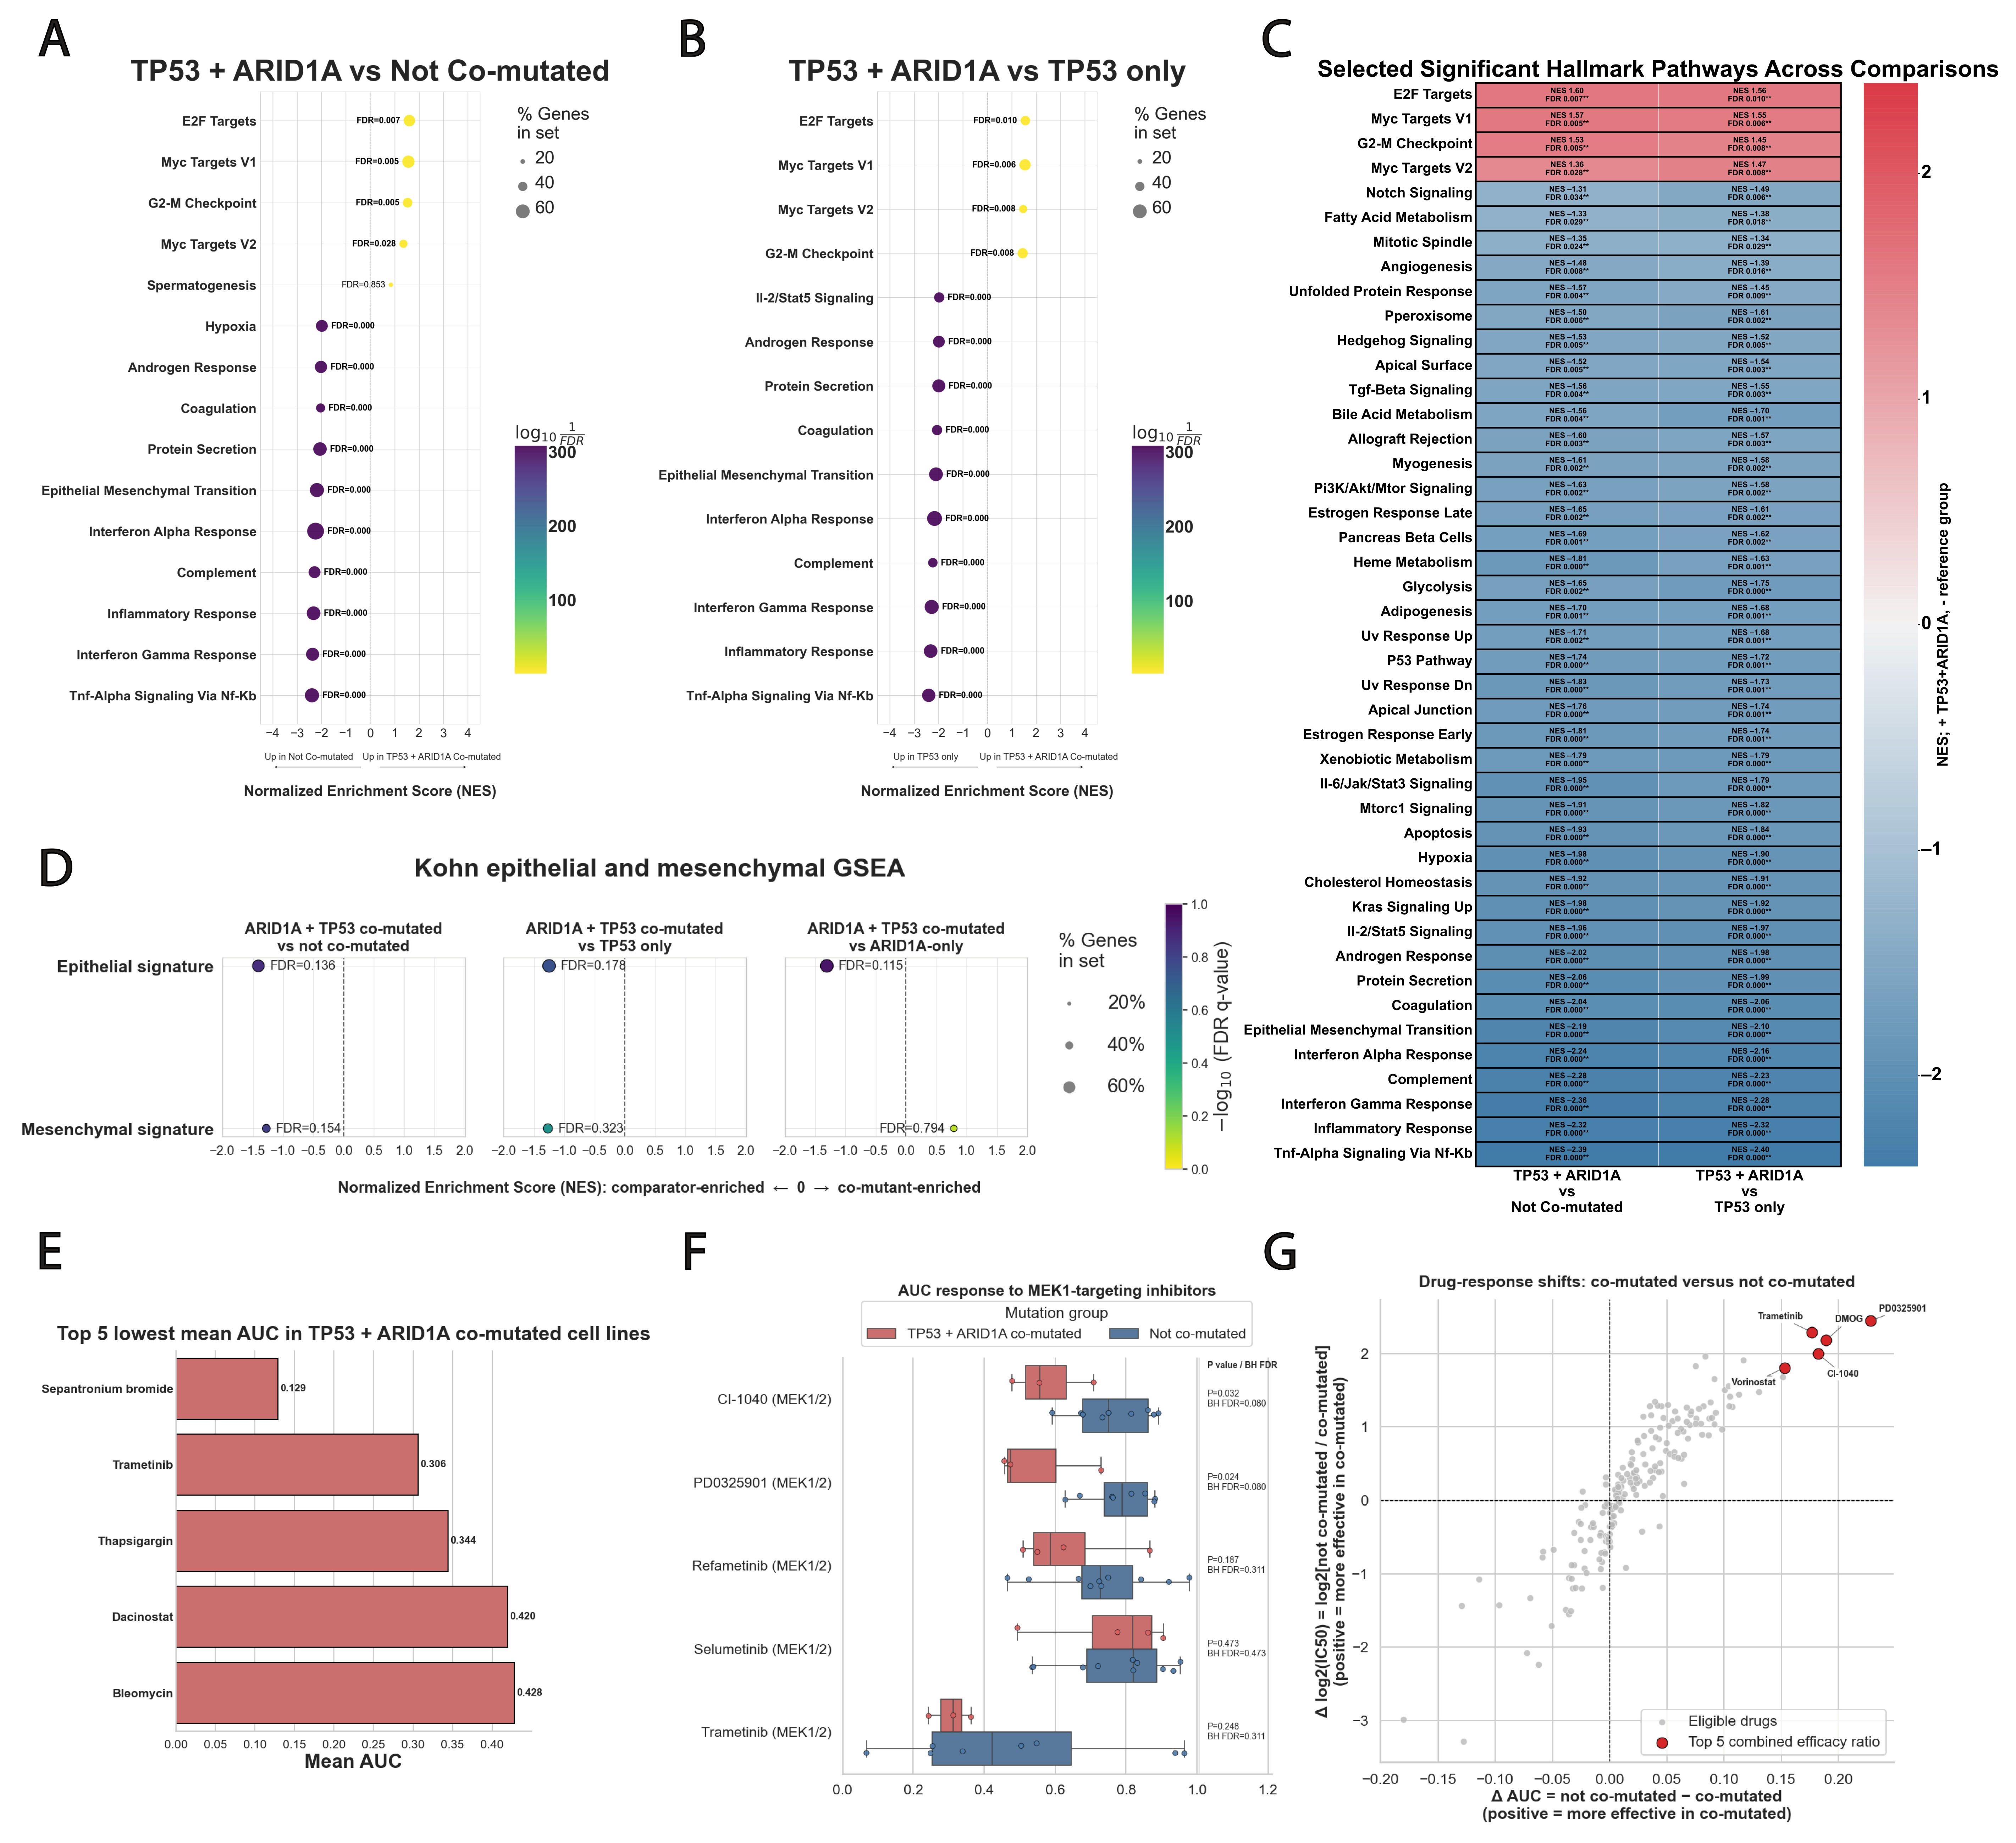
Disclaimer/Publisher’s Note: The statements, opinions and data contained in all publications are solely those of the individual author(s) and contributor(s) and not of MDPI and/or the editor(s). MDPI and/or the editor(s) disclaim responsibility for any injury to people or property resulting from any ideas, methods, instructions or products referred to in the content. |
© 2026 by the authors. Licensee MDPI, Basel, Switzerland. This article is an open access article distributed under the terms and conditions of the Creative Commons Attribution (CC BY) license.