


Simple Summary
Chronic lymphocytic leukemia (CLL) is a common blood cancer. It is preceded by a condition, called monoclonal B-cell lymphocytosis (MBL), in which a small population of clonal B-cells circulates in the blood. Although most people with MBL never progress to CLL, it is unknown why some do. Earlier studies found 41 inherited genetic variants that increase the risk of CLL. Using a study of more than 12,000 people, including people without MBL, people with MBL, and people with CLL, we evaluated the impact of these inherited variants in developing MBL and progressing from MBL to CLL. We found some variants linked more strongly to developing MBL and others to progression, and a few variants appeared to act in opposite directions. A combined genetic risk score of these variants was linked to both developing MBL and progression. These findings can guide future studies of who is most likely to develop CLL.
Abstract
Background: Low-count monoclonal B-cell lymphocytosis (LC-MBL) is a precursor to chronic lymphocytic leukemia (CLL). Forty-one inherited susceptibility variants for CLL have been reported, but whether these variants impact CLL, through the initiation of the clone (LC-MBL) or progression of LC-MBL to CLL, is not well characterized. Methods: We evaluated 41 previously reported CLL susceptibility variants and the CLL polygenic risk score (CLL-PRS, a weighted score of the 41 variants) among a study of 8322 individuals who screened negative for MBL based on eight-color flow cytometry, 1601 individuals who screened positive for LC-MBL, and 2606 CLL patients. Logistic regression was used to estimate odds ratios (ORs) and 95% confidence intervals (CI) for LC-MBL compared with MBL-negative individuals and for CLL compared with LC-MBL (herein labeled progression). Models were adjusted for age, sex, and genetic principal components. Results: Of the 41 variants, 22 (54%) were associated with LC-MBL and 20 (49%) with progression (all p < 0.05). The ORs for eight variants differed between LC-MBL risk and progression (false discovery rate, FDR < 0.05), including two (rs6708784, 2q13; rs391855, 16q24.1) with associations in opposite directions. The CLL-PRS was associated with both LC-MBL (OR = 1.77, 95% CI: 1.66–1.88, p = 3.7 × 10−68) and progression (OR = 1.45, 95% CI: 1.35–1.56, p = 8.1 × 10⁻²⁴). Conclusions: The effects of individual CLL-risk variants vary across the etiological continuum of disease with a subset associated with clonal initiation of LC-MBL and clonal progression to different degrees, or even in opposite directions. The CLL-PRS may help identify individuals at elevated risk for both LC-MBL and progression to CLL.
1. Introduction
Monoclonal B-cell lymphocytosis (MBL) is a common condition and a precursor to chronic lymphocytic leukemia (CLL) [1,2,3]. MBL is categorized as low-count (LC-MBL; <0.5 × 10⁹/L) or high-count (HC-MBL; 0.5 to <5 × 10⁹/L) based on the absolute clonal B-cell count [4]. Individuals with HC-MBL progress to CLL requiring therapy at a rate of approximately 1–2% per year [5]. LC-MBL is detected in approximately 5–18% of adults over age 40 screened by flow cytometry [6,7,8]. Although most individuals with LC-MBL do not progress to CLL, recent studies from our group have demonstrated that LC-MBL is associated with a 2.6-fold increased risk of lymphoid malignancy [9], a 1.9-fold risk of melanoma [10], and a 1.6-fold risk of serious infections [11]. MBL, CLL, and outcomes after CLL diagnosis, such as time to first treatment and infection [12,13], can be viewed as a continuum of B-cell malignancy, and biomarkers are needed to identify individuals at risk at each point along this continuum.
Genome-wide association studies (GWAS) have identified 41 common single nucleotide polymorphisms (SNPs) associated with CLL risk [14,15,16,17,18,19,20], many of which map to loci implicated in immune regulation [15]. When combined into a polygenic risk score (PRS), the CLL-PRS is strongly and robustly associated with CLL risk, independent of family history of hematological cancer [21,22]. The CLL-PRS has also been found to be associated with risk of MBL (including both LC- and HC-MBL) and 21 of the 41 SNPs were individually associated with MBL [22,23,24]. However, it remains unclear whether the associations of these SNPs differ between risk of LC-MBL and progression from LC-MBL to CLL. We assembled a cohort of individuals spanning the etiologic continuum from those who screened negative for MBL to those with LC-MBL and overt CLL to evaluate the effect of the 41 CLL-risk variants and the CLL-PRS.
2. Methods
2.1. Study Population
This study was approved by the Mayo Clinic Institutional Review Board, with all participants providing informed written consent. Individuals screened for MBL were identified through the Mayo Clinic Biobank [25], which enrolled 56,959 adults between 2009 and 2016, mainly from primary care clinics [26]. At enrollment, participants provided blood samples and completed a health history questionnaire. MBL screening was performed in a subset of Biobank participants, as described previously [6,10,11,27]. Participants aged 40 years or older, with no history of hematological cancer, and with available stored peripheral blood mononuclear cells (PBMCs), were eligible for MBL screening.
Patients with CLL were identified from the Mayo Clinic CLL Clinical Database [22,28,29], which has prospectively collected data since 1995 on patients seen in the Division of Hematology at Mayo Clinic, Rochester, MN, who agreed to the research use of their medical records [29]. Patients who consented to participate and provided a blood specimen within two years of their CLL diagnosis were included. Characteristics of the study groups are shown in Supplementary Table S1.
2.2. MBL Screening
Details of the MBL screening strategy in the Mayo Clinic Biobank have been reported previously [6,9,10,11,22]. In brief, stored PBMCs were evaluated with an eight-color flow cytometry assay (CD38, CD45, kappa, lambda, CD19, CD23, CD5, and CD20) that detects clonal B cells at a level of 0.005%, acquiring approximately 500,000 events per sample. Each MBL case was reviewed and confirmed by a Mayo Clinic hematopathologist with expertise in lymphoid malignancies. MBL clones were classified by immunophenotype as CLL-type (CD5+, CD20dim/CD20+), or non–CLL-type (CD5−). Individuals included herein were those who screened negative for MBL (MBL-negative) and those with LC-MBL (defined as the proportion of clonal B cells out of total B cells < 85%) with immunophenotype as CLL-type. Individuals with HC-MBL or another immunophenotype were excluded.
2.3. Genotyping
Genotyping was performed using Illumina arrays (Infinium OmniExpress or Global Screening Array) or by genotyping by sequencing at the Regeneron Genetics Center. DNA was extracted from whole blood. Quality control followed previously described procedures [22]. SNPs that were monomorphic, had call rates < 95%, or showed extreme deviation from Hardy–Weinberg equilibrium (p < 1.0 × 10⁻⁵) were removed, and individuals with sex discordance or a genotyped relative were excluded. Samples with call rates below 98% were removed; genotype concordance across platforms exceeded 99%. We evaluated the 41 SNPs reported in the largest GWAS of CLL to date [15].
2.4. Statistical Analysis
We performed three case-control analyses. The first compared individuals screened with LC-MBL to those who screened negative for MBL (MBL-negative) to identify variants associated with LC-MBL risk. Second, because CLL is always preceded by LC-MBL, we compared patients with CLL to individuals with LC-MBL to identify variants that may be markers of progression from LC-MBL to CLL, herein labeled as progression. We considered this analysis to be an indirect proxy for a longitudinal study that follows individuals with LC-MBL until progression to CLL or study end date. Finally, we compared patients with CLL to MBL-negative individuals to confirm the associations of the 41 SNPs with CLL risk. Logistic regression was used to estimate odds ratios (ORs) and 95% confidence intervals (CIs), with SNPs coded additively for the risk allele. All models were adjusted for age, sex, and the first ten principal components to account for population stratification. To test whether the OR for each SNP differed between the first two analyses, we used the Wald test for the difference in log ORs; p-values were adjusted using the Benjamini–Hochberg false discovery rate (FDR) across all 41 SNPs. SNPs with FDR < 0.05 and non-overlapping 95% CIs were considered to differ between analyses. Characteristics of the three groups were summarized using medians and percentages. Age was defined as age at MBL screening for Biobank participants and age at diagnosis for patients with CLL.
2.5. Polygenic Risk Score
As previously published [21,22,23], the CLL-PRS was calculated for each individual as a weighted sum of the CLL-susceptibility risk alleles, using weights derived from the largest GWAS of CLL to date [15] (Supplementary Table S2). The CLL-PRS was evaluated as a continuous variable and in quintiles, with the middle quintile as the reference, as it contains the most common PRS value in the general population [22]. Quintiles of the CLL-PRS41 were defined using previously published thresholds derived from 7983 controls in the NHL GWAS [21] which allows comparison with prior studies. Separately, in an exploratory analysis, we constructed a second score (CLL-PRS20) from the 20 of the 41 SNPs that were associated with progression (CLL vs. LC-MBL, p < 0.05). Quintiles of the CLL-PRS20 were defined using cut points derived from the distribution of the score among all MBL-negative individuals, given no published reference thresholds exist for this score. Analyses were performed using PLINK 1.9 [30] and R v4.4.1, and figures were produced using Python v3.7. Analysis code is available at https://github.com/rmwangi07/cll-mbl-susceptibility-continuum (accessed on 30 October 2026).
3. Results
Among the 2606 patients with CLL, 1601 individuals with LC-MBL, and 8322 MBL-negative individuals, the median age was 62 years, 65 years, and 61 years, respectively (Supplementary Table S1). CLL patients were more likely to be male (67%) than individuals with LC-MBL (50%) or MBL-negative individuals (36%).
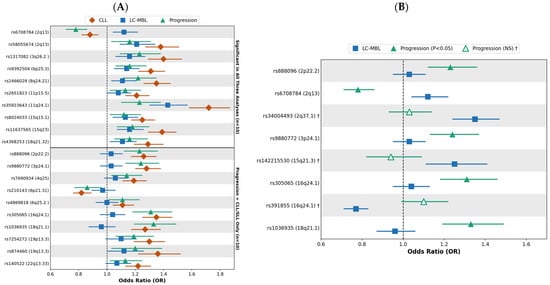
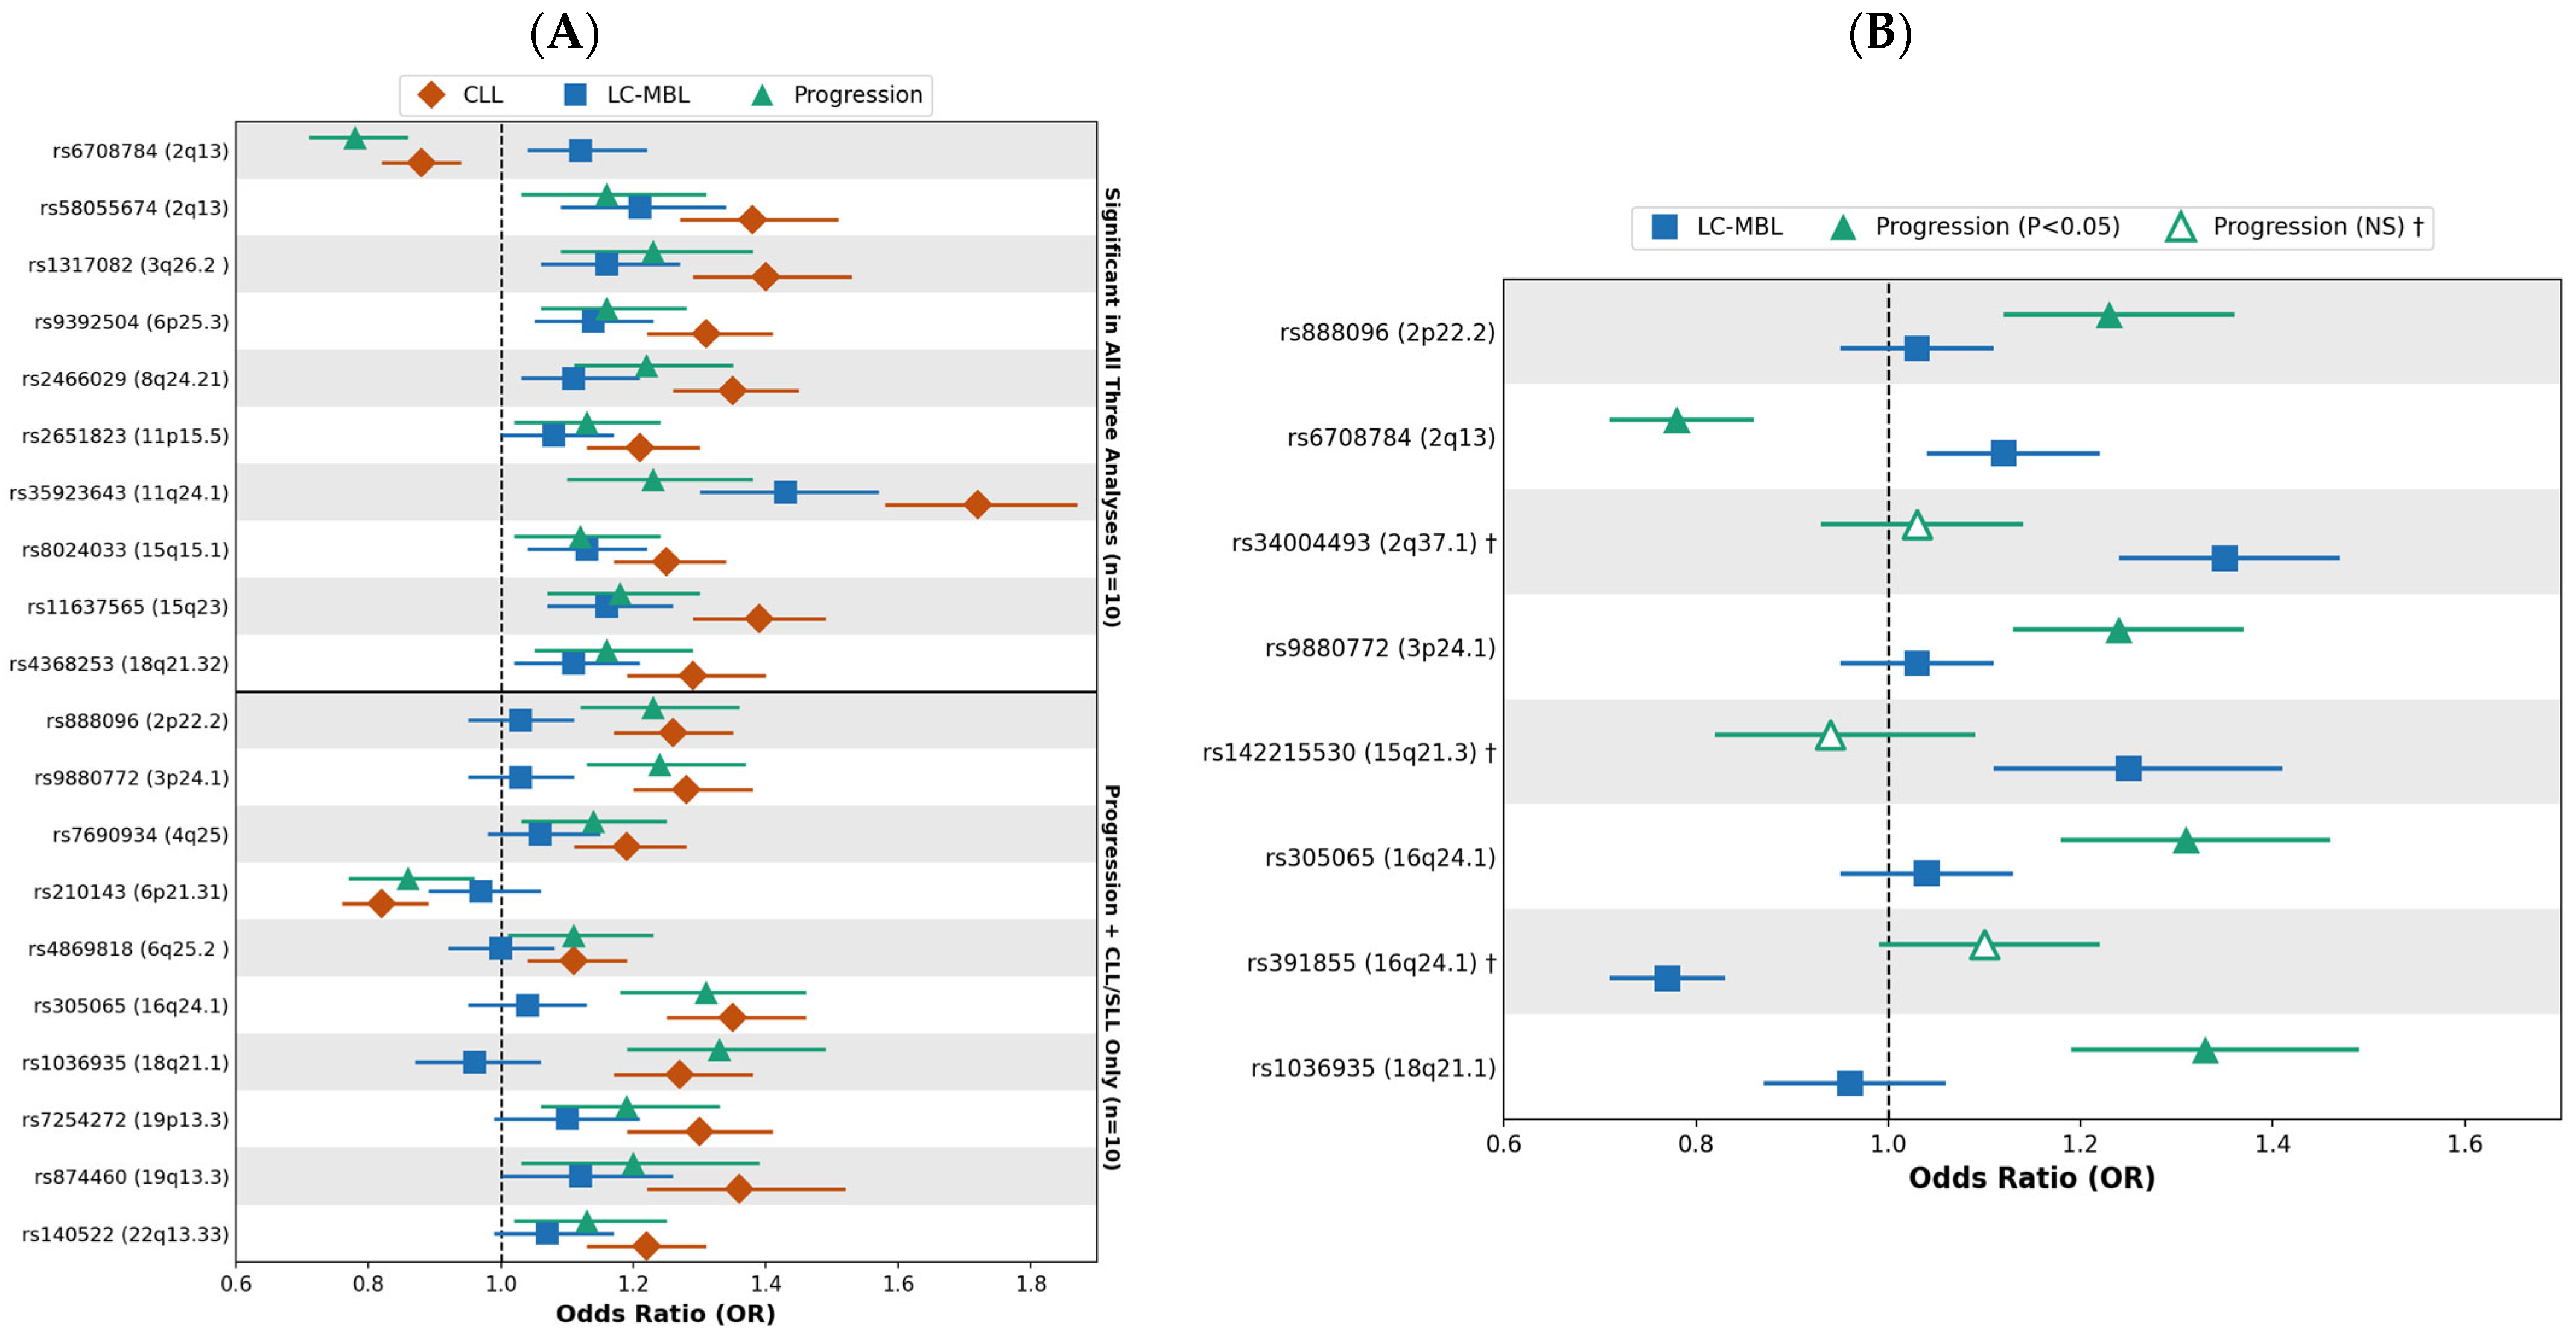
Of the 41 SNPs, 22 (54%) were associated with LC-MBL risk (all p < 0.05; Figure 1A and Supplementary Figure S1), similar to the 21 SNPs associated with overall MBL in our previous, smaller screening study [22].
Figure 1.
Associations of inherited CLL-risk variants with LC-MBL risk, progression, and CLL. All odds ratios (95% CI) are adjusted for age, sex, and principal components. (A) The 20 SNPs associated with progression (p < 0.05); 10 SNPs were also associated with LC-MBL (top) and 10 showed no evidence of association with LC-MBL (bottom); SNPs are ordered by chromosomal position within each subgroup. (B) The eight SNPs whose odds ratios differed between LC-MBL risk and progression (FDR < 0.05, non-overlapping 95% CIs required). Blue squares, LC-MBL versus MBL-negative; green triangles, CLL versus LC-MBL (progression); red diamonds, CLL vs. MBL-negative, filled triangles, p < 0.05 for progression; open triangles (†), p ≥ 0.05.
In the case-control “progression” analyses of CLL versus LC-MBL, 20 SNPs (49%) were associated with progression at p < 0.05 (Figure 1A); 18 had positive associations and two had inverse. Of these 20 SNPs, 10 showed no evidence of an association with risk of LC-MBL, and 10 were associated with both LC-MBL and progression. All 20 SNPs were associated with CLL risk in this sample (all p < 0.05; Figure 1A). Because a SNP may be associated with both risk of LC-MBL and progression, but more strongly with one, we compared the ORs between the two analyses. Eight SNPs had significantly different ORs (FDR < 0.05) with non-overlapping 95% CIs (Figure 1B). Four SNPs had larger ORs for progression than for risk of LC-MBL (rs888096, 2p22.2; rs9880772, 3p24.1; rs305065, 16q24.1; rs1036935, 18q21.1), and two had larger ORs for LC-MBL than for progression (rs34004493, 2q37.1; rs142215530, 15q21.3). Two SNPs had associations in opposite directions; rs6708784 (2q13) was positively associated with LC-MBL (OR = 1.12, 95% CI: 1.04–1.22) but inversely associated with progression (OR = 0.78, 95% CI: 0.71–0.86; P for difference = 1.3 × 10⁻⁸), and rs391855 (16q24.1) was inversely associated with LC-MBL (OR = 0.77, 95% CI: 0.70–0.83), but positively associated with progression (OR = 1.10, 95% CI: 1.00–1.22; p for difference = 9.3 × 10⁻⁸).
Of the remaining 21 SNPs that were not statistically associated with progression, 18 had OR estimates for progression in the same direction as observed in the analyses for risk of CLL (i.e., CLL cases to MBL-negative individuals, Supplementary Figure S1); the lack of statistical significance in the progression analyses may be due to reduced sample size and thus reduced statistical power. Furthermore, of these 21 SNPs, 12 were statistically associated with LC-MBL risk, indicating these SNPs may play a role in clonal development (Supplementary Figure S1).
We next assessed the effect of the CLL-PRS. The distribution of the CLL-PRS derived from the 41 SNPs increased across the continuum from MBL-negative individuals to LC-MBL to CLL (Supplementary Figure S2). Using a sample size approximately four times larger than our prior screening study of 396 individuals with LC-MBL, we confirmed that the CLL-PRS was associated with risk of LC-MBL (OR = 1.77, 95% CI: 1.66–1.88, p = 3.7 × 10−68; Table 1) [21,22,23]. Compared to the middle quintile, individuals in the highest quintile of CLL-PRS had higher odds of LC-MBL compared to MBL-negative (OR = 2.15, 95% CI: 1.83–2.54) and those in the lowest quintile had reduced odds (OR = 0.55, 95% CI: 0.45–0.68). In the CLL vs. LC-MBL analyses, the CLL-PRS was also associated with progression (OR = 1.45, 95% CI: 1.35–1.56, p = 8.1 × 10⁻²⁴; Table 1). Compared with the middle quintile, individuals in the highest CLL-PRS quintile had higher odds of CLL relative to LC-MBL (OR = 1.60, 95% CI: 1.32–1.93, p = 1.1 × 10⁻⁶), while those in the lowest quintile had reduced odds (OR = 0.63, 95% CI: 0.47–0.83, p = 9.2 × 10⁻⁴; Table 1). Finally, the CLL-PRS was associated with CLL (OR = 2.59, 95% CI: 2.44–2.74, p = 4.6 × 10−220), with ORs of 3.52 (95% CI: 3.06–4.06) for the highest quintile and 0.35 (95% CI: 0.28–0.43) for the lowest quintile compared with the middle quintile (Table 1).
Table 1.
Distribution and association of the CLL polygenic risk score (CLL-PRS41) across MBL-negative individuals, LC-MBL, and CLL. Quintile thresholds were derived from 7983 controls from the NHL GWAS [21]; Q3 is the reference. All models adjusted for age, sex, and principal components.
In an exploratory analysis, we also evaluated the PRS of the 20 SNPs associated with progression (CLL-PRS20, Supplementary Table S3). The CLL-PRS20 was associated with progression (OR = 1.92, 95% CI: 1.74–2.13, p = 1.2 × 10⁻³⁵). Compared with the middle quintile, individuals in the highest CLL-PRS20 quintile had higher odds of progression (OR = 1.81, 95% CI: 1.50–2.19, p = 9.1 × 10⁻¹⁰).
4. Discussion
Using a sample size over four times larger than any prior study of individuals screened for MBL, we have several notable findings on the impact of germline genetics across the CLL continuum. First, germline genetics plays a role in developing LC-MBL. The CLL-PRS was significantly associated with LC-MBL risk with an effect size of 1.8, consistent with our prior study of 396 individuals with LC-MBL and 2631 MBL-negative [22]. These findings indicate that the CLL-PRS may identify individuals at risk of LC-MBL. Moreover, just over 50% of the previously reported CLL susceptibility SNPs were statistically associated with LC-MBL. These findings suggest that these individual SNPs may mark or be involved in early clonal B-cell development rather than at the later CLL stage.
Next, germline genetics plays a role in progression. Twenty of the 41 SNPs were associated with progression from LC-MBL to CLL, and eight had ORs that differed between LC-MBL and progression, suggesting that the associations of these SNPs are not uniform across the etiologic continuum from LC-MBL to CLL. The most notable were the two SNPs with associations in opposite directions, rs6708784 at 2q13 and rs391855 at 16q24.1 (near the B-cell transcription factor IRF8 involved in B-cell development) [15]. The biological basis for these opposing associations remains unclear. Interestingly, the risk allele of rs6708784 is associated with reduced expression of BCL2L11 [31], which encodes the pro-apoptotic protein BIM. Reduced BCL2L11 expression could decrease apoptosis and thereby promote the survival and persistence of abnormal B-cell clones. However, it remains unclear why the same allele is associated with reduced progression risk. Further studies are needed to help clarify these findings. Finally, the CLL-PRS was also associated with CLL compared to individuals with LC-MBL, suggesting its potential as a biomarker for progression in individuals with LC-MBL. CLL-PRS, along with acquired molecular features, such as clonal hematopoiesis [9] or somatic events [28,32], have been identified as potential biomarkers to identify individuals with MBL at risk for progression to CLL.
Our study has several strengths, including the large number of individuals screened for MBL using a sensitive flow cytometry assay and the inclusion of individuals who screened negative for MBL. Our study also has limitations. Although we identified 20 SNPs statistically associated with progression from LC-MBL to CLL, our case-control study design limits our ability to draw definitive inferences regarding progression. The ideal study would prospectively follow a cohort of individuals with LC-MBL for progression to CLL or study end date. However, given the relatively low rate of progression, our cohort of ~1600 LC-MBL will require extended follow-up to accrue enough CLL events for an adequately powered analysis. Replication in an independent cohort is also needed. The test for differences in ORs does not account for individuals with LC-MBL contributing to both analyses and may be anti-conservative. Genotypes were obtained from more than one platform, although concordance across platforms exceeded 99%. Individuals with HC-MBL, who have a higher risk of progression than those with LC-MBL [5,6], were not evaluated because of small numbers. The CLL-PRS20 analysis is exploratory and because the same individuals were used to identify the 20 SNPs and estimate their associations, these estimates are upwardly biased and require external validation.
Because LC-MBL is also associated with non-CLL lymphoid malignancies [6,9], future studies should evaluate whether the CLL-PRS, or PRSs for other lymphoma subtypes, are associated with these outcomes. Extending these analyses to outcomes after CLL diagnosis, such as time to first treatment and infection [12,13], would further characterize the role of inherited susceptibility across the continuum of B-cell malignancy.
5. Conclusions
In conclusion, although the CLL-PRS was associated with both development of LC-MBL and progression from LC-MBL to CLL, the inherited CLL susceptibility SNPs appear to have variable relationships with B-cell clone etiology and expansion. Eight of the 41 established SNPs associated with developing CLL can be separated into those associated with risk of LC-MBL and risk of progression from LC-MBL to CLL, supporting distinct genetic contributions to these two processes. Prospective follow-up studies of individuals with LC-MBL that integrate inherited risk, along with acquired molecular features, will be needed to determine whether these findings can inform predictions of progression to CLL.
Supplementary Materials
The following supporting information can be downloaded at: https://www.mdpi.com/article/10.3390/cancers18213556/s1, Figure S1: The 21 inherited CLL-risk variants that did not reach p < 0.05 for progression from LC-MBL to CLL; Figure S2: Distribution of the CLL-PRS41 across MBL-negative individuals, LC-MBL, and CLL; Table S1: Characteristics of MBL-negative individuals, individuals with LC-MBL, and patients with CLL; Table S2: The 41 CLL susceptibility SNPs, risk alleles, and weights used to construct the CLL-PRS41; Table S3: Distribution and association of the CLL polygenic risk score (CLL-PRS20) across MBL-negative individuals, LC-MBL, and CLL. References [15,21] are cited in the Supplementary Materials.
Author Contributions
Conceptualization, R.M., G.K. and S.L.S.; methodology, R.M., G.K. and S.L.S.; software, R.M. and D.R.; formal analysis, R.M.; investigation, C.A.H., S.A.P. and T.D.S.; resources, J.E.O., J.R.C., C.M.V., S.A.P., T.D.S. and S.L.S.; data curation, D.R., A.D.N., K.G.R., Y.Y., N.J.B., R.G. and E.B.; writing—original draft preparation, R.M.; writing—review and editing, R.M., G.K., D.R., A.D.N., K.G.R., J.E.O., Y.Y., N.J.B., R.G., E.B., J.R.C., C.A.H., C.M.V., S.A.P., T.D.S. and S.L.S.; visualization, R.M.; supervision, S.L.S.; project administration, S.L.S.; funding acquisition, S.L.S. All authors have read and agreed to the published version of the manuscript.
Funding
This work was supported by the National Institutes of Health grants CA258465, AG58266, CA254951.
Institutional Review Board Statement
The study was conducted in accordance with the Declaration of Helsinki and approved by the Mayo Clinic Institutional Review Board, code 1870-00, date 19 January 2026.
Informed Consent Statement
Informed consent was obtained from all subjects involved in the study.
Data Availability Statement
Analysis code is available at https://github.com/rmwangi07/cll-mbl-susceptibility-continuum (accessed on 30 October 2026). Summary statistics for the 41 variants are provided in the Supplementary Materials. Individual-level genotype and clinical data are not publicly available because of participant consent and privacy restrictions; requests can be made to the Mayo Clinic Biobank through its data access process.
Acknowledgments
We thank the participants of the Mayo Clinic Biobank and the CLL patients for their invaluable contributions and continued support of this research. Mayo Clinic Project Generation, PG Leadership Team, Cerhan, James R.; Couch, Fergus J., Olson, Janet E. Statistical Genetics and Bioinformatics: Larson, Nicholas B.; Fredericksen, Zachary S. Laboratory Operations, Cicek, Mine. (Alphabetical listing): Alcohol Use Disorder (AUD): Biernacka, Joanna M., Karpyak, Victor M.; Alzheimer’s Disease Research Center (ADRC): Vemuri, Prashanthi; Ramanan, Vijay K.; Bipolar disorder registry: Biernacka, Joanna M., Frye, Mark A.; Brain: Eckel Passow, Jeanette E.; Breast—Mayo Florida: McLaughlin, Sarah A.; Breast—Mayo Rochester: Olson, Janet E.; Couch, Fergus J., Ruddy, Kathryn J.; Cardiovascular Disease Specimen Repository: Bielinski, Suzette J.; Chronic Kidney Disease: Lieske, John C.; Chronic Pain: Hooten, W. Michael.; Colorectal: Boardman, Lisa A.; COVID-19 Biobank: Kennedy, Richard B.; Cerhan, James R.; Badley, Andrew D.; Endometrial: Dowdy, Sean C.; Bakkum-Gamez, Jamie N.; Glaser, Gretchen E.; Lung: Yang, Ping.; Lymphoma: Cerhan, James R.; Mayo Clinic Biobank: Olson, Janet E.; Mayo Clinic Study of Aging (MCSA): Vemuri, Prashanthi; Ramanan, Vijay K.; Mayo Mammography Health Study: Vachon, Celine M.; Multiple Myeloma (MM)/Smouldering MM (SMM): Dispenzieri, Angela; Vachon, Celine M.; Neuroendocrine pancreatic tumor registry: Antwi, Samuel O.; Ann L. Oberg; Kari G. Rabe; Mayo Clinic Biospecimen Resource for Ovarian Cancer Research: Kaufmann, Scott H.; Goode, Ellen L.; William A. Cliby; Biospecimen Resource for Pancreas Research: Antwi, Samuel O.; Ann L. Oberg; Kari G. Rabe; Parkinson’s Disease: Ahlskog, J. Eric; Bower, James H.; Polycystic kidney disease: Harris, Peter C.; Polyps: Boardman, Lisa A.; Prevalence of Asymptomatic Ventricular Dysfunction: Pereira, Naveen L.; PRISM Mammography study: Couch, Fergus J.; Vachon, Celine M.; Olson, Janet E.; Prostate: Cicek, Mine.; Prostate Family: Cicek, Mine.; Radiation Oncology Registry: Ma, Daniel J.; Mutter, Robert W.; Renal: Eckel Passow, Jeanette E., Antwi, Samuel O.; Thompson, R. Houston; Sharma, Vidit; Vascular Diseases Biorepository: Pereira, Naveen L.; Management: Colborn, Lisa K.; Danielsen, Andrew J.; Harrington, Jonathan J.; Kushwaha, Jennifer M.
Conflicts of Interest
Sameer A. Parikh: research funding to the institution from Janssen, AstraZeneca, BeOne, Merck, and Genentech for clinical studies in which he is a principal investigator; honoraria to the institution from Pharmacyclics, Merck, AstraZeneca, Janssen, BeOne, Genentech, SoBi, Kite Pharma, and AbbVie for consulting and advisory board participation.
References
- Marti, G.E.; Rawstron, A.C.; Ghia, P.; Hillmen, P.; Houlston, R.S.; Kay, N.; Schleinitz, T.A.; Caporaso, N.; International Familial CLL Consortium. Diagnostic criteria for monoclonal B-cell lymphocytosis. Br. J. Haematol. 2005, 130, 325–332. [Google Scholar] [CrossRef] [Scilit] [PubMed]
- Landgren, O.; Albitar, M.; Ma, W.; Abbasi, F.; Hayes, R.B.; Ghia, P.; Marti, G.E.; Caporaso, N.E. B-cell clones as early markers for chronic lymphocytic leukemia. N. Engl. J. Med. 2009, 360, 659–667. [Google Scholar] [CrossRef] [Scilit] [PubMed]
- Slager, S.L.; Lanasa, M.C.; Marti, G.E.; Achenbach, S.J.; Camp, N.J.; Abbasi, F.; Kay, N.E.; Vachon, C.M.; Cerhan, J.R.; Johnston, J.B.; et al. Natural history of monoclonal B-cell lymphocytosis among relatives in CLL families. Blood 2021, 137, 2046–2056. [Google Scholar] [CrossRef] [Scilit] [PubMed]
- Alaggio, R.; Amador, C.; Anagnostopoulos, I.; Attygalle, A.D.; Araujo, I.B.O.; Berti, E.; Bhagat, G.; Borges, A.M.; Boyer, D.; Calaminici, M.; et al. The 5th edition of the World Health Organization Classification of Haematolymphoid Tumours: Lymphoid Neoplasms. Leukemia 2022, 36, 1720–1748. [Google Scholar] [CrossRef] [Scilit] [PubMed]
- Rawstron, A.C.; Bennett, F.L.; O’Connor, S.J.; Kwok, M.; Fenton, J.A.; Plummer, M.; de Tute, R.; Owen, R.G.; Richards, S.J.; Jack, A.S.; et al. Monoclonal B-cell lymphocytosis and chronic lymphocytic leukemia. N. Engl. J. Med. 2008, 359, 575–583. [Google Scholar] [CrossRef] [Scilit] [PubMed]
- Slager, S.L.; Parikh, S.A.; Achenbach, S.J.; Norman, A.D.; Rabe, K.G.; Boddicker, N.J.; Olson, J.E.; Kleinstern, G.; Lesnick, C.E.; Call, T.G.; et al. Progression and survival of MBL: A screening study of 10 139 individuals. Blood 2022, 140, 1702–1709. [Google Scholar] [CrossRef] [Scilit] [PubMed]
- Rawstron, A.C.; Green, M.J.; Kuzmicki, A.; Kennedy, B.; Fenton, J.A.; Evans, P.A.; O’Connor, S.J.; Richards, S.J.; Morgan, G.J.; Jack, A.S.; et al. Monoclonal B lymphocytes with the characteristics of “indolent” chronic lymphocytic leukemia are present in 3.5% of adults with normal blood counts. Blood 2002, 100, 635–639. [Google Scholar] [CrossRef] [Scilit] [PubMed]
- Nieto, W.G.; Almeida, J.; Romero, A.; Teodosio, C.; López, A.; Henriques, A.F.; Sánchez, M.L.; Jara-Acevedo, M.; Rasillo, A.; González, M.; et al. Increased frequency (12%) of circulating chronic lymphocytic leukemia-like B-cell clones in healthy subjects using a highly sensitive multicolor flow cytometry approach. Blood 2009, 114, 33–37. [Google Scholar] [CrossRef] [Scilit] [PubMed]
- Boddicker, N.J.; Shanafelt, T.D.; Parikh, S.A.; Rabe, K.G.; Griffin, R.; Norman, A.D.; Yao, Y.; Tian, S.; Ma, T.; O’Brien, D.R.; et al. CHIP amplifies the risk of lymphoid malignancies in individuals with monoclonal B-cell lymphocytosis (MBL). Blood Cancer J. 2025, 15, 195. [Google Scholar] [CrossRef] [Scilit] [PubMed]
- Vallejo, B.A.; Ansari, A.; Parikh, S.A.; Achenbach, S.J.; Rabe, K.G.; Norman, A.D.; Olson, J.E.; Kay, N.E.; Braggio, E.; Hanson, C.A.; et al. Risk of Incident Melanoma Among Individuals With Low-Count Monoclonal B-Cell Lymphocytosis. J. Clin. Oncol. 2024, 42, 4153–4162. [Google Scholar] [CrossRef] [Scilit] [PubMed]
- Shanafelt, T.D.; Kay, N.E.; Parikh, S.A.; Achenbach, S.J.; Lesnick, C.E.; Hanson, C.A.; Kleinstern, G.; Olson, J.E.; Norman, A.D.; Rabe, K.G.; et al. Risk of serious infection among individuals with and without low count monoclonal B-cell lymphocytosis (MBL). Leukemia 2021, 35, 239–244. [Google Scholar] [CrossRef] [Scilit] [PubMed]
- Agius, R.; Brieghel, C.; Andersen, M.A.; Pearson, A.T.; Ledergerber, B.; Cozzi-Lepri, A.; Louzoun, Y.; Andersen, C.L.; Bergstedt, J.; von Stemann, J.H.; et al. Machine learning can identify newly diagnosed patients with CLL at high risk of infection. Nat. Commun. 2020, 11, 363. [Google Scholar] [CrossRef] [Scilit] [PubMed]
- International CLL-IPI working group. An international prognostic index for patients with chronic lymphocytic leukaemia (CLL-IPI): A meta-analysis of individual patient data. Lancet Oncol. 2016, 17, 779–790. [Google Scholar] [CrossRef] [Scilit] [PubMed]
- Berndt, S.I.; Skibola, C.F.; Joseph, V.; Camp, N.J.; Nieters, A.; Wang, Z.; Cozen, W.; Monnereau, A.; Wang, S.S.; Kelly, R.S.; et al. Genome-wide association study identifies multiple risk loci for chronic lymphocytic leukemia. Nat. Genet. 2013, 45, 868–876. [Google Scholar] [CrossRef] [Scilit] [PubMed]
- Law, P.J.; Berndt, S.I.; Speedy, H.E.; Camp, N.J.; Sava, G.P.; Skibola, C.F.; Holroyd, A.; Joseph, V.; Sunter, N.J.; Nieters, A.; et al. Genome-wide association analysis implicates dysregulation of immunity genes in chronic lymphocytic leukaemia. Nat. Commun. 2017, 8, 14175. [Google Scholar] [CrossRef] [Scilit] [PubMed]
- Berndt, S.I.; Camp, N.J.; Skibola, C.F.; Vijai, J.; Wang, Z.; Gu, J.; Nieters, A.; Kelly, R.S.; Smedby, K.E.; Monnereau, A.; et al. Meta-analysis of genome-wide association studies discovers multiple loci for chronic lymphocytic leukemia. Nat. Commun. 2016, 7, 10933. [Google Scholar] [CrossRef] [Scilit] [PubMed]
- Di Bernardo, M.C.; Crowther-Swanepoel, D.; Broderick, P.; Webb, E.; Sellick, G.; Wild, R.; Sullivan, K.; Vijayakrishnan, J.; Wang, Y.; Pittman, A.M.; et al. A genome-wide association study identifies six susceptibility loci for chronic lymphocytic leukemia. Nat. Genet. 2008, 40, 1204–1210. [Google Scholar] [CrossRef] [Scilit] [PubMed]
- Crowther-Swanepoel, D.; Broderick, P.; Di Bernardo, M.C.; Dobbins, S.E.; Torres, M.; Mansouri, M.; Ruiz-Ponte, C.; Enjuanes, A.; Rosenquist, R.; Carracedo, A.; et al. Common variants at 2q37.3, 8q24.21, 15q21.3 and 16q24.1 influence chronic lymphocytic leukemia risk. Nat. Genet. 2010, 42, 132–136. [Google Scholar] [CrossRef] [Scilit] [PubMed]
- Slager, S.L.; Rabe, K.G.; Achenbach, S.J.; Vachon, C.M.; Goldin, L.R.; Strom, S.S.; Lanasa, M.C.; Spector, L.G.; Rassenti, L.Z.; Leis, J.F.; et al. Genome-wide association study identifies a novel susceptibility locus at 6p21.3 among familial CLL. Blood 2011, 117, 1911–1916. [Google Scholar] [CrossRef] [Scilit] [PubMed]
- Speedy, H.E.; Di Bernardo, M.C.; Sava, G.P.; Dyer, M.J.; Holroyd, A.; Wang, Y.; Sunter, N.J.; Mansouri, L.; Juliusson, G.; Smedby, K.E.; et al. A genome-wide association study identifies multiple susceptibility loci for chronic lymphocytic leukemia. Nat. Genet. 2014, 46, 56–60. [Google Scholar] [CrossRef] [Scilit] [PubMed]
- Kleinstern, G.; Camp, N.J.; Goldin, L.R.; Vachon, C.M.; Vajdic, C.M.; de Sanjose, S.; Weinberg, J.B.; Benavente, Y.; Casabonne, D.; Liebow, M.; et al. Association of polygenic risk score with the risk of chronic lymphocytic leukemia and monoclonal B-cell lymphocytosis. Blood 2018, 131, 2541–2551. [Google Scholar] [CrossRef] [Scilit] [PubMed]
- Kleinstern, G.; Weinberg, J.B.; Parikh, S.A.; Braggio, E.; Achenbach, S.J.; Robinson, D.P.; Norman, A.D.; Rabe, K.G.; Boddicker, N.J.; Vachon, C.M.; et al. Polygenic risk score and risk of monoclonal B-cell lymphocytosis in caucasians and risk of chronic lymphocytic leukemia (CLL) in African Americans. Leukemia 2022, 36, 119–125. [Google Scholar] [CrossRef] [Scilit] [PubMed]
- Kleinstern, G.; Slager, S.L. The inherited genetic contribution and polygenic risk score for risk of CLL and MBL: A narrative review. Leuk. Lymphoma 2023, 64, 788–798. [Google Scholar] [CrossRef] [Scilit] [PubMed]
- Crowther-Swanepoel, D.; Corre, T.; Lloyd, A.; Gaidano, G.; Olver, B.; Bennett, F.L.; Doughty, C.; Toniolo, D.; Caligaris-Cappio, F.; Ghia, P.; et al. Inherited genetic susceptibility to monoclonal B-cell lymphocytosis. Blood 2010, 116, 5957–5960. [Google Scholar] [CrossRef] [Scilit] [PubMed]
- Olson, J.E.; Ryu, E.; Johnson, K.J.; Koenig, B.A.; Maschke, K.J.; Morrisette, J.A.; Liebow, M.; Takahashi, P.Y.; Fredericksen, Z.S.; Sharma, R.G.; et al. The Mayo Clinic Biobank: A building block for individualized medicine. Mayo Clin. Proc. 2013, 88, 952–962. [Google Scholar] [CrossRef] [Scilit] [PubMed]
- Olson, J.E.; Ryu, E.; Hathcock, M.A.; Gupta, R.; Bublitz, J.T.; Takahashi, P.Y.; Bielinski, S.J.; St Sauver, J.L.; Meagher, K.; Sharp, R.R.; et al. Characteristics and utilisation of the Mayo Clinic Biobank, a clinic-based prospective collection in the USA: Cohort profile. BMJ Open 2019, 9, e032707. [Google Scholar] [CrossRef] [Scilit] [PubMed]
- Boddicker, N.J.; Mwangi, R.; Robinson, D.P.; Allmer, C.; Rosenthal, A.C.; Habermann, T.M.; Feldman, A.L.; Rimsza, L.M.; King, R.L.; Larson, M.C.; et al. Risk of lymphoid malignancy associated with cancer predisposition genes. Blood Cancer J. 2025, 15, 71. [Google Scholar] [CrossRef] [Scilit] [PubMed]
- Kleinstern, G.; Boddicker, N.J.; O’Brien, D.R.; Allmer, C.; Rabe, K.G.; Norman, A.D.; Griffin, R.; Yan, H.; Ma, T.; Call, T.G.; et al. Tumor mutational load is prognostic for progression to therapy among high-count monoclonal B-cell lymphocytosis. Blood Adv. 2024, 8, 2118–2129. [Google Scholar] [CrossRef] [Scilit] [PubMed]
- Parikh, S.A.; Rabe, K.G.; Kay, N.E.; Call, T.G.; Ding, W.; Schwager, S.M.; Bowen, D.A.; Conte, M.; Jelinek, D.F.; Slager, S.L.; et al. Chronic lymphocytic leukemia in young (≤ 55 years) patients: A comprehensive analysis of prognostic factors and outcomes. Haematologica 2014, 99, 140–147. [Google Scholar] [CrossRef] [Scilit] [PubMed]
- Chang, C.C.; Chow, C.C.; Tellier, L.C.; Vattikuti, S.; Purcell, S.M.; Lee, J.J. Second-generation PLINK: Rising to the challenge of larger and richer datasets. Gigascience 2015, 4, 7. [Google Scholar] [CrossRef] [Scilit] [PubMed]
- Speedy, H.E.; Beekman, R.; Chapaprieta, V.; Orlando, G.; Law, P.J.; Martín-García, D.; Gutiérrez-Abril, J.; Catovsky, D.; Beà, S.; Clot, G.; et al. Insight into genetic predisposition to chronic lymphocytic leukemia from integrative epigenomics. Nat. Commun. 2019, 10, 3615. [Google Scholar] [CrossRef] [Scilit] [PubMed]
- Abdelbaky, S.B.; Giacopelli, B.; Rabe, K.G.; Yamaguchi, K.; Wu, Y.Z.; Yan, H.; Shanafelt, T.D.; Parikh, S.A.; Ding, W.; Hampel, P.J.; et al. Prediction of outcomes for high-count monoclonal B lymphocytosis using an epigenetic and immunogenetic signature. Blood 2024, 143, 1752–1757. [Google Scholar] [CrossRef] [Scilit] [PubMed]

Disclaimer/Publisher’s Note: The statements, opinions and data contained in all publications are solely those of the individual author(s) and contributor(s) and not of MDPI and/or the editor(s). MDPI and/or the editor(s) disclaim responsibility for any injury to people or property resulting from any ideas, methods, instructions or products referred to in the content. |
© 2026 by the authors. Licensee MDPI, Basel, Switzerland. This article is an open access article distributed under the terms and conditions of the Creative Commons Attribution (CC BY) license.