Low Calorie Beverage Consumption Is Associated with Energy and Nutrient Intakes and Diet Quality in British Adults

 ,
,
Abstract
:1. Introduction
2. Methods
2.1. Sample
2.2. Interview
2.3. Diet Record
2.4. Classification of Beverages
- Low calorie beverages (LCB): all low- and no-calorie beverages, carbonated and still, ready to drink and diluted (weight of added water included). Excludes water.
- Sugar-sweetened beverages (SSB): beverages with a range of sugar contents, carbonated and still, ready to drink and diluted (weight of added water included).
- 100% fruit juices (FJ), not including fruit drinks.
- Tea, coffee and water (TCW), excluding added milk (unless takeaway/vending beverage).
- Milk: all liquid milk, including that added to hot beverages.
- Alcoholic beverages: beer, cider, wine, spirits, alco-pops.
2.5. Classification of Respondents

| No LCB | LCB | Total N | |
|---|---|---|---|
| No SSB | Non-consumer (NC) | LCB only | |
| 598 | 216 | 814 | |
| SSB | SSB only | Both LCB and SSB (BB) | |
| 476 | 300 | 776 | |
| Total N | 1074 | 516 | 1590 |
2.6. Statistical Methods
3. Results
3.1. Subject Characteristics
| Characteristic | Group | Beverage Consumer Group 1 | Chi-Square p Value | |||||
|---|---|---|---|---|---|---|---|---|
| NC | LCB | SSB | BB | All | ||||
| n | 598 | 216 | 476 | 300 | 1590 | |||
| Age | All 16+ | mean | 55 a | 46 b | 43 b | 37 c | 47 | <0.0001 |
| SE | 1 | 1 | 1 | 1 | ||||
| Age group | 16–24 | % | 5 a | 6 a | 24 b | 27 b | 15 | <0.0001 |
| 25–44 | % | 25 | 43 | 33 | 46 | 34 | ||
| 45–64 | % | 38 | 39 | 27 | 21 | 31 | ||
| 65+ | % | 33 | 13 | 16 | 7 | 20 | ||
| Sex | Male | % | 47 | 48 | 52 | 47 | 49 | 0.25 |
| Female | % | 53 | 53 | 48 | 53 | 51 | ||
| Ethnic group | White | % | 89 | 96 a | 86 b | 91 | 89 | 0.002 |
| Non-white | % | 11 | 4 | 14 | 9 | 11 | ||
| Socio-economic group | Higher Professional/managerial | % | 16 | 20 a | 14 | 11 b | 15 | 0.26 |
| Lower Professional/managerial | % | 27 | 27 | 28 | 30 | 28 | ||
| Intermediate/small employers | % | 20 | 17 | 22 | 18 | 20 | ||
| Routine/manual/not working | % | 38 | 36 | 37 | 41 | 38 | ||
| Educational Qualifications 2 | Some | % | 72 a | 84 b | 78 | 85 b | 78 | <0.001 |
| None | % | 28 | 16 | 22 | 15 | 22 | ||
| Economic status | In full-time education | % | 3 a | 2 a | 10 b | 15 b | 7 | <0.0001 |
| Employed | % | 51 a | 66 b | 55 | 62 b | 56 | ||
| Not working or retired | % | 47 a | 32 b | 35 b | 23 c | 37 | ||
| Household income (£) | <15 K | % | 17 | 15 | 18 | 13 | 16 | 0.08 |
| 15–30 K | % | 34 | 27 | 37 | 32 | 34 | ||
| >30 K | % | 50 a,b | 58 a | 45 b | 55 a,b | 50 | ||
| On a diet | Not dieting | % | 87 | 85 | 91 | 88 | 88 | 0.11 |
| Dieting | % | 13 | 15 | 9 | 12 | 12 | ||
| Smoking status | Current smoker | % | 19 | 25 | 23 | 23 | 22 | 0.001 |
| Ex-regular smoker | % | 27 a | 27 a | 19 b | 16 b | 22 | ||
| Never regular smoker | % | 55 | 49 | 58 | 61 | 56 | ||
| Drink alcohol | Yes | % | 81 | 89 | 82 | 86 | 83 | 0.03 |
| No | % | 20 | 12 | 18 | 14 | 17 | ||
| BMI group | Under 18.5 kg/m2 | % | 1 | 1 | 4 | 0 | 2 | <0.001 |
| 18.5 and below 25 kg/m2 | % | 33 | 28 a | 39 b | 42 b | 36 | ||
| 25 and below 30 kg/m2 | % | 37 | 38 | 34 | 32 | 35 | ||
| 30+ kg/m2 | % | 28 | 33 a | 22 b | 26 | 27 | ||
| BMI (kg/m2) | Mean | 27.7 a | 28.4 a | 26.3 b | 27.2 | 27.2 | 0.001 | |
| SE | 0.24 | 0.4 | 0.24 | 0.34 | 0.14 | |||
3.2. Beverage Consumption
| Beverage | Beverage Consumer Group | Overall ANOVA | Planned Contrasts | |||||||
|---|---|---|---|---|---|---|---|---|---|---|
| NC | LCB | SSB | BB | All | LCB vs. NC | LCB vs. SSB | LCB vs. BB | |||
| n | 598 | 216 | 476 | 300 | 1590 | |||||
| Sugar-sweetened beverages (SSB) | Mean | 0 a | 0 a | 253 b | 263 b | 129 | <0.0001 | 1.0 | <0.0001 | <0.0001 |
| SE | 0 | 0 | 11 | 17 | 6 | |||||
| Low calorie beverages (LCB) | Mean | 0 a | 297 b | 0 a | 284 b | 90 | <0.0001 | <0.0001 | <0.0001 | 0.67 |
| SE | 0 | 24 | 0 | 18 | 6 | |||||
| Tea, coffee, water | Mean | 1245 a | 1070 b | 1041 b | 821 c | 1080 | <0.0001 | 0.001 | 0.6 | <0.0001 |
| SE | 25 | 44 | 29 | 30 | 16 | |||||
| Tea | Mean | 490 a | 423 a,b | 359 b,c | 270 c | 399 | <0.0001 | 0.05 | 0.06 | <0.0001 |
| SE | 18 | 29 | 19 | 18 | 10 | |||||
| Coffee | Mean | 281 a | 256 a | 238 a,b | 196 b | 249 | 0.005 | 0.4 | 0.50 | 0.04 |
| SE | 15 | 22 | 16 | 18 | 9 | |||||
| Tap Water | Mean | 342 | 310 | 348 | 290 | 330 | 0.2 | 0.3 | 0.3 | 0.7 |
| SE | 19 | 31 | 23 | 22 | 12 | |||||
| Bottled Water | Mean | 98 | 71 | 78 | 56 | 80 | 0.05 | 0.1 | 0.6 | 0.3 |
| SE | 12 | 12 | 8 | 8 | 6 | |||||
| Fruit Juice | Mean | 48 a | 58 a,b | 56 b | 62 b | 55 | 0.3 | 0.3 | 0.9 | 0.8 |
| SE | 4 | 9 | 4 | 9 | 3 | |||||
| Alcoholic drinks | Mean | 222 a | 219 a,b | 316 b | 268 a,b | 260 | 0.02 | 0.9 | 0.04 | 0.3 |
| SE | 16 | 36 | 30 | 33 | 13 | |||||
| Milk | Mean | 164 | 163 | 154 | 152 | 158 | 0.5 | 1.0 | 0.5 | 0.45 |
| SE | 5 | 11 | 6 | 9 | 3 | |||||
| Total Beverages | Mean | 1679 a | 1807 a,b | 1821 a,b | 1850 b | 1772 | 0.008 | 0.05 | 0.85 | 0.6 |
| SE | 30 | 57 | 42 | 53 | 21 | |||||
3.3. Food Consumption
| Food Group | Beverage Consumer Group | Planned Contrasts | ||||||||
|---|---|---|---|---|---|---|---|---|---|---|
| NC | LCB | SSB | BB | All | Overall ANOVA | LCB vs. NC | LCB vs. SSB | LCB vs. BB | ||
| n | 598 | 216 | 476 | 300 | 1590 | |||||
| Meat and Meat Products | Mean | 167 a | 181 a,b | 193 b,c | 211 c | 185 | <0.0001 | 0.1 | 0.2 | 0.009 |
| SE | 5 | 8 | 5 | 8 | 3 | |||||
| Fish | Mean | 46 a | 42 a,b | 34 b | 31 b,c | 39 | <0.0001 | 0.4 | 0.09 | 0.03 |
| SE | 2.4 | 3.9 | 2.1 | 2.7 | 1.3 | |||||
| Fruit | Mean | 110 a | 105 a,b | 88 b,c | 74 c | 96 | <0.0001 | 0.6 | 0.05 | 0.001 |
| SE | 5 | 7 | 5 | 5 | 3 | |||||
| Vegetables | Mean | 147 a | 137 a,b | 129 b,c | 112 c | 133 | <0.0001 | 0.2 | 0.3 | 0.005 |
| SE | 4 | 7 | 4 | 5 | 3 | |||||
| Potatoes | Mean | 84 a | 82 a | 88 a,b | 99 b | 88 | 0.004 | 0.8 | 0.3 | 0.004 |
| SE | 3 | 4 | 3 | 4 | 2 | |||||
| Chips, Fried and Roast Potatoes | Mean | 35 a | 38 a,b | 45 b,c | 52 c | 42 | <0.0001 | 0.4 | 0.1 | 0.004 |
| SE | 2 | 3 | 2 | 3 | 1 | |||||
| Bread | Mean | 80 a | 80 a | 88 a,b | 90 b | 84 | 0.006 | 1.0 | 0.05 | 0.04 |
| SE | 2 | 3 | 2 | 3 | 1 | |||||
| White bread | Mean | 43 a | 42 a,b | 54 b,c | 58 c | 49 | <0.0001 | 0.8 | 0.002 | 0.001 |
| SE | 2 | 2 | 1 | 2 | 1 | |||||
| Pasta, Rice & other cereals | Mean | 65 a | 65 a,b | 80 b | 88 b,c | 74 | <0.0001 | 1.0 | 0.02 | 0.002 |
| SE | 3 | 5 | 4 | 5 | 2 | |||||
| Breakfast cereals | Mean | 34 a | 23 b | 26 b | 20 b | 28 | <0.0001 | 0.001 | 0.3 | 0.3 |
| SE | 2 | 2 | 2 | 1 | 1 | |||||
| High fibre breakfast cereals | Mean | 29 a | 19 a,b | 19 b | 13 b,c | 21 | <0.0001 | 0.002 | 0.8 | 0.04 |
| SE | 2 | 2 | 2 | 1 | 1 | |||||
| Sugary foods | Mean | 73 | 71 | 78 | 73 | 74 | 0.4 | 0.7 | 0.1 | 0.7 |
| SE | 3 | 4 | 3 | 3 | 2 | |||||
| Puddings, yogurt and ice cream | Mean | 50 | 48 | 49 | 45 | 49 | 0.9 | 0.7 | 0.8 | 0.6 |
| SE | 3 | 4 | 3 | 3 | 2 | |||||
| Biscuits and cakes | Mean | 34 | 32 | 33 | 31 | 33 | 0.7 | 0.5 | 0.7 | 0.8 |
| SE | 2 | 2 | 2 | 2 | 1 | |||||
| Confectionery | Mean | 6 a | 11 b,c | 12 b | 14 c | 10 | <0.0001 | 0.001 | 0.5 | 0.06 |
| SE | 1 | 1 | 1 | 1 | 1 | |||||
| Sugar, jam and sweet spreads | Mean | 12 a,c | 9 b | 13 a | 9 b,c | 11 | <0.0001 | 0.003 | 0.001 | 0.9 |
| SE | 1 | 1 | 1 | 1 | 1 | |||||
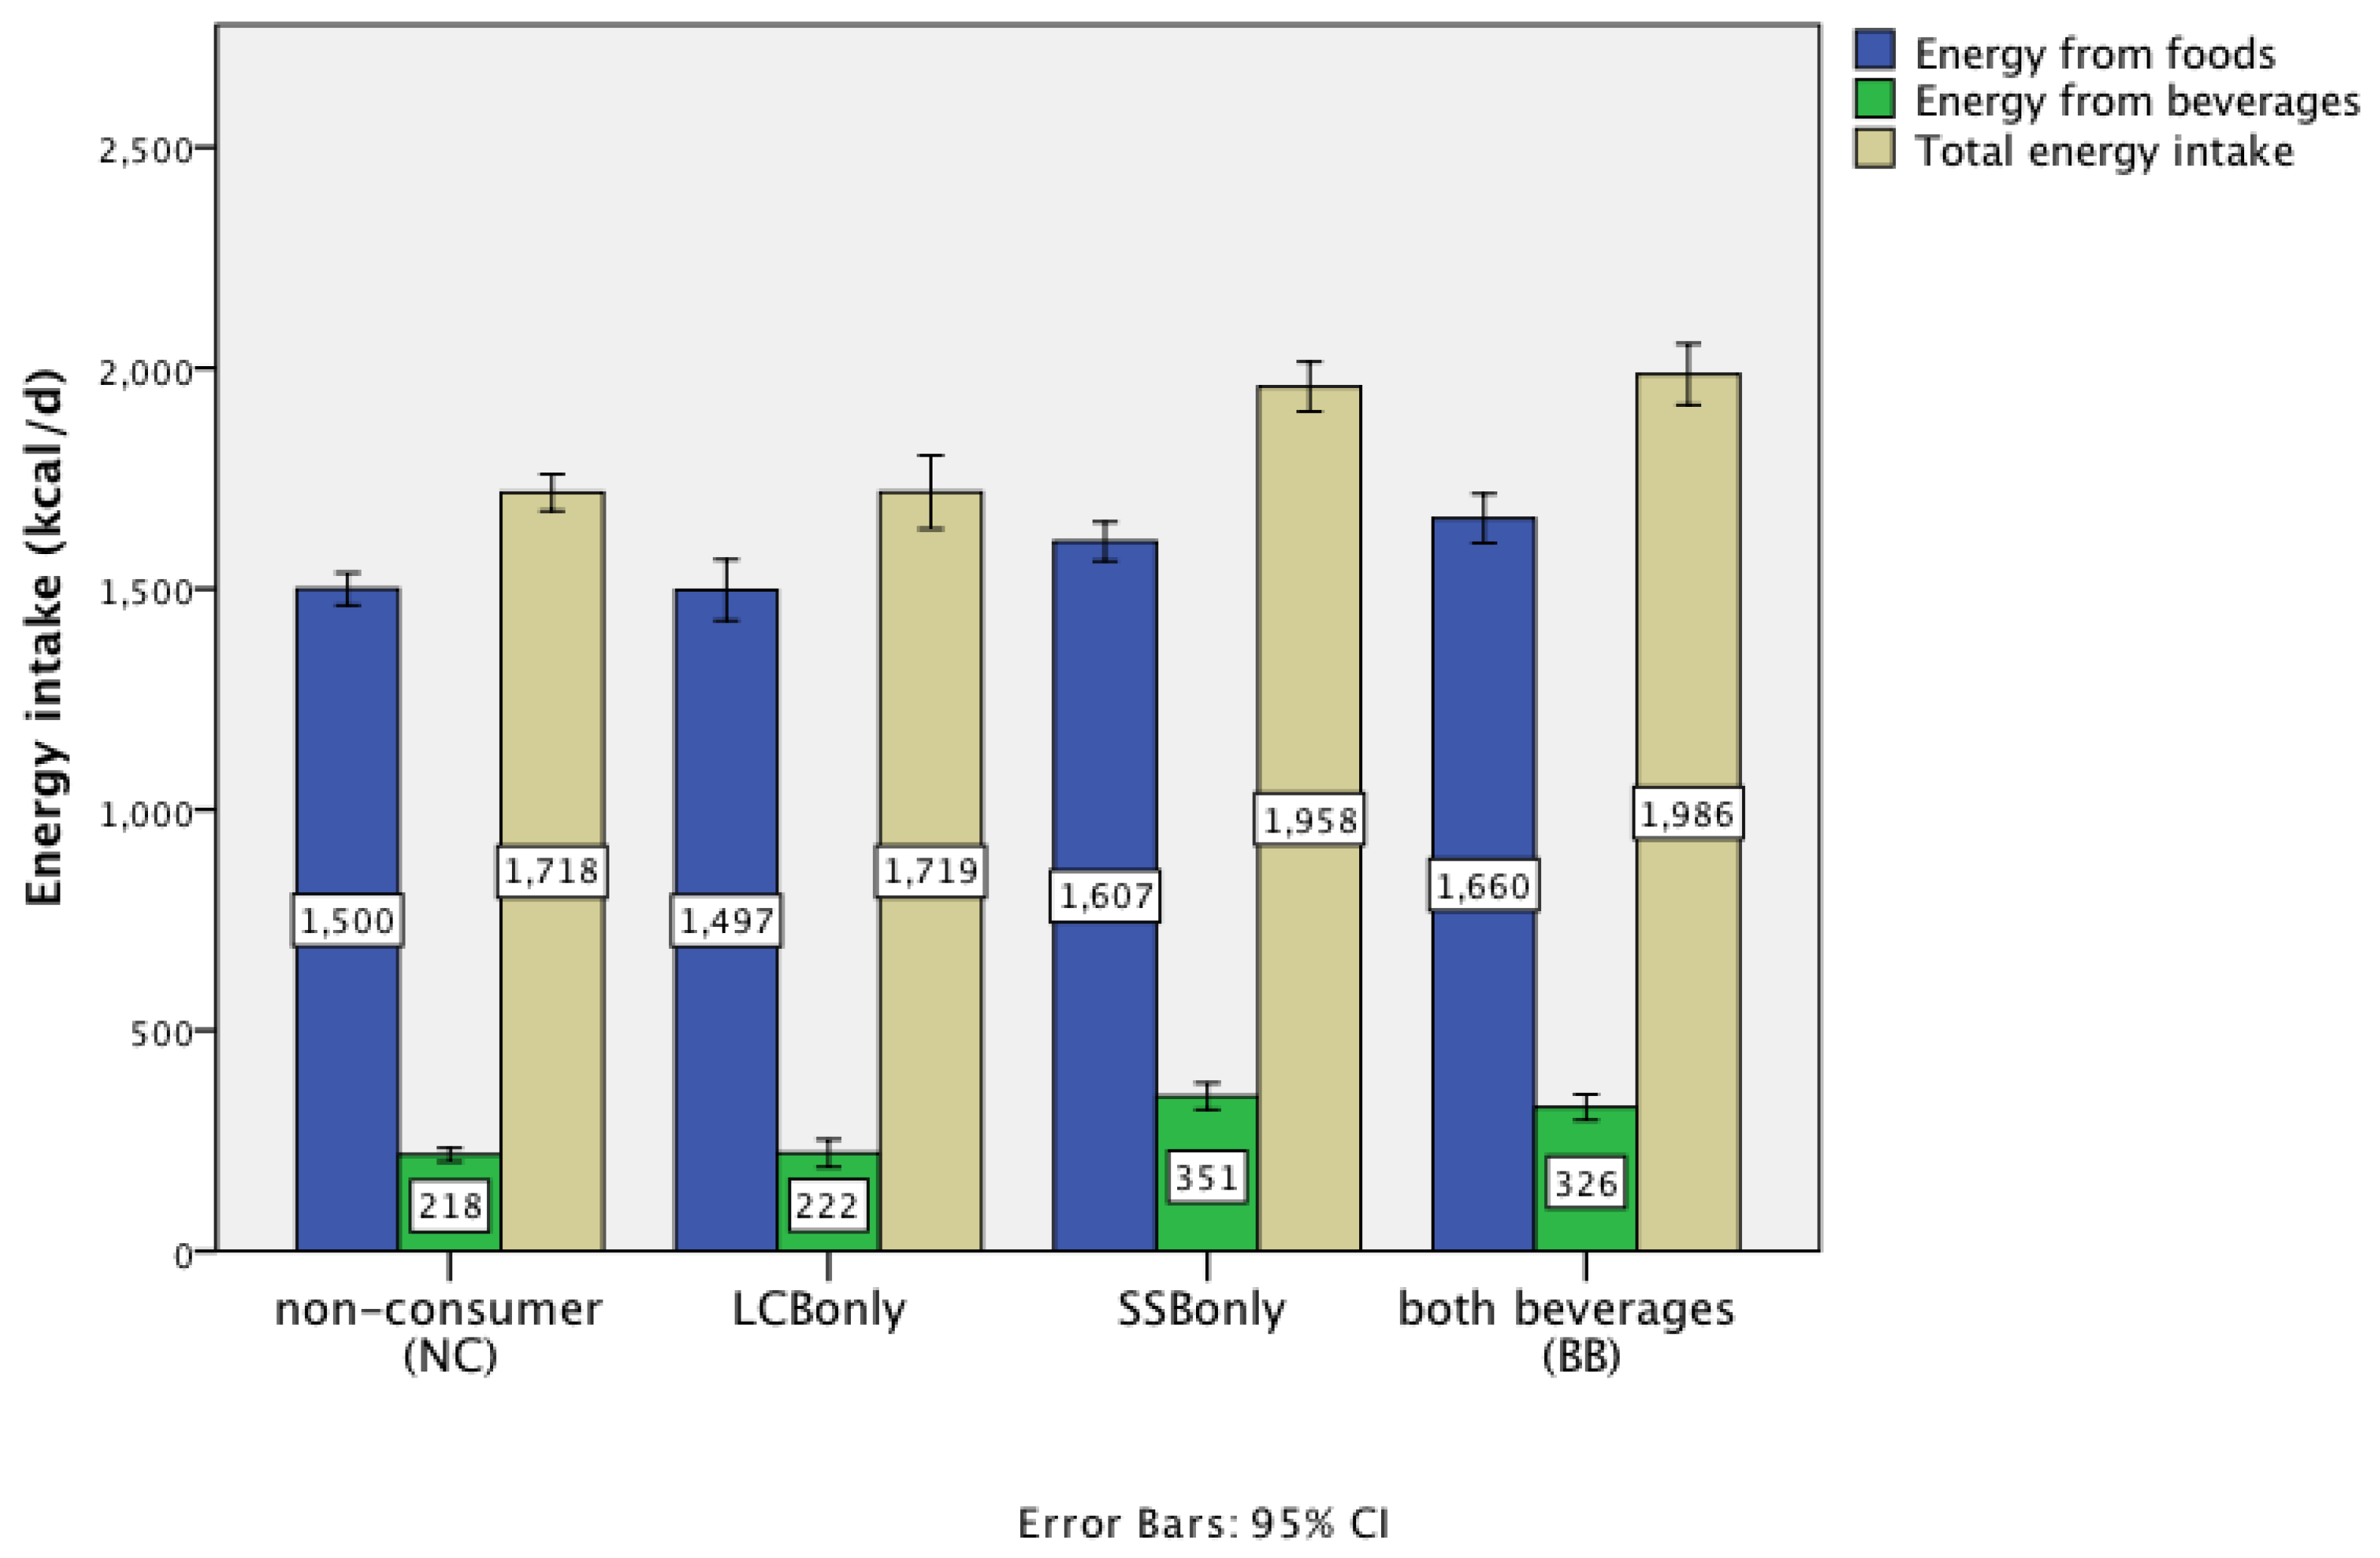
3.4. Energy and Macronutrient Intake

| Macronutrient Intake (per Day) | Beverage Consumer Group | Planned Contrasts | ||||||||
|---|---|---|---|---|---|---|---|---|---|---|
| NC | LCB | SSB | BB | All | Overall ANOVA | LCB vs. NC | LCB vs. SSB | LCB vs. BB | ||
| n | 598 | 216 | 476 | 300 | 1590 | |||||
| Energy (kcal) | Mean | 1718 a | 1719 a | 1958 b | 1986 b | 1844 | <0.0001 | 1.0 | <0.0001 | <0.0001 |
| SE | 21 | 42 | 29 | 35 | 15 | |||||
| Protein (g) | Mean | 72 | 74 | 75 | 77 | 74 | 0.1 | 0.4 | 0.9 | 0.3 |
| SE | 1.2 | 1.9 | 1.0 | 1.4 | 0.7 | |||||
| Fat (g) | Mean | 66 a | 65 a | 72 b | 74 b | 69 | <0.0001 | 0.6 | 0.001 | <0.0001 |
| SE | 1.0 | 2.0 | 1.2 | 1.6 | 0.7 | |||||
| Carbohydrate (g) | Mean | 200 a | 200 a | 239 b | 243 b | 221 | <0.0001 | 1.0 | <0.0001 | <0.0001 |
| SE | 2 | 5 | 3 | 4 | 2 | |||||
| Saturated fatty acids (g) | Mean | 24.4 a | 24.2 a | 26.7 b | 27.0 b | 25.6 | <0.0001 | 0.8 | 0.01 | 0.007 |
| SE | 0.4 | 0.8 | 0.5 | 0.6 | 0.3 | |||||
| Monounsaturated fatty acids (g) | Mean | 23.2 a | 22.9 a | 26.0 b | 27.1 b | 24.8 | <0.0001 | 0.7 | <0.0001 | <0.0001 |
| SE | 0.4 | 0.7 | 0.5 | 0.6 | 0.3 | |||||
| n-6 Fatty acids (g) | Mean | 9.5 a | 9.2 a | 10.2 a,b | 10.6 b | 9.9 | <0.0001 | 0.4 | 0.009 | 0.001 |
| SE | 0.2 | 0.3 | 0.2 | 0.3 | 0.1 | |||||
| n-3 Fatty acids (g) | Mean | 2.1 | 1.9 | 2.1 | 2.1 | 2.1 | 0.096 | 0.02 | 0.05 | 0.02 |
| SE | 0.1 | 0.1 | 0.1 | 0.1 | 0.03 | |||||
| Trans fatty acids (g) | Mean | 1.34 a | 1.37 a,b | 1.48 b | 1.49 b,c | 1.42 | 0.004 | 0.7 | 0.1 | 0.1 |
| SE | 0.03 | 0.06 | 0.03 | 0.04 | 0.02 | |||||
| Starch (g) | Mean | 117 a | 118 a | 128 b | 138 c | 125 | <0.0001 | 0.9 | 0.007 | <0.0001 |
| SE | 2 | 3 | 2 | 3 | 1 | |||||
| Non-milk extrinsic sugars (g) | Mean | 43 a | 43 a | 76 b | 71 b | 59 | <0.0001 | 1.0 | <0.0001 | <0.0001 |
| SE | 1 | 2 | 2 | 2 | 1 | |||||
| Non-starch polysaccharide (g) | Mean | 13.9 | 13.9 | 13.3 | 13.3 | 13.6 | 0.200 | 1.0 | 0.3 | 0.2 |
| SE | 0.2 | 0.4 | 0.2 | 0.3 | 0.1 | |||||
| Macronutrients (% energy) | ||||||||||
| Protein | Mean | 17.1 a | 18 b | 15.7 c | 15.7 c | 16.5 | <0.0001 | 0.03 | <0.0001 | <0.0001 |
| SE | 0.2 | 0.4 | 0.2 | 0.2 | 0.1 | |||||
| Fat | Mean | 33.9 | 33.2 | 33.0 | 33.2 | 33.4 | 0.1 | 0.3 | 0.6 | 0.9 |
| SE | 0.3 | 0.5 | 0.3 | 0.3 | 0.2 | |||||
| Carbohydrate | Mean | 44.5 a | 44.1 a | 46.4 b | 46.4 b | 45.4 | <0.0001 | 0.5 | <0.0001 | 0.001 |
| SE | 0.2 | 0.5 | 0.3 | 0.4 | 0.2 | |||||
| Saturated fatty acids | Mean | 12.6 | 12.4 | 12.2 | 12.1 | 12.4 | 0.1 | 0.4 | 0.6 | 0.4 |
| SE | 0.4 | 0.8 | 0.5 | 0.7 | 0.3 | |||||
| Monounsaturated fatty acids | Mean | 11.9 | 11.8 | 11.9 | 12.1 | 11.9 | 0.5 | 0.6 | 0.6 | 0.1 |
| SE | 0.4 | 0.7 | 0.5 | 0.6 | 0.3 | |||||
| n-3 Fatty acids | Mean | 1.1 a | 1.0 b | 0.9 b | 1.0 b | 1.0 | <0.0001 | 0.005 | 0.6 | 0.9 |
| SE | 0.05 | 0.07 | 0.05 | 0.06 | 0.03 | |||||
| n-6 Fatty acids | Mean | 4.9 | 4.8 | 4.7 | 4.8 | 4.8 | 0.2 | 0.3 | 0.6 | 1.0 |
| SE | 0.19 | 0.31 | 0.19 | 0.25 | 0.11 | |||||
| Trans fatty acids | Mean | 0.7 | 0.7 | 0.7 | 0.7 | 0.7 | 0.4 | 0.6 | 0.8 | 0.5 |
| SE | 0.03 | 0.06 | 0.03 | 0.04 | 0.02 | |||||
| Starch | Mean | 26.2 a | 26.2 a,b | 25.0 b | 26.4 a | 25.9 | 0.003 | 1.0 | 0.03 | 0.6 |
| SE | 0.3 | 0.5 | 0.3 | 0.3 | 0.1 | |||||
| Non-milk extrinsic sugars | Mean | 9.4 a | 9.2 a | 14.3 b | 13.3 b | 11.6 | <0.0001 | 0.6 | <0.0001 | <0.0001 |
| SE | 0.2 | 0.3 | 0.2 | 0.3 | 0.2 | |||||
3.5. Micronutrient Intakes
| Micronutrient (per Day) | Beverage Consumer Group | Planned Contrasts | ||||||||
|---|---|---|---|---|---|---|---|---|---|---|
| NC | LCB | SSB | BB | All | Overall | LCB vs. non | LCB vs. SSB | LCB vs. BB | ||
| n | 598 | 216 | 476 | 300 | 1590 | |||||
| Vitamin A (RE) (µg) | Mean | 1344 a | 1119 a,b | 1012 b | 976 b,c | 1143 | <0.0001 | 0.04 | 0.3 | 0.2 |
| SE | 56 | 91 | 40 | 58 | 29 | |||||
| Thiamin (mg) | Mean | 2.3 | 1.9 | 1.6 | 2.2 | 2.0 | 0.2 | 0.2 | 0.2 | 0.5 |
| SE | 0.3 | 0.2 | 0.1 | 0.4 | 0.2 | |||||
| Riboflavin (mg) | Mean | 2.2 | 1.8 | 1.8 | 2.1 | 2.0 | 0.3 | 0.07 | 0.9 | 0.3 |
| SE | 0.2 | 0.1 | 0.1 | 0.3 | 0.1 | |||||
| Niacin equivalent (mg) | Mean | 37.0 | 38.0 | 39.1 | 39.7 | 38.3 | 0.09 | 0.5 | 0.4 | 0.2 |
| SE | 0.8 | 1.1 | 0.7 | 0.9 | 0.4 | |||||
| Vitamin B6 (mg) | Mean | 2.8 | 2.6 | 2.6 | 3.2 | 2.8 | 0.2 | 0.4 | 0.9 | 0.1 |
| SE | 0.2 | 0.1 | 0.1 | 0.4 | 0.1 | |||||
| Vitamin B12 (µg) | Mean | 6.6 a | 5.7 a,b | 5.5 b | 5.7 a,b | 6.0 | 0.02 | 0.05 | 0.5 | 1.0 |
| SE | 0.3 | 0.3 | 0.2 | 0.4 | 0.2 | |||||
| Folate (µg) | Mean | 301.1 | 287.4 | 279.7 | 300.8 | 292.6 | 0.5 | 0.4 | 0.5 | 0.6 |
| SE | 10.9 | 10.5 | 6.1 | 21.8 | 6.2 | |||||
| Vitamin C (mg) | Mean | 106.6 | 99.0 | 108.9 | 101.2 | 105.4 | 0.7 | 0.4 | 0.3 | 0.8 |
| SE | 5.8 | 6.7 | 5.9 | 5.3 | 3.1 | |||||
| Vitamin D (µg) | Mean | 4.4 a | 3.9 a,b | 3.2 b | 3.4 b,c | 3.8 | <0.0001 | 0.1 | 0.02 | 0.07 |
| SE | 0.2 | 0.3 | 0.1 | 0.2 | 0.1 | |||||
| Vitamin E (mg) | Mean | 12.5 | 10.5 | 11.4 | 10.9 | 11.6 | 0.5 | 0.08 | 0.4 | 0.7 |
| SE | 1.0 | 0.6 | 0.9 | 1.0 | 0.5 | |||||
| Iron (mg) | Mean | 11.8 | 11.5 | 12.2 | 11.6 | 11.9 | 0.7 | 0.7 | 0.3 | 0.9 |
| SE | 0.3 | 0.5 | 0.6 | 0.3 | 0.2 | |||||
| Calcium (mg) | Mean | 824 | 842 | 851 | 866 | 842 | 0.3 | 0.5 | 0.8 | 0.4 |
| SE | 13 | 24 | 15 | 20 | 9 | |||||
| Magnesium (mg) | Mean | 258 | 256 | 259 | 254 | 257 | 0.9 | 0.8 | 0.8 | 0.8 |
| SE | 4 | 7 | 4 | 5 | 2 | |||||
| Potassium (mg) | Mean | 2806 | 2809 | 2775 | 2786 | 2793 | 0.9 | 1.0 | 0.7 | 0.8 |
| SE | 36 | 71 | 40 | 51 | 22 | |||||
| Zinc (mg) | Mean | 9.5 | 9.6 | 9.5 | 9.8 | 9.6 | 0.8 | 0.8 | 0.7 | 0.7 |
| SE | 0.2 | 0.4 | 0.2 | 0.3 | 0.1 | |||||
| Selenium (µg) | Mean | 51 | 50 | 48 | 49 | 50 | 0.5 | 0.9 | 0.3 | 0.6 |
| SE | 1.3 | 2.0 | 1.0 | 1.4 | 0.7 | |||||
| Iodine (µg) | Mean | 180 a | 176 a,b | 173 a,b | 160 b | 174 | 0.02 | 0.6 | 0.7 | 0.05 |
| SE | 3.6 | 6.7 | 4.0 | 5.0 | 2.2 | |||||
| Sodium (mg) | Mean | 2112 a | 2244 a,b | 2355 b | 2559 c | 2288 | <0.0001 | 0.06 | 0.1 | <0.0001 |
| SE | 32 | 62 | 40 | 50 | 22 | |||||
3.6. Energy Intake: Adjustment for Covariates
| Parameter | B | Std. Error | t | Sig. |
|---|---|---|---|---|
| Intercept | 1502 | 93 | 16 | <0.0001 |
| Non Consumer | −226 | 43 | −5 | <0.0001 |
| Low Calorie Beverages | −241 | 52 | −5 | <0.0001 |
| Sugar-Sweetened Beverages | −52 | 42 | −1 | 0.2 |
| Both Beverages (ref) | 0 | |||
| Males | 515 | 29 | 18 | <0.0001 |
| Females (ref) | 0 | |||
| Age 16–24 years | 9 | 59 | 0 | 0.9 |
| Age 25–44 years | 56 | 48 | 1 | 0.2 |
| Age 45–64 years | 22 | 45 | 0 | 0.6 |
| Age 65 + years (ref) | 0 | |||
| BMI < 18.5 (underweight) | 95 | 110 | 1 | 0.4 |
| BMI 18.5 < 25 (normal weight) | 58 | 38 | 1 | 0.1 |
| BMI 25 < 30 (overweight) | 18 | 37 | 0 | 0.6 |
| BMI 30+ (obese) (ref) | 0 | |||
| Not dieting | 121 | 46 | 3 | 0.008 |
| Dieting (ref) | 0 | |||
| White ethnicity | 161 | 49 | 3 | 0.001 |
| Non-white ethnicity (ref) | 0 | |||
| Current smoker | −91 | 38 | −2 | 0.02 |
| Ex-smoker | 10 | 37 | 0 | 0.8 |
| Non-smoker (ref) | 0 | . | . | . |
| Socioeconomic group 1 (highest) | 77 | 48 | 2 | 0.1 |
| Socioeconomic group 2 | 6 | 38 | 0 | 0.9 |
| Socioeconomic group 3 | 16 | 41 | 0 | 0.7 |
| Socioeconomic group 4 (lowest) (ref) | 0 | |||
| Household income 1 (lowest) | −101 | 54 | −2 | 0.06 |
| Household income 2 | −46 | 44 | −1 | 0.3 |
| Household income 3 | −85 | 41 | −2 | 0.04 |
| Household income 4 (highest) (ref) | 0 | |||
| Educational qualification (none) | −118 | 42 | −3 | 0.006 |
| Educational qualification (any) (ref) | 0 |
3.7. Within- Person Analysis
| Model 7.1 | Model 7.2 | Model 7.3 | |||||||||
|---|---|---|---|---|---|---|---|---|---|---|---|
| Total Energy | Beverage Energy | Food Energy | |||||||||
| Parameter | B | SE | p Value | Parameter | B | SE | p Value | Parameter | B | SE | p Value |
| Low Calorie Beverages | 1 | 4 | 0.9 | Low Calorie Beverages | −5 | 2 | 0.01 | Low Calorie Beverages | 6 | 4 | 0.1 |
| Sugar-Sweetened Beverages | 41 | 4 | <0.0001 | Sugar-Sweetened Beverages | 28 | 2 | <0.0001 | Sugar-Sweetened Beverages | 14 | 3 | <0.0001 |
| Tea/coffee/water | −3 | 2 | 0.07 | Tea/coffee/water | −9 | 1 | <0.0001 | Tea/coffee/water | 6 | 2 | <0.0001 |
| Milk | 51 | 7 | <0.0001 | Milk | 39 | 3 | <0.0001 | Milk | 11 | 6 | 0.05 |
| Fruit juice | 31 | 7 | <0.0001 | Fruit juice | 21 | 3 | <0.0001 | Fruit juice | 10 | 6 | 0.09 |
| Alcoholic beverages | 37 | 1 | <0.0001 | Alcoholic beverages | 38 | 0 | <0.0001 | Alcoholic beverages | −1 | 1 | 0.2 |
| 8.1. Total Energy | 8.2. Beverage Energy | 8.3. Food Energy | |||||||||
|---|---|---|---|---|---|---|---|---|---|---|---|
| (Adjusted R Squared = 0.638) | p Value | (Adjusted R Squared = 0.980) | p Value | (Adjusted R Squared = 0.507) | p Value | ||||||
| Parameter | B | SE | Parameter | B | SE | Parameter | B | SE | |||
| Intercept | 1440 | 222 | 0.0001 | Intercept | −89 | 52 | 0.09 | Intercept | 1522 | 215 | 0.0001 |
| Low Calorie Beverages * | - | Low Calorie Beverages * | - | Low Calorie Beverages * | - | ||||||
| Sugar-Sweetened Beverages | 39 | 5 | 0.0001 | Sugar-Sweetened Beverages | 32 | 1 | 0.0001 | Sugar-Sweetened Beverages | 7 | 5 | 0.2 |
| Tea/coffee/water | −9 | 4 | 0.03 | Tea/coffee/water | −5 | 1 | 0.0001 | Tea/coffee/water | −3 | 4 | 0.4 |
| Milk | 54 | 7 | 0.0001 | Milk | 52 | 2 | 0.0001 | Milk | 3 | 7 | 0.7 |
| Fruit juice | 38 | 7 | 0.0001 | Fruit juice | 33 | 2 | 0.0001 | Fruit juice | 5 | 7 | 0.5 |
| Alcoholic beverages | 24 | 4 | 0.0001 | Alcoholic beverages | 35 | 1 | 0.0001 | Alcoholic beverages | −11 | 4 | 0.006 |
| ALL BEVERAGES | 16 | 4 | 0.0001 | ALL BEVERAGES | 5 | 1 | 0.0001 | ALL BEVERAGES | 11 | 4 | 0.004 |
| Friday | 67 | 23 | 0.004 | Friday | 13 | 5 | 0.02 | Friday | 54 | 23 | 0.02 |
| Saturday | 134 | 24 | 0.0001 | Saturday | 26 | 6 | 0 | Saturday | 108 | 24 | 0.0001 |
| Sunday | 39 | 25 | 0.1 | Sunday | 1 | 6 | 0.9 | Sunday | 37 | 24 | 0.1 |
| Monday | −18 | 25 | 0.5 | Monday | −3 | 6 | 0.6 | Monday | −14 | 24 | 0.5 |
| Tuesday | −3 | 24 | 0.9 | Tuesday | 1 | 6 | 0.9 | Tuesday | −4 | 23 | 0.9 |
| Wednesday (ref) | 0 | Wednesday (ref) | 0 | Wednesday (ref) | 0 | ||||||
| Thursday | 19 | 23 | 0.4 | Thursday | −2 | 5 | 0.8 | Thursday | 20 | 23 | 0.4 |
| Day1 | −10 | 16 | 0.5 | Day1 | −3 | 4 | 0.5 | Day1 | −8 | 16 | 0.6 |
| Day2 | 5 | 16 | 0.8 | Day2 | 0 | 4 | 1.00 | Day2 | 5 | 15 | 0.8 |
| Day3 | 16 | 16 | 0.3 | Day3 | 2 | 4 | 0.7 | Day3 | 15 | 15 | 0.3 |
| Day4 (ref) | 0 | Day4 (ref) | 0 | Day4 (ref) | 0 | ||||||
4. Discussion
Strengths and Limitations of the Present Study
5. Conclusions
Acknowledgments
Author Contributions
Conflicts of Interest
References
- Bates, B.; Lennox, A.; Prentice, A.; Bates, C.; Page, P.; Nicholson, S.; Swan, G. National Diet and Nutrition Survey: Results from Years 1 to 4 (Combined) of the Rolling Programme for 2008 and 2009 to 2011 and 2012. Available online: https://www.gov.uk/government/statistics/national-diet-and-nutrition-survey-results-from-years-1-to-4-combined-of-the-rolling-programme-for-2008-and-2009-to-2011-and-2012 (accessed on 16 December 2015).
- UNESDA Soft Drinks Europe. Consumption. Available online: http://www.unesda.eu/products-ingredients/consumption/ (accessed on 16 December 2015).
- Gibson, S.; Gunn, P.; Maughan, R.J. Hydration, water intake and beverage consumption habits among adults. Nutr. Bull. 2012, 37, 182–192. [Google Scholar] [CrossRef]
- Piernas, C.; Ng, S.W.; Popkin, B. Trends in purchases and intake of foods and beverages containing caloric and low-calorie sweeteners over the last decade in the united states. Pediatr. Obes. 2013, 8, 294–306. [Google Scholar] [CrossRef] [PubMed]
- Ventura, A.K.; Mennella, J.A. Innate and learned preferences for sweet taste during childhood. Curr. Opin. Clin. Nutr. Metab. Care 2011, 14, 379–384. [Google Scholar] [CrossRef] [PubMed]
- Bellisle, F.; Drewnowski, A. Intense sweeteners, energy intake and the control of body weight. Eur. J. Clin. Nutr. 2007, 61, 691–700. [Google Scholar] [CrossRef] [PubMed]
- Allison, D.B. Liquid calories, energy compensation and weight: What we know and what we still need to learn. Br. J. Nutr. 2014, 111, 384–386. [Google Scholar] [CrossRef] [PubMed]
- De la Hunty, A.; Gibson, S.; Ashwell, M. A review of the effectiveness of aspartame in helping with weight control. Nutr. Bull. 2006, 31, 115–128. [Google Scholar] [CrossRef]
- Mattes, R.D.; Popkin, B.M. Nonnutritive sweetener consumption in humans: Effects on appetite and food intake and their putative mechanisms. Am. J. Clin. Nutr. 2009, 89, 1–14. [Google Scholar] [CrossRef] [PubMed]
- Tate, D.F.; Turner-McGrievy, G.; Lyons, E.; Stevens, J.; Erickson, K.; Polzien, K.; Diamond, M.; Wang, X.; Popkin, B. Replacing caloric beverages with water or diet beverages for weight loss in adults: Main results of the choose healthy options consciously everyday (choice) randomized clinical trial. Am. J. Clin. Nutr. 2012, 95, 555–563. [Google Scholar] [CrossRef] [PubMed]
- Malik, V.S.; Pan, A.; Willett, W.C.; Hu, F.B. Sugar-sweetened beverages and weight gain in children and adults: A systematic review and meta-analysis. Am. J. Clin. Nutr. 2013, 98, 1084–1102. [Google Scholar] [CrossRef] [PubMed]
- Ebbeling, C.B. Sugar-sweetened beverages and body weight. Curr. Opin. Lipidol. 2014, 25, 1–7. [Google Scholar] [CrossRef] [PubMed]
- Miller, P.; Perez, V. Low-calorie sweeteners and body weight and composition: A meta-analysis of randomized controlled trials and prospective cohorts. Am. J. Clin. Nutr. 2014, 100, 765–777. [Google Scholar] [CrossRef] [PubMed]
- Kaiser, K.A.; Shikany, J.M.; Keating, K.D.; Allison, D.B. Will reducing sugar-sweetened beverage consumption reduce obesity? Evidence supporting conjecture is strong, but evidence when testing effect is weak. Obes. Rev. Off. J. Int. Assoc. Study Obes. 2013, 14, 620–633. [Google Scholar] [CrossRef] [PubMed]
- Ebbeling, C.B.; Feldman, H.A.; Chomitz, V.R.; Antonelli, T.A.; Gortmaker, S.L.; Osganian, S.K.; Ludwig, D.S. A randomized trial of sugar-sweetened beverages and adolescent body weight. New Engl. J. Med. 2012, 367, 1407–1416. [Google Scholar] [CrossRef] [PubMed]
- de Ruyter, J.C.; Katan, M.B.; Kuijper, L.D.; Liem, D.G.; Olthof, M.R. The effect of sugar-free versus sugar-sweetened beverages on satiety, liking and wanting: An 18 month randomized double-blind trial in children. PLoS ONE 2013, 8, e78039. [Google Scholar] [CrossRef] [PubMed]
- Peters, J.C.; Wyatt, H.R.; Foster, G.D.; Pan, Z.; Wojtanowski, A.C.; Vander Veur, S.S.; Herring, S.J.; Brill, C.; Hill, J.O. The effects of water and non-nutritive sweetened beverages on weight loss during a 12-week weight loss treatment program. Obesity 2014, 22, 1415–1421. [Google Scholar] [CrossRef] [PubMed]
- Rogers, P.J.; Hogenkamp, P.S.; de Graaf, K.; Higgs, S.; Lluch, A.; Ness, A.R.; Penfold, C.; Perry, R.; Putz, P.; Yeomans, M.R.; et al. Does low-energy sweetener consumption affect energy intake and body weight? A systematic review, including meta-analyses, of the evidence from human and animal studies. Int. J. Obes. 2015. [Google Scholar] [CrossRef] [PubMed]
- Scientific Advisory Committee on Nutrition (SACN). Carbohydrates and Health. Available online: https://www.gov.uk/government/uploads/system/uploads/attachment_data/file/445503/SACN_Carbohydrates_and_Health.pdf (accessed on 16 December 2015).
- USDA. Scientific Report of the 2015 Dietary Guidelines Advisory Committee. Available online: http://health.Gov/dietaryguidelines/2015-scientific-report/ (accessed on 16 December 2015).
- Gardner, C.; Wylie-Rosett, J.; Gidding, S.S.; Steffen, L.M.; Johnson, R.K.; Reader, D.; Lichtenstein, A.H. Nonnutritive sweeteners: Current use and health perspectives: A scientific statement from the american heart association and the american diabetes association. Diabetes Care 2012, 35, 1798–1808. [Google Scholar] [CrossRef] [PubMed]
- Anderson, G.H.; Foreyt, J.; Sigman-Grant, M.; Allison, D.B. The use of low-calorie sweeteners by adults: Impact on weight management. J. Nutr. 2012, 142, 1163S–1169S. [Google Scholar] [CrossRef] [PubMed]
- Drewnowski, A.; Rehm, C.D. Consumption of low-calorie sweeteners among U.S. adults is associated with higher healthy eating index (HEI 2005) scores and more physical activity. Nutrients 2014, 6, 4389–4403. [Google Scholar] [CrossRef] [PubMed]
- NatCen Social Research, MRC Human Nutrition Research and University College London Medical School. National Diet and Nutrition Survey Years 1–4, 2008/09–2011/12. Available online: http://dx.Doi.Org/10.5255/ukda-sn-6533-3 (accessed on 16 December 2015).
- Fitt, E.; Cole, D.; Ziauddeen, N.; Pell, D.; Stickley, E.; Harvey, A.; Stephen, A.M. Dino (diet in nutrients out) —An integrated dietary assessment system. Public Health Nutr. 2015, 18, 234–241. [Google Scholar] [CrossRef] [PubMed]
- Bleich, S.N.; Wolfson, J.A.; Vine, S.; Wang, Y.C. Diet-beverage consumption and caloric intake among us adults, overall and by body weight. Am. J. Public Health 2014, 104, e72–e78. [Google Scholar] [CrossRef] [PubMed]
- Piernas, C.; Ng, S.W.; Mendez, M.A.; Gordon-Larsen, P.; Popkin, B.M. A dynamic panel model of the associations of sweetened beverage purchases with dietary quality and food-purchasing patterns. Am. J. Epidemiol. 2015, 181, 661–671. [Google Scholar] [CrossRef] [PubMed]
- Sadler, M.J.; McNulty, H.; Gibson, S. Sugar-fat seesaw: A systematic review of the evidence. Crit. Rev. Food Sci. Nutr. 2015, 55, 338–356. [Google Scholar] [CrossRef] [PubMed]
- Drewnowski, A. Dietary habits and use of low-calorie sweetners: An effective tool in the prevention of obesity and diabetes. Ann. Nutr. Metab. 2013, 63, 147–148. [Google Scholar]
- Piernas, C.; Mendez, M.A.; Ng, S.W.; Gordon-Larsen, P.; Popkin, B.M. Low-calorie- and calorie-sweetened beverages: Diet quality, food intake, and purchase patterns of us household consumers. Am. J. Clin. Nutr. 2014, 99, 567–577. [Google Scholar] [CrossRef] [PubMed]
- Piernas, C.; Tate, D.F.; Wang, X.; Popkin, B.M. Does diet-beverage intake affect dietary consumption patterns? Results from the choose healthy options consciously everyday (choice) randomized clinical trial. Am. J. Clin. Nutr. 2013, 97, 604–611. [Google Scholar] [CrossRef] [PubMed]
- Wang, Y.C.; Ludwig, D.S.; Sonneville, K.; Gortmaker, S.L. Impact of change in sweetened caloric beverage consumption on energy intake among children and adolescents. Arch. Pediatr. Adolesc. Med. 2009, 163, 336–343. [Google Scholar] [CrossRef] [PubMed]
- Stookey, J.D.; Constant, F.; Gardner, C.D.; Popkin, B.M. Replacing sweetened caloric beverages with drinking water is associated with lower energy intake. Obesity 2007, 15, 3013–3022. [Google Scholar] [CrossRef] [PubMed]
- An, R. Beverage consumption in relation to discretionary food intake and diet quality among us adults, 2003 to 2012. J. Acad. Nutr. Dietetics 2015. [Google Scholar] [CrossRef] [PubMed]
- Stubbs, R.J.; O'Reilly, L.M.; Whybrow, S.; Fuller, Z.; Johnstone, A.M.; Livingstone, M.B.; Ritz, P.; Horgan, G.W. Measuring the difference between actual and reported food intakes in the context of energy balance under laboratory conditions. Br. J. Nutr. 2014, 111, 2032–2043. [Google Scholar] [CrossRef] [PubMed]
- Black, A.E. Critical evaluation of energy intake using the goldberg cut-off for energy intake: Basal metabolic rate. A practical guide to its calculation, use and limitations. Int. J. Obes. Relat. Metab. Disord. J. Int. Assoc. Study Obes. 2000, 24, 1119–1130. [Google Scholar] [CrossRef]
- Hirvonen, T.; Mannisto, S.; Roos, E.; Pietinen, P. Increasing prevalence of underreporting does not necessarily distort dietary surveys. Eur. J. Clin. Nutr. 1997, 51, 297–301. [Google Scholar] [CrossRef] [PubMed]
- Voss, S.; Kroke, A.; Klipstein-Grobusch, K.; Boeing, H. Is macronutrient composition of dietary intake data affected by underreporting? Results from the epic-potsdam study. European prospective investigation into cancer and nutrition. Eur. J. Clin. Nutr. 1998, 52, 119–126. [Google Scholar] [CrossRef] [PubMed]
- Black, A.E.; Cole, T.J. Biased over- or under-reporting is characteristic of individuals whether over time or by different assessment methods. J. Am. Dietet. Assoc. 2001, 101, 70–80. [Google Scholar] [CrossRef]
© 2016 by the authors; licensee MDPI, Basel, Switzerland. This article is an open access article distributed under the terms and conditions of the Creative Commons by Attribution (CC-BY) license (http://creativecommons.org/licenses/by/4.0/).
Share and Cite
Gibson, S.A.; Horgan, G.W.; Francis, L.E.; Gibson, A.A.; Stephen, A.M. Low Calorie Beverage Consumption Is Associated with Energy and Nutrient Intakes and Diet Quality in British Adults. Nutrients 2016, 8, 9. https://doi.org/10.3390/nu8010009
Gibson SA, Horgan GW, Francis LE, Gibson AA, Stephen AM. Low Calorie Beverage Consumption Is Associated with Energy and Nutrient Intakes and Diet Quality in British Adults. Nutrients. 2016; 8(1):9. https://doi.org/10.3390/nu8010009
Chicago/Turabian StyleGibson, Sigrid A., Graham W. Horgan, Lucy E. Francis, Amelia A. Gibson, and Alison M. Stephen. 2016. "Low Calorie Beverage Consumption Is Associated with Energy and Nutrient Intakes and Diet Quality in British Adults" Nutrients 8, no. 1: 9. https://doi.org/10.3390/nu8010009
APA StyleGibson, S. A., Horgan, G. W., Francis, L. E., Gibson, A. A., & Stephen, A. M. (2016). Low Calorie Beverage Consumption Is Associated with Energy and Nutrient Intakes and Diet Quality in British Adults. Nutrients, 8(1), 9. https://doi.org/10.3390/nu8010009