


Abstract
In 2019, “Nutrition Therapy for Adults with Diabetes or Prediabetes: A Consensus Report” was published. This consensus report, however, did not provide an easy way to illustrate to subjects with prediabetes (SwPs) how to follow a correct dietary approach. The purpose of this review is to evaluate current evidence on optimum dietary treatment of SwPs and to provide a food pyramid for this population. The pyramid built shows that everyday consumption should consist of: whole-grain bread or potatoes eaten with their skins (for fiber and magnesium) and low glycemic index carbohydrates (GI < 55%) (three portions); fruit and vegetables (5 portions), in particular, green leafy vegetables (for fiber, magnesium, and polyphenols); EVO oil (almost 8 g); nuts (30 g, in particular, pistachios and almonds); three portions of dairy products (milk/yogurt: 300–400 g/day); mineral water (almost 1, 5 L/day for calcium intake); one glass of wine (125 mL); and three cups of coffee. Weekly portions should include fish (four portions), white meat (two portions), protein plant-based food (four portions), eggs (egg portions), and red/processed meats (once/week). At the top of the pyramid, there are two pennants: a green one means that SwPs need some personalized supplementation (if daily requirements cannot be satisfied through diet, vitamin D, omega-3, and vitamin B supplements), and a red one means there are some foods and factors that are banned (simple sugar, refined carbohydrates, and a sedentary lifestyle). Three to four times a week of aerobic and resistance exercises must be performed for 30–40 min. Finally, self-monitoring innovative salivary glucose devices could contribute to the reversion of prediabetes to normoglycemia.
1. Introduction
In light of the increase in the incidence and prevalence of Type 2 diabetes mellitus (T2DM) worldwide, numerous studies have focused on the early identification of individuals at risk of developing this disease, so as to be able to implement interventional strategies to delay the onset. This has led to the recognition of the term “prediabetes”, a dysglycemic state straddling normal glucose tolerance and the frank diagnosis of T2DM [1]. “Prediabetes”, in fact, is a term used to indicate a condition in which blood glucose levels are suggestive of abnormal glucose metabolism, but are not yet able to meet the diagnostic criteria of full-blown diabetic disease [2]. The definitions of prediabetes most frequently used are those of the American Diabetes Association (ADA) and the International Committee of Experts and the World Health Organization (WHO). Both definitions are based on measurements of fasting glucose concentrations, two hours after the oral glucose challenge, and/or glycated hemoglobin (HbA1c) values. The latter has only recently been included in the definition. However, there has been discussion of how useful this is in clinical practice [3,4] since HbA1c does not always seem to be able to identify all subjects with prediabetes and the only way to identify the alteration of glucose metabolism is through the dosage of fasting blood glucose and through the oral glucose challenge test [5].
A systematic review that considered 16 cohort studies for a total of 44,203 subjects observed over 5–6 years concluded that, as HbA1c increased, the risk of developing T2DM significantly and progressively increased: the risk increases from 9 to 25% in 5 years with a hemoglobin glycosy between 5.5% and 6.0% (37–42 mmol/mol), and 25 to 50% with a hemoglobin glycosy between 6.0% and 6.5% (42–48 mmol/mol), with a relative risk 20 times greater than those who had a HbA1c level of 5% [6].
Additional studies suggest that a HbA1c of 5.7% (39 mmol/mol) or greater is associated with a risk of T2DM similar to individuals who participated in the Diabetes Prevention Program (DPP) and were defined as high-risk, and their baseline HbA1c was a strong predictor for the development of T2DM during DPP and its follow-up [7,8].
Therefore, it is reasonable to consider that an HbA1c between 5.7 and 6.4% (39–47 mmol/mol) could identify individuals with prediabetes.
Muscle IR, considered a trigger of T2DM, may have been present for decades before the beta-cell function is impaired [9]. Furthermore, it has been reported that there is a significant increase in beta-cell function 3 to 4 years before the diagnosis of T2DM, followed by a large decrease thereafter [10]. The continuous increase in IR accompanied by a reduction in beta cell functionality leads to abnormal blood sugar levels, such that prediabetes can evolve into full-blown T2DM.
Given these premises, prediabetes should not be seen as a clinical entity in and of itself, but more as a condition of increased risk for both T2DM and cardiovascular disease. In fact, prediabetes is also associated with obesity (particularly visceral obesity), dyslipidemia (with high triglycerides and low HDL cholesterol), and hypertension. Therefore, the presence of this condition should serve as input to initiate a comprehensive screening of all cardiovascular risk factors [2].
The prevalence of prediabetes obviously depends on the age group of the population studied, with the elderly having a higher prevalence, as well as on the definition used, with a higher prevalence when using the ADA criteria as a result of the difference in cut-off values used against WHO criteria [11].
According to recent studies, the rate of progression from prediabetes to T2DM is about 25% in 3–5 years and it is estimated that 70% of individuals with prediabetes will develop T2DM in their lifetime [10,12,13,14,15,16,17].
If left untreated, 37% of people with prediabetes could develop T2DM in 4 years [18]. However, where appropriate lifestyle changes are made, long-term studies have shown that the risk of progression can be reduced by delaying the onset of T2DM to 10 years, avoiding long-term complications related to T2DM [18].
In this sense, lifestyle interventions appear to be very promising [18].
Given this background, even if in 2019, the “Nutrition Therapy for Adults with Diabetes or Prediabetes: A Consensus Report” was published, [19]. This consensus report does not provide an easy way to illustrate to subjects with prediabetes (SwPs) how to follow the correct dietary approach. The purpose of this review is to evaluate current evidence on optimum dietary treatment of SwPs and to provide a food pyramid for this population.
2. Materials and Methods
This narrative review was performed following these steps [20,21,22]:
(1) Configuration of a working group: three operators skilled in clinical nutrition (one acting as a methodological operator and two participating as clinical operators); (2) formulation of the revision question on the basis of considerations made in the abstract: “the state of the art on ideal dietary therapy in order to obtain the reversion of prediabetes to normoglycemia”; (3) identification of relevant studies: a research strategy was planned on PubMed (Public MEDLINE run by the National Center of Biotechnology Information (NCBI) of the National Library of Medicine of Bethesda (Bethesda, MD, USA)) as follows: (a) definition of the keywords (prediabetes, IFG, IGT, foods, nutrients, and dietary supplements), allowing the definition of the interest field of the documents to be searched, grouped in inverted commas (“. . .”), and used separately or in combination; (b) use of the Boolean (a data type with only two possible values: true or false) AND operator, which allows the establishment of logical relations among concepts; (c) research modalities: advanced search; (d) limits: time limits: papers published in the last 30 years; humans; languages: English; (e) manual search performed by senior researchers experienced in clinical nutrition through the revision of reviews and individual articles on ideal dietary therapy in order to the state of the art on ideal dietary therapy in order to obtain the reversion of prediabetes to normoglycemia published in journals qualified in the Index Medicus; (4) analysis and presentation of the outcomes: the data extrapolated from the “revised studies” were collocated in tables; in particular, for each study specified, the author and year of publication and the study characteristics; for each topic, we built three types of tables depending on the type of study: table with reviews and meta-analyses, table with observational human studies, and table with interventional human studies; in the tables (obviously except for reviews and meta-analyses), only studies on humans are reported, while, in the text, in vitro studies and studies on animal models are also cited, if useful to explain some mechanisms of action. Moreover, in tables, for all studies, the level of evidence has been added [23,24]; (5) The analysis was carried out in the form of a narrative review of the reports. At the beginning of each section, the keywords considered and the kind of studies chosen have been reported. We evaluated, as suitable for the narrative review, the studies of any design that considered the relevance of diet, foods, nutrients, and dietary supplements in order to obtain the reversion of prediabetes to normoglycemia. Figure 1 shows the eligible studies and Figure 2 represents proper nutrition and lifestyle to prevent or support the treatment of prediabetes, specifying the quality and amount of food needed to provide ideal dietary management and to construct a food pyramid.
Figure 1.
Flow chart of the eligible studies.
Figure 2.
Ideal food pyramid for prediabetes.
3. Results
3.1. Carbohydrate-Containing Food
This research was conducted based on the keywords: “prediabetes” OR “diet” OR “diet and prediabetes” OR “carbohydrate” OR “Mediterranean diet” OR “ketogenic diet”. Nine studies have been referenced, including: one consensus statement, one consensus report, one cohort study, one prospective study, one randomized dose response trial, one randomized controlled trial, one randomized pilot trial, one randomized crossover trial, and one prospective observational study.
Table 1 shows the studies that evaluated the relationship between carbohydrate-containing foods and prediabetes with their strength of evidence.
3.2. Protein Foods
3.2.1. Milk and Dairy Products
This research was conducted based on the keywords: “milk consumption” OR “dairy consumption” OR “cheese” OR “yogurt” AND “risk of type 2 diabetes” OR “prediabetes” OR “glycemic control” OR “risk for developing diabetes”. The following studies were included: two randomized controlled trial, one systematic review, three prospective cohort studies, two cross-sectional studies, one retrospective cohort study, two narrative review, and one experimental study. Table 2A,B shows the studies that evaluated the relationship between milk/dairy products and prediabetes with their strength of evidence.
3.2.2. Eggs
This research was conducted based on the keywords: “eggs consumption” OR “eggs” AND “risk of type 2 diabetes” OR “prediabetes” OR “glycemic control” OR “risk for developing diabetes”. The following studies were included: one randomized controlled trial, one systematic review, one meta-analysis, and one report from USDA.
Table 2C,D shows the studies that evaluated the relationship between eggs and prediabetes with their strength of evidence.
3.2.3. Meat
This research was conducted based on the keywords: “red meat” OR “read meat consumption” OR “meat” AND “prediabetes” OR “risk of type 2 diabetes” OR “glycemic control” OR “risk for developing diabetes”. The following studies were included: one cross-sectional study, two meta-analyses combined with three prospective cohort studies, one prospective study, and one systematic review.
Table 2E,F shows the studies that evaluated the relationship between meat and prediabetes with their strength of evidence.
3.2.4. Plant Based Protein
This research was conducted based on the keywords: “legumes” OR “soy proteins” OR “soy”, “peanuts” OR “vegetal protein” OR “plant-based proteins” AND “diabetes” OR “prediabetes” OR “impaired fasting plasma glucose” OR “glycemia”. The following studies were included: four meta-analyses, two prospective cohort studies, one systematic review, two randomized controlled trials, one report from the WHO, three narrative reviews, one case–control study, four in vitro studies, and one in vivo animal study.
Table 2G,H shows the studies that evaluated the relationship between plant based protein and prediabetes with their strength of evidence.
3.3. Sarcopenia
This research was conducted based on the keywords: “Sarcopenia” OR “muscle loss” AND “prediabetes” OR “diabetes” OR “impaired fasting glucose”. The following studies were included: one cross-sectional study, one meta-analysis, and two retrospective studies.
Table 3A,B shows the studies that evaluated the relationship between sarcopenia and prediabetes with their strength of evidence.
3.4. Lipid-Containing Food
This research was conducted based on the keywords: “Lipids AND prediabetes” OR “Lipids AND diabetes” OR “Fatty Acids AND prediabetes “OR “Diabetes prevention AND lipids” OR “Diabetes prevention AND fatty acids” OR “olive oil AND prediabetes” OR “fish AND prediabetes”. In total, 17 articles were consulted, including 4 narrative reviews, 1 systematic review, 2 meta-analyses, and 11 clinical trials (7 randomized controlled trials, 3 cohort studies, and 1 case–control studies).
Table 4A,B shows the studies that evaluated the relationship between lipid-containing food and prediabetes with their strength of evidence.
3.5. Vitamins
This research was conducted based on the keywords: “vitamins intake” OR “vitamins supplementation” OR “micronutrient intake” AND “prediabetes” OR “type 2 diabetes” OR “hyperglycemia” OR “diabetes risk”. In total, 12 articles were consulted, including 3 cross-sectional studies, 1 randomized controlled trial, 3 prospective studies, 1 case–control study, 1 systematic review, and 3 meta-analyses.
Table 5A,B shows the studies that evaluated the relationship between Vitamins and prediabetes with their strength of evidence.
3.6. Minerals
This research was conducted based on the keywords: “minerals intake” OR “minerals supplementation” OR “micronutrient intake” AND “prediabetes” OR “type 2 diabetes” OR “hyperglycemia” OR “diabetes risk”. In total, 13 articles were consulted, including 3 cross-sectional studies, 2 randomized controlled trials, 3 prospective studies, 1 retrospective study, 3 meta-analyses, and 1 narrative review.
Table 6A,B shows the studies that evaluated the relationship between minerals and prediabetes with their strength of evidence.
3.7. Osteoporosis
This research was conducted based on the keywords: “osteoporosis” OR “osteopenia” OR “fracture risk” OR “bone mineral density” AND “prediabetes” OR “type 2 diabetes” OR “hyperglycemia” OR “diabetes risk”. Three articles were consulted: one systematic review, one narrative review, and one cross-sectional multistage study.
Table 7 shows the studies that evaluated the relationship between osteoporosis and prediabetes with their strength of evidence.
3.8. Fruits and Vegetables
This research was conducted based on the keywords: “Fruit” OR “vegetables” OR “fiber” AND “prediabetes” OR “type 2 diabetes” OR “hyperglycemia” OR “diabetes risk”. In total, 10 articles were consulted: 1 systematic review, 2 narrative reviews, 1 cross-sectional study, 4 prospective studies, 1 in vivo animal study, and 1 meta-analysis.
Table 8A,B shows the studies that evaluated the relationship between fruits and vegetables and prediabetes with their strength of evidence.
3.9. Nuts
This research was conducted based on the keywords: “nuts” OR “almons” OR “nuts consumption” AND “prediabetes” OR “type 2 diabetes” OR “hyperglycemia” OR “diabetes risk”. Eight articles were consulted: two narrative reviews, one cross-sectional study, and five randomized controlled trials.
Table 9 shows the studies that evaluated the relationship between nuts and prediabetes with their strength of evidence.
3.10. Hydratation
3.10.1. Plain Water
This research was conducted based on the keywords: “still water” OR “water intake” OR “hydration” AND “prediabetes” OR “diabetes risk” “type 2 diabetes”. Two articles were consulted: two cross-sectional studies.
Table 10A shows the studies that evaluated the relationship between plain water and prediabetes with their strength of evidence.
3.10.2. Sugary Beverages
This research was conducted based on the keywords: “SSB intake” OR “sugary beverage” OR “Sugar sweetened beverage” AND non-sugar sweeteners (NSS), AND “prediabetes” OR “diabetes risk” “type 2 diabetes”. Nine articles were consulted: two randomized controlled trials, one cross-sectional study, one meta-analysis, one systematic review with a meta-analysis of RCT studies, one systematic review, one guideline from the WHO, one standard of care in diabetes, and one narrative review.
Table 10B,C shows the studies that evaluated the relationship between sugary beverages and prediabetes with their strength of evidence.
3.11. Alcohol
This research was conducted based on the keywords: “alcohol” OR “ethanol” OR “polyphenol” OR “resveratrol” OR “metabolic syndrome” AND “prediabetes” OR “type 2 diabetes” OR “hyperglycemia” OR “diabetes risk”. Nine studies have been referenced, including: one randomized controlled trial, one systematic review, three narrative reviews, two prospective cohort studies, and two cross-sectional studies.
Table 11A,B shows the studies that evaluated the relationship between alcohol and prediabetes with their strength of evidence.
3.12. Coffee
This research was conducted based on the keywords: “coffee” OR “chlorogenic acid” OR “caffeine” AND “prediabetes” OR “type 2 diabetes” OR “hyperglycemia” OR “diabetes risk”. Seven studies have been referenced, including: two meta-analyses, one randomized controlled trial, one narrative review, one prospective cohort study, one in vitro study, and one cross-sectional study.
Table 12A,B shows the studies that evaluated the relationship between coffee and prediabetes with their strength of evidence.
3.13. Physical Activity
This research was conducted based on the keywords: “prediabetes” OR “treating prediabetes” OR “prevention of diabetes” AND “physical activity” OR “exercise” OR “high-intensity interval training”. Five studies have been referenced, including: two meta-analyses, one meta-analysis of randomized controlled trials, one consensus report, one randomized controlled trial, and one systematic review.
Table 13A,B shows the studies that evaluated the relationship between physical activity and prediabetes with their strength of evidence.
3.14. Dietary Supplementation with Probiotics
This research was conducted based on the keywords: “gut microbiota” OR “pre-biotics” OR “probiotics” OR “synbiotics” AND “Prediabetes” OR “Blood glucose” OR “Diabetes mellitus” OR “Metabolic syndrome”. In total, 29 were sourced: 5 narrative reviews, 5 systematic reviews, 3 systematic reviews and meta-analyses, 7 clinical trials (4 cohort studies and 3 case–control studies), 2 in vitro studies, and 7 studies on animal models.
Table 14A,B shows the studies that evaluated the relationship between microbiota and prediabetes with their strength of evidence.
3.15. Monitoring Glucose Levels
This research was conducted based on the keywords: “glucose levels” OR “saliva collection method” OR “saliva” OR “salivary amylase” OR “serum glucose” OR “blood glucose” AND “prediabetes” OR “type 2 diabetes” OR “hyperglycemia” OR “diabetes risk” OR “diabetes diagnosis”. In total, 41 articles were consulted: 15 narrative reviews, 11 cross-sectional studies, 7 randomized controlled trials, 2 systematic reviews, 1 prospective study, 2 retrospective studies, 1 case–control study, 1 position statement, and 1 experimental study.
Table 15A,B shows the studies that evaluated the relationship between monitoring glucose levels and prediabetes with their strength of evidence.
Table 1.
(A) Carbohydrate-containing foods and prediabetes interventional studies; and (B) carbohydrate-containing foods and prediabetes observational studies.
Table 2.
(A) Milk and dairy products and prediabetes interventional studies; (B) milk and dairy products and prediabetes observational and experimental studies; (C) milk and dairy products and prediabetes review and meta-analysis; (D) eggs and prediabetes interventional studies; (E) eggs and prediabetes review and meta-analysis; (F) meat and prediabetes observational studies; (G) meat and prediabetes review and meta-analysis; (H) plant-based protein foods and prediabetes interventional studies; (I) plant-based protein foods and prediabetes observational studies; and (J) plant-based protein foods and prediabetes reviews and meta-analyses.
Table 3.
(A) Sarcopenia and prediabetes observational studies; and (B) sarcopenia and prediabetes review and meta-analysis.
Table 4.
(A) Lipid-containing foods and prediabetes interventional studies; (B) lipid-containing foods and prediabetes observational studies; and (C) lipid-containing foods and prediabetes review and meta-analysis.
Table 5.
(A) Vitamins and prediabetes interventional studies; (B) vitamins and prediabetes observational studies; and (C) vitamins and prediabetes review and meta-analysis.
Table 6.
(A) Minerals and prediabetes interventional studies; (B) minerals and prediabetes observational studies; and (C) minerals and prediabetes reviews and meta-analysis.
Table 7.
Osteoporosis and prediabetes studies.
Table 8.
(A) Fruits and vegetables and prediabetes observational studies; and (B) fruits and vegetables and prediabetes review and meta-analysis.
Table 9.
Nuts and prediabetes interventional studies.
Table 10.
(A) Plain water and prediabetes interventional studies; (B) sugary beverages and prediabetes interventional studies; (C) sugary beverages and prediabetes observational studies; and (D) sugary beverages and prediabetes reviews, meta-analyses, and guidelines.
Table 11.
(A) Alcohol and prediabetes interventional studies; (B) alcohol and prediabetes observational studies; and (C) alcohol and prediabetes review and meta-analysis.
Table 12.
(A) Coffee and prediabetes interventional and in vitro studies; (B) coffee and prediabetes observational studies; and (C) coffee and prediabetes reviews and meta-analysis.
Table 13.
(A) Physical activity and prediabetes interventional studies; and (B) physical activity and prediabetes, review, and meta-analysis.
Table 14.
(A) Dietary supplementation with probiotics and prediabetes observational studies; and (B) dietary supplementation with probiotics and prediabetes reviews and meta-analyses.
Table 15.
(A) Monitoring glucose levels and prediabetes interventional studies; (B) monitoring glucose levels and prediabetes observational studies; and (C) monitoring glucose levels and prediabetes reviews and meta-analyses.
4. Discussion
4.1. Carbohydrate-Containing Foods
Carbohydrates are an easily used source of energy and represent the main dietary factor influencing blood sugar, especially postprandial. Carbohydrate-containing foods, with varying proportions of sugars, starches, and fibers, have a wide range of effects on the glycemic response. Some cause a sustained rise and slow fall in blood glucose concentrations, while others cause a rapid rise followed by a rapid fall. A recent consensus report identified carbohydrate foods that are rich in dietary fiber, vitamins, and minerals, and low in added sugar, fat, and sodium as ideal [19].
Whole-grain carbohydrates with a low glycemic index are, therefore, the ideal foods to recommend for people with prediabetes. Moreover, these foods are the carbohydrates present in the Mediterranean diet which, as reported in numerous studies, represents a dietary pattern that can be considered a reference for the treatment of prediabetes. Indeed, the Mediterranean diet, in a prospective cohort study in the Spanish primary care setting that examined a total of 1184 participants with prediabetes for an average of 4.2 years, demonstrated that a high adherence to a Mediterranean diet compared to a low/medium adherence would reduce the incidence of T2DM [28].
A previous prospective study conducted in Greece showed similar results [29].
Considering potatoes among carbohydrates, potatoes eaten in their skins can represent a valid food to be included in the group of carbohydrates for nutrition in subjects with prediabetes. Potatoes are a rich and bio-available source of potassium, dietary fiber, and other key nutrients, such as magnesium, that may benefit cardiometabolic health [174].
Considering meal frequency, there are no specific studies in subjects with prediabetes, but the consensus statement by the American Association of Clinical Endocrinologists and American College of Endocrinology on the Comprehensive Type 2 Diabetes Management Algorithm—2020 Executive Summary reports the importance of consuming five meals a day (breakfast, lunch, and dinner with two snacks) in order to avoid hypo- and hyperglycemia [175].
In conclusion, three portions per day of whole-meal carbohydrates with a low glycemic index or potatoes with their skins, therefore, represent the ideal foods to recommend for subjects with prediabetes.
Low-Carbohydrate Diets for the Treatment of Obese Patients with Prediabetes
The consensus report “Therapy for Adults with Diabetes or Prediabetes”, published in 2019, highlighted that individuals with prediabetes should be referred for an intensive behavioral lifestyle intervention program modelled on the DPP (diabetes prevention program) and/or individualized MNT (medical–nutritional therapy) typically provided by a professional, with the aim of improving eating habits, increasing moderate-intensity physical activity to at least 150 min per week, and achieving and maintaining a 7–10% initial body weight loss if necessary [19].
With regard to weight loss in subjects with obese prediabetes, the evidence of scientific research shows that, in this situation, it may be useful to consider a low-carbohydrate diet.
Results from a randomized (1:1) parallel group study suggest that adults with prediabetes or noninsulin-dependent T2DM and obesity may be able to improve glycemic control with fewer medications by following a ketogenic diet at low-carbohydrate libitum (LCK) versus a low-fat, low-calorie, moderate-carb (MCCR) diet.
There were 34 patients involved, 16 who followed the LCK and 18 who followed the MCCR; at 12 months, the participants in the LCK group lost more weight than the participants in the MCCR group. On average, at 12 months, participants in the LCK group lost 8.3% of body weight, while the MCCR group lost 3.8%. Moreover, at 12 months, participants in the LCK group reduced their HbA1c by greater levels than participants in the MCCR group; the largest reductions in HbA1c in the LCK group occurred despite a greater reduction in the use of glucose-lowering medications [25].
A further randomized and balanced study divided the participants into two groups: the first (consisting of 18 participants) followed a low-calorie, medium-carbohydrate, low-fat, carbohydrate-count (MCCR) diet consistent with the guidelines of the American Diabetes Association. The second group (consisting of 16 participants) instead followed a low-carbohydrate, high-fat normocaloric diet, the goal of which was to induce nutritional ketosis (LCK). Participants were all at least 18 years old, diagnosed with T2DM (HbA1c ≥ 6.5%) or prediabetes with an HbA1c greater than 6.0% and a body mass index (BMI) of at least 25 kg/m2; the study lasted three months.
A key finding of this study was that a low-carbohydrate diet was more effective than a standard and moderate carbohydrate diet in reducing HbA1c at three months. All individuals in the LCK group showed a decrease in HbA1c, and this was a statistically significant advantage over the percentage of people in the MCCR group whose HbA1c decreased. The proportion of people who achieved a decrease in HbA1c of at least 0.5% was more than double in the LCK (56% vs. 22%), which, again, was statistically significant [26].
Moreover, another randomized cross-over and interventional study also compared two low-carbohydrate diets, both involving the consumption of non-starchy vegetables, the avoidance of added sugars, and the use of refined grains. The main differences between the two diets concerned legumes, whole grains, and fruit; in fact, the diet called WFKD (well-formulated ketogenic diet) avoided the use of legumes, fruit, and whole grains, while the diet named Med-Plus (Mediterranean-plus diet) encouraged their use. Legumes, fruits, and whole grains are consistently recommended by national and international public health organizations based on extensive evidence of the cardiovascular benefits of fiber, antioxidants, and vitamins and minerals characteristic of these food groups.
There were 40 enrolled participants, all over 18 years old, with a diagnosis of prediabetes (HbA1c 5.7–6.4% or fasting glucose 100–125 mg/dL) or T2DM (HbA1c ≥ 6.5% or fasting glucose ≥126 mg/dL).
The two types of diet were randomly assigned, and both were followed for 12 weeks each by the enrolled patients.
The primary outcome of the study was to investigate the percent change in HbA1c after 12 weeks of each diet. Secondary and exploratory outcomes included percentage changes in body weight, fasting insulin, blood glucose, and lipids; average glucose from continuous glucose monitoring (CGM); and nutrient intake.
The primary analysis was for 33 participants with complete data. HbA1c values did not differ between diets at 12 weeks. Triglycerides decreased the most for WFKD [percentage changes, −16% vs. −5% for Med-Plus; p = 0.02] and LDL cholesterol was higher for WFKD [percentage changes, +10% versus −5% for Med-Plus; p = 0.01]. Weight decreased 8% versus 7% and HDL cholesterol increased 11% versus 7% for WFKD versus Med-Plus, respectively. However, there was a significant diet order interaction for both. Participants had lower intakes of fiber and three nutrients on WFKD compared to Med-Plus. The twelve-week follow-up data suggest that Med-Plus is more sustainable.
This study confirmed that HbA1c levels can be significantly reduced with both a ketogenic diet and a Mediterranean diet, as long as the diet is limited in added sugars and refined carbohydrates. The study’s primary question was whether people with an impaired glucose metabolism experienced greater metabolic benefits or harm when limiting whole and intact legumes, fruits, and grains. in addition to avoiding added sugars and refined grains.
Although carbohydrate reduction is often recommended as a strategy to control blood glucose in patients with prediabetes and T2DM, the metabolic benefits and risks of extreme versus moderate carbohydrate restriction are unclear. The authors found that both WFKD and Med-Plus were associated with improved blood sugar and reduced body weight due to a reduction in added sugars and refined sugars. Although WFKD was associated with better glucose control, differences in HbA1c values were modest despite the 50% lower carbohydrate intake on WFKD compared to Med-Plus (<20% vs. <40% total calories from carbohydrates, respectively). Additionally, increased LDL cholesterol, decreased fiber intake, and increased potential for nutrient deficiencies in WFKD may be concerning. Collectively, these comparative results do not support a benefit sufficient to justify avoiding legumes, fruits, and grains to achieve the metabolic state of ketosis. In a clinical setting, patients need to be supported in choosing a dietary pattern that fits their needs and preferences. There should, therefore, be less focus on promoting a particular dietary approach; clinicians should enable patients to make an informed choice to help them determine which approach is best for them. Finally, regardless of the benefits, diets must be sustainable, and this study suggests that it was difficult for participants to follow through on WFKD [27].
Finally, a very recent study that included 9793 adults with prediabetes, taken from the 1999–2014 NHANES survey, investigated the association between different types of low-carbohydrate diets (LCDs) and low-fat diets (LFDs) with mortality. The results demonstrate that subjects with prediabetes who mostly adhered to LCDs and LFDs showed a significantly lower all-cause mortality compared to subjects with less adherence to this type of diet, who, on the contrary, showed higher all-cause mortality [30].
In conclusion, with regard to weight loss in subjects with obese prediabetes, the evidence from scientific research shows that, in this situation, it may be useful to consider low-carbohydrate diets.
4.2. Protein Foods
Proteins are essential in a balanced diet and some evidence in the literature focuses on their important role in the prevention and treatment of the onset of prediabetes.
Foods rich in protein appear to be characterized by a low glycemic index (GI) and the intake of proteins induces a release of insulin in any case lower than that generated by the ingestion of carbohydrates [176,177,178].
This suggests that high-protein (HP) diets may help preserve β-cells by increasing insulin sensitivity and decreasing the insulin load per meal [179].
Furthermore, as can be seen from studies on human models by Ferrarini et al. and DeFronzo and Tripathy, the higher protein content in the diet can also contribute to maintaining or increasing lean body mass and, consequently, to favoring the uptake of glucose at the muscle level: the skeletal muscle is, in fact, essential for the clearance of glucose being substantially responsible for the postprandial uptake of about 80% of the glucose taken [9,180].
The current international dietary guidelines regarding the daily protein requirement in the diet range from 0.8 g/kg/day to 1–1.5 g/kg/day depending on the age, sex, and concomitant pathologies of the subjects under examination. However, despite advances in understanding the ideal protein requirement for many states of the disease, there is still a debate about the ideal intake for patients with IR and prediabetes [19]. There are several studies in the literature that highlight the usefulness of protein intake up to 30% of total daily calories [181,182].
4.2.1. Milk and Dairy Products
There are two different types of proteins in milk: caseins and whey proteins. The proportion between the two protein components varies in the milk of various mammalian species. Specifically, in cow’s milk, the most consumed in the world, the whey protein/casein ratio is 1:4 [41]. Caseins and whey proteins are biologically very similar and are both an excellent source of essential amino acids with a super-imposable PDCAAS (protein-digestibility-corrected amino acid score) equal to 1.0 but whey proteins are generally considered as nutritionally superior as they are characterized by a higher biological value; better NPU (net protein utilization), i.e., the proportion of amino acids converted into muscle mass compared to the amount of amino acids supplemented; higher quantity of BCCAAs; and faster absorption [33].
In general, the benefits of milk derivatives are extensively investigated in the literature, also with regard to the relationship with the risk or therapy for prediabetes.
In the recent scoping review by Yau JW et al. concerning different dietary patterns and their efficacy on prediabetes, 19 studies on the impact of protein-rich meals and nuts on prediabetes were considered: with three trials each, protein from milk and soy were the supplementation interventions; substantial improvements in glucose metabolism, especially postprandial glucose, HbA1c, and indicators of oxidative stress were observed in these subjects [42].
One of the first studies that thoroughly investigated this relationship is the 2013 study by Rideout TC et al. Twenty-three healthy subjects completed a randomized, crossover trial of 12 months. Participants consumed their habitual diets and were randomly assigned to one of two treatment groups: a high-dairy-supplement group instructed to consume four servings of dairy per day (HD); or a low-dairy-supplement group limited to no more than two servings of dairy per day (LD).
The results demonstrated that the consumption of four portions of low-fat dairy products (skimmed milk 250 mL or low-fat yogurt 100 g) per day for six months was able to improve the HOMA index (p < 0.05) and the blood insulin (p < 0.05) [31].
A recent population-based study analyzed the possible relationship between the consumption of dairy products and the incidence of prediabetes in a sample of 2262 participants with no alterations in glucose metabolism at enrolment (mean age 56 ± 7.3 years; 50% male). Having defined a portion of liquid dairy products as a quantity equal to 200 mL and a portion of cheese as a quantity equal to 20 g, after an average follow-up period of 6.4 ± 0.7 years, it emerged that the intake of fermented dairy products, high-fat cheese and full-fat cheeses are associated with a reduction in the risk of prediabetes between the upper quartile (3.9–15.4 servings/day) and lower quartile (0–1.8 servings/day) by 17%, respectively (RR 0.83, 95% CI 0.69–0.99, p-trend = 0.04), 14% (RR 0.86, 95% CI 0.73–1.02, p-trend = 0.04), and 21% (RR 0.79, 95% CI 0.66–0.94, p-trend = 0.01). No association was found with total dairy intake and with other dairy subtypes, suggesting that cheese intake may be related to a lower risk of T2DM, despite the high saturated fat and sodium content [34]. Morever, the same year included an analysis conducted on 6770 subjects (mean age 62 ± 4 years, 59% female), which showed a lower risk of prediabetes in the event of a higher intake of whole yoghurt (HRQ4 vs. Q1 0.70, 95% CI 0.54–0.91 and HRserving/day 0.67, 0.51–0.89) and whole milk (HRQ4 vs. Q1 0.81, 0.67–0.97, HRserving/day 0.88, 0.79–0.99) [35].
In 2017, a study based on the evaluation, using food-frequency questionnaires, of the total intake of dairy and milk-based products on 2809 participants (mean age ± SD: 54.0 ± 9.7 years; body mass index (in kg/m2): 27.1 ± 4.7; 54% females), with an average follow-up of 12 years, had already observed, in 1867 subjects without prediabetes at baseline, a lower risk of developing prediabetes in association with consumption (≥14 compared to <4 portions/week) of total, high-, and low-fat dairy products (39%, 32%, and 25% reduction, respectively; servings in grams equal to 245 g for skimmed and whole milk; 15 g for cream and 12 g for sour cream; 96 g for sorbets and iced milk; 66 g for ice cream; 227 g for yogurt; 105 g for cottage cheese and ricotta; 28 g for cream cheese and other cheeses; 5 g for butter). Intake of whole, low-fat, and skimmed milk, as well as whole milk and yogurt, also showed a nonlinear association with the incidence of prediabetes [36].
A longitudinal population study published in 2023, conducted on 4891 healthy Australian subjects, with normal glucose tolerance (age 49.0 ± 12.3 years, 57% females), investigated the intake of dairy products at baseline using the food-frequency questionnaire and the possible occurrence of prediabetes at 5 and 12 years of follow-up. Higher intakes of dairy products and full-fat milk, and whole cheeses were associated with a lower risk of prediabetes [37].
A 2018 study had analyzed in great detail the relationship between the consumption of individual subgroups of dairy products and the risk of developing prediabetes (defined on the basis of fasting blood glucose or Hb1Ac values). Overall, semi-quantitative food-frequency questionnaires and blood samples from 112,086 healthy adult participants were analyzed; an inverse association of skimmed and fermented dairy products and buttermilk with prediabetes had emerged [38].
More generally, however, the cross-sectional population study by Pestoni et al. of 2021, conducted on 1305 participants, showed that a dietary pattern characterized by a high consumption of vegetables, fruit, whole grains, and dairy products (called the Prudent pattern) was associated with a significantly lower probability of developing prediabetes (diagnosed by the oral glucose tolerance test, OGTT) compared to the Western pattern, characterized by the consumption of high quantities of red and processed meat, alcoholic and sugary drinks, and refined cereals [39].
The scientific literature also reports studies concerning the relationship between milk protein supplements, in particular, whey protein, and glycemic control.
Akhavan et al. [32] investigated how premeal supplements of different doses of whey proteins (5, 10, 20, or 40 g) affected insulin release and postprandial glucose: the supplementation of 20–40 g of whey proved able to reduce the subsequent food intake (p < 0.0001) and those 10, 20, and 40 g were able to reduce postprandial glycemia and AUC (p < 0.05); there is no evidence for supplements of just 5 g of whey protein.
Finally, a recent review in 2019 [40] analyzed the possible advantages of milk proteins in improving glycemic control and, therefore, in delaying the onset of T2DM: the review specifically examined 45 studies concerning the evidence of an association between milk proteins and glycemic control, however, not elaborating a meta-analysis in consideration of the excessive heterogeneity of the studies examined; the doses of whey protein between the various studies examined ranged from supplements of 4.5 g to 90 g/day and that of casein from 12 to 60 g. The study concludes that there is sufficient evidence to state that acute milk protein supplementation improves insulin secretion by positively influencing postprandial glycemic values (but, at the moment, there is no long-term evidence) and that milk proteins can be a valid ally in the treatment of prediabetes and T2DM as they include amino acids and bioactive peptides capable of directly influencing gastric emptying, the secretion of incretin hormones, and the insulin response itself.
In conclusion, scientific literature concurs in demonstrating that a higher intake of milk and cheese, both low-fat and fat-free (three portions of low-fat dairy products (skimmed milk or low-fat yogurt: 300–400 g/day)), is associated with better glycemic control.
Whey protein supplementation (10–40 g of whey protein taken before a meal) may also be helpful in glycemic control, particularly in sarcopenic prediabetic patients.
4.2.2. Eggs
Eggs are a rich source of nutrients, including unsaturated fatty acids (omega-3, EPA, and DHA), choline, essential amino acids, minerals, carotenoids, lecithin, folate, and vitamins (A, D, and B). With about 200 mg of cholesterol per egg, eggs are among the foods with the highest cholesterol content [183]; however, the most recent American guidelines [184] no longer support the association between dietary cholesterol and serum cholesterol (and, consequently, the risk of coronary heart disease). Therefore, these guidelines no longer provided a recommended upper limit for dietary cholesterol intake to avoid the effect on blood cholesterol concentrations.
Some studies are now examining the relationship between egg consumption and the risk of developing prediabetes and T2DM.
In the 12-week randomized controlled trial by Pourafshar S. et al. [43], the correlation between egg consumption and improvement in glycemic control and insulin sensitivity was evaluated. We included 42 overweight or obese subjects aged 40 to 75 years with prediabetes and T2DM. Participants were randomly assigned to receive one large egg per day or an equivalent amount of egg substitute per day for 12 weeks. Blood samples were taken to analyze the lipid profile and biomarkers related to glycemic control.
Regular egg consumption has been shown to lead to an improvement in fasting blood sugar and IR levels (HOMA-IR). The lipid profile was then evaluated: there were no significant changes in the levels of total cholesterol and LDL cholesterol.
A 2017 systematic review [44] evaluated the link between egg consumption and the main cardiovascular risk factors in subjects with T2DM or at risk of the disease (prediabetes, IR, or metabolic syndrome). The inclusion criteria were randomized, controlled trials in which the number of eggs consumed was pitted against an egg-deficient (two eggs per week) or egg-free diet control group.
From 10 articles, it was found that the consumption of 6–12 eggs per week had no negative effects on the plasma concentrations of total cholesterol, LDL, triglycerides, fasting glucose, insulin, and C-reactive protein, in subjects at risk of developing T2DM.
A 2020 systematic review [45] considered three American cohort studies to analyze the correlation between long-term egg consumption and the risk of developing T2DM.
We included 82,750 women from the Nurses’ Health Study (NHS; 1980–2012), 89,636 women from NHS II (1991–2017), and 41,412 men from the Health Professionals Follow-Up Study (HPFS; 1986–2016) with no T2DM, cardiovascular disease, or baseline cancer.
Over a 32-year follow-up period, comprehensive data on egg intake and diet were collected every two to four years. The meta-analysis results indicate that there is no consistent relationship between T2DM risk and moderate egg consumption. However, the various geographic areas have been shown to differ significantly from one another. In fact, in US studies, the risk of T2DM increased by 18% for each egg consumed daily; this did not happen in the European or Asian studies. In the United States, however, egg consumption reflects an adherence to a Western dietary pattern, as eggs are often eaten alongside red or processed meats, refined grains, and sugary drinks.
In conclusion, the intake of 2–4 eggs per week should be recommended in patients with prediabetes.
4.2.3. Meat
Recent studies have investigated the association between the consumption of red and processed meat and the risk of developing prediabetes and T2DM.
In a 2022 cross-sectional study, Nguyen et al. [46] examined the relationship between the consumption of red and processed meat and the risk of prediabetes and T2DM in a cohort of 3000 participants, aged 40 to 60 years old, living in a municipality in Vietnam. Compared to subjects who ate less than 100 g per day, it was found that those who consumed more than 200 g of red meat per day had a 1.67 times higher risk of developing prediabetes and a 1.8 times higher risk of developing prediabetes and T2DM. There was no significant evidence regarding the consumption of white meat.
A further meta-analysis, combined with three cohort studies [48], examined the association between the consumption of red meat, both processed and unprocessed, and the incidence of developing prediabetes and T2DM. Both processed and unprocessed red meat were associated with an increased risk of T2DM in each of three cohort studies, which included 37,083 men from the Health Professionals Follow-Up Study (1986–2006), 79,570 women from the Nurses’ Health Study I (1980–2008), and 87,504 women in Nurses’ Health Study II (1991–2005). A meta-analysis of 442,101 participants supported the findings, which showed a 19% and 51% increase in relative risk for intakes of 100 and 50 g of processed red meat per day, respectively.
Another study including the analysis of three prospective cohort studies [49] investigated the relationship between changes in red meat consumption over a four-year period and the related changes in the risk of developing T2DM and prediabetes. Included in this study were 74,077 females from the Nurses’ Health Study II (1991–2007), 48,709 females from the Nurses’ Health Study (1986–2006), and 26,357 males from the Health Professionals Follow-Up Study (1986–2006). It was found that eating more than 0.50 servings of red meat per day was linked to a 48% greater chance of developing prediabetes and T2DM over the next four years. Meanwhile, reducing red meat consumption by more than 0.50 servings per day from baseline to the first four years of follow-up was associated with a 14% lower risk during the entire subsequent follow-up.
A prospective study conducted by Song et al. [47] established a direct link between the consumption of red and processed meat and the increased risk of T2DM: 37,309 women participated in the Women’s Health Study of age 45 or older, free from cancer, cardiovascular disease, and/or T2DM. Specifically, when comparing women in the top quintile with those in the bottom quintile, the relative risks of T2DM were 1.28 for red meat and 1.23 for processed meat intake.
However, a systematic review with meta-analysis conducted in 2023 on 21 randomized controlled trials [50] evaluated the relationship between the consumption of red meat and the risk of prediabetes and T2DM. The results highlighted that, compared to diets with reduced or no red meat intake, there were no significant differences of red meat intake in terms of insulin sensitivity, IR, blood glucose and fasting insulin, HbA1c, and pancreatic beta cell function. When comparing meals with those with little or no red meat intake, red meat consumption only slightly reduced postprandial glucose.
In conclusion, the intake of red and processed meat must be occasional, a portion of 100 g no more than one day a week.
4.2.4. Plant-Based Foods
Vegetable protein sources, such as legumes, have the great advantage of being low in saturated fats and rich in fiber, phytonutrients, and antioxidants, which, on the contrary, are scarce in foods of animal origin [56]. Antioxidants inhibit glucose uptake, stimulate insulin secretion, reduce hepatic glucose production, and stimulate glucose uptake, as reported in the review by Kim [57]. In fact, several in vitro and in vivo studies on animals have revealed that polyphenols are able to inhibit the action of carbohydrate digestive enzymes (alpha-amylase and alpha-glucosidase) [185,186,187,188] and improve insulin-mediated glucose uptake by activating AMPK in skeletal muscle and upregulating glut-4 expression [189]. The fibers modulate the postprandial glucidic response and stimulate the production of short-chain fatty acids, which, in turn, improve the glucidic response and insulin sensitivity [190]. Iron, zinc, potassium, magnesium, niacin, dietary fiber, and a particularly high intake of environmentally friendly proteins make legumes a one-of-a-kind food with a nutrient-rich profile. Legumes are considered low-glycemic-index foods (GI < 55%) because they are excellent in reducing the postprandial response to glucose and insulin [191]. Soybeans are the legumes with the lowest glycemic index among legumes (GI 16 ± 1%), followed in ascending order by beans (GI 24 ± 4%), chickpeas (GI 28 ± 9%), and lentils (GI 32 ± 5%) [192].
Legume consumption was related to better metabolic health, as reported in the systematic review with meta-analysis by Schwingshackl [58]; this study evaluated the correlation of certain metabolic parameters (systolic blood pressure, glycemic parameters, and lipid profile) and consumption of specific food groups: 66 studies in the literature considered “reliable” were analyzed in detail (out of a total of more than 300, dated between 1979 and 2018); the random effect model was used for the statistical evaluation. Legume consumption was associated with a reduction in LDL cholesterol (−0.30 to −0.12 mmol/L), HOMA-index, total cholesterol, HbA1c, and both systolic and diastolic blood pressure. In the general analysis, legumes were second only to the consumption of dried fruit in terms of benefit for all the outcomes analyzed.
The same working group also investigated the association between the consumption of foods from the main food groups and all-cause mortality [59].
In this review with meta-analysis, 103 prospective studies were considered for the analysis (17 treated legumes as a food group): an inverse association with all-cause mortality was highlighted in the comparison between the category with the highest consumption of legumes in the diet (total range: 6–166 g/day); i.e., those who consume the highest amount are at a lower risk of mortality from all causes than those who consume a smaller amount (RR: 0.96; 95% CI: 0.93, 1.00; I2 = 48%; p-heterogeneity = 0.01); it also highlighted that the risk of mortality from all causes decreased by 16% with the increase in the intake of legumes of up to 150 g/day.
From the observational study by Becerra-Tomás N et al. on a large sample of 3349 non-diabetic patients at baseline (from the PREDIMED epidemiological study), it was possible to observe that, during an average prospective follow-up period of 4.3 years, the individuals who consumed higher amounts of legumes in their ordinary diet (the highest quartile) were exposed to a significantly reduced risk of developing T2DM compared to the lowest quartile (HR: 0.65; 95% CI: 0.43, 0.96; p-trend = 0.04). The quartiles were made up as follows: Q1 9.64 ± 3.55 g/day, Q2 16.09 ± 1.41 g/day, Q3 21.57 ± 1.89 g/day, and Q4 34.60 ± 17.24 g/day. In practice, the subjects of Q4 consume about 120–360 g of legumes per week (a range that goes from just under a standard portion of legumes, which turns out to be 150 g, to more than two portions) and are exposed to a significantly higher risk but are less likely to develop T2DM than those who consume less and occasionally [53].
In 2008, H. Shams et al. [54] conducted a case–control study to evaluate the impact of legume supplementation in improving glycemic indices in a sample of 30 patients with T2DM: the patients were randomly divided into two groups, one control group with a standard diet and a treatment group that would consume 50 g of cooked lentils per day (instead of 30 g of bread in the control diet); after a six-week period, total cholesterol and fasting blood glucose were significantly reduced (p < 0.05).
From the recent 2020 meta-analysis by Tang J regarding the intake of plant-derived proteins (legumes in general and soybeans and derivatives), it was possible to identify with a moderate degree of evidence that there is a dose-dependent inverse correlation between the consumption of soy (tofu, soy protein, and soy isoflavones) and incidence of T2DM (all p-values < 0.05) [60]. Specifically, a daily increase of one serving (124 g) of tofu, 10 g of soy protein, and 10 mg of soy isoflavones was associated with lower risks of T2DM by 32%, respectively (RR: 0.68; 95% CI: 0.50, 0.93), 9% (RR: 0.91; 95% CI: 0.84, 0.99), and 4% (RR: 0.96; 95% CI: 0, 92, 0.99). These data are also confirmed in the previous review (2018) by Li W. et al. [61].
A 2020 Korean study investigated the effect of soy protein supplementation (specifically, black soy peptides, a less common variant of green or yellow soy, typically found in eastern countries and used in Chinese medicine) on glycemic outcomes in patients with impaired glycemia (prediabetics and newly diagnosed T2DM): 55 subjects were recruited and randomly assigned, either to the treatment group or to the control group; subjects in the treatment group were administered 4.5 g/day of black soy peptides for 12 weeks, and the control group a placebo for the same timeframe. It was possible to observe an improvement in the fasting blood glucose of the treated patients compared to the control patients (p < 0.05), as well as for the blood glucose 2 h after the meal (p < 0.05), while no significant differences were found for parameter HbA1c [51].
Peanuts are also taxonomically classified as legumes. There are few studies in the literature on the effect of peanuts on T2DM and IFG: the prospective study conducted by Rui Jiang et al. in 2002 on a cohort of 83 818 female subjects, aged between 34 and 59 years, without T2DM at baseline, and during an average follow-up of 16 years, showed that peanut butter consumption was inversely associated with the onset of T2DM with an RR of 0.79 (95% CI, 0.68–0.91; p for trend <0.001) with an average weekly consumption of five portions (equivalent, according to the authors, to > 140 g/week) compared to those who did not consume it [55].
Instead, from the administration study by C.E.G. Reis et al., it was possible to evaluate the postprandial glucidic response to the intake of peanuts: in a sample of 13 subjects (nine female and four male, healthy, average age 28.5 years and with mean BMI of 22.7), a meal of raw peanuts with skin (RPS) (63 g), roasted peanuts without skin (RPWS) (63 g), and ground-roasted peanuts without skin was randomly administered after 12 h of overnight fasting (GRPWS) (63 g), or an isocaloric, isoglucose, isolipid, and isoprotein control meal; as a consequence, postprandial capillary blood glucose levels were measured at 30, 45, 60, 90, and 120 min and each subject ate all four test meals at different times and in a random sequence (one test every two days, taking one of the randomly chosen from those not previously tested). The glycemic index of peanuts was found to be 14.33. The area under the glycemic response curve (AUC) after GRPWS intake was lower (p = 0.02) than that obtained with RPS and overall blood glucose at 15 min and 30 min of roasted peanut meals were hypoglycemic compared to the control meal. There was no treatment effect on energy, macronutrient, and fiber intake after the test meal. The authors argue that the amount of fat released and absorbed in the digestive system depends on the degree of maceration and rupture of the peanut cell wall; therefore, their grinding influences the glycemic and insulinemic responses [52].
In conclusion, from the evidence in the literature, it is possible to deduce that a consumption of vegetable proteins is recommended for the purpose of improving glycemic control and IR: a good amount of legumes, between 150 g fresh, corresponding to 50 g dried (standard portion), three times a week, up to a maximum of 150 mg/day, is recommended. Furthermore, soy and its derivatives, such as tofu, and peanuts, preferably with skins and also in the form of peanut butter, are a valid addition to the diet as they can all contribute to preventing the progression of IR, typical of prediabetes, in overt T2DM.
4.3. Sarcopenia
There are still few studies aimed at investigating a possible specific association between sarcopenia and prediabetes. Among the most recent is the study by Xu J. et al. of 2023, conducted on 16,116 adults aged between 20 and 59 years. Sarcopenia, defined by a DXA assessment of appendicular skeletal muscle mass (ASM), was found to be closely associated with an increased risk of prediabetes (particularly of IGT), independent of obesity, triglycerides, and LDL cholesterol levels. In particular, the greatest risk was observed in subjects with sarcopenia and, at the same time, obesity, especially if centrally obese [193]. In another cross-sectional study of 1629 elderly (mean age 73.1 ± 5.4 years) living in Japan, logistic regression demonstrated that prediabetes represents an independent risk factor for sarcopenia (assessed by appendicular skeletal muscle mass) for male subjects, but not female subjects [63].
Considering how a reduced metabolism and muscle mass are associated with an increase in IR and the appearance of T2DM, the causal relationship between sarcopenia and impaired glucose metabolism could, in fact, be bidirectional; in this regard, a study conducted on 22,482 adults aged ≥ 20 years, defining sarcopenia as the ratio of appendicular skeletal muscle mass/body mass index (ASMBMI) < 0.789 for men and <0.512 for women (based on the established by the Foundation for the National Institutes of Health (FNIH) Sarcopenia Project), showed that prediabetes is associated with an increased risk of sarcopenia [OR (95% CI) = 1.230 (1.057, 1.431), p = 0.008]. In particular, an HbA1c > 5.2% was found to be an independent risk factor for the loss of appendicular skeletal muscle mass and sarcopenia in male participants without T2DM [64].
Already, in 2021, a meta-analysis performed on 16 observational studies to investigate the association between the presence of sarcopenia and HbA1c values, prediabetes, T2DM, and its complications, had shown that subjects with prediabetes had reduced mass, strength, and muscle performance compared to non-diabetics [65].
Therefore, further studies are needed in order to confirm not only the existence of an association between sarcopenia and prediabetes, but also to better define, possibly, the causal relationship between the two conditions. In any case, the assessment and monitoring of body composition over time must be part of the multidimensional assessment of the patient with prediabetes.
In conclusion, given that the studies that have been carried out up to now investigating the correlation between prediabetes and sarcopenia concur in demonstrating that subjects with prediabetes had reduced mass, strength, and muscle performance compared to non-diabetics, it is important that patients with prediabetes be screened in order to evaluate the possible presence of this pathology. Finally, given this background, it is equally important that protein intake is taken adequately by patients with prediabetes.
4.4. Lipid-Containing Foods
An impaired fatty acid (FA) metabolism plays a pivotal role in the development of an impaired glucose metabolism and, consequently, in the onset of T2DM [194]. An interesting review by Stinkens provides an overview of the pathways related to the metabolism of fatty acids in the adipose tissue, liver, and muscle. Adipose tissue dysfunction can result in excess lipids, systemic inflammation, and the excessive accumulation of lipids in non-adipose tissue such as the liver, skeletal muscle, and pancreas. All of these alterations favor the development of an impaired glucose metabolism, IR, and T2DM. The review suggests that improving the lipid storage capacity of adipose tissue prevents excess lipids in circulation and the consequent ectopic fat deposition, and, thus, has a high potential to improve glucose tolerance and insulin sensitivity.
The improvement of the mitochondrial function of adipose tissue can be achieved by nutritional strategies such as supplementation with specific polyphenols (or a combination of polyphenols) and modification of the FA composition in the diet. The quality of dietary fat not only modulates lipid metabolism but may also affect low-grade inflammation which, in turn, may reduce the risk of developing IR and T2D. Targeting skeletal muscle lipid turnover and the balance between lipolysis, FA uptake, and mitochondrial function/fat oxidation may be an attractive strategy with which to improve insulin sensitivity in obesity and T2D.
The most promising dietary intervention to reduce FA uptake is the improvement of the lipid-buffering capacity of adipose tissue. The increased activation of SIRT-1 and PGC-1 may result in an improved skeletal muscle mitochondrial biogenesis function, fat oxidation, and metabolic flexibility. The modulation of dietary polyphenol content or modulation of dietary fat quality may also have positive effects on skeletal muscle lipid metabolism and insulin sensitivity. Finally, the prevention of β-cell apoptosis and modulation of β-cell proliferation by bioactive compounds (including polyphenols, vitamins, and carotenoids) may maintain insulin secretory capacity and, as such, could be a potential target to reduce the incidence of T2D.
In conclusion, the manipulation of the quantity and quality of dietary fat is of particular interest for improving adipose tissue function, skeletal muscle lipid turnover, and mitochondrial function. Further human intervention studies targeting specific AF-related pathways are needed to translate the indications above into relevance for the control of glucose homeostasis and insulin sensitivity.
A case–control study aimed at determining the association between dietary fat quality (DFQ) indices and fatty acid intake with prediabetes was carried out.
In the study, 150 subjects with normal fasting glucose (FBG) and 147 prediabetic subjects were included. (The inclusion criteria for prediabetic subjects were as follows: age between 35 and 65 years, fasting glucose of 100–125 mg/dL after an 8–12 h fast, or OGTT of 140–199 mg/dL after 2 h and with a 75 g glucose load, diagnosed no more than three months before the interview.) Participants were interviewed to complete a valid semi-quantitative FFQ with 168 food items. The Healthy Eating Index (HEI) score was calculated, which summarizes the consumption of 13 foods or nutrients (including consumption of total fruits, whole fruits, total vegetables, greens and beans, whole grains, dairy products, total protein foods, seafood and plant proteins, fatty acids, refined grains, sodium, added sugars, and saturated fats). Each component was rated on a scale of 0 to 10. In the Dietary Fat Quality Survey, a positive association was found between total saturated fatty acid (SFA), myristic and palmitic acid intakes, and prediabetes. Furthermore, an inverse association was observed between the intake of n-3 polyunsaturated fatty acids, eicosapentaenoic acid, docosahexaenoic acid, arachidonic acid, and prediabetes (p-trend < 0.05) [73].
Another 2018 study wanted to demonstrate the association between the quality and quantity of lipids in the diet and the risk of onset of T2DM in adults. For the study, 2139 adult subjects between 20 and 70 years of age, without T2DM, were taken into consideration, and followed for more than five years with the assessment of dietary intake using validated questionnaires. During the follow-up, in which 143 new cases of T2DM were found, high intakes of monounsaturated, polyunsaturated, omega-3 fatty acids, and cholesterol were associated with a lower risk of T2DM. Additionally, omega-6/omega-3 and total fat/omega-3 ratios were also found to be positively associated with T2DM [74].
Fatty acids (FAs) influence the translocation of glucose transporters, as well as insulin receptor binding and signalling, as well as contribute to cell membrane fluidity and permeability. A 2021 review details the role of FAs in the pathogenesis of T2DM, which, to date, has not been fully shown.
Through lipidomic techniques (a subcategory of metabolomics), it has been shown that specific combinations of FAs within phospholipids and triglycerides have a stronger association with the risk of T2DM, particularly shorter-chain saturated fatty acids (SFAs).
Elevated TG levels increase FFA, resulting in the accumulation of DAG (diacylglycerol) and fatty acyl Co-A and increased ROS. All this together activates PKC (protein kinase C), which disrupts the insulin signalling pathway [195].
As explained in the review, the increase in palmitic acid is due to an enhancement of the de novo synthesis of fatty acids, as well as the alteration of cellular organelles and the promotion of a pro-inflammatory state. Furthermore, the increase in intracellular levels of palmitic acid depends on the plasma content of non-esterified fatty acids (NEFAs), which promote lipotoxicity and lipoapoptosis.
When palmitic acid levels rise beyond mitochondrial oxidation limits, this causes excess fatty acids to be converted into harmful lipids such as diacylglycerol and ceramide which, if present in high amounts, can activate protein kinase C (PKC) isoforms, which, in turn, phosphorylate the Serine 1 residues of insulin, thus attenuating its signalling pathway and, consequently, determining IR. Furthermore, PKC isoforms inhibit the pro-inflammatory signalling cascade and promote ceramide synthesis, the latter being involved in the inhibition of FA mitochondrial β-oxidation.
Collectively, these changes cause metabolic dysregulation and promote the onset of T2DM.
On the other hand, oleic acid produces beneficial effects on insulin sensitivity, such as the production of anti-inflammatory effects (due to the activation of IL-10), the increase in the production of adiponectin, and the reduction of pro-inflammatory cytokines (IL-6 and TNF-α).
As mentioned earlier, omega-3s may improve insulin signalling and a possible mechanism is explained in the review. In fact, PUFAs can reduce endoplasmic reticulum stress and improve beta-oxidation at the mitochondrial level, thus determining a reduction in the accumulation of lipids, as well as reactive oxygen species (ROS).
EPA and DHA regulate insulin sensitivity through the phosphorylation of Akt (protein kinase B), activation of AMPK (AMP-activated protein kinase), and activation of PPAR-γ (peroxisome proliferator-activated receptor-γ). They inhibit the expression of pro-inflammatory mediators from adipose tissue and promote the expression of adiponectin, thereby indirectly promoting insulin secretion from pancreatic β-cells, while having a direct effect on the same function by exerting a role on the membrane fluidity and structure of the lipid raft and binding to PPARs, GPR40, and GPR120, thereby promoting insulin secretion.
Conversely, omega-6s exert a pro-inflammatory effect, since the product of desaturation, arachidonic acid, produces inflammatory cytokines and eicosanoids.
Thus, maintaining an optimal balance of omega-6 and omega-3 FAs in the diet is critical to human health. The review proposes a ratio between 1:1 and 2:1 as a target ratio between omega-6 and omega-3. Therefore, FA dietary interventions specifically aimed at maintaining an optimal omega-6/omega-3 ratio may overcome the risk of developing T2DM [196].
4.4.1. Fish
Numerous epidemiological studies have investigated the association between the intake of fish, the food richest in omega-3, and the risk of prediabetes.
A meta-analysis, creating a database of 12 independent cohorts followed in longitudinal studies for about 11.4 years, found an inverse relationship between the incidence of T2DM and fish consumption by combining studies on Eastern populations, while such a relationship did not exist among Western populations [78].
A Japanese longitudinal study evaluated the incidence of new cases of T2DM in a population of 22,921 men and 29,759 women. This incidence was found to be 971 new cases. In men, fish intake was found to be statistically significant and associated with a decreased risk of T2DM. However, this association was not found in the female population [75].
A case–control study carried out in 2021 evaluated how, in a pool of 152 people over the age of 65 and with fasting blood sugar between 100 and 124 mg/dL, those who followed a balanced diet enriched with two weekly portions of sardines showed, in one year, a greater decrease in blood pressure, an increase in the omega-3 index, an increase in circulating metabolites considered protective against T2DM, an increase in adiponectin, and an improvement in IR assessed by HOMA-IR [66].
Another study conducted by Rajabi-Naeeni et al., conducted on 168 women aged between 15–50 years with prediabetes, found a significant reduction in fasting insulin in those who took a supplement of 1 g per day of omega-3 or a combined supplementation with omega-3 and vitamin D [67].
Another 2017 study conducted in Indonesia administered a supplement of 3 g per day of omega-3 for 12 weeks to a pool of 45 women suffering from obesity: the supplementation led to a greater control of prediabetes compared to the group that took the placebo [68].
A 2018 study hypothesized that omega-3 fatty acids may have a preventive role in patients with prediabetes, also in light of the benefits that such supplementation can have against anxiety and sleep disorders, conditions that pose a greater risk for the development of metabolic syndrome [69].
A Danish study found, by carrying out a long follow-up on a middle-aged cohort, how a diet that favors white meat and fish in place of processed meats determines a lower risk of developing T2DM [76].
In 2021, a 10-year longitudinal study evaluated the incidence of new cases of T2DM and the consequent correlation with the diet of the participants (evaluated by 24 h recall). In a cohort of 392,287 people, 7262 new cases of T2DM were found. It emerged that the consumption of lean fish does not seem to correlate with the risk of developing T2DM; instead, a statistically significant inverse correlation (p < 0.001) was found between the consumption of fatty fish and fish oil and the risk of T2DM. Those who reported eating two or more servings of fatty fish per week or fish oil had a 22% lower risk of developing T2DM, even after adjusting for any confounders. Those who already consumed fish oil regularly at baseline had a 9% lower risk [77].
4.4.2. Olive Oil
Extra-virgin olive oil, the food richest in polyunsaturated fatty acids, is probably one of the major components that distinguish the Mediterranean diet. It is, in fact, the most abundant oil in flavonoids, lignans, and bioactive compounds, in light of its low level of refining. The main polyphenols contained in olive oil are oleuropein and hydroxytyrosol, as reported in the Narrative Review of the Evidence by Guasch-Ferrè [197].
A 2017 meta-analysis highlights how olive oil intake can be beneficial for the prevention and treatment of T2DM. Four study cohorts were analyzed, a total of 15,784 subjects with T2DM. The highest intake of olive oil (approximately 15–20 g per day) showed a 16% reduction in the risk of onset of T2DM compared with a lower intake. In patients with T2DM, on the other hand, supplementation with olive oil showed a more marked reduction in HbA1c and fasting blood glucose than in the control group [79].
The literature has hypothesized that the effectiveness of taking EVO OIL on lipid metabolism is not only due to the lipid content but also to an action on intestinal permeability.
An Italian study from 2022 evaluated the role of EVO oil in 20 subjects with IFG, hypothesizing a role for the latter in effectively reducing intestinal permeability and the consequent metabolic endotoxemia. The addition of EVO oil to the meal showed, in subjects affected by IFG compared to healthy subjects, a decrease in LPS and zonulin values, suggesting a potential role in reducing intestinal permeability. At the same time, a reduction in postprandial glycemia at 2 h and an increase in insulin and GLP1 values were detected [72].
A double-blind randomized study found that, in a group of patients at risk for T2DM (as a result of suffering from prediabetes or metabolic syndrome), the intake of 50 mL of EVO oil significantly improved the endothelial function [70].
An Italian cross-over study found improvements in the blood sugar, insulin, and GLP-1 levels of 30 patients following the administration of 10 g of extra-virgin olive oil. An improvement in the activity of dipeptidyl peptidase 4 (DDP4) was also found in these patients [71].
In conclusion, there are numerous studies that have investigated the role of fatty acids in prediabetes, in particular, the beneficial role of the intake of foods rich in mono- and polyunsaturated fats. The protective role of an intake of at least 2–3 portions of fish weekly in T2DM is linked to the presence of omega-3 fatty acids EPA and DHA and their anti-inflammatory action, capable of increasing membrane fluidity, and the number and efficiency of insulin receptors. Furthermore, the benefits of fish could also be linked to the content in the latter of proteins and amino acids, capable of increasing the sense of satiety and, consequently, facilitating weight loss.
As regards monounsaturated fatty acids, the literature has shown that the daily intake of at least 10 mL per day (optimal 15–20 mL) of extra-virgin olive oil represents an important strategy in glucid control in prediabetes. The effectiveness is due, in particular, to the presence of high quantities of polyphenols in the EVO oil.
4.5. Vitamins
4.5.1. Vitamin D
Recent meta-analyses have demonstrated the beneficial effects of vitamin D supplementation in delaying progression to T2DM (relative risk reduction of 11–12% compared to the placebo) and also in improving the regression to the normal regulation of glucose (relative benefit of 48% compared to the placebo) [85]. In the pathogenesis of prediabetes and T2DM, the role of deficient or altered levels of insulin, adiponectin, and 25 hydroxy vitamin D (25[OH]D) regulate food intake, energy metabolism, glucose and lipid metabolism, and body weight. Adiponectin is a hormone synthesized by adipocytes, which plays an important role in the regulation of glucose metabolism and which increases insulin sensitivity, exerting antidiabetic and anti-inflammatory activities.
Similarly, vitamin D appears to improve insulin sensitivity through various mechanisms, and recent studies have found a strong link between vitamin D deficiency, obesity, and metabolic syndrome. Since both low levels of vitamin D and adiponectin are associated with increased obesity, the association between vitamin D and adiponectin could provide an explanation for the development and natural course of T2DM.
As their relationship and etiology are still unknown, Banerjee et al. conducted a cross- sectional study published in 2017 with the aim of investigating the role of these parameters and establishing their interrelationship in patients with prediabetes and T2DM. The study included 202 subjects: 77 subjects with T2DM (mean age 48.09 ± 6.8), 73 with prediabetes (mean age 49.96 ± 7.6), and 52 healthy subjects constituting the control group (mean age 50.08 ± 7.1). All subjects were matched for age, gender, and BMI within study groups. In all study groups, fasting serum levels of adiponectin, insulin, and 25(OH)D were measured, and routine biochemical parameters were analyzed. The results show statistically lower serum adiponectin and 25(OH)D levels and higher serum insulin levels in subjects with prediabetes or T2DM compared to controls. Changes in serum adiponectin or serum 25(OH)D in people with prediabetes and T2DM were inversely related to serum insulin levels. Furthermore, a multiple linear regression analysis with 25(OH)D, insulin, and HOMA-IR as variables revealed that serum adiponectin levels could be an independent risk factor for the progression of prediabetes and T2DM. In conclusion, the authors state that the association of these hormones could act as a predictor of the progression of prediabetes to T2DM [81].
To evaluate whether vitamin D supplementation reduces the risk of developing T2DM in patients with prediabetes, Zhang Y. et al. conducted a systematic review and meta-analysis published in 2020, including randomized control trials evaluating vitamin D supplementation versus a placebo. The primary outcome was new-onset T2DM; the second was the reversibility of prediabetes.
The authors identified eight eligible studies with a total of 4896 subjects. The population consisted of adults with prediabetes (defined by the WHO and American Diabetes Association criteria) who were taking vitamin D, regardless of type, dose, duration, or route of administration. Specifically, five studies recruited participants with prediabetes, two studies recruited participants with prediabetes and vitamin D deficiency, and one study recruited participants with prediabetes, vitamin D deficiency, and obesity. The follow-up duration of the studies ranged from six months to five years.
All eight studies reported the development of new-onset T2DM, particularly in 1022 (20.9%) of the 4896 participants. Combining data from all eight studies that reported an RR, vitamin D supplementation reduced the incidence of new-onset T2DM by 11%. In particular, non-obese subjects benefitted more than obese subjects. The reversion of prediabetes to normoglycemia occurred in 116 of 548 (21.2%) participants in the vitamin D group and 75 of 532 (14.1%) participants in the control group.
In conclusion, in people with prediabetes, vitamin D supplementation reduces the risk of T2DM and increases the rate of reversion of prediabetes to normoglycemia [85].
Considering that vitamin D has a regulation on glucose homeostasis pathways, Rasouli et al. conducted a study published in 2022 with the aim of investigating the effects of vitamin D supplementation on β-cell function. This was a randomized, double-blind, placebo-controlled clinical trial conducted at 22 sites in the United States comparing vitamin D versus a placebo for T2DM prevention in adults at high risk for T2DM. To be eligible, participants had to meet at least two of three glycemic criteria for prediabetes defined by the 2010 American Diabetes Association guidelines: fasting plasma glucose (FPG) 100 to 125 mg/dL (5.6 to 6.9 mmol/L); plasma glucose 2 h after a 75 g oral glucose load 140 to 199 mg/dL (7.8 to 11.0 mmol/L); and HbA1c 5.7% to 6.4% (39–47 mmol/mol). The other inclusion criteria were age (>30 years) and BMI (between 24 and 42 kg/m2). In total, there were 1774 participants, with a mean age of 60.5 ± 9.8 years and a mean BMI of 31.9 ± 4.4 kg/m2, 44% were female, and 69% white.
Participants were randomized to either a single soft gel containing 4000 IU vitamin D3 (cholecalciferol) or a matching placebo once daily. Randomization was divided into blocks by site, body mass index (<30 or ≥30 kg/m2), and race (white or non-white). Participants were asked to refrain from the use of specific T2DM or weight-loss medications during the study and to limit the use of other vitamin-D-containing supplements or multivitamins. During the study, participants received information on T2DM prevention through information sheets and bi-annual group meetings.
The main outcomes included changes in insulin sensitivity, insulin secretion, and β-cell function in response to the study intervention (vitamin D vs. placebo) over the first two years of the study. The homeostasis assessment model (HOMA) was used to estimate steady-state insulin sensitivity (%S) and β-cell function (%B) as percentages of a normal reference population. The study involved measuring C-peptide and insulin concentrations at baseline, 12 months, and 24 months.
Approximately one-third of participants met all three prediabetic criteria (FPG, 2 h plasma glucose after a 75 g oral glucose load, and HbA1c). The mean baseline vitamin D level was 27.9 ng/mL and increased to 52.8 at 12 months and 54.9 mg/dL at 24 months in the vitamin D group, whereas it was unchanged in the placebo group (28.5 ng/mL at baseline, 27.9 ng/mL at 12 months, and 28.4 ng/mL at 24 months). Of the total of 1774 participants, 275 (15.5%) subjects had a diagnosis of T2DM between the 12th and 24th months of follow-up, 116 (13.1%) in the vitamin D group vs. 159 (18.0%) in the placebo group, showing a significantly lower incidence of T2DM onset in the vitamin D group.
The authors state that this study showed no difference or change in β-cell function with vitamin D supplementation versus placebo. However, vitamin D improved β-cell function among those who had baseline 25(OH)D levels below 12 ng/mL. The rate of incident T2DM over the two years of the study was significantly lower in the vitamin D group than in the placebo group, showing a real benefit from vitamin D supplementation in patients with prediabetes [80].
In conclusion, the evaluation of vitamin D blood levels is mandatory in patients with prediabetes in order to identify personalized supplementation of this vitamin.
4.5.2. Group B Vitamins
As for the B vitamins, by regulating homocysteine synthesis, these vitamins could reduce the risk of T2DM, by reducing IR and oxidative stress.
Hyperhomocysteinemia has emerged as a risk factor for prediabetes and T2DM due to its association with IR (IR). Hyperhomocysteinemia can be caused by various factors, including dietary factors, and a low intake of folate, vitamin B6, and B12.
These B vitamins play a fundamental role in the degradation of homocysteine (Hcy) by acting as preliminary substrate donors (folate) or as essential coenzymes (vitamin B6 and B12). Furthermore, these vitamins are vital components of a one-carbon metabolism that contributes to DNA methylation, critical to the pathogenesis of T2DM [82].
To prospectively examine folate, vitamin B6, and B12 intakes in relation to T2DM incidence in a large US cohort, Jie Zhu et al. published the results of a 30-year follow-up of young adult patients in 2020.
A total of 4704 American adults (52% female and 51% black) between 18 and 30 years of age (mean age, 24.9 ± 3.6 years) and without T2DM were enrolled in this study in 1985–1986 and monitored through 2015–2016 in the Coronary Artery Risk Development in Young Adults (CARDIA) study. Dietary assessment was conducted by means of a validated anamnestic questionnaire three times: at baseline, in 1992–1993 (year 7), and in 2005–2006 (year 20). The cumulative mean intakes (from diet and supplementation) of folate, vitamin B6, and B12 were included in the analyses. Cases of incident T2DM were defined on the basis of plasma glucose levels (measured at baseline and then at the 7th, 10th, 15th, 20th, 25th, and 30th year), oral glucose tolerance tests (with 10th, 20th, 25th, and 30th year of OGTT), hemoglobin A1c concentrations (measured at 20th, 25th, and 30th year), and/or antidiabetic drugs.
During 30 years (mean of 20.5 ± 8.9) of follow-up, 655 cases of T2DM occurred. Folate intake, but not vitamin B6 or vitamin B12 intake, was inversely associated with the incidence of T2DM after adjustment for potential confounders, especially in older subjects and whites. To investigate the possible mechanisms behind the potential benefits of folates in diabetics, we studied the correlation between folate intake and plasma homocysteine blood glucose, insulin levels, HOMA-IR and HOMA-β function index, and inflammatory indices. It emerged that folate intake was inversely associated with homocysteine levels, so a higher intake of these was also associated with a reduction in plasma homocysteine (p-trend < 0.01) and insulin (p-trend < 0.01). Finally, among supplement users, folate intake was inversely associated with serum C-reactive protein levels (p-trend < 0.01).
In conclusion, this prospective study found that folate intake (both dietary and supplemental) in young adulthood is inversely associated with the incidence of T2DM (over a 30-year follow-up) among Americans. The observed association may be partially explained by mechanisms binding homocysteine, insulin sensitivity, and systemic inflammation [82].
These findings are supported by a previous 2012 case–control study which demonstrated that both dietary intake and serum folic acid level were lower in Omani patients with T2DM than in healthy control subjects [198] and from two prospective cohort studies (2017 and 2019) that found dietary folate consumption was inversely associated with incident T2DM in Korean or Japanese women [199,200]. However, the cases of T2DM in these two cohort studies were self-reported and were not validated by clinical measurements and data.
Lind MV and colleagues, in 2019, conducted a meta-analysis of the randomized controlled trials present in the literature, to investigate the effects of folate supplementation on the outcome of IR and T2DM. In this meta-analysis, 29 studies were analyzed (with a total of 22,250 participants) and they evaluated the effect of placebo-controlled folate supplementation, alone or in combination with other B vitamins, on fasting glucose, insulin, model evaluation of homeostasis for IR (HOMA-IR), HbA1c, or risk of T2DM. Of the 29 studies included (4 with a crossover design and 25 with a parallel design), the majority (n = 26) reported fasting blood glucose values. For fasting insulin and HOMA-IR, 11 studies were included, while, for HbA1c, 8 studies were included. Only two studies were included for the development of T2DM as an outcome, with a follow-up of 4 and 7.3 years, respectively. The duration of studies reporting glucose metabolism outcomes ranged from two weeks to two years, with the majority of studies ranging in duration from four to eight weeks. Of the 29 studies, 21 studies involved supplementation with folic acid alone, while 3 included vitamin B12, 1 included vitamin B6, and 4 included both vitamin B12 and vitamin B6. The folic acid dosages used ranged between 0.4 and 15 mg/day (the most used dosage was between 0.8 and 5 mg/day).
The results of all these studies showed a mean reduction in homocysteine ranging from 0.3 to 4.3 µmol/L compared to treatment with a placebo. As far as the study population is concerned, possible pathologies were also taken into account: one study analyzed the results on women with polycystic ovary syndrome; eight studies were on subjects with T2D; six on subjects with metabolic syndrome traits—overweight, obese, hypertensive, or with multiple metabolic syndrome variables; seven on people with heart disease; and five included apparently healthy participants. Most of the studies included both genders, but six involved only women and five only involved men. The T2DM developmental outcome studies had a total of 24,954 participants, with 916 new cases of T2DM identified during follow-up.
There were no significant effects of folate administration on fasting blood glucose. Only studies combining folate and B vitamins showed lower fasting blood sugar compared with placebos, while folate administration alone showed no difference between the treated and placebo groups. Instead, compared with the placebo, folate supplementation reduced fasting insulin (WMD: −13.47 pmol/L; 95% CI: −21.41, −5.53 pmol/L; p < 0.001) and HOMA-IR (WMD: −0.57 units; 95% CI: −0.76, −0.37 units; p < 0.0001), but no particular effects were observed for fasting glucose or the HbA1c. Changes in homocysteine following folate supplementation correlated with changes in fasting glucose (β = 0.07; 95% CI: 0.01, 0.14; p = 0.025) and HbA1c (β = 0.46; 95% CI: 0.06, 0.85; p = 0.02). Only two studies reported the development of new cases of T2DM in the follow-up period. Of these, one used folic acid alone and the other used folic acid, vitamin B12, and vitamin B6. There were no differences for folate supplementation on overall risk of T2DM (0.91; 95% CI: 0.80, 1.04; p = 0.16) and no heterogeneity was found in the results of the two studies (I2 = 0%; p = 1.00). Therefore, the authors conclude the work stating that folate supplementation could be beneficial for glucose homeostasis and RI reduction, but, at present, there is insufficient data to definitively determine the effect on T2DM development [86].
The most recent study on this subject is one published by Jin G et al., who conducted and published in 2021 a cross-sectional study to define the association between folate, B12, and B6 obtained from diet, supplementation, and T2DM and prediabetes in American adults. Subjects from the general American population were chosen, reaching a total of 22,041 participants (10,672 men and 11,369 women), to select 29,201 candidates over the age of 20. To define their condition of T2DM or prediabetes, five diagnostic criteria were applied: three based on laboratory data and two on questionnaires. To calculate the intake of the vitamins concerned, 24 h recalls on two different days were used. The mean value of intake was obtained from the 24 h diary and from the supplementation. From the results, of the 22,041 participants, 18.3% had T2DM and most were over 60 years old. Healthy subjects ate more folate, vitamin B12, B6, and calories than diabetics. In binary logistic regression analysis, dietary folate and B6 were associated with a lower risk of T2DM, and, after adjusting for confounders, folate, B6, and B12 levels were inversely associated with T2DM. Dietary folate and B6 intakes were negatively associated with new T2DM diagnoses, and B12 and B6 were inversely associated with prediabetes. In conclusion, therefore, the authors state that there is an association between low values of B vitamins and the risk of T2DM, especially in the over-60 population [83].
Since it is possible with routine tests to carry out the evaluation of folate, vitamin B 12, and homocysteine in the blood, it is essential to carry out these analyses in subjects with prediabetes in order to supplement in case of folic acid and vitamin B12 deficiencies.
4.5.3. Vitamin C
Research suggests that chronic low-grade inflammation and oxidative stress play a key role in the development of IR and T2DM, as well as related complications. Vitamin C is a micronutrient with potent antioxidant properties, essential to humans for many biological functions and as an enzyme cofactor, and recent studies suggest that people with T2DM have lower plasma vitamin C values than subjects with normal glycemic control.
With the aim of analyzing plasma vitamin C concentrations across the glycemic spectrum and investigating the correlation with metabolic health indices, Wilson et al. conducted a pilot cross-sectional observational study of adults with various glycemic conditions ranging from normal glucose tolerance (NGT) to those with T2DM.
Demographic and anthropometric data, and physical activity information were collected, and participants were asked to complete a four-day food diary. Venous blood samples were collected and glycemic indices, plasma vitamin C concentrations, hormone tests, lipid profiles, and high-sensitivity C-reactive protein (hs-CRP) were analyzed.
A total of 89 participants completed the study, including individuals with NGT (n = 35), prediabetes (n = 25), and T2DM managed with diet alone or a metformin-only regimen (n = 29). Vitamin C plasma concentrations were significantly lower in subjects with T2DM than in those with NGT (41.2 µmol/L versus 57.4 µmol/L, p <0.05), and a higher rate of vitamin C deficiency was observed (i.e., <11.0 µmol/L) in both the prediabetic and T2DM groups. Results showed that fasting glucose (p = 0.001), BMI (p = 0.001), smoking history (p = 0.003), and dietary vitamin C intake (p = 0.032) are significant independent predictors of vitamin C plasma concentrations.
In conclusion, these results suggest that adults with a history of smoking, prediabetes or T2DM, and/or obesity have higher vitamin C requirements [84].
Because existing randomized control trials had observed conflicting results of the effects of vitamin C on circulating biomarkers of glycemic and insulin regulation, Ashor AW and colleagues published in 2017 a systematic review and meta-analysis of RCTs testing the effect of vitamin C administration on glucose, HbA1c, and insulin concentrations and on insulin sensitivity. For this meta-analysis, four databases (PubMed, Embase, Scopus, and Cochrane Library) were used to retrieve the studies published up to April 2016 and which verified the effects of supplementation with vitamin C alone (dosage between 72 and 6000 mg per day, with an average of 1000 mg/day) in adults over the age of 18, regardless of their state of health, and/or phenotype. A total of 22 studies were included (16 with parallel design and 6 with crossover design) for a total of 937 participants, with an average age of 49 (range 22–60). Having identified two independent subgroups in two studies, the analysis was ultimately based on a total of 24 studies: 23 described the effects of vitamin C on blood glucose, 9 on insulin, and 10 on HbA1c concentration; 19 studies analyzed fasting glucose, and 4 studies analyzed postprandial glucose. Finally, 13 studies involved subjects with T2DM, 8 studies healthy subjects, 2 studies subjects with 1DM, and 1 study patients with coronary disease. The duration of the various studies ranged from 1 to 120 days (mean of 30 days).
The results showed that, overall, vitamin C did not change glucose, insulin, and HbA1c concentrations. However, a subgroup analysis showed that vitamin C significantly decreased glucose concentrations (−0.44 mmol/L, 95% CI: −0.81, −0.07, p = 0.01) in patients with T2DM, as well as in interventions longer than 30 days (−0.53%, 95% CI: −0.79, −0.10, p = 0.02). The analysis showed a better benefit of vitamin C administration on glycemia in those with a higher baseline BMI and glucose concentration, with the greatest effects in the longer duration studies. As regards insulin concentration, positive effects were observed on fasting values, but not on postprandial ones. The best response was observed in the elderly and in overweight and obese subjects.
In summary, the greatest reduction in glucose concentrations was observed in patients with T2DM, older individuals, and with more prolonged supplementation [87].
In conclusion, personalized vitamin C supplementation could represent a possible future strategy to increase the benefits and effectiveness of interventions. However, the results should be interpreted with caution due to the limitations of the primary studies analyzed.
4.5.4. Vitamin E
The association between oxidative stress and T2DM has been recognized for some time and is based on the observation that hyperglycemia, hyperinsulinemia, and IR can increase the generation of free radicals and, thus, contribute to oxidative stress. Oxidative stress may, in turn, promote the glycation of hemoglobin and impair insulin signalling and secretion by β-cells. It is, therefore, reasonable to hypothesize that antioxidants, such as vitamin E, may have beneficial effects on glycemic control in T2DM.
Observational studies have revealed that higher serum vitamin E concentration, as well as increased intake and supplementation of this vitamin, is associated with beneficial effects on glycemic control in T2DM. However, it is still unclear whether the Vitamin E supplementation has a definite effect on glycemic control. The article published in 2014 by Xu R and colleagues provides a meta-analysis of randomized control trials (conducted in parallel or with a crossover design) on vitamin E with the aim of characterizing its impact on HbA1c values, fasting blood glucose, and fasting insulin. All relevant studies in existence up to April 2013 were reviewed within PubMed, EMBASE, and the Cochrane Library for the analysis. Inclusion criteria required that subjects be adults with T2DM and supplement vitamin E for at least 6 weeks and that this treatment was the only difference with the control groups. A total of 14 randomized control trials were thus selected, involving a total of 714 subjects (including 363 subjects for the vitamin E group and 351 for the control group); 12 studies evaluated the effects on HbA1c, 12 on fasting glucose, 6 on fasting insulin. The range of vitamin E administered was 200 to 1600 IU/day, taken from 6 to 27 weeks.
The meta-analysis results showed that increasing vitamin E supplementation did not lead to significant benefits in glycemic control, as measured by reductions in HbA1c, fasting glucose, and fasting insulin. A subgroup analysis revealed significant reductions in HbA1c (0.58%, 95% CI −0.83 to −0.34) and fasting insulin (−9.0 pmol/L, 95% CI −15.90 to −2.10) versus controls in patients with low baseline vitamin E status. The subgroup analysis also demonstrated that results may have been influenced by vitamin E dosage, study duration, ethnic group, serum HbA1c concentration, and fasting glucose control status [88].
In conclusion, based on the evidence analyzed from the randomized control trials, there is insufficient evidence supporting a potential beneficial effect of vitamin E supplementation on improving HbA1c, fasting glucose, and insulin concentrations in subjects with prediabetes.
4.6. Minerals
Scientific literature has evaluated the intake of some minerals, in particular, zinc, magnesium, selenium, and calcium, on glucose metabolism.
Since zinc is an element capable of influencing glucose homeostasis in animals and humans, a systematic review and meta-analysis of 14 randomized control trials (for a total of 3978 subjects, of which 3298 were healthy, 408 affected by T2DM, 48 with DM1, 48 with DM1 or T2DM, 120 with metabolic syndrome, and 56 obese subjects) evaluated the effect of zinc supplementation on fasting blood glucose, HbA1c, insulin, and blood zinc concentrations. Overall, zinc supplementation (3 to 240 mg/day, median 30 mg/day) was associated with a statistically significant reduction in fasting glucose [98].
A more recent review with a meta-analysis of 32 randomized controlled trials, with a total of 1700 patients from 14 different countries, showed, in the groups treated with zinc supplementation compared to the control groups, a statistically significant reduction in fasting glucose [FG, weight mean difference (WMD): −14.15 mg/dL; 95% CI: −17.36, −10.93 mg/dL], and a homeostasis model assessment for IR (WMD: −0.73; 95% CI: −1.22, −0.24) and HbA1c (WMD: −0.55%; 95% CI: −0.84, −0.27%). In particular, the greatest reductions were observed in subjects already diagnosed with T2DM and in those receiving supplementation with inorganic zinc [99]. The mean dose of elemental zinc used in the studies analyzed was 35 mg/day (range: 4–240 mg/day; mean: 30 mg/day), with a duration ranging from 1 to 12 months. Different anions have been used in the various preparations, including sulphate, gluconate, amino chelate, oxide, and acetate; in five studies, however, the type of anion used was not specified [99].
In conclusion, therefore, zinc-based supplementation could have a potential role as an adjunctive treatment in the prevention and management of prediabetes and T2DM, particularly in subjects who do not reach the RDA in zinc intake.
Moreover, the alterations of selenium homeostasis in the context of an altered glucose metabolism are arousing great interest in the scientific community. It represents a fundamental component of selenic proteins, which play an important role in redox homeostasis, in the metabolism of thyroid hormones, and in the protection from oxidative stress and inflammation. A 2019 study on a population sample from northeast China (189 cases, of which 12 subjects are with IFG, 15 subjects with IGT, 25 patients with DM1, and 137 with T2DM, and 51 healthy controls) highlighted the presence of significantly higher serum Se levels in the IFG group and markedly reduced urinary concentrations in the IGT group. Furthermore, blood Se levels were positively associated with serum Zn in subjects with IFG and IGT, and urinary Se with urinary Zn and Cu in the IGT group alone [91]. Furthermore, the same group of researchers had also investigated serum and urinary Zn and Cu in the same sample, finding significantly higher serum Cu levels in subjects with IFG and IGT, in agreement with the results of Serdar et al. [92].
In conclusion, the results obtained suggest the importance of the further investigation of the role of it in glucose metabolism.
In a 2014 clinical trial, lasting seven years, the association was investigated between the intake of magnesium, assessed using the semi-quantitative food-frequency questionnaire (FFQ), both through foods and through the use of supplements, and the risk of developing IFG (≥5.6 to <7.0 mmol/L), IGT (2 h post-load glucose ≥7.8 to <11.1 mmol/L), IR, or hyperinsulinemia (≥90th percentile of homeostasis model assessment of IR or fasting insulin, respectively) in 2582 participants (55% female), aged 26 to 81, with normal glucometabolic status at baseline. Subjects with the highest magnesium intake (upper quintile: 356–651 mg/day, mean 395 mg/day) showed a 37% lower risk of impaired glucose metabolism than those with the lowest intake (lower quintile range: 101–258 mg/day, mean 236 mg/day) [93]. In line with these results, Kieboom et al., in the context of the population-based Rotterdam Study (8555 participants, mean age 64.7 years; mean follow-up 5.7 years), found that a reduction in serum magnesium levels equal to 0.1 mmol/L is associated with an increased risk of T2DM and prediabetes (understood as IFG) (HR 1.12 [95% CI 1.01, 1.25]), with only 13.4% of the effect of serum magnesium levels mediated by IR [94]. Similar results had already emerged, in 2008, from the study by Guerrero-Romero et al. on 1122 subjects (age 20–65), of which 817 were re-examined after 10 years, in which hypomagnesemia was associated with the development of IGT (relative risk 1.38, 95% confidence interval, 1.1–6.3) and IGT + IFG (1.49, 95% confidence interval, 1.1–4.9), but not with the development of IFG alone [95].
In conclusion, an adequate intake of magnesium can play an important role in the management of glucose metabolism. In case of insufficient dietary intake, in the presence of prediabetes, magnesium supplementation may be useful.
Regarding calcium intake during juvenile-adulthood, a recent 2019 cohort study evaluated its association with the development of IGF (n = 1134, M and F; baseline age between 3 and 18). Baseline dietary calcium intake (assessed by 48 h FFQ), 1019 ± 366 mg/day for females and 1270 ± 514 mg/day for males, as well as long-term mean intake (1181 ± 340 mg/day for females and 1398 ± 424 mg/day for males) were not correlated with the risk of developing impaired glucose metabolism in adulthood [96]. In a double-blind, randomized, controlled clinical trial of 314 healthy adults, however, daily supplementation with 500 mg of calcium citrate and 700 I.U. of vitamin D for three years was associated with a smaller increase in fasting glucose than placebo (0.02 mmol/L [0.4 mg/dL] vs. 0.34 mmol/L [6.1 mg/dL], respectively, p = 0.042) and HOMA-IR (0.05 vs. 0.91, p = 0.031) in participants with baseline IFG (n = 92) [89]. In conclusion, the results of this study demonstrated that, in healthy, older adults with IFG, supplementation with calcium and vitamin D (500 mg of calcium citrate and 700 IU of vitamin D) may attenuate increases in glycemia and IR that occur over time.
In conclusion, if dietary calcium intake is not adequate, it is useful to suggest calcium supplementation (500 mg/day) to subjects with prediabetes.
Another mineral, whose defect appears to be associated with IFG and dyslipidemia, is chromium: in 130 male patients with a history of myocardial infarction and 130 controls, serum chromium was inversely correlated with blood glucose values in both cases and in controls (r = −0.189, p < 0.05 and r = −0.354, p < 0.00001, respectively) [97]. However, a 2002 systematic review and meta-analysis involving 15 randomized clinical trials involving a total of 618 participants, 193 of whom had T2DM and 425 were healthy or found to have IGT, found no relationship between the concentration of chromium and that of glucose and insulin in non-diabetic subjects [100]. On the other hand, with reference to the effects of a daily supplementation with chromium picolinate, a randomized, controlled, double-blind, cross-over clinical trial examined the effects of a six-month supplementation with chromium picolinate (500 or 1000 mcg/day) versus placebo in 59 subjects with IFG, IGT, or metabolic syndrome. The authors found no changes in fasting and 2 h oral glucose levels, insulin levels, and HOMA-IR [90]. A 2010 review did not reveal any significant improvement in glucose metabolism either in patients with metabolic syndrome or in subjects with IGT [101].
In conclusion, there are inadequate data to recommend chromium supplementation in patients with prediabetes.
4.7. Osteoporosis
The scientific literature has been studying the correlation between T2DM and osteoporosis for some time.
Paschou and colleagues aimed at reviewing the updated information on osteoporosis and fracture risk in patients with T2DM. They discussed the effects of T2DM treatment on bone metabolism, as well as the effect of anti-osteoporotic drugs on T2DM incidence and control, while providing personalized guidance for the optimal management of these pathologies. Their “guide to optimal management” was published in 2017. To this purpose, the scientific literature (human studies) existing up to 2017 was reviewed, and a classification system as defined by the American College of Physicians was adopted for the recommendations.
In summary, the results showed that both a healthy diet and physical exercise are very important for the prevention and treatment of both pathologies [201].
As Ferrari and colleagues also state in a review published in 2018, fragility fractures are increasingly recognized as a complication of both type 1 and T2DM, with the risk of fracture increasing with disease duration and poor glycemic control. Since the identification and management of fracture risk in these patients is challenging, the review investigated the clinical features of bone fragility in adults with T2DM to find evidence in the literature and studies evaluating parameters such as bone mineral density (BMD), bone microstructure and material properties, biochemical markers, and fracture prediction algorithms (e.g., FRAX) in these patients. Furthermore, the impact of T2DM drugs on bone and the efficacy of osteoporosis treatments in this population were examined and, eventually, an algorithm was proposed by the authors for the identification and management of diabetic patients at an increased risk of fracture.
With regard to T2DM, an increased risk of fracture was reported in some of the studies analyzed in the review, but not in others. In a middle-aged population of 33,000 people, T2DM was the strongest predictor of low-energy fracture in both men and women, with relative risks of 2.38 and 1.87, respectively. In a meta-analysis of patients with T2DM, the relative risk of hip fractures in men was 2.8 and, in women, it was 2.1.
With an OR of approximately 1.5 for osteoporotic fractures in patients with T2DM, only approximately 4% of the overall osteoporotic fracture burden is statistically attributable to T2DM. However, considering the increasing prevalence of T2DM and the fact that the condition itself may also be associated with an increased risk of falls (with damage), fragility fractures increasingly appear as a serious but overlooked complication of this disease. Nonetheless, the link between T2DM and skeletal health receives only cursory attention in osteoporosis guidelines and even less in clinical T2DM guidelines [202].
Finally, this year, Liu Y. and colleagues published a multistage cross-sectional study to investigate the effects of sarcopenia, osteoporosis, and osteopenia on spine fractures in prediabetic patients by collecting and analyzing data from the U.S. National Health and Nutrition Examination Surveys from 2009 to 2018. A total of 23,825 subjects were included in the study, including 7427 with prediabetic youth. Bone mineral density and skeletal muscle mass index (SMI) information were measured with DXA. The diagnosis of vertebral fracture was based on DXA results and history.
As for bone health, the results showed that the lumbar and spinal bone mineral density of the prediabetes group was lower than in the healthy group, while there were no differences between diabetic and healthy subjects (this is probably explained by the fact that the diabetic group was overweight). The prevalence of osteoporosis was higher in diabetics than in prediabetics, and higher in the latter than in healthy subjects. The same was true for the prevalence of spinal fractures among the three groups. The SMI trend was also higher in the diabetic group than in the prediabetic group and in the prediabetic group than in the healthy group, probably again due to the excessive weight of the subjects of these two groups. By adding data related to some variables, namely, age, sex, race, BMI, etc., it can be stated that prediabetes is not an independent risk factor for osteoporosis since there was no significant increase in osteoporosis among subjects with prediabetes (OR 0.91, 95% CI 0.78–1.05). For fracture risk, the results showed that sarcopenia is not an independent risk factor for vertebral fractures in the prediabetic population, whereas osteoporosis and osteopenia are. But, adjusting for variables, both sarcopenia and osteoporosis were positively associated with vertebral fractures in all subject groups (OR 4.44, 95% CI 1.76–11.21, and OR 2.90, 95% CI 1.85–4.56, respectively), with a higher prevalence in osteosarcopenia sufferers (OR 6.63; 95% CI, 1.34–2.94) compared to those affected only by sarcopenia or osteoporosis. In conclusion and summary, both sarcopenia and osteoporosis are risk factors for spine fracture in prediabetic adults, and the combination of sarcopenia and osteoporosis further increases the prevalence of spine fracture [102].
In conclusion, from the various studies and scientific evidence, the link between prediabetes and osteoporosis has been known for years, understood as an increased risk of experiencing a decreased bone mineral density and, therefore, an increased risk of fracture in this population. The causes of this link are not entirely clear but there are many possible factors at play: from pathophysiological ones such as microangiopathy at the bone tissue level, discussed as a possible cause of diabetic osteopenia, to molecular ones (it has been demonstrated that insulin, IGF-1 and IGF-2, cytokines, and hormones have an influence on bone metabolism itself such as determining changes in the bone metabolism of subjects with glycemic imbalances). It is, therefore, evident how important the prevention of a chronic and progressive pathology such as osteoporosis is, also, and above all in this population of subjects. The latter have to undergo a regular monitoring of bone mineral density and patient management procedures that include the right tests and correct calcium and vitamin D supplements.
4.8. Fruits and Vegetables
The relationship between fruit and vegetable consumption and prediabetes has been investigated by numerous studies.
In a Swedish court study [103] in which 6961 men and women aged between 35 and 56 were enrolled, the relationship was studied between lifestyle, in particular, fruit and vegetable consumption, and the incidence of prediabetes and T2DM during the mean follow-up of 20 years. During the follow-up, 1024 patients developed T2DM and 870 a prediabetic condition. An inverse relationship was seen between fruit and vegetable consumption and the development of a dysglycemia condition with an HR of 0.76 (95% CI 0.58–1.00). In the analysis of the subtypes, an increased incidence of T2DM was noted in those who consume banana, cabbage, and tomato, while a reduction in the incidence was noted with the consumption of apples and pears.
In the study by Li et al. [104], the court in question consisted of 79,922 patients aged over 40 years and the information regarding fruit consumption was collected on the basis of administered questionnaires. Baseline and 2 h post-load glucose measurements were measured at baseline and during follow-up. During an average follow-up of about four years, 7.36% of the participants developed T2DM. Overall, a trend was noted whereby the risk of T2DM decreases (every 100 g more per day corresponds to 2.8% less risk) as the intake of fruit increases. This risk especially decreased in normoglycemic patients in whom the consumption of more than seven portions of fruit per week decreased the risk of developing T2DM by 48%. On the other hand, fruit consumption did not lead to a reduction in the risk of progression towards a frank condition of T2DM in patients already in a prediabetic situation.
Another Chinese cross-sectional study [105] involved 6802 participants between 18 and 65 years old. The correlation between fruit and vegetable consumption and the development of T2DM was seen to be positive when analyzing the female sample, while this relationship was not found in the male sample. If the risk of prediabetes is assessed, however, this relationship is valid for both sexes, especially males. A reduction in the risk of prediabetes was seen with a consumption of fruit and vegetables corresponding to the third and fourth quartile, i.e., between 320 and 530 g (including the weight of vegetables + fruit/day).
Zhang’s study [106] looked at fiber intake and the risk of prediabetes among Chinese adults. The prospective study involved 18,085 participants who—at baseline—had neither T2DM nor prediabetes or other CVDs nor cancer. In the follow-up period, 63,175 person/years, 4139 cases of T2DM occurred. The amount of fiber was quantified in the study as weight per 1000 Kcal introduced. The population under examination was divided into quartiles, in which the third and fourth quartiles introduced 12.7 g/1000 Kcal and 19.2 g/1000 Kcal of fibers, respectively. The results were that fiber intake was inversely related to the incidence of prediabetes. The study also demonstrated that the type of fiber that was found to be most effective in preventing prediabetes is soluble fiber, mostly found in fruit and vegetables.
In addition to fibers, the literature has shown that the polyphenols contained in fruit and vegetables can play a fundamental role in glycemic control.
A 2017 narrative review summarized the evidence from clinical and prospective observational studies linking dietary polyphenols to prediabetes and T2DM, with particular attention to foods rich in polyphenols, characteristic of the Mediterranean diet. In addition, metabolic biomarkers related to polyphenol intake and genotype–polyphenol interactions that modulate the effects on T2DM have been described. Dietary polyphenols come primarily from plant-based foods including fruits, vegetables, whole grains, coffee, tea, and nuts. Polyphenols may affect blood sugar and T2DM through several mechanisms, such as promoting glucose uptake into tissues and thereby improving insulin sensitivity. The intake of polyphenols, particularly flavan-3-ols, and their dietary sources have demonstrated beneficial effects on IR and other cardiometabolic risk factors. Several prospective studies have shown inverse associations between polyphenol intake and T2DM. The Mediterranean diet and its key components—olive oil, nuts, and red wine—have been inversely associated with IR and T2DM. To some extent, these associations can be attributed to the high amount of polyphenols and bioactive compounds in typical foods conforming to this traditional dietary pattern. Few studies have suggested that genetic predisposition may modulate the relationship between polyphenols and T2DM risk. In conclusion, polyphenol intake may be beneficial for both IR and T2DM risk [197].
Even the intake of magnesium, which fruits and vegetables are rich in, especially green leafy vegetables, can play an important role in controlling glucose metabolism. Animal studies have shown that a low-magnesium diet can lead to impaired insulin secretion and action [203].
Moreover, magnesium is an essential cofactor for multiple enzymes involved in glucose metabolism and has been discovered to play a role in the development of T2DM [108,204].
Studies in humans also suggest a significant inverse association between magnesium intake and T2DM risk and supports the dietary recommendation to increase consumption of major food sources of magnesium, such as whole grains, nuts, and green leafy vegetables.
In a study that followed 85,060 women and 42,872 men, magnesium intake was evaluated using a validated food-frequency questionnaire every 2–4 years. After 18 years of follow-up in women and 12 years in men, the study documented 4085 and 1333 incident cases of T2DM, respectively. After adjusting for age, BMI, physical activity, family history of T2DM, smoking, alcohol consumption, and history of hypertension and hypercholesterolemia at baseline, the relative risk (RR) of T2DM was 0.66 (95% CI 0.60–0.73; p for trend < 0.001) in women and 0.67 (0.56–0.80; p for trend < 0.001) in men, comparing the highest with the lowest quintile of total magnesium intake. The results of this study confirmed the inverse association between magnesium intake and T2DM risk [107].
Moreover, as regards green leafy vegetables, a meta-analysis demonstrated that, for green leafy vegetables, the summary relative risk of T2DM for an increase of 0.2 serving consumed/day was 0.87 (95% CI 0.81 to 0.93) without heterogeneity among studies (p = 0.496, I2 = 0%), confirming that high green leafy vegetable intake is associated with a significantly reduced risk of T2DM [108].
Moreover, in the systematic review by Banaszak [205], it emerges that people who adopt a vegetarian diet have better blood parameters: glucose, insulin, total and LDL cholesterol, and the resulting HOMA IR. These subjects have a higher consumption of fruit and vegetables on average than omnivores.
In conclusion, all the studies found that a consumption of fruit (particularly pears and apples) and vegetables equal to an average of 500 g per day led to a reduction in the development of prediabetes and T2DM. This result can be explained both by the supply of fibers, especially soluble, and water, and by the presence of micronutrients such as vitamins and minerals, especially magnesium, and polyphenols, present in fruit and vegetables.
4.9. Nuts
Numerous studies have evaluated the correlation between the intake of nuts (rich in unsaturated fatty acids, fibers, antioxidant vitamins, minerals, and other bioactive compounds), and prediabetes.
The randomized clinical study with two parallel arms by Gulati et al. [109] in which the effects of a dose of 20 g of almonds before lunch and dinner was evaluated over three months. Sixty-six participants with prediabetes in the range of 18–60 years were enrolled; thirty patients per arm completed the study. In the blood parameters in the group with almonds, there was a reduction in the HOMA IR index, total cholesterol, and LDL cholesterol. Above all, a reduction in the normoglycemic state was seen in 23.3% of participants, a reduction comparable to the efficacy with a treatment with acarbose. The intake of almonds before main meals would, therefore, seem to help in the prevention of the evolution from prediabetes to frank T2DM.
In the randomized parallel group study by Cascas et al. [110], 50 patients with metabolic syndrome were instructed to consume 30 g of dried fruit per day (15 g walnuts, 7.5 g almonds, and 7.5 g hazelnuts). The nut group reduced fasting insulin by 2.60 μU/mL (95% CI, −4.62 to −0.59) and HOMA by 0.72 (−1.28 to −0.16) (p < 0.05). Among inflammatory markers, IL6 levels decreased by 1.1 ng/mL (−2.7 to −0.1; p = 0.035), although, adjusting for weight loss, the correlation was attenuated.
In the study by Hou et al. [111], the effect of peanuts and almonds in the context of a low-carbohydrate diet on cardiometabolic and inflammatory parameters in patients with T2DM was compared. A total of 32 patients were recruited, of which 17 were assigned to the peanut group and 15 to the almond group in a parallel study. Over the three-month follow-up period, there were significant pre–post changes in fasting and postprandial blood glucose (p < 0.05). The HbA1c value was reduced in the almond group (p < 0.05). Consumption of peanuts and almonds did not increase BMI and had no effect on plasma lipid levels or interleukin-6.
In the randomized parallel group study by Wien et al. [112], 65 people with prediabetes were recruited. The dietary intervention lasted 16 weeks in which the almond intake was approximately 20% of the daily caloric intake, approximately 60 g/day.
The intervention group showed both a reduction in insulin (−1.78 µU/mL vs. +1.47 µU/mL, p = 0.002), HOMA IR (−0.48 vs. +0.30, p = 0.007), and HOMA 2B (−13.2 vs. +22.3, p = 0.001) compared with the control group without almonds. LDL decreased (−12.4 mg/dL vs. −0.4 mg/dL). There were no changes in BMI (−0.4 vs. −0.7 kg/m2, p = 0.191), systolic blood pressure (−4.4 mm Hg vs. −3.5 mm Hg, p = 0.773), or other cardiovascular risks.
Studies have also been conducted in which food products with nuts, such as bars, were used. For example, in the randomized crossover study by Lu et al. [113], the postprandial glycemic response was evaluated from 0 to 120 min after the ingestion of a nut-based, high-protein snack bar or an isocaloric bar containing more carbohydrates. The bar used contained a caloric quantity of about 1000 KJ. Ten overweight Chinese men with a mean age of 47.9 years and a mean BMI of 25.5 with the presence of abundant pancreatic and hepatic ectopic fat tissue assessed using DEXA and MRI were enrolled in the study. In the patients who received the bar rich in dried fruit, there was a reduction in blood sugar (p < 0⋅05) in the 30–120 min after ingestion of both the bar alone and the bar associated with 50 g of white bread (a food that normally raises blood sugar), with an area under the glycemic curve 10 times lower.
It has been hypothesized that some polyphenols contained in dried fruit, in particular, ellagic acid, may be the substances that counterbalance lipoinflammation and are involved in glucose control. In fact, as shown by the review by Guasch Ferrè et al., polyphenols promote glucose uptake in the tissues and increase insulin sensitivity [197].
In the review by Kang et al. [206], the mechanisms involved in the metabolic benefit of ellagic acid are discussed in detail, in particular, its role as an epigenetic and intestinal microbiota regulator. It is mainly contained in raspberries, strawberries, apples, walnuts, and pecans. Ellagic acid may be a promising strategy to ameliorate obesity-related metabolic complications, independent of weight loss.
In conclusion, the consumption of dried fruit—in the average dose of 30 g per day—was protective against IR, IFG, and HbA1c. Some studies show a reduction in inflammatory markers, but more studies are needed to establish the correlation between nuts and levels of pro-inflammatory cytokines, such as IL6. It has been hypothesized that some polyphenols contained in dried fruit, such as ellagic acid, may be the substances that counterbalance lipoinflammation and are involved in glucose control.
4.10. Hydration
4.10.1. Plain Water
Proper hydration plays a crucial role in preventing or influencing the evolution of prediabetes into T2DM.
In 2015, Carroll and colleagues published a cross-sectional study with the aim of investigating the correlation between water intake and risk of developing T2DM in an adult population in the United Kingdom. The authors hypothesized that a higher water intake could be associated with a lower risk of T2DM.
The survey evaluated—in 138 adult subjects—the risk of T2DM, blood pressure, fruit and vegetable intake, and beverage intake. The T2DM risk score was calculated using the Diabetes UK risk assessment tool validated for use in the UK. This tool measures seven key risk factors for T2DM: age, gender, body mass index (BMI), waist circumference, ethnicity, family history of first-degree T2DM, and use of antihypertensive medications/history of hypertension.
Dietary variables were assessed using a food-frequency questionnaire (FFQ). The FFQ investigated the consumption trends over the previous seven days and only fruit and vegetables were measured in terms of diet. From a list of 38 fruits and vegetables, participants were asked to indicate their average intake (“never”, “once”, “2–4 times”, “5–6 times”, “once a day”, “2–3 a day”, “4–5 a day”, or “6+ times a day”). Since fizzy water was not included in the original FFQ, it was added to the survey in the same format as other beverages. Water was measured in beakers and an information card indicated that 1 beaker equaled 240 mL (standard measure). Participants were asked to report their average intake of a variety of beverages (including, but not limited to, alcoholic, caffeinated, sweetened, and artificially sweetened beverages) in the previous seven days. The FFQ, therefore, made it possible to evaluate the average daily intake of still water and the total average intake of drinks and fruit and vegetables (portions/day).
The results, confirming the authors’ hypothesis, showed that water intake was negatively correlated with the risk of developing T2DM, since those who consumed greater quantities of plain water showed a lower risk. A clear trend of low water consumption emerged in groups classified as being at a high risk for T2DM. Total beverage intake was not associated with risk of T2DM, and no significant differences in total intake were observed between risk groups. Finally, the analyses showed that each 240 mL portion of water drunk per day was associated with a 0.72-point decrease in the risk of T2DM. With the mean daily water intake of 567 mL, the mean risk reduction in each participant was 1.7 points.
In conclusion, although no significant differences were found in water intake between the various risk groups, a negative correlation was observed between water intake and risk score: an increased risk of T2DM was, in fact, associated with a lower water intake, confirming the hypothesis of Harriet A. Carroll and colleagues and suggesting that water intake may play a significant role in the development and prevention of T2DM [114].
In 2016, Carroll and colleagues also published another cross-sectional study, conducted from 2008 to 2012, on a total of 456 men and 579 women with an average age of 44 years. The aim of the study was to analyze the association between simple water intake and the HbA1c trend in the National Diet and Nutrition Survey (2008–2012) rolling survey. The data collected include a four-day food diary and HbA1c values from blood sampling. The analyses used linear and logistic regressions stratified by gender while modelling the association of still water intake per day (240 mL) with HbA1c and probabilities of HbA1c ≥ 5–5%, respectively. Sugary drinks, fruit juices, and artificially sweetened drinks have been transformed with modelling systems into still water.
After adjustment, 1 glass/day of water was found to be associated with a reduction in HbA1c of 0–4% (95% CI 0–7, 0–2) in men, and, in logistic regression, men had a 22% (95% CI 10.32%) reduced chance of HbA1c ≥ 5–5%/day cup of plain water. There was no evidence of an association with HbA1c or odds of HbA1c ≥ 5–5% in women. None of the substitution models was associated with a change in HbA1c probabilities ≥ 5–5%. Still water intake was associated with lower HbA1c in men but not in women. Replacing water with specific beverages was not associated with a reduction in the odds of HbA1c ≥ 5–5%, suggesting that adding water is more relevant [115].
The mechanisms that potentially associate a greater intake of water with better glycemic control can be summarized as follows: surely, the consumption of water represents an indicator of a healthy lifestyle, especially if it is associated with physical activity and a diet including a reduced intake of sugars and more healthy food. Furthermore, still water intake is arguably linked to an increase in satiety, which leads to a potential reduction in energy expenditure. These factors contribute to improving blood sugar both indirectly (through weight stability) and directly (through lower and/or lower blood glucose concentration peaks). The ingestion of water also contributes to hydration and, thus, to the reduction of arginine vasopressin secretion (the hormone that regulates blood pressure and which plays an important role in glycemic control) and to the increase in plasma volume (consequently, decreasing the concentration plasma glucose), both of which influence glucose homeostasis.
In summary, in the first study published by Harriet A. Carroll and colleagues in 2015, an increased risk of T2DM was observed where there was a lower water intake, suggesting the potential positive impact of a good water intake on the risk of developing T2DM. In the second study of 2016 it was observed that, in the male population examined, 1 glass/day of water was associated with a reduction in HbA1c of 0–4% and, in the logistic regression, men always had a reduced probability of 22% (95% CI 10.32%) HbA1c ≥ 5–5% for each daily cup of plain water consumed.
In conclusion, following what has been reported in the literature, it can be stated that not only does water appear to be an essential element for normal metabolism, but it can also be specifically associated with a reduction in the risk of T2DM and, therefore, make it clear how important the intake of simple water and the right hydration are in both the prevention and influence on the evolution of prediabetes into T2DM.
Given what is reported on calcium intake in the above chapter on minerals and on the relationship between osteoporosis and T2DM, it could be interesting to advise people with prediabetes to drink mineral waters rich in calcium.
The consumption of 2 L of calcium-rich mineral water (when the calcium content is higher than 150 mg/L) is useful for reaching the calcium daily requirements because it is a valuable source of highly bio-available calcium.
4.10.2. Sugary Beverages
As regards the correlation between the consumption of sugary beverages (SSB) and the onset of T2DM, there are several studies in the literature concerning both young people and adults.
Duke published a cohort study in 2021 to examine the relationships between sugary beverage (SSB) intake and reported prediabetes in US adolescents. Sugar-sweetened drinks are marketed in different forms, including nondiet pop or soda, flavored juice drinks, sports drinks, sweetened coffee and tea, coffee drinks, energy drinks, and electrolyte-replacement solutions. A variety of sugars may be added to sweeten these beverages as they are processed (e.g., brown sugar, corn sweetener, corn syrup, fructose, high fructose corn syrup, honey, molasses, raw sugar, and sucrose) [207].
The Duke cohort study analyzed data coming from a 2019 Minnesota student survey (N = 125,375). We used logistic regression to examine the relationships between SSB intake frequencies and youth-reported prediabetes in analytical models while adjusting for demographic and other cardiometabolic indicators. Further analyses examined the relationships between fruit juice, milk, and water consumption, and prediabetes.
The results showed that 1 in 4 adolescents reported consuming at least one SHW per day. In adjusted models, a range of SSB intake frequencies were significantly associated with increased odds of prediabetes. However, all frequencies of water intake were associated with a reduction in the odds of prediabetes.
We therefore conclude that efforts to reduce SSB intake among adolescents are warranted in order to support cardiometabolic health. The results of the study are consistent with the current guidelines that indicate water as the preferred drink for adolescents’ hydration needs, regardless of whether or not they are at risk of developing metabolic problems [207].
The risk of T2DM associated with SSB intake was also quantified among adults. Using the results from three large US prospective cohorts of women and men, Drouin-Chartier et al. found that an increase of sugary beverage intake by more than 0.5 servings per day was associated with a 16% higher risk of T2DM over a subsequent four-year period. Additionally, replacing a daily serving of SHW with water, coffee/tea (the amount of sugar and dairy was not measured), or skim milk (0–2%) was associated with a reduction in the risk of T2DM by 2–10%.
In the study published in 2019 by Drouin-Chartier et al., we investigated the association between long-term changes due to the consumption of sugary drinks (including 100% fruit juices) and drinks containing artificial sweeteners (ASBs), together with the consequent risk of T2DM.
The three large prospective studies analyzed by the authors followed 76,531 women in the Nurses’ Health Study (1986–2012), 81,597 women in the Nurses’ Health Study II (1991–2013), and 34,224 men in the Health Professionals’ Follow-up Study (1986–2012). Changes in beverage consumption (i.e., eight-ounce servings per day) were calculated via food-frequency questionnaires administered to subjects every four years. Multivariable Cox proportional regression models were used to calculate hazard ratios for T2DM associated with changes in beverage consumption. The results of the three cohorts were pooled using a meta-analysis.
During 2,783,210 person-years of follow-up, the authors documented 11,906 incident cases of T2DM. After adjusting for BMI and initial and final covariates of dietary and lifestyle changes, an increase in the total consumption of sugar-sweetened beverages (including both sugar-sweetened beverages and 100% fruit juices) by >0.5 servings per day over four years was associated with a 16% (95% CI 1%, 34%) higher risk of T2DM in the following four years. An increase in ASB consumption by >0.5 servings per day was associated with an 18% (2%, 36%) higher risk of T2DM. Replacing a daily serving of sugary drinks with water, coffee, or tea—no ASBs—was associated with a 2–10% lower risk of T2DM.
The conclusions of the study are that an increased consumption of sugary drinks or ASBs was associated with a higher risk of T2DM, although the latter association may be influenced by reverse causality and surveillance biases [119].
Another interesting topic is considering non-sugar sweeteners (NSSs), such as acesulfame potassium, aspartame, saccharin, sucralose, steviol glycosides, cyclamate, neotame, advantame, and luo han guo, that are widely used to replace added sugars in the diet; the studies on the association between their use and blood glucose control in patients with alterations of glucose metabolism are inconclusive. Moreover, all the studies were conducted on diabetic subjects and the position papers are also dedicated exclusively to diabetic subjects and not to subjects with prediabetes. In two RCTs, conducted in 52 subjects, levels of fasting blood glucose were 0.16 mmol/L lower in the groups receiving aspartame or a combination of NSSs than in groups receiving sugar (95% confidence interval −0.26 to −0.06); no differences were observed in plasma insulin levels or in insulin resistance and β-cell function as measured by the homoeostatic model assessment of insulin resistance [116,117]. On the contrary, as reported by a systematic review and meta-analyses, observational studies showed that consuming NSS had long-term negative effects, such as an increased risk of overweight, and type 2 diabetes [120].
Recently, a new guideline from the World Health Organization (WHO) advises against using NSSs to regulate weight or prevent non-communicable diseases [121]. Unfortunately, individuals with diabetes, who frequently utilize NSSs as a means of preserving glycemic control, were not given any advice by the WHO guideline [118]. According to the American Diabetes Association’s (ADA) 2023 standards of care for people with diabetes, when consumed in moderation, NSSs may be a suitable substitute for sugar-sweetened products. The standards also suggest that NSSs do not appear to have a significant impact on glycemic control, though it is unclear how they will affect weight management. But the ADA’s recommendations are also based on studies that did not look at every kind of non-sugar sweetener (acesulfame potassium, which is commonly present in foods and beverages, was not studied) [122]. The Academy of Nutrition and Dietetics practice guidelines for adults with type 1 and type 2 diabetes examined individual types of NSSs for managing glycemia in adults with diabetes, despite the lack of long-term studies; the report concluded that adults with diabetes should be informed that intake of aspartame, sucralose, and steviol glycosides, within the acceptable daily intake (ADI) levels, will not have a significant influence on glycemic control; however, studies that looked at the effects of saccharin, acesulfame potassium, and neotame intake on glycemic outcomes in this population were not included [123].
In conclusion, as reported by Hedrick [124], considering the intake of non-sugar sweeteners, the lack of specificity in studying NSS, the discrepancies in the findings of observational versus randomized controlled trials, the fact that NSSs are heterogeneous compounds that may affect different metabolic pathways with various impacts on health, and other methodological aspects, make it difficult to draw firm conclusive recommendations for or against the use of NSSs in a specific population subgroup such as prediabetes subjects.
In conclusion, these studies agree in confirming the hypothesis that there is a close correlation—in both young people and adults—between the consumption of SSBs and the development of T2DM, while reiterating how higher frequencies of water intake have instead been associated with a reduction in the odds of prediabetes.
4.11. Alcohol
As far as red wine is concerned, there are studies showing that red wine consumption can be beneficial in certain quantities. Wine can be beneficial as it contains some bioactive compounds such as polyphenols (anthocyanins, flavones, alkyphenols, phenolic acids, lignans, and stilbenes) [208,209].
Polyphenols may influence glycemia and T2DM through different mechanisms, such as promoting the uptake of glucose in tissues, therefore improving insulin sensitivity, as reported in a narrative review by Guash-Ferre [197].
The meta-analysis by Bajunas et al. [131] included 20 cohort studies that compared the relative risk of developing T2DM for both men and women in response to the introduction of red wine every day. The study showed that both men and women had a lower relative risk of developing prediabetes than those who did not consume it and those who consumed more than 50 g in women and 60 g in men. The risk-lowering consumption is 22 g of ethanol in men and 24 g in women.
In the case–control study by Rochitte et al. [126], two groups of people were retrospectively compared, 101 people drinking red wine and 104 with complete abstinence from alcohol. The 205 people are healthy males between the ages of 50 and 75. The group that drank red wine consumed one glass a day for 4–5 days a week for at least 5 years before the analyses. FPG was lower among wine drinkers than non-drinkers (97.6 ± 18.2 vs. 118.4 ± 29.6 mg/dL; p < 0.02) and, thus, HDL cholesterol was higher in wine drinkers (46.9 ± 10.9 vs. 39.5 ± 9.0 mg/dL; p < 0.001). In retrospect, it is, therefore, possible to understand that the habit of drinking one glass of red wine a day has led to better glycometabolic parameters.
In the prospective cohort study by Blomster et al. [127], during an average follow-up of 5 years, a cohort of 11,140 people with T2DM was studied and 3389 of these took alcohol. Participants were determined to be eligible for the study with an age over 55 years, if they were diagnosed with T2DM after 30 years of age, and had a history of major macro- or micro-vascular complication. The women enrolled who consumed alcohol were 593 or 17% of the drinking group. Those who consumed moderate alcohol (less than 21 units of alcohol per week in men and less than 14 units of alcohol per week for women) saw a reduction in cardiovascular events (adjusted hazard ratio [aHR] 0.83; 95% CI 0.72 −0.95; p = 0.008), fewer micro-vascular complications (aHR 0.85; 95% CI 0.73–0.99; p = 0.03), and a reduced all-cause mortality (aHR 0.87; 96% CI 0.75–1.00; p = 0.05). These benefits were seen in people who drank mostly red wine.
In the two-year randomized clinical trial by Gepner et al. [125], 224 subjects were assigned to one of three groups: the first group was assigned to drink 150 mL of mineral water at dinner, the second group was assigned 150 mL of white wine, and the third group was assigned 150 mL of red wine for two years. Calorie and carbohydrate consumption between the various groups was comparable. The red wine group increased (HDL-C) by 2.0 mg/dL (95% CI, 0.04 to 0.06 mmol/L [1.6 to 2.2 mg/dL]; p < 0.001), apolipoprotein A1 by 0.03 g/L (CI, 0.01 to 0.06 g/L; p = 0.05), and decreased the ratio of total cholesterol to HDL by 0.27 (CI, −0.52 to −0.01; p = 0.039). No differences were seen in blood pressure, adiposity, liver function, drug therapy, symptoms, or quality of life in the three groups. Sleep quality improved in the wine drinking groups. Overall, the group consuming one glass of red wine per day reduced the number of positive parameters for diagnosing metabolic syndrome by 0.34 (CI, −0.68 to −0.001; p = 0.049).
Conversely, alcohol abuse led to an increased risk of prediabetes.
In the study by Li et al. [128], the aim was to examine the association between the average consumption of alcohol with the incidence of T2DM or with a condition of dysglycemia and to note associations with the polymorphism of the genes coding for aldehyde dehydrogenase (ALDH2) and alcohol dehydrogenase (ADH1B). The participating patients were all older than 50 years: 15,726 participants were without T2DM; 11,232 were without T2DM and without IFG. Of these, 1624 patients corresponding to 10.33% developed T2DM, and 1004 (8.94%) developed IFG during the four-year follow-up. Adjusting for other confounders, occasional or moderate alcohol use was not associated with the risk of hyperglycemia (IFG + T2DM) (odds ratio (OR) = 1.10, 95% confidence interval (CI) 0.95–1.27, and 0.90 (0.69–1.18), respectively), while high consumption increased the incidence of dysglycemia (T2DM + IFG) (OR = 1.82, 95% CI 1.24–2.68). No interactions of sex, BMI, and ADH1B/ALDH2 genetic polymorphisms were seen. In the 2011 study by Cullman et al. [129] a different behavior of alcohol emerged in the two sexes. This cohort study analyzed 2070 men and 3058 women with normoglycemia and 70 men and 41 women with prediabetes. Total alcohol consumption and binge drinking increased the risk of prediabetes and T2DM in men (OR 1.42, 95% CI 1.00–2.03 and OR 1.67, 95% CI 1.11–2.50, respectively), while low consumption reduced the risk of T2DM in women (OR 0.41, 95% CI 0.22–0.79). Men had a higher risk of prediabetes with a high beer consumption (OR 1.84, 95% CI 1.13–3.01) and T2DM with a high alcohol consumption (OR 2.03, 95% CI 1.27–3.24). Women showed a reduced risk of prediabetes, with a high wine consumption (OR 0.66, 95% CI 0.43–0.99), and T2DM, with medium consumption of both wine and spirits (OR 0.46, 95% CI 0.24–0.88 and OR 0.55, 95% CI 0.31–0.97, respectively), while heavy alcohol consumption increased the prediabetes risk (OR 2.41, 95% CI 1.47–3.96).
In the cross-sectional analytical study by Suebsamran et al. [130], a relationship was seen between alcohol consumption and prediabetes. The total 383,442 patients enrolled were divided into six different groups based on the amount of alcohol consumed. The prevalence of prediabetes was 10.5% (11.2% and 9.7% in men and women, respectively). After adjustment for other risk factors, alcohol consumption was independently associated with prediabetes, with a dose–response relationship (adjusted odds ratio (OR of 1.80, 95% CI 1.53–2.11, p < 0.001 and 1.47, 95% CI 1.28–1.68, p < 0.001) for those who drank alcohol daily and 3–4 times a week, compared with non-drinkers), but those who drank 1–2 times/month had a reduced risk of prediabetes (OR = 0.89, 95% CI, 0.82–0.97, p = 0.006). Similar results were seen for men. Women who drank occasionally had a significantly reduced risk of prediabetes, compared with women who did not drink (OR 0.95, 95% CI 0.91–0.99, p = 0.039). In the study, it is clear that alcohol consumption increases the risk of prediabetes in a dose-dependent manner, although sporadic consumption seems to decrease the incidence.
Based on the literature reviewed, it can be stated that there is no safe dose of alcohol. It has been seen that the condition of prediabetes acts synergistically with alcohol in increasing the risk of pancreatic and biliary tree tumors and stroke, especially in geriatric patients. Drinking alcohol in a condition of dysglycemia leads to a more rapid progression to a condition of frank T2DM in a dose-dependent manner. Occasional consumption (one or two times a month) has been shown to be safe in some studies.
In conclusion, the analysis of the literature shows that the consumption of 1 glass of red wine a day during a meal was found to be protective in prediabetes and reduce the risk of disease progression and macro-vascular and micro-vascular complications of diabetic disease. The risk-lowering consumption is 22 g of ethanol in men and 24 g in women. The beneficial effect would seem to be elicited by the various polyphenolic compounds present in red wine. Polyphenols may influence glycemia and T2DM through different mechanisms, such as promoting the uptake of glucose in tissues, and, therefore, improving insulin sensitivity. Conversely, alcohol abuse leads to an increased risk of prediabetes.
4.12. Coffee
Coffee is one of the most consumed beverages in the world. It is commonly taken in roasted coffee form and, as such, it represents a complex blend of over 1000 bioactive compounds, some with potentially therapeutic antioxidant, anti-inflammatory, or anticancer effects. The main active compounds include caffeine, chlorogenic acids, and diterpenes cafestol and kahweol [135].
A systematic review and a dose–response meta-analysis by Ding demonstrated that coffee consumption was consistently associated with a lower risk of T2DM [136].
Specifically, compared with no coffee consumption, the results of this systematic review and meta-analysis, based on 1,109,272 study participants and 45,335 T2DM cases, demonstrate that consuming six cups of coffee per day was associated with a 33% lower risk of T2DM. Consumption of caffeinated coffee and decaffeinated coffee was both associated with a lower risk of T2DM. The association between coffee consumption and T2DM risk was consistent for men and women and for European, US, and Asian populations. A total of 218 meta-analyses were considered, including 201 meta-analyses of observational studies and 17 meta-analyses of randomized controlled trials.
There are several plausible biological mechanisms that may contribute to the inverse association between coffee consumption and T2DM risk: chlorogenic acid, a phenolic compound, is a major component of coffee and has been shown to reduce blood glucose concentrations in animal experiments [137]. Chlorogenic acid (CGA) may reduce intestinal glucose absorption by competitively inhibiting glucose-6-phosphate translocase and by reducing sodium-dependent glucose transport into vesicles of the brush border membrane [132], by reducing oxidative stress due to its antioxidant properties, and by reducing hepatic glucose production [134].
Meng’s review, which reports the role of chlorogenic acid in the regulation of glycolipid metabolism, describes chlorogenic acid (CGA) as an insulin sensitizer that potentiates insulin action similarly to the therapeutic action of metformin. CGA was found to promote a significant reduction in peak plasma glucose in the oral glucose tolerance test, most likely by attenuating intestinal glucose absorption, indicating a possible role of CGA as a glycemic-index-lowering agent and highlighting it as a compound of interest for reducing the risk of developing T2DM.
CGA exerts its antidiabetic effects by stimulating glucose uptake in both insulin-sensitive and insulin-resistant adipocytes. Furthermore, CGA, unlike thiazolidinediones (TZDs) or insulin, does not induce obesity or other side effects [138].
Interesting is Yangimoto’s randomized, double-blind, placebo-controlled crossover study in which they examined the effective dose of green tea catechins (GTCs) and coffee chlorogenic acid (CCA) on postprandial glucose, insulin, and incretin responses to a high-fat, carbohydrate cookie meal containing 75 g of glucose in healthy men. Study 1 (n = 18) evaluated two doses of GTC (270 or 540 mg) containing a fixed dose of CCA (270 mg) with 113 mg caffeine and a placebo (0 mg GTC and 0 mg CCA) with 112 mg caffeine. Study 2 (n = 18) evaluated two doses of CCA (150 or 300 mg) containing a fixed dose of GTC (540 mg) and a placebo with 99 mg caffeine. The combined single ingestion of GTC and CCA significantly impaired the incretin response and suppressed the glucose and insulin levels. These results suggest that the minimal effective dose is 540 mg of GTC and 150 mg of CCA [133].
In conclusion, the scientific literature has shown that coffee consumption is significantly associated with a lower risk of T2DM. Specifically, when compared with no coffee consumption, consumption of six cups of coffee per day was associated with a 33% lower risk of T2DM. Chlorogenic acid, among the numerous bioactive compounds present in coffee, would be the main compound responsible for this positive activity.
4.13. Physical Activity
Exercise is increasingly recognized as a form of therapy in individuals with T2DM, as it is effective in improving fitness and reducing HbA1c and other cardiovascular risk factors, as well as the dosage/number of medications taken by hypoglycemics [140].
In “Nutrition Therapy for Adults with Diabetes or Prediabetes: A Consensus Report” for patients with T2DM, a moderate-intensity physical activity of at least 150 min per week is recommended [19].
As regards the studies that consider the efficacy of glycemic control in patients with prediabetes, these are less numerous, but nonetheless provide interesting indications.
The aim of the meta-analysis systematic review by Angélica Trevisan De Nardi et al. of 2018 was to compare the effects of high-intensity interval training (HIIT) versus moderate-intensity continuous training (MICT) on functional capacity and cardiometabolic markers in individuals with prediabetes, comparing previously published studies.
The duration of the studies ranged from two to four weeks for the prediabetes patient groups. The included studies used different HIIT and MICT protocols. Exercise types, session length, and intensity varied widely between studies. All exercises were performed after meals and were monitored by direct supervision or objective measurements using heart rate monitors or accelerometers. Additionally, subjects were instructed not to alter their dietary and medication intake habits during the study period.
Both modalities—HIIT and MICT—showed similar effects on systolic and diastolic blood pressure in individuals with prediabetes. High-intensity interval training, requiring a smaller time commitment, has the potential to be used as a treatment modality for people with prediabetes or T2D. This type of training induces cardiometabolic adaptations similar to those of MICT [141].
The study by Jung ME et al. of 2015 [139] compared high-intensity interval training (HIIT) with traditional moderate-intensity continuous training (MICT). In fact, according to the authors, HIIT leads to improvements in various cardio-metabolic health markers, but the adherence to HIIT following a supervised laboratory intervention has yet to be tested. The researchers compared self-report and objective measures of physical activity after one month of independent exercise in individuals with prediabetes who were randomized to HIIT (n = 15) or MICT (n = 17).
The individuals involved were all with prediabetes ranging in age from 30 to 60. After completing 10 supervised exercise sessions, the participants were asked to perform HIIT or MICT three times a week for four weeks.
Individuals randomized into the HIIT group (89 ± 11%) adhered to the prescribed protocol to a greater extent than individuals in MICT (71 ± 31%) as determined by exercise logs completed over the one-month follow-up (p = 0. 05, Cohen’s d = 0.75). Minutes spent in vigorous physical activity per week as measured by the accelerometer were higher in HIIT (24 ± 18) than in MICT (11 ± 10) at one-month follow-up (p = 0.049, Cohen’s d = 0, ninety-two). Cardiorespiratory fitness and systolic blood pressure assessed at the one-month follow-up were similarly improved (p < 0.05). In conclusion, this study provides preliminary evidence that individuals with prediabetes can adhere to HIIT in the short term and do so at a higher level than MICT. These findings support the potential utility of HIIT as an alternative exercise strategy that could strengthen exercise adherence by allowing patients to save and optimize exercise time [139].
A systematic review and meta-analysis by Jadhav RA et al. comparing and analyzing randomized controlled trials of individuals diagnosed with prediabetes and interventions delivered in the form of physical activity were included in this review. Adiponectin, leptin, C-reactive protein, interleukin-6, and tumor necrosis factor-α were the outcome measures considered. The authors found that physical activity promotion with or without dietary or lifestyle modifications did not affect adiponectin level; however, it did show a positive effect on leptin in individuals with prediabetes. There is a dose–response relationship of adiponectin and leptin with weight loss in human participants, indicating that a slight weight loss of up to 5% reduces the leptin level, but, to make a change in the level of adiponectin, weight reduction would have to be greater than 10%. The prediabetes stage is associated with an increased level of inflammatory markers, namely, CRP, IL-6, and TNF-α. IL-6 promotes the expression of leptin on mRNA and inhibits the expression of adiponectin. This explains the impact of physical activity on adiponectin and leptin reducing IL-6. Weight reduction causes a reduction in the size of adipocytes and a reduction in the secretions of inflammatory cytokines. IL-6 concentration is related to adipocyte size. However, TNF-α secretion is independent of adipocyte size. The cytokine production literature has also proposed that IL-6 suppresses TNF-α production. This review suggests that the physical activity promotion program may reduce the level of leptin and IL-6, but whether there is any effect on the level of adiponectin, CRP, and TNF-α in individuals with prediabetes is uncertain [142].
In conclusion, regular exercise can help prevent the progression of prediabetes to full-blown T2DM. Several studies, already collected in the meta-analysis, have shown that subjecting these patients to “high-intensity” training or moderate intensity training sessions leads to similar effects on systolic and diastolic blood pressure and on cardiometabolic adaptations in individuals with prediabetes. However, high-intensity interval training, requiring a lower time commitment, has the potential to be used as a treatment modality for people with prediabetes or T2D, positively impacting compliance, and one session of HIIT would also seem to have greater and more lasting effects on the reduction of the postprandial glucose increase.
Physical activity also seems to be able to modulate and reduce the level of leptin and interleukin-6 in these patients who, by definition, have an increase in pro-inflammatory markers.
4.14. Dietary Supplementation with Probiotics
The intestinal microbiota is not only a simple component of the gastrointestinal tract, but seems to have a specific role in the pathogenesis of many metabolic diseases, such as obesity [210], T2DM [143], and non-alcoholic fatty liver disease [211].
Evidence for the involvement of the gut microbiota in the regulation of glucose metabolism and the progression of T2DM is accumulating. Understanding microbial dysbiosis and the specific alterations in gut microbiota composition that occur during the early stages of glucose intolerance is of paramount importance, as recently reported in the systematic review by Letchumanan [150].
The factors that contribute to the diversity and interindividual variability of the microbiota are many and are related to genetics, nutrition and lifestyle, some drugs, such as antibiotics, and changes in the composition of the diet [212].
In the pathogenesis of prediabetes and T2DM, inflammatory response, nutrition, intestinal permeability, glycolipid metabolism, insulin sensitivity, and energy homeostasis play an important role [151].
It was observed that the number of bacteria responsible for the production of short-chain fatty acids (SCFAs) was lower in patients with T2DM [143]. An altered gut microbiota can lead to decreased SCFA production and increased inflammation, and can affect insulin secretion and pancreatic β-cell sensitivity, leading to IR [213]. SCFAs, especially butyrate, promote the secretion of GLP-1, which prevents glucagon secretion, inhibits gluconeogenesis in the liver, and improves insulin sensitivity [214]. Additionally, SCFAs may prevent low-grade inflammation caused by the migration of bacteria from the gut into the mesenteric adipose tissue and blood [215]. In conclusion, these data suggest that increasing SCFAs, especially butyrate, is important for preventing and controlling prediabetes.
Lipopolysaccharides (LPSs), components of the outer cell membrane of Gram-negative bacteria, can be found in high concentrations and be absorbed from the intestine [144]. LPS stimulates the immune system by binding to the toll-like receptor (TLR), triggering immune cells to release inflammatory cytokines, which promote IR caused by an endotoxin-induced inflammatory response [216]. Furthermore, a study conducted on animal models demonstrated how the intestinal microbiota protects against the development of obesity, metabolic syndrome, and prediabetes with an immune-mediated mechanism, inducing specific commensal Th17 cells. A diet rich in fats and sugars has been shown to promote the metabolic syndrome by depleting those micro-organisms that induce Th17; conversely, the recovery of commensal Th17 cells restores their protective effect. Indeed, it has been observed that the loss of protective Th17 cells is induced by diet, in particular, by simple sugars. The elimination of sugar from diets has shown a protective role against obesity and metabolic syndrome in the animal model through a mechanism dependent on specific commensal Th17 cells. Sugar and ILC3 promote the growth of bacterial species, such as Faecalibaculum rodentium, which dysregulate the Th17-inducing microbiota [217].
Another potential mechanism associated with intestinal ecosystem homeostasis is the endocannabinoid system. LPS interacts with endocannabinoid receptors (eCB1), modulating the intestinal permeability and translocation of LPS, increasing circulating levels of LPS and inducing metabolic endotoxemia [218]. Cholic acid and chenodeoxycholic acid are primary bile acids (BAs) produced from cholesterol in the liver and converted to secondary BAs in the intestine [219,220]. Furthermore, BAs are involved in the regulation of glucose homeostasis as signalling molecules and cellular receptors, directly activating nuclear farnesoid X receptor (FXR) and Takeda G protein-coupled receptor 5 (TGR5), signalling and indirectly promoting the FXR-dependent induction of intestinal fibroblast growth factor-19 (FGF19) [221]. TGR5 activation can induce pre-proglucagon gene expression and GLP-1 secretion [214,222]. Conversely, FXR activation suppresses pre-proglucagon gene expression and GLP-1 secretion by inhibiting glycolysis and ChREBP activity in L cells [223]. Thus, in intestinal endocrine L cells, BA acts through the opposing effects on TGR5 and FXR to regulate GLP-1 production and secretion, thereby maintaining weight loss and improving glucose tolerance.
Another mechanism related to the action of the microbiota on prediabetes involves intestinal bacteria that metabolize nutrients to produce trimethylamine (TMA), which is then converted into trimethylamine N-oxide (TMAO) in the liver. TMAO levels have been shown to be elevated in patients with T2DM [145]. Additionally, animal models have shown that nutrient-derived TMAO can exacerbate IGT and increase fasting insulin levels by blocking the hepatic insulin signalling pathway and causing inflammation in adipose tissue [145]. Although a prospective study demonstrated that a higher intake of phosphatidylcholine (the precursor to the generation of TMAO) was independently associated with an increased risk of T2DM [146], the association between TMAO and T2DM has not reached a consistent conclusion. Roi et al. observed that plasma TMAO levels are associated with an increased prevalence of prediabetes in a nonlinear manner but not related to IR or FPG [147].
Thus, overall, the gut microbiota influences host metabolic disorders through the modulation of metabolites, including SCFA, LPS endotoxin, BA, and TMAO, as well as mediating the interaction between the gastrointestinal system and other organs [152].
As regards the composition of the microbiota in prediabetes, in a 2018 Danish case–control study, it was demonstrated that individuals with this condition have an altered intestinal microbiota compared to healthy subjects, characterized by a decrease in the genus Clostridium and the mucin-degrading bacterium Akkermansia munichipila. These results are comparable to observations made in chronic diseases characterized by chronic low-grade inflammation [148].
A study published in the journal EBioMedicine in the same period came to different conclusions, especially with regard to the bacterium Akkermansia munichipila. The authors used a combination of in-depth metagenomics and metaproteomic analyses of stool samples from treatment-naïve (TN-DM2, n = 77), prediabetic (prediabetes, n = 80), and normoglucose-tolerant (NGT, n = 97) individuals with T2DM to study the relative functional and compositional changes in the gut microbiota, and the fecal content of microbial and host proteins to elucidate possible host–microbial interactions, characterizing the different stages of the disease, from prediabetes to treatment-naïve T2DM [149].
In total, 11,980 meta-proteins and 425 human proteins were identified. The analysis allowed us to observe several distinctive features in prediabetes and NGT compared to TN-DM2, such as a higher abundance of Akkermansia muciniphila and a lower abundance of Bacteroides spp. The first is a well-known mucin-degrading bacterium which, in some studies, has already been shown to be able to reduce some pathologies included in metabolic syndrome, both in mice and in humans. On the other hand, the relative abundance of several Firmicutes species that produce butyrate was lower in prediabetes and TN-DM2 than in NGT. These findings are in line with a gradual progression of the disease through prediabetes to overt T2DM. Specifically, the authors found higher abundances of Enterobacteriaceae species (dominated by E. coli) and lower levels of host proteins that are potentially involved in Proteobacteria-specific responses in prediabetes, such as galectin-3 and proteins within the immunoglobulin super-family. An increased abundance of intestinal Enterobacteriaceae has been widely reported in patients with metabolic diseases such as obesity and atherosclerotic cardiovascular disease, and in patients with chronic inflammatory bowel disease. These unique traits, associated with prediabetes, could link potential gut microbial signals to an increase in chronic low-grade systemic inflammation.
The authors also noted that pancreatic enzyme content differed in fecal samples among the three groups of individuals studied. These results suggest that unique and distinctive nonlinear changes to the gut ecosystem may exist in individuals with prediabetes prior to the transition to overt T2DM. The authors of the study themselves emphasize that further large-scale longitudinal follow-up studies will be needed to delineate how microbial functions change from prediabetes to T2DM and to address the nature of the interactions between the gut microbiota and the host, in the transient phases leading to frank T2DM, also in a future therapeutic perspective.
A subsequently published systematic review (2022) summarized the existing evidence regarding the composition and diversity of the microbiota in individuals with prediabetes and individuals newly diagnosed with T2DM (newDM) compared to individuals with normal glucose tolerance (nonDM). A total of 18 observational studies (5489 participants) that analyzed the gut microbiota of subjects with prediabetes and newDM were included. Low microbial diversity was found overall in both prediabetes and newDM compared with nonDM. Differences in gut microbiota composition between prediabetes and newDM and those with nonDM were inconsistent across included studies. Four of the eighteen studies found an increased abundance of phylum Firmicutes, together with a decrease in the abundance of Bacteroidetes, in the new DM. A decrease in Faecalibacterium prausnitzii, Roseburia, Dialister, Flavonifractor, Alistipes, Haemophilus, and Akkermansia muciniphila and an increase in the abundance of Lactobacillus, Streptococcus, Escherichia, Veillonella, and Collinsella in the disease groups (prediabetes and newDM) were observed at the genus/species level in at least two studies. In four studies, Lactobacillus was also found to correlate positively with FPG, HbA1c, and/or IR (HOMA-IR). This calls for further investigations on the species/strain-specific role of the endogenously present Lactobacillus in the glucose regulation mechanism and in the progression of T2DM disease. Differences in dietary intake caused significant variations in the variety of bacterial species [150].
A 2016 review of randomized controlled trials (RCTs) suggested that prebiotics have a neutral effect on body weight, decreasing fasting and postprandial blood glucose, and improving insulin sensitivity and lipid profile, while it appears that some inflammatory markers are decreased, sometimes substantially (20–30%). As for probiotics, these have shown significant but limited effects on body weight (<3%) and metabolic parameters. The effect was mainly observed with fermented milk or yoghurt as opposed to administration in capsule form and with consumption for at least eight weeks of multiple rather than single bacterial strains. Pickled and fermented foods, especially vegetables and legumes, could serve as a dietary source of pre-, pro-, and synbiotics. These foods have shown possible benefits with respect to morbidity and mortality in prospective cohort studies [152].
A more recent systematic review including randomized controlled trials also reached similar conclusions, with inconsistent results among the included studies, partly due to the limited sources. The authors highlighted that probiotics can reduce HbA1c and have the potential to improve blood glucose levels after oral glucose loading. Probiotic supplementation can suppress the increase in blood cholesterol, but the improvement cannot be verified. Prebiotics failed to show a clear improvement in glycemic control, but their use led to changes in the gut microbiota composition. A combination of probiotics and prebiotics through symbiotic supplementation is more effective than probiotics alone in glycemic control. The review concluded that the benefits of gut microbiota modulation in the treatment of prediabetes have been partially demonstrated. However, there is not enough evidence to show significant benefits on glucose metabolism, lipid metabolism, and body composition [153].
A 2022 meta-analysis that included seven publications, for a total of 460 patients, however, demonstrated how probiotics were able to significantly reduce HbA1c levels, quantitative insulin sensitivity check index (QUICKI), total cholesterol, triglycerides, and LDL cholesterol compared to the levels in the placebo group, while the effects on fasting blood glucose, HOMA index, and HDL cholesterol were not different from those of the placebo group. The meta-analysis, therefore, concluded that probiotics may play an important role in the regulation of HbA1c, QUICKI, total and LDL cholesterol, and TG in patients with prediabetes. Furthermore, based on existing studies, probiotics can regulate blood glucose homeostasis in various ways [154].
In the same year (2022), a systematic review reached similar conclusions stating that the administration of probiotics can provide beneficial and salutary effects in the clinical management of patients with prediabetes and metabolic syndrome. Different probiotic compositions have shown beneficial and remarkable effects on glucose homeostasis, lipid profiles, BMI, and inflammatory markers in subjects with prediabetes and metabolic syndrome, and healthy individuals, and could be beneficial in rebalancing the gut microbiota in the prediabetic condition [155].
Animal models of T2DM show that specific probiotic bacteria improve glucose control. Benefits have been seen with probiotics containing Lactobacillus acidophilus, Lactobacillus casei, Lactobacillus plantarum, Lactobacillus gasseri, Lactobacillus reuteri, and Lactobacillus rhamnosus. For example, Lactobacillus casei improved glucose tolerance, lowered lipid levels, boosted immunity, and reduced oxidative stress, while Lactobacillus johnsoniii improved intestinal barrier integrity. Bifidobacterium lactis has also been shown to lower lipid and insulin levels [156].
Regarding the duration of probiotic treatment, a 2016 meta-analysis suggested that the effect of probiotics on glucose metabolism was potentially greater when consumed for more than eight weeks or when multiple strains of probiotics were consumed simultaneously [157].
A currently highly regarded research topic is the study of the microbiota of patients with prediabetes. Scientific literature agrees in demonstrating that the intestinal microbiota plays an important role in regulating glucose metabolism. It was observed that the number of bacteria responsible for the production of short-chain fatty acids (SCFAs) was lower in patients with T2D. Decreased SCFA production leads to increased inflammation and can affect insulin secretion and pancreatic β-cell sensitivity, leading to IR. These data suggest that elevation of SCFAs, particularly butyrate, is important in glycemic control in prediabetes. Furthermore, a study conducted on animal models demonstrated how the intestinal microbiota protects against the development of obesity, metabolic syndrome, and prediabetes with an immune-mediated mechanism, while inducing specific commensal Th17 cells. The gut microbiota influences host metabolic disorders through the modulation of several metabolites, such as LPS endotoxin, BA, and TMAO, as well as SCFA.
As regards the composition of the microbiota in patients with prediabetes, to date, the studies do not agree, but they do agree in stating that the intake of probiotics (multiple strains for at least eight weeks) could be useful in managing blood sugar metabolism in subjects with prediabetes.
4.15. Monitoring Glucose Levels
Monitoring blood glucose levels is a daily routine for diabetic people. Education programs emphasize the importance of the proper disposal of needles to prevent contamination and the transmission of blood-borne viruses. Despite these precautions, outbreaks of hepatitis have been reported in settings where multiple T2DM patients engage in self- or assisted monitoring of blood glucose. In the United States, 18 outbreaks of hepatitis B virus (HBV) infection were investigated, all linked to the improper use of blood-glucose-monitoring equipment [162,163,224].
Monitoring glucose levels can be challenging, and patients often spend significant periods with high blood sugar levels (outside the target range). Intensive insulin administration, in these cases, have been associated with an increased risk of death, while more frequent assessments of blood sugar levels have been shown to reduce mortality and morbidity in critically ill individuals, leading to improved outcomes [158,164,165].
Regular self-monitoring of blood sugar levels helps individuals with T2DM understand how factors such as food intake, physical activity, stress, and illness affect their glucose levels. Frequent monitoring allows people to maintain a good quality of life and make necessary adjustments to their medication, ultimately improving their long-term health. By reducing the risk of T2DM-related complications such as heart attacks, strokes, and damage to the eyes, kidneys, and nerves, individuals can achieve better overall health outcomes [166,172].
As for patient compliance, traditional biological fluids (e.g., blood) require invasive sampling techniques like painful finger pricking that entail evident discomfort and health risks, such as infections and viral transmission. Hence, there is increasing attention being paid towards non-invasive sampling. Today, different biological fluids like blood (gold standard), serum, urine, cerebrospinal fluid, etc. are used as diagnostic tools, but they need precautions and skilled personnel to be collected with few complications. Despite advancements in technology, most of commercially available glucometers still require invasive sampling methods, such as venipuncture or finger-pricks, which can be uncomfortable for frequent measurements. Alternatively, there are implantable devices available, but they are not cost-effective and are typically reserved for specific chronic patients, making widespread monitoring of the growing global diabetic population impractical [167,168,169].
Blood has been extensively studied and widely used as a biomarker source for diagnostic purposes. Blood has a higher glucose concentration compared to other biofluids; however, it presents challenges such as rapid coagulation, intense red color, and a high concentration of biomolecules. These factors increase the likelihood of interference-related issues or limited specificity. Therefore, in most cases, in vitro analyses are performed on serum samples, often requiring dilution of up to 100 times to mitigate these challenges [225,226].
As a result, there is a growing interest in non-invasive sampling techniques. In this regard, the use of saliva as a diagnostic fluid is emerging as a viable option in clinical practice. Non-invasive biofluids offer various advantages, such as eliminating the need for needle-based sampling, reducing physical discomfort and anxiety (particularly for frequent measurements), not requiring trained personnel, thereby reducing healthcare costs, while eliminating the risks associated with blood-borne pathogens (a safer approach), and having a greater stability due to no rapid coagulation. Moreover, urine and saliva sampling are simple and can be easily self-collected, making them ideal for home-testing purposes, even when a relatively large amount is needed [227,228].
Although blood glucose monitoring is more commonly practiced, urine sample testing is valuable for assessing potential kidney dysfunctions. Glycosuria is primarily associated with untreated T2DM and, in rare cases, a syndrome where urine hyperglycemia corresponds to normal blood glucose levels. However, anomalous glucose concentrations in urine are predominantly linked to T2DM.
Typically, glucose is not present in urine or it is in very low concentrations. However, in cases of elevated blood glucose levels, glucose is excreted into urine. Generally, when the glucose concentration exceeds 50–100 mg/dL (2.77–5.55 mM), a urine test is considered positive for hyperglycemia. Since urine is stored in the bladder for a certain period before being excreted, the measured glucose concentration represents an average of blood glucose levels during that time. Therefore, shorter collection intervals result in more accurate measurements and a stronger correlation with blood glucose fluctuations [170,171,229].
In order to measure glucose levels in sweat, it is necessary to utilize wearable devices, such as skin patches. Among the various strategies for detecting glucose in sweat, wearable electrochemical sensors based on nanoparticles (NPs) have been extensively explored. The fabrication of these wearable skin pads involved transferring the system onto a transparent and biocompatible chitosan film. In vivo testing of this system was conducted on the back area of the neck of several volunteers before and after sleeping. However, this strategy has certain limitations. The sweat secretion changes drastically over the day and in the case of physical exercise or pathological conditions. Additionally, it is challenging to visually distinguish samples due to the low difference in glucose amounts in sweat, while the long assay time of 60 min could restrict the practicality and applicability of the sensor [159,230].
The glucose concentration can vary greatly among these biofluids, with some cases exhibiting glucose levels nearly two orders of magnitude lower than in blood. Achieving the necessary sensitivity for glucose detection in these biofluids requires technological advancements [231].
Saliva is a transparent, mildly acidic fluid that is secreted by various salivary glands, including the parotid (20–25% of total secretion), submandibular (70–75% of total secretion), sublingual, tubarial, and minor glands. It is a combination of mucus and serous secretions. The primary components of saliva include water (98% composition), mucopolysaccharides, glycoproteins, electrolytes, white blood cells, epithelial cells (which carry DNA), proteins, and enzymes such as amylase, lipase, and antimicrobial enzymes. The resting pH of saliva typically varies from 6.2 to 7.4. However, this value can change after consuming a meal or in pathological conditions. Saliva encompasses a wide range of molecules that provide insights into both normal and abnormal states. Within human saliva, there are naturally occurring substances present at concentrations representative of various tissues, as well as molecules associated with recreational use or therapeutic purposes. Additionally, saliva serves as a valuable source of markers indicating hormonal, immunological, neurological, and metabolic conditions [173,232,233,234,235].
Currently, there are five primary categories of salivary diagnostic elements that are considered as biomarkers: proteome, microbiome, transcriptome, micro-RNA, and metabolome. Among these, the most common and abundant salivary substances with clinical relevance (validated biomarkers) include microparticles, viruses, bacteria, various proteins, immune system components such as IgA, IgG, and IgM, polynucleotides, lipids like cholesterol and triglycerides, steroid hormones, electrolytes, and small signaling molecules. One attractive aspect of human saliva is its ease of collection, which can be carried out quickly and without the need for specialized training [236,237,238,239].
Saliva serves as an easily accessible biomarker source that can be collected non-invasively, making it highly advantageous for colorimetric tests. Unlike other biofluids, saliva is colorless, further enhancing its suitability for such tests. However, it is essential to ensure proper sampling techniques to avoid misleading results. Saliva samples can be categorized as stimulated or non-stimulated, and, while this distinction may not be critical in some cases, it is particularly important for glucose measurements. To establish a better correlation with blood glucose levels (and potential T2DM risks) and to enhance reproducibility, it is recommended to exclusively use non-stimulated saliva [160,161,240].
Numerous studies have shown a positive correlation between blood glucose levels and salivary glucose levels. However, the existing literature presents contradictory findings due to various factors that influence salivary glucose values, including the collection protocol and the criteria used to enroll subjects in the studies. Nonetheless, P. Balan et al. demonstrated that salivary glucose levels are significantly higher in both uncontrolled diabetic subjects (13.35 ± 6.61 mg/dL) and controlled diabetic subjects (4.95 ± 2.479 mg/dL) compared to non-diabetic subjects (1.18 ± 0.675 mg/dL), which aligns with previous research. Other studies have also reported significant correlations, with varying ratios ranging from 1:40 to 1:100 depending on factors such as the population being studied (healthy or diabetic), age, and body mass index [241,242,243,244,245,246,247,248].
Innovative glucose assessment systems, such as salivary assessment, would, therefore, represent an important support for the patient in terms of quality of life. To date, the results are promising, but many studies still need to be conducted before these assessments can be considered routine for patients with glycemic alterations.
5. Conclusions
The global prevalence of prediabetes is increasing. In 2019, the prevalence estimated was 7.5% (373.9 million people). Prediabetes is a risk factor for T2DM, and, for prediabetic individuals, lifestyle modification is the cornerstone to T2DM prevention, with evidence of a 40–70% relative-risk reduction. Given this background, the aim of this review is to evaluate the latest data regarding novel augmentation strategies in prediabetes in order to identify the best lifestyle modification and to construct a food pyramid that allows subjects with prediabetes to easily figure out what to eat, also considering the quality of life; therefore, certain technologies can be of support, such as the innovative salivary glucose monitoring system.
Considering carbohydrate intake, three portions per day of whole-meal carbohydrates with a low glycemic index or potatoes with their skins on represent the ideal foods to recommend to patients with prediabetes. In order to obtain weight loss in an obese patient with prediabetes, the evidence from scientific research shows that, in this case, it may be useful to consider low-carbohydrate diets.
Regarding proteins, they are essential in a balanced diet and evidence in the literature focuses on their important role in the prevention and treatment of the onset of prediabetes.
Foods rich in protein appear to be characterized by a low glycemic index (GI) and the intake of proteins induces a release of insulin in any case lower than that generated by the ingestion of carbohydrates. This suggests that high-protein (HP) diets may help preserve β-cells by increasing insulin sensitivity and decreasing the insulin load per meal.
Furthermore, the higher protein content in the diet can also contribute to maintaining or increasing lean body mass and, consequently, to favoring the uptake of glucose at the muscle level: the skeletal muscle is, in fact, essential for the clearance of glucose being substantially responsible for the postprandial uptake of about 80% of the glucose taken.
Considering milk and dairy products, the scientific literature agrees in demonstrating that a higher intake of milk and cheese, both low-fat and fat-free (three portions of low-fat dairy products, skimmed milk, or low-fat yogurt: 300–400 g/day), is a result associated with better glycemic control.
Whey protein supplementation (10–40 g of whey protein taken before a meal) may also be helpful in glycemic control, particularly in sarcopenic prediabetic patients.
Regarding the intake of red meat and processed meat, it must be occasional, a portion of 100 g no more than one day a week for the egg intake; 2–4 eggs per week should be recommended to patients with prediabetes.
Considering plant-based foods, from the evidence in the literature, it is possible to deduce that a consumption of vegetable proteins is recommended for the purpose of improving glycemic control and IR: a good amount of legumes, between 150 g fresh, corresponding to 50 g dried (standard portion), three times a week up to a maximum of 150 mg/day, is recommended. Furthermore, soy and its derivatives, such as tofu, and peanuts, preferably with skins and also in the form of peanut butter, are a valid addition to the diet as they can all contribute to preventing the progression of IR, typical of prediabetes, in overt T2DM.
Finally, given that the studies that have been carried out up to now, investigating the correlation between prediabetes and sarcopenia, agree in demonstrating that patients with prediabetes had reduced mass, strength, and muscle performance compared to non-diabetics, it is important that patients with prediabetes are screened in order to evaluate the possible presence of this pathology. Finally, given this background, it is equally important that protein intake is adequate in patients with prediabetes.
Regarding lipid intake, there are numerous studies that have investigated the role of fatty acids in prediabetes, in particular, the beneficial role of the intake of foods rich in mono- and polyunsaturated fats. The protective role of the intake of at least 2–3 portions of fish weekly in T2DM is linked to the presence of omega-3 fatty acids EPA and DHA and their anti-inflammatory action, capable of increasing membrane fluidity, and the number and efficiency of insulin receptors. Furthermore, the benefits of fish could also be linked to the content in the latter of proteins and amino acids, capable of increasing the sense of satiety and, consequently, facilitating weight loss. As regards monounsaturated fatty acids, the literature has shown that the daily intake of at least 10 mL per day (optimal 15–20 mL) of extra-virgin olive (EVO) oil represents an important strategy in glucide control in prediabetes. The effectiveness is due, in particular, to the presence of high quantities of polyphenols in the EVO oil.
Regarding vitamins, the evaluation of vitamin D in blood levels is mandatory in patients with prediabetes in order to identify a personalized supplementation of this vitamin. For B group vitamins, since it is possible with routine tests to carry out the evaluation of folate, vitamin B12, and homocysteine in the blood, it is essential that we carry out these analyses on patients with prediabetes in order to supplement in the case of folic acid and vitamin B12 deficiencies. As for vitamin C, personalized supplements of vitamin C could represent a possible future strategy with which to increase the benefits and effectiveness of interventions. However, the results should be interpreted with caution due to the limitations of the primary studies analyzed. Regarding vitamin E, based on the evidence from the randomized controlled trials analyzed, there is insufficient evidence supporting a potential beneficial effect of vitamin E supplementation on improving HbA1c and fasting glucose and insulin concentrations in patients with prediabetes.
With regard to minerals, the evaluation of the dietary intake of some minerals, such as zinc, magnesium, selenium, and calcium, should be considered in patients with prediabetes, in order to evaluate the need for oral supplementation.
Considering the link between prediabetes and osteoporosis, from the various studies and scientific evidence, the link between prediabetes and osteoporosis has been known for years, understood as an increased risk of decreased bone mineral density, and, therefore, as an increased risk of fractures in this population. The causes of this connection are not entirely clear but there are many possible factors at play: from pathophysiological ones such as microangiopathy at the bone tissue level, discussed as a possible cause of diabetic osteopenia, to molecular ones (it has been demonstrated that insulin, IGF-1 and IGF-2, cytokines, and hormones have an influence on bone metabolism itself so as to determine changes in the bone metabolism of subjects with glycemic imbalances). It is, therefore, evident how important the prevention of a chronic and progressive pathology such as osteoporosis is, also, and above all in this population of patients. The latter must sustain the correct monitoring of bone mineral density and patient management that includes the right tests and correct calcium and vitamin D supplements.
As far as fruit and vegetables are concerned, all the studies found that a consumption of fruit (particularly pears and apples) and vegetables equal to an average of 500 g per day led to a reduction in the development of prediabetes. This result can be explained both by the supply of fiber, especially water-soluble fiber, and by the presence of micronutrients such as vitamins and minerals, especially magnesium, and polyphenols, present in fruit and vegetables.
Considering the consumption of nuts, the average dose of 30 g per day was protective against IR, IFG, and HbA1c. Some studies show a reduction in inflammatory markers, but more studies are needed to establish the correlation between nuts and the levels of pro-inflammatory cytokines, such as IL6. It has been hypothesized that some polyphenols contained in dried fruit, such as ellagic acid, may be the substances that counterbalance lipoinflammation and are involved in glucose control.
With regard to hydration, the literature stated that water appears to be an essential element for normal metabolism and an adequate intake of water can also be specifically associated with a reduction of the risk of T2DM for patients with prediabetes.
Given what is reported on calcium intake in the section on minerals and on the relationship between osteoporosis and T2DM, it could be interesting to advise people with prediabetes to drink mineral water rich in calcium.
The consumption of 2 L of calcium-rich mineral water (when the calcium content is over 150 mg/L) is useful in order to reach the daily calcium requirement because it is a valuable source of highly bioavailable calcium.
Considering sugary drinks, studies agree in confirming the hypothesis that there is a close correlation in both young people and adults, between the consumption of these beverages and the development of T2DM and in reiterating how higher frequencies of water intake are instead associated with a reduction in the odds of prediabetes.
As far as NSSs are concerned, the lack of specificity in studying NSSs, the discrepancies in the findings of observational versus randomized controlled trials, the fact that NSSs are heterogeneous compounds that may affect different metabolic pathways with various impacts on health, and other methodological aspects make it difficult to draw firm conclusive recommendations for or against the use of NSSs in a specific population subgroup such as prediabetes subjects.
Regarding alcohol intake, the analysis of the literature shows that the consumption of one glass of red wine a day with a meal was found to be protective in prediabetes and reduce the risk of disease progression and macro-vascular and micro-vascular complications of diabetic disease. The risk-lowering consumption is 22 g of ethanol in men and 24 g in women. The beneficial effect would seem to be elicited by the various polyphenolic compounds present in red wine. Polyphenols may influence glycemia and T2DM through different mechanisms, such as promoting the uptake of glucose in tissues, and, therefore, improving insulin sensitivity. Conversely, alcohol abuse leads to an increased risk of prediabetes.
As far as coffee is concerned, the scientific literature has shown that coffee consumption is significantly associated with a lower risk of T2DM. Specifically, compared with no coffee consumption, consumption of six cups of coffee per day was associated with a 33% lower risk of T2DM. Chlorogenic acid, among the numerous bioactive compounds present in coffee, is mainly responsible for this positive activity.
Considering physical activity, regular exercise can help prevent the progression of prediabetes to full-blown T2DM. Several studies, already collected in the meta-analysis, have shown that subjecting these patients to “high-intensity” training or moderate-intensity training sessions leads to similar effects on systolic and diastolic blood pressure and on cardiometabolic adaptations to individuals with prediabetes. However, high-intensity interval training (HIIT), requiring a lower time commitment, has the potential to be used as a treatment modality for people with prediabetes or T2D, positively impacting compliance, and it would also appear that one session of HIIT has a greater and more lasting effect on the reduction of the postprandial glucose increase. Physical activity also seems to be able to modulate and reduce the level of leptin and interleukin-6 in these patients who, by definition, have an increase in pro-inflammatory markers.
Scientific literature recognizes that the intestinal microbiota plays an important role in regulating glucose metabolism. It was observed that the number of bacteria responsible for the production of short-chain fatty acids (SCFAs) was lower in patients with T2D. Decreased SCFA production leads to increased inflammation and can affect insulin secretion and pancreatic β-cell sensitivity leading to IR. The data suggest that the elevation of SCFAs, particularly butyrate, is important in glycemic control in prediabetes. Furthermore, a study conducted on animal models demonstrated how the intestinal microbiota protects against the development of obesity, metabolic syndrome, and prediabetes with an immune-mediated mechanism, inducing specific commensal Th17 cells. The gut microbiota influences host metabolic disorders through the modulation of several metabolites, such as the LPS endotoxin, BA, and TMAO, as well as SCFA. As regards the composition of the microbiota in patients with prediabetes, to date, the studies do not agree, but they do agree in stating that the intake of probiotics (multiple strains for at least eight weeks) could be useful in managing blood sugar metabolism in patients with prediabetes.
Supplementary Materials
The following supporting information can be downloaded at: https://www.mdpi.com/article/10.3390/nu15234943/s1, Table S1. Tabelle CHO; Table S2a. Tabelle Milk and Dairy; Table S2b. Tabelle Eggs; Table S2c. Tabelle Meat; Table S2d. Tabelle Plant-Based Proteins; Table S3. Tabelle sarcopenia; Table S4. Tabelle Lipid; Table S5. Tabelle Vitamins; Table S6. Tabella Minerals; Table S7. Tabelle Osteoporosis; Table S8. Tabella Fruits and vegetables; Table S9. Tabella Nuts; Table S10a. Tabelle Plain water; Table S10b. Tabelle Sugary beverages; Table S11. Tabella Alcohol; Table S12. Tabella Coffee; Table S13. Tabelle Physical activity; Table S14. Tabelle Microbiota; Table S15. Tabelle Monitoring Glucose Levels.
Author Contributions
Conceptualization, M.R and S.P.; methodology, M.R.; writing—original draft preparation, G.C.B., A.C., P.D., C.S., C.R., S.R., E.G., F.M., Z.P., M.P., G.M., A.T. and E.M.V.; writing—review and editing, M.R. and G.C.B.; visualization, M.R. and G.C.B.; project administration, M.R. All authors have read and agreed to the published version of the manuscript.
Funding
This research received no external funding.
Institutional Review Board Statement
Not applicable.
Informed Consent Statement
Not applicable.
Data Availability Statement
The data presented in this study are available in the article and in the Supplementary Materials.
Conflicts of Interest
Stefano Russano and Paolo Donati was employed by the company AICUBE. The remaining authors declare that the research was conducted in the absence of any commercial or financial relationships that could be construed as a potential conflict of interest.
References
- Glauber, H.; Vollmer, W.M.; Nichols, G.A. A Simple Model for Predicting Two-Year Risk of Diabetes Development in Individuals with Prediabetes. Perm. J. 2018, 22. [Google Scholar] [CrossRef] [Scilit] [PubMed]
- American Diabetes Association Professional Practice Committee. 2. Classification and Diagnosis of Diabetes: Standards of Medical Care in Diabetes—2022. Diabetes Care 2022, 45, S17–S38. [Google Scholar] [CrossRef] [Scilit]
- Smulders, Y.; Serné, E. Is HbA1c a Good Diagnostic Test for (Pre)Diabetes in Cardiac Rehabilitation Patients? Eur. J. Prev. Cardiol. 2018, 25, 462–463. [Google Scholar] [CrossRef] [Scilit]
- Tatulashvili, S.; Patois-Vergès, B.; Nguyen, A.; Blonde, M.-C.; Vergès, B. Detection of Glucose Metabolism Disorders in Coronary Patients Enrolled in Cardiac Rehabilitation: Is Glycated Haemoglobin Useful? Data from the Prospective REHABDIAB Study. Eur. J. Prev. Cardiol. 2018, 25, 464–471. [Google Scholar] [CrossRef] [Scilit]
- Færch, K.; Vistisen, D.; Johansen, N.B.; Jørgensen, M.E. Cardiovascular Risk Stratification and Management in Pre-Diabetes. Curr. Diabetes Rep. 2014, 14, 493. [Google Scholar] [CrossRef] [Scilit]
- Zhang, X.; Gregg, E.W.; Williamson, D.F.; Barker, L.E.; Thomas, W.; Bullard, K.M.; Imperatore, G.; Williams, D.E.; Albright, A.L. A1C Level and Future Risk of Diabetes: A Systematic Review. Diabetes Care 2010, 33, 1665–1673. [Google Scholar] [CrossRef] [Scilit]
- Ackermann, R.T.; Cheng, Y.J.; Williamson, D.F.; Gregg, E.W. Identifying Adults at High Risk for Diabetes and Cardiovascular Disease Using Hemoglobin A1c. Am. J. Prev. Med. 2011, 40, 11–17. [Google Scholar] [CrossRef] [Scilit]
- Diabetes Prevention Program Research Group. HbA1c as a Predictor of Diabetes and as an Outcome in the Diabetes Prevention Program: A Randomized Clinical Trial. Diabetes Care 2015, 38, 51–58. [Google Scholar] [CrossRef] [Scilit]
- DeFronzo, R.A.; Tripathy, D. Skeletal Muscle Insulin Resistance Is the Primary Defect in Type 2 Diabetes. Diabetes Care 2009, 32, S157–S163. [Google Scholar] [CrossRef] [Scilit]
- Tabák, A.G.; Herder, C.; Rathmann, W.; Brunner, E.J.; Kivimäki, M. Prediabetes: A High-Risk State for Diabetes Development. Lancet 2012, 379, 2279–2290. [Google Scholar] [CrossRef] [Scilit] [PubMed]
- Echouffo-Tcheugui, J.B.; Selvin, E. Prediabetes and What It Means: The Epidemiological Evidence. Annu. Rev. Public. Health 2021, 42, 59–77. [Google Scholar] [CrossRef] [Scilit]
- Diabetes Prevention Program Research Group. The Prevalence of Retinopathy in Impaired Glucose Tolerance and Recent-Onset Diabetes in the Diabetes Prevention Program. Diabetes Med. 2007, 24, 137–144. [Google Scholar] [CrossRef] [Scilit]
- Lee, C.C.; Perkins, B.A.; Kayaniyil, S.; Harris, S.B.; Retnakaran, R.; Gerstein, H.C.; Zinman, B.; Hanley, A.J. Peripheral Neuropathy and Nerve Dysfunction in Individuals at High Risk for Type 2 Diabetes: The PROMISE Cohort. Diabetes Care 2015, 38, 793–800. [Google Scholar] [CrossRef] [Scilit]
- Echouffo-Tcheugui, J.B.; Narayan, K.M.; Weisman, D.; Golden, S.H.; Jaar, B.G. Association between Prediabetes and Risk of Chronic Kidney Disease: A Systematic Review and Meta-Analysis. Diabetes Med. 2016, 33, 1615–1624. [Google Scholar] [CrossRef] [Scilit]
- Huang, Y.; Cai, X.; Mai, W.; Li, M.; Hu, Y. Association between Prediabetes and Risk of Cardiovascular Disease and All Cause Mortality: Systematic Review and Meta-Analysis. BMJ 2016, 355, i5953. [Google Scholar] [CrossRef] [Scilit]
- The HAPO Study Cooperative Research Group. Hyperglycemia and Adverse Pregnancy Outcomes. N. Engl. J. Med. 2008, 358, 1991–2002. [Google Scholar] [CrossRef] [Scilit]
- de Souza, C.F.; Gross, J.L.; Gerchman, F.; Leitão, C.B. Pré-Diabetes: Diagnóstico, Avaliação de Complicações Crônicas e Tratamento. Arq. Bras. Endocrinol. Metabol. 2012, 56, 275–284. [Google Scholar] [CrossRef] [Scilit]
- Khan, R.M.M.; Chua, Z.J.Y.; Tan, J.C.; Yang, Y.; Liao, Z.; Zhao, Y. From Pre-Diabetes to Diabetes: Diagnosis, Treatments and Translational Research. Medicina 2019, 55, 546. [Google Scholar] [CrossRef] [Scilit]
- Evert, A.B.; Dennison, M.; Gardner, C.D.; Garvey, W.T.; Lau, K.H.K.; MacLeod, J.; Mitri, J.; Pereira, R.F.; Rawlings, K.; Robinson, S.; et al. Nutrition Therapy for Adults with Diabetes or Prediabetes: A Consensus Report. Diabetes Care 2019, 42, 731–754. [Google Scholar] [CrossRef] [Scilit]
- Egger, M.; Smith, D.G. Doug Altman Systematic Reviews in Health Care. Meta-Analysis in Context. Int. J. Epidemiol. 2002, 31, 697. [Google Scholar] [CrossRef] [Scilit]
- How to Read a Paper. Available online: https://www.bmj.com/about-bmj/resources-readers/publications/how-read-paper (accessed on 20 November 2023).
- Available online: https://www.cochrane.it/sites/cochrane.it/files/public/uploads/guidausorevisioni.pdf (accessed on 20 November 2023).
- Owens, D.K.; Lohr, K.N.; Atkins, D.; Treadwell, J.R.; Reston, J.T.; Bass, E.B.; Chang, S.; Helfand, M. AHRQ Series Paper 5: Grading the Strength of a Body of Evidence When Comparing Medical Interventions—Agency for Healthcare Research and Quality and the Effective Health-Care Program. J. Clin. Epidemiol. 2010, 63, 513–523. [Google Scholar] [CrossRef] [Scilit] [PubMed]
- Available online: https://www.iss.it/-/snlg-manuale-metodologico (accessed on 20 November 2023).
- Saslow, L.R.; Daubenmier, J.J.; Moskowitz, J.T.; Kim, S.; Murphy, E.J.; Phinney, S.D.; Ploutz-Snyder, R.; Goldman, V.; Cox, R.M.; Mason, A.E.; et al. Twelve-Month Outcomes of a Randomized Trial of a Moderate-Carbohydrate versus Very Low-Carbohydrate Diet in Overweight Adults with Type 2 Diabetes Mellitus or Prediabetes. Nutr. Diabetes 2017, 7, 304. [Google Scholar] [CrossRef] [Scilit]
- Saslow, L.R.; Kim, S.; Daubenmier, J.J.; Moskowitz, J.T.; Phinney, S.D.; Goldman, V.; Murphy, E.J.; Cox, R.M.; Moran, P.; Hecht, F.M. A Randomized Pilot Trial of a Moderate Carbohydrate Diet Compared to a Very Low Carbohydrate Diet in Overweight or Obese Individuals with Type 2 Diabetes Mellitus or Prediabetes. PLoS ONE 2014, 9, e91027. [Google Scholar] [CrossRef] [Scilit] [PubMed]
- Gardner, C.D.; Landry, M.J.; Perelman, D.; Petlura, C.; Durand, L.R.; Aronica, L.; Crimarco, A.; Cunanan, K.M.; Chang, A.; Dant, C.C.; et al. Effect of a Ketogenic Diet versus Mediterranean Diet on Glycated Hemoglobin in Individuals with Prediabetes and Type 2 Diabetes Mellitus: The Interventional Keto-Med Randomized Crossover Trial. Am. J. Clin. Nutr. 2022, 116, 640–652. [Google Scholar] [CrossRef] [Scilit] [PubMed]
- Cea-Soriano, L.; Pulido, J.; Franch-Nadal, J.; Santos, J.M.; Mata-Cases, M.; Díez-Espino, J.; Ruiz-García, A.; Regidor, E. Mediterranean Diet and Diabetes Risk in a Cohort Study of Individuals with Prediabetes: Propensity Score Analyses. Diabetes Med. 2022, 39, e14768. [Google Scholar] [CrossRef] [Scilit] [PubMed]
- Filippatos, T.D.; Panagiotakos, D.B.; Georgousopoulou, E.N.; Pitaraki, E.; Kouli, G.-M.; Chrysohoou, C.; Tousoulis, D.; Stefanadis, C.; Pitsavos, C. Mediterranean Diet and 10-Year (2002–2012) Incidence of Diabetes and Cardiovascular Disease in Participants with Prediabetes: The ATTICA Study. Rev. Diabetes Stud. 2016, 13, 226–235. [Google Scholar] [CrossRef] [Scilit]
- Li, L.; Shan, Z.; Wan, Z.; Li, R.; Geng, T.; Lu, Q.; Zhu, K.; Qiu, Z.; Zhang, X.; Liu, Y.; et al. Associations of Lower-Carbohydrate and Lower-Fat Diets with Mortality among People with Prediabetes. Am. J. Clin. Nutr. 2022, 116, 206–215. [Google Scholar] [CrossRef] [Scilit] [PubMed]
- Rideout, T.C.; Marinangeli, C.P.F.; Martin, H.; Browne, R.W.; Rempel, C.B. Consumption of Low-Fat Dairy Foods for 6 Months Improves Insulin Resistance without Adversely Affecting Lipids or Bodyweight in Healthy Adults: A Randomized Free-Living Cross-over Study. Nutr. J. 2013, 12, 56. [Google Scholar] [CrossRef] [Scilit]
- Akhavan, T.; Luhovyy, B.L.; Brown, P.H.; Cho, C.E.; Anderson, G.H. Effect of Premeal Consumption of Whey Protein and Its Hydrolysate on Food Intake and Postmeal Glycemia and Insulin Responses in Young Adults. Am. J. Clin. Nutr. 2010, 91, 966–975. [Google Scholar] [CrossRef] [Scilit]
- Sindayikengera, S.; Xia, W. Nutritional Evaluation of Caseins and Whey Proteins and Their Hydrolysates from Protamex. J. Zhejiang Univ. Sci. B 2006, 7, 90–98. [Google Scholar] [CrossRef] [Scilit]
- Slurink, I.A.L.; den Braver, N.R.; Rutters, F.; Kupper, N.; Smeets, T.; Elders, P.J.M.; Beulens, J.W.J.; Soedamah-Muthu, S.S. Dairy Product Consumption and Incident Prediabetes in Dutch Middle-Aged Adults: The Hoorn Studies Prospective Cohort. Eur. J. Nutr. 2022, 61, 183–196. [Google Scholar] [CrossRef] [Scilit]
- Slurink, I.A.L.; Voortman, T.; Ochoa-Rosales, C.; Ahmadizar, F.; Kavousi, M.; Kupper, N.; Smeets, T.; Soedamah-Muthu, S.S. Dairy Product Consumption in Relation to Incident Prediabetes and Longitudinal Insulin Resistance in the Rotterdam Study. Nutrients 2022, 14, 415. [Google Scholar] [CrossRef] [Scilit] [PubMed]
- Hruby, A.; Ma, J.; Rogers, G.; Meigs, J.B.; Jacques, P.F. Associations of Dairy Intake with Incident Prediabetes or Diabetes in Middle-Aged Adults Vary by Both Dairy Type and Glycemic Status. J. Nutr. 2017, 147, 1764–1775. [Google Scholar] [CrossRef] [Scilit] [PubMed]
- Slurink, I.A.L.; Chen, L.; Magliano, D.J.; Kupper, N.; Smeets, T.; Soedamah-Muthu, S.S. Dairy Product Consumption and Incident Prediabetes in the Australian Diabetes, Obesity, and Lifestyle Study With 12 Years of Follow-Up. J. Nutr. 2023, 153, 1742–1752. [Google Scholar] [CrossRef] [Scilit]
- Brouwer-Brolsma, E.M.; Sluik, D.; Singh-Povel, C.M.; Feskens, E.J.M. Dairy Product Consumption Is Associated with Pre-Diabetes and Newly Diagnosed Type 2 Diabetes in the Lifelines Cohort Study. Br. J. Nutr. 2018, 119, 442–455. [Google Scholar] [CrossRef] [Scilit]
- Pestoni, G.; Riedl, A.; Breuninger, T.A.; Wawro, N.; Krieger, J.P.; Meisinger, C.; Rathmann, W.; Thorand, B.; Harris, C.; Peters, A.; et al. Association between Dietary Patterns and Prediabetes, Undetected Diabetes or Clinically Diagnosed Diabetes: Results from the KORA FF4 Study. Eur. J. Nutr. 2021, 60, 2331–2341. [Google Scholar] [CrossRef] [Scilit] [PubMed]
- Hidayat, K.; Du, X.; Shi, B.-M. Milk in the Prevention and Management of Type 2 Diabetes: The Potential Role of Milk Proteins. Diabetes Metab. Res. Rev. 2019, 35, e3187. [Google Scholar] [CrossRef] [Scilit]
- Hoffman, J.R.; Falvo, M.J. Protein—Which Is Best? J. Sports Sci. Med. 2004, 3, 118–130. [Google Scholar] [PubMed]
- Yau, J.W.; Thor, S.M.; Ramadas, A. Nutritional Strategies in Prediabetes: A Scoping Review of Recent Evidence. Nutrients 2020, 12, 2990. [Google Scholar] [CrossRef] [Scilit]
- Pourafshar, S.; Akhavan, N.S.; George, K.S.; Foley, E.M.; Johnson, S.A.; Keshavarz, B.; Navaei, N.; Davoudi, A.; Clark, E.A.; Arjmandi, B.H. Egg Consumption May Improve Factors Associated with Glycemic Control and Insulin Sensitivity in Adults with Pre- and Type II Diabetes. Food Funct. 2018, 9, 4469–4479. [Google Scholar] [CrossRef] [Scilit]
- Richard, C.; Cristall, L.; Fleming, E.; Lewis, E.D.; Ricupero, M.; Jacobs, R.L.; Field, C.J. Impact of Egg Consumption on Cardiovascular Risk Factors in Individuals with Type 2 Diabetes and at Risk for Developing Diabetes: A Systematic Review of Randomized Nutritional Intervention Studies. Can. J. Diabetes 2017, 41, 453–463. [Google Scholar] [CrossRef] [Scilit] [PubMed]
- Drouin-Chartier, J.P.; Schwab, A.L.; Chen, S.; Li, Y.; Sacks, F.M.; Rosner, B.; Manson, J.A.E.; Willett, W.C.; Stampfer, M.J.; Hu, F.B.; et al. Egg Consumption and Risk of Type 2 Diabetes: Findings from 3 Large US Cohort Studies of Men and Women and a Systematic Review and Meta-Analysis of Prospective Cohort Studies. Am. J. Clin. Nutr. 2020, 112, 619–630. [Google Scholar] [CrossRef] [Scilit] [PubMed]
- Nguyen, C.Q.; Pham, T.T.P.; Fukunaga, A.; Van Hoang, D.; Phan, T.V.; Phan, D.C.; Van Huynh, D.; Hachiya, M.; Le, H.X.; Do, H.T.; et al. Red Meat Consumption Is Associated with Prediabetes and Diabetes in Rural Vietnam: A Cross-Sectional Study. Public Health Nutr. 2023, 26, 1006–1013. [Google Scholar] [CrossRef] [Scilit] [PubMed]
- Song, Y.; Manson, J.E.; Buring, J.E.; Liu, S. A Prospective Study of Red Meat Consumption and Type 2 Diabetes in Middle-Aged and Elderly Women: The Women’s Health Study. Diabetes Care 2004, 27, 2108–2115. [Google Scholar] [CrossRef] [Scilit]
- Pan, A.; Sun, Q.; Bernstein, A.M.; Schulze, M.B.; Manson, J.A.E.; Willett, W.C.; Hu, F.B. Red Meat Consumption and Risk of Type 2 Diabetes: 3 Cohorts of US Adults and an Updated Meta-Analysis. Am. J. Clin. Nutr. 2011, 94, 1088–1096. [Google Scholar] [CrossRef] [Scilit]
- Pan, A.; Sun, Q.; Bernstein, A.M.; Manson, J.E.; Willett, W.C.; Hu, F.B. Changes in Red Meat Consumption and Subsequent Risk of Type 2 Diabetes Mellitus: Three Cohorts of US Men and Women. JAMA Intern. Med. 2013, 173, 1328–1335. [Google Scholar] [CrossRef] [Scilit] [PubMed]
- Sanders, L.M.; Wilcox, M.L.; Maki, K.C. Red Meat Consumption and Risk Factors for Type 2 Diabetes: A Systematic Review and Meta-Analysis of Randomized Controlled Trials. Eur. J. Clin. Nutr. 2023, 77, 156–165. [Google Scholar] [CrossRef] [Scilit]
- Kwak, J.H.; Lee, J.H.; Ahn, C.-W.; Park, S.-H.; Shim, S.-T.; Song, Y.D.; Han, E.N.; Lee, K.H.; Chae, J.-S. Black Soy Peptide Supplementation Improves Glucose Control in Subjects with Prediabetes and Newly Diagnosed Type 2 Diabetes Mellitus. J. Med. Food 2010, 13, 1307–1312. [Google Scholar] [CrossRef] [Scilit]
- Reis, C.E.G.; Bordalo, L.A.; Rocha, A.L.C.; Freitas, D.M.O.; da Silva, M.V.L.; de Faria, V.C.; Martino, H.S.D.; Costa, N.M.B.; Alfenas, R.C. Ground Roasted Peanuts Leads to a Lower Post-Prandial Glycemic Response than Raw Peanuts. Nutr. Hosp. 2011, 26, 745–751. [Google Scholar] [CrossRef]
- Becerra-Tomás, N.; Díaz-López, A.; Rosique-Esteban, N.; Ros, E.; Buil-Cosiales, P.; Corella, D.; Estruch, R.; Fitó, M.; Serra-Majem, L.; Arós, F.; et al. Legume Consumption Is Inversely Associated with Type 2 Diabetes Incidence in Adults: A Prospective Assessment from the PREDIMED Study. Clin. Nutr. 2018, 37, 906–913. [Google Scholar] [CrossRef] [Scilit]
- Shams, H.; Tahbaz, F.; Entezari, M.H.; Abadi, A. Effects of Cooked Lentils on Glycemic Control and Blood Lipids of Patients with Type 2 Diabetes. ARYA Atheroscler. J. 2008, 3, 215–218. [Google Scholar]
- Jiang, R. Nut and Peanut Butter Consumption and Risk of Type 2 Diabetes in Women. JAMA 2002, 288, 2554. [Google Scholar] [CrossRef] [Scilit]
- Ley, S.H.; Hamdy, O.; Mohan, V.; Hu, F.B. Prevention and Management of Type 2 Diabetes: Dietary Components and Nutritional Strategies. Lancet 2014, 383, 1999–2007. [Google Scholar] [CrossRef] [Scilit]
- Kim, Y.; Keogh, J.B.; Clifton, P.M. Polyphenols and Glycemic Control. Nutrients 2016, 8, 17. [Google Scholar] [CrossRef] [Scilit]
- Schwingshackl, L.; Hoffmann, G.; Iqbal, K.; Schwedhelm, C.; Boeing, H. Food Groups and Intermediate Disease Markers: A Systematic Review and Network Meta-Analysis of Randomized Trials. Am. J. Clin. Nutr. 2018, 108, 576–586. [Google Scholar] [CrossRef] [Scilit] [PubMed]
- Schwingshackl, L.; Schwedhelm, C.; Hoffmann, G.; Lampousi, A.-M.; Knüppel, S.; Iqbal, K.; Bechthold, A.; Schlesinger, S.; Boeing, H. Food Groups and Risk of All-Cause Mortality: A Systematic Review and Meta-Analysis of Prospective Studies. Am. J. Clin. Nutr. 2017, 105, 1462–1473. [Google Scholar] [CrossRef] [Scilit]
- Tang, J.; Wan, Y.; Zhao, M.; Zhong, H.; Zheng, J.-S.; Feng, F. Legume and Soy Intake and Risk of Type 2 Diabetes: A Systematic Review and Meta-Analysis of Prospective Cohort Studies. Am. J. Clin. Nutr. 2020, 111, 677–688. [Google Scholar] [CrossRef] [Scilit] [PubMed]
- Li, W.; Ruan, W.; Peng, Y.; Wang, D. Soy and the Risk of Type 2 Diabetes Mellitus: A Systematic Review and Meta-Analysis of Observational Studies. Diabetes Res. Clin. Pract. 2018, 137, 190–199. [Google Scholar] [CrossRef] [Scilit] [PubMed]
- Chen, R.; Xu, J.; Wang, Y.; Jiang, B.; Xu, X.; Lan, Y.; Wang, J.; Lin, X. Prevalence of Sarcopenia and Its Association with Clinical Outcomes in Heart Failure: An Updated Meta-analysis and Systematic Review. Clin. Cardiol. 2023, 46, 260–268. [Google Scholar] [CrossRef] [Scilit]
- Kaga, H.; Tamura, Y.; Someya, Y.; Naito, H.; Tabata, H.; Kakehi, S.; Yamasaki, N.; Sato, M.; Kadowaki, S.; Suzuki, R.; et al. Prediabetes Is an Independent Risk Factor for Sarcopenia in Older Men, but Not in Older Women: The Bunkyo Health Study. J. Cachexia Sarcopenia Muscle 2022, 13, 2835–2842. [Google Scholar] [CrossRef] [Scilit] [PubMed]
- Li, S.; Mao, J.; Zhou, W. Prediabetes Is Associated with Loss of Appendicular Skeletal Muscle Mass and Sarcopenia. Front. Nutr. 2023, 10, 1109824. [Google Scholar] [CrossRef] [Scilit] [PubMed]
- Qiao, Y.S.; Chai, Y.H.; Gong, H.J.; Zhuldyz, Z.; Stehouwer, C.D.A.; Zhou, J.B.; Simó, R. The Association Between Diabetes Mellitus and Risk of Sarcopenia: Accumulated Evidences From Observational Studies. Front. Endocrinol. 2021, 12, 782391. [Google Scholar] [CrossRef] [Scilit] [PubMed]
- Díaz-Rizzolo, D.A.; Serra, A.; Colungo, C.; Sala-Vila, A.; Sisó-Almirall, A.; Gomis, R. Type 2 Diabetes Preventive Effects with a 12-Months Sardine-Enriched Diet in Elderly Population with Prediabetes: An Interventional, Randomized and Controlled Trial. Clin. Nutr. 2021, 40, 2587–2598. [Google Scholar] [CrossRef] [Scilit] [PubMed]
- Rajabi-Naeeni, M.; Dolatian, M.; Qorbani, M.; Vaezi, A.A. The Effect of Omega-3 and Vitamin D Co-Supplementation on Glycemic Control and Lipid Profiles in Reproductive-Aged Women with Pre-Diabetes and Hypovitaminosis D: A Randomized Controlled Trial. Diabetol. Metab. Syndr. 2020, 12, 41. [Google Scholar] [CrossRef] [Scilit]
- Weta, I.W.; Sutirtayasa, I.W.P.; Subawa, A.A.N.S.N.; Malik, S.G. Supplementation 2000 mg and 1000 mg of Linoleic Acid and Alfa Linolenic Acid Delayed Pre Diabetic State in Balinese Young Obese Women: A Randomised Clinical Trial. Bali Med. J. 2017, 6, 55. [Google Scholar] [CrossRef] [Scilit]
- Jamilian, M.; Samimi, M.; Mirhosseini, N.; Afshar Ebrahimi, F.; Aghadavod, E.; Talaee, R.; Jafarnejad, S.; Hashemi Dizaji, S.; Asemi, Z. The Influences of Vitamin D and Omega-3 Co-Supplementation on Clinical, Metabolic and Genetic Parameters in Women with Polycystic Ovary Syndrome. J. Affect. Disord. 2018, 238, 32–38. [Google Scholar] [CrossRef] [Scilit] [PubMed]
- Njike, V.Y.; Ayettey, R.; Treu, J.A.; Doughty, K.N.; Katz, D.L. Post-Prandial Effects of High-Polyphenolic Extra Virgin Olive Oil on Endothelial Function in Adults at Risk for Type 2 Diabetes: A Randomized Controlled Crossover Trial. Int. J. Cardiol. 2021, 330, 171–176. [Google Scholar] [CrossRef] [Scilit]
- Carnevale, R.; Loffredo, L.; Del Ben, M.; Angelico, F.; Nocella, C.; Petruccioli, A.; Bartimoccia, S.; Monticolo, R.; Cava, E.; Violi, F. Extra Virgin Olive Oil Improves Post-Prandial Glycemic and Lipid Profile in Patients with Impaired Fasting Glucose. Clin. Nutr. 2017, 36, 782–787. [Google Scholar] [CrossRef] [Scilit]
- Bartimoccia, S.; Cammisotto, V.; Nocella, C.; Del Ben, M.; D’Amico, A.; Castellani, V.; Baratta, F.; Pignatelli, P.; Loffredo, L.; Violi, F.; et al. Extra Virgin Olive Oil Reduces Gut Permeability and Metabolic Endotoxemia in Diabetic Patients. Nutrients 2022, 14, 2153. [Google Scholar] [CrossRef] [Scilit] [PubMed]
- Abshirini, M.; Mahaki, B.; Bagheri, F.; Siassi, F.; Koohdani, F.; Qorbani, M.; Yavari, P.; Sotoudeh, G. Dietary Fat Quality and Pre-Diabetes: A Case-Control Study. Int. J. Prev. Med. 2020, 11, 160. [Google Scholar] [CrossRef] [Scilit] [PubMed]
- Mirmiran, P.; Esfandyari, S.; Moghadam, S.K.; Bahadoran, Z.; Azizi, F. Fatty Acid Quality and Quantity of Diet and Risk of Type 2 Diabetes in Adults: Tehran Lipid and Glucose Study. J. Diabetes Complicat. 2018, 32, 655–659. [Google Scholar] [CrossRef] [Scilit]
- Nanri, A.; Mizoue, T.; Noda, M.; Takahashi, Y.; Matsushita, Y.; Poudel-Tandukar, K.; Kato, M.; Oba, S.; Inoue, M.; Tsugane, S. Fish Intake and Type 2 Diabetes in Japanese Men and Women: The Japan Public Health Center–Based Prospective Study. Am. J. Clin. Nutr. 2011, 94, 884–891. [Google Scholar] [CrossRef] [Scilit]
- Ibsen, D.B.; Warberg, C.K.; Würtz, A.M.L.; Overvad, K.; Dahm, C.C. Substitution of Red Meat with Poultry or Fish and Risk of Type 2 Diabetes: A Danish Cohort Study. Eur. J. Nutr. 2019, 58, 2705–2712. [Google Scholar] [CrossRef] [Scilit] [PubMed]
- Chen, G.-C.; Arthur, R.; Qin, L.-Q.; Chen, L.-H.; Mei, Z.; Zheng, Y.; Li, Y.; Wang, T.; Rohan, T.E.; Qi, Q. Association of Oily and Nonoily Fish Consumption and Fish Oil Supplements with Incident Type 2 Diabetes: A Large Population-Based Prospective Study. Diabetes Care 2021, 44, 672–680. [Google Scholar] [CrossRef] [Scilit] [PubMed]
- Xun, P.; He, K. Fish Consumption and Incidence of Diabetes. Diabetes Care 2012, 35, 930–938. [Google Scholar] [CrossRef] [Scilit]
- Schwingshackl, L.; Lampousi, A.-M.; Portillo, M.P.; Romaguera, D.; Hoffmann, G.; Boeing, H. Olive Oil in the Prevention and Management of Type 2 Diabetes Mellitus: A Systematic Review and Meta-Analysis of Cohort Studies and Intervention Trials. Nutr. Diabetes 2017, 7, e262. [Google Scholar] [CrossRef] [Scilit] [PubMed]
- Rasouli, N.; Brodsky, I.G.; Chatterjee, R.; Kim, S.H.; Pratley, R.E.; Staten, M.A.; Pittas, A.G.; D2d Research Group. Effects of Vitamin D Supplementation on Insulin Sensitivity and Secretion in Prediabetes. J. Clin. Endocrinol. Metab. 2022, 107, 230–240. [Google Scholar] [CrossRef] [Scilit]
- Banerjee, A.; Khemka, V.K.; Roy, D.; Poddar, J.; Roy, T.K.S.; Karnam, S.A. Role of Serum Adiponectin and Vitamin D in Prediabetes and Diabetes Mellitus. Can. J. Diabetes 2017, 41, 259–265. [Google Scholar] [CrossRef] [Scilit]
- Zhu, J.; Chen, C.; Lu, L.; Yang, K.; Reis, J.; He, K. Intakes of Folate, Vitamin B6, and Vitamin B12 in Relation to Diabetes Incidence Among American Young Adults: A 30-Year Follow-up Study. Diabetes Care 2020, 43, 2426–2434. [Google Scholar] [CrossRef] [Scilit]
- Jin, G.; Wang, J.; Jiang, X. Association of Folate, Vitamin B-12 and Vitamin B-6 Intake with Diabetes and Prediabetes in Adults Aged 20 Years and Older. Asia Pac. J. Clin. Nutr. 2021, 30, 75–86. [Google Scholar] [CrossRef] [Scilit]
- Wilson, R.; Willis, J.; Gearry, R.; Skidmore, P.; Fleming, E.; Frampton, C.; Carr, A. Inadequate Vitamin C Status in Prediabetes and Type 2 Diabetes Mellitus: Associations with Glycaemic Control, Obesity, and Smoking. Nutrients 2017, 9, 997. [Google Scholar] [CrossRef] [Scilit] [PubMed]
- Zhang, Y.; Tan, H.; Tang, J.; Li, J.; Chong, W.; Hai, Y.; Feng, Y.; Lunsford, L.D.; Xu, P.; Jia, D.; et al. Effects of Vitamin D Supplementation on Prevention of Type 2 Diabetes in Patients with Prediabetes: A Systematic Review and Meta-Analysis. Diabetes Care 2020, 43, 1650–1658. [Google Scholar] [CrossRef] [Scilit] [PubMed]
- Lind, M.V.; Lauritzen, L.; Kristensen, M.; Ross, A.B.; Eriksen, J.N. Effect of Folate Supplementation on Insulin Sensitivity and Type 2 Diabetes: A Meta-Analysis of Randomized Controlled Trials. Am. J. Clin. Nutr. 2019, 109, 29–42. [Google Scholar] [CrossRef] [Scilit] [PubMed]
- Ashor, A.W.; Werner, A.D.; Lara, J.; Willis, N.D.; Mathers, J.C.; Siervo, M. Effects of Vitamin C Supplementation on Glycaemic Control: A Systematic Review and Meta-Analysis of Randomised Controlled Trials. Eur. J. Clin. Nutr. 2017, 71, 1371–1380. [Google Scholar] [CrossRef] [Scilit]
- Xu, R.; Zhang, S.; Tao, A.; Chen, G.; Zhang, M. Influence of Vitamin E Supplementation on Glycaemic Control: A Meta-Analysis of Randomised Controlled Trials. PLoS ONE 2014, 9, e95008. [Google Scholar] [CrossRef] [Scilit]
- Pittas, A.G.; Harris, S.S.; Stark, P.C.; Dawson-Hughes, B. The Effects of Calcium and Vitamin D Supplementation on Blood Glucose and Markers of Inflammation in Nondiabetic Adults. Diabetes Care 2007, 30, 980–986. [Google Scholar] [CrossRef] [Scilit]
- Ali, A.; Ma, Y.; Reynolds, J.; Wise, J.P.; Inzucchi, S.E.; Katz, D.L. Chromium effects on glucose tolerance and insulin sesitivity in persons at risk for diabetes mellitus. Endocr. Pr. 2011, 17, 16. [Google Scholar] [CrossRef] [Scilit]
- Zhou, Q.; Guo, W.; Jia, Y.; Xu, J. Serum and Urinary Selenium Status in Patients with the Pre-Diabetes and Diabetes in Northeast China. Biol. Trace Elem. Res. 2019, 191, 61–69. [Google Scholar] [CrossRef] [Scilit] [PubMed]
- Xu, J.; Zhou, Q.; Liu, G.; Tan, Y.; Cai, L. Analysis of Serum and Urinal Copper and Zinc in Chinese Northeast Population with the Prediabetes or Diabetes with and without Complications. Oxid. Med. Cell Longev. 2013, 2013, 635214. [Google Scholar] [CrossRef] [Scilit]
- Hruby, A.; Meigs, J.B.; O’Donnell, C.J.; Jacques, P.F.; McKeown, N.M. Higher Magnesium Intake Reduces Risk of Impaired Glucose and Insulin Metabolism and Progression from Prediabetes to Diabetes in Middle-Aged Americans. Diabetes Care 2014, 37, 419–427. [Google Scholar] [CrossRef] [Scilit] [PubMed]
- Kieboom, B.C.T.; Ligthart, S.; Dehghan, A.; Kurstjens, S.; de Baaij, J.H.F.; Franco, O.H.; Hofman, A.; Zietse, R.; Stricker, B.H.; Hoorn, E.J. Serum Magnesium and the Risk of Prediabetes: A Population-Based Cohort Study. Diabetologia 2017, 60, 843–853. [Google Scholar] [CrossRef] [Scilit]
- Guerrero-Romero, F.; Rascón-Pacheco, R.A.; Rodríguez-Morán, M.; De La Peña, J.E.; Wacher, N.; Chavez-Negrete, A.; Madero, A.; Salcedo, A.; Medina-Escobedo, C.E.; Revilla-Monsalve, C.; et al. Hypomagnesaemia and Risk for Metabolic Glucose Disorders: A 10-Year Follow-up Study. Eur. J. Clin. Investig. 2008, 38, 389–396. [Google Scholar] [CrossRef] [Scilit]
- Wu, F.; Juonala, M.; Pahkala, K.; Buscot, M.J.; Sabin, M.A.; Pitkanen, N.; Ronnemaa, T.; Jula, A.; Lehtimaki, T.; Hutri-Kahonen, N.; et al. Youth and Long-Term Dietary Calcium Intake with Risk of Impaired Glucose Metabolism and Type 2 Diabetes in Adulthood. J. Clin. Endocrinol. Metab. 2019, 104, 2067–2074. [Google Scholar] [CrossRef] [Scilit] [PubMed]
- Alissa, E.M.; Bahjri, S.M.; Ahmed, W.H.; Al-Ama, N.; Ferns, G.A.A. Chromium Status and Glucose Tolerance in Saudi Men with and without Coronary Artery Disease. Biol. Trace Elem. Res. 2009, 131, 215–228. [Google Scholar] [CrossRef] [Scilit] [PubMed]
- Capdor, J.; Foster, M.; Petocz, P.; Samman, S. Zinc and Glycemic Control: A Meta-Analysis of Randomised Placebo Controlled Supplementation Trials in Humans. J. Trace Elem. Med. Biol. 2013, 27, 137–142. [Google Scholar] [CrossRef] [Scilit] [PubMed]
- Wang, X.; Wu, W.; Zheng, W.; Fang, X.; Chen, L.; Rink, L.; Min, J.; Wang, F. Zinc Supplementation Improves Glycemic Control for Diabetes Prevention and Management: A Systematic Review and Meta-Analysis of Randomized Controlled Trials. Am. J. Clin. Nutr. 2019, 110, 76–90. [Google Scholar] [CrossRef] [Scilit]
- Althuis, M.D.; Jordan, N.E.; Ludington, E.A.; Wittes, J.T. Glucose and Insulin Responses to Dietary Chromium Supplements: A Meta-Analysis. Am. J. Clin. Nutr. 2002, 76, 148–155. [Google Scholar] [CrossRef] [Scilit] [PubMed]
- Wang, Z.Q.; Cefalu, W.T. Current Concepts about Chromium Supplementation in Type 2 Diabetes and Insulin Resistance. Curr. Diabetis Rep. 2010, 10, 145–151. [Google Scholar] [CrossRef] [Scilit]
- Liu, Y.; Chai, S.; Zhang, X. Effect of Sarcopenia, Osteoporosis, and Osteosarcopenia on Spine Fracture in American Adults with Prediabetes. Front. Endocrinol. 2023, 14, 1163029. [Google Scholar] [CrossRef] [Scilit]
- Barouti, A.A.; Tynelius, P.; Lager, A.; Björklund, A. Fruit and Vegetable Intake and Risk of Prediabetes and Type 2 Diabetes: Results from a 20-Year Long Prospective Cohort Study in Swedish Men and Women. Eur. J. Nutr. 2022, 61, 3175–3187. [Google Scholar] [CrossRef] [Scilit]
- Li, L.; Yang, H.-Y.; Ma, Y.; Liang, X.-H.; Xu, M.; Zhang, J.; Huang, Z.-X.; Meng, L.-H.; Zhou, J.; Xian, J.; et al. Whole Fresh Fruit Intake and Risk of Incident Diabetes in Different Glycemic Stages: A Nationwide Prospective Cohort Investigation. Eur. J. Nutr. 2022, 62, 771–782. [Google Scholar] [CrossRef] [Scilit] [PubMed]
- Wu, C.; Liu, P.; Yuan, Z. Fruit and Vegetable Intake Is Inversely Associated with Type 2 Diabetes in Chinese Women: Results from the China Health and Nutrition Survey. Int. J. Food Sci. Nutr. 2021, 72, 208–218. [Google Scholar] [CrossRef] [Scilit] [PubMed]
- Zhang, S.; Meng, G.; Zhang, Q.; Liu, L.; Yao, Z.; Wu, H.; Gu, Y.; Wang, Y.; Zhang, T.; Wang, X.; et al. Dietary Fibre Intake and Risk of Prediabetes in China: Results from the Tianjin Chronic Low-Grade Systemic Inflammation and Health (TCLSIH) Cohort Study. Br. J. Nutr. 2022, 128, 753–761. [Google Scholar] [CrossRef] [Scilit] [PubMed]
- Lopez-Ridaura, R.; Willett, W.C.; Rimm, E.B.; Liu, S.; Stampfer, M.J.; Manson, J.E.; Hu, F.B. Magnesium Intake and Risk of Type 2 Diabetes in Men and Women. Diabetes Care 2004, 27, 134–140. [Google Scholar] [CrossRef] [Scilit] [PubMed]
- Li, M.; Fan, Y.; Zhang, X.; Hou, W.; Tang, Z. Fruit and Vegetable Intake and Risk of Type 2 Diabetes Mellitus: Meta-Analysis of Prospective Cohort Studies. BMJ Open 2014, 4, e005497. [Google Scholar] [CrossRef] [Scilit] [PubMed]
- Gulati, S.; Misra, A.; Tiwari, R.; Sharma, M.; Pandey, R.M.; Upadhyay, A.D.; Chandra Sati, H. Premeal Almond Load Decreases Postprandial Glycaemia, Adiposity and Reversed Prediabetes to Normoglycemia: A Randomized Controlled Trial. Clin. Nutr. ESPEN 2023, 54, 12–22. [Google Scholar] [CrossRef] [Scilit]
- Casas-Agustench, P.; López-Uriarte, P.; Bulló, M.; Ros, E.; Cabré-Vila, J.J.; Salas-Salvadó, J. Effects of One Serving of Mixed Nuts on Serum Lipids, Insulin Resistance and Inflammatory Markers in Patients with the Metabolic Syndrome. Nutr. Metab. Cardiovasc. Dis. 2011, 21, 126–135. [Google Scholar] [CrossRef] [Scilit] [PubMed]
- Hou, Y.-Y.; Ojo, O.; Wang, L.-L.; Wang, Q.; Jiang, Q.; Shao, X.-Y.; Wang, X.-H. A Randomized Controlled Trial to Compare the Effect of Peanuts and Almonds on the Cardio-Metabolic and Inflammatory Parameters in Patients with Type 2 Diabetes Mellitus. Nutrients 2018, 10, 1565. [Google Scholar] [CrossRef] [Scilit]
- Wien, M.; Bleich, D.; Raghuwanshi, M.; Gould-Forgerite, S.; Gomes, J.; Monahan-Couch, L.; Oda, K. Almond Consumption and Cardiovascular Risk Factors in Adults with Prediabetes. J. Am. Coll. Nutr. 2010, 29, 189–197. [Google Scholar] [CrossRef] [Scilit] [PubMed]
- Lu, L.W.; Silvestre, M.P.; Sequeira, I.R.; Plank, L.D.; Foster, M.; Middleditch, N.; Acevedo-Fani, A.; Hollingsworth, K.G.; Poppitt, S.D. A Higher-Protein Nut-Based Snack Product Suppresses Glycaemia and Decreases Glycaemic Response to Co-Ingested Carbohydrate in an Overweight Prediabetic Asian Chinese Cohort: The Tū Ora Postprandial RCT. J. Nutr. Sci. 2021, 10, e30. [Google Scholar] [CrossRef] [Scilit]
- Carroll, H.A.; Davis, M.G.; Papadaki, A. Higher Plain Water Intake Is Associated with Lower Type 2 Diabetes Risk: A Cross-Sectional Study in Humans. Nutr. Res. 2015, 35, 865–872. [Google Scholar] [CrossRef] [Scilit] [PubMed]
- Carroll, H.A.; Betts, J.A.; Johnson, L. An Investigation into the Relationship between Plain Water Intake and Glycated Hb (HbA1c): A Sex-Stratified, Cross-Sectional Analysis of the UK National Diet and Nutrition Survey (2008–2012). Br. J. Nutr. 2016, 116, 1–11. [Google Scholar] [CrossRef] [Scilit] [PubMed]
- Maersk, M.; Belza, A.; Stødkilde-Jørgensen, H.; Ringgaard, S.; Chabanova, E.; Thomsen, H.; Pedersen, S.B.; Astrup, A.; Richelsen, B. Sucrose-Sweetened Beverages Increase Fat Storage in the Liver, Muscle, and Visceral Fat Depot: A 6-Mo Randomized Intervention Study. Am. J. Clin. Nutr. 2012, 95, 283–289. [Google Scholar] [CrossRef] [Scilit] [PubMed]
- Raben, A.; Vasilaras, T.H.; Møller, A.C.; Astrup, A. Sucrose Compared with Artificial Sweeteners: Different Effects on Ad Libitum Food Intake and Body Weight after 10 Wk of Supplementation in Overweight Subjects. Am. J. Clin. Nutr. 2002, 76, 721–729. [Google Scholar] [CrossRef] [Scilit] [PubMed]
- Sylvetsky, A.C.; Jin, Y.; Clark, E.J.; Welsh, J.A.; Rother, K.I.; Talegawkar, S.A. Consumption of Low-Calorie Sweeteners among Children and Adults in the United States. J. Acad. Nutr. Diet. 2017, 117, 441–448.e2. [Google Scholar] [CrossRef] [Scilit] [PubMed]
- Drouin-Chartier, J.-P.; Zheng, Y.; Li, Y.; Malik, V.; Pan, A.; Bhupathiraju, S.N.; Tobias, D.K.; Manson, J.E.; Willett, W.C.; Hu, F.B. Changes in Consumption of Sugary Beverages and Artificially Sweetened Beverages and Subsequent Risk of Type 2 Diabetes: Results from Three Large Prospective U.S. Cohorts of Women and Men. Diabetes Care 2019, 42, 2181–2189. [Google Scholar] [CrossRef] [Scilit]
- Toews, I.; Lohner, S.; Küllenberg de Gaudry, D.; Sommer, H.; Meerpohl, J.J. Association between Intake of Non-Sugar Sweeteners and Health Outcomes: Systematic Review and Meta-Analyses of Randomised and Non-Randomised Controlled Trials and Observational Studies. BMJ 2019, 364, k4718. [Google Scholar] [CrossRef] [Scilit]
- Khan, T.A.; Lee, J.J.; Ayoub-Charette, S.; Noronha, J.C.; McGlynn, N.; Chiavaroli, L.; Sievenpiper, J.L. WHO Guideline on the Use of Non-Sugar Sweeteners: A Need for Reconsideration. Eur. J. Clin. Nutr. 2023, 77, 1009–1013. [Google Scholar] [CrossRef] [Scilit]
- ElSayed, N.A.; Aleppo, G.; Aroda, V.R.; Bannuru, R.R.; Brown, F.M.; Bruemmer, D.; Collins, B.S.; Hilliard, M.E.; Isaacs, D.; Johnson, E.L.; et al. 15. Management of Diabetes in Pregnancy: Standards of Care in Diabetes-2023. Diabetes Care 2023, 46, S254–S266. [Google Scholar] [CrossRef] [Scilit]
- Franz, M.J.; MacLeod, J.; Evert, A.; Brown, C.; Gradwell, E.; Handu, D.; Reppert, A.; Robinson, M. Academy of Nutrition and Dietetics Nutrition Practice Guideline for Type 1 and Type 2 Diabetes in Adults: Systematic Review of Evidence for Medical Nutrition Therapy Effectiveness and Recommendations for Integration into the Nutrition Care Process. J. Acad. Nutr. Diet. 2017, 117, 1659–1679. [Google Scholar] [CrossRef] [Scilit]
- Hedrick, V.E.; Nieto, C.; Grilo, M.F.; Sylvetsky, A.C. Non-Sugar Sweeteners: Helpful or Harmful? The Challenge of Developing Intake Recommendations with the Available Research. BMJ 2023, 383, e075293. [Google Scholar] [CrossRef] [Scilit] [PubMed]
- Gepner, Y.; Golan, R.; Harman-Boehm, I.; Henkin, Y.; Schwarzfuchs, D.; Shelef, I.; Durst, R.; Kovsan, J.; Bolotin, A.; Leitersdorf, E.; et al. Effects of Initiating Moderate Alcohol Intake on Cardiometabolic Risk in Adults with Type 2 Diabetes. Ann. Intern. Med. 2015, 163, 569–579. [Google Scholar] [CrossRef] [Scilit]
- da Luz, P.L.; Coimbra, S.; Favarato, D.; Albuquerque, C.; Mochiduky, R.I.; Rochitte, C.E.; Hojaij, E.; Gonsalves, C.R.L.; Laurindo, F.R. Coronary Artery Plaque Burden and Calcium Scores in Healthy Men Adhering to Long-Term Wine Drinking or Alcohol Abstinence. Braz. J. Med. Biol. Res. 2014, 47, 697–705. [Google Scholar] [CrossRef] [Scilit] [PubMed]
- Blomster, J.I.; Zoungas, S.; Chalmers, J.; Li, Q.; Chow, C.K.; Woodward, M.; Mancia, G.; Poulter, N.; Williams, B.; Harrap, S.; et al. The Relationship Between Alcohol Consumption and Vascular Complications and Mortality in Individuals with Type 2 Diabetes. Diabetes Care 2014, 37, 1353–1359. [Google Scholar] [CrossRef] [Scilit] [PubMed]
- Li, M.J.; Ren, J.; Zhang, W.S.; Jiang, C.Q.; Jin, Y.L.; Lam, T.H.; Cheng, K.K.; Thomas, G.N.; Xu, L. Association of Alcohol Drinking with Incident Type 2 Diabetes and Pre-diabetes: The Guangzhou Biobank Cohort Study. Diabetes Metab. Res. Rev. 2022, 38, e3548. [Google Scholar] [CrossRef] [Scilit]
- Cullmann, M.; Hilding, A.; Östenson, C.-G. Alcohol Consumption and Risk of Pre-diabetes and Type 2 Diabetes Development in a Swedish Population. Diabet. Med. 2012, 29, 441–452. [Google Scholar] [CrossRef] [Scilit]
- Suebsamran, P.; Choenchoopon, H.; Rojanasaksothorn, S.; Loiha, S.; Chamnan, P. Association between Alcohol Consumption and Pre-Diabetes among 383,442 Thai Population Aged 15 Years and Older in Ubon Ratchathani: Analytical Cross-Sectional Study. J. Med. Assoc. Thai 2016, 99 (Suppl. S1), S35–S42. [Google Scholar]
- Baliunas, D.O.; Taylor, B.J.; Irving, H.; Roerecke, M.; Patra, J.; Mohapatra, S.; Rehm, J. Alcohol as a Risk Factor for Type 2 Diabetes. Diabetes Care 2009, 32, 2123–2132. [Google Scholar] [CrossRef] [Scilit]
- Arion, W.J.; Canfield, W.K.; Ramos, F.C.; Schindler, P.W.; Burger, H.-J.; Hemmerle, H.; Schubert, G.; Below, P.; Herling, A.W. Chlorogenic Acid and Hydroxynitrobenzaldehyde: New Inhibitors of Hepatic Glucose 6-Phosphatase. Arch. Biochem. Biophys. 1997, 339, 315–322. [Google Scholar] [CrossRef] [Scilit]
- Yanagimoto, A.; Matsui, Y.; Yamaguchi, T.; Saito, S.; Hanada, R.; Hibi, M. Acute Dose–Response Effectiveness of Combined Catechins and Chlorogenic Acids on Postprandial Glycemic Responses in Healthy Men: Results from Two Randomized Studies. Nutrients 2023, 15, 777. [Google Scholar] [CrossRef] [Scilit]
- Sakhi, A.K.; Andersen, L.F.; Jacobs, D.R.; Blomhoff, R.; Svilaas, A.; Svilaas, T.; Ström, E.C.; Ose, L. Intakes of Antioxidants in Coffee, Wine, and Vegetables Are Correlated with Plasma Carotenoids in Humans. J. Nutr. 2004, 134, 562–567. [Google Scholar] [CrossRef] [Scilit] [PubMed]
- Poole, R.; Kennedy, O.J.; Roderick, P.; Fallowfield, J.A.; Hayes, P.C.; Parkes, J. Coffee Consumption and Health: Umbrella Review of Meta-Analyses of Multiple Health Outcomes. BMJ 2017, 359, j5024. [Google Scholar] [CrossRef] [Scilit] [PubMed]
- Ding, M.; Bhupathiraju, S.N.; Chen, M.; van Dam, R.M.; Hu, F.B. Caffeinated and Decaffeinated Coffee Consumption and Risk of Type 2 Diabetes: A Systematic Review and a Dose-Response Meta-Analysis. Diabetes Care 2014, 37, 569–586. [Google Scholar] [CrossRef] [Scilit] [PubMed]
- van Dam, R.M. Coffee Consumption and Risk of Type 2 Diabetes, Cardiovascular Diseases, and Cancer. Appl. Physiol. Nutr. Metab. 2008, 33, 1269–1283. [Google Scholar] [CrossRef] [Scilit] [PubMed]
- Meng, S.; Cao, J.; Feng, Q.; Peng, J.; Hu, Y. Roles of Chlorogenic Acid on Regulating Glucose and Lipids Metabolism: A Review. Evid. Based Complement. Altern. Med. 2013, 2013, 801457. [Google Scholar] [CrossRef] [Scilit] [PubMed]
- Jung, M.E.; Bourne, J.E.; Beauchamp, M.R.; Robinson, E.; Little, J.P. High-Intensity Interval Training as an Efficacious Alternative to Moderate-Intensity Continuous Training for Adults with Prediabetes. J. Diabetes Res. 2015, 2015, 191595. [Google Scholar] [CrossRef] [Scilit]
- Snowling, N.J.; Hopkins, W.G. Effects of Different Modes of Exercise Training on Glucose Control and Risk Factors for Complications in Type 2 Diabetic Patients: A Meta-Analysis. Diabetes Care 2006, 29, 2518–2527. [Google Scholar] [CrossRef] [Scilit] [PubMed]
- De Nardi, A.T.; Tolves, T.; Lenzi, T.L.; Signori, L.U.; Silva, A.M.V. da High-Intensity Interval Training versus Continuous Training on Physiological and Metabolic Variables in Prediabetes and Type 2 Diabetes: A Meta-Analysis. Diabetes Res. Clin. Pr. 2018, 137, 149–159. [Google Scholar] [CrossRef] [Scilit]
- Jadhav, R.A.; Maiya, G.A.; Hombali, A.; Umakanth, S.; Shivashankar, K.N. Effect of Physical Activity Promotion on Adiponectin, Leptin and Other Inflammatory Markers in Prediabetes: A Systematic Review and Meta-Analysis of Randomized Controlled Trials. Acta Diabetol. 2021, 58, 419–429. [Google Scholar] [CrossRef] [Scilit] [PubMed]
- Qin, J.; Li, Y.; Cai, Z.; Li, S.; Zhu, J.; Zhang, F.; Liang, S.; Zhang, W.; Guan, Y.; Shen, D.; et al. A Metagenome-Wide Association Study of Gut Microbiota in Type 2 Diabetes. Nature 2012, 490, 55–60. [Google Scholar] [CrossRef] [Scilit]
- Larsen, N.; Vogensen, F.K.; van den Berg, F.W.J.; Nielsen, D.S.; Andreasen, A.S.; Pedersen, B.K.; Al-Soud, W.A.; Sørensen, S.J.; Hansen, L.H.; Jakobsen, M. Gut Microbiota in Human Adults with Type 2 Diabetes Differs from Non-Diabetic Adults. PLoS ONE 2010, 5, e9085. [Google Scholar] [CrossRef] [Scilit]
- Tang, W.H.W.; Wang, Z.; Li, X.S.; Fan, Y.; Li, D.S.; Wu, Y.; Hazen, S.L. Increased Trimethylamine N-Oxide Portends High Mortality Risk Independent of Glycemic Control in Patients with Type 2 Diabetes Mellitus. Clin. Chem. 2017, 63, 297–306. [Google Scholar] [CrossRef] [Scilit]
- Li, Y.; Wang, D.D.; Chiuve, S.E.; Manson, J.E.; Willett, W.C.; Hu, F.B.; Qi, L. Dietary Phosphatidylcholine Intake and Type 2 Diabetes in Men and Women. Diabetes Care 2015, 38, e13–e14. [Google Scholar] [CrossRef] [Scilit] [PubMed]
- Roy, S.; Yuzefpolskaya, M.; Nandakumar, R.; Colombo, P.C.; Demmer, R.T. Plasma Trimethylamine-N-Oxide and Impaired Glucose Regulation: Results from The Oral Infections, Glucose Intolerance and Insulin Resistance Study (ORIGINS). PLoS ONE 2020, 15, e0227482. [Google Scholar] [CrossRef] [Scilit] [PubMed]
- Allin, K.H.; Tremaroli, V.; Caesar, R.; Jensen, B.A.H.; Damgaard, M.T.F.; Bahl, M.I.; Licht, T.R.; Hansen, T.H.; Nielsen, T.; Dantoft, T.M.; et al. Aberrant Intestinal Microbiota in Individuals with Prediabetes. Diabetologia 2018, 61, 810–820. [Google Scholar] [CrossRef] [Scilit] [PubMed]
- Zhong, H.; Ren, H.; Lu, Y.; Fang, C.; Hou, G.; Yang, Z.; Chen, B.; Yang, F.; Zhao, Y.; Shi, Z.; et al. Distinct Gut Metagenomics and Metaproteomics Signatures in Prediabetics and Treatment-Naïve Type 2 Diabetics. EBioMedicine 2019, 47, 373–383. [Google Scholar] [CrossRef] [Scilit] [PubMed]
- Letchumanan, G.; Abdullah, N.; Marlini, M.; Baharom, N.; Lawley, B.; Omar, M.R.; Mohideen, F.B.S.; Addnan, F.H.; Nur Fariha, M.M.; Ismail, Z.; et al. Gut Microbiota Composition in Prediabetes and Newly Diagnosed Type 2 Diabetes: A Systematic Review of Observational Studies. Front. Cell Infect. Microbiol. 2022, 12, 985. [Google Scholar] [CrossRef] [Scilit]
- Gurung, M.; Li, Z.; You, H.; Rodrigues, R.; Jump, D.B.; Morgun, A.; Shulzhenko, N. Role of Gut Microbiota in Type 2 Diabetes Pathophysiology. EBioMedicine 2020, 51, 102590. [Google Scholar] [CrossRef] [Scilit] [PubMed]
- Barengolts, E. Gut Microbiota, Prebiotics, Probiotics, and Synbiotics in Management of Obesity and Prediabetes: Review of Randomized Controlled Trials. Endocr. Pract. 2016, 22, 1224–1234. [Google Scholar] [CrossRef] [Scilit]
- Wang, X.; Yang, J.; Qiu, X.; Wen, Q.; Liu, M.; Zhou, D.; Chen, Q. Probiotics, Pre-Biotics and Synbiotics in the Treatment of Pre-Diabetes: A Systematic Review of Randomized Controlled Trials. Front. Public Health 2021, 9, 645035. [Google Scholar] [CrossRef] [Scilit]
- Li, Y.; Wu, Y.; Wu, L.; Qin, L.; Liu, T. The Effects of Probiotic Administration on Patients with Prediabetes: A Meta-Analysis and Systematic Review. J. Transl. Med. 2022, 20, 498. [Google Scholar] [CrossRef] [Scilit] [PubMed]
- Zeighamy Alamdary, S.; Afifirad, R.; Asgharzadeh, S.; Asadollahi, P.; Mahdizade Ari, M.; Dashtibin, S.; Sabaghan, M.; Shokouhamiri, M.R.; Ghanavati, R.; Darbandi, A. The Influence of Probiotics Consumption on Management of Prediabetic State: A Systematic Review of Clinical Trials. Int. J. Clin. Pract. 2022, 2022, 5963679. [Google Scholar] [CrossRef] [Scilit] [PubMed]
- Bock, P.M.; Telo, G.H.; Ramalho, R.; Sbaraini, M.; Leivas, G.; Martins, A.F.; Schaan, B.D. The Effect of Probiotics, Prebiotics or Synbiotics on Metabolic Outcomes in Individuals with Diabetes: A Systematic Review and Meta-Analysis. Diabetologia 2021, 64, 26–41. [Google Scholar] [CrossRef] [Scilit] [PubMed]
- Zhang, Q.; Wu, Y.; Fei, X. Effect of Probiotics on Glucose Metabolism in Patients with Type 2 Diabetes Mellitus: A Meta-Analysis of Randomized Controlled Trials. Medicina 2016, 52, 28–34. [Google Scholar] [CrossRef] [Scilit]
- Pierre, K.B.; Jones, C.M.; Stain, S.C. Benefits of Intense Glucose Control in Critically Ill Patients. Curr. Surg. 2005, 62, 277–282. [Google Scholar] [CrossRef] [Scilit] [PubMed]
- Zhang, Z.; Azizi, M.; Lee, M.; Davidowsky, P.; Lawrence, P.; Abbaspourrad, A. A Versatile, Cost-Effective, and Flexible Wearable Biosensor for in situ and ex situ Sweat Analysis, and Personalized Nutrition Assessment. Lab. Chip 2019, 19, 3448–3460. [Google Scholar] [CrossRef] [Scilit] [PubMed]
- Cui, Y.; Zhang, H.; Zhu, J.; Peng, L.; Duan, Z.; Liu, T.; Zuo, J.; Xing, L.; Liao, Z.; Wang, S.; et al. Unstimulated Parotid Saliva Is a Better Method for Blood Glucose Prediction. Appl. Sci. 2021, 11, 11367. [Google Scholar] [CrossRef] [Scilit]
- Cui, Y.; Zhang, H.; Zhu, J.; Liao, Z.; Wang, S.; Liu, W. Correlations of Salivary and Blood Glucose Levels among Six Saliva Collection Methods. Int. J. Env. Res. Public Health 2022, 19, 4122. [Google Scholar] [CrossRef] [Scilit]
- Schaffzin, J.K.; Southwick, K.L.; Clement, E.J.; Konings, F.; Ganova-Raeva, L.; Xia, G.; Khudyakov, Y.; Johnson, G.S. Transmission of Hepatitis B Virus Associated with Assisted Monitoring of Blood Glucose at an Assisted Living Facility in New York State. Am. J. Infect. Control 2012, 40, 726–731. [Google Scholar] [CrossRef] [Scilit]
- Han, B.; Liu, W.; Yang, S.; Wang, S.; Du, J.; Liu, Y.; Cui, F. Association between Self-Monitoring of Blood Glucose and Hepatitis B Virus Infection among People with Diabetes Mellitus: A Cross-Sectional Study in Gansu Province, China. BMJ Open 2021, 11, e048463. [Google Scholar] [CrossRef] [Scilit]
- Finney, S.J. Glucose Control and Mortality in Critically Ill Patients. JAMA 2003, 290, 2041. [Google Scholar] [CrossRef] [Scilit]
- Evans, J.M.; Newton, R.W.; Ruta, D.A.; MacDonald, T.M.; Stevenson, R.J.; Morris, A.D. Frequency of Blood Glucose Monitoring in Relation to Glycaemic Control: Observational Study with Diabetes Database. BMJ 1999, 319, 83–86. [Google Scholar] [CrossRef] [Scilit] [PubMed]
- Van den Berghe, G.; Wouters, P.J.; Bouillon, R.; Weekers, F.; Verwaest, C.; Schetz, M.; Vlasselaers, D.; Ferdinande, P.; Lauwers, P. Outcome Benefit of Intensive Insulin Therapy in the Critically Ill: Insulin Dose versus Glycemic Control. Crit. Care Med. 2003, 31, 359–366. [Google Scholar] [CrossRef] [Scilit] [PubMed]
- Sørgård, B.; Iversen, M.M.; Mårtensson, J. Continuous Glucose Monitoring in Adults with Type 1 Diabetes: A Balance between Benefits and Barriers: A Critical Incident Study. J. Clin. Nurs. 2019, 28, 3318–3329. [Google Scholar] [CrossRef] [Scilit] [PubMed]
- Hilliard, M.E.; Levy, W.; Anderson, B.J.; Whitehouse, A.L.; Commissariat, P.V.; Harrington, K.R.; Laffel, L.M.; Miller, K.M.; Van Name, M.; Tamborlane, W.V.; et al. Benefits and Barriers of Continuous Glucose Monitoring in Young Children with Type 1 Diabetes. Diabetes Technol. Ther. 2019, 21, 493–498. [Google Scholar] [CrossRef] [Scilit] [PubMed]
- Engler, R.; Routh, T.L.; Lucisano, J.Y. Adoption Barriers for Continuous Glucose Monitoring and Their Potential Reduction with a Fully Implanted System: Results from Patient Preference Surveys. Clin. Diabetes 2018, 36, 50–58. [Google Scholar] [CrossRef] [Scilit]
- Hayford, J.T.; Weydert, J.A.; Thompson, R.G. Validity of Urine Glucose Measurements for Estimating Plasma Glucose Concentration. Diabetes Care 1983, 6, 40–44. [Google Scholar] [CrossRef] [Scilit] [PubMed]
- Morris, L.R. Correlation Between Plasma and Urine Glucose in Diabetes. Ann. Intern. Med. 1981, 94, 469. [Google Scholar] [CrossRef] [Scilit] [PubMed]
- Malanda, U.L.; Welschen, L.M.C.; Riphagen, I.I.; Dekker, J.M.; Nijpels, G.; Bot, S.D.M. Self-Monitoring of Blood Glucose in Patients with Type 2 Diabetes Mellitus Who Are Not Using Insulin. Cochrane Database Syst. Rev. 2012, 1, CD005060. [Google Scholar] [CrossRef] [Scilit]
- Ilea, A.; Andrei, V.; Feurdean, C.N.; Băbțan, A.-M.; Petrescu, N.B.; Câmpian, R.S.; Boșca, A.B.; Ciui, B.; Tertiș, M.; Săndulescu, R.; et al. Saliva, a Magic Biofluid Available for Multilevel Assessment and a Mirror of General Health-A Systematic Review. Biosensors 2019, 9, 27. [Google Scholar] [CrossRef] [Scilit]
- Macdonald-Clarke, C.J.; Martin, B.R.; McCabe, L.D.; McCabe, G.P.; Lachcik, P.J.; Wastney, M.; Weaver, C.M. Bioavailability of Potassium from Potatoes and Potassium Gluconate: A Randomized Dose Response Trial. Am. J. Clin. Nutr. 2016, 104, 346–353. [Google Scholar] [CrossRef] [Scilit] [PubMed]
- Garber, A.J.; Handelsman, Y.; Grunberger, G.; Einhorn, D.; Abrahamson, M.J.; Barzilay, J.I.; Blonde, L.; Bush, M.A.; DeFronzo, R.A.; Garber, J.R.; et al. Consensus statement by the american association of clinical endocrinologists and american college of endocrinology on the comprehensive type 2 diabetes management algorithm—2020 executive summary. Endocrinol. Pract. 2020, 26, 107–139. [Google Scholar] [CrossRef] [Scilit] [PubMed]
- Campbell, A.P.; Rains, T.M. Dietary Protein Is Important in the Practical Management of Prediabetes and Type 2 Diabetes. J. Nutr. 2015, 145, 164S–169S. [Google Scholar] [CrossRef] [Scilit] [PubMed]
- Nuttall, F.Q.; Mooradian, A.D.; Gannon, M.C.; Billington, C.; Krezowski, P. Effect of Protein Ingestion on the Glucose and Insulin Response to a Standardized Oral Glucose Load. Diabetes Care 1984, 7, 465–470. [Google Scholar] [CrossRef] [Scilit] [PubMed]
- Rietman, A.; Schwarz, J.; Tomé, D.; Kok, F.J.; Mensink, M. High Dietary Protein Intake, Reducing or Eliciting Insulin Resistance? Eur. J. Clin. Nutr. 2014, 68, 973–979. [Google Scholar] [CrossRef] [Scilit]
- Stentz, F.B.; Mikhael, A.; Kineish, O.; Christman, J.; Sands, C. High Protein Diet Leads to Prediabetes Remission and Positive Changes in Incretins and Cardiovascular Risk Factors. Nutr. Metab. Cardiovasc. Dis. 2021, 31, 1227–1237. [Google Scholar] [CrossRef] [Scilit] [PubMed]
- Ferrannini, E.; Simonson, D.C.; Katz, L.D.; Reichard, G.J.; Bevilacqua, S.; Barrett, E.J.; Olsson, M.; DeFronzo, R.A. The Disposal of an Oral Glucose Load in Patients with Non-Insulin-Dependent Diabetes. Metabolism 1988, 37, 79–85. [Google Scholar] [CrossRef] [Scilit] [PubMed]
- Gannon, M.C.; Nuttall, F.Q.; Saeed, A.; Jordan, K.; Hoover, H. An Increase in Dietary Protein Improves the Blood Glucose Response in Persons with Type 2 Diabetes. Am. J. Clin. Nutr. 2003, 78, 734–741. [Google Scholar] [CrossRef] [Scilit]
- Ajala, O.; English, P.; Pinkney, J. Systematic Review and Meta-Analysis of Different Dietary Approaches to the Management of Type 2 Diabetes. Am. J. Clin. Nutr. 2013, 97, 505–516. [Google Scholar] [CrossRef] [Scilit]
- Clayton, Z.S.; Fusco, E.; Kern, M. Egg Consumption and Heart Health: A Review. Nutrition 2017, 37, 79–85. [Google Scholar] [CrossRef] [Scilit]
- Anderson, C.A.; Campbell, W.W. USDA 2015 Dietary Guidelines Advisory Committee Report: A Call for Bold Action to Create a Culture of Health. Nutr. Today 2015, 50, 172–173. [Google Scholar] [CrossRef] [Scilit]
- Ademiluyi, A.O.; Oboh, G. Phenolic-Rich Extracts from Selected Tropical Underutilized Legumes Inhibit α-Amylase, α-Glucosidase, and Angiotensin I Converting Enzyme in Vitro. J. Basic Clin. Physiol. Pharmacol. 2012, 23. [Google Scholar] [CrossRef] [Scilit] [PubMed]
- Kwon, Y.-I.; Apostolidis, E.; Kim, Y.-C.; Shetty, K. Health Benefits of Traditional Corn, Beans, and Pumpkin: In Vitro Studies for Hyperglycemia and Hypertension Management. J. Med. Food 2007, 10, 266–275. [Google Scholar] [CrossRef] [Scilit] [PubMed]
- Koh, L.W.; Wong, L.L.; Loo, Y.Y.; Kasapis, S.; Huang, D. Evaluation of Different Teas against Starch Digestibility by Mammalian Glycosidases. J. Agric. Food Chem. 2010, 58, 148–154. [Google Scholar] [CrossRef] [Scilit]
- Hara, Y.; Honda, M. The Inhibition of α-Amylase by Tea Polyphenols. Agric. Biol. Chem. 1990, 54, 1939–1945. [Google Scholar] [CrossRef] [Scilit]
- Kurimoto, Y.; Shibayama, Y.; Inoue, S.; Soga, M.; Takikawa, M.; Ito, C.; Nanba, F.; Yoshida, T.; Yamashita, Y.; Ashida, H.; et al. Black Soybean Seed Coat Extract Ameliorates Hyperglycemia and Insulin Sensitivity via the Activation of AMP-Activated Protein Kinase in Diabetic Mice. J. Agric. Food Chem. 2013, 61, 5558–5564. [Google Scholar] [CrossRef] [Scilit] [PubMed]
- Baothman, O.A.; Zamzami, M.A.; Taher, I.; Abubaker, J.; Abu-Farha, M. The Role of Gut Microbiota in the Development of Obesity and Diabetes. Lipids Health Dis. 2016, 15, 108. [Google Scholar] [CrossRef] [Scilit]
- Carbohydrates in Human Nutrition. Report of a Joint FAO/WHO Expert Consultation. FAO Food Nutr. Pap. 1998, 66, 1–140. [Google Scholar]
- Atkinson, F.S.; Foster-Powell, K.; Brand-Miller, J.C. International Tables of Glycemic Index and Glycemic Load Values: 2008. Diabetes Care 2008, 31, 2281–2283. [Google Scholar] [CrossRef] [Scilit]
- Xu, J.; Han, X.; Chen, Q.; Cai, M.; Tian, J.; Yan, Z.; Guo, Q.; Xu, J.; Lu, H. Association between Sarcopenia and Prediabetes among Non-Elderly US Adults. J. Endocrinol. Investig. 2023, 46, 1815–1824. [Google Scholar] [CrossRef] [Scilit]
- Stinkens, R.; Goossens, G.H.; Jocken, J.W.E.; Blaak, E.E. Targeting Fatty Acid Metabolism to Improve Glucose Metabolism. Obes. Rev. 2015, 16, 715–757. [Google Scholar] [CrossRef] [Scilit]
- Palomer, X.; Pizarro-Delgado, J.; Barroso, E.; Vázquez-Carrera, M. Palmitic and Oleic Acid: The Yin and Yang of Fatty Acids in Type 2 Diabetes Mellitus. Trends Endocrinol. Metab. 2018, 29, 178–190. [Google Scholar] [CrossRef] [Scilit] [PubMed]
- Shetty, S.; Kumari, S. Fatty Acids and Their Role in Type-2 Diabetes (Review). Exp. Ther. Med. 2021, 22, 706. [Google Scholar] [CrossRef] [Scilit] [PubMed]
- Guasch-Ferré, M.; Merino, J.; Sun, Q.; Fitó, M.; Salas-Salvadó, J. Dietary Polyphenols, Mediterranean Diet, Prediabetes, and Type 2 Diabetes: A Narrative Review of the Evidence. Oxid. Med. Cell Longev. 2017, 2017, 6723931. [Google Scholar] [CrossRef] [Scilit]
- Al-Maskari, M.Y.; Waly, M.I.; Ali, A.; Al-Shuaibi, Y.S.; Ouhtit, A. Folate and Vitamin B12 Deficiency and Hyperhomocysteinemia Promote Oxidative Stress in Adult Type 2 Diabetes. Nutrition 2012, 28, e23–e26. [Google Scholar] [CrossRef] [Scilit] [PubMed]
- Hong, S.M.; Woo, H.W.; Kim, M.K.; Kim, S.Y.; Lee, Y.-H.; Shin, D.H.; Shin, M.-H.; Chun, B.-Y.; Choi, B.Y. A Prospective Association between Dietary Folate Intake and Type 2 Diabetes Risk among Korean Adults Aged 40 Years or Older: The Korean Multi-Rural Communities Cohort (MRCohort) Study. Br. J. Nutr. 2017, 118, 1078–1088. [Google Scholar] [CrossRef] [Scilit]
- Eshak, E.S.; Iso, H.; Muraki, I.; Tamakoshi, A. Among the Water-Soluble Vitamins, Dietary Intakes of Vitamins C, B2 and Folate Are Associated with the Reduced Risk of Diabetes in Japanese Women but Not Men. Br. J. Nutr. 2019, 121, 1357–1364. [Google Scholar] [CrossRef] [Scilit]
- Paschou, S.A.; Dede, A.D.; Anagnostis, P.G.; Vryonidou, A.; Morganstein, D.; Goulis, D.G. Type 2 Diabetes and Osteoporosis: A Guide to Optimal Management. J. Clin. Endocrinol. Metab. 2017, 102, 3621–3634. [Google Scholar] [CrossRef] [Scilit] [PubMed]
- Ferrari, S.L.; Abrahamsen, B.; Napoli, N.; Akesson, K.; Chandran, M.; Eastell, R.; El-Hajj Fuleihan, G.; Josse, R.; Kendler, D.L.; Kraenzlin, M.; et al. Diagnosis and Management of Bone Fragility in Diabetes: An Emerging Challenge. Osteoporos. Int. 2018, 29, 2585–2596. [Google Scholar] [CrossRef] [Scilit]
- Suàrez, A.; Pulido, N.; Casla, A.; Casanova, B.; Arrieta, F.J.; Rovira, A. Impaired Tyrosine-Kinase Activity of Muscle Insulin Receptors from Hypomagnesaemic Rats. Diabetologia 1995, 38, 1262–1270. [Google Scholar] [CrossRef]
- Barbagallo, M.; Dominguez, L.J.; Galioto, A.; Ferlisi, A.; Cani, C.; Malfa, L.; Pineo, A.; Busardo’, A.; Paolisso, G. Role of Magnesium in Insulin Action, Diabetes and Cardio-Metabolic Syndrome X. Mol. Asp. Med. 2003, 24, 39–52. [Google Scholar] [CrossRef] [Scilit] [PubMed]
- Banaszak, M.; Górna, I.; Przysławski, J. Non-Pharmacological Treatments for Insulin Resistance: Effective Intervention of Plant-Based Diets—A Critical Review. Nutrients 2022, 14, 1400. [Google Scholar] [CrossRef] [Scilit] [PubMed]
- Kang, I.; Buckner, T.; Shay, N.F.; Gu, L.; Chung, S. Improvements in Metabolic Health with Consumption of Ellagic Acid and Subsequent Conversion into Urolithins: Evidence and Mechanisms. Adv. Nutr. 2016, 7, 961–972. [Google Scholar] [CrossRef] [Scilit]
- Duke, N.N. Youth Beverage Intake and Reported Prediabetes: Choice and Frequency Matter. J. Pediatr. Health Care 2021, 35, 216–225. [Google Scholar] [CrossRef] [Scilit] [PubMed]
- Castellarin, S.D.; Bavaresco, L.; Falginella, L.; Gonçalves, M.I.V.Z.; Di Gaspero, G.; Gerós, H.; Delrot, S. Phenolics in Grape Berry and Key Antioxidants. In The Biochemistry of the Grape Berry; Castellarin, S.D., Bavaresco, L., Falginella, L., Gonçalves, M.I.V.Z., Di Gaspero, G., Eds.; Bentham Science Publishers: Sharjah, United Arab Emirates, 2012; pp. 89–110. [Google Scholar]
- Gómez-Plaza, E.; Gil-Muñoz, R. Biochemistry of Wine and Beer. Biomolecules 2021, 11, 59. [Google Scholar] [CrossRef] [Scilit] [PubMed]
- Ridaura, V.K.; Faith, J.J.; Rey, F.E.; Cheng, J.; Duncan, A.E.; Kau, A.L.; Griffin, N.W.; Lombard, V.; Henrissat, B.; Bain, J.R.; et al. Gut Microbiota from Twins Discordant for Obesity Modulate Metabolism in Mice. Science 2013, 341, 1241214. [Google Scholar] [CrossRef] [Scilit] [PubMed]
- Safari, Z.; Gérard, P. The Links between the Gut Microbiome and Non-Alcoholic Fatty Liver Disease (NAFLD). Cell. Mol. Life Sci. 2019, 76, 1541–1558. [Google Scholar] [CrossRef] [Scilit]
- Thursby, E.; Juge, N. Introduction to the Human Gut Microbiota. Biochem. J. 2017, 474, 1823–1836. [Google Scholar] [CrossRef] [Scilit]
- Aw, W.; Fukuda, S. Understanding the Role of the Gut Ecosystem in Diabetes Mellitus. J. Diabetes Investig. 2018, 9, 5–12. [Google Scholar] [CrossRef] [Scilit] [PubMed]
- Thomas, C.; Gioiello, A.; Noriega, L.; Strehle, A.; Oury, J.; Rizzo, G.; Macchiarulo, A.; Yamamoto, H.; Mataki, C.; Pruzanski, M.; et al. TGR5-Mediated Bile Acid Sensing Controls Glucose Homeostasis. Cell Metab. 2009, 10, 167–177. [Google Scholar] [CrossRef] [Scilit]
- Amar, J.; Chabo, C.; Waget, A.; Klopp, P.; Vachoux, C.; Bermúdez-Humarán, L.G.; Smirnova, N.; Bergé, M.; Sulpice, T.; Lahtinen, S.; et al. Intestinal Mucosal Adherence and Translocation of Commensal Bacteria at the Early Onset of Type 2 Diabetes: Molecular Mechanisms and Probiotic Treatment. EMBO Mol. Med. 2011, 3, 559–572. [Google Scholar] [CrossRef] [Scilit]
- Amyot, J.; Semache, M.; Ferdaoussi, M.; Fontés, G.; Poitout, V. Lipopolysaccharides Impair Insulin Gene Expression in Isolated Islets of Langerhans via Toll-Like Receptor-4 and NF-ΚB Signalling. PLoS ONE 2012, 7, e36200. [Google Scholar] [CrossRef] [Scilit]
- Kawano, Y.; Edwards, M.; Huang, Y.; Bilate, A.M.; Araujo, L.P.; Tanoue, T.; Atarashi, K.; Ladinsky, M.S.; Reiner, S.L.; Wang, H.H.; et al. Microbiota Imbalance Induced by Dietary Sugar Disrupts Immune-Mediated Protection from Metabolic Syndrome. Cell 2022, 185, 3501–3519.e20. [Google Scholar] [CrossRef] [Scilit] [PubMed]
- Muccioli, G.G.; Naslain, D.; Bäckhed, F.; Reigstad, C.S.; Lambert, D.M.; Delzenne, N.M.; Cani, P.D. The Endocannabinoid System Links Gut Microbiota to Adipogenesis. Mol. Syst. Biol. 2010, 6, 392. [Google Scholar] [CrossRef] [Scilit] [PubMed]
- Lefebvre, P.; Cariou, B.; Lien, F.; Kuipers, F.; Staels, B. Role of Bile Acids and Bile Acid Receptors in Metabolic Regulation. Physiol. Rev. 2009, 89, 147–191. [Google Scholar] [CrossRef] [Scilit] [PubMed]
- Ridlon, J.M.; Kang, D.-J.; Hylemon, P.B. Bile Salt Biotransformations by Human Intestinal Bacteria. J. Lipid Res. 2006, 47, 241–259. [Google Scholar] [CrossRef] [Scilit] [PubMed]
- Chávez-Talavera, O.; Tailleux, A.; Lefebvre, P.; Staels, B. Bile Acid Control of Metabolism and Inflammation in Obesity, Type 2 Diabetes, Dyslipidemia, and Nonalcoholic Fatty Liver Disease. Gastroenterology 2017, 152, 1679–1694.e3. [Google Scholar] [CrossRef] [Scilit]
- Katsuma, S.; Hirasawa, A.; Tsujimoto, G. Bile Acids Promote Glucagon-like Peptide-1 Secretion through TGR5 in a Murine Enteroendocrine Cell Line STC-1. Biochem. Biophys. Res. Commun. 2005, 329, 386–390. [Google Scholar] [CrossRef] [Scilit] [PubMed]
- Trabelsi, M.-S.; Daoudi, M.; Prawitt, J.; Ducastel, S.; Touche, V.; Sayin, S.I.; Perino, A.; Brighton, C.A.; Sebti, Y.; Kluza, J.; et al. Farnesoid X Receptor Inhibits Glucagon-like Peptide-1 Production by Enteroendocrine L Cells. Nat. Commun. 2015, 6, 7629. [Google Scholar] [CrossRef] [Scilit]
- Klonoff, D.C.; Perz, J.F. Assisted Monitoring of Blood Glucose: Special Safety Needs for a New Paradigm in Testing Glucose. J. Diabetes Sci. Technol. 2010, 4, 1027–1031. [Google Scholar] [CrossRef] [Scilit]
- American Diabetes Association. Standards of Medical Care in Diabetes—2014. Diabetes Care 2014, 37, S14–S80. [Google Scholar] [CrossRef] [Scilit] [PubMed]
- Clarke, S.F.; Foster, J.R. A History of Blood Glucose Meters and Their Role in Self-Monitoring of Diabetes Mellitus. Br. J. Biomed. Sci. 2012, 69, 83–93. [Google Scholar] [CrossRef] [Scilit] [PubMed]
- Heikenfeld, J.; Jajack, A.; Feldman, B.; Granger, S.W.; Gaitonde, S.; Begtrup, G.; Katchman, B.A. Accessing Analytes in Biofluids for Peripheral Biochemical Monitoring. Nat. Biotechnol. 2019, 37, 407–419. [Google Scholar] [CrossRef] [Scilit] [PubMed]
- Vashist, S.K. Non-Invasive Glucose Monitoring Technology in Diabetes Management: A Review. Anal. Chim. Acta 2012, 750, 16–27. [Google Scholar] [CrossRef] [Scilit] [PubMed]
- American Diabetes Association. Urine Glucose and Ketone Determinations. Diabetes Care 1991, 14, 39–40. [Google Scholar] [CrossRef] [Scilit]
- Bariya, M.; Nyein, H.Y.Y.; Javey, A. Wearable Sweat Sensors. Nat. Electron. 2018, 1, 160–171. [Google Scholar] [CrossRef] [Scilit]
- Boselli, L.; Pomili, T.; Donati, P.; Pompa, P.P. Nanosensors for Visual Detection of Glucose in Biofluids: Are We Ready for Instrument-Free Home-Testing? Materials 2021, 14, 1978. [Google Scholar] [CrossRef] [Scilit]
- Humphrey, S.P.; Williamson, R.T. A Review of Saliva: Normal Composition, Flow, and Function. J. Prosthet. Dent. 2001, 85, 162–169. [Google Scholar] [CrossRef] [Scilit] [PubMed]
- de Almeida, P.D.V.; Grégio, A.M.T.; Machado, M.A.N.; de Lima, A.A.S.; Azevedo, L.R. Saliva Composition and Functions: A Comprehensive Review. J. Contemp. Dent. Pr. 2008, 9, 72–80. [Google Scholar]
- Lee, Y.-H.; Wong, D.T. Saliva: An Emerging Biofluid for Early Detection of Diseases. Am. J. Dent. 2009, 22, 241–248. [Google Scholar]
- Malamud, D. Saliva as a Diagnostic Fluid. Dent. Clin. North. Am. 2011, 55, 159–178. [Google Scholar] [CrossRef] [Scilit] [PubMed]
- Shah, S. Salivaomics: The Current Scenario. J. Oral. Maxillofac. Pathol. 2018, 22, 375–381. [Google Scholar] [CrossRef] [Scilit] [PubMed]
- Wong, D.T.W. Salivaomics. J. Am. Dent. Assoc. 2012, 143, 19S–24S. [Google Scholar] [CrossRef] [Scilit] [PubMed]
- Koneru, S.; Tanikonda, R. Salivaomics—A Promising Future in Early Diagnosis of Dental Diseases. Dent. Res. J. 2014, 11, 11–15. [Google Scholar]
- Zhang, L.; Xiao, H.; Wong, D.T. Salivary Biomarkers for Clinical Applications. Mol. Diagn. Ther. 2009, 13, 245–259. [Google Scholar] [CrossRef] [Scilit] [PubMed]
- Ganesan, A.; Muthukrishnan, A.; Veeraraghavan, V.; Kumar, N. Effectiveness of Salivary Glucose as a Reliable Alternative in Diagnosis of Type 1 Diabetes Mellitus: A Cross-Sectional Study. J. Pharm. Bioallied Sci. 2022, 14, 557. [Google Scholar] [CrossRef] [Scilit] [PubMed]
- Balan, P.; Babu, S.; Sucheta, K.; Shetty, S.; Rangare, A.; Castelino, R.; Fazil, A.K. Can Saliva Offer an Advantage in Monitoring of Diabetes Mellitus? —A Case Control Study. J. Clin. Exp. Dent. 2014, 6, e335. [Google Scholar] [CrossRef] [Scilit]
- Abikshyeet, P.; Ramesh, V.; Oza, N. Glucose Estimation in the Salivary Secretion of Diabetes Mellitus Patients. Diabetes Metab. Syndr. Obes. 2012, 5, 149–154. [Google Scholar] [CrossRef] [Scilit]
- Gupta, S.; Nayak, M.; Sunitha, J.; Dawar, G.; Sinha, N.; Rallan, N. Correlation of Salivary Glucose Level with Blood Glucose Level in Diabetes Mellitus. J. Oral. Maxillofac. Pathol. 2017, 21, 334. [Google Scholar] [CrossRef] [Scilit]
- Ragunathan, H.; Aswath, N.; Sarumathi, T. Salivary Glucose Estimation: A Noninvasive Method. Indian J. Dent. Sci. 2019, 11, 25. [Google Scholar] [CrossRef] [Scilit]
- Abd-Elraheem, S.E.; Mansour, H.H. Salivary Changes in Type 2 Diabetic Patients. Diabetes Metab. Syndr. Clin. Res. Rev. 2017, 11, S637–S641. [Google Scholar] [CrossRef] [Scilit] [PubMed]
- Katti, G.; Ghali, S.; Diwakar, D.; Guduba, V.; Shahbaz, S.; Katti, C. Salivary Alterations in Type 1 Diabetes Mellitus Patients: Salivary Glucose Could Be Noninvasive Tool for Monitoring Diabetes Mellitus. Indian J. Dent. Res. 2014, 25, 420. [Google Scholar] [CrossRef] [Scilit] [PubMed]
- Choudhry, A.A.; Kumar, P.; Prasad, M.; Mohapatra, T.; Sharma, P. Validation of Salivary Glucose as a Screening Tool of Diabetes Mellitus. Rom. J. Intern. Med. 2022, 60, 145–152. [Google Scholar] [CrossRef] [Scilit]
- Fares, S.; Said, M.S.M.; Ibrahim, W.; Amin, T.T.; Saad, N.E.S. Accuracy of Salivary Glucose Assessment in Diagnosis of Diabetes and Prediabestes. Diabetes Metab. Syndr. Clin. Res. Rev. 2019, 13, 1543–1547. [Google Scholar] [CrossRef] [Scilit] [PubMed]
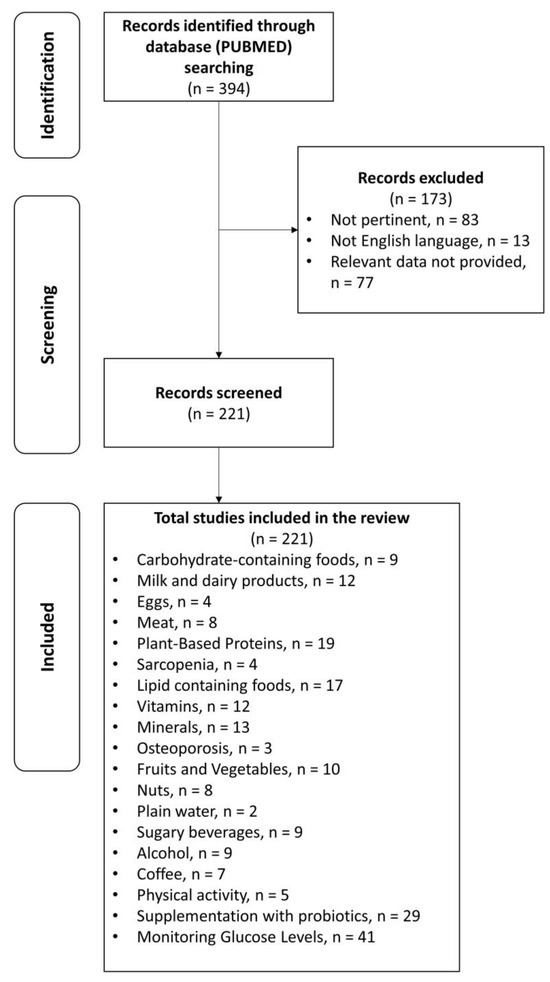
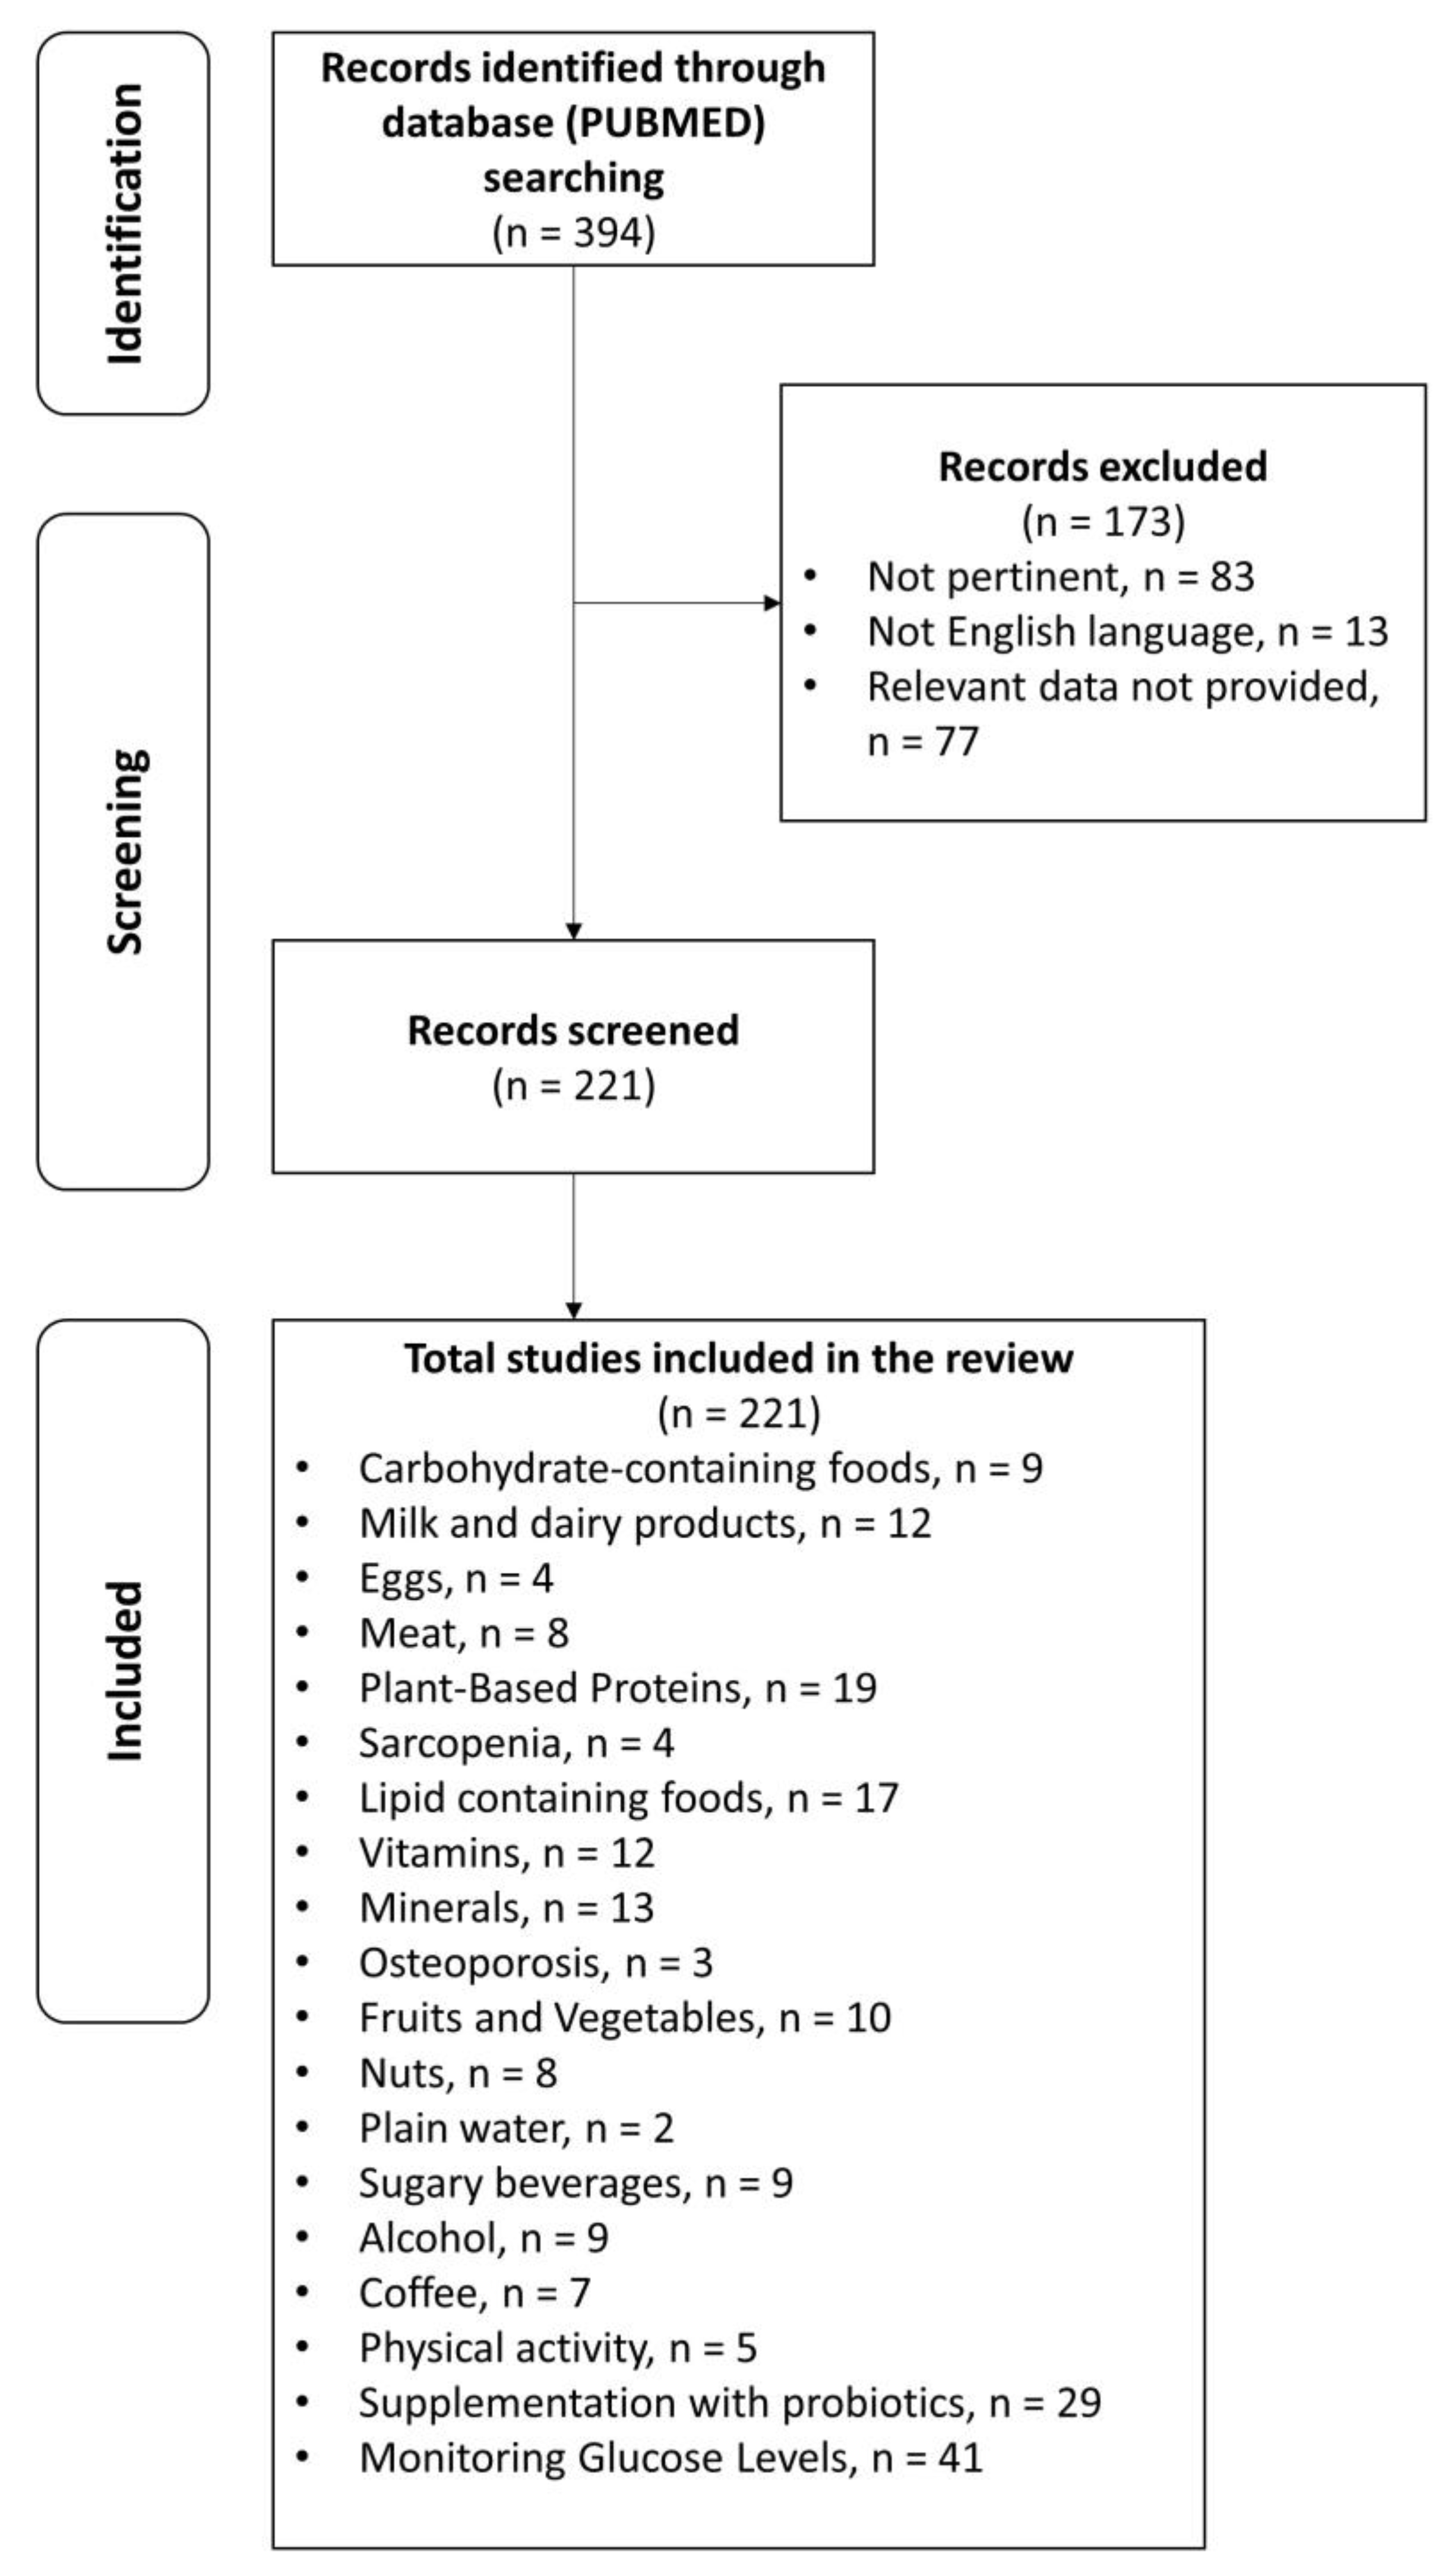
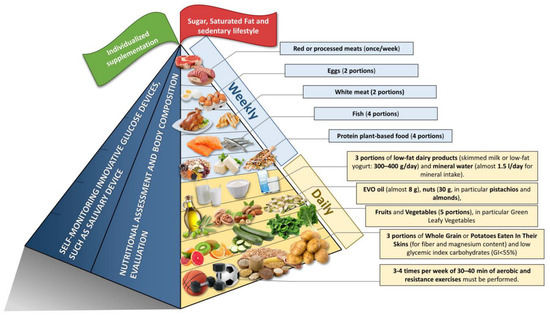
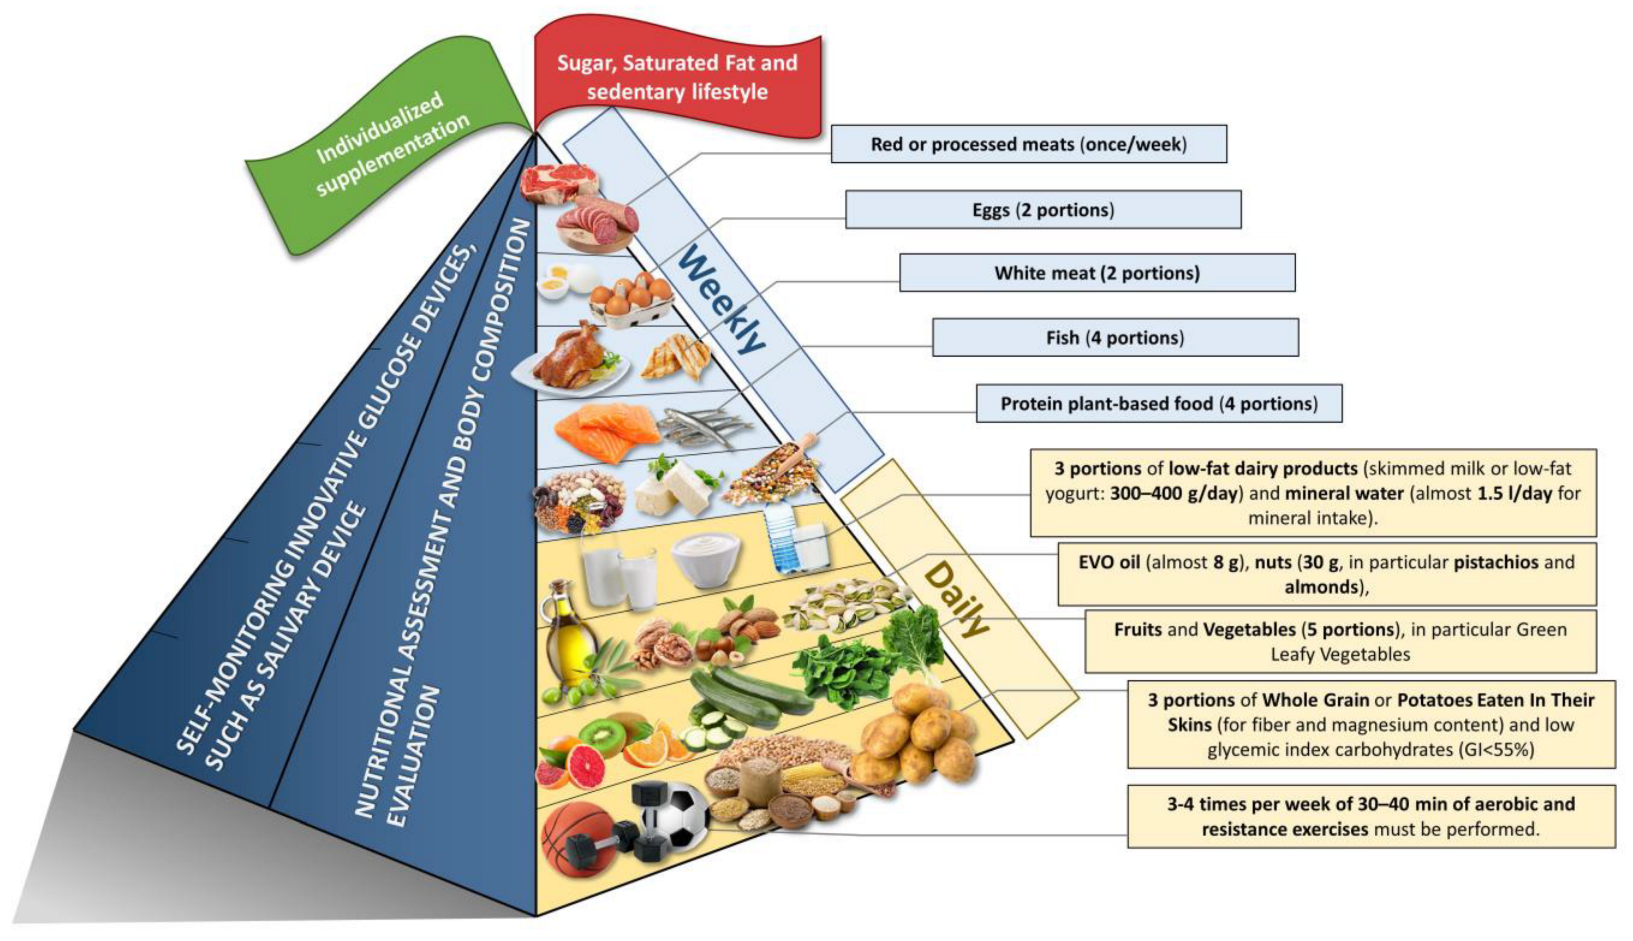
Disclaimer/Publisher’s Note: The statements, opinions and data contained in all publications are solely those of the individual author(s) and contributor(s) and not of MDPI and/or the editor(s). MDPI and/or the editor(s) disclaim responsibility for any injury to people or property resulting from any ideas, methods, instructions or products referred to in the content. |
© 2023 by the authors. Licensee MDPI, Basel, Switzerland. This article is an open access article distributed under the terms and conditions of the Creative Commons Attribution (CC BY) license (https://creativecommons.org/licenses/by/4.0/).