


Highlights
What are the main findings?
- The 2025 Talidas GLOF followed a period of rapid lake expansion during the warmest melt season, coinciding with early and persistent snow depletion relative to the 2000–2024 baseline record.
- Multi-decadal satellite records (1992–2024) show intermittent lake formation prior to 2022, although Landsat revisit limitations could be a factor.
What are the implications of the main findings?
- Sustained climatic anomalies and cryospheric preconditioning can destabilize moraine-dammed lakes even in the absence of a discrete trigger such as landslides.
- Multi-sensor remote sensing time series provides a robust framework for monitoring glacial lake evolution and detecting anomalous pre-GLOF conditions.
Abstract
Glacial lake outburst floods (GLOFs) are high-impact hazards in mountain regions, yet many events remain poorly documented because field access is limited and lake evolution can occur on sub-weekly time scales. Here, we used high spatiotemporal resolution PlanetScope imagery (3 m) to quantify the seasonal evolution and abrupt drainage of a moraine-dammed glacial lake in August 2025 in northern Pakistan. Historical lake dynamics were reconstructed using PlanetScope (2016–2024) imagery and multi-decadal Landsat observations (1992–2018). Climatic conditions were evaluated using ERA5-Land temperature data, and seasonal snow dynamics were characterized using MODIS and PlanetScope-based snow cover analyses. Multi-decadal satellite imagery indicates that lake formation in this catchment was historically intermittent, with no evidence of abrupt drainage before 2025, highlighting the anomalous nature of the event. PlanetScope observations show steady lake expansion throughout summer 2025, reaching a maximum area of 0.052 km2 prior to the GLOF on August 22. Pre- and post-event imagery reveals no discernible landslide or impact trigger. Instead, the observations are most consistent with a failure mechanism driven by meltwater-driven lake growth and overtopping or erosion of the moraine dam. The 2025 summer season (June to September) was characterized by exceptionally warm conditions and unprecedented early snow depletion relative to the 2000–2024 baseline, suggesting a strong climatic and cryospheric contribution to the outburst. These results demonstrate the value of integrating dense time series of satellite observations and climatic data for capturing glacial-lake life cycles and diagnosing likely controls on outburst initiation. The study highlights the critical role of high-frequency satellite remote sensing for improving GLOF monitoring and early-warning capabilities in data-scarce mountain environments.
1. Introduction
Glacial lakes are dynamic and potentially hazardous features in high-mountain environments, particularly under ongoing climatic warming [1,2,3]. Rising temperatures have accelerated glacier thinning and retreat worldwide, promoting the formation and expansion of glacial lakes [3,4,5,6]. Some glacial lakes experience sudden drainage events known as glacial lake outburst floods (GLOFs), which can generate severe downstream impacts, including channel erosion, debris deposition, infrastructure damage, and loss of life [5,7,8]. Understanding the short-term evolution of glacial lakes and the conditions leading to abrupt drainage remains a critical challenge for hazard assessment in remote mountain regions [9].
GLOFs can be initiated by a wide range of physical triggers [8,10]. Short-duration or acute triggers include avalanches and landslides entering a lake, glacier calving, intense rainfall events, and rapid snowmelt leading to increased water levels and overtopping or eroding natural dams [11,12,13,14,15]. In contrast, longer-term processes such as progressive dam weakening, melting of buried ice within moraine dams, permafrost degradation, and internal piping can gradually destabilize lake dams, leading to failure [11,16,17,18]. Identifying which of these mechanisms operated during a specific event is often challenging in remote mountain settings, particularly when field observations are unavailable.
Beyond promoting lake formation and expansion, ongoing climate warming is expected to amplify GLOF triggering processes and increase the risk of GLOFs [19,20,21]. Warming temperatures increase meltwater input and reduce slope stability through permafrost degradation, glacier and ice-core melt, and increased debris availability, thereby enhancing the likelihood of rockfalls, landslides, debris flows, and ice avalanches entering glacial lakes and triggering GLOFs [13,21,22,23,24,25]. These processes can give rise to cascading hazard sequences, in which an initial mass movement generates lake overtopping or dam erosion, followed by rapid downstream flooding, channel erosion, debris deposition, and secondary damming [22,25,26,27,28,29]. Despite growing recognition of these compound hazards, many GLOF events in remote mountain regions remain poorly documented due to inadequate field observations [30,31,32,33].
Remote sensing has become an essential tool for monitoring glacial lakes in remote, high-altitude terrain, where field observations are sparse or often unavailable [34]. Recent advances in satellite remote sensing and geographic information systems (GIS) now enable consistent mapping of lake formation and evolution, detection of geomorphic signatures of triggering processes, and assessment of cascading downstream impacts across local to global scales [8,14,32,33,34]. Such remote-sensing-based analyses combined with climatic data improve understanding of GLOF drivers and consequences and provide an essential foundation for hazard assessment, early-warning efforts, and risk mitigation in data-scarce mountain regions [23,35,36].
In this study, we use high spatiotemporal resolution PlanetScope imagery to document the evolution of a moraine-dammed glacial lake in the Talidas catchment in the Hindu Kush, Pakistan, culminating in a sudden drainage event on 22 August 2025. The GLOF triggered intense erosion along the channel, mobilizing large volumes of sediment and generating a debris flow that caused widespread destruction downstream. The massive debris deposit subsequently blocked the Gilgit River, completely obstructing its flow, leading to the formation of a large debris-dammed lake. The cascading disaster damaged more than 300 houses, agricultural land, and critical infrastructure downstream; however, an early warning from nearby shepherds prompted timely evacuation, and no fatalities were reported [37]. We analyze the seasonal development and abrupt collapse of the moraine-dammed glacial lake, geomorphic signatures of potential triggers and dam breach, and seasonal snow-covered area (SCA) dynamics to assess their relationship with lake growth. To place the 2025 GLOF in a broader context, we evaluate the historical seasonal evolution of the lake extent from the early 1990s through 2024 using a combination of Landsat (1992–2018) and PlanetScope (2016–2024) imagery, identifying years characterized by ephemeral ponding, gradual seasonal growth, or absence of lake formation. While cloud-free imagery is sparse in the earlier record, the available observations provide valuable context for evaluating the anomalous nature of the 2025 event. While the datasets used differ in spatial resolutions, Landsat imagery is primarily used to establish long-term context and identify general patterns of lake presence or absence, whereas PlanetScope data are used for detailed analysis of lake evolution during recent years. As such, differences in spatial resolution are not expected to significantly influence the interpretation of lake dynamics at the temporal scales considered.
This study aims to (1) quantify the seasonal evolution and abrupt drainage of the glacial lake during the 2025 melt season and analyze its historical behavior (1990s–2024), (2) assess changes in SCA and temperature dynamics within the contributing catchment and their temporal correspondence with lake expansion, and (3) explore potential GLOF triggers (e.g., external mass movement, extreme weather events, and overtopping or erosion of the dam). Using the Talidas GLOF as a case study, which combines event-scale analysis with multi-decadal satellite observations, we demonstrate the value of high-frequency remote sensing for detecting anomalous glacial lake behavior and strengthening observational frameworks for GLOF hazard assessment in data-scarce mountain regions.
2. Materials and Methods
2.1. Study Area
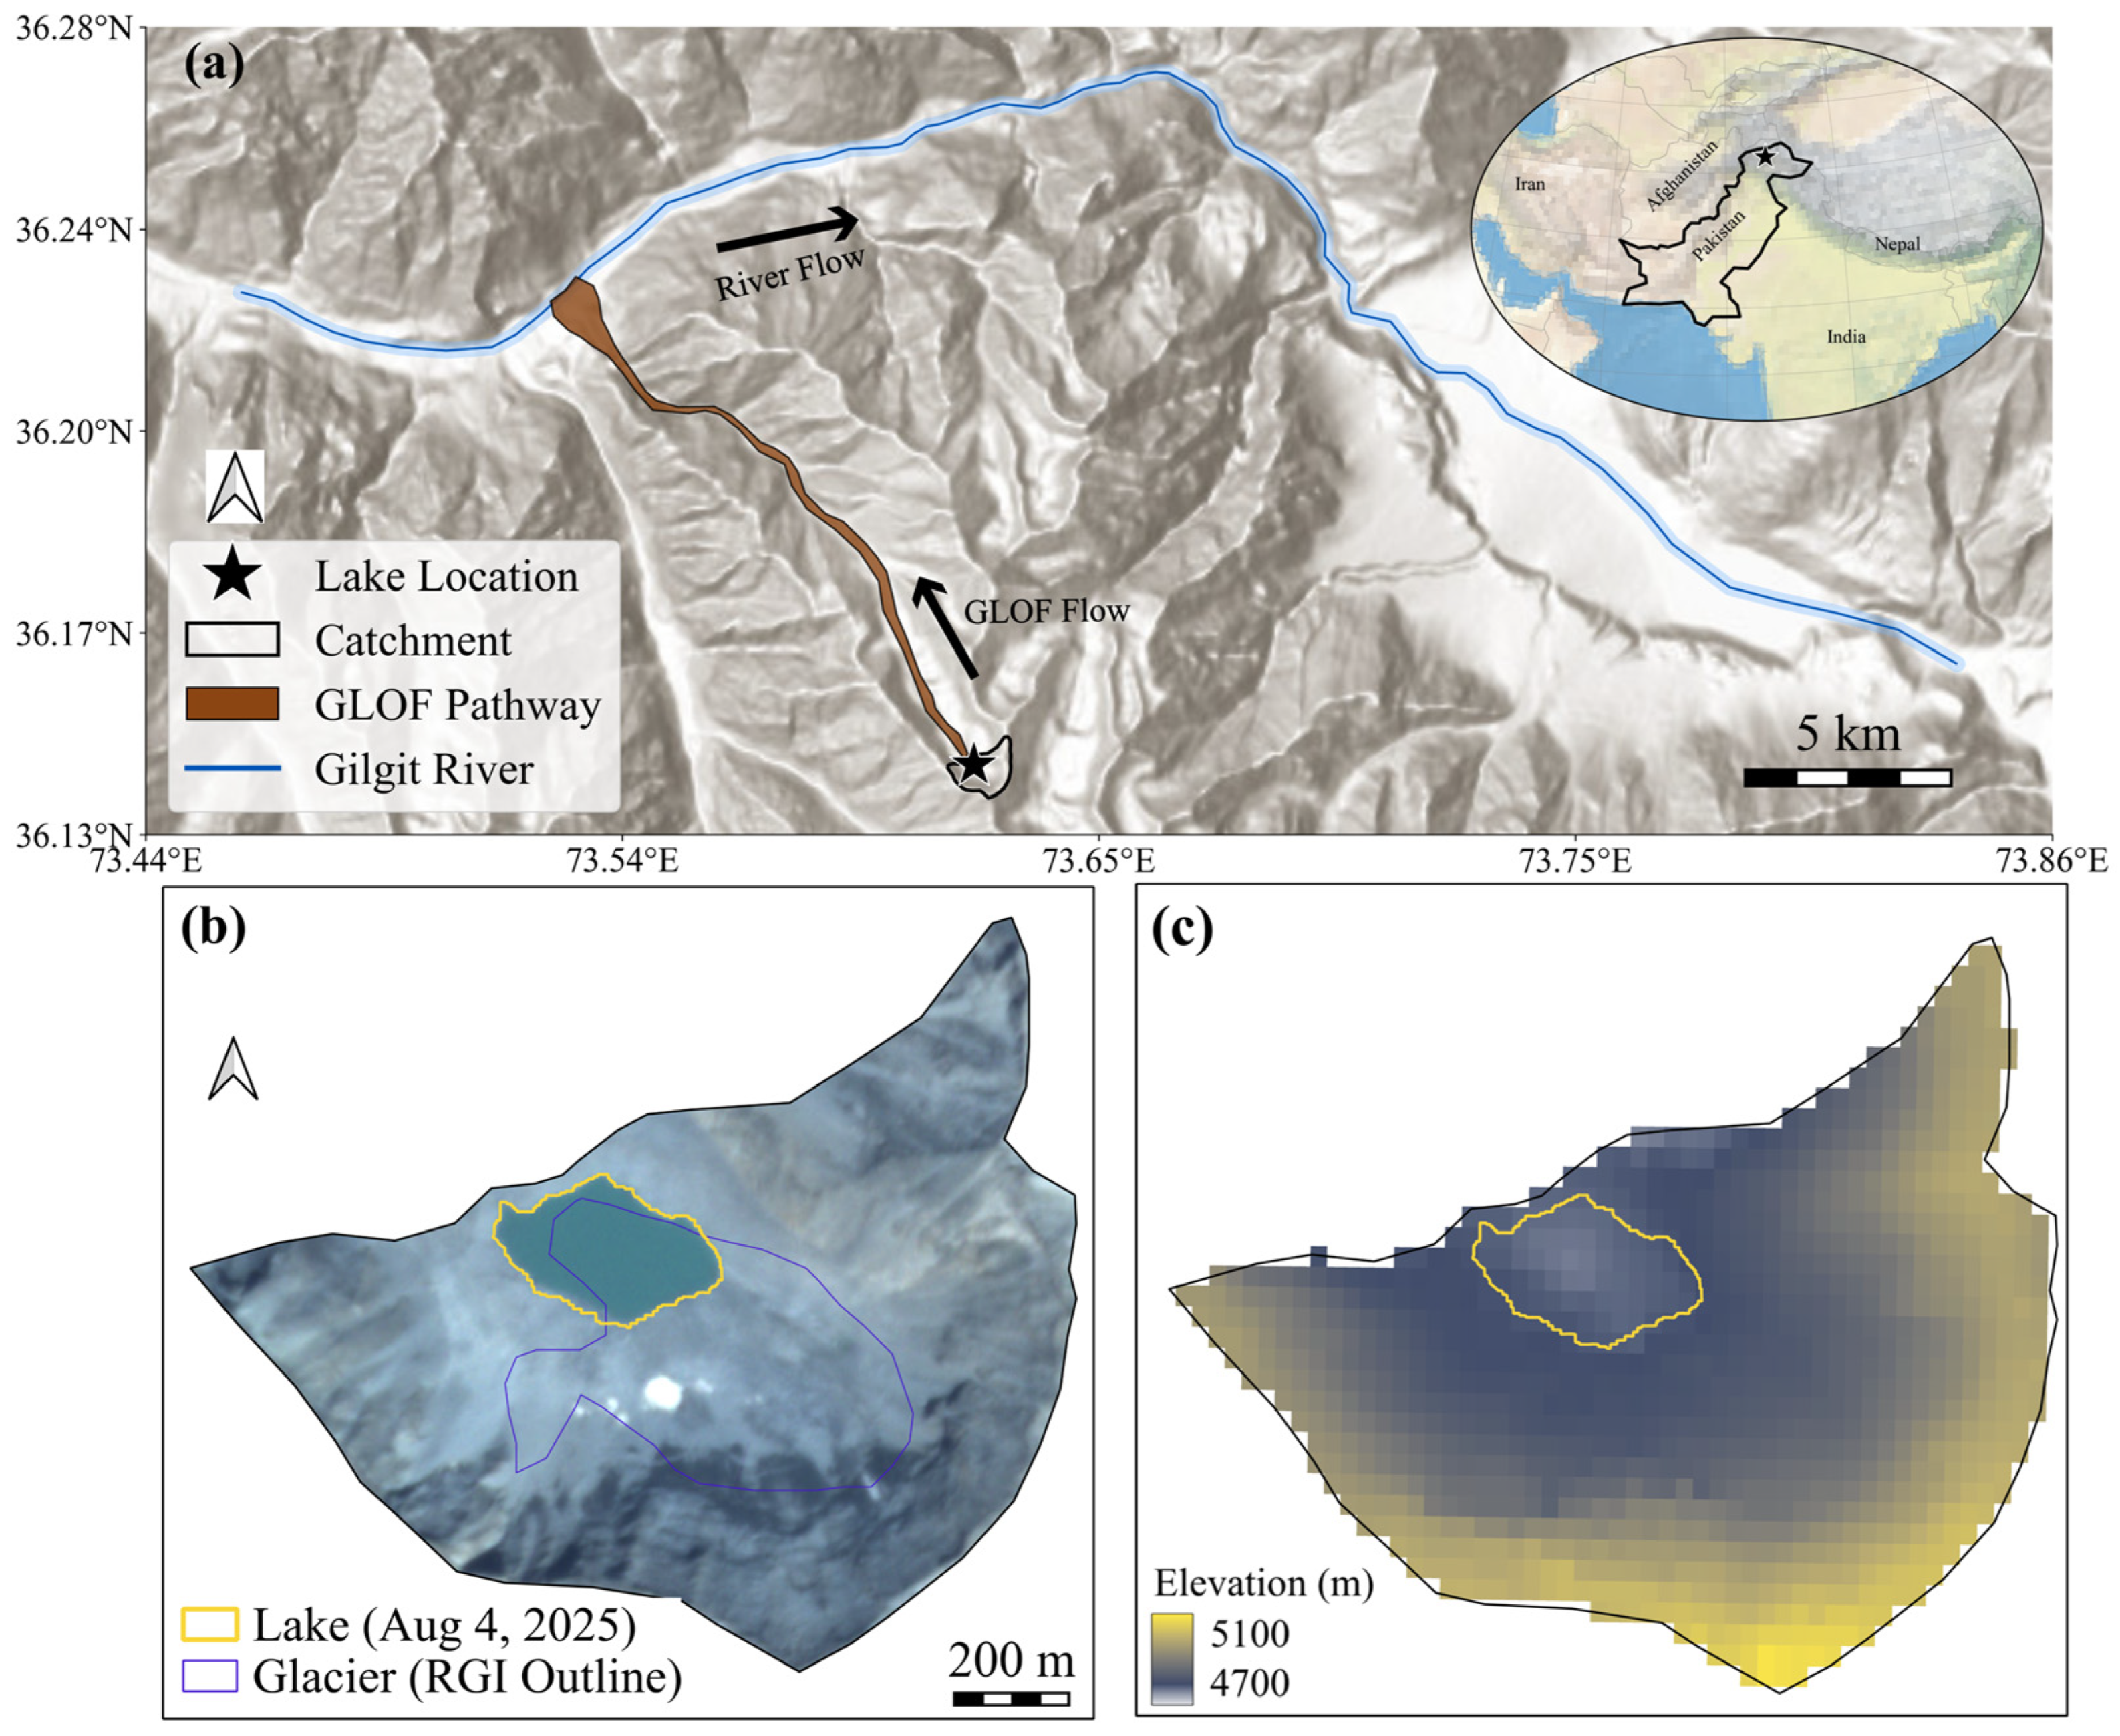
This study focuses on the high-elevation moraine-dammed glacial lake that triggered the Talidas GLOF and its contributing catchment in Gilgit sub-basin of the Upper Indus Basin in northern Pakistan (Figure 1). The lake catchment, with an area of 0.8 km2, is characterized by complex alpine topography and strong seasonal snow dynamics. Elevations across the catchment range from 4700 to 5100 m a.s.l., with steep relief and pronounced headwalls surrounding the lake basin. As per the Randolph Glacier Inventory [38], the catchment hosted a small glacier, which has now disappeared. The lake occupied a topographic depression dammed by unconsolidated moraine and debris material. High-resolution optical imagery from Google Earth indicates that the moraine dam is composed of morphologically heterogeneous and rough surface material, characterized by irregular topography and visible blocky debris (Figure S1). This suggests a predominantly coarse and poorly sorted sediment composition, likely consisting of a mixture of boulders, cobbles, and finer material typical of unconsolidated glacial moraines. The lake was located at the head of a cascading lake system, aligned along the primary flow path (Figure S2). The first downstream lake is located approximately 0.59 km from the source lake outlet, followed by a second lake at an additional 0.16 km downstream. Elevation data indicate a drop from 4712 m at the source lake outlet to 4557 m at the first downstream lake (≈150 m), followed by a more moderate drop to 4531 m at the second lake (≈26 m). When the source lake drained on 22 August 2025, the downstream lakes overflowed due to the flood wave but remained structurally intact and did not undergo catastrophic drainage.
Figure 1.
Overview of the study site. (a) Lake location, along with the catchment, GLOF flow path, and Gilgit River are shown on a Hillshade basemap. (b) PlanetScope true-color composite clipped to the lake catchment extent, with the pre-GLOF lake outline (4 August 2025). The blue outline shows the Randolph Glacier Inventory glacier outline. (c) SRTM-derived elevation map for the catchment with the same lake outline overlaid.
The Gilgit sub-basin forms part of the eastern Hindu Kush Range and drains into the Indus River [39]. Climatically, the region falls within a cold desert regime characterized by arid to semi-arid conditions [40]. Precipitation in the Gilgit River basin is influenced by two distinct atmospheric systems, including summer precipitation associated with the South Asian monsoon and winter-spring precipitation driven by mid-latitude westerly disturbances [41,42,43]. The majority of annual precipitation occurs during the winter and spring, primarily in the form of snowfall [40,41].
2.2. Data
We used high-resolution PlanetScope multispectral imagery to map the glacial lake extent and SCA within the lake catchment from 2016 to 2025. PlanetScope imagery includes three visible bands (red, green, and blue) and one near-infrared (NIR) band at 3 m spatial resolution [44,45]. Level 3B Ortho Scene Analytic images, which are radiometrically calibrated, orthorectified, and provided at top-of-atmosphere reflectance [46,47], were obtained from the Planet Explorer platform “https://www.planet.com/explorer/ (December 2025)” under Planet’s Program for Education and Research (E&R) license. Cloud cover complicates accurate glacial lake delineation and snow mapping by obscuring surface features and exhibiting reflectance characteristics similar to snow in the visible and NIR bands, hampering reliable spectral discrimination [48]. To minimize this ambiguity, scenes were selected through careful visual inspection to ensure full coverage of the study area and the absence of cloud contamination.
Historical glacial lake dynamics from 1992 to 2018 were assessed using cloud-free multispectral optical satellite imagery from the Landsat missions, obtained through Google Earth Engine and courtesy of the United States Geological Survey (USGS). Specifically, Landsat 5 Thematic Mapper (TM), Landsat 7 Enhanced Thematic Mapper Plus (ETM+), and Landsat 8 and 9 Operational Land Imager (OLI) imagery at 30 m spatial resolution were used to characterize multi-decadal variations in lake presence, extent, and drainage behavior prior to the 2025 GLOF. For all Landsat sensors, Collection 2 Tier 1 calibrated top-of-atmosphere reflectance products were employed, ensuring consistent radiometric calibration and geometric accuracy suitable for long-term temporal analysis.
Summer season (June to September) snow persistence within the catchment was derived from the Moderate Resolution Imaging Spectroradiometer (MODIS) Terra Global Snow Cover product (0.01° spatial resolution) [49]. Shuttle Radar Topography Mission (SRTM) digital elevation data (30 m spatial resolution) were used to derive elevation and slope metrics for the lake catchment [50]. Daily mean 2 m air temperature (2000–2025) and daily total precipitation (August 2025) from the ERA5-Land reanalysis dataset (0.1° spatial resolution) were retrieved via Google Earth Engine and used to assess temperature variability and precipitation over the study area [51]. Daily aggregated precipitation for August 2025 was also obtained from NASA’s Integrated Multi-satellitE Retrievals (IMERG) for Global Precipitation Measurement (GPM) product (0.1° spatial resolution) [52]. We also used the High Mountain Asia permafrost probability dataset (1 km spatial resolution) [53] to assess permafrost conditions within the lake catchment. A summary of all datasets, including their temporal coverage, spatial resolution, and usage in this study, is provided in Table S1.
2.3. Lake Delineation and Geomorphological Analysis
Glacial lake outlines were delineated through manual digitization using cloud-free PlanetScope and Landsat imagery in QGIS. Lake boundaries were mapped by visual interpretation of true- and false-color composites to ensure reliable identification of the lake outline in complex alpine terrain, particularly during periods of partial snow cover. For earlier years with sparse imagery, mapped lake extents represent discrete observations rather than continuous seasonal evolution. The lake area was calculated from the outlines and its uncertainty was estimated using the equation (Equation (1)) of Hanshaw and Bookhagen (2014) [54].
where σ is the uncertainty in lake area, P is the perimeter of the lake and G is the spatial resolution of the images used.
σ = (P/G) × (G2/2) × 0.6872,
To estimate the lake volume, we used the empirical equation (Equation (2)) by Cook and Quincey (2015) [55]. The equation is given by:
where V is the volume in m3 and A is the lake area in m2.
V = 0.1217 × A1.4129,
To evaluate surface changes associated with the 2025 GLOF, cloud-free PlanetScope imagery acquired before and after the August 22 event (8 August 2025 and 22 August 2025, respectively) was compared using true- and false-color composites. The comparison focused on identifying geomorphic indicators of potential triggering processes, including changes in lake margins, textural changes on adjacent slopes, and disturbed material downstream of the lake. False-color composites incorporating the NIR band were generated to enhance contrasts between water, debris, and freshly exposed surfaces, which may indicate erosion or disturbance associated with rapid lake drainage.
2.4. SCA Mapping
For recent years (2022–2025), SCA was mapped from PlanetScope imagery using a Random Forest (RF) classifier, similar to the method detailed in Yang et al. (2023) [48], implemented in Python 3.13. RF classifiers have been widely shown to perform well for snow cover mapping from optical imagery [56,57,58]. The classifier was trained using multiple PlanetScope scenes spanning both early-season (high snow cover) and late-season (patchy or minimal snow) conditions and the corresponding manually digitized training data. Eight input features were used in the model, including blue, green, red, and near-infrared (NIR) bands, visible-band brightness, and three spectral ratios (red/green, blue/green, and blue/red). Training polygons represented three surface classes: (1) snow, (2) exposed rock/debris, and (3) open water. A total of 95 training samples were used, consisting of 35 snow, 35 rock/debris, and 25 water samples. These polygons were rasterized to the image grid, and all labeled pixels were extracted for model development.
The RF model was trained with 200 trees, no maximum depth restriction, and out-of-bag scoring enabled. After training, the model was applied consistently to all PlanetScope scenes in the analysis period to generate classified maps. Binary snow masks were then derived by isolating pixels classified as snow, and these masks were used to calculate SCA and fractional SCA (fSCA) within the catchment. Model performance was evaluated using an independent temporal validation approach. Validation polygons representing the same three land-cover classes (snow, exposed rock/debris, and open water) were manually delineated for separate PlanetScope images and rasterized to generate independent labeled pixels. This validation dataset was derived from images acquired on 20 June 2025, 2 July 2025, and 21 July 2025, which were not used during model training, thereby ensuring an unbiased assessment of model performance across varying seasonal conditions. Classification performance was assessed using standard metrics including precision, recall, F1-score, and overall accuracy (Table S2).
Long-term (2000–2025) snow dynamics were assessed using MODIS data, with the snow conditions characterized using a binary approach indicating snow presence or snow-free conditions. The daily time series was then aggregated to compute the total number of snow-free days for each summer season (June to September).
2.5. Melt-Season Temperature Analysis
Daily mean 2 m air temperature data obtained from the ERA5-Land reanalysis were spatially averaged over the lake catchment for the period 2000–2025. Analyses focused on the summer season (June-September). A baseline climatology was constructed using the 2000–2024 period by computing the mean and standard deviation (SD) of daily temperatures for each calendar day. The daily temperature time series was smoothed using a 7-day centered moving average prior to analysis and 2025 temperature deviations from the baseline daily mean for the corresponding calendar day were then calculated. The 7-day smoothing was applied to reduce short-term variability and noise associated with daily fluctuations in temperature, thereby emphasizing persistent climatic signals relevant to lake evolution. Exceedance statistics were derived relative to the smoothed baseline mean and standard deviation.
3. Results
3.1. Glacial Lake Evolution During the 2025 Melt Season
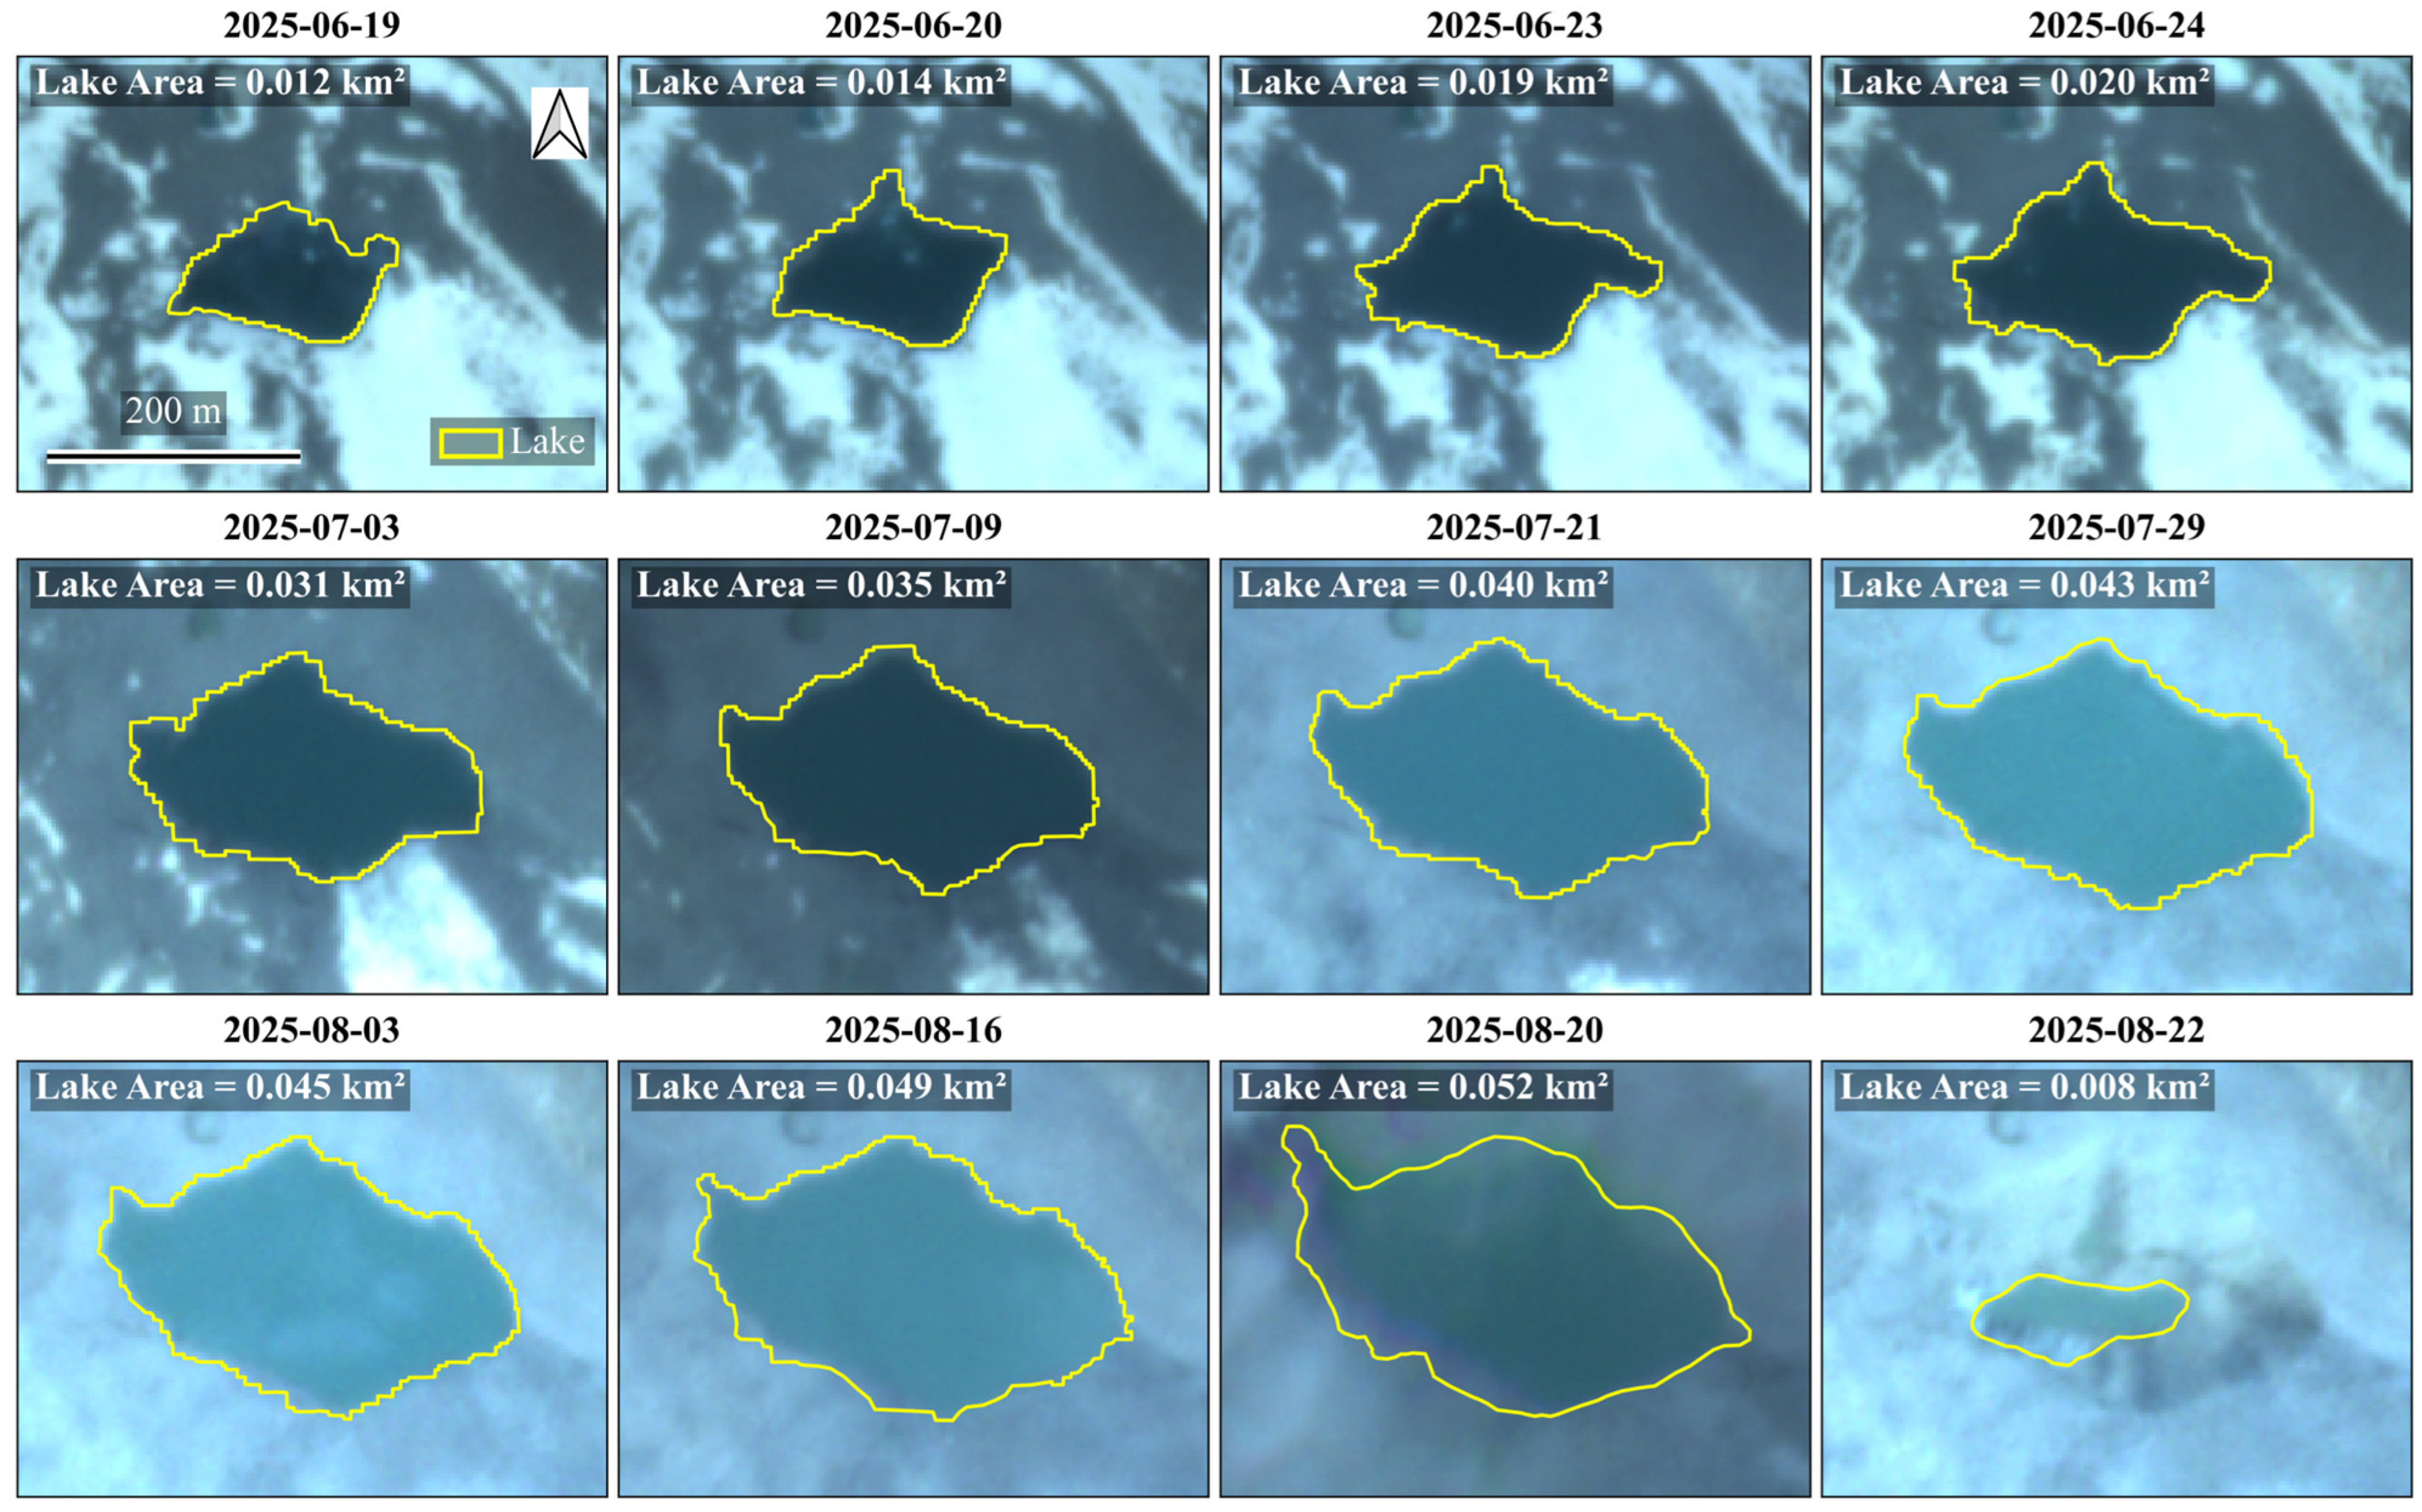
PlanetScope imagery shows that the lake catchment remained snow covered until mid-June 2025, with the first clear expression of the lake observed on 19 June 2025. At this stage, the lake covered an area of 0.012 ± 0.0006 km2, corresponding to an estimated volume of approximately 6.9 × 10⁴ m3. Over the following days, the lake expanded steadily, nearly doubling and reaching an area of 0.020 ± 0.0008 km2 by June 24 (Figure 2), while the estimated volume increased to approximately 1.5 × 10⁵ m3. From late June to early July, the lake exhibited a period of accelerated expansion, with the lake area increasing to 0.031 km2 ± 0.0010 on July 3 and 0.035 ± 0.0010 km2 on July 9. This phase corresponds to the most rapid areal growth observed during the season and was accompanied by a substantial increase in lake volume from approximately 2.7 × 10⁵ m3 to 3.2 × 10⁵ m3, reflecting rapid water accumulation within the basin.
Figure 2.
Evolution of the moraine-dammed glacial lake during the 2025 melt season derived from PlanetScope imagery. The lake (yellow outline) first appears as a small surface pond on 19 June and expands progressively through July and early August. By 22 August 2025, the lake area is drastically reduced, leaving only a small residual pond.
After mid-July, the rate of lake expansion gradually slowed, although the lake continued to grow. Lake area increased from 0.040 ± 0.0011 km2 on July 21 to a seasonal maximum extent of 0.052 ± 0.0011 km2 and a corresponding volume of 5.6 × 10⁵ m3 on August 20, indicating a transition from rapid growth to a more gradual expansion phase. Overall, the lake expanded by more than a factor of four in area and approximately eightfold in volume between June 19 and August 20. This growth was followed by an abrupt drainage on August 22, when both area and volume sharply decreased to 0.008 ± 0.0004 km2 and 3.8 × 10⁴ m3, respectively. The imagery from August 22 shows only a small residual pond within the lake basin, after the observed GLOF. The lake area and volume change over the summer are summarized in Table S3.
3.2. Interannual Variability in Glacial Lake Formation and Drainage (1992–2024)
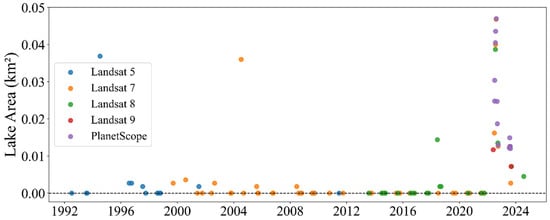
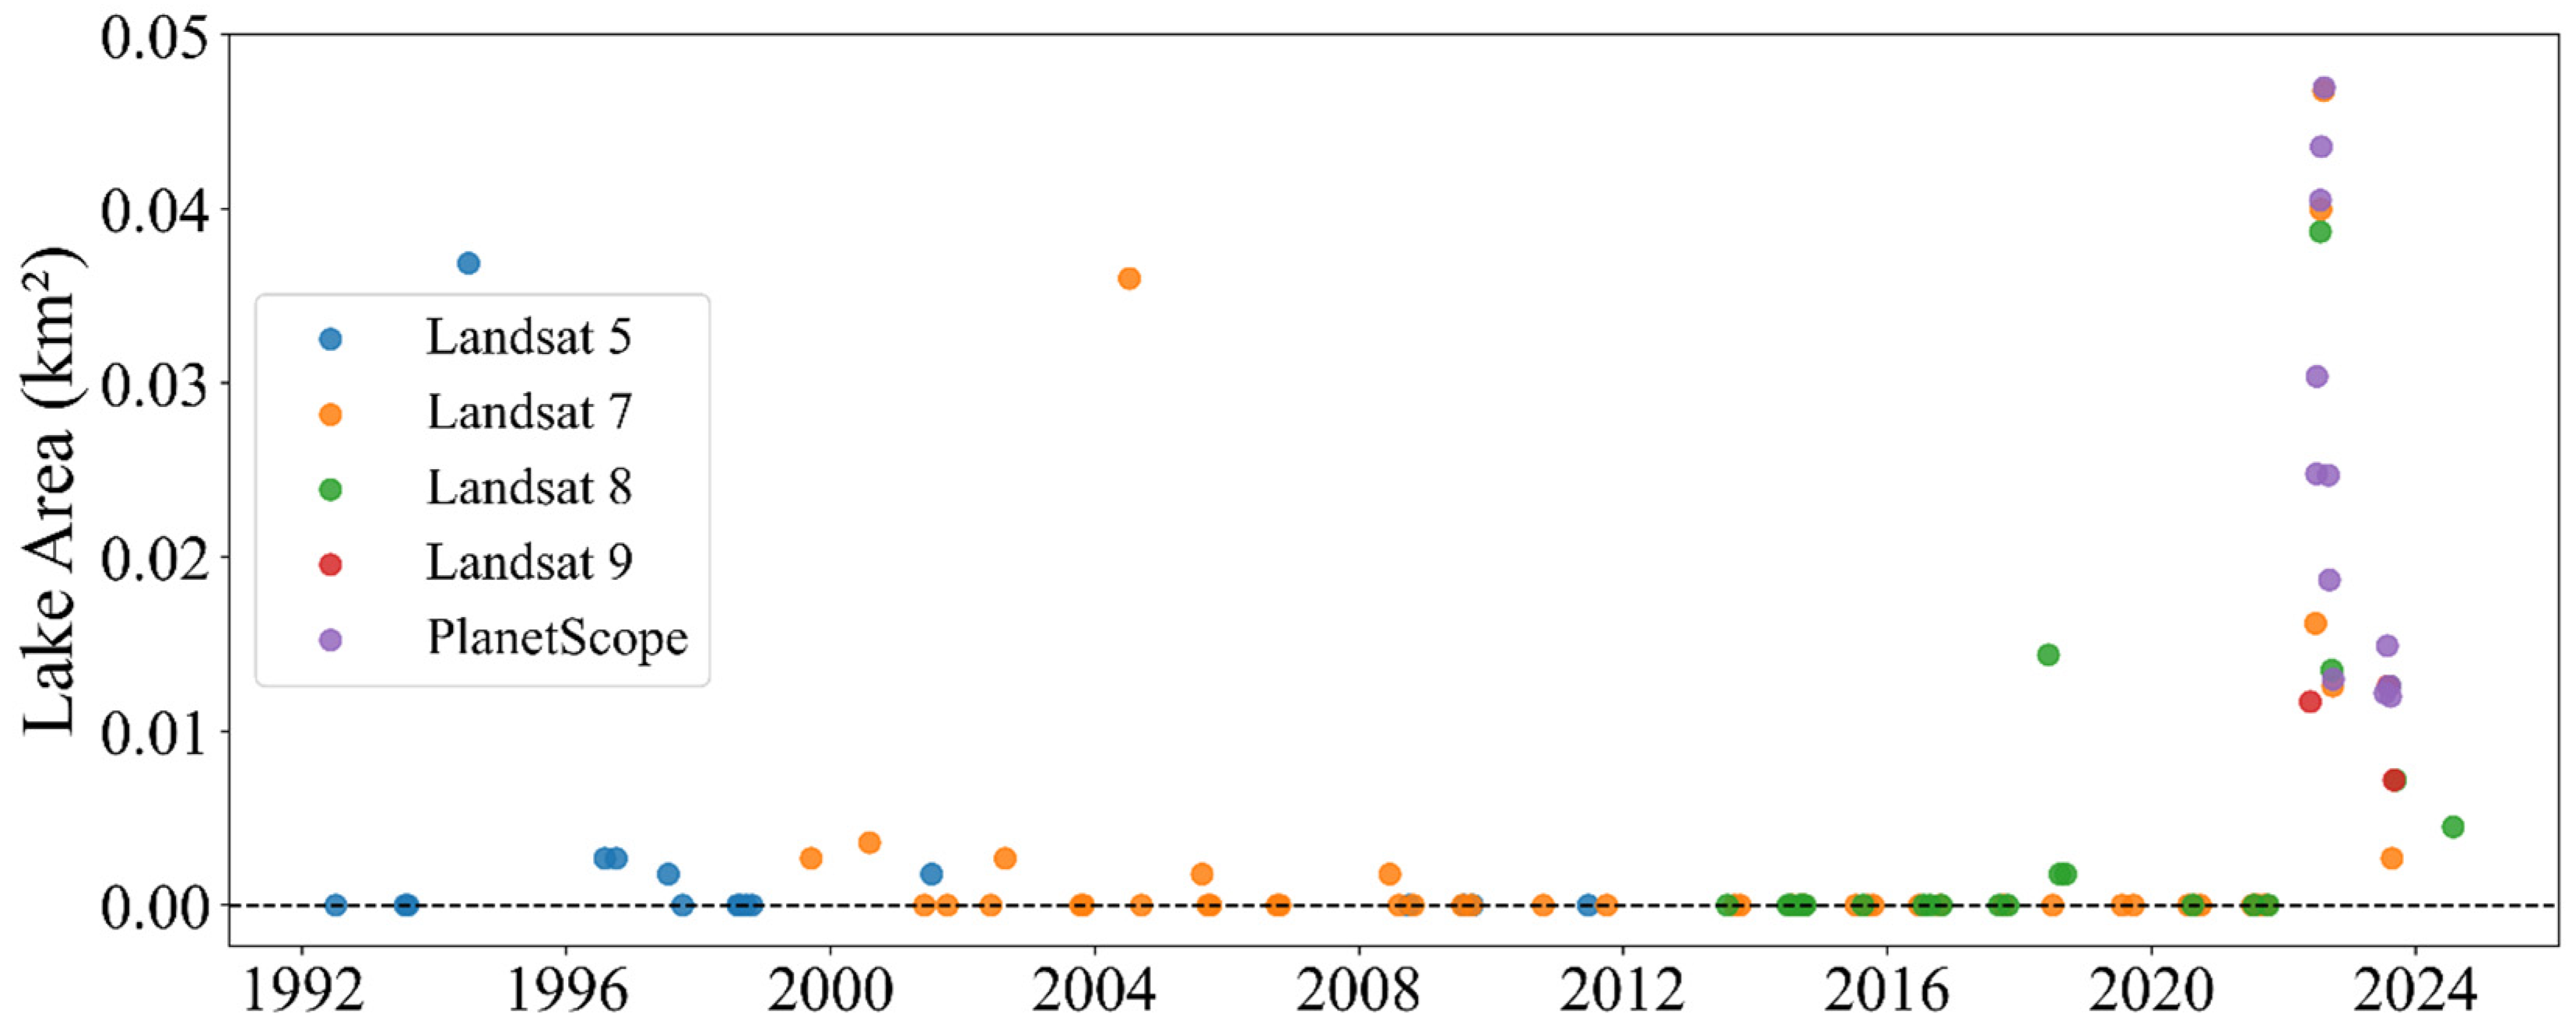
The combined Landsat (1992–2018) and PlanetScope (2016–2024) record indicates that glacial lake formation in the Talidas catchment was historically rare and highly intermittent (Figure 3). Between 1992 and 2021, most cloud-free satellite observations show no detectable lake, with only occasional small and short-lived water bodies. When present, the lake generally exhibited gradual seasonal expansion followed by progressive shrinkage rather than abrupt drainage. However, the temporal density of observations during the earlier years is sparse, particularly prior to 2016, due to the coarse revisit frequency (16 days) of Landsat satellites. Consequently, some short-lived lake occurrences may have gone undetected.
Figure 3.
Multi-satellite time series of glacial lake presence and area from the early 1990s to 2024. Each point represents a single cloud-free satellite observation, with colors indicating the source sensor (Landsat 5, 7–9, and PlanetScope). Zero-area points correspond to dates when no lake was detected in a single Landsat pixel. Cloud-free imagery prior to 2018 was relatively scarce due to the coarse temporal resolution (16 days) of Landsat satellites, resulting in a lower temporal density of observations.
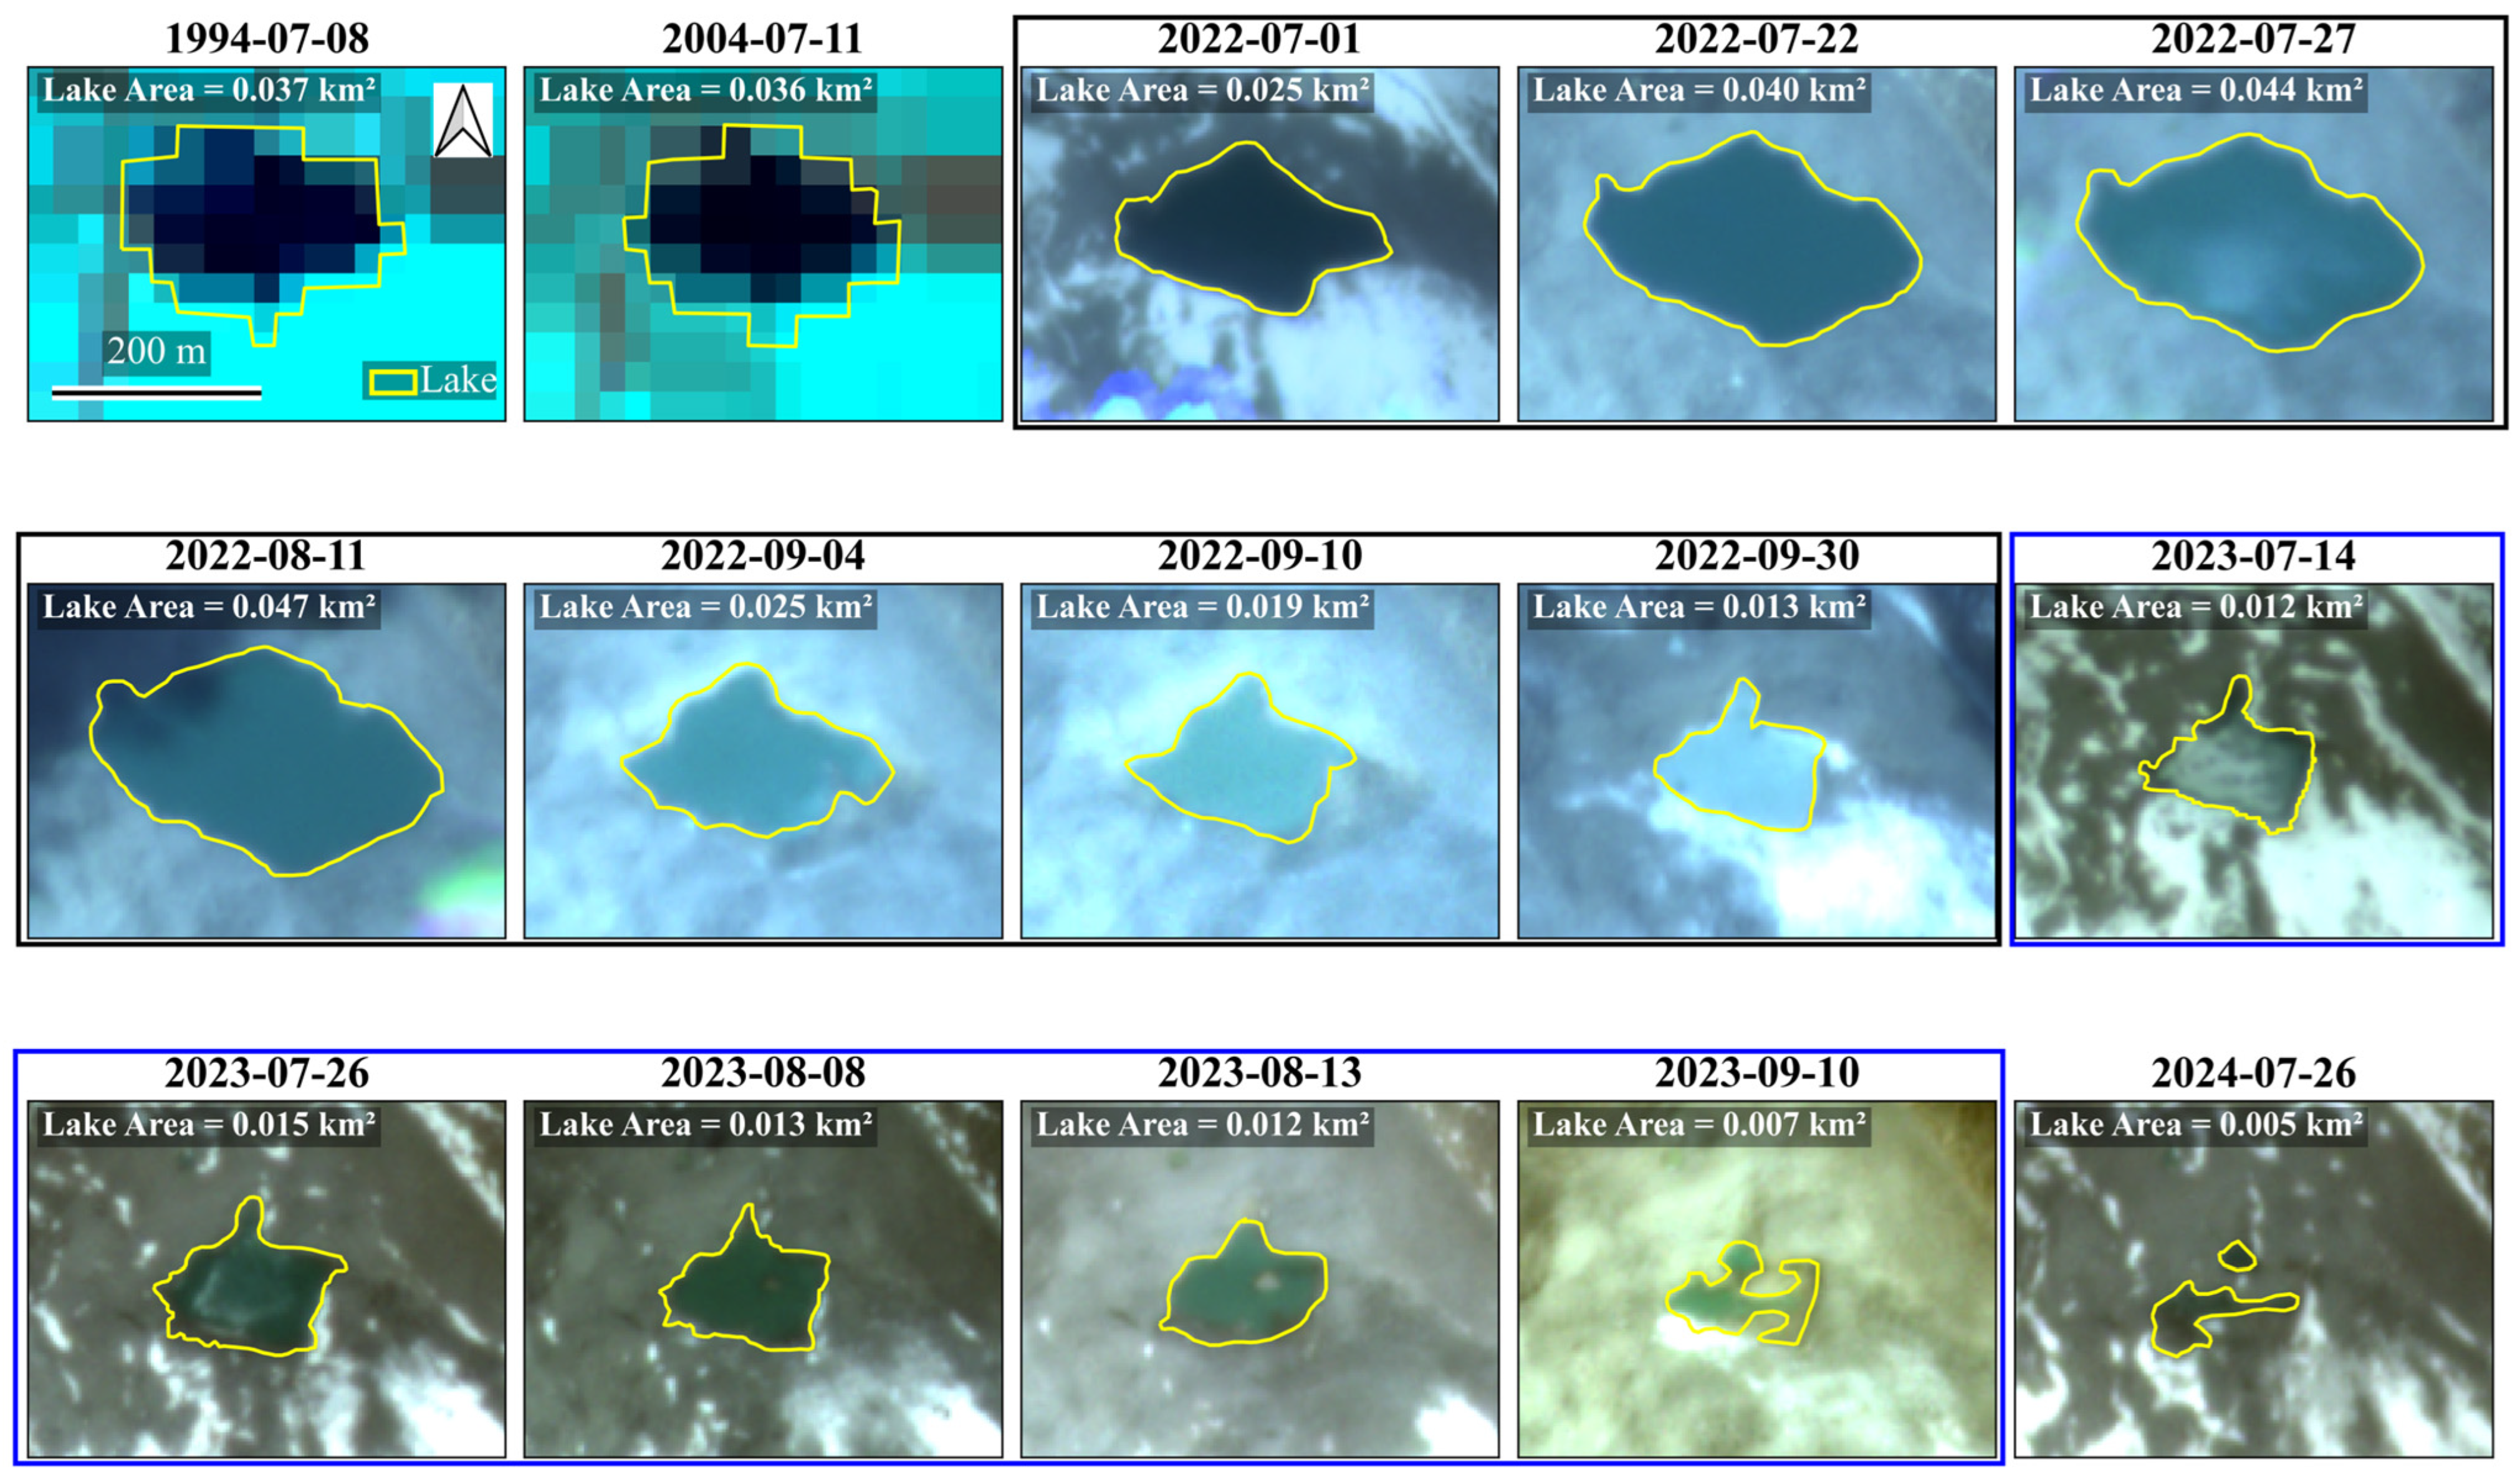
Landsat observations from 1992 to 2017 show only two instances of significant lake formation including a lake surface of approximately 0.037 ± 0.01 km2 on 8 July 1994, and a similar-sized lake of 0.036 ± 0.01 km2 on 11 July 2004. In 1994, useful imagery is not available to assess the seasonal lake dynamics, while in 2004, a cloud-free image in September shows no lake presence. Outside of these isolated events, the majority of cloud-free images prior to 2017 indicate either no lake or only very small ponding.
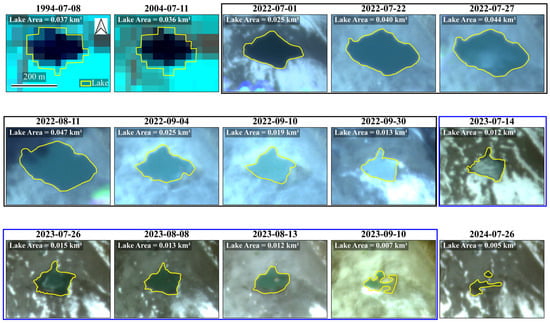
Higher-temporal-resolution PlanetScope imagery from 2016 onward provides a more detailed record of intra- and interannual variability in lake behavior. Between 2017 and 2021, lake formation remained infrequent, with only small and ephemeral ponds detected in most years and no observable lake in the available imagery for 2016. A clear shift occurred beginning in 2022, when a more persistent and larger lake began to develop (Figure 3 and Figure 4). In 2022, the lake was first observed in mid-June, expanded steadily through July, and reached a maximum area of approximately 0.047 ± 0.0009 km2 in mid-August before gradually contracting throughout September (0.013 ± 0.0005 km2 by September 30th). In 2023, the lake emerged later in the season as the seasonal snow receded, with a similar size (≤0.015 km2) and shape as September 2022, and contracted gradually to 0.007 ± 0.0006 km2 by early September 2023. The 2024 season again showed only short-lived ponding, with a maximum observed area of about 0.005 km2 in July. The lake disappeared by the end of August 2024. The 2022–2024 lake life cycle shows that it developed and contracted gradually over the three-year period and disappeared in August 2024.
Figure 4.
Landsat (1994 and 2004) and PlanetScope (2022–2024) imagery showing mapped glacial lake outlines (shown in yellow) for selected dates between 1994 and 2024. The 2022 imagery series is grouped together in the black box, while the 2023 series is in the blue box, illustrating interannual variability in lake evolution.
3.3. Climatological Context (2000–2025)
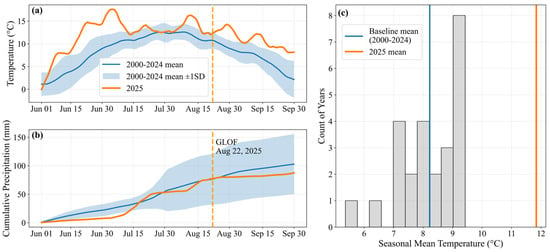
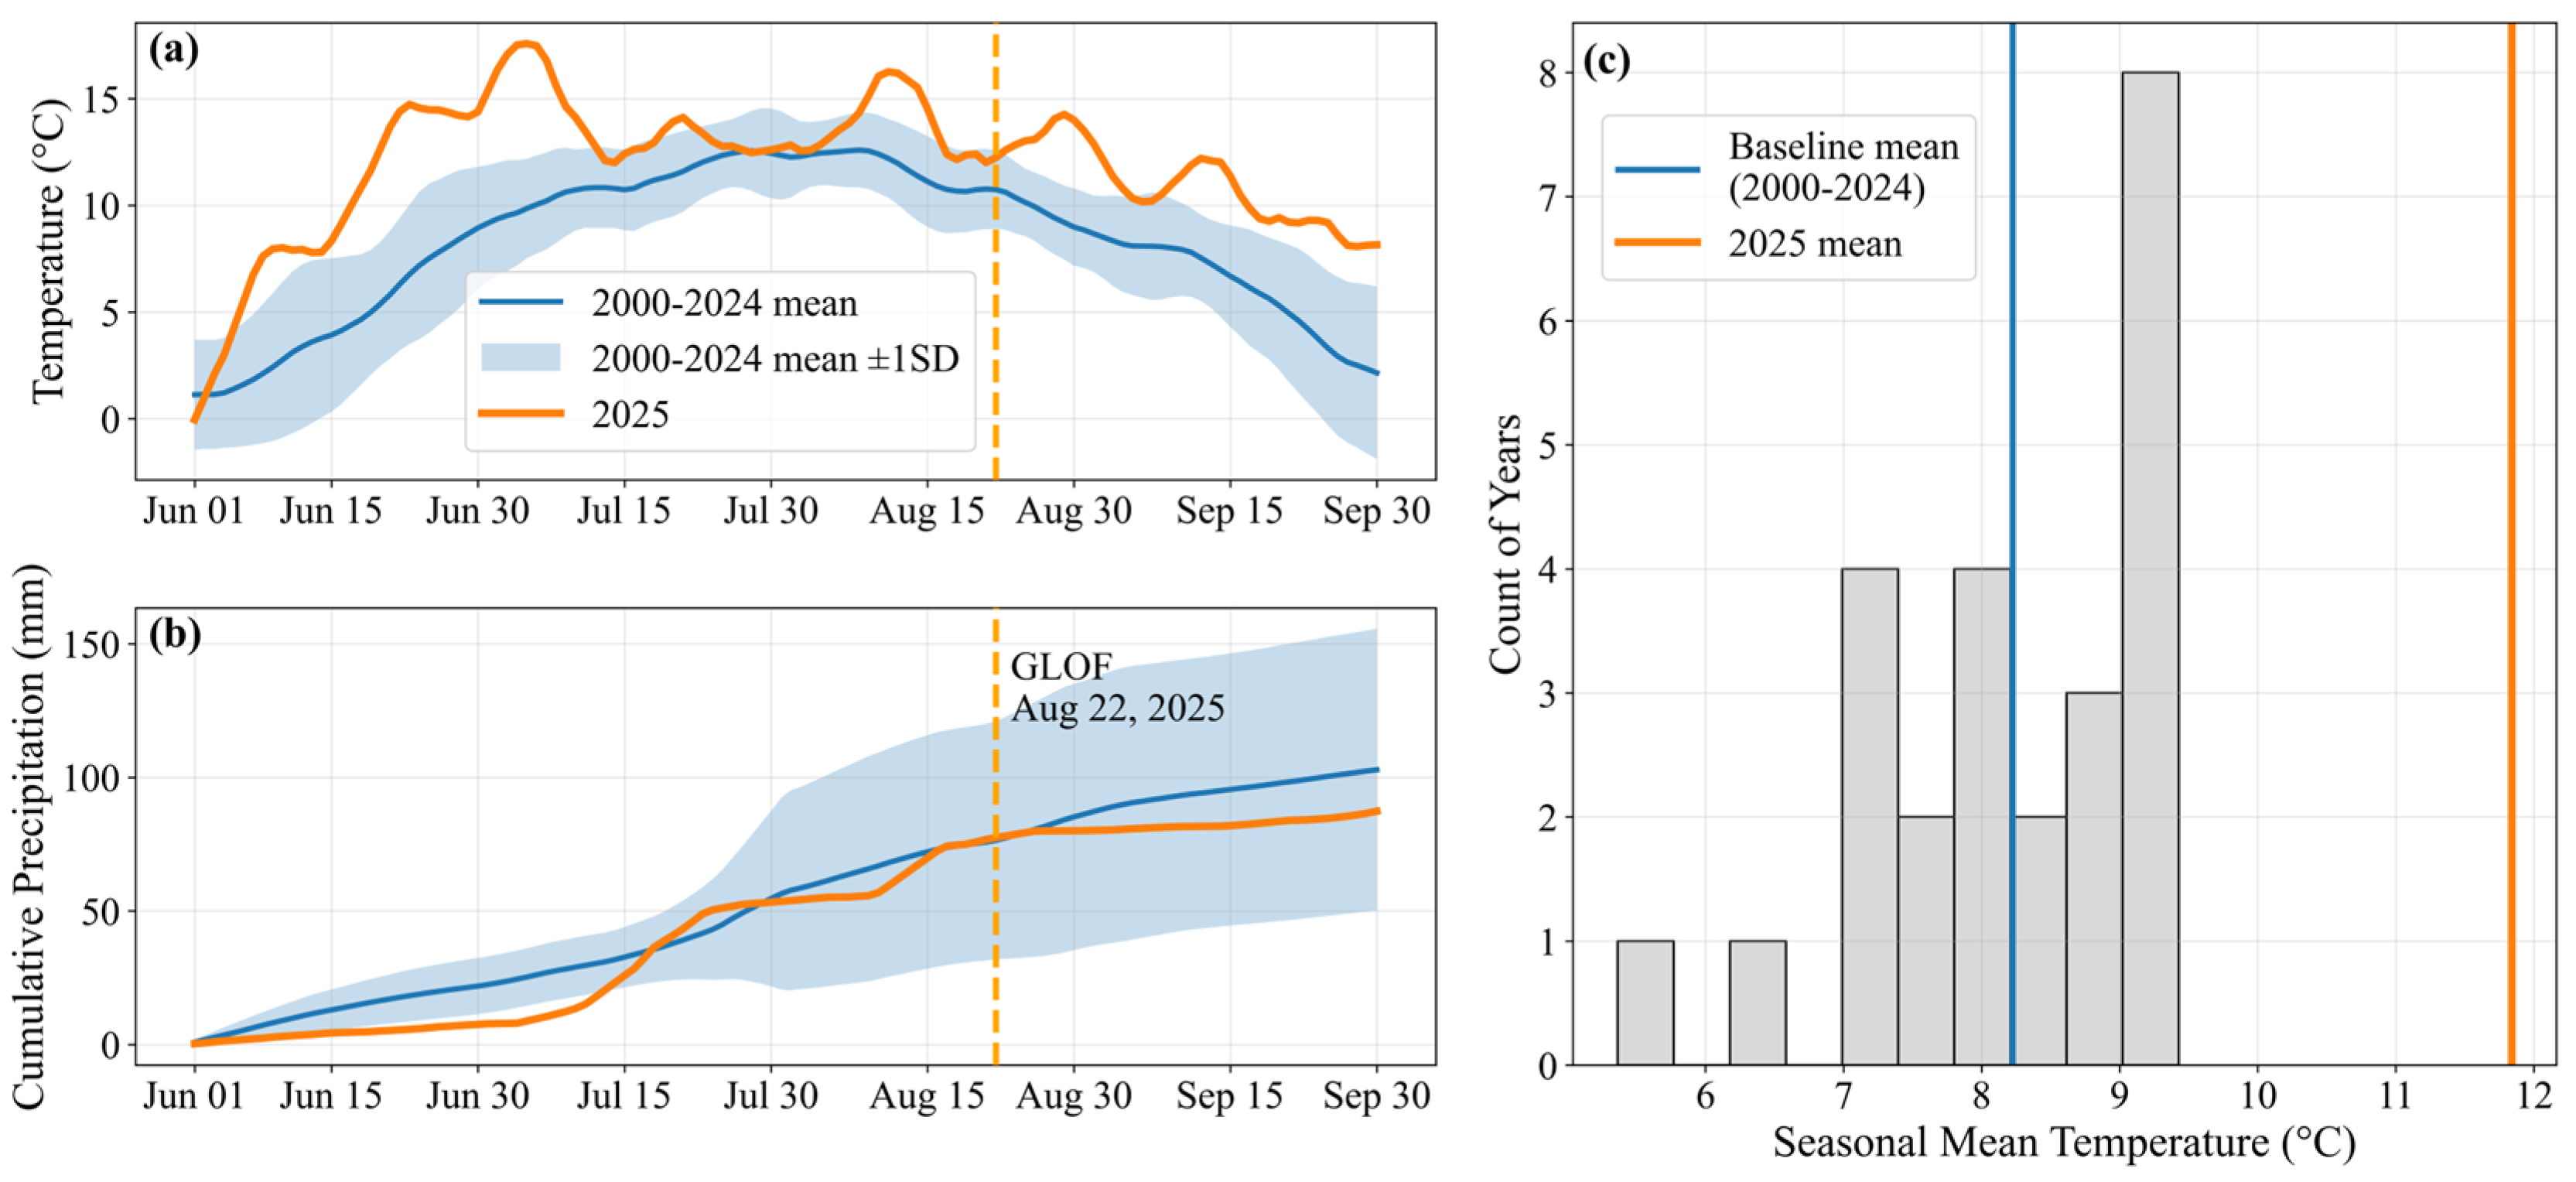
Long-term remote sensing and climatic records suggest that the lake catchment exhibits a strongly seasonal melt regime characterized by progressive warming, declining snow cover, and generally low summer precipitation. Comparison of 2025 conditions with the 2000–2024 climatology reveals that the year of the outburst represents a distinct climatic departure from the long-term climatology, with sustained anomalous warming and exceptionally early snow depletion. The climatology shows that the melt season is characterized by gradual warming from early June, peak temperatures in late July, followed by a gradual cooling period into late September (Figure 5a). There is generally low daily rainfall amounts that are fairly consistent across years during June and July with more variability for the remainder of the period (Figure 5b). Compared to the long-term climatology, daily mean air temperatures in 2025 were substantially warmer, with the seasonal mean increasing from 8.2 °C during 2000–2024 to 11.8 °C in 2025, representing a +3.6 °C deviation (Figure 5c). This value lies 3.4 standard deviations above the historical distribution and ranks as the warmest melt season in the 2000–2025 record. Daily exceedance statistics further show that 2025 was persistently warmer than normal during the melt season, except for a brief near-normal period from late July to early August. Relative to the daily climatology (mean ± 1SD), 86 of 122 days in 2025 exceeded the mean + 1SD envelope and 27 days exceeded mean + 2SD, while none fell below mean—1SD. In contrast, 2025’s cumulative precipitation was well below the climatological precipitation from June to early July. Mid-July 2025 had considerable precipitation which returned the cumulative precipitation within the climatological envelope. The remainder of the period prior to the GLOF was relatively dry except for a large multi-day rainfall event in mid-August approximately a week before the GLOF.
Figure 5.
Climatology of the lake catchment derived from ERA5-Land temperature and GPM IMERG precipitation data. (a) Daily mean 2 m air temperature for June-September 2025 compared with the 2000–2024 climatological mean and ±1SD envelope. The vertical dashed line marks the GLOF date (22 August 2025). (b) Cumulative precipitation for 2025 compared to the 2000–2024 climatological range. (c) Distribution of June-September mean temperatures for the 2000–2024 baseline period, with vertical lines denoting the baseline mean and the 2025 seasonal mean.
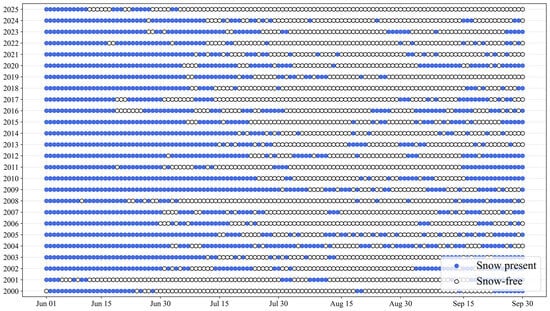
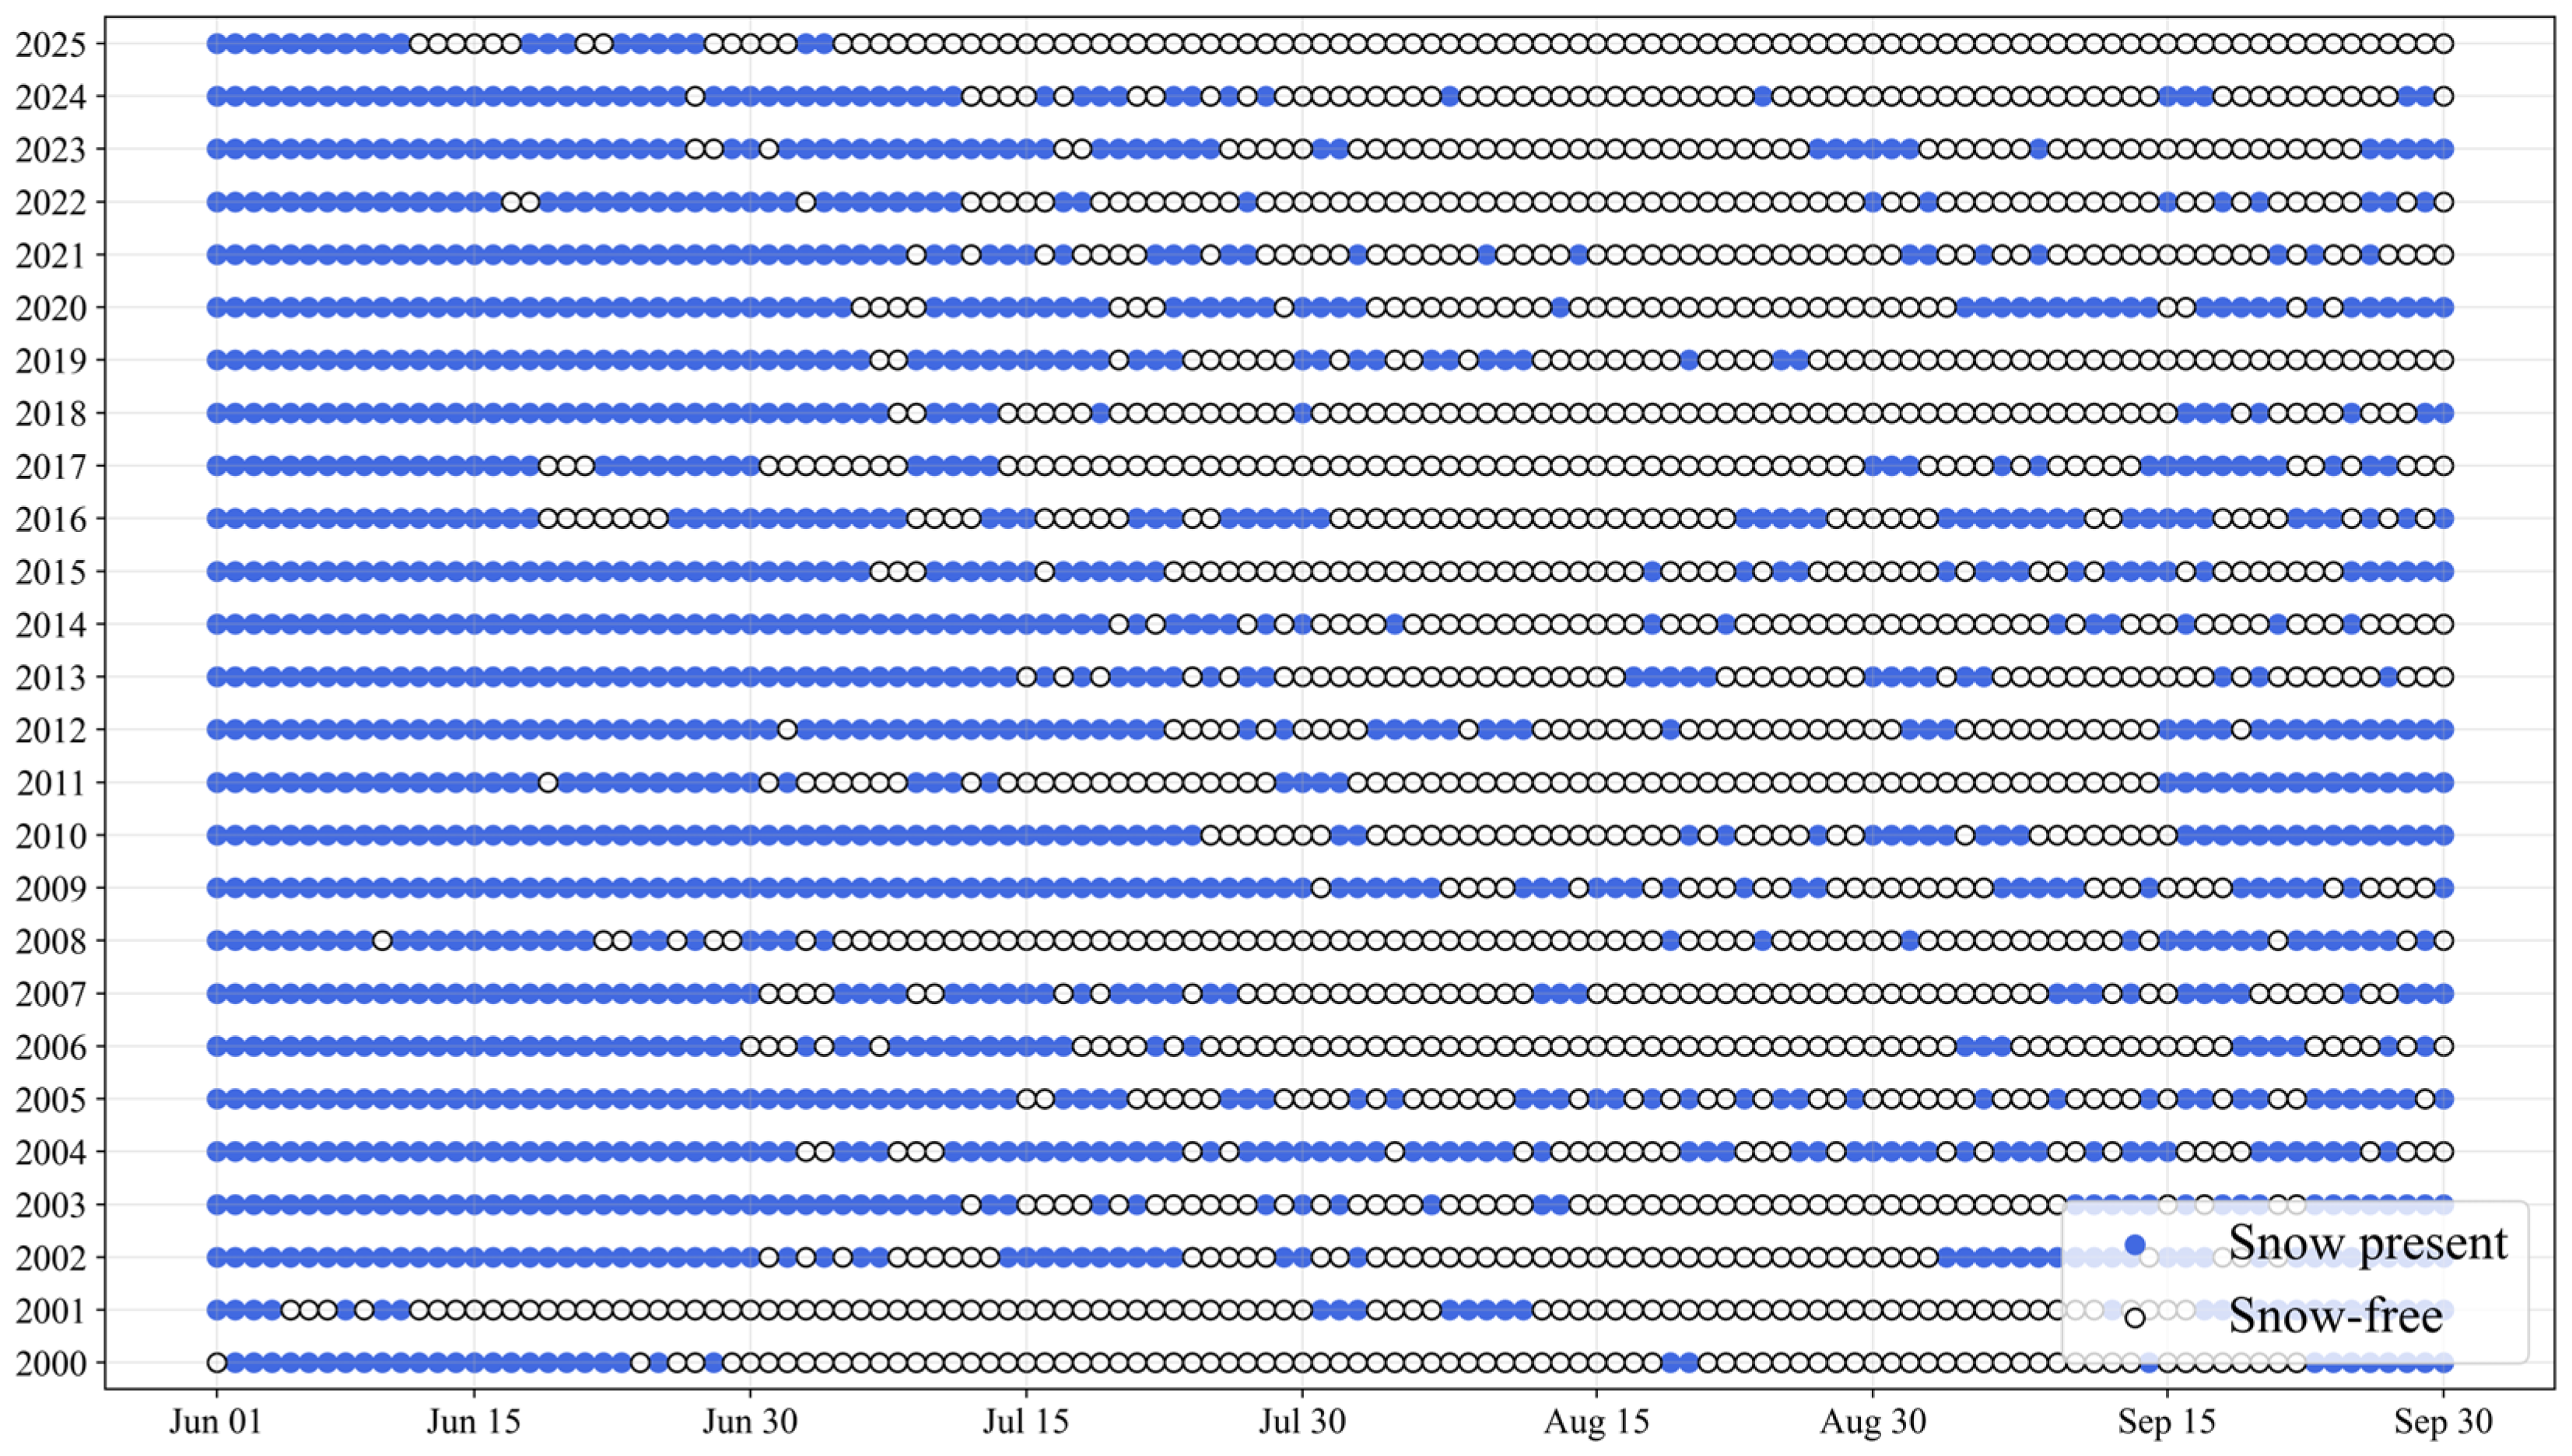
MODIS observations show that the lake catchment typically experiences a gradual transition from snow-covered to intermittently snow-free conditions during the melt season. In most years, consecutive snow-free days are concentrated between late July through early September, while snow cover persists through June and often reappears episodically during the melt season (Figure 6). For the 2000–2024 snow cover climatology, the catchment experienced an average of ~60 snow-free days, with historical values ranging from a minimum of 33 days to a maximum of 92 days. In contrast, 2025 exhibited a markedly different seasonal snow regime. The catchment transitioned to persistently snow-free conditions by early July and remained snow-free through September, resulting in 101 snow-free days, which is the highest value in the 26-year record (Figure 6 and Figure S3).
Figure 6.
Daily snow presence and absence in the lake catchment from June to September for 2000–2025 derived from MODIS observations. Each point represents a single day, where blue markers indicate snow presence and gray markers indicate snow-free conditions. The plot shows that 2025 experienced an unusually early transition to persistent snow-free conditions compared to the historical record.
3.4. Snow Dynamics and Lake Evolution
Based on historical snow climatology derived from MODIS, no consistent relationship is evident between snow dynamics and lake formation (Figure 6). In the early years (2000–2001), only minor ponding is observed in the available imagery with relatively high numbers of snow-free days. 2004 exhibits significant lake formation in the July Landsat image, and it corresponds to one of the lowest numbers of snow-free days (33 days). Across the period from 2005 to 2021, lake development remains limited to minor ponding despite substantial interannual variability in snow-free conditions. More recently, pronounced lake formation is observed in 2022 and 2025, with 2025 exhibiting the highest snow-free conditions.
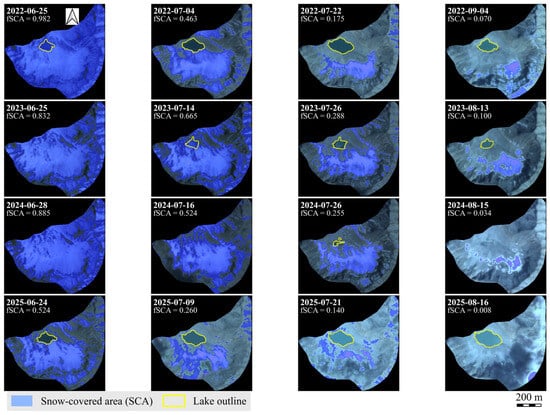
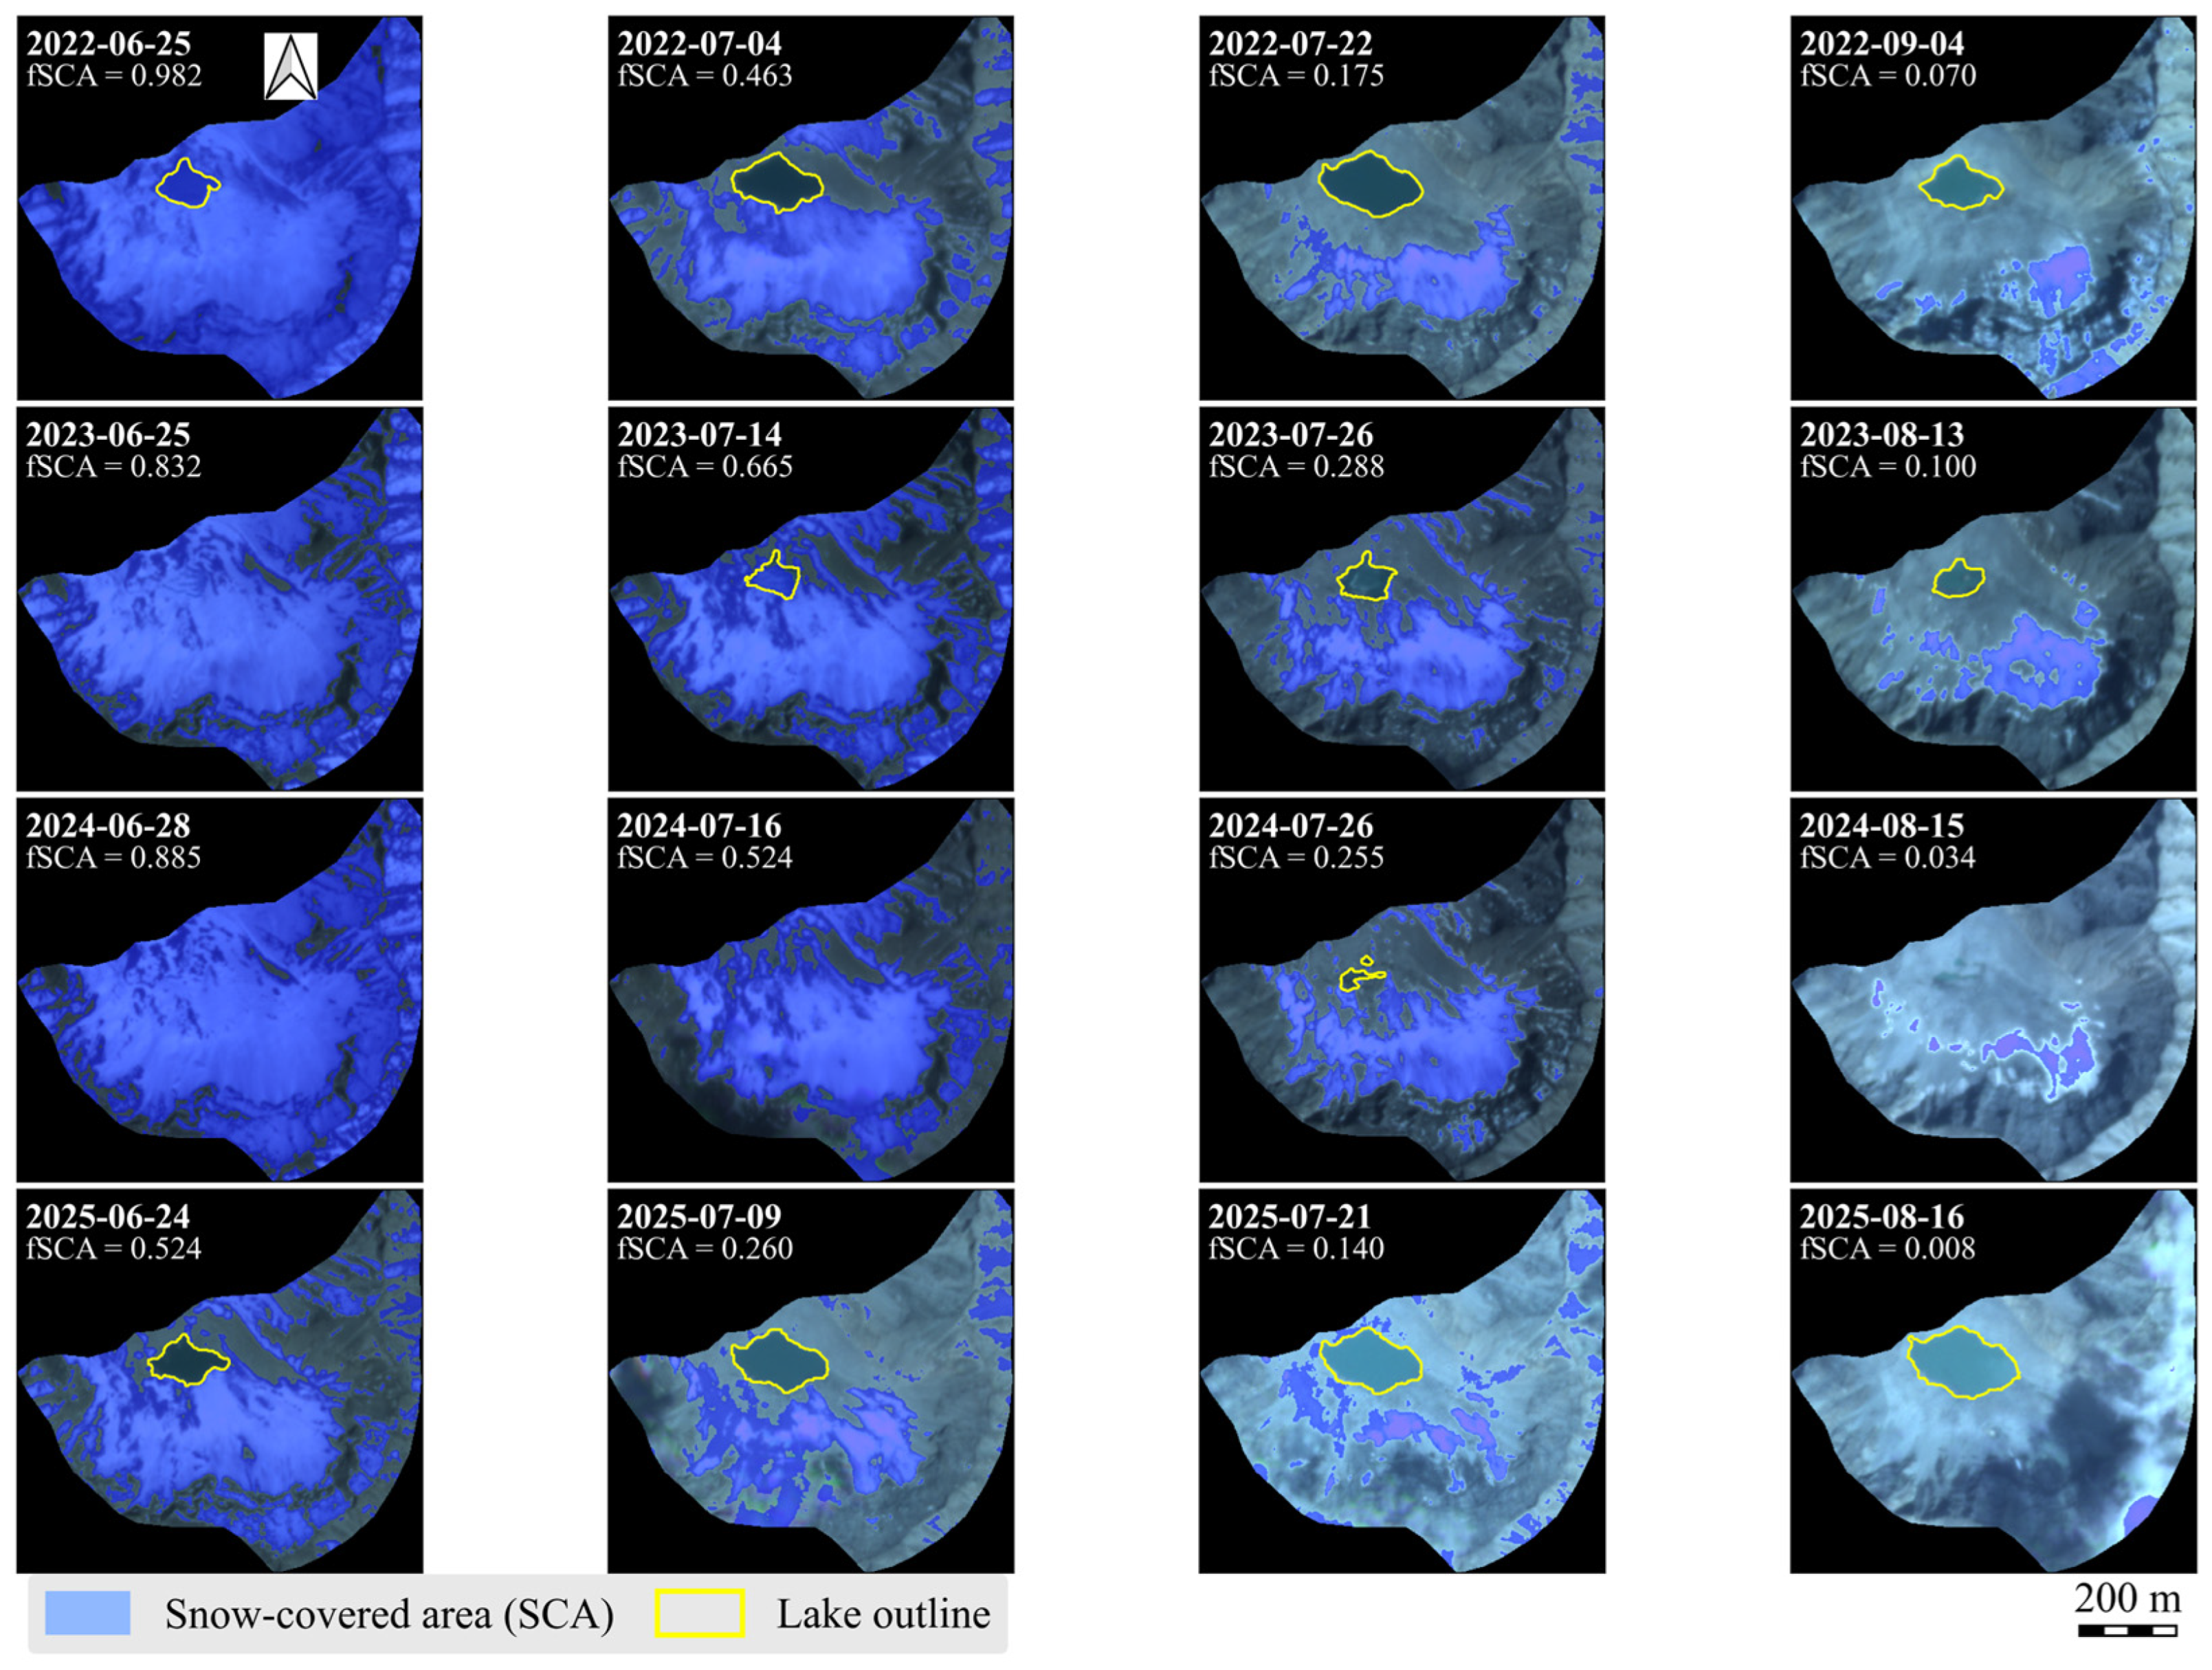
High-resolution PlanetScope imagery provides detailed insight into intra-seasonal snow dynamics and lake evolution, revealing an earlier onset and a longer duration of snow-free conditions during the GLOF year as compared to other recent years (Figure 7 and Figure S4). Across all four years from 2022 to 2025, SCA followed a generally similar seasonal trajectory, with progressive depletion from late June through late September. However, the timing and magnitude of snow loss differed among years. In 2025, fSCA decreased from moderate snow coverage (~52%) in late June to near-zero values by mid-July and remained effectively snow-free for the rest of the melt season. In contrast, during 2022, 2023, and 2024, despite rapid early-season snow loss, measurable snow cover persisted into mid-August or later. SCA at comparable stages of the melt season was lower in 2025 than in 2022, 2023, and 2024.
Figure 7.
Seasonal evolution of SCA and the glacial lake across the 2022–2025 melt seasons, showing representative dates from late June, early July, late July, and late summer for each year. Images show progressive seasonal snow (blue areas) depletion and associated lake (yellow outline) development in the catchment.
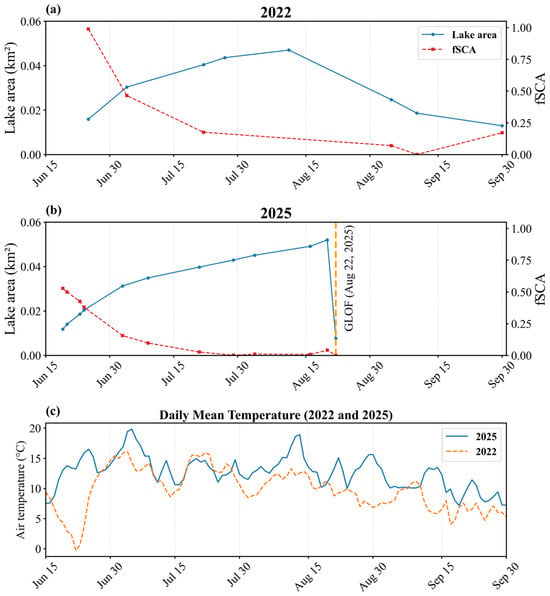
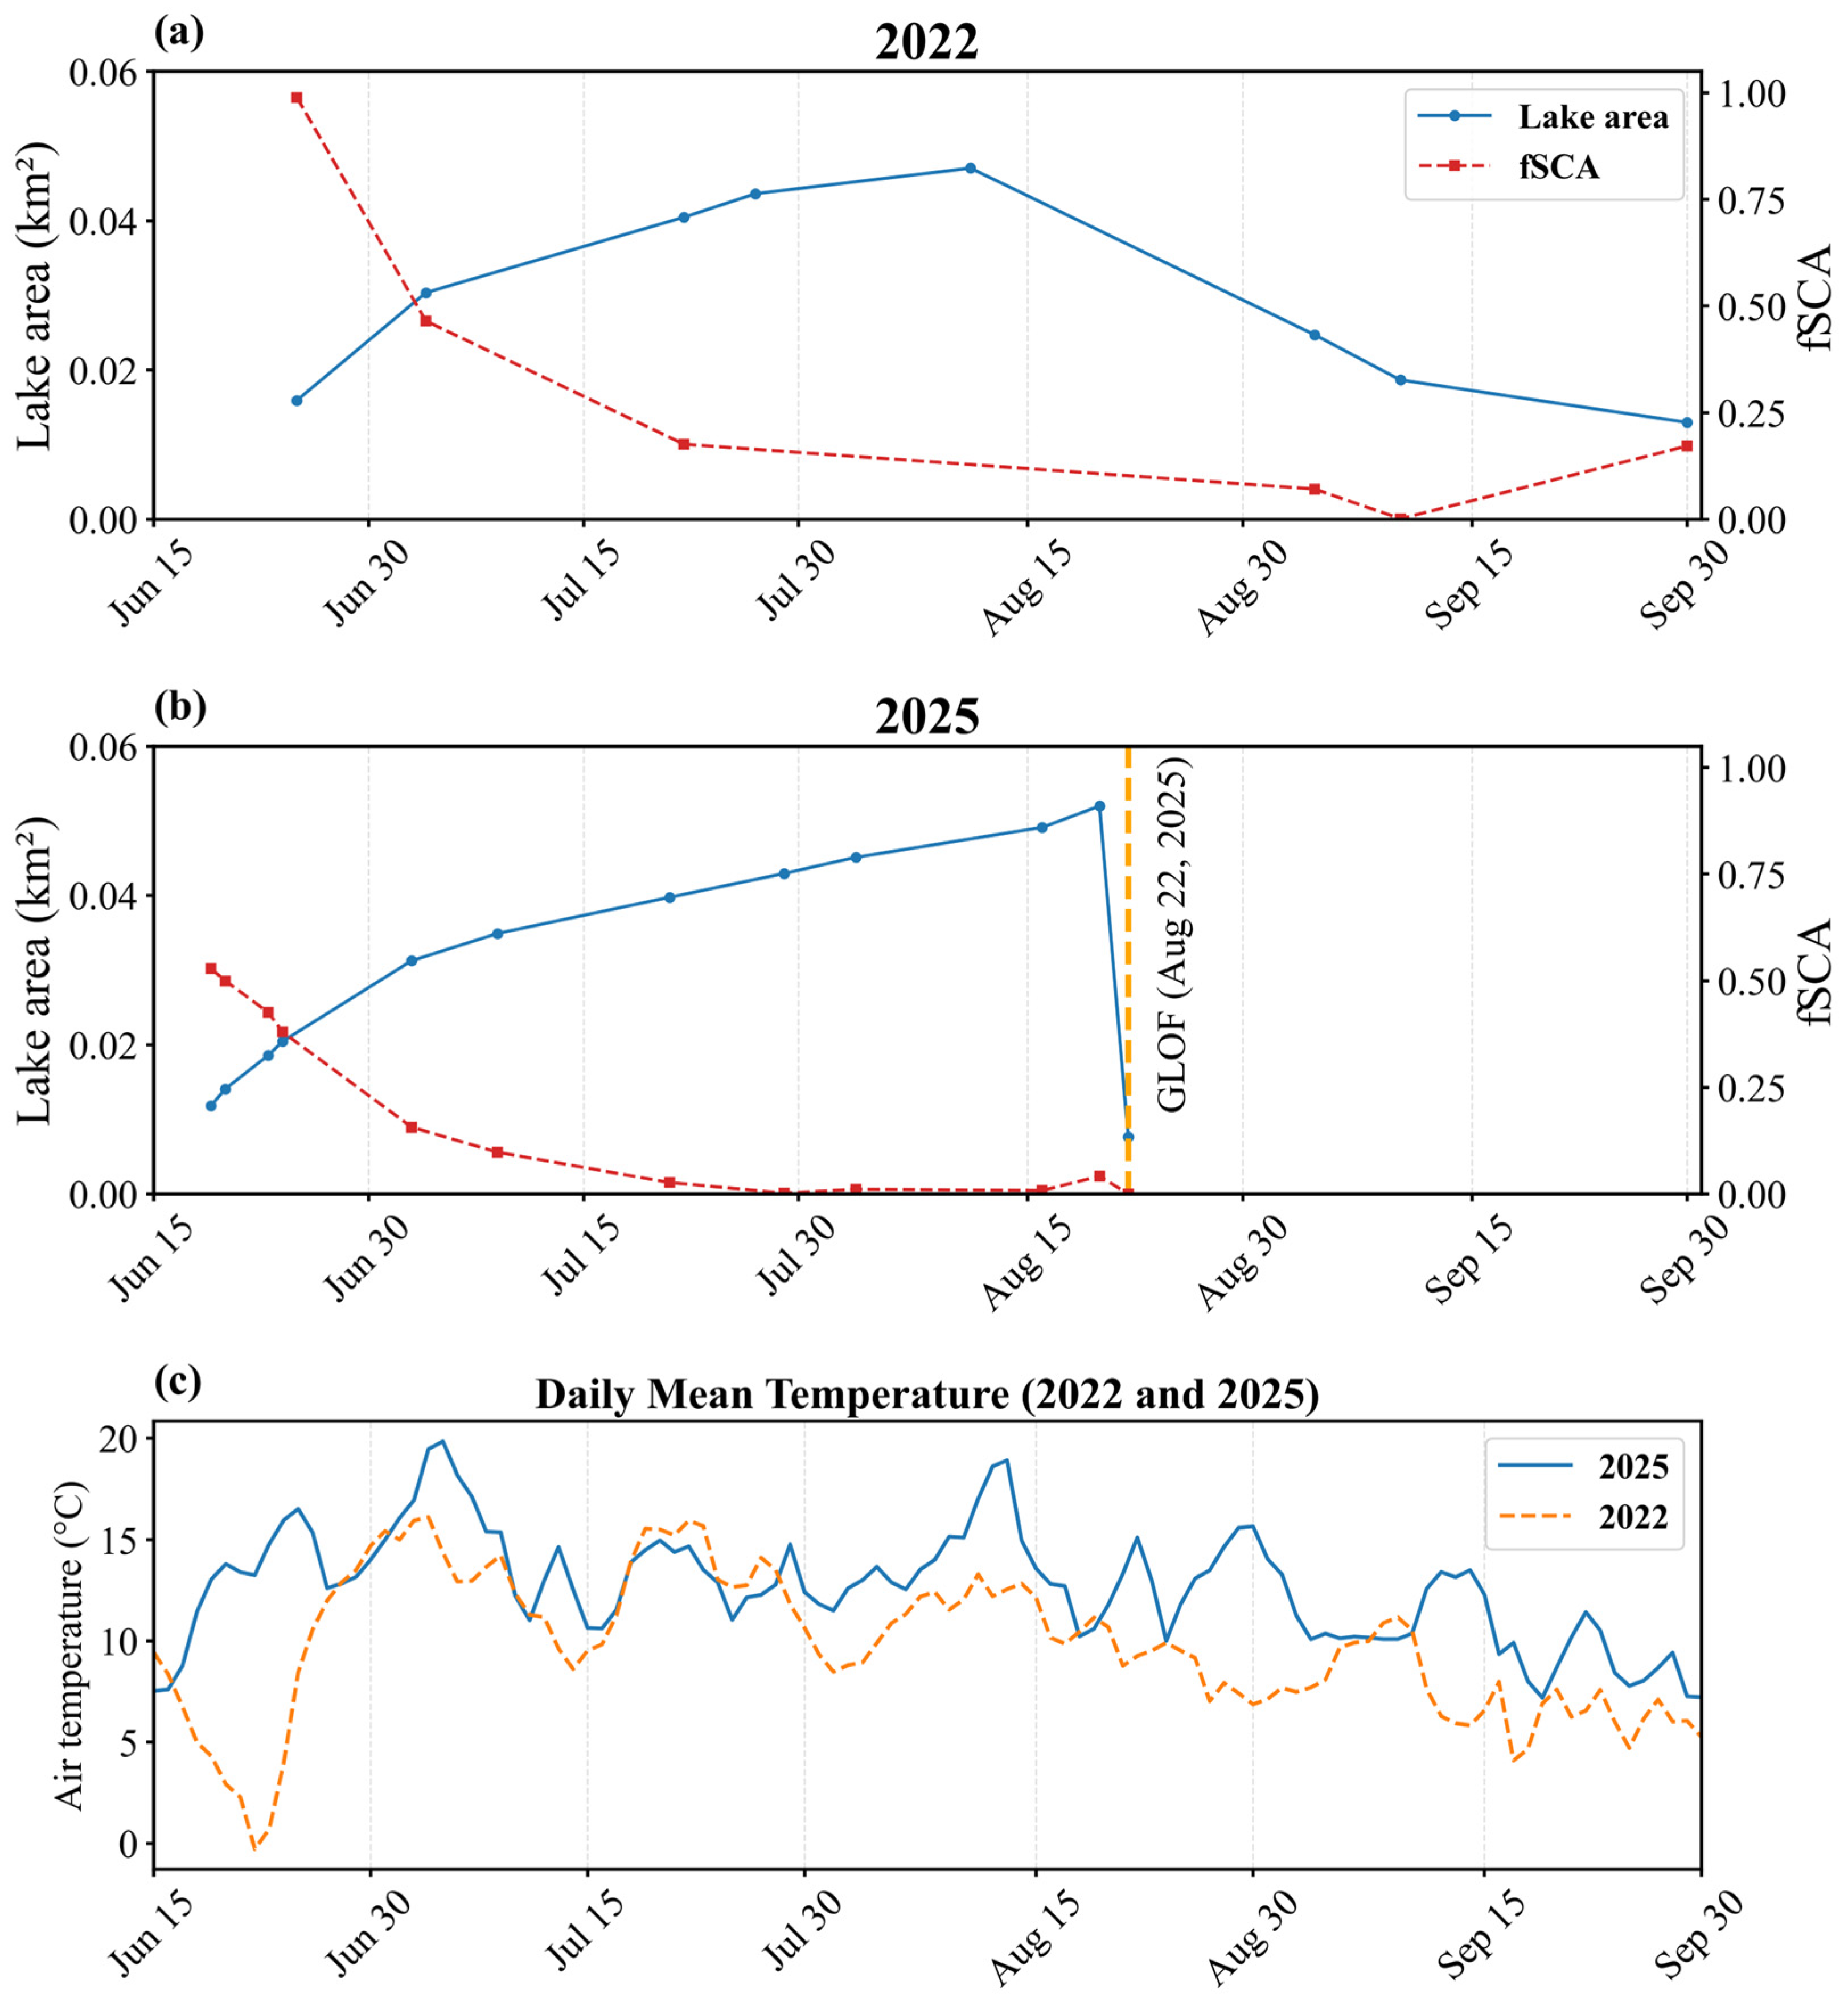
2022 and 2025 had different snow conditions and lake evolution patterns (Figure 8). In both years, initial lake expansion coincided with declining fSCA during early summer, suggesting that seasonal snowmelt was an important source of inflow. However, the subsequent trajectories diverged. In 2022, the lake reached its maximum extent around mid-August and then gradually contracted through late summer despite consistent snowmelt (Figure 8a). In 2025, rapid and near-complete snow depletion was accompanied by rapid lake expansion through June and July. The lake reached a similar maximum extent as in 2022 on a comparable seasonal timeline but instead culminated in abrupt drainage on 22 August 2025 (Figure 8b). The daily temperature comparison shows higher temperatures in 2025 compared to 2022 (Figure 8c).
Figure 8.
Seasonal evolution of lake area, fractional snow-covered area (fSCA), and air temperature for 2022 and 2025. (a) lake area and fSCA time series for 2022, characterized by gradual lake growth and seasonal contraction without abrupt drainage. (b) Time series of lake area (blue) and fSCA (red) during the 2025 melt season, showing progressive lake expansion followed by abrupt drainage on 22 August 2025 (orange vertical line). (c) Comparison of daily air temperature for the summer season, showing higher temperatures in 2025 compared to 2022.
3.5. Potential GLOF Trigger
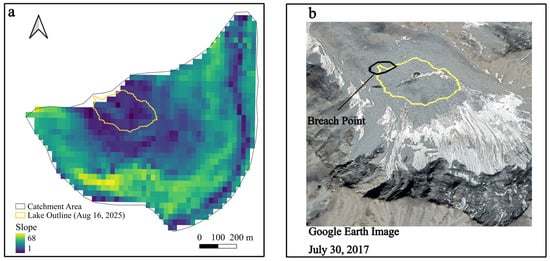
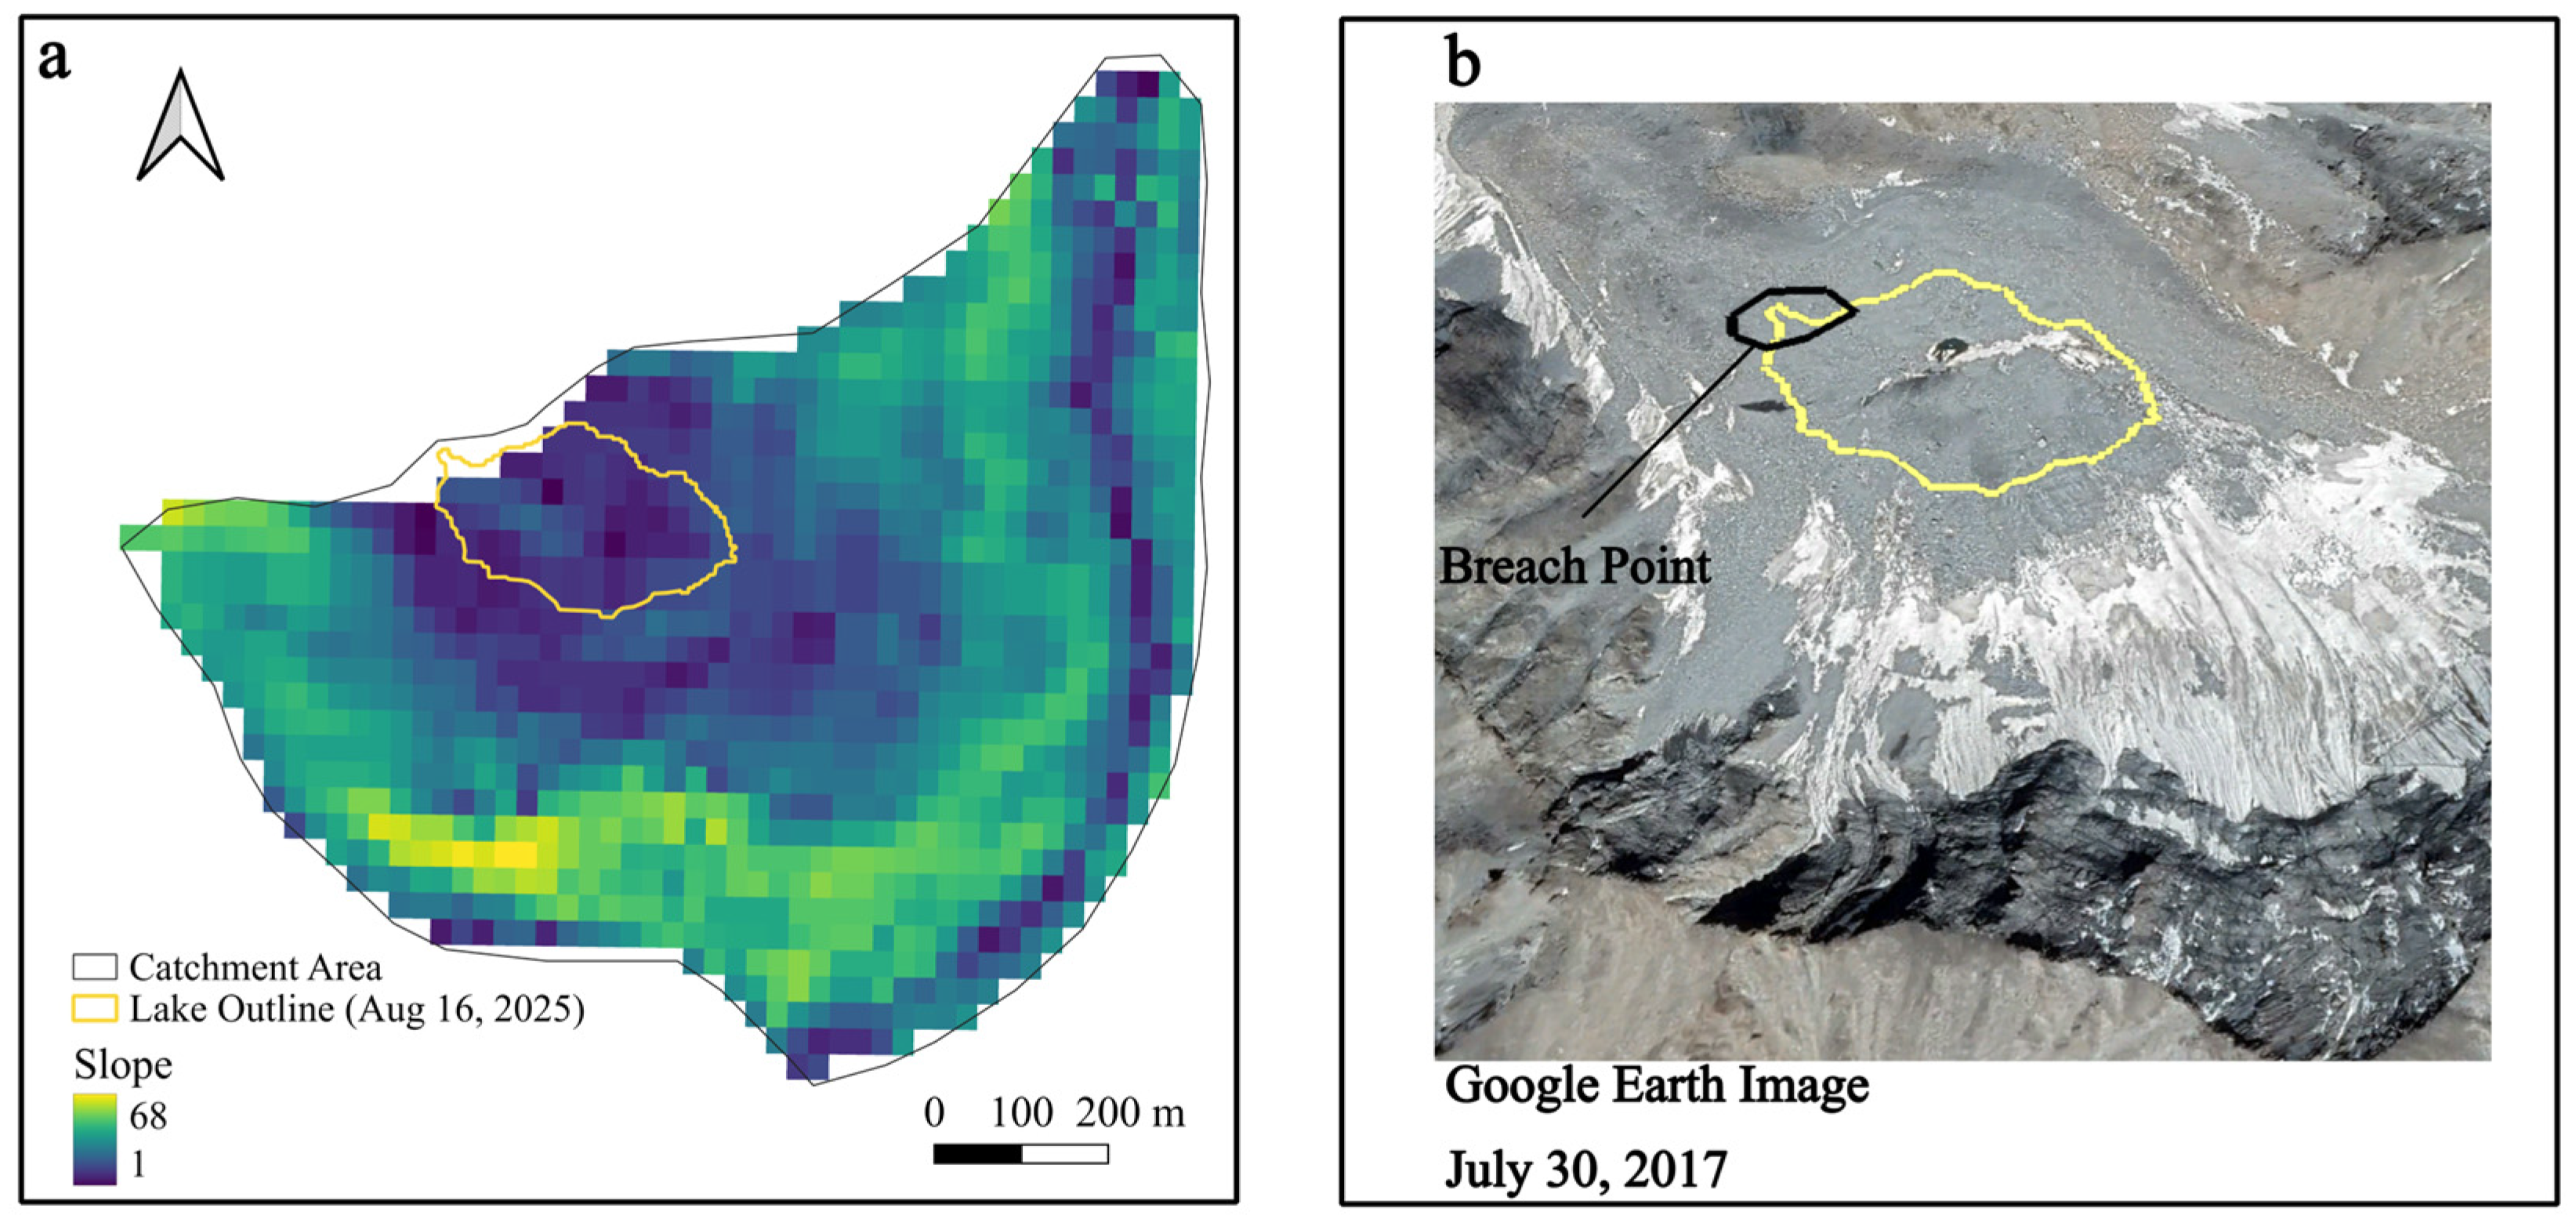
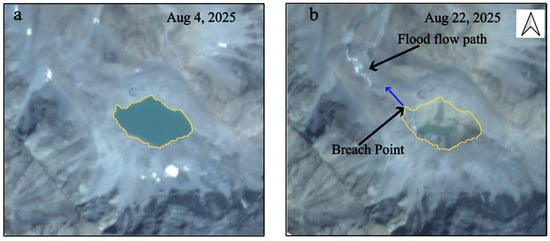
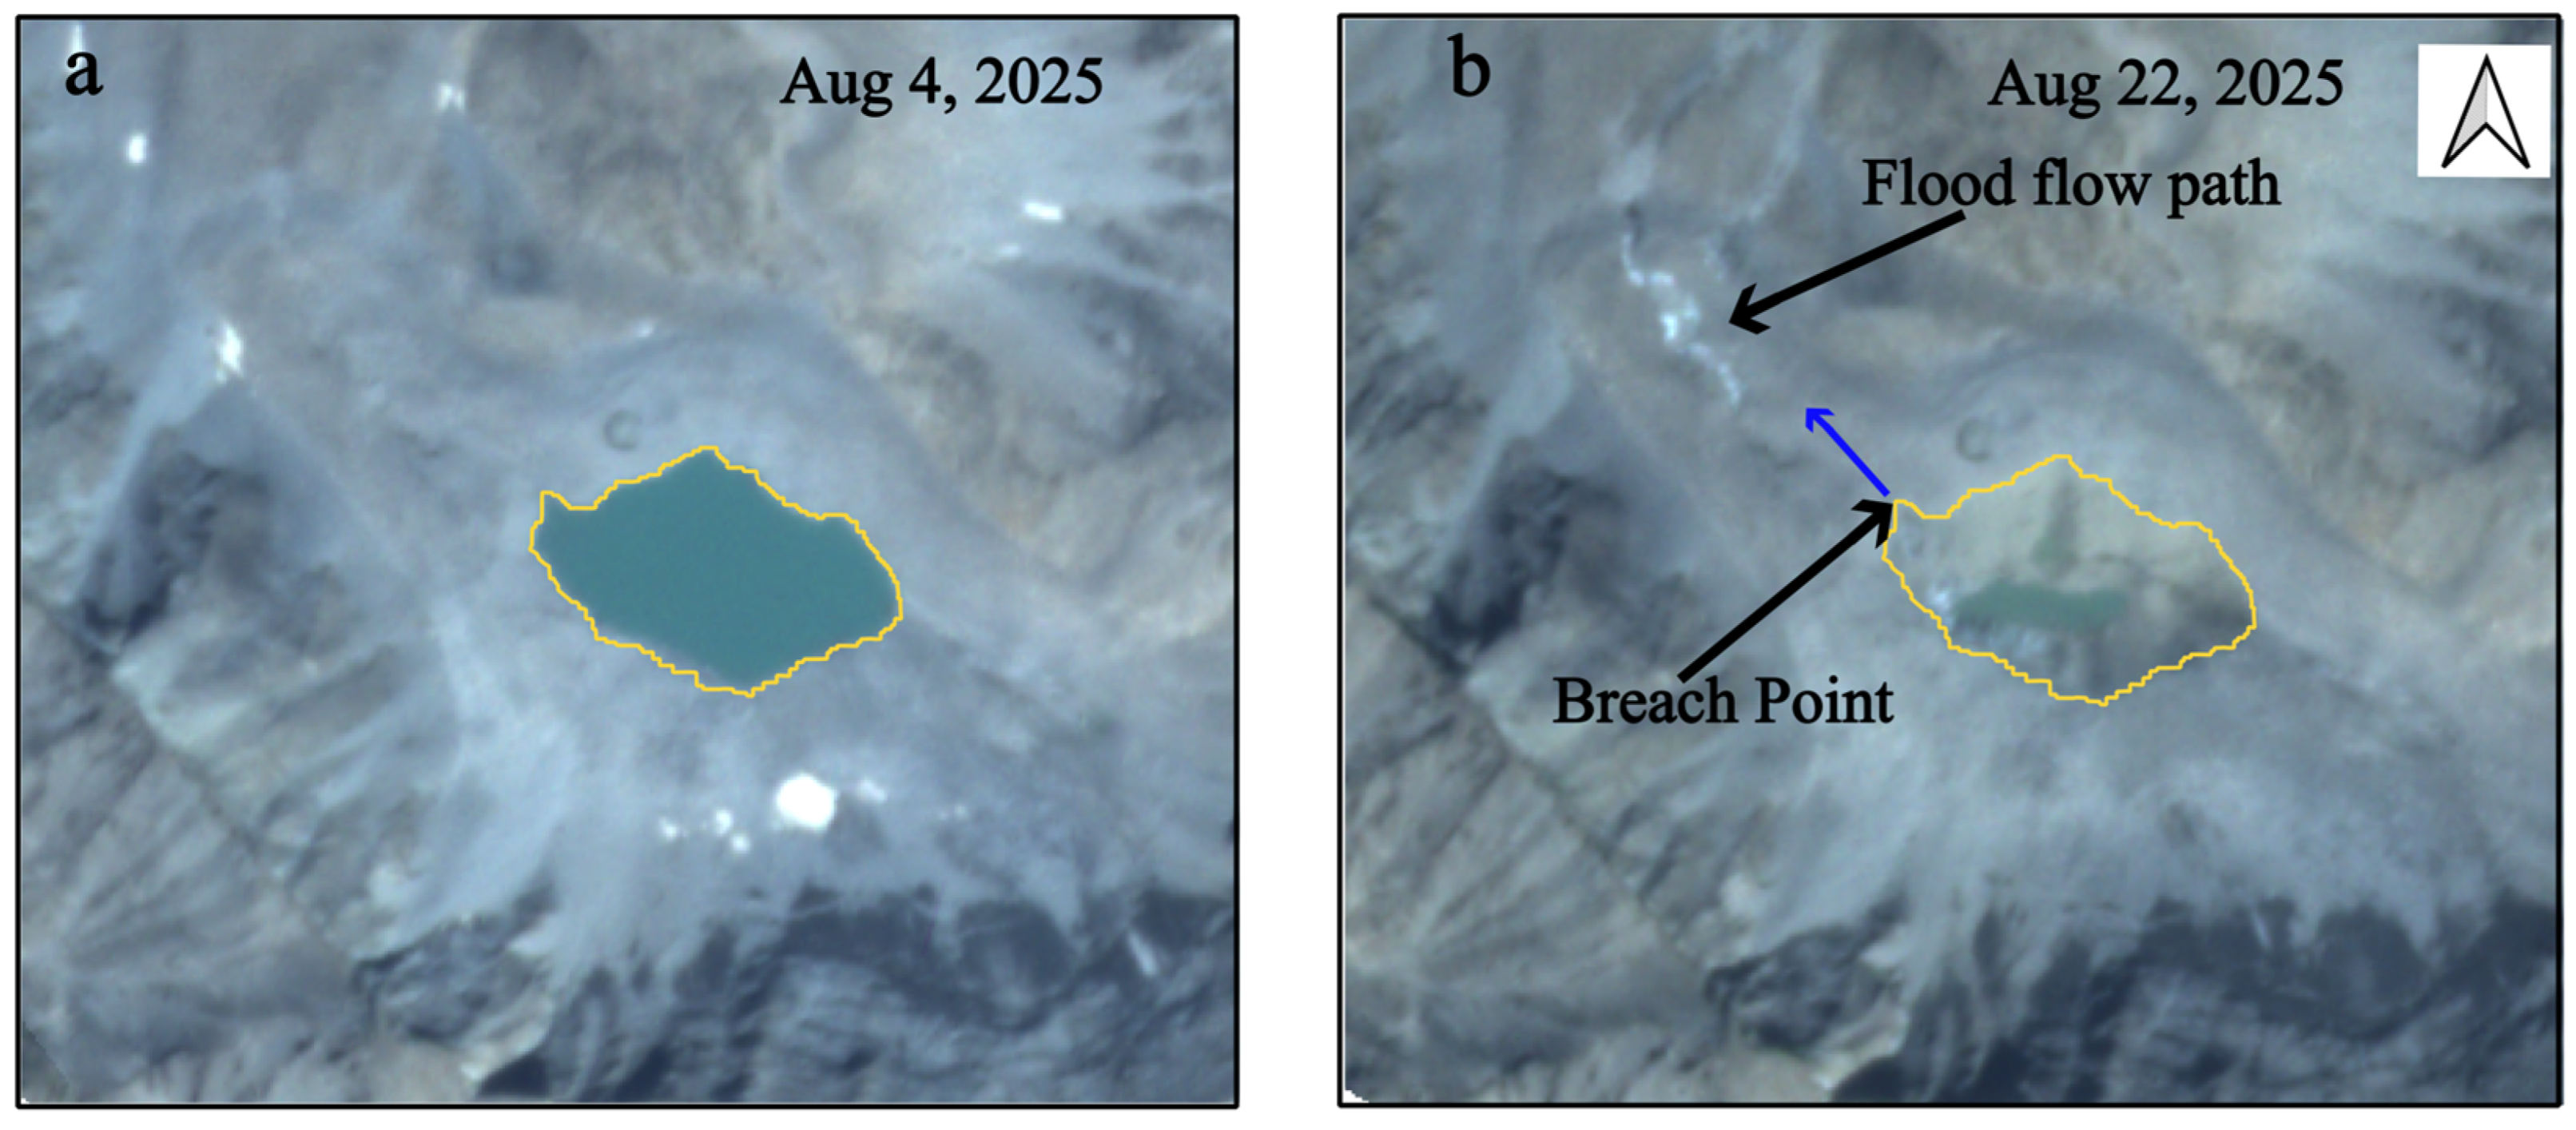
Topographic analysis based on the SRTM DEM indicates that the lake catchment is characterized by steep and highly variable terrain, with a mean slope of approximately 30° and local slopes reaching up to 68° (Figure 9a). Steep slopes surround the lake, forming near-vertical headwalls in several locations above the lake basin (Figure 9b). The High Mountain Asia permafrost dataset indicates a high probability (0.99) of near-surface permafrost occurrence within the lake catchment. Such conditions are conducive to slope instability and mass movements, particularly during warm periods where sub-surface ice may begin to thaw. However, comparison of pre- and post-event PlanetScope true- and false-color imagery reveals no clear evidence of a large landslide or coherent debris deposit on the slopes surrounding the lake (Figure 10a,b). No distinct scar or accumulation feature is detectable at PlanetScope resolution, suggesting that a major slope failure was unlikely to have directly initiated the outburst. While small, localized mass movements below the detection threshold of the imagery cannot be entirely excluded, there is no optical evidence to support a landslide-dominated trigger.
Figure 9.
Terrain context of the breached glacial lake and surrounding catchment. (a) Slope derived from the SRTM DEM, with the pre-GLOF lake outline (yellow) overlain highlights the steep and topographically complex terrain surrounding the lake. (b) Google Earth image of the same area shows the lake position (yellow outline) relative to adjacent high-slope regions and near-vertical cliff walls in the upper catchment.
Figure 10.
Pre- and post-event PlanetScope imagery of the glacial lake showing morphological changes associated with the 2025 GLOF. (a) The pre-event image shows the intact lake with the pre-GLOF lake outline (yellow) indicated. (b) The post-event image shows the pre-GLOF lake outline (yellow) over the drained basin, breach point at the lowest lake margin, and a channelized flood-eroded and reworked sediment corridor extending downstream from the breach.
The optical evidence suggests that the 2025 GLOF was driven by meltwater inflow from seasonal snow leading to overtopping or erosion and dam failure rather than by a large landslide trigger. GPM IMERG daily precipitation time series shows several short-duration precipitation events during August 2025 (Figure S6), suggesting moist soils as well as runoff inputs to the lake. Fresh snowfall on August 20, as shown by PlanetScope imagery, at higher elevations within the steep, rapidly draining catchment and its disappearance by August 22 (Figure S5) implies meltwater input prior to the outburst. Although ERA5-Land temperature time series indicates above-freezing air temperatures during this period (Figure S6), the coarse spatial resolution (~9 km) of the reanalysis product may overestimate temperatures at the high elevations. The rapid melt of the fresh snowfall likely produced short-term inflow pulses to the lake, increasing hydrostatic pressure on the moraine dam and enhancing overtopping or erosional failure potential prior to the outburst.
Post-event imagery shows near-complete drainage of the lake, accompanied by widespread exposure of lakebed sediments and dam breach at the lowest point along the lake margin (Figure 10b). A narrow, elongate corridor of light-toned disturbed material extends downstream from the breach, following a pre-existing topographic low.
4. Discussion
4.1. Climatic and Cryospheric Controls on the 2025 GLOF
Among the wide range of documented GLOF trigger mechanisms, dynamic mass movements into lakes, such as landslides, avalanches, rockfalls, or glacier calving, are widely recognized as the dominant trigger type [7,24,59]. Such mass movements can rapidly displace lake water and generate high-energy displacement waves that overtop and erode moraine dams [11,15]. Hydrometeorological extremes, including intense rainfall or rapid ice and snowmelt during exceptionally high temperatures, can also destabilize dams by abruptly raising lake levels and increasing hydrostatic pressure on dam structures [12,60,61]. In addition to these dynamic triggers, more gradual processes may lead to GLOFs, including continuous lake level rise resulting in overtopping or hydrostatic failure, as well as internal degradation mechanisms such as seepage, piping, and the thawing of ice-cored or permafrost-rich moraine materials that weaken dam stability over time [11,21,61,62].
The 2025 Talidas GLOF was most likely driven by a combination of anomalous climatic and cryospheric conditions rather than a discrete external trigger. Summer 2025 represented an extreme climatic outlier relative to the 2000–2024 baseline, characterized by a sustained positive thermal departure throughout the melt season. These persistently warm conditions likely enhanced catchment-wide snowmelt, accelerated lake growth, and resulted in unusually prolonged snow-free periods. The sustained rise in lake level would have progressively increased hydrostatic pressure on the moraine dam, promoting overtopping or erosional incision even in the absence of a sudden impact trigger.
In addition to meltwater input, permafrost conditions within the high-elevation catchment may have further contributed to dam destabilization. Degradation of permafrost in steep alpine terrain can increase the likelihood of rockfalls and slope failure, while thawing of ice-rich moraine materials may reduce dam stability [63]. The high probability of permafrost at the site suggests the presence of frozen ground and potentially ice-rich moraine materials within the lake basin and surrounding terrain. In such systems, permafrost binds unconsolidated sediments and its degradation leads to a reduction in sediment cohesion and overall weakening of the moraine structure [64,65]. Prolonged snow-free conditions, combined with anomalously warm temperatures across much of the summer, would have increased surface energy absorption, promoting ground warming and potential permafrost degradation [14,66]. Such degradation has been widely documented across the Tibetan Plateau under recent warming trends [15]. As ice-rich moraine material thaws, void space and permeability increase, enhancing infiltration, internal seepage, and pore-water pressure, which can promote piping and internal erosion under sustained lake loading [67,68]. In addition, thaw-induced degradation of buried ice or ice-rich layers may lead to localized subsidence, reducing dam elevation and freeboard, thereby increasing susceptibility to overtopping and breach initiation [30]. Comparable mechanisms have been reported in the High Mountain Asia region highlighting the role of thawing permafrost as a key preconditioning factor in lake instability and the increasing GLOF hazards under sustained warming in the region [25,65,68,69]. While no clear optical evidence of slope failure was observed in the Talidas catchment, progressive weakening of frozen or ice-rich dam materials and increased erosional susceptibility under sustained hydrostatic pressure remain plausible contributing factors.
Short-term hydrological pulses immediately prior to the outburst may have provided an additional destabilizing factor. The presence of fresh snow on August 20 on the upper slopes, followed by its disappearance by August 22, indicates a likely rapid melt event before the GLOF. In a steep, fast-draining catchment, rapid melt events can generate meltwater inflow over short timescales [63]. In addition, precipitation events during this period would have further increased catchment wetness and inflow to the lake. These short-lived melt and rainfall pulses, acting on an already stressed lake system, likely increased hydrostatic pressure on the moraine dam and contributed to overtopping or erosional breach.
In summary, the 2025 Talidas GLOF was most likely the result of compound climatic and cryospheric forcing. Lakes of comparable extent were observed in earlier years (e.g., 1994, 2004, and 2022) without documented outburst. However, it is important to note that the temporal resolution of Landsat imagery may limit the ability to detect short-lived or rapid drainage events in earlier years. Despite this limitation, no evidence of past GLOFs was identified from available local records, including regional newspapers and reports. Furthermore, informal communication with local residents did not indicate recollection of any previous outburst events.
To better contextualize the 2025 event, a comparison with lake evolution in recent years provides useful insight. During 2022–2024, the lake evolved more gradually, reached peak extent in mid-August, and subsequently contracted without abrupt drainage, while seasonal snow persisted throughout much of the summer, suggesting comparatively cooler melt-season conditions. In contrast, the 2025 lake exhibited rapid expansion, reached a similar maximum extent on a comparable seasonal timeline, and then underwent abrupt drainage. This divergence in behavior points to the importance of environmental preconditioning in 2025 but also to the unpredictable nature of GLOF events. The concurrence of sustained warm temperatures, early and prolonged snow depletion, potential permafrost-related weakening of moraine materials, and short-term late-season inflows likely enhanced meltwater inflow and hydrostatic pressure while progressively reducing dam stability, ultimately leading to overtopping or erosional breach.
4.2. Implications for Remote Sensing-Based GLOF Monitoring and Early Warning
Remote sensing has emerged as an essential tool for the detection and monitoring of glacial lakes in remote, high-mountain regions where ground-based observations are limited or logistically impractical [70,71]. Multi-temporal satellite imagery enables systematic tracking of lake evolution, identification of changes in surrounding terrain, and assessment of potential GLOF hazards [34]. Advances in high-resolution optical and radar datasets have further improved the ability to reconstruct lake growth histories, evaluate geomorphic conditions, and quantify downstream impacts [10,17,72]. The increase in spatiotemporal resolution of satellite imagery and the number of available data sources (Figure 3) will further improve monitoring and predicting GLOF risks. The integration of remotely sensed observations with climate and cryospheric data has also enhanced understanding of how meteorological forcing influences lake behavior, geomorphological changes in the lake catchment, and GLOF occurrence [15,26].
Based on the analysis of the Talidas GLOF event, an operational early warning framework for similar high-mountain environments can be devised. The major indicators of heightened GLOF risk can include a concurrence of rapid lake growth at seasonal scales in a catchment dominated by steep slopes and permafrost, sustained positive temperatures, and early depletion of snow cover in the catchment. Such conditions may enhance both the likelihood of external triggers (e.g., landslides) and internal dam destabilization. From an operational perspective, such indicators can be monitored using a multi-sensor framework. High-resolution optical imagery (e.g., PlanetScope, Sentinel-2) can be used to track lake area changes at sub-weekly to weekly intervals, while moderate-resolution datasets (e.g., Landsat) provide longer-term historical context. Snow cover dynamics can be derived from optical indices or available MODIS products, and temperature anomalies can be assessed using reanalysis datasets (e.g., ERA5-Land). In regions with frequent cloud cover, Sentinel-1 SAR data can provide complementary observations of lake extent and surface conditions.
The findings of this study suggest that remote-sensing-based GLOF monitoring frameworks should move beyond a sole focus on maximum lake size. Greater emphasis should be placed on tracking the trajectory of lake growth, evaluating dam and catchment characteristics, and identifying potential triggering processes such as landslides, avalanches, glacier calving, anomalous meteorological conditions or gradual dam degradation. Historical lake behavior, as documented through multi-decadal satellite records, can provide critical context for assessing which lakes are exhibiting anomalous or hazardous development patterns, such as rapid lake growth. Incorporating these indicators into monitoring protocols can improve the ability of remote sensing to support early-warning systems and proactive risk management.
4.3. Limitations and Future Directions
Although this study benefited from high spatial resolution (3 m) PlanetScope imagery for mapping lake outlines, several sources of uncertainty remain. Manual delineation using high-resolution imagery reduces area estimation errors relative to coarser-resolution sensors, but shoreline mapping can still be affected by snow cover, cast shadows, turbid water, and variable illumination conditions [73,74,75]. Our analysis relied primarily on optical imagery, which is inherently constrained by cloud cover and seasonal weather conditions [71]. Nevertheless, the daily temporal resolution of PlanetScope imagery provided a sufficiently dense record to capture lake evolution and seasonal snow dynamics with minimal temporal gaps.
While pre- and post-event imagery allowed us to rule out external mass movement as a likely trigger of the 2025 GLOF, optical data alone are insufficient to fully diagnose failure mechanisms such as internal piping, ice-core degradation, or progressive dam weakening. The absence of in situ observations limits direct validation of remote-sensing-based interpretations and prevents detailed characterization of the dam structure and channel erosion processes. In addition, our interpretation of melt-season climatology relies on MODIS-based snow products and ERA5-Land reanalysis data (~9 km spatial resolution), which introduce uncertainty due to their coarse spatial resolution relative to the small catchment (~0.8 km2). These datasets represent spatially averaged conditions and may not fully capture strong elevational gradients, microclimatic variability, or localized processes within the catchment. Previous studies have shown that ERA5 temperatures can overestimate observed values during pre-monsoon and monsoon periods in complex mountain terrain, reflecting limitations in representing fine-scale temperature fluctuations [76,77,78].
To account for these limitations, ERA5-Land and MODIS data were used primarily to characterize regional-scale trends and relative anomalies, rather than absolute conditions within the catchment. A long-term baseline (2000–2024) was established using the same datasets, and conditions during the 2025 melt season were interpreted relative to this baseline. This approach reduces sensitivity to systematic biases associated with coarse-resolution data and allows identification of persistent anomalous signals, such as sustained warming and early snow depletion.
Future work could address these limitations through the integration of complementary datasets and methods. Synthetic Aperture Radar (SAR) imagery offers an all-weather alternative to optical observations and could enable more consistent monitoring of lake extent and surrounding slope conditions, particularly during periods of persistent cloud cover [79,80]. Multi-temporal DEMs derived from stereo optical imagery or radar interferometry would allow estimation of volumetric changes in the lake basin and adjacent terrain, improving understanding of pre-failure lake dynamics and geomorphic precursors. Targeted field investigations, where feasible, would further strengthen interpretations by providing direct information on lake bathymetry, dam composition, subsurface conditions, and potential GLOF triggers.
Further, reconstruction of the 2025 GLOF, including post-breach flood routing, sediment transport analysis, and channel evolution mapping, would enhance understanding of downstream impacts and process dynamics. In particular, incorporating numerical simulations of GLOF initiation and downstream propagation would provide valuable insights into flow dynamics, peak discharge, travel time, and inundation extent. Combining optical time series, SAR observations, DEM analysis, and hydrodynamic modeling thus represents a promising pathway for improving the physical interpretation of GLOF processes and advancing remote-sensing-based early-warning frameworks in high-mountain regions.
5. Conclusions
This study documented the seasonal evolution and abrupt drainage of a moraine-dammed glacial lake in the Talidas catchment using a multi-sensor remote sensing framework. High-resolution PlanetScope imagery captured the full life cycle of the lake during the 2025 melt season, revealing initial lake formation in mid-June, sustained expansion through July and early August, and near-complete drainage on 22 August 2025. The lake reached a maximum area of 0.052 km2 prior to the outburst, expanding by more than a factor of four over two months. Multi-decadal analysis using Landsat (1992–2018) and PlanetScope (2017–2024) imagery shows that lake formation in this catchment has historically been intermittent and short-lived, with no clear evidence of abrupt drainage events prior to 2025, highlighting the anomalous nature of the 2025 GLOF.
Integrated analysis of lake dynamics, seasonal snow cover, and temperature indicates that the 2025 event was most consistent with compound climatic and cryospheric forcing rather than a discrete external trigger. Summer 2025 was characterized by persistently warmer conditions relative to the 2000–2024 baseline, rapid seasonal snowmelt within the catchment, and early and prolonged snow-free conditions. These factors likely enhanced meltwater inflow and increased hydrostatic pressure on the moraine dam, leading to overtopping or erosion-dominated failure mechanism.
This study demonstrates the critical value of high-temporal-resolution satellite observations for reconstructing hazardous glacial lake evolution in remote, data-scarce mountain regions. The integration of optical imagery (PlanetScope and Landsat), MODIS-based snow cover data, ERA5-Land temperature reanalysis, and permafrost probability datasets provided a comprehensive, multi-dimensional framework for diagnosing potential GLOF controls. The results also have direct implications for remote-sensing-based GLOF monitoring and early-warning efforts. The Talidas case shows that indicators such as extreme temperatures, rapid and persistent snow depletion, lake expansion, and geomorphic observation of lake surroundings may collectively signal elevated outburst risk.
Supplementary Materials
The following supporting information can be downloaded at: https://www.mdpi.com/article/10.3390/rs18091329/s1, Figure S1: Google Earth image showing the lake basin, composed of morphologically heterogeneous and rough surface material, predominantly coarse and poorly sorted sediment composition, likely consisting of a mixture of boulders, cobbles, and finer material; Figure S2: False color composite of PlanetScope image from 4 August 2025, showing multiple lakes upstream of the Talidas settlement. The lake at the highest elevation drained out on 22 August 2025, while the lakes below overflowed due to the flood wave but remained structurally intact and did not undergo catastrophic drainage; Table S1: Summary of remote sensing and reanalysis datasets used in this study, including sensor/source, temporal coverage, spatial resolution, and specific applications in the study; Table S2: Performance metrics for independent temporal validation of the Random Forest snow classification using manually digitized validation polygons from 20 June 2025, 2 July 2025, and 21 July 2025; Table S3. Lake area and volume change during summer 2025. Lake volume is estimated using the empirical equation suggested by Cook and Quincey 2015 [55]; Figure S3: Number of snow-free days in the lake catchment during the June-September period for 2000–2025 derived from MODIS observations. The horizontal blue line indicates the mean number of snow-free days for the 2000–2024 baseline. The chart shows that 2025 experienced the highest number of snow-free days in the 26-year record, reflecting exceptionally early and sustained seasonal snow depletion; Figure S4: Seasonal evolution of fSCA within the lake catchment for the 2022–2025 melt seasons. All years show rapid snow depletion during early summer followed by low and stable values in July–August. The 2025 season exhibits consistently lower fSCA and earlier transition to near-snow-free conditions compared to the preceding years; Figure S5: False color composite of PlanetScope image from 20 August 2025, showing fresh snow on the higher elevation slope upstream of the lake, which disappeared in addition to the drainage of the lake by the 22 August 2025, image; Figure S6: Daily areal-mean precipitation over the lake catchment during August 2025 derived from GPM IMERG V07 dataset and daily temperature derived from ERA5-Land dataset. The precipitation pulses preceding the outburst suggest additional short-term hydrometeorological inflow and moist soil.
Author Contributions
Conceptualization, I.K.; methodology, I.K. and J.M.J. (Jeremy M. Johnston); software, I.K.; validation, I.K.; formal analysis, I.K.; investigation, I.K.; resources, J.M.J. (Jennifer M. Jacobs); data curation, I.K.; writing—original draft preparation, I.K.; writing—review and editing, I.K., J.M.J. (Jeremy M. Johnston) and J.M.J. (Jennifer M. Jacobs); visualization, I.K.; supervision, J.M.J. (Jennifer M. Jacobs); project administration, J.M.J. (Jennifer M. Jacobs); funding acquisition, I.K. All authors have read and agreed to the published version of the manuscript.
Funding
This research was funded by a Fulbright Program grant sponsored by the Bureau of Educational and Cultural Affairs of the United States Department of State and administered by the Institute of International Education.
Data Availability Statement
The original contributions presented in this study are included in the article/Supplementary Material. Further inquiries can be directed to the corresponding author.
Conflicts of Interest
The authors declare no conflicts of interest. The funders had no role in the design of the study; in the collection, analyses, or interpretation of data; in the writing of the manuscript; or in the decision to publish the results.
Abbreviations
The following abbreviations are used in this manuscript:
| ETM+ | Enhanced Thematic Mapper Plus |
| fSCA | Fractional Snow-covered Area |
| GIS | Geographic Information System |
| GLOF | Glacial Lake Outburst Flood |
| GPM | Global Precipitation Measurement |
| IMERG | Integrated Multi-satellitE Retrievals |
| MODIS | Moderate Resolution Imaging Spectroradiometer |
| NIR | Near Infrared |
| OLI | Operational Land Imager |
| RF | Random Forest |
| SAR | Synthetic Aperture Radar |
| SCA | Snow-covered Area |
| SD | Standard Deviation |
| SRTM | Shuttle Radar Topography Mission |
| TM | Thematic Mapper |
| USGS | United States Geological Survey |
References
- Clague, J.J.; Huggel, C.; Korup, O.; McGuire, B. Climate Change and Hazardous Processes in High Mountains. Rev. De La Asoc. Geol. Argent. 2012, 69, 328–338. [Google Scholar] [CrossRef] [Scilit]
- Zhang, T.; Wang, W.; An, B. Heterogeneous Changes in Global Glacial Lakes under Coupled Climate Warming and Glacier Thinning. Commun. Earth Environ. 2024, 5, 374. [Google Scholar] [CrossRef] [Scilit]
- Song, C.; Fan, C.; Ma, J.; Zhan, P.; Deng, X. A Spatially Constrained Remote Sensing-Based Inventory of Glacial Lakes Worldwide. Sci. Data 2025, 12, 464. [Google Scholar] [CrossRef] [Scilit]
- Shugar, D.H.; Burr, A.; Haritashya, U.K.; Kargel, J.S.; Watson, C.S.; Kennedy, M.C.; Bevington, A.R.; Betts, R.A.; Harrison, S.; Strattman, K. Rapid Worldwide Growth of Glacial Lakes since 1990. Nat. Clim. Change 2020, 10, 939–945. [Google Scholar] [CrossRef] [Scilit]
- Zhang, T.; Wang, W.; An, B.; Wei, L. Enhanced Glacial Lake Activity Threatens Numerous Communities and Infrastructure in the Third Pole. Nat. Commun. 2023, 14, 8250. [Google Scholar] [CrossRef] [Scilit] [PubMed]
- Ke, L.; Ding, X.; Ning, Y.; Liao, Y.; Song, C. Annual Trajectory of Global Glacial Lake Variations and the Interactions with Glacier Mass Balance during 2013–2022. CATENA 2024, 245, 108280. [Google Scholar] [CrossRef] [Scilit]
- Richardson, S.D.; Reynolds, J.M. An Overview of Glacial Hazards in the Himalayas. Quat. Int. 2000, 65–66, 31–47. [Google Scholar] [CrossRef] [Scilit]
- Taylor, C.; Robinson, T.R.; Dunning, S.; Rachel Carr, J.; Westoby, M. Glacial Lake Outburst Floods Threaten Millions Globally. Nat. Commun. 2023, 14, 487. [Google Scholar] [CrossRef] [Scilit] [PubMed]
- Emmer, A.; Allen, S.K.; Carey, M.; Frey, H.; Huggel, C.; Korup, O.; Mergili, M.; Sattar, A.; Veh, G.; Chen, T.Y.; et al. Progress and Challenges in Glacial Lake Outburst Flood Research (2017–2021): A Research Community Perspective. Nat. Hazards Earth Syst. Sci. 2022, 22, 3041–3061. [Google Scholar] [CrossRef] [Scilit]
- Yang, L.; Lu, Z.; Ouyang, C.; Zhao, C.; Hu, X.; Zhang, Q. Glacial Lake Outburst Flood Monitoring and Modeling through Integrating Multiple Remote Sensing Methods and HEC-RAS. Remote Sens. 2023, 15, 5327. [Google Scholar] [CrossRef] [Scilit]
- Emmer, A.; Cochachin, A. The Causes and Mechanisms of Moraine-Dammed Lake Failures in the Cordillera Blanca, North American Cordillera, and Himalayas. AUC Geogr. 2013, 48, 5–15. [Google Scholar] [CrossRef] [Scilit]
- Allen, S.K.; Rastner, P.; Arora, M.; Huggel, C.; Stoffel, M. Lake Outburst and Debris Flow Disaster at Kedarnath, June 2013: Hydrometeorological Triggering and Topographic Predisposition. Landslides 2015, 13, 1479–1491. [Google Scholar] [CrossRef] [Scilit]
- Huggel, C.; Carey, M.; Emmer, A.; Frey, H.; Walker-Crawford, N.; Wallimann-Helmer, I. Anthropogenic Climate Change and Glacier Lake Outburst Flood Risk: Local and Global Drivers and Responsibilities for the Case of Lake Palcacocha, Peru. Nat. Hazards Earth Syst. Sci. 2020, 20, 2175–2193. [Google Scholar] [CrossRef] [Scilit]
- Yang, L.; Lu, Z.; Zhao, C.; Kim, J.; Yang, C.; Wang, B.; Liu, X.; Wang, Z. Analyzing the Triggering Factors of Glacial Lake Outburst Floods with SAR and Optical Images: A Case Study in Jinweng Co, Tibet, China. Landslides 2022, 19, 855–864. [Google Scholar] [CrossRef] [Scilit]
- Yang, L.; Lu, Z.; Zhao, C.; Zhang, Q.; Hu, X.; Wang, B. Triggering Factors and Flooding Processes of Glacial Lake Outburst Flood at Ranzerio Lake. Npj Nat. Hazards 2025, 2, 90. [Google Scholar] [CrossRef] [Scilit]
- Thompson, S.S.; Kulessa, B.; Benn, D.I.; Mertes, J.R. Anatomy of Terminal Moraine Segments and Implied Lake Stability on Ngozumpa Glacier, Nepal, from Electrical Resistivity Tomography (ERT). Sci. Rep. 2017, 7, 46766. [Google Scholar] [CrossRef] [Scilit]
- Sattar, A.; Goswami, A.; Kulkarni, A.V.; Emmer, A.; Haritashya, U.K.; Allen, S.; Frey, H.; Huggel, C. Future Glacial Lake Outburst Flood (GLOF) Hazard of the South Lhonak Lake, Sikkim Himalaya. Geomorphology 2021, 388, 107783. [Google Scholar] [CrossRef] [Scilit]
- Mou, Y.; Chen, H.; Wang, T.; Ruan, H.; Li, X.; Yu, Y.; Zhou, Y.; Meng, H. The Breaching Mechanism of Moraine Dams with Buried Ice: A Review. Cold Reg. Sci. Technol. 2024, 228, 104315. [Google Scholar] [CrossRef] [Scilit]
- Yao, T.; Thompson, L.; Yang, W.; Yu, W.; Gao, Y.; Guo, X.; Yang, X.; Duan, K.; Zhao, H.; Xu, B.; et al. Different Glacier Status with Atmospheric Circulations in Tibetan Plateau and Surroundings. Nat. Clim. Change 2012, 2, 663–667. [Google Scholar] [CrossRef] [Scilit]
- Nie, Y.; Sheng, Y.; Liu, Q.; Liu, L.; Liu, S.; Zhang, Y.; Song, C. A Regional-Scale Assessment of Himalayan Glacial Lake Changes Using Satellite Observations from 1990 to 2015. Remote Sens. Environ. 2017, 189, 1–13. [Google Scholar] [CrossRef] [Scilit]
- Harrison, S.; Kargel, J.S.; Huggel, C.; Reynolds, J.; Shugar, D.H.; Betts, R.A.; Emmer, A.; Glasser, N.; Haritashya, U.K.; Klimeš, J.; et al. Climate Change and the Global Pattern of Moraine-Dammed Glacial Lake Outburst Floods. Cryosphere 2018, 12, 1195–1209. [Google Scholar] [CrossRef] [Scilit]
- Chen, N.; Liu, M.; Allen, S.; Deng, M.; Khanal, N.R.; Peng, T.; Tian, S.; Huggel, C.; Wu, K.; Rahman, M.; et al. Small Outbursts into Big Disasters: Earthquakes Exacerbate Climate-Driven Cascade Processes of the Glacial Lakes Failure in the Himalayas. Geomorphology 2023, 422, 108539. [Google Scholar] [CrossRef] [Scilit]
- Rinzin, S.; Zhang, G.; Sattar, A.; Wangchuk, S.; Allen, S.K.; Dunning, S.; Peng, M. GLOF Hazard, Exposure, Vulnerability, and Risk Assessment of Potentially Dangerous Glacial Lakes in the Bhutan Himalaya. J. Hydrol. 2023, 619, 129311. [Google Scholar] [CrossRef] [Scilit]
- Emmer, A.; Vilca, O.; Salazar Checa, C.; Li, S.; Cook, S.; Pummer, E.; Hrebrina, J.; Haeberli, W. Causes, Consequences and Implications of the 2023 Landslide-Induced Lake Rasac Glacial Lake Outburst Flood (GLOF), Cordillera Huayhuash, Peru. Nat. Hazards Earth Syst. Sci. 2025, 25, 1207–1228. [Google Scholar] [CrossRef] [Scilit]
- Zhang, T.; Wang, W.; Kougkoulos, I.; Cook, S.J.; Li, S.; Iribarren-Anacona, P.; Watson, C.S.; An, B.; Yao, T. High Frequency of Moraine-Dammed Lake Outburst Floods Driven by Global Warming. Nat. Commun. 2025, 16, 11173. [Google Scholar] [CrossRef] [Scilit]
- Sattar, A.; Haritashya, U.K.; Kargel, J.S.; Karki, A. Transition of a Small Himalayan Glacier Lake Outburst Flood to a Giant Transborder Flood and Debris Flow. Sci. Rep. 2022, 12, 12421. [Google Scholar] [CrossRef] [Scilit]
- Neupane, R.; Chen, H.; Cao, C. Review of Moraine Dam Failure Mechanism. Geomat. Nat. Hazards Risk 2019, 10, 1948–1966. [Google Scholar] [CrossRef] [Scilit]
- Veh, G.; Lützow, N.; Tamm, J.; Luna, L.V.; Hugonnet, R.; Vogel, K.; Geertsema, M.; Clague, J.J.; Korup, O. Less Extreme and Earlier Outbursts of Ice-Dammed Lakes since 1900. Nature 2023, 614, 701–707. [Google Scholar] [CrossRef] [Scilit] [PubMed]
- Ahmed, R. Decoding the Fate of Himalayan Glaciers under Climate Change: Impacts, Challenges, Research Gaps, and Policy Pathways. Evol. Earth 2025, 3, 100082. [Google Scholar] [CrossRef] [Scilit]
- Westoby, M.J.; Glasser, N.F.; Brasington, J.; Hambrey, M.J.; Quincey, D.J.; Reynolds, J.M. Modelling Outburst Floods from Moraine-Dammed Glacial Lakes. Earth-Sci. Rev. 2014, 134, 137–159. [Google Scholar] [CrossRef] [Scilit]
- Carrivick, J.L.; Tweed, F.S. A Global Assessment of the Societal Impacts of Glacier Outburst Floods. Glob. Planet. Change 2016, 144, 1–16. [Google Scholar] [CrossRef] [Scilit]
- Peng, M.; Wang, X.; Zhang, G.; Veh, G.; Sattar, A.; Chen, W.; Allen, S. Cascading Hazards from Two Recent Glacial Lake Outburst Floods in the Nyainqêntanglha Range, Tibetan Plateau. J. Hydrol. 2023, 626, 130155. [Google Scholar] [CrossRef] [Scilit]
- Zhang, G.; Carrivick, J.L.; Emmer, A.; Shugar, D.H.; Veh, G.; Wang, X.; Labedz, C.; Mergili, M.; Mölg, N.; Huss, M.; et al. Characteristics and Changes of Glacial Lakes and Outburst Floods. Nat. Rev. Earth Environ. 2024, 5, 447–462. [Google Scholar] [CrossRef] [Scilit]
- Nurakynov, S.; Sydyk, N.; Baygurin, Z.; Balakay, L. Advancements in Remote Sensing for Monitoring and Risk Assessment of Glacial Lake Outburst Floods. Geosciences 2025, 15, 211. [Google Scholar] [CrossRef] [Scilit]
- Ahmed, R. Glacial Lake Outburst Flood (GLOF) Hazard and Risk Management Strategies: A Global Overview. Water Resour. Manag. 2025, 39, 1–16. [Google Scholar] [CrossRef] [Scilit]
- Tom, M.; Odermatt, D.; David, C.H.; Cerbelaud, A.; Wade, J.; Frey, H. Monitoring Earth’s Glacial Lakes from Space with Machine Learning. Sci. Remote Sens. 2025, 12, 100277. [Google Scholar] [CrossRef] [Scilit]
- DAWN. 200 People Rescued after Glacial Burst in Gilgit-Baltistan’s Ghizer: Rescue 1122. Pakistan August 22, 2025. Available online: https://www.dawn.com/news/1933779 (accessed on 20 February 2026).
- RGI Consortium. Randolph Glacier Inventory—A Dataset of Global Glacier Outlines, Version 7; NSIDC: Boulder CO, USA, 2023. [Google Scholar] [CrossRef]
- Hussain, N.; Ali, S.; Hussain, A.; Ali, S.; Khan, S.; Raza, G.; Abbas, Q.; Hussain, I.; Hussain, M. Climate Change Variability Trends andImplications for Freshwater Resourcesin Pakistan’s Eastern HinduKush Region. Pol. J. Environ. Stud. 2018, 27, 665–673. [Google Scholar] [CrossRef] [Scilit] [PubMed]
- Adnan, M.; Nabi, G.; Kang, S.; Zhang, G.; Adnan, R.M.; Anjum, M.N.; Iqbal, M.; Ali, A.F. Snowmelt Runoff Modelling under ProjectedClimate Change Patterns in the Gilgit River Basinof Northern Pakistan. Pol. J. Environ. Stud. 2017, 26, 525–542. [Google Scholar] [CrossRef] [Scilit]
- Hewitt, K. Glacier Change, Concentration, and Elevation Effects in the Karakoram Himalaya, Upper Indus Basin. Mt. Res. Dev. 2011, 31, 188–200. [Google Scholar] [CrossRef] [Scilit]
- Hasson, S.; Lucarini, V.; Khan, M.R.; Petitta, M.; Bolch, T.; Gioli, G. Early 21st Century Snow Cover State over the Western River Basins of the Indus River System. Hydrol. Earth Syst. Sci. 2014, 18, 4077–4100. [Google Scholar] [CrossRef] [Scilit]
- Adnan, M.; Liu, S.; Saifullah, M.; Iqbal, M.; Saddique, Q.; Ul Hussan, W.; Latif, Y. Estimation of Changes in Runoff and Its Sources in Response to Future Climate Change in a Critical Zone of the Karakoram Mountainous Region, Pakistan in the near and Far Future. Geomat. Nat. Hazards Risk 2024, 15, 2291330. [Google Scholar] [CrossRef] [Scilit]
- John, A.; Cannistra, A.F.; Yang, K.; Tan, A.; Shean, D.; Hille Ris Lambers, J.; Cristea, N. High-Resolution Snow-Covered Area Mapping in Forested Mountain Ecosystems Using PlanetScope Imagery. Remote Sens. 2022, 14, 3409. [Google Scholar] [CrossRef] [Scilit]
- Wang, Z.; Jaya Baskar, J.V.; Sistla Naga Sai, M.S.; Svoma, B.; Vivoni, E.R. Spatiotemporal Patterns of Intermittent Snow Cover From PlanetScope Imagery Using Deep Learning. Geophys. Res. Lett. 2025, 52, e2025GL116582. [Google Scholar] [CrossRef] [Scilit]
- Frazier, A.E.; Hemingway, B.L. A Technical Review of Planet Smallsat Data: Practical Considerations for Processing and Using PlanetScope Imagery. Remote Sens. 2021, 13, 3930. [Google Scholar] [CrossRef] [Scilit]
- Shields, S.G.; Coops, N.C.; Achim, A.; Hamelin, R.C.; Mulverhill, C. A Review of PlanetScope CubeSats for Forest Monitoring. Science of Remote Sensing 2025, 12, 100314. [Google Scholar] [CrossRef] [Scilit]
- Yang, K.; John, A.; Shean, D.; Lundquist, J.D.; Sun, Z.; Yao, F.; Todoran, S.; Cristea, N. High-Resolution Mapping of Snow Cover in Montane Meadows and Forests Using Planet Imagery and Machine Learning. Front. Water 2023, 5, 1128758. [Google Scholar] [CrossRef] [Scilit]
- Johnston, J.; Jacobs, J.; Cho, E. MODIS/Terra Global Annual 0.01Deg CMG Snow Cover Climatology; Version 1; NASA: Washington, DC, USA, 2024. [Google Scholar] [CrossRef]
- Farr, T.G.; Rosen, P.A.; Caro, E.; Crippen, R.; Duren, R.; Hensley, S.; Kobrick, M.; Paller, M.; Rodriguez, E.; Roth, L.; et al. The Shuttle Radar Topography Mission. Rev. Geophys. 2007, 45, 2005RG000183. [Google Scholar] [CrossRef] [Scilit]
- Hersbach, H.; Bell, B.; Berrisford, P.; Hirahara, S.; Horányi, A.; Muñoz-Sabater, J.; Nicolas, J.; Peubey, C.; Radu, R.; Schepers, D.; et al. The ERA5 Global Reanalysis. Q. J. R. Meteorol. Soc. 2020, 146, 1999–2049. [Google Scholar] [CrossRef] [Scilit]
- Huffman, G.; Bolvin, D.; Braithwaite, D.; Hsu, K.; Joyce, R.; Xie, P. Integrated Multi-satellitE Retrievals for GPM (IMERG); NASA: Washington, DC, USA, 2014. [Google Scholar]
- Kim, K.Y.; Lakshmi, V.; Rajaram, H.; Kansara, P.; Haagenson, R. High Mountain Asia 1 Km MODIS-AIRS Gap-Filled Ground Temperatures and Permafrost Probability Maps, 2003–2016; Version 1; NSIDC: Boulder, CO, USA, 2024. [Google Scholar] [CrossRef]
- Hanshaw, M.N.; Bookhagen, B. Glacial Areas, Lake Areas, and Snow Lines from 1975 to 2012: Status of the Cordillera Vilcanota, Including the Quelccaya Ice Cap, Northern Central Andes, Peru. Cryosphere 2014, 8, 359–376. [Google Scholar] [CrossRef] [Scilit]
- Cook, S.J.; Quincey, D.J. Estimating the Volume of Alpine Glacial Lakes. Earth Surf. Dynam. 2015, 3, 559–575. [Google Scholar] [CrossRef] [Scilit]
- Hu, J.M.; Shean, D. Improving Mountain Snow and Land Cover Mapping Using Very-High-Resolution (VHR) Optical Satellite Images and Random Forest Machine Learning Models. Remote Sens. 2022, 14, 4227. [Google Scholar] [CrossRef] [Scilit]
- Johnston, J.M.; Jacobs, J.M.; Hunsaker, A.; Wagner, C.; Vardaman, M. Applications of Snow-Covered Areas from Unoccupied Aerial Systems (UAS) Visible Imagery: A Demonstration in Southeastern New Hampshire. Remote Sens. 2025, 17, 1885. [Google Scholar] [CrossRef] [Scilit]
- Moradi, M.; Fleming, A.G.; Hunsaker, A.; Jacobs, J.M. Identifying Snow-Covered Areas from Unoccupied Aerial Systems (UAS) Visible Imagery: A Comparison of Methods. EGUsphere 2025, 1–45. [Google Scholar] [CrossRef] [Scilit]
- Furian, W.; Loibl, D.; Schneider, C. Future Glacial Lakes in High Mountain Asia: An Inventory and Assessment of Hazard Potential from Surrounding Slopes. J. Glaciol. 2021, 67, 653–670. [Google Scholar] [CrossRef] [Scilit]
- Cook, K.L.; Andermann, C.; Gimbert, F.; Adhikari, B.R.; Hovius, N. Glacial Lake Outburst Floods as Drivers of Fluvial Erosion in the Himalaya. Science 2018, 362, 53–57. [Google Scholar] [CrossRef] [Scilit] [PubMed]
- Shrestha, F.; Steiner, J.F.; Shrestha, R.; Dhungel, Y.; Joshi, S.P.; Inglis, S.; Ashraf, A.; Wali, S.; Walizada, K.M.; Zhang, T. A Comprehensive and Version-Controlled Database of Glacial Lake Outburst Floods in High Mountain Asia. Earth Syst. Sci. Data 2023, 15, 3941–3961. [Google Scholar] [CrossRef] [Scilit]
- Mool, P.K.; Joshi, S.P.; Bajracharya, S.R. Inventory of Glaciers, Glacial Lakes and Glacial Lake Outburst Floods Monitoring and Early Warning Systems in the Hindu Kush—Himalayan Region, Nepal; International Centre for Integrated Mountain Development: Kathmandu, Nepal, 2001. [Google Scholar]
- Allen, S.; Frey, H.; Huggel, C. Assessment of Glacier and Permafrost Hazards in Mountain Regions. Technical Guidance Document; Standing Group on Glacier and Permafrost Hazards in Mountains (GAPHAZ); Unpublished; Swiss Agency for Development and Cooperation SDC: Zurich, Switzerland, 2017; p. 72. Available online: https://www.researchgate.net/doi/10.13140/RG.2.2.26332.90245 (accessed on 12 February 2026).
- Wang, B.; Gu, Y.; Zhou, K.; Li, S.; Zheng, C.; Lu, Y. Impact of Freeze–Thaw Action on Soil Erodibility in the Permafrost Regions of the Sanjiangyuan Area Affected by Thermokarst Landslides. Water 2025, 17, 818. [Google Scholar] [CrossRef] [Scilit]
- Misra, A.K.; Ahmed, Z.; Dutta, K.; Raj Khatri, N.; Baruah, B.; Rajak, R.; Ranjan, R.K.; Wanjari, N. Glacial Lake Outburst Hazard Assessment Linked to Moraine Dam and Permafrost Stability in Sikkim Himalaya. Kuwait J. Sci. 2026, 53, 100588. [Google Scholar] [CrossRef] [Scilit]
- Oriana, L.-P.; Timo, S.; Nicola, D.; Tom, B.I. Towards a Better Understanding of River Network Dynamics in a Glacierized Catchment. J. Hydrol. 2026, 668, 135029. [Google Scholar] [CrossRef] [Scilit]
- Diak, M.; Böttcher, M.E.; Ehlert Von Ahn, C.M.; Hong, W.-L.; Kędra, M.; Kotwicki, L.; Koziorowska-Makuch, K.; Kuliński, K.; Lepland, A.; Makuch, P.; et al. Permafrost and Groundwater Interaction: Current State and Future Perspective. Front. Earth Sci. 2023, 11, 1254309. [Google Scholar] [CrossRef] [Scilit]
- Vilímek, V.; Kropáček, J.; Chowdhury, A.; Baťka, J.; De, S.K. Analysis of Triggering Factors behind the October 2023 South Lhonak GLOF Event in the Sikkim Himalaya Using Multiple Remote Sensing Data. Geomat. Nat. Hazards Risk 2026, 17, 2625407. [Google Scholar] [CrossRef] [Scilit]
- Sattar, A.; Cook, K.L.; Rai, S.K.; Berthier, E.; Allen, S.; Rinzin, S.; De Vries, M.V.W.; Haeberli, W.; Kushwaha, P.; Shugar, D.H.; et al. The Sikkim Flood of October 2023: Drivers, Causes, and Impacts of a Multihazard Cascade. Science 2025, 387, eads2659. [Google Scholar] [CrossRef] [Scilit]
- Kirschbaum, D.; Watson, C.S.; Rounce, D.R.; Shugar, D.H.; Kargel, J.S.; Haritashya, U.K.; Amatya, P.; Shean, D.; Anderson, E.R.; Jo, M. The State of Remote Sensing Capabilities of Cascading Hazards Over High Mountain Asia. Front. Earth Sci. 2019, 7, 197. [Google Scholar] [CrossRef] [Scilit]
- Khan, I.; Vardaman, M.; Johnston, J.; Jacobs, J.M. Glacial Lake Mapping: Progress, Challenges, and Future Directions. Arct. Antarct. Alp. Res. 2025, 57, 2592365. [Google Scholar] [CrossRef] [Scilit]
- Khanal, N.R.; Mool, P.K.; Shrestha, A.B.; Rasul, G.; Ghimire, P.K.; Shrestha, R.B.; Joshi, S.P. A Comprehensive Approach and Methods for Glacial Lake Outburst Flood Risk Assessment, with Examples from Nepal and the Transboundary Area. Int. J. Water Resour. Dev. 2015, 31, 219–237. [Google Scholar] [CrossRef] [Scilit]
- Li, J.; Warner, T.A.; Wang, Y.; Bai, J.; Bao, A. Mapping Glacial Lakes Partially Obscured by Mountain Shadows for Time Series and Regional Mapping Applications. Int. J. Remote Sens. 2019, 40, 615–641. [Google Scholar] [CrossRef] [Scilit]
- Wangchuk, S.; Bolch, T. Mapping of Glacial Lakes Using Sentinel-1 and Sentinel-2 Data and a Random Forest Classifier: Strengths and Challenges. Sci. Remote Sens. 2020, 2. [Google Scholar] [CrossRef] [Scilit]
- Bazilova, V.; Kääb, A. Mapping Area Changes of Glacial Lakes Using Stacks of Optical Satellite Images. Remote Sens. 2022, 14, 5973. [Google Scholar] [CrossRef] [Scilit]
- Xu, W.; Lei, X.; Chen, S.; Yu, T.; Hu, Z.; Zhang, M.; Jiang, L.; Bao, R.; Guan, X.; Ma, M.; et al. How Well Does the ERA5 Reanalysis Capture the Extreme Climate Events Over China? Part II: Extreme Temperature. Front. Environ. Sci. 2022, 10, 921659. [Google Scholar] [CrossRef] [Scilit]
- Lopes, F.M.; Dutra, E.; Boussetta, S. Evaluation of Daily Temperature Extremes in the ECMWF Operational Weather Forecasts and ERA5 Reanalysis. Atmosphere 2024, 15, 93. [Google Scholar] [CrossRef] [Scilit]
- Satyapragyan, S.; Yadav, J.S.; Bhambri, R. Bias Corrections of ERA5 and ERA5-Land Temperature Using Automatic Weather Station Data in the Higher Central Himalaya: Implications for Hydro-Meteorological and Glaciological Research. J. Hydrol. Reg. Stud. 2026, 63, 103079. [Google Scholar] [CrossRef] [Scilit]
- Zhang, L.; Xu, Y.; Meng, C.; Li, X.; Liu, H.; Wang, C. Comparison of Statistical and Dynamic Downscaling Techniques in Generating High-Resolution Temperatures in China from CMIP5 GCMs. J. Appl. Meteorol. Climatol. 2020, 59, 207–235. [Google Scholar] [CrossRef] [Scilit]
- Khan, I.; Jacobs, J.M.; Johnston, J.M.; Vardaman, M. Mapping Glacial Lakes in the Upper Indus Basin (UIB) Using Synthetic Aperture Radar (SAR) Data. Glacies 2025, 2, 13. [Google Scholar] [CrossRef] [Scilit]
Disclaimer/Publisher’s Note: The statements, opinions and data contained in all publications are solely those of the individual author(s) and contributor(s) and not of MDPI and/or the editor(s). MDPI and/or the editor(s) disclaim responsibility for any injury to people or property resulting from any ideas, methods, instructions or products referred to in the content. |
© 2026 by the authors. Licensee MDPI, Basel, Switzerland. This article is an open access article distributed under the terms and conditions of the Creative Commons Attribution (CC BY) license.