


Highlights
What are the main findings?
- The integration of point cloud voxelization with vegetation indices enabled robust estimation of oilseed rape aboveground biomass (AGB), with correlation coefficients exceeding 0.80 between estimated and measured AGB across the entire growth period for all voxel treatments.
- Among 20 vegetation indices tested, the blue green ratio index (BGI) combined with a cubic regression model under a 45° camera angle and 0.1–m voxel size was identified as the most suitable combination, offering a good balance between estimation performance and analysis time.
What are the implications of the main findings?
- The proposed CVMVI framework offers a non-destructive, efficient, and low-cost method for field-scale crop biomass estimation, facilitating real-time growth monitoring and precision agriculture.
- The use of larger voxel sizes (e.g., 0.1 m) substantially reduces data processing time without compromising estimation performance, enhancing the practical applicability of UAV-based remote sensing in agricultural production.
Abstract
To support low-cost, non-destructive crop growth monitoring, this study systematically compared different vegetation indices, voxel sizes, and camera angles using a point cloud voxelization approach combined with a vegetation index weighted canopy volume index (CVMVI) to assess aboveground biomass (AGB) in winter oilseed rape (Brassica napus L.). Field experiments were conducted from 2021 to 2024 at the Yangma Experimental Base of the Chengdu Academy of Agricultural and Forestry Sciences. Red, green, blue (RGB) imagery of oilseed rape was acquired using an unmanned aerial vehicle (UAV) during the following five key growth stages: seedling, bolting, flowering, podding, and maturity. Collected images were processed to generate point clouds, which were subsequently voxelized at four resolutions (0.03, 0.05, 0.07, and 0.1 m). CVMVI was constructed by integrating vegetation indices (VIs) derived from the RGB data and the voxelized canopy structural information. Regression models were established between the CVMVI values and field-measured AGB to estimate biomass. Model performance was evaluated using the coefficient of determination (R2), root mean square error (RMSE), and relative error (RE). There were strong correlations (r > 0.80) between the estimated and measured AGB across all voxelization treatments throughout the growth period. Among the 20 VIs tested, regression methods based on the blue green ratio index (BGI), color intensity index, blue red ratio index, vegetative index, and green red ratio index consistently showed superior estimation performance across three consecutive years, demonstrating their good applicability for estimating AGB in oilseed rape under varying agronomic conditions (different varieties, densities, and sowing dates). The cubic regression model CVMBGI performed best under a 45° UAV camera angle, with the highest R2 and lowest RMSE and RE (2021–2022: R2 = 0.864, RMSE = 2414.18 kg/ha, RE = 14.8%; 2022–2023: R2 = 0.754, RMSE = 2550.53 kg/ha, RE = 14.9%; 2023–2024: R2 = 0.863, RMSE = 1953.61 kg/ha, RE = 22.9%). Since the estimation performance showed negligible differences among voxel sizes, and the 0.1–m voxel offered the smallest data volume and shortest analysis time, the CVMBGI model with a 0.1–m voxel was selected as the preferred approach, providing a practical balance between estimation performance and processing demand. These findings highlight the application potential of point cloud voxelization technology for crop biomass estimation. This study proposes a novel, non-destructive, and efficient framework for estimating field crop AGB using low-cost UAV RGB imagery, facilitating the wider adoption of UAV technology in practical agricultural production.
1. Introduction
Oilseed rape (Brassica napus L.) is the largest oil crop in China. In 2024, the sown area of oilseed rape in China reached 7.99 × 10⁶ ha, with oil production reaching 1.69 × 10⁷ tons, accounting for 55.93 and 42.40% of the total sown area and yield of oil crops in China, respectively [1]. As a crucial source of edible oil and feed protein, oilseed rape is China’s most significant and promising oil crop, serving as a key strategic resource promoting the domestic supply of raw edible oil materials [2].
Crop aboveground biomass (AGB), defined as the total amount of aboveground organic matter per unit area, is a product of photosynthesis and closely correlated with the final yield [3]. Therefore, the efficient and accurate estimation of crop AGB is important for crop growth monitoring and yield prediction. Traditional methods for measuring crop AGB rely on destructive approaches, such as manual sampling, which are inefficient, time-consuming, and lagging, limiting real-time monitoring and precise management of crop growth to some extent [4,5].
Recently, unmanned aerial vehicles (UAVs) equipped with high-resolution digital cameras have been widely adopted to collect crop phenotypic information due to their advantages of low cost, high flexibility, and high spatial resolution [3,6]. This technology minimizes the disturbance and damage to crops, offering a pathway for rapid, non-destructive crop growth monitoring. Current UAV-based methods for AGB estimation can be broadly categorized into two approaches. The first approach combines spectral vegetation indices (VIs) with simple structural parameters, such as plant height extracted from crop surface models. For instance, Tao et al. [7] demonstrated that incorporating UAV-derived plant height into regression models with visible-light VIs significantly improved winter wheat biomass estimation compared to using VIs alone (coefficient of determination (R2) = 0.8191, root mean square error (RMSE) = 0.1106 kg/m2, normalized RMSE (NRMSE) = 21.15%). Similarly, Yue et al. [8] utilized UAV red, green, blue (RGB) and hyperspectral data, and found that combining VIs with crop height in Random Forest regression models yielded high accuracy for winter wheat AGB estimation (R2 = 0.96, RMSE = 0.57 t/ha). The second, more sophisticated approach focuses on constructing 3D canopy volume models to capture the complex spatial structure of crops. Zhang et al. [3] predicted the dry matter weight of rapeseed using a crop volume model derived from UAV-based canopy coverage and plant height, confirming the feasibility of this method (validation set: correlation coefficient (r) = 0.752, RMSE = 139.1 g/m2, relative error (RE) = 15.3%). Furthermore, Maimaitijiang et al. [9] proposed a vegetation index weighted canopy volume model (CVMVI) for soybean. This model leverages spectral information to capture differences in crop physiological status, species, and genotypes, thereby supplementing biomass estimation based solely on canopy volume. Their approach achieved excellent predictive results (R2 = 0.893, relative RMSE (RRMSE) = 16.3%). While these methods have advanced the field, many rely on dense, high-resolution point clouds, which present critical challenges in terms of enormous data volumes and slow computational speeds [10]. Most consumer-grade computer hardware is inadequate for processing such data on a whole-field scale.
Therefore, a key question for UAV-based biomass estimation is how to maintain accuracy while reducing data volume. Point cloud voxelization offers a promising solution. Voxelization simplifies the 3D space by aggregating points into volumetric units (voxels), which can significantly reduce data complexity. Studies in forestry have explored this technique. For example, Lecigne et al. [11] found that while smaller voxels capture finer architectural details, larger voxels offer advantages in handling occlusion and reducing computation time. Similarly, Deng et al. [12] demonstrated that a layer thickness of 0.1 m and a voxel size of 0.05 m effectively improved leaf area estimation for Pinus massoniana using terrestrial laser scanning data. In dryland ecosystems, Rodríguez-Lozano et al. [13] reported that a 5 cm voxel model provided optimal aboveground biomass estimation (R2 = 0.858, RMSE = 927.3 g). However, research specifically applying point cloud voxelization to crop biomass estimation remains limited. To address this gap, this study focuses on winter oilseed rape. We acquired UAV RGB imagery during key growth stages, performed point cloud voxelization at four resolutions (0.03, 0.05, 0.07, and 0.1 m), and constructed the CVMVI by integrating VIs. Regression models were then established with field-measured AGB to estimate plot-level biomass. By comparing the performance of combinations of voxel sizes and VIs, this study aimed to identify suitable vegetation indices, voxel resolutions, and camera angles for oilseed rape AGB assessment, thereby providing a practical reference for real-time growth monitoring and precision management using low-cost UAV RGB technology.
2. Materials and Methods
2.1. Experimental Site Description
The experiment was conducted from October 2021 to May 2024 at the Chongzhou Yangma Base of the Chengdu Academy of Agricultural and Forestry Sciences (Sichuan Province, China). The experimental plot was flat, with medium to high soil fertility, a uniform previous crop and land quality, good sunlight exposure on all sides, good irrigation and drainage conditions, no waterlogging issues, and convenient accessibility. The preceding crop was paddy rice. The plot area is 15 m2 (2 m × 7.5 m). The experimental design is shown in Table 1. The three-year experimental designs were designed to generate a wide range of biomass levels and canopy structures across different growth stages. The purpose was to use the diverse datasets to validate the generalizability and robustness of the proposed CVMVI model under various field conditions.
Table 1.
Field experimental design from 2021 to 2024.
2.2. Data Acquisition
2.2.1. UAV Image Acquisition and Preprocessing
The UAV used was a DJI consumer-grade quadcopter (Phantom 4 Pro V2.0, Shenzhen Dajiang Innovation Technology Co., Ltd., Shenzhen, China) equipped with an RGB high-definition digital camera. The camera lens had a field of view of 84°, 8.8 mm/24 mm (35 mm format equivalent), an aperture of f/2.8–f/11 with autofocus (focus distance 1 m to infinity), an effective pixel count of 20 million, and a gimbal angle control accuracy of ±0.02°.
Flights were conducted on sunny, cloudless days with little wind between 10:00 and 15:00. The quadcopter UAV equipped with a high-definition digital camera was flown with an along–track overlap of 83% and a side overlap of 83% to acquire high-definition RGB images of each plot at camera angles of 45° and 90° during the following 5 oilseed rape growth stages: seedling, bolting, flowering, pod-filling, and maturity stages.
Agisoft Metashape professional software (version 2.1.0, Agisoft LLC, St. Petersburg, Russia) was used for image stitching of the acquired UAV images to generate digital orthophoto maps (DOMs) and digital surface models (DSMs). Sparse point clouds were generated using the Structure from Motion (SFM) algorithm implemented in the software, which automatically detects and matches feature points across overlapping images. Sparse point clouds were generated based on the position and orientation system data and spatial location information of the images, and 10 ground control points (GCPs) were imported for geometric correction to construct dense point clouds. DOMs and DSMs for the 45° and 90° flight angles were generated, respectively. QGIS software (version 3.40.5, Open Source Geospatial Foundation Project. http://qgis.org) was used to delineate the experimental plots, each with an area of 1.5 m × 6 m. The number of point clouds per plot for each acquisition date and camera angle is summarized in Table 2.
Table 2.
Number of point clouds per plot across different acquisition dates and camera angles.
2.2.2. Ground Data Measurement
AGB was measured in the oilseed rape on the same day as UAV image acquisition. In each plot, five representative plant samples were selected and washed clean with water, and the roots were removed. The samples were placed in an oven at 105 °C for 30 min for enzyme deactivation and then dried at 80 °C to a constant weight. The dry matter weight was measured, and the average of the five samples was approximated as the biomass of that plot. The plot biomass was converted to per-hectare biomass (kg/ha) based on the planting density of the plot.
2.3. Vegetation Index Selection
VIs, which reflect vegetation growth conditions, are widely used to monitor the physiological activity of vegetation. They are calculated by combining relevant spectral bands that reflect changes in the physiological and biochemical activities of vegetation based on the spectral absorption characteristics of vegetation [14]. This study calculated 20 VIs to estimate oilseed rape AGB. The relevant VI calculation formulas are shown in Table 3.
Table 3.
Formulas for vegetation indices (VIs).
2.4. Construction of the Oilseed Rape Biomass Estimation Model Based on the Voxelization Method
After voxelizing the point cloud data to varying degrees and converting it into cubes, the height and RGB data of each voxel were extracted. Specifically, the RGB value of each voxel was calculated as the average of the RGB values of all original points falling inside that voxel. Biomass estimation model CVMVI was obtained by summing the product of the height, surface area (square of the resolution), and VI of each voxel in the experimental plot. The model formula is as follows:
where n is the total number of oilseed rape voxels in the experimental plot; Ai represents the surface area of voxel i (m2); Hi represents the height of voxel i, defined as the vertical distance from the voxel center to the ground surface (i.e., the canopy height at that location) (m); and VIi represents the VI value of voxel i (dimensionless). Thus, the product Ai × Hi represents the volume of the voxel, and CVMVI is a color-weighted volume indicator.
It is important to note that CVMVI is an empirical model rather than an exact physical representation. The model assumes that, for a given growth stage and uniform canopy structure, the aboveground biomass of a voxel is approximately proportional to its color-weighted volume. This simplifying assumption follows the approach of Maimaitijiang et al. [9] and has been widely adopted in UAV-based crop biomass estimation studies. The validity of this empirical relationship is supported by the strong correlations observed between CVMVI and field-measured AGB in this study.
2.5. Comparison of CVMVI and Voxel Size Combinations
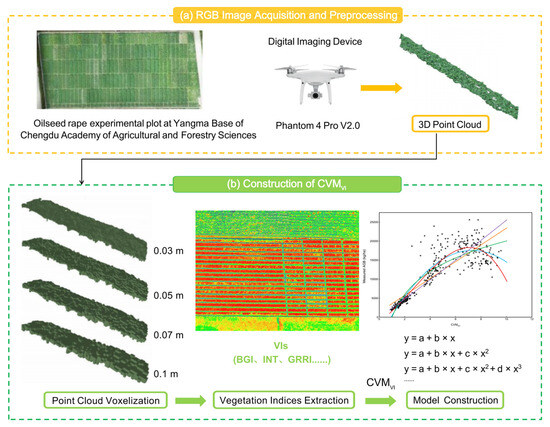
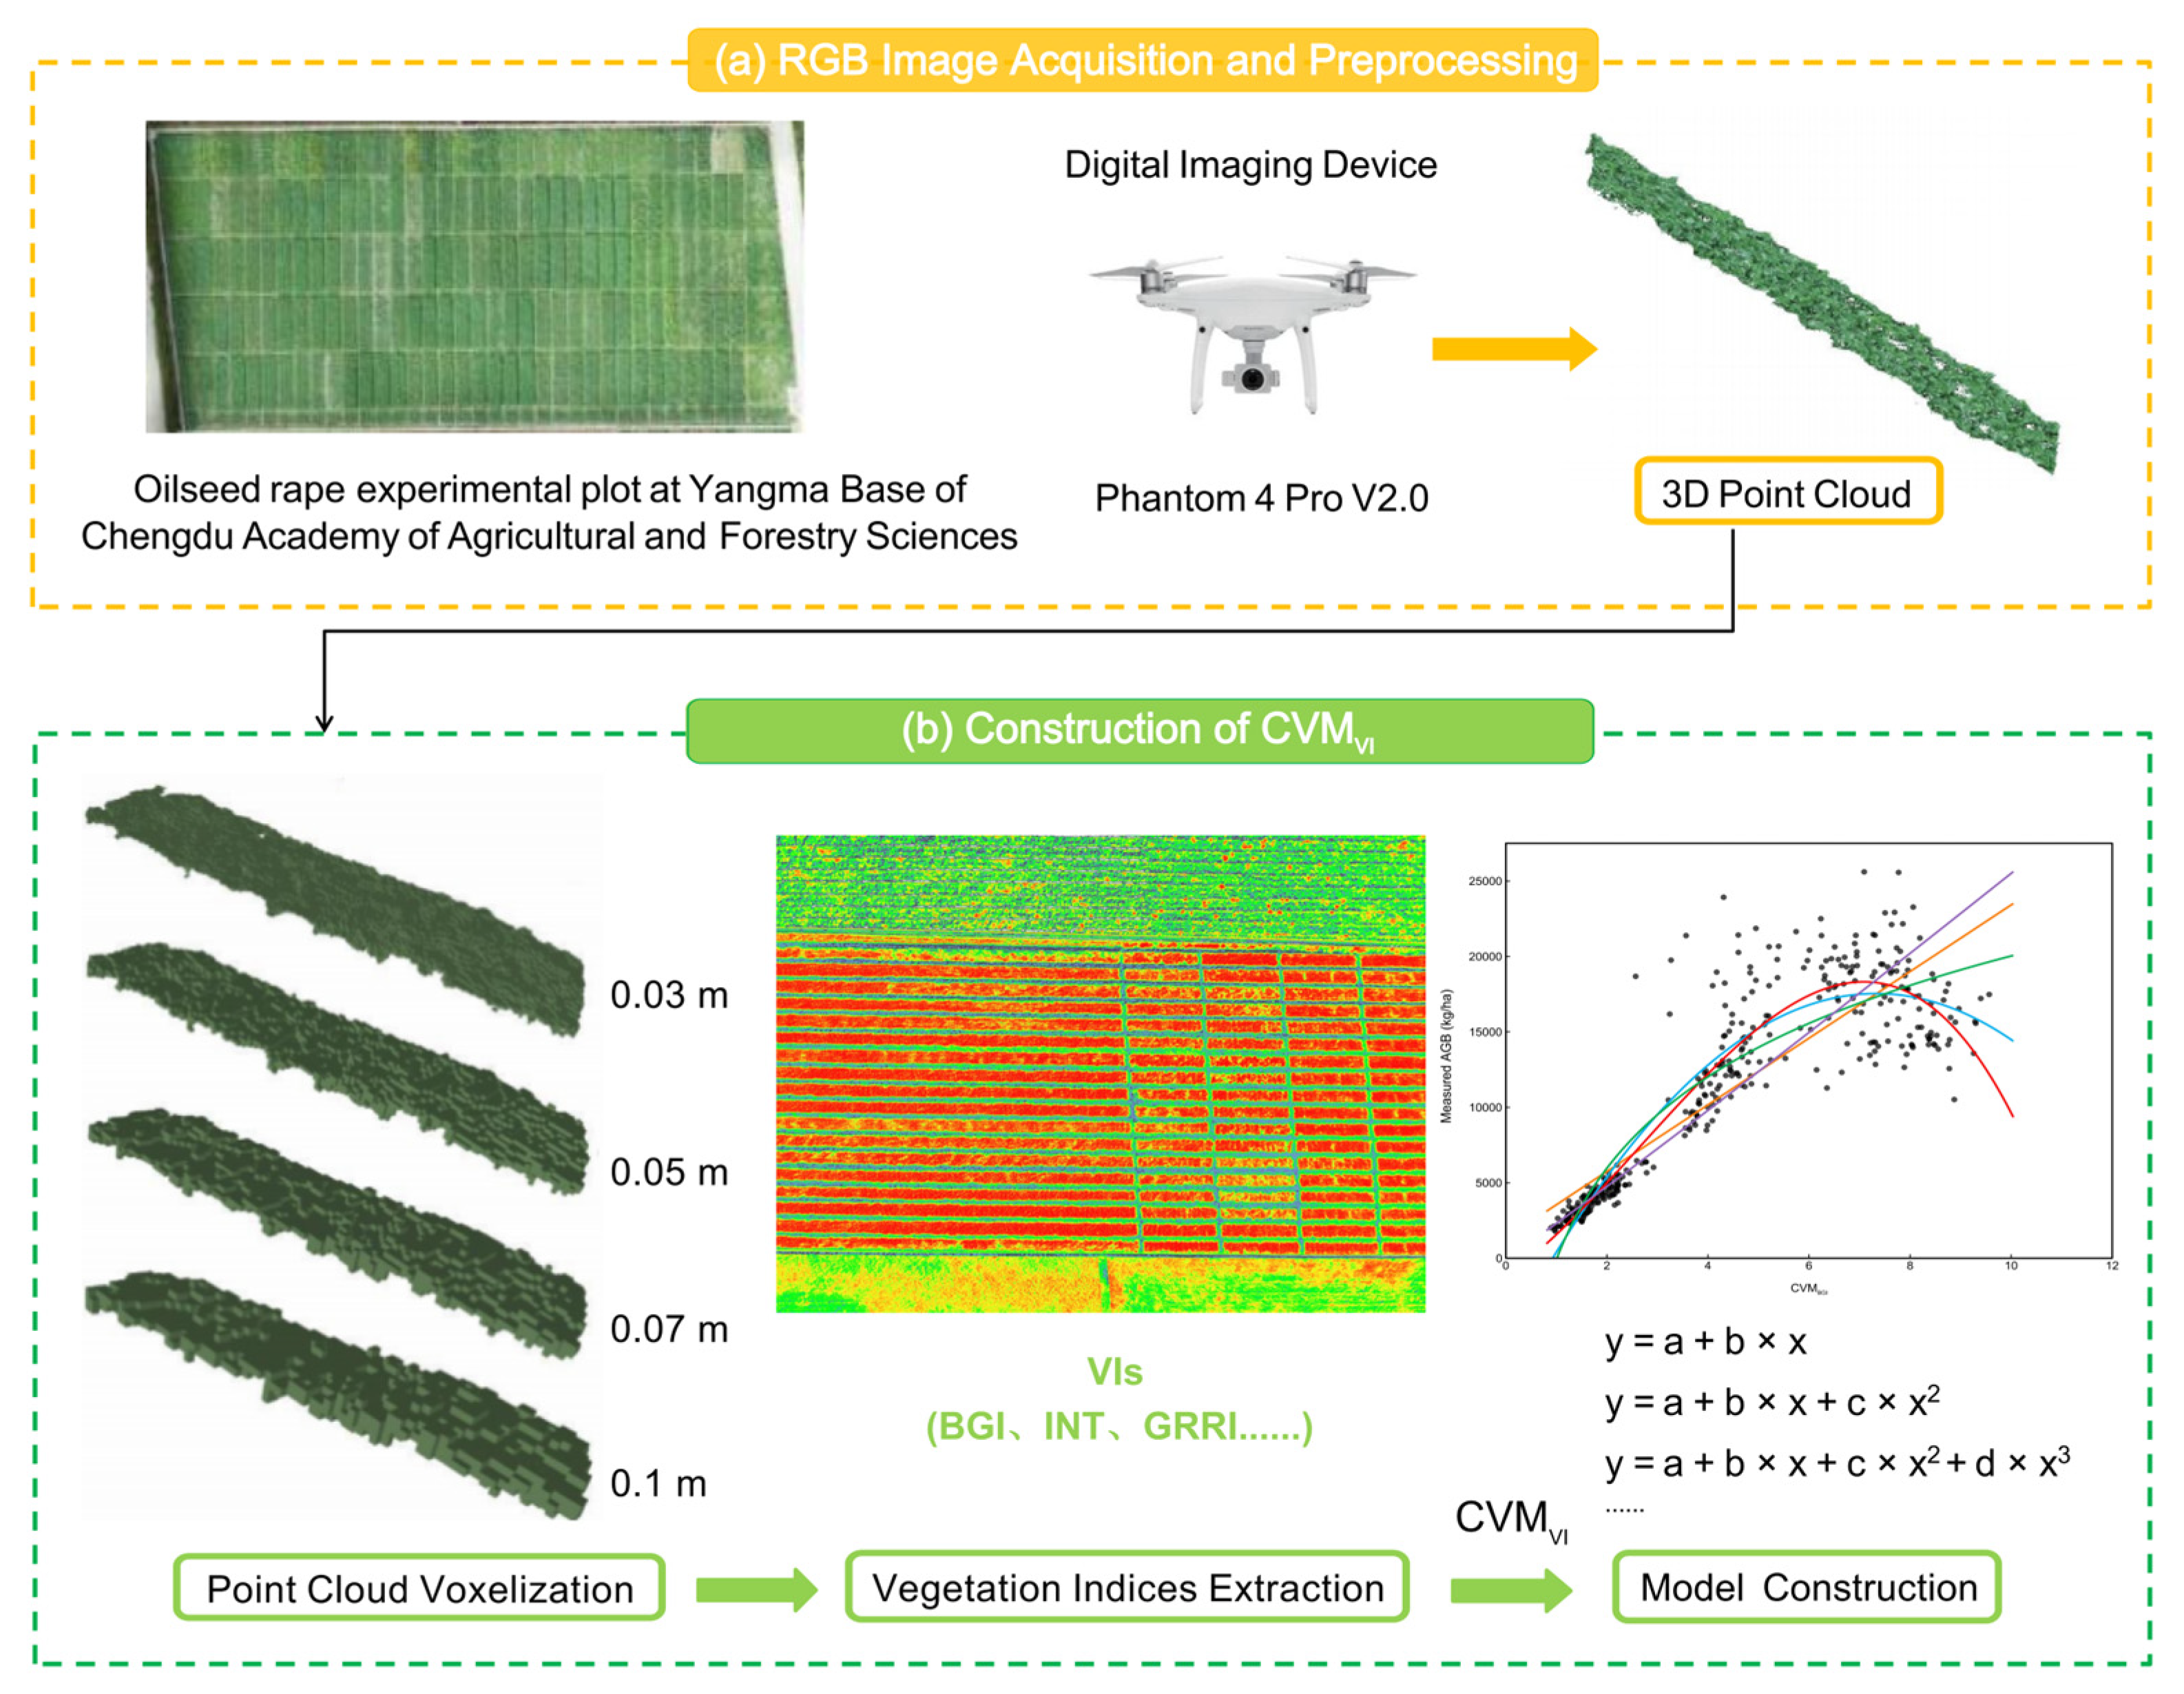
To estimate the oilseed rape biomass, this study established regression models between CVMVI under different VIs and voxel sizes and the measured biomass. The regression equations included linear and nonlinear functions (polynomial, exponential, power, and logarithmic). The model estimation performance was evaluated using R2, RMSE, and RE. A higher R2 indicates a stronger association, while lower RMSE and RE indicate smaller deviations between the estimated and measured biomass. The experimental workflow is shown in Figure 1. The evaluation metrics can be expressed as follows:
where yi is the measured biomass value; is the mean of the measured biomass values; is the estimated biomass value; and n is the number of samples.
Figure 1.
Workflow diagram for AGB estimation model construction.
3. Results
3.1. Description of Measured Oilseed Rape AGB
The results of oilseed rape AGB indicate that there were differences in biomass across different years due to variations in experimental setups (Table 4). From the seedling stage to the maturity stage, the biomass showed a monotonically increasing trend, and the oilseed rape AGB followed an “S”-shaped growth curve as the growth period progressed.
Table 4.
Oilseed rape aboveground biomass description.
3.2. Correlation Analysis Between CVMVI Models Based on Vegetation Indices and the Measured AGB
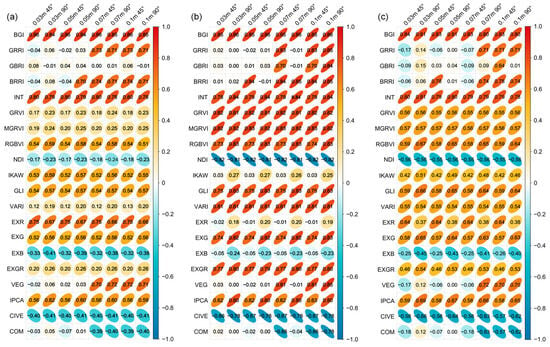
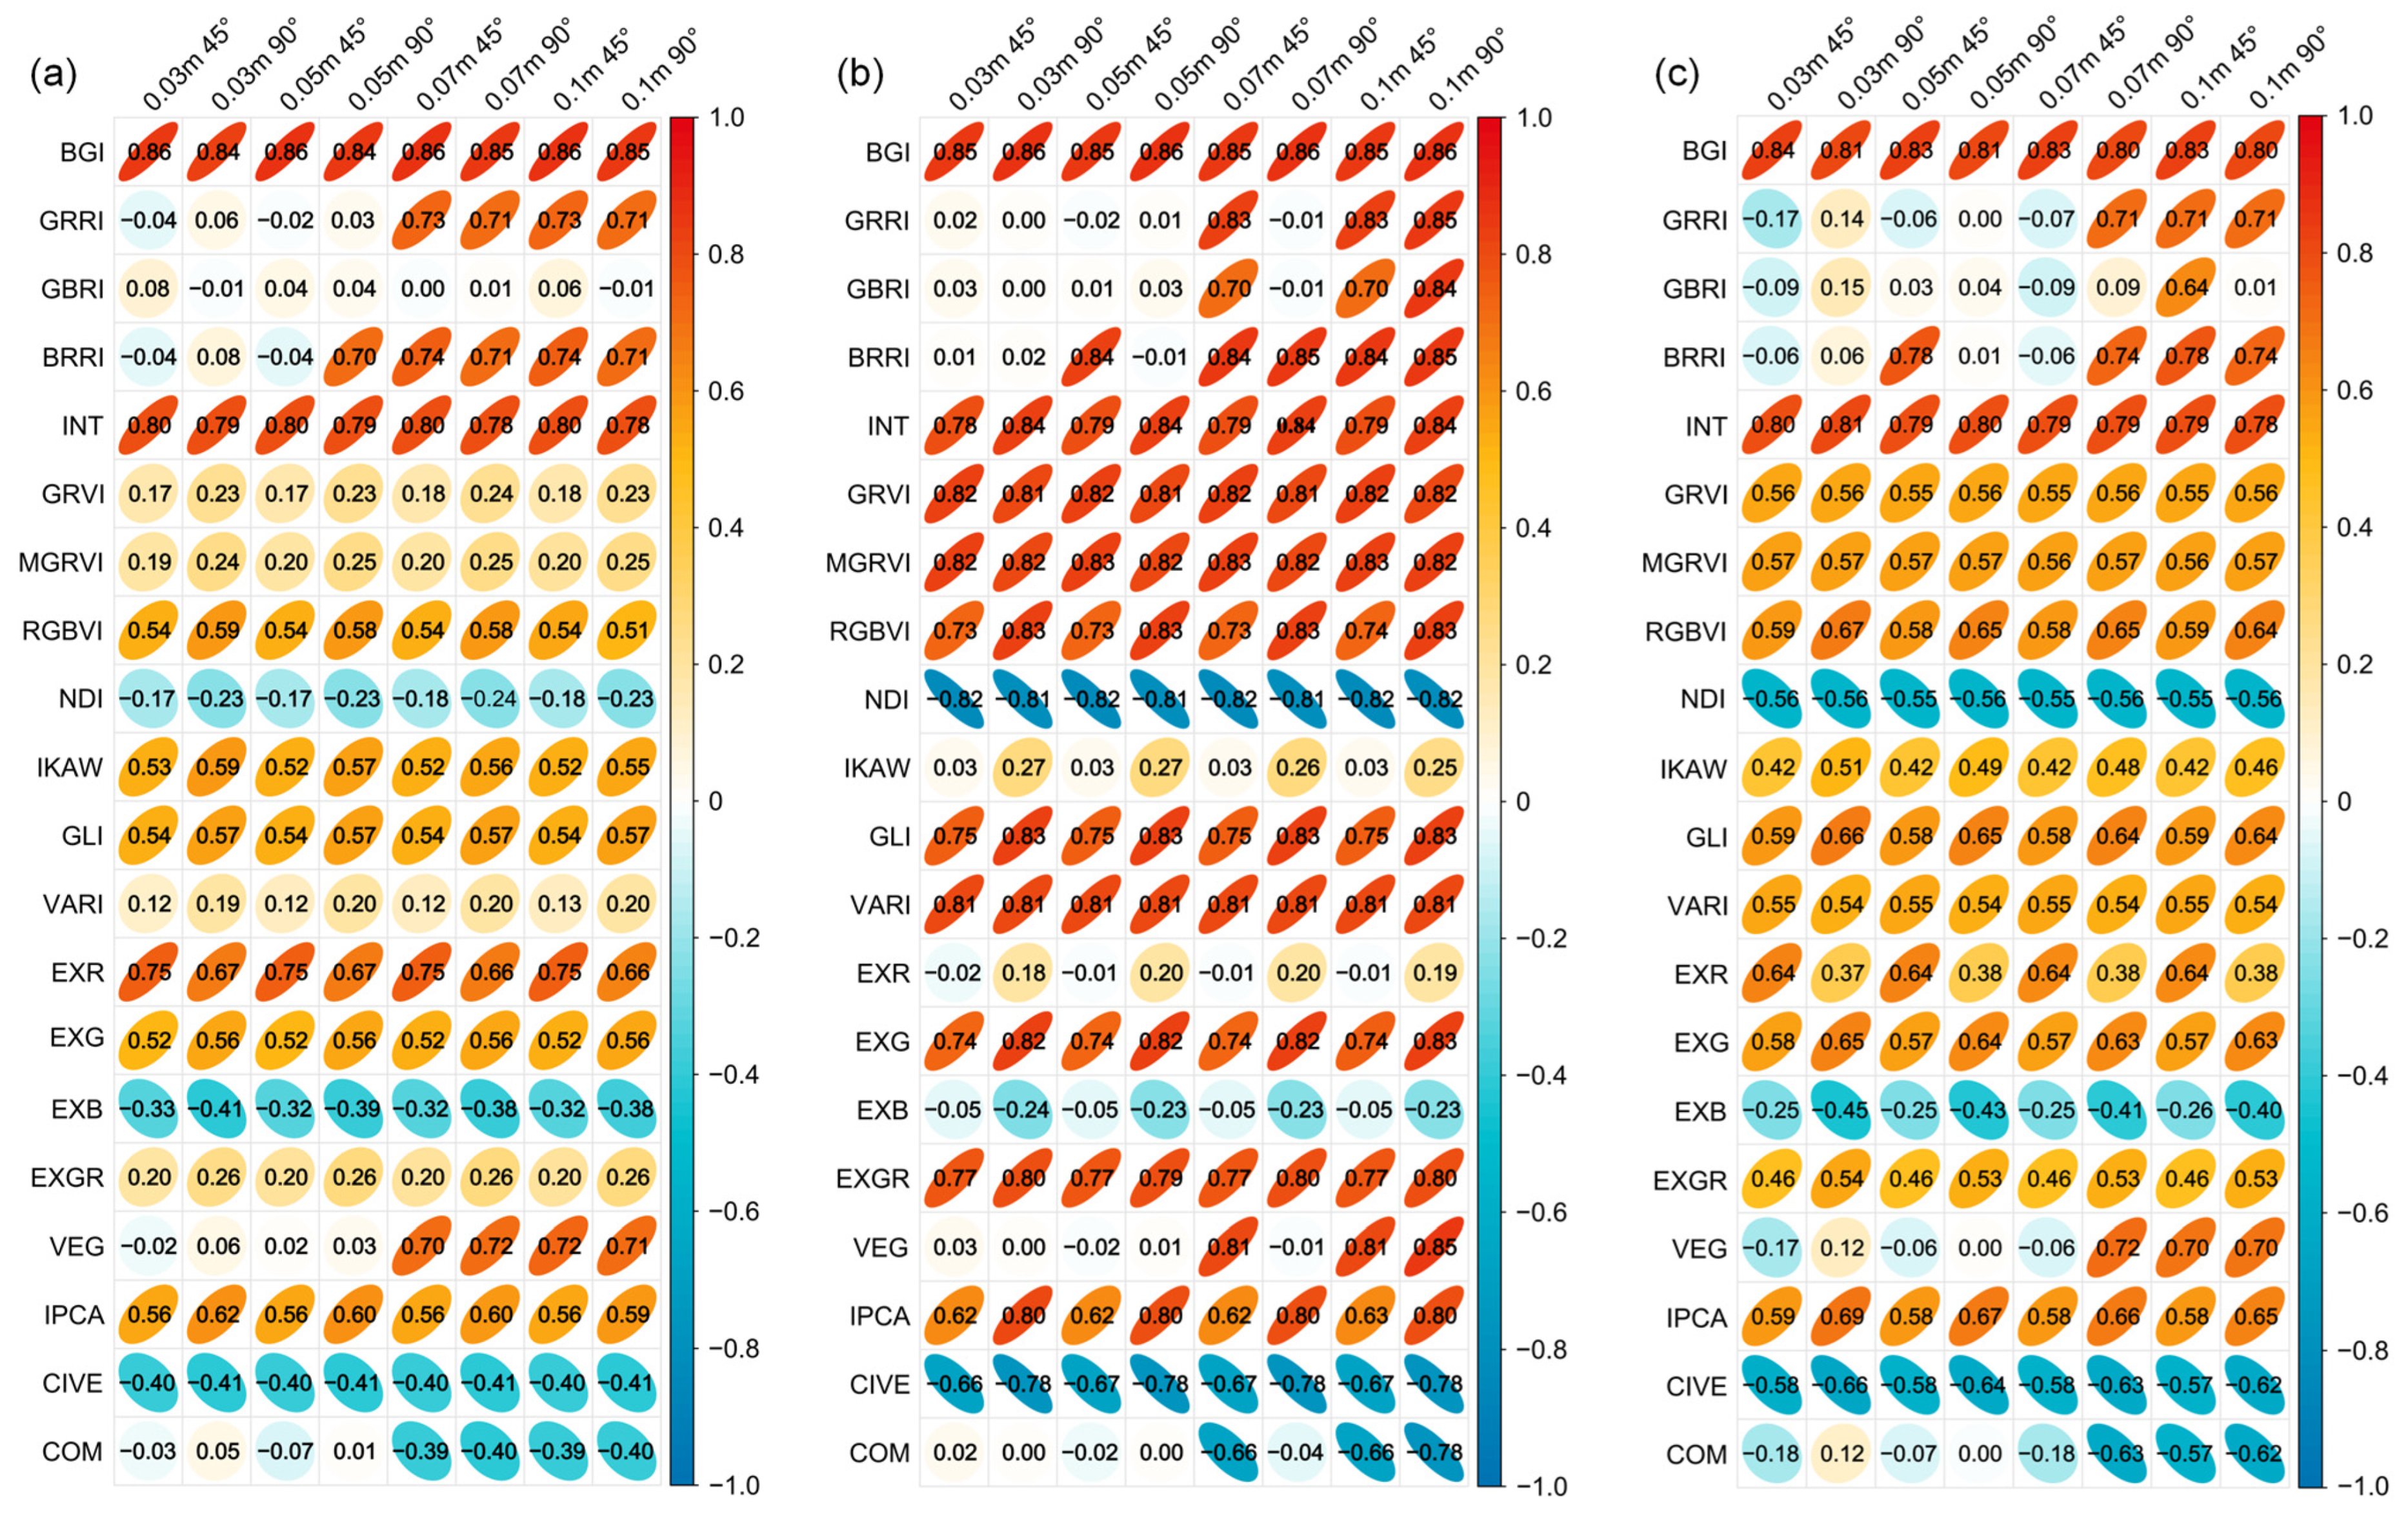
To identify the most promising vegetation indices for AGB estimation, we calculated the Pearson correlation coefficients between CVMVI and field-measured AGB for all 20 VIs across four voxel sizes (0.03, 0.05, 0.07, 0.1 m) and two camera angles (45° and 90°), using data from three consecutive growing seasons (2021–2022, 2022–2023, and 2023–2024) (Figure 2). Across all three years, the CVMBGI model and CVMINT model consistently exhibited the strongest and most stable correlations with AGB, regardless of voxel size or camera angle. Specifically, the CVMBGI model constructed based on the BGI had the strongest correlation with the measured biomass (r > 0.80). The CVMINT model based on the INT also showed strong correlations, with coefficients greater than 0.75.
Figure 2.
Heatmap of correlations between the CVMVI (vegetation index weighted canopy volume model) and the measured AGB. (a) 2021–2022. (b) 2022–2023. (c) 2023–2024. In the left column labels, “VI (vegetation index)” represents “CVMVI”. The column labels indicate voxel size (e.g., 0.03 m) and camera angle (45° or 90°).
In contrast, CVMGRRI, CVMBRRI, and CVMVEG showed marked sensitivity to voxel size and camera angle. The sharp increase in correlation for CVMGRRI and CVMVEG when voxel size increases from 0.05 m to 0.07 m can be explained by two main factors. First, smaller voxels (0.03–0.05 m) capture very fine spatial details, but they are also more sensitive to local noise, gaps within the canopy, and uneven point cloud density caused by variable leaf orientation and occlusion. Under such conditions, ratio-based indices may become unstable because small variations in red or blue channel reflectance can cause large relative changes. Second, when voxel size increases to 0.07–0.1 m, each voxel aggregates points from a larger physical volume, which averages out local spectral noise and provides a more robust estimate of the average canopy color. In addition, the 90° camera angle minimizes shadows and captures mostly top-of-canopy reflectance, while the 45° oblique view introduces side-view information that may either enhance or suppress certain indices depending on canopy structure. Despite this variability, models based on the GRRI, BRRI, and VEG showed strong correlations (r > 0.70) under the 0.1–m voxel treatment. Therefore, together with CVMBGI and CVMINT, these five models were retained for subsequent estimation model construction. Among them, CVMBGI consistently exhibited the highest and most stable correlations across all treatments and years, and was therefore selected as the representative index for further analysis of growth-stage performance (Figure 3).
Figure 3.
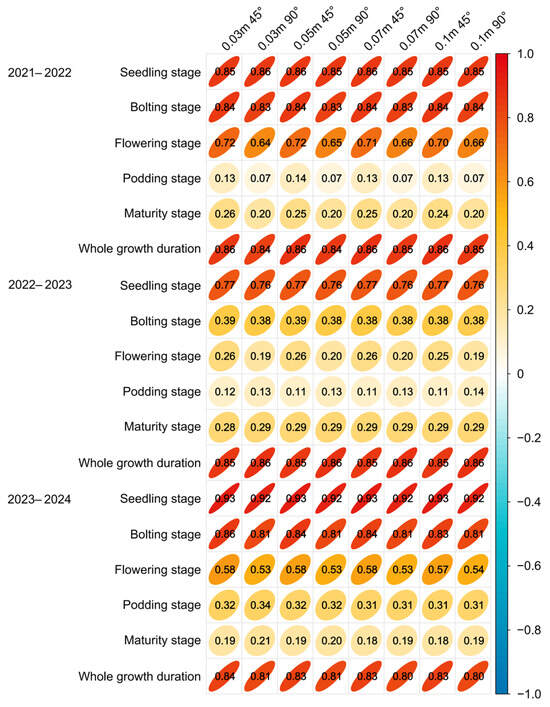
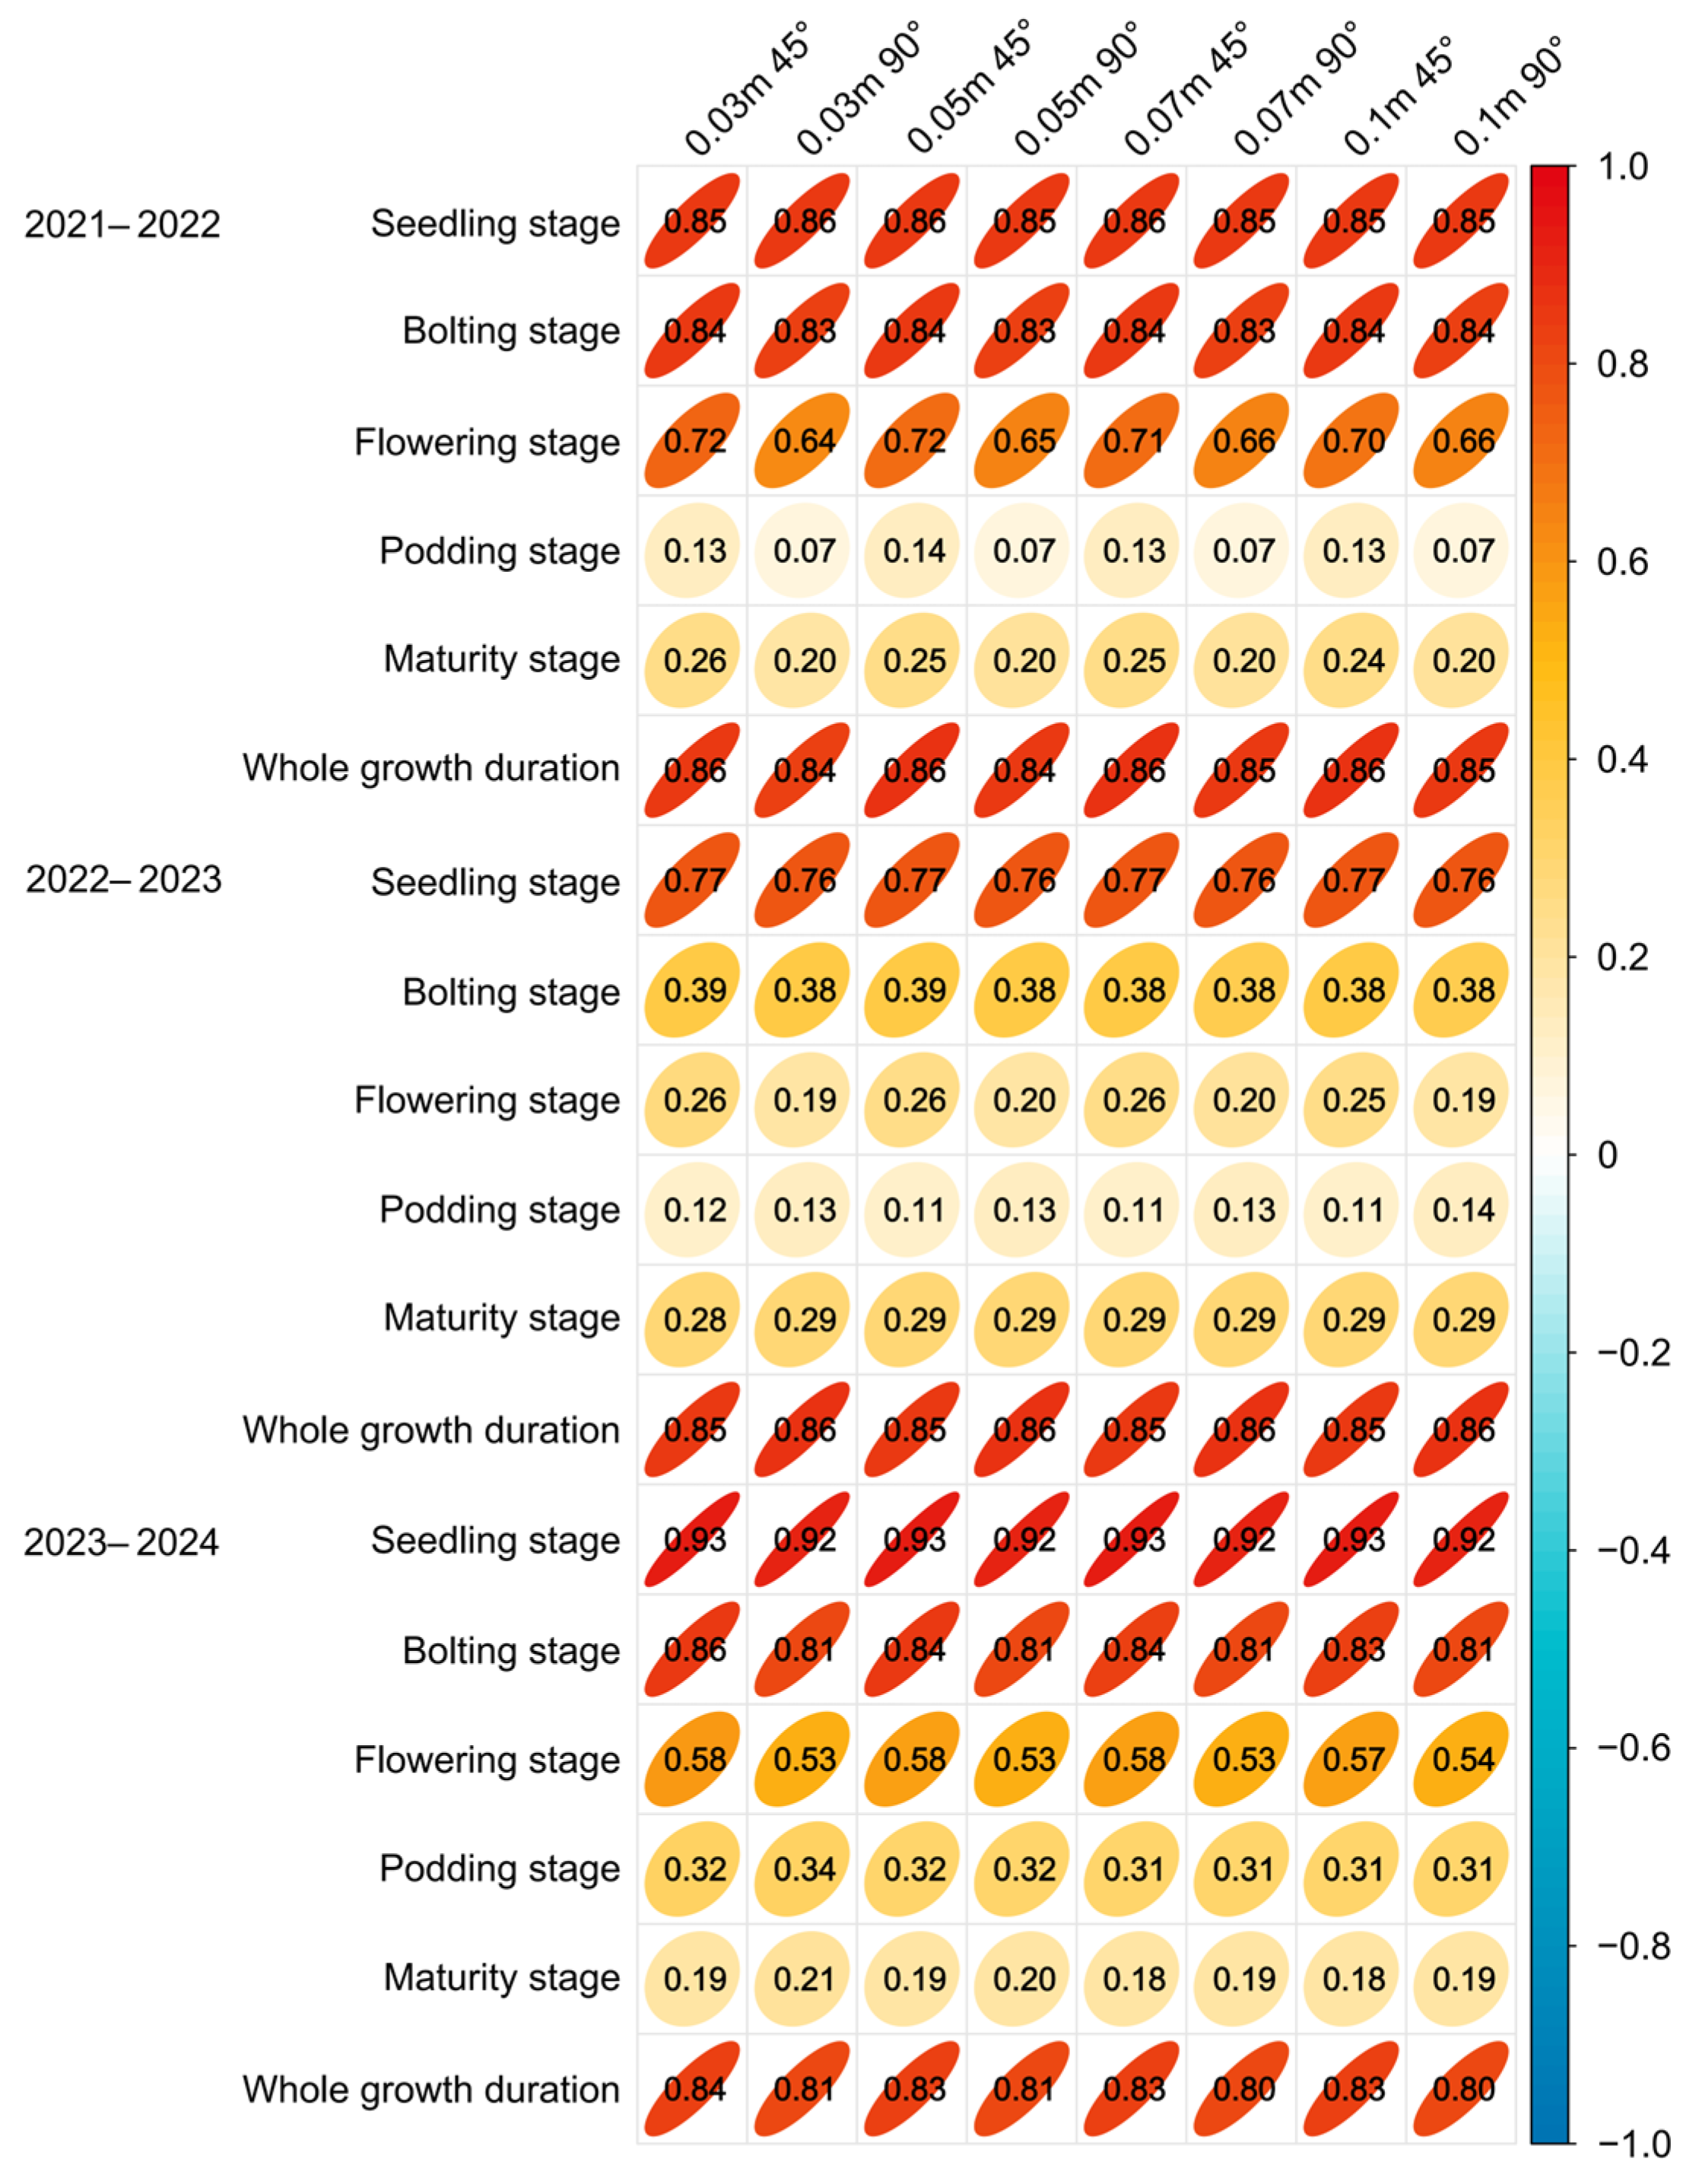
Heatmap of correlations between the estimated and measured AGB of oilseed rape at different growth stages. The column labels indicate voxel size (e.g., 0.03 m) and camera angle (45° or 90°).
3.3. Comparison of Oilseed Rape AGB Estimation Results Using Different Camera Angles and Voxel Sizes
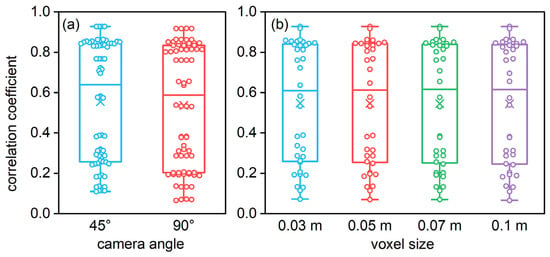
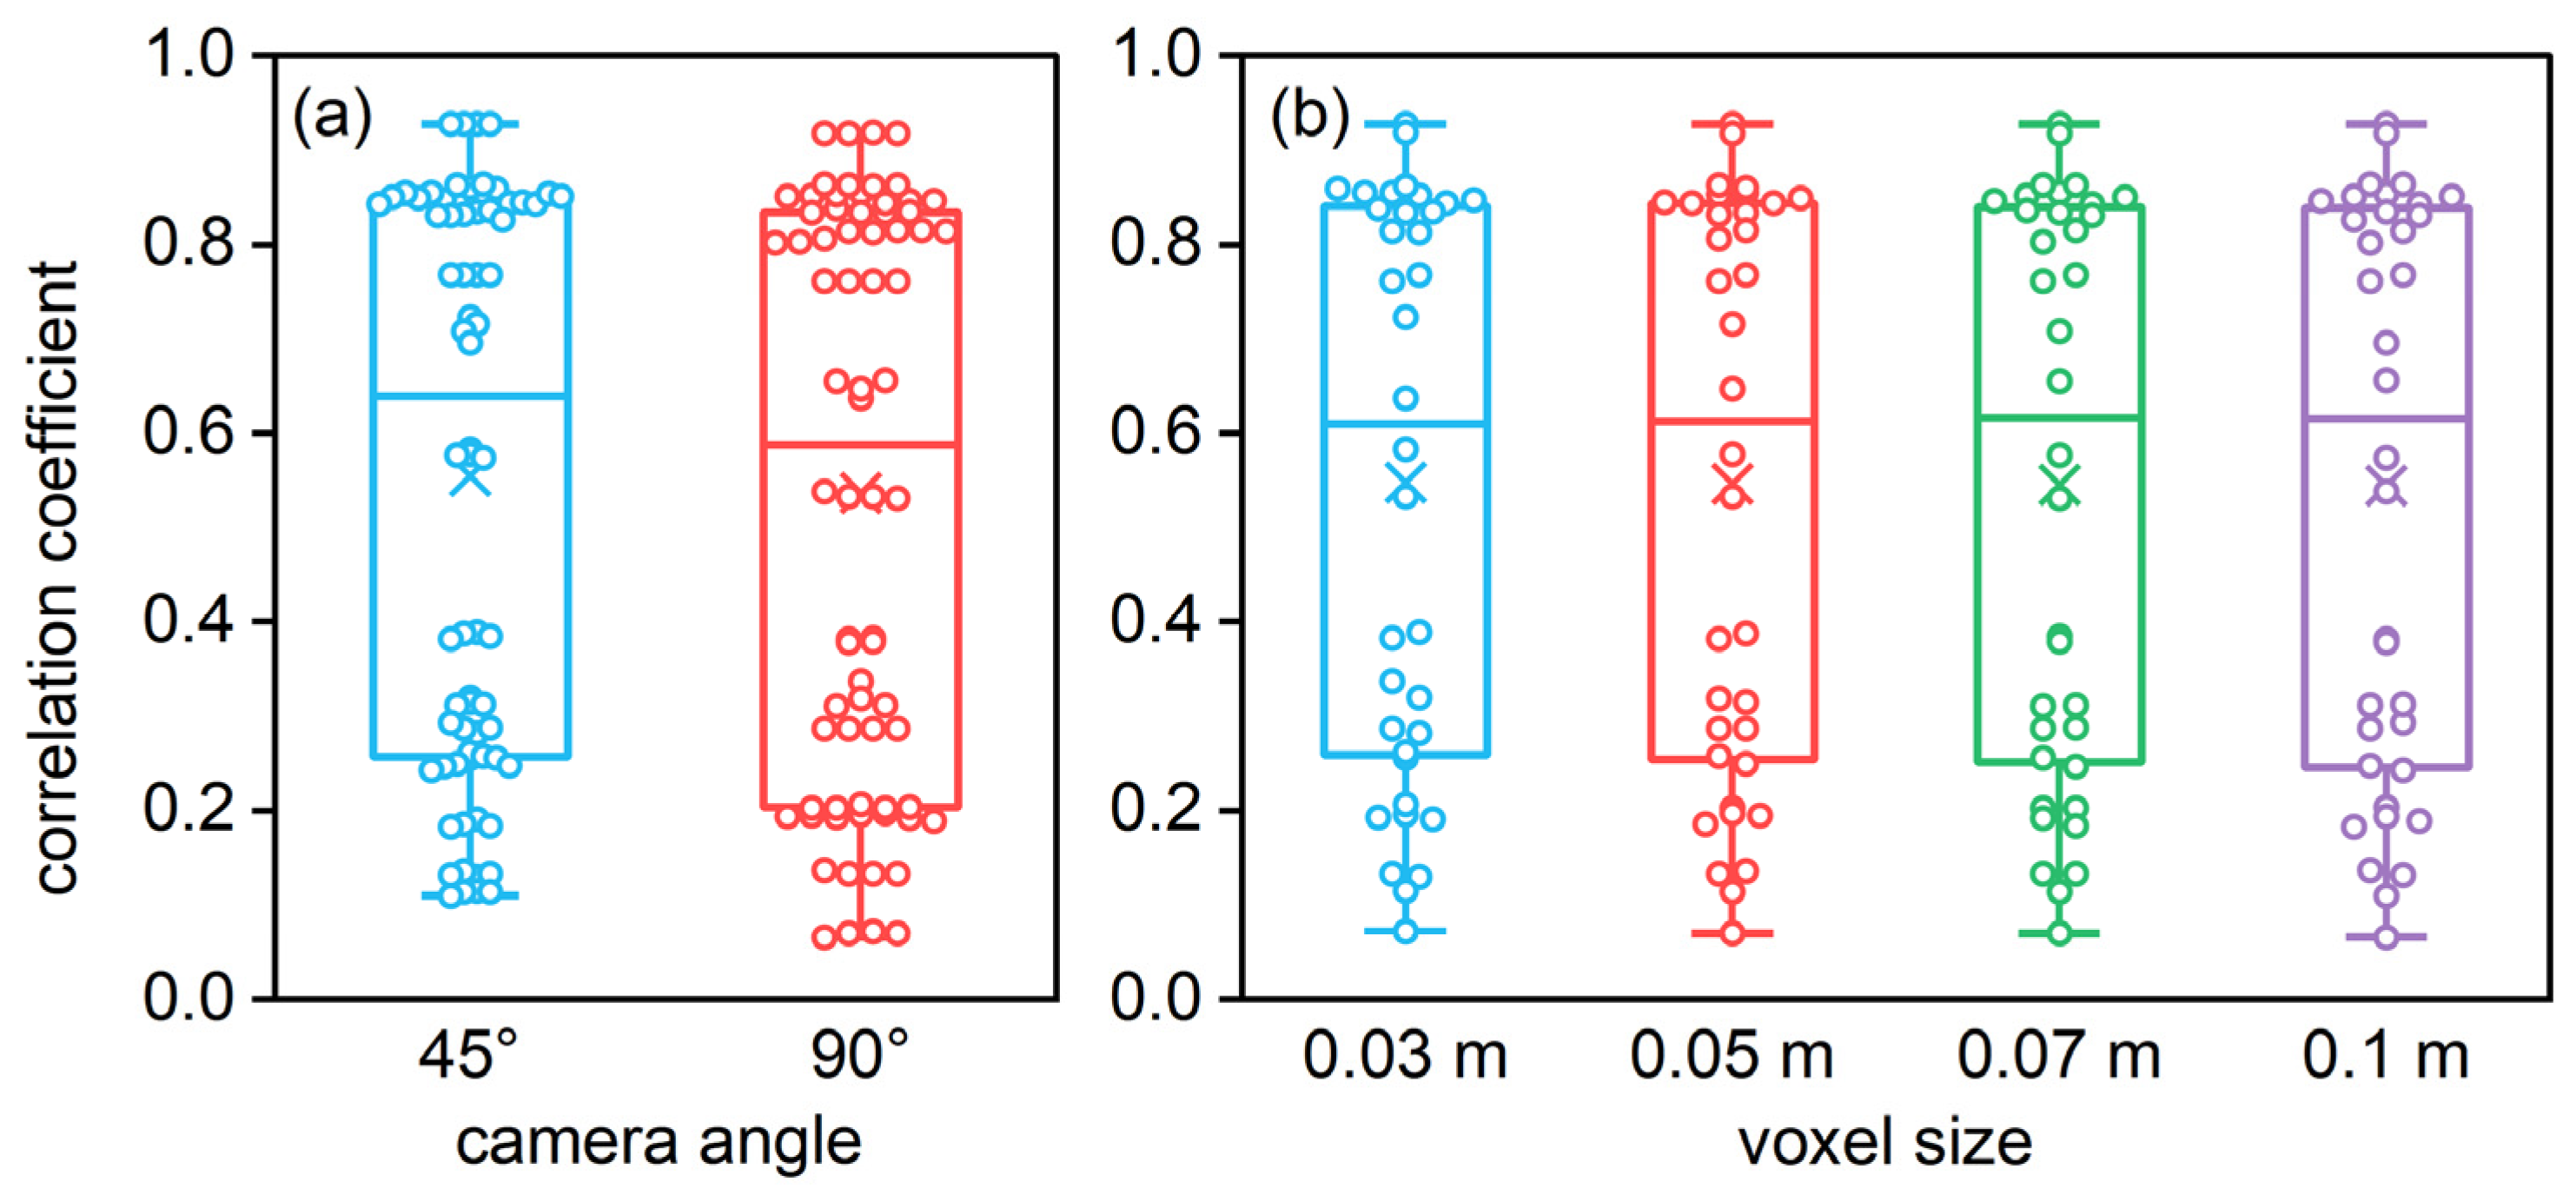
Comparing the correlation strength under two camera angles (Figure 3) showed that the correlation coefficients between the estimated and measured biomass under the 45° angle were generally higher than those under the vertical (90°) angle for the same voxel treatment. To statistically verify this observation, we performed a significance analysis on the correlation coefficients across all voxel treatments and growth stages. The results revealed a highly significant difference between the two camera angles (p < 0.01) (Figure 4a), confirming that the 45° oblique angle provides a reliable advantage over the 90° vertical angle for oilseed rape biomass estimation. The primary reason is that when reconstructing point clouds from RGB images taken at a 45° angle, the generated point clouds are more three-dimensional than those reconstructed from 90° images, capturing more side morphological information and obtaining biomass information that better aligns with the actual growth status of oilseed rape.
Figure 4.
Significant differences in correlation coefficients. (a) camera angle. (b) voxel size.
Comparing the biomass correlation strength after four voxelization treatments showed no significant differences among voxel sizes within the same growth stage (Figure 4b). The reason may be that the average RGB values of the points inside a voxel are extracted as the RGB value for that voxel during the point cloud voxelization process. As the color expression of oilseed rape in the field is relatively uniform, the collected RGB information is largely similar, leading to no significant differences in VI values among voxels. Consequently, the differences in biomass correlation strength were not substantial among voxelization treatments.
3.4. Estimation Performance of Oilseed Rape AGB at Different Growth Stages
As shown in Figure 3, the correlation coefficients between the estimated and measured AGB at the seedling stage were greater than those at other stages in the same year, and the coefficients generally decreased gradually as the growth period progressed. The reason is that oilseed rape plants grow uniformly during the seedling stage without mutual shading. As it grows, the density of the rape population gradually increases. The overlapping of leaves and pods leads to partial point cloud loss during the later processing of UAV images, reducing the correlation strength. Due to some degree of lodging during the reproductive growth stage, the canopy height captured by the UAV was significantly lower than the natural plant height, causing biomass estimation model CVMVI, which is based on voxel height, to also yield lower values than the measured data. The estimated biomass for the entire growth period showed strong correlations with measured values, with correlation coefficients greater than 0.80 for all voxelization treatments, which were higher than those for any single later growth stage. The main reason is that the data volume for a single stage is relatively small, making the correlation coefficient more susceptible to sampling error. The increased data volume throughout the growth period reduces this sampling error.
3.5. Selection of Regression Methods for Estimating Oilseed Rape AGB Based on CVMVI
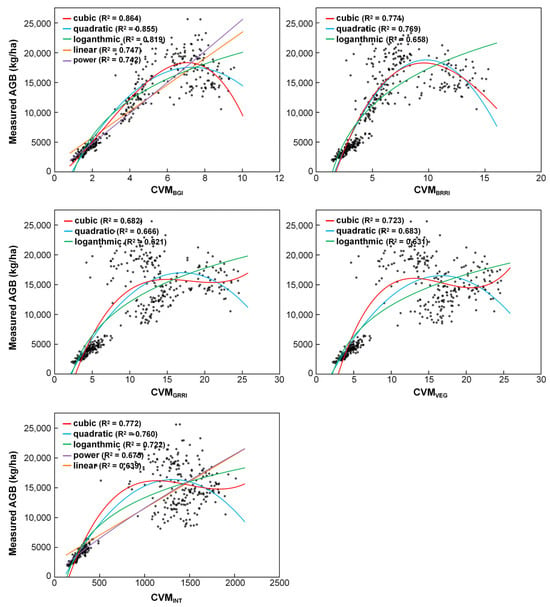
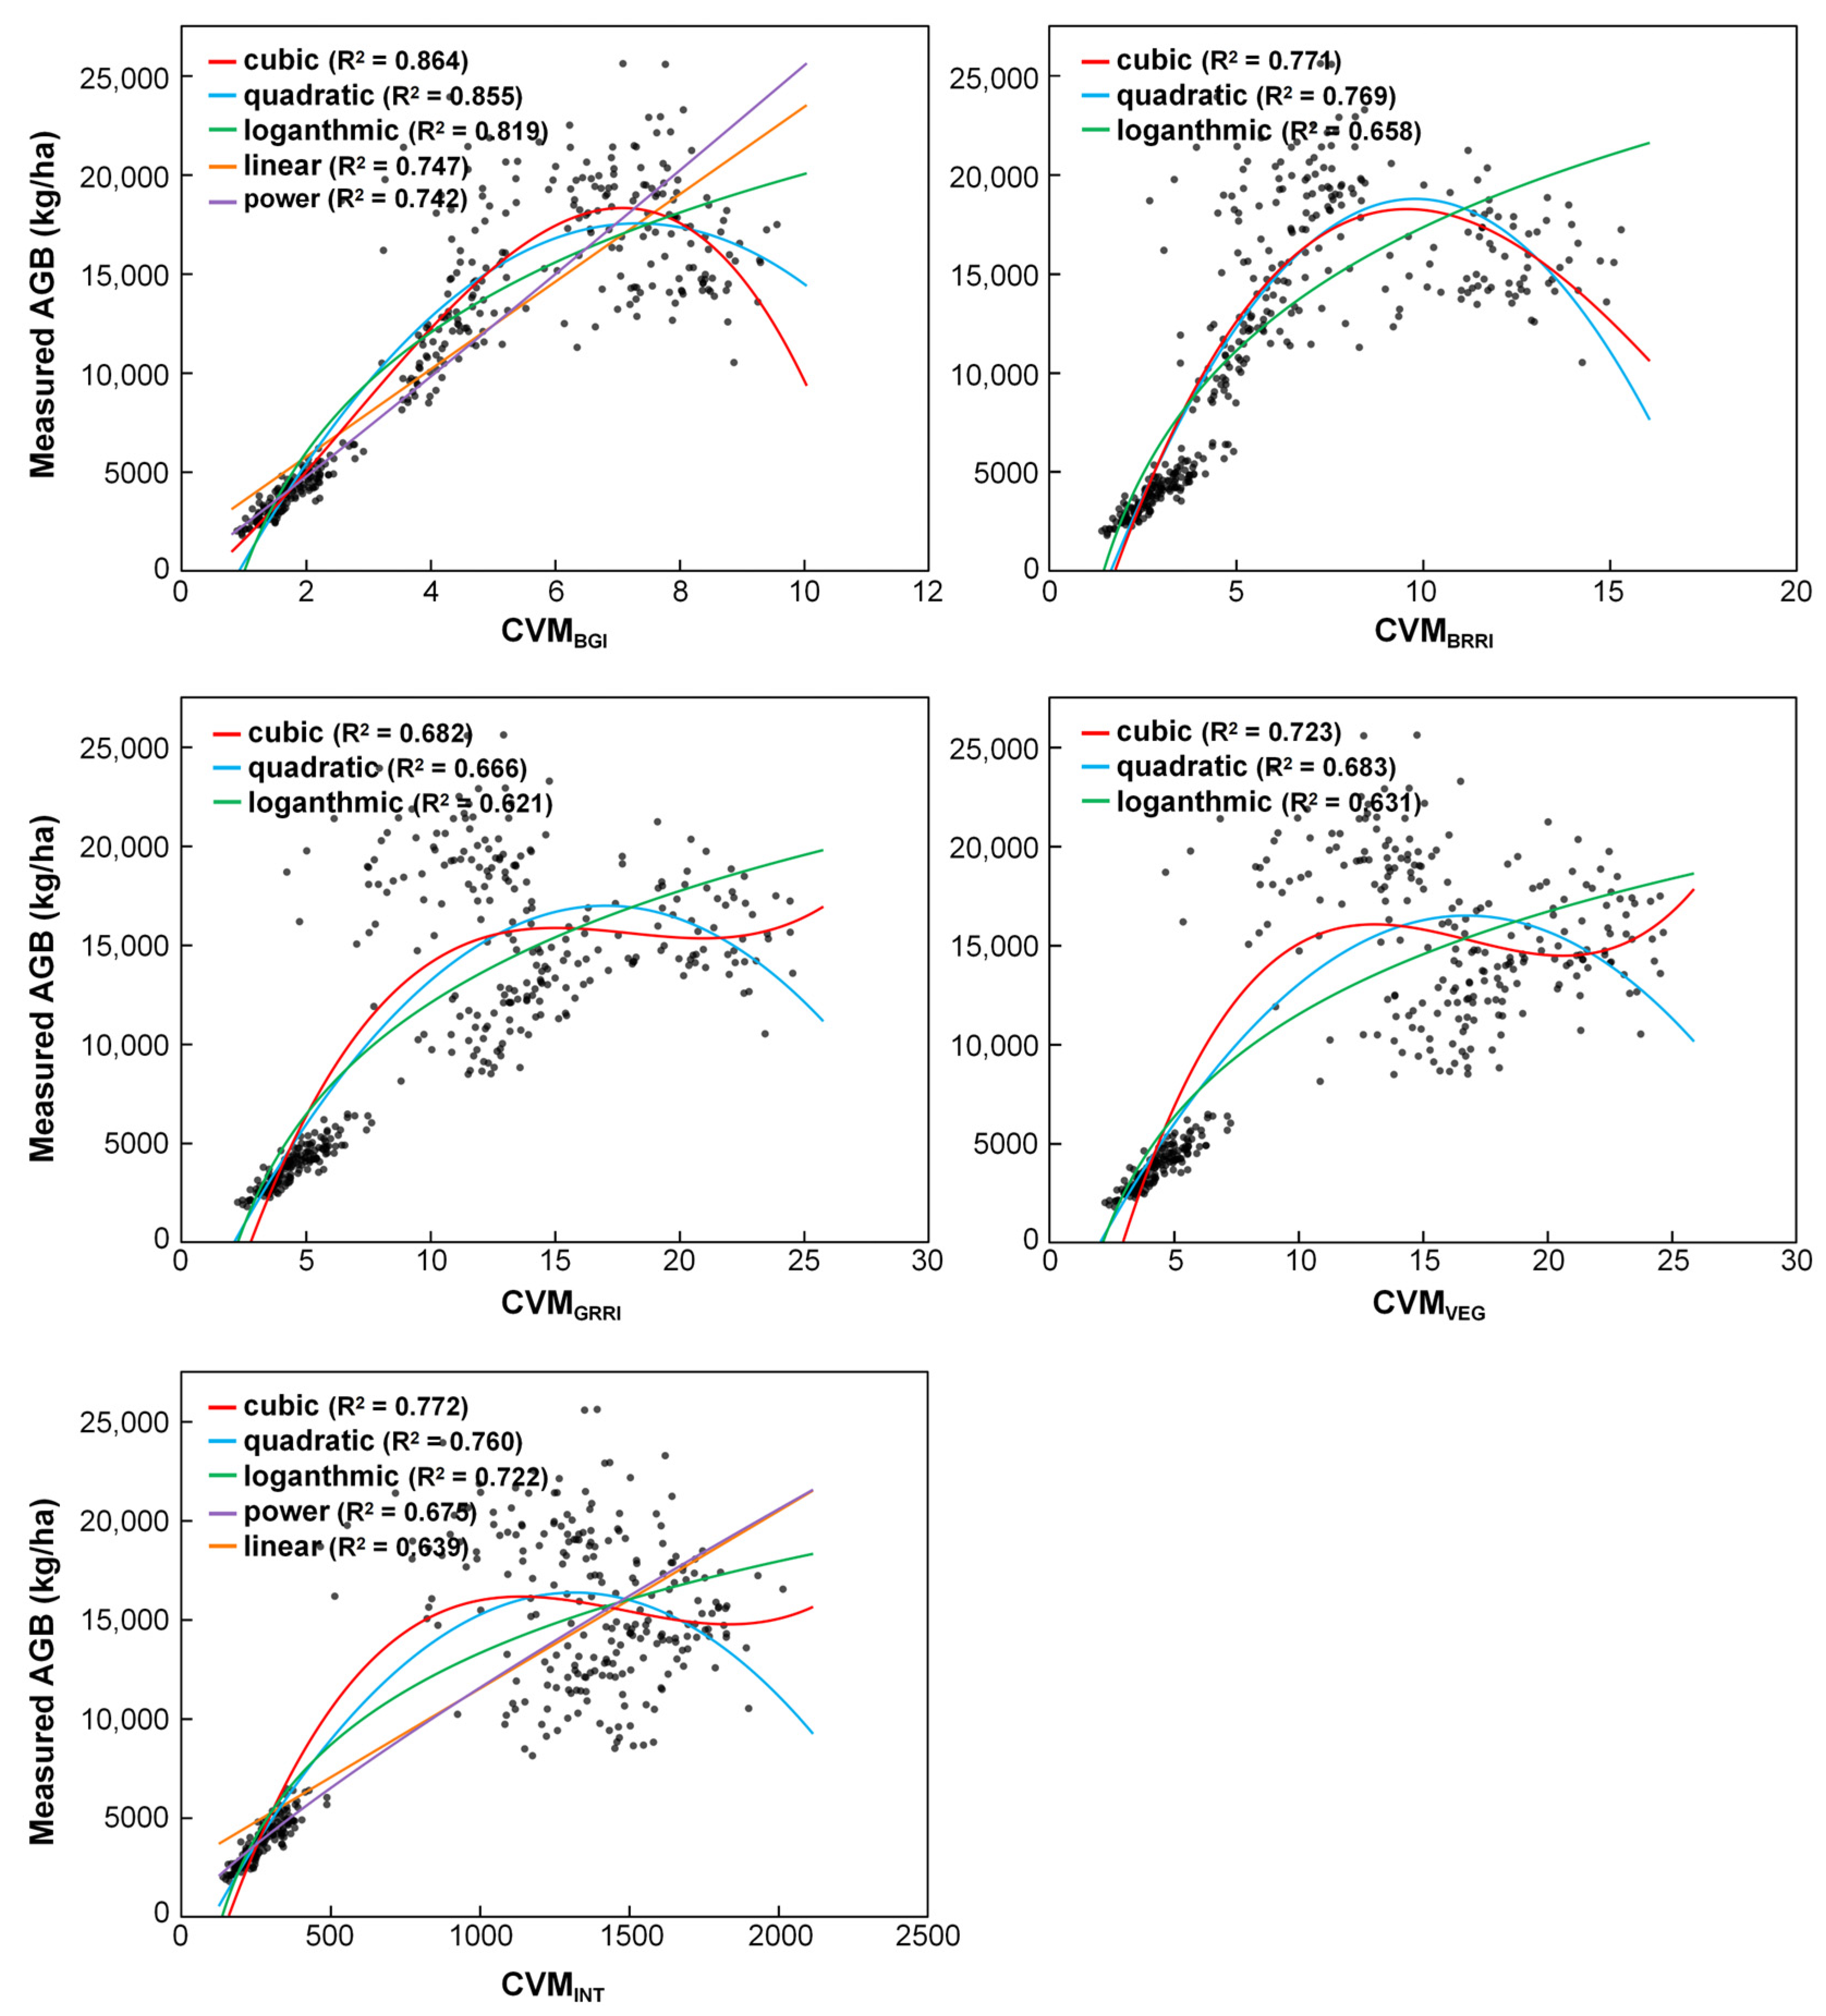
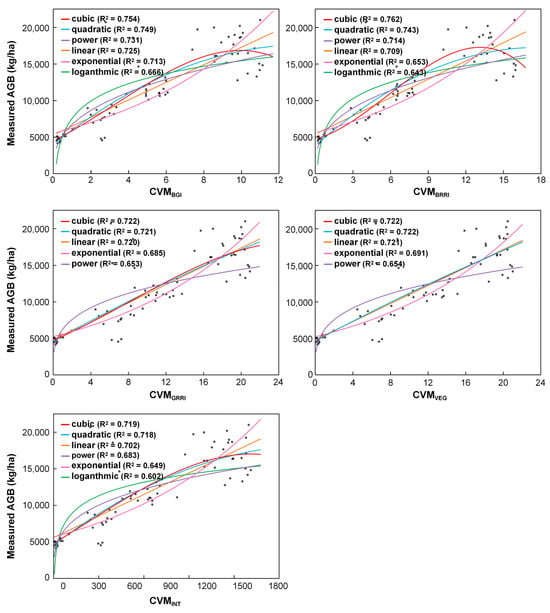
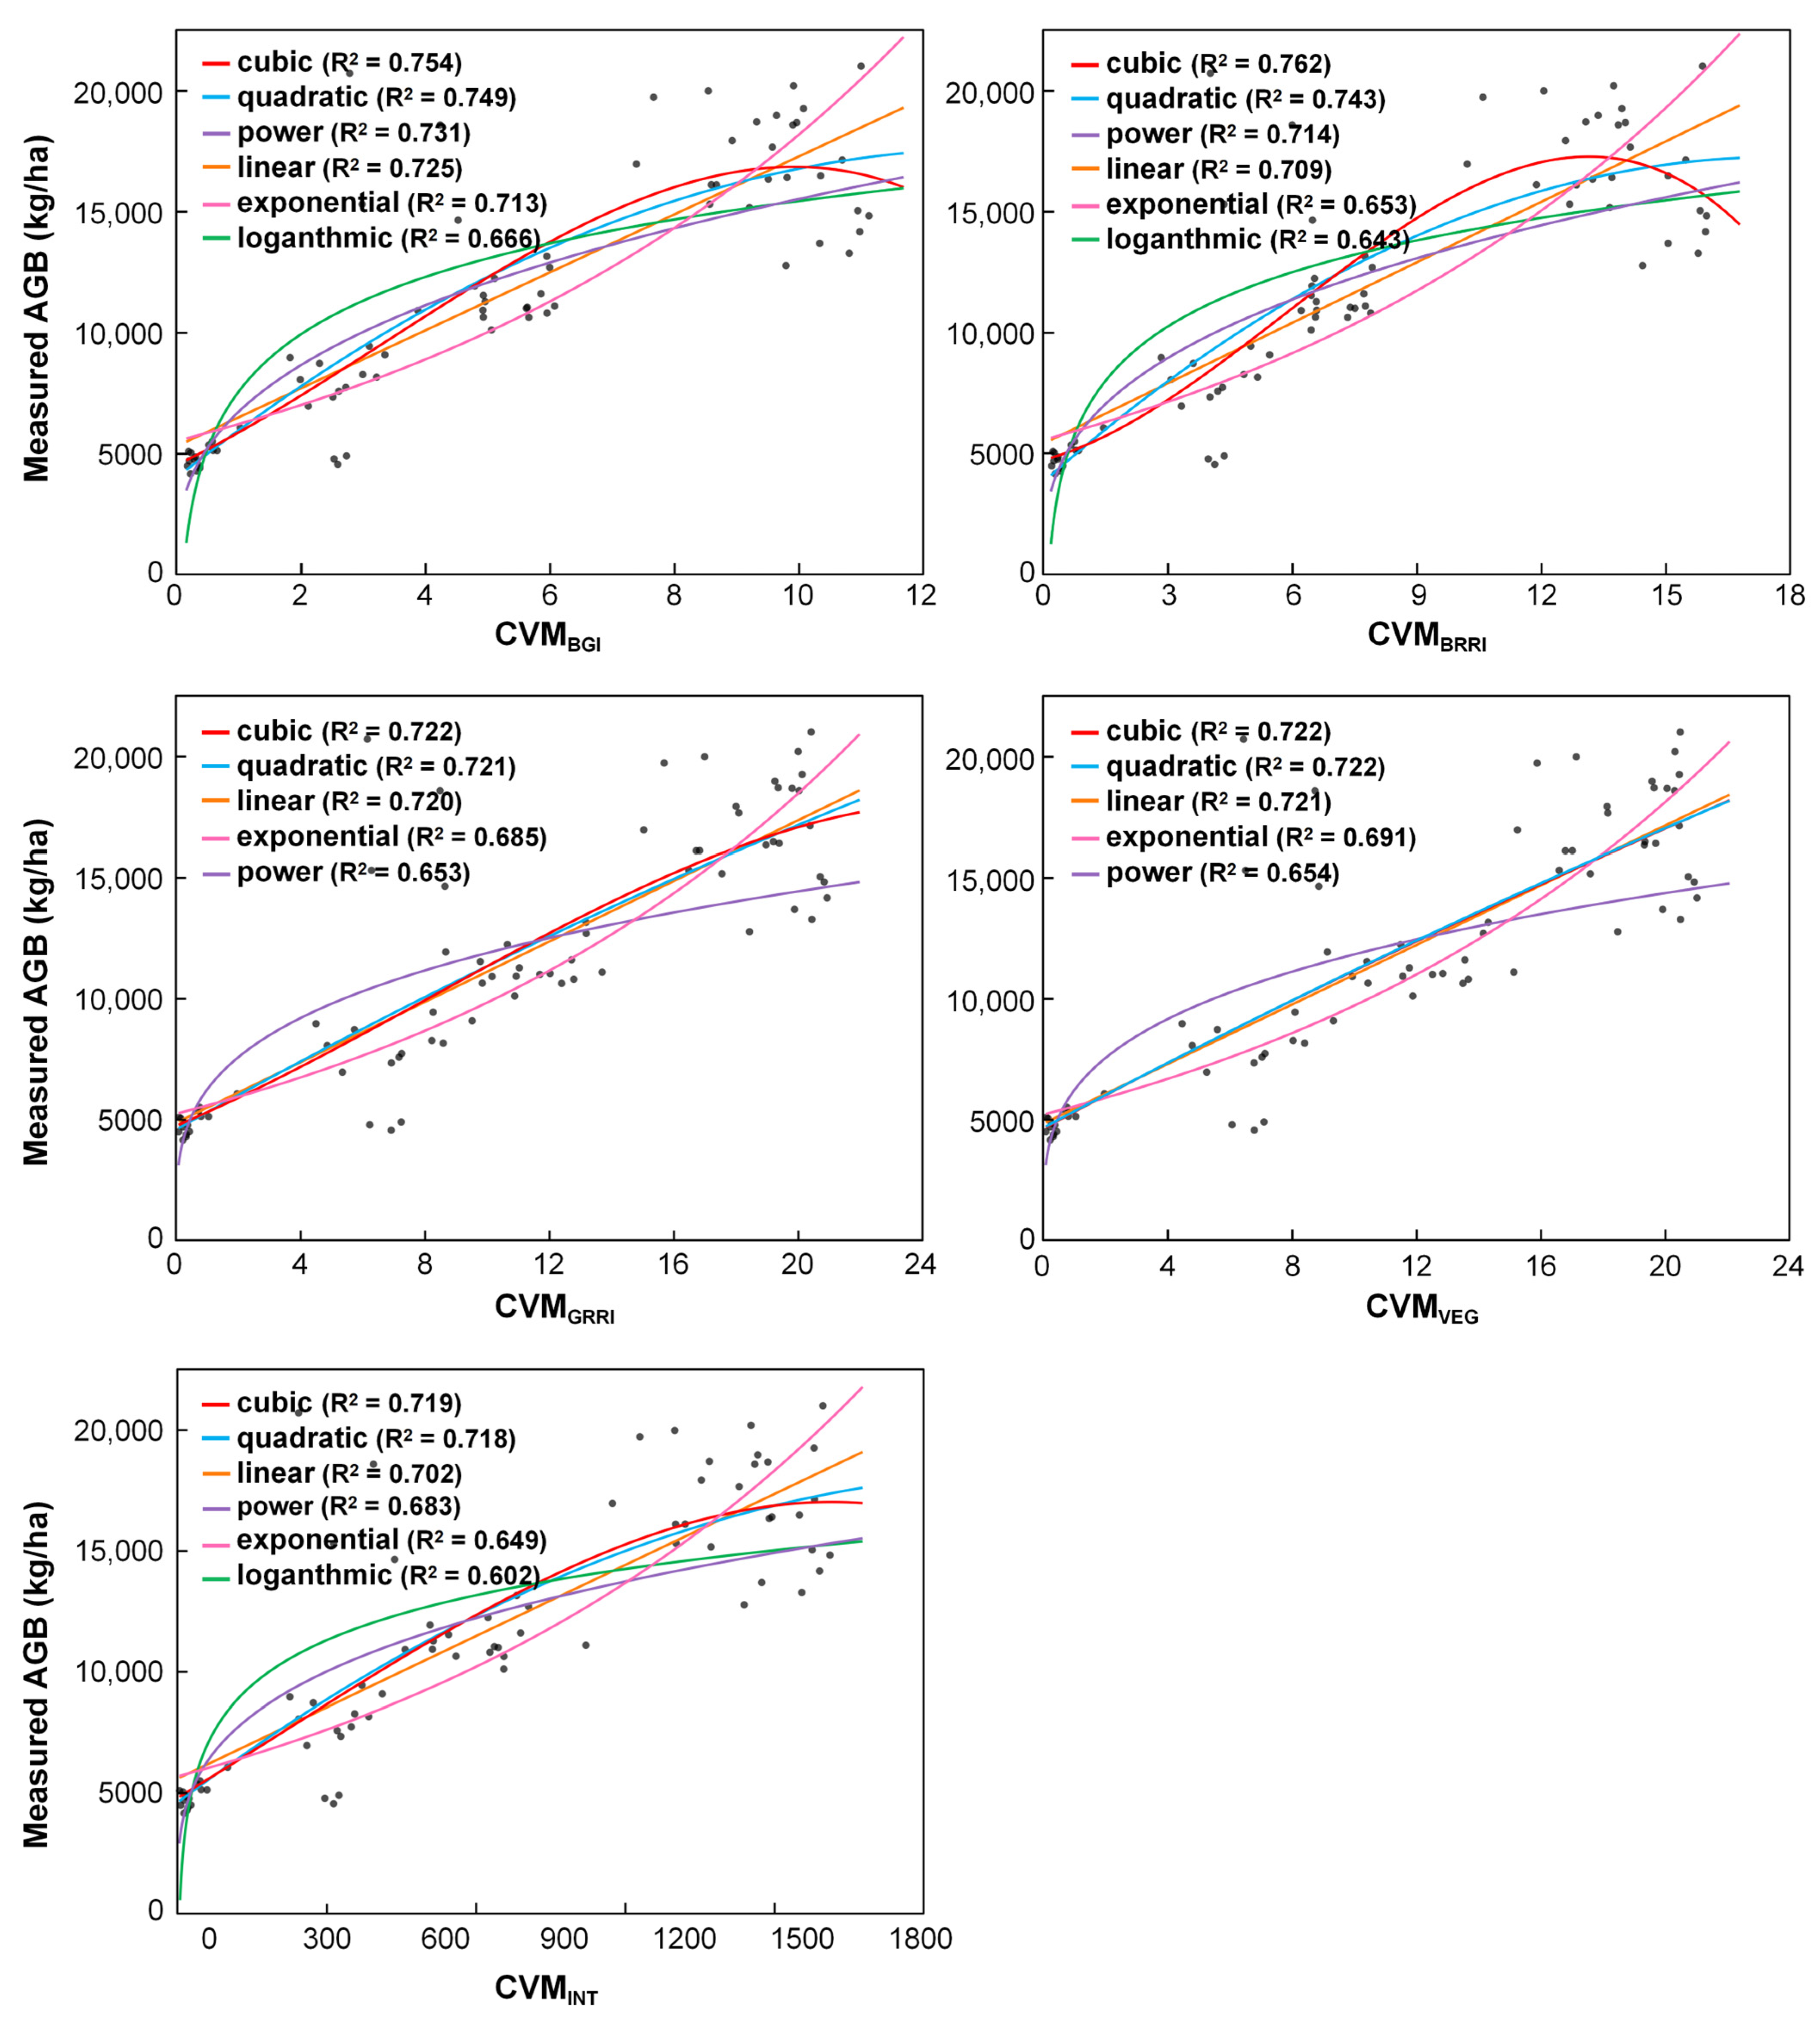
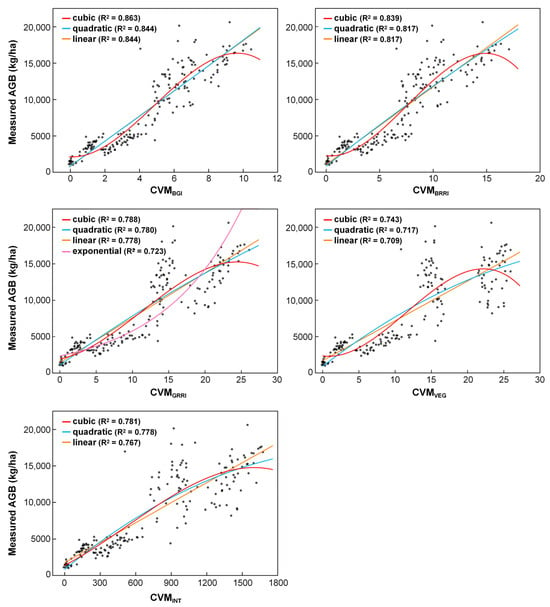
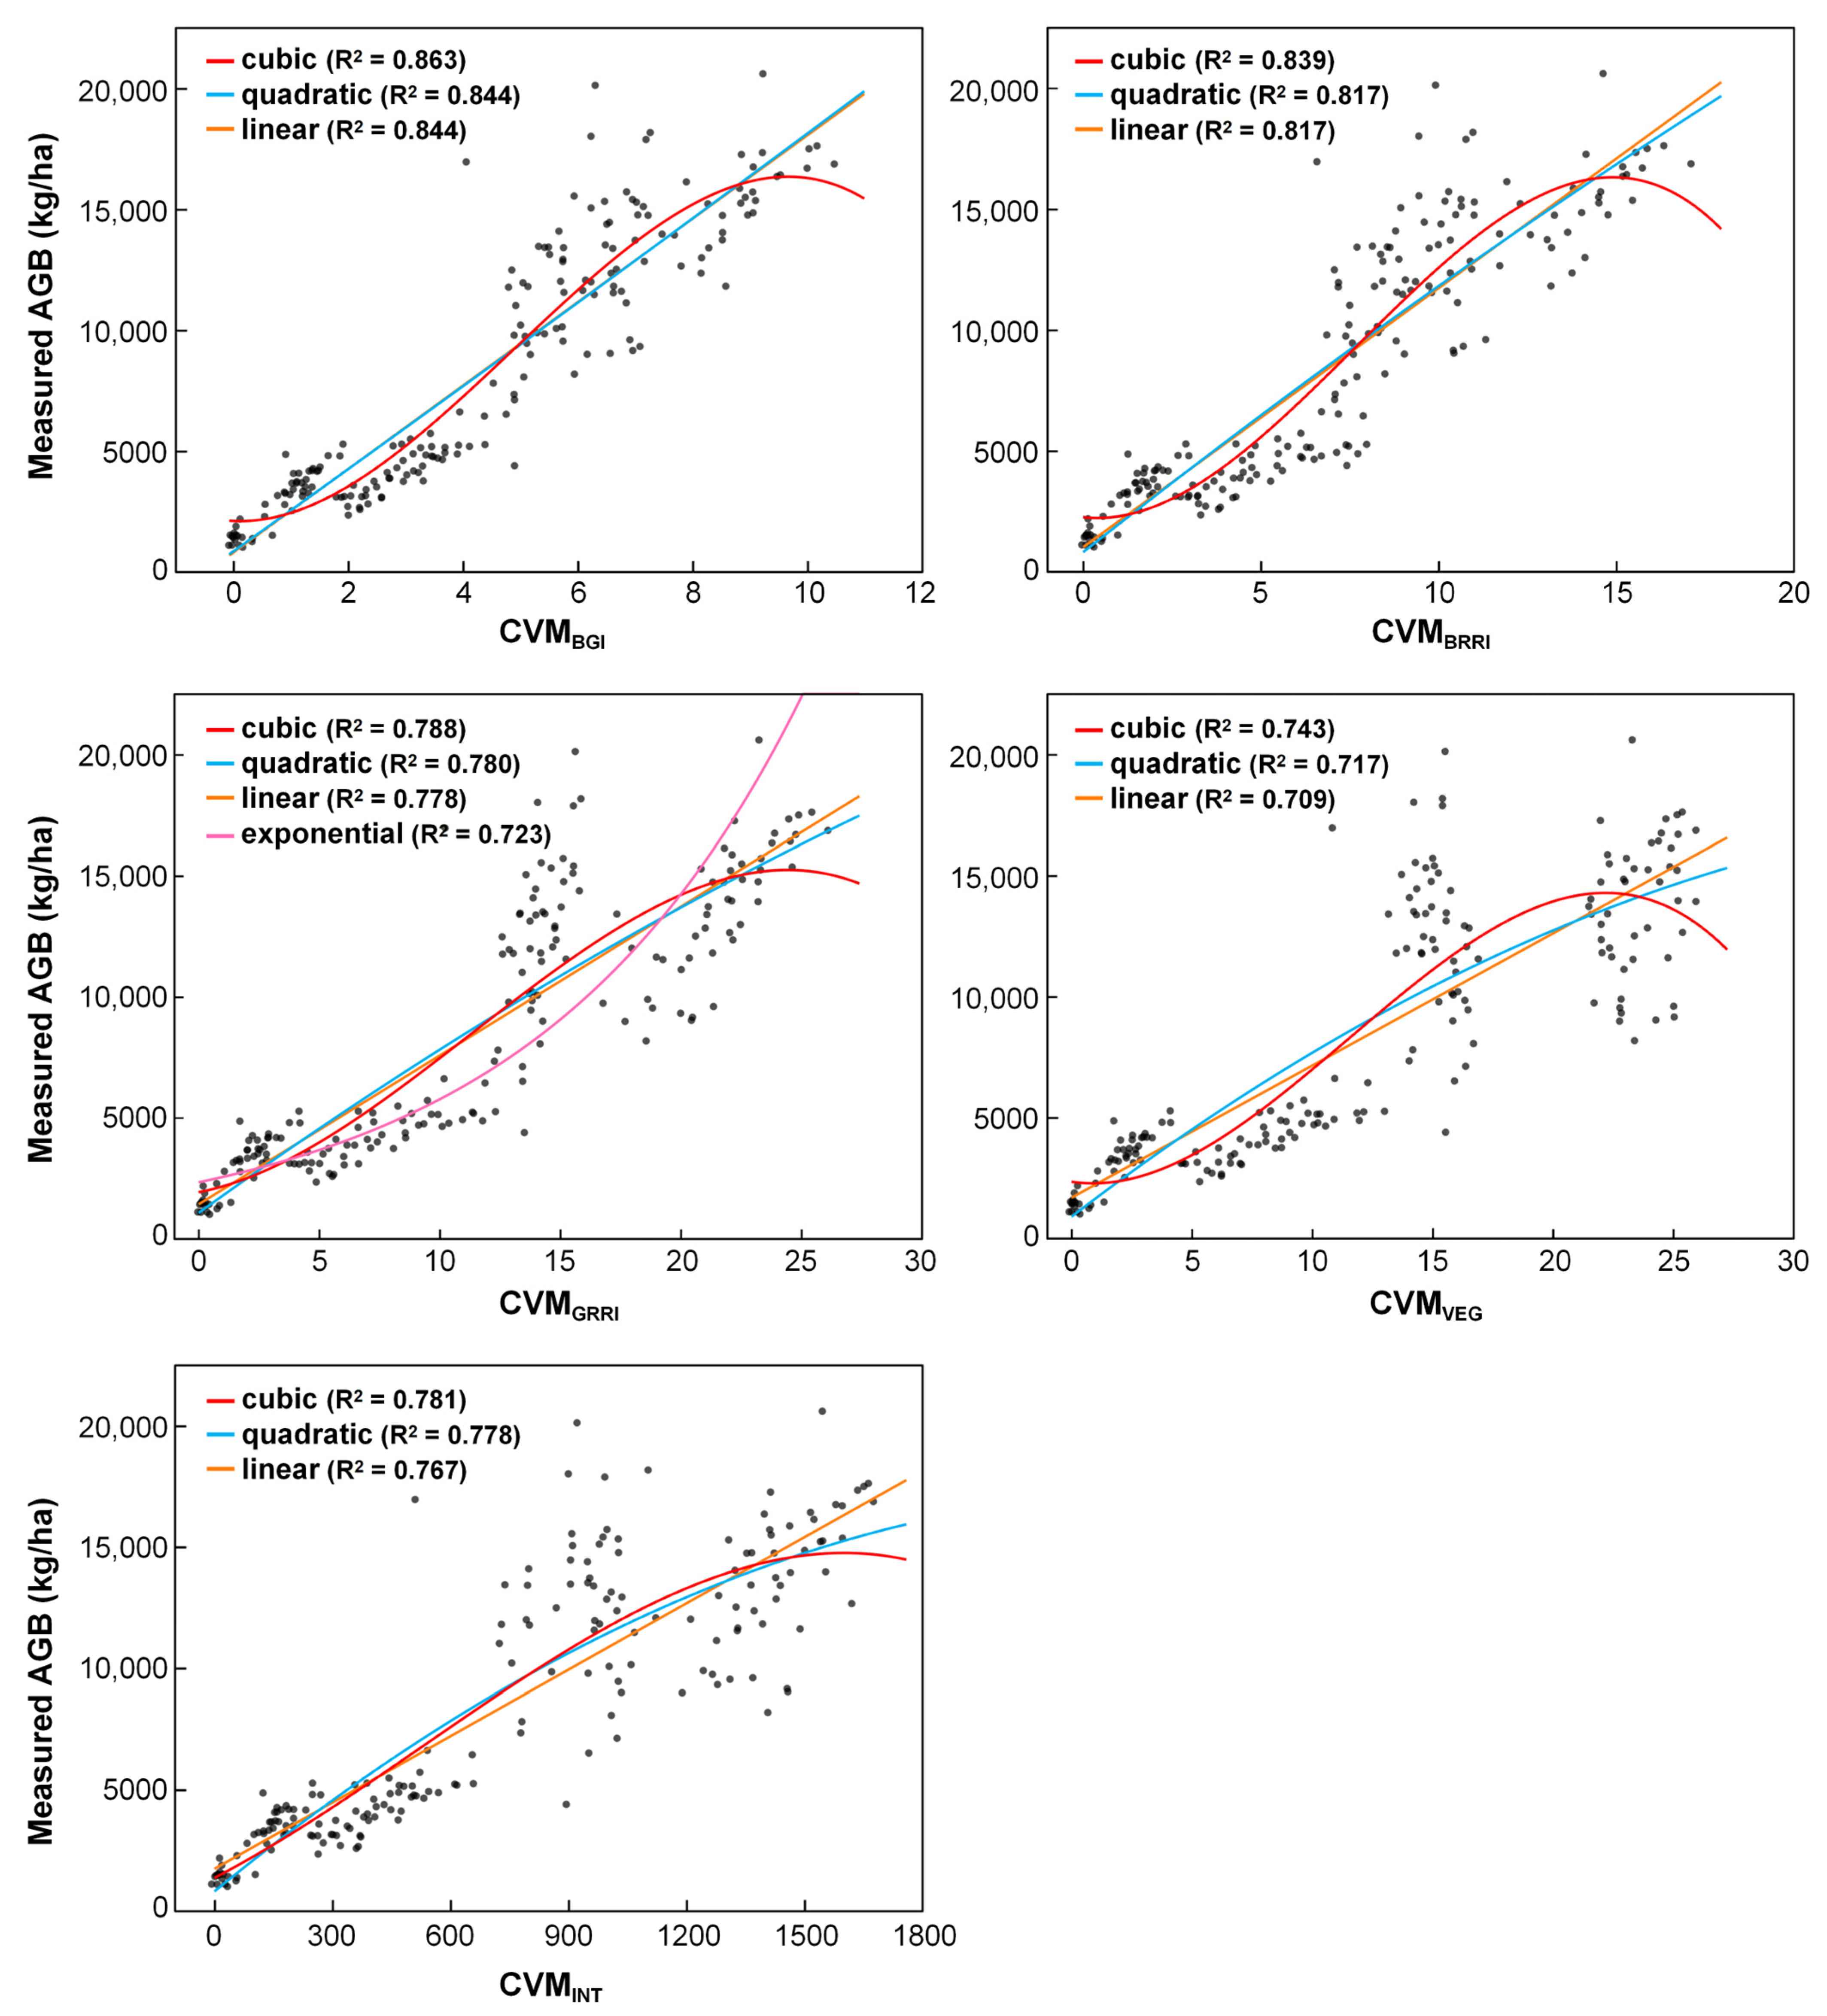
By combining point cloud voxelization treatment and VIs, this study constructed 5 regression models based on CVMBGI, CVMINT, CVMGRRI, CVMBRRI, and CVMVEG from the 45° camera angle data: linear, power, exponential, logarithmic, and polynomial regressions. Figure 5, Figure 6 and Figure 7 list the superior regression models for oilseed rape AGB. Cubic regression model CVMBGI, which was based on the BGI, was the best estimation model in this study (2021–2022: R2 = 0.864, RMSE = 2414.18 kg/ha, RE = 14.8%; 2022–2023: R2 = 0.754, RMSE = 2550.53 kg/ha, RE = 14.9%; 2023–2024: R2 = 0.863, RMSE = 1953.61 kg/ha, RE = 22.9%) (Appendix A, Table A1, Table A2 and Table A3). Models based on the VIs BGI, INT, BRRI, VEG, and GRRI showed superior performance in biomass estimation across the three years, demonstrating the good applicability of these five indices for estimating oilseed rape AGB. Among the regression models with the same voxel size and VI, cubic regression exhibited superior estimation performance compared to other regression models. This may be because oilseed rape grows rapidly during the vegetative growth stage but slows down in later stages. Thus, a cubic equation is more suitable for describing the growth process across the entire growth period.
Figure 5.
Superior estimation models for oilseed rape AGB in 2021–2022.
Figure 6.
Superior estimation models for oilseed rape AGB in 2022–2023.
Figure 7.
Superior estimation models for oilseed rape AGB in 2023–2024.
4. Discussion
4.1. Selection of the UAV Camera Angle and Voxel Size for Estimating Oilseed Rape AGB
This study constructed estimation models for oilseed rape AGB using two UAV camera angles: 45° and 90°. The 45° oblique angle performed significantly better than the 90° vertical angle (p < 0.01), likely because the oblique view captures more side morphological information of the canopy, thereby better reflecting plant height and layer distribution, which are critical for biomass estimation. In contrast, the vertical view is limited to top-of-canopy information and is more susceptible to saturation in dense canopies. This finding is consistent with recent studies on multi-angle UAV remote sensing. For instance, Sun et al. [30] systematically compared five camera angles (30°, 45°, 60°, 90°, and 180° panoramas) over diverse grasslands on the Qinghai-Tibetan Plateau and found that 45° oblique images produced the strongest correlations with aboveground biomass, which aligns well with our optimal angle. Similarly, Lu et al. [31] reported that for winter wheat, oblique angles (especially −60° and −40°) significantly improved the estimation of leaf nitrogen concentration compared to nadir views, highlighting the value of capturing side-view information. However, Khun et al. [32] found that for early-stage corn, a 30° oblique angle gave slightly better biomass estimation than 45°, possibly because corn plants at early stages have a more erect leaf orientation, making 30° sufficient to capture most vertical structure without introducing excessive shadowing. In our study, oilseed rape at the seedling and bolting stages has a relatively open canopy with horizontally oriented leaves, which may explain why a steeper oblique angle (45°) performed best. Our work thus provides stronger statistical evidence for the superiority of oblique photography in crop biomass estimation. Future research should explore a wider range of oblique angles to systematically evaluate their suitability across different growth stages and crop types, and to determine the optimal UAV camera angle for biomass estimation.
For point cloud voxelization, this study compared the following four voxel resolutions: 0.03, 0.05, 0.07, and 0.10 m. The results showed no significant differences in correlation strength among the different voxel sizes, which contrasts with the expectation that smaller voxels would yield stronger correlations. This finding differs from several previous studies. For example, in grapevine canopies, Ferreira et al. [33] reported that envelope-based methods (convex hull, alpha shape) were more sensitive to point density loss than voxel-based grids, and that optimal voxel size increased with flight height (0.15 m at 30 m, 0.20 m at 60 m, and 0.25 m at 100 m), indicating that voxel size should be adapted to point cloud density and canopy structure. Similarly, in shrub studies, Wu et al. [34] proposed a Shrub Structure Index and determined that a voxel edge length of 0.04 m combined with a sampling grid size of 100 provided the lowest estimation error, but they noted that optimal parameters depend on point cloud density and canopy complexity. The insensitivity of voxel size in our oilseed rape study may be attributed to the relatively uniform canopy color, consistent plant height and architecture throughout the growing season, and the dense, homogeneous canopy structure after closure. Under such conditions, the RGB information extracted from different voxel resolutions remains similar, thus weakening the effect of voxel size on estimation performance. Nevertheless, compared to the original dense point cloud data, voxelized data significantly reduced data volume, greatly improved processing efficiency, and maintained correlation strength. For instance, using a 0.1–m voxel reduced processing time by over 50% compared to the original point cloud. This reduction in computational cost is consistent with the findings of Lecigne et al. [11], who noted that larger voxels offer advantages in handling occlusion and reducing computation time. Our study demonstrates that for oilseed rape, voxel sizes up to 0.1 m can be used without sacrificing estimation performance, which is particularly beneficial for large-scale, multi-temporal crop monitoring where computational efficiency is a priority. While Ferreira et al. [33] emphasized the need for voxel size tuning based on point density, our results show that for a relatively uniform crop canopy like oilseed rape, a single larger voxel size (0.1 m) can be applied across different growth stages without significant performance loss, greatly simplifying practical application. Therefore, point cloud voxelization is considered a feasible and practical approach for crop biomass estimation. For practical applications, larger voxel sizes can be selected to speed up processing without weakening estimation performance, meeting the demands of large-scale, multi-temporal crop monitoring.
4.2. Analysis of the Effectiveness of Models Constructed from Point Cloud Voxelization and Vegetation Indices for Estimating Oilseed Rape AGB
Three years of field experimental data consistently showed strong correlations between estimated and measured AGB across the entire growth period using point cloud voxelization combined with vegetation indices, confirming the stability and applicability of this approach under different years and agronomic treatments (varieties, densities, sowing dates). The CVMVI approach performed well, with CVMBGI giving the highest R2 and lowest RMSE and RE in both linear and nonlinear regressions. Our results are comparable to or better than those reported in similar studies. For example, Maimaitijiang et al. [9] achieved an R2 of 0.893 for soybean AGB estimation using a similar CVMVI framework with RGB imagery, but they did not incorporate voxelization and thus required processing dense point clouds, which is computationally intensive. In contrast, our method reduces data volume by more than 50% using 0.1–m voxelization while maintaining comparable accuracy. Similarly, Zhang et al. [3] reported a validation correlation coefficient of 0.752 for rapeseed biomass using a crop volume model without VI weighting, whereas our CVMBGI method achieved higher accuracy, highlighting the value of incorporating spectral information. Yue et al. [8] combined RGB and hyperspectral data with Random Forest regression and reported high accuracy (R2 = 0.96, RMSE = 0.57 t/ha) for winter wheat AGB, but their method requires expensive hyperspectral sensors and lacks the efficiency gains from voxelization. Our approach thus offers a favorable trade-off between cost, computational demand, and estimation performance. These results indicate that integrating point cloud voxelization with weighted VIs is a promising low-cost, non-destructive method for biomass assessment, with the potential to replace manual destructive sampling, reduce labor and time costs, and support real-time growth monitoring and precision field management in oilseed rape.
4.3. Limitations and Future Research Directions
However, this study also identified limitations during later growth stages. From the podding stage to maturity, issues such as leaf overlap and plant lodging complicate the canopy structure, reducing the ability of point clouds to reflect the true canopy volume and leading to weaker correlations between estimated and measured biomass. Consequently, the estimation model used in this study is not suitable under lodging conditions. Future research should address these challenges by exploring strategies such as dynamically correcting canopy volume using multi–temporal point cloud data or introducing lodging detection algorithms to identify and exclude lodged areas, thereby improving model robustness under complex growth conditions.
Another limitation is that this study employed only traditional statistical regression models (linear, polynomial, exponential, power, and logarithmic) based on RGB imagery. Traditional regression models are simple and easy to interpret, and they can clearly describe the relationship between CVMVI and AGB, which is particularly valuable for understanding physiological mechanisms. Moreover, they require no complex parameter tuning and offer high computational efficiency. Under the current experimental conditions, the regression model already achieved high accuracy, demonstrating the feasibility of the proposed method. Nevertheless, it is important to acknowledge the advantages of machine learning methods such as random forest and support vector regression. These approaches can inherently capture complex nonlinear interactions and higher-order dependencies without pre-specifying model forms, and they tend to generalize better when trained on larger, more heterogeneous datasets.
In addition, multispectral or hyperspectral sensors can acquire near-infrared and red-edge bands that are more sensitive to vegetation physiological status, such as chlorophyll content, nitrogen status, and water stress—factors that are critical for biomass accumulation but cannot be fully captured by RGB bands alone. Furthermore, RGB-based vegetation indices are sensitive to illumination conditions. Although all images were acquired under sunny, cloudless conditions between 10:00 and 15:00 to minimize illumination variability, radiometric correction was not applied. Different acquisition times within this time window may still introduce subtle changes in solar elevation and reflectance, potentially affecting the consistency of vegetation indices and consequently the correlation strength. For practical scalability, radiometric calibration is recommended to ensure cross-comparability of spectral indices. Alternatively, the use of multispectral or hyperspectral sensors, which typically incorporate built-in radiometric calibration and are less affected by illumination changes, can mitigate this limitation while providing richer spectral information. Therefore, the combination of machine learning algorithms with rich multispectral or hyperspectral features holds great promise for further improving biomass correlation strength and robustness.
Future research should consider collecting larger and more diverse datasets across multiple growth conditions and sites, and systematically evaluate machine learning models using multispectral or hyperspectral UAV platforms. Such an approach would enable the construction of estimation models that better reflect the growth status of oilseed rape across different growth stages and environmental conditions, while also addressing the current limitations related to spectral saturation and canopy complexity.
Regarding voxelization, although the current results showed no significant effect of voxel size on the strength of the empirical relationship, whether this conclusion applies to other crops, other growth conditions, or other sensor data remains to be verified. Further studies are needed to explore the performance of finer voxel resolutions in biomass estimation for different crop types and environments, seeking an optimal balance between relationship strength and analysis time.
5. Conclusions
To develop a low-cost, non-destructive approach for assessing oilseed rape AGB, this study utilized UAV RGB imagery, extracted 20 VIs, and constructed the CVMVI with point cloud voxelization. Correlation analysis was performed with the measured AGB at different growth stages, and the estimation performance was evaluated using R2, RMSE, and RE. The following results were obtained:
- (1)
- The 45° camera angle gave stronger correlations than the 90° angle under the same processing conditions, making it the preferred angle for oilseed rape AGB assessment.
- (2)
- Correlation coefficients between the estimated and measured AGB exceeded 0.80 for all voxelization treatments across the full growth period, confirming the strong agreement of this approach. The correlation between the estimated and measured AGB at the seedling stage was better than that at other stages in the same year, mainly due to increasing canopy overlap and lodging.
- (3)
- Five VIs, namely, BGI, INT, BRRI, VEG, and GRRI, showed good suitability for relating CVMVI to AGB across different agronomic conditions. Under the 45° camera angle, the combination of CVMBGI and a 0.1–m voxel size analyzed by cubic regression, provided the most practical balance between estimation performance and analysis time, and is therefore recommended. Among regression forms tested with the same voxel size and VI, cubic regression gave the strongest agreement between estimated and measured AGB.
The proposed method uses only consumer-grade UAVs and standard RGB cameras, which are affordable and easy to operate. It eliminates the need for expensive multispectral or LiDAR equipment and substantially reduces the labor and time costs associated with traditional destructive sampling. By providing rapid, non-destructive, field-scale biomass estimates, this approach enables farmers to monitor crop growth in real time and make informed management decisions, ultimately improving both yield and resource use efficiency.
Author Contributions
Conceptualization, W.G.; methodology, B.B. and T.C.; software, T.C.; formal analysis, Y.W.; investigation, Y.M., J.S., Q.Z., S.F., Y.L., H.S. and Q.W.; resources, J.Y.; data curation, T.C.; writing—original draft preparation, B.B.; writing—review and editing, B.B. and W.G.; visualization, B.B.; supervision, W.G.; project administration, W.G. and J.Y.; funding acquisition, W.G. and J.Y. All authors have read and agreed to the published version of the manuscript.
Funding
This research was supported by Sichuan Agricultural Innovation Team (SCCXTD-2026-3), Key Research and Development Support Program of Chengdu (2025-YF09-00021-SN, 2024-YF09-00036-SN).
Data Availability Statement
The data presented in this study are available upon request from the corresponding author.
Conflicts of Interest
The authors declare no conflicts of interest.
Appendix A
Table A1.
Validation statistics of regression models for AGB estimation in 2021–2022.
Table A2.
Validation statistics of regression models for AGB estimation in 2022–2023.
Table A3.
Validation statistics of regression models for AGB estimation in 2023–2024.
References
- National Bureau of Statistics. China Statistical Yearbook. 2024. Available online: http://www.stats.gov.cn/sj/ndsj/2024/indexch.htm (accessed on 4 March 2026).
- Li, G.C.; Niu, Q.C.; Leng, B.F.; Ding, Y.F.; Tong, T.; Fan, L.X. The decade of rapeseed industry in the new era: Development and its path choice. Chin. J. Oil Crop Sci. 2024, 46, 228–235. [Google Scholar] [CrossRef]
- Zhang, J.; Xie, T.J.; Wei, X.N.; Wang, Z.K.; Liu, C.T.; Zhou, G.S.; Wang, B. Estimation of feed rapeseed biomass based on multi-angle oblique imaging technique of unmanned aerial vehicle. Acta Agron. Sin. 2021, 47, 1816–1823. [Google Scholar] [CrossRef] [Scilit]
- Wang, C.F. Rapeseed LAI Estimation Based on UAV Multi-Source Remote Sensing Data. Master’s Thesis, Huazhong Agricultural University, Wuhan, China, 2020. [Google Scholar] [CrossRef]
- Dong, Z.Y.; Lv, S.Q.; Wei, Y.X.; Zhu, Y.W.; Meng, X.X. Estimation of rapeseed aboveground biomass based on UAV multi-spectral remote sensing. South China Agric. 2024, 18, 172–177. [Google Scholar] [CrossRef]
- Wang, H.; Xiang, Y.Z.; Li, W.Y.; Shi, H.Z.; Wang, X.; Zhao, X. Estimation of winter rapeseed aboveground biomass based on UAV multi-spectral remote sensing. Trans. Chin. Soc. Agric. Mach. 2023, 54, 218–229. [Google Scholar] [CrossRef]
- Tao, H.L.; Xu, L.J.; Feng, H.K.; Yang, G.J.; Yang, X.D.; Miao, M.K.; Dai, Y. Estimation of plant height and biomass of winter wheat based on UAV digital image. Trans. Chin. Soc. Agric. Eng. 2019, 35, 107–116. [Google Scholar] [CrossRef]
- Yue, J.B.; Feng, H.K.; Jin, X.L.; Yuan, H.H.; Li, Z.H.; Zhou, C.Q.; Yang, G.J.; Tian, Q.J. A comparison of crop Parameters estimation using images from UAV-mounted snapshot hyper spectral sensor and high-definition digital camera. Remote Sens. 2018, 10, 1138. [Google Scholar] [CrossRef] [Scilit]
- Maimaitijiang, M.; Sagan, V.; Sidike, P.; Maimaitiyiming, M.; Hartling, S.; Peterson, K.T.; Maw, M.J.W.; Shakoor, N.; Mockler, T.; Fritschi, F.B. Vegetation index weighted canopy volume model (CVMVI) for soybean biomass estimation from unmanned aerial system-based RGB imagery. ISPRS J. Photogramm. 2019, 151, 27–41. [Google Scholar] [CrossRef] [Scilit]
- Chen, J.J. Research on Building Segmentation Algorithm Based on 3D Point Cloud. Master’s Thesis, Anhui Jianzhu University, Hefei, China, 2023. [Google Scholar] [CrossRef]
- Lecigne, B.; Delagrange, S.; Messier, C. Exploring trees in three dimensions: VoxR, a novel voxel-based R package dedicated to analysing the complex arrangement of tree crowns. Ann. Bot. 2018, 121, 589–601. [Google Scholar] [CrossRef] [Scilit] [PubMed]
- Deng, Y.B.; Yu, K.Y.; Yao, X.; Xie, Q.Y.; Hsieh, Y.; Liu, J. Estimation of pinus massoniana leaf area using terrestrial laser scanning. Forests. 2019, 10, 660. [Google Scholar] [CrossRef] [Scilit]
- Rodríguez-Lozano, B.; Rodríguez-Caballero, E.; Maggioli, L.; Cantón, Y. Non-destructive biomass estimation in mediterranean alpha steppes: Improving traditional methods for measuring dry and green fractions by combining proximal remote sensing tools. Remote Sens. 2021, 13, 2970. [Google Scholar] [CrossRef] [Scilit]
- Zhou, L.F.; Jin, S.Y.; Xu, X.W.; Wang, Y.X.; Xu, L.L.; Chen, M.Q.; Tian, J.R.; Liu, H.L.; Meng, R. Monitoring of pine wilt disease based on UAV remote sensing and machine learning. Remote Sens. Technol. Appl. 2025, 40, 520–531. [Google Scholar] [CrossRef]
- Huang, Y.Y. Estimation of Chlorophyll Content in Brassica napus Based on Unmanned Aerial Vehicle Images. Master’s Thesis, Wuhan Polytechnic University, Wuhan, China, 2023. [Google Scholar] [CrossRef]
- Ahmad, I.S.; Reid, J.F. Evaluation of colour representations for maize images. J. Agric. Eng. Res. 1995, 63, 185–195. [Google Scholar] [CrossRef] [Scilit]
- Tucker, C.J. Red and photographic infrared linear combinations for monitoring vegetation. Remote Sens. Environ. 1979, 8, 127–150. [Google Scholar] [CrossRef] [Scilit]
- Nie, S.; Wang, C.; Dong, P.L.; Xi, X.H.; Luo, S.Z.; Zhou, H.Y. Estimating leaf area index of maize using airborne discrete-return LiDAR data. IEEE J. Sel. Top. Appl. Earth Obs. Remote Sens. 2016, 9, 3259–3266. [Google Scholar] [CrossRef] [Scilit]
- Bendig, J.; Yu, K.; Aasen, H.; Bolten, A.; Bennertz, S.; Broscheit, J.; Gnyp, M.L.; Bareth, G. Combining UAV-based plant height from crop surface models, visible, and near infrared vegetation indices for biomass monitoring in barley. Int. J. Appl. Earth Obs. 2015, 39, 79–87. [Google Scholar] [CrossRef] [Scilit]
- Woebbecke, D.M.; Meyer, G.E.; Bargen, K.V.; Mortensen, D.A. Color indices for weed identification under various soil, residue, and lighting conditions. Trans. ASAE 1995, 38, 259–269. [Google Scholar] [CrossRef] [Scilit]
- Kawashima, S.; Nakatani, M. An algorithm for estimating chlorophyll content in leaves using a video camera. Ann. Bot. 1998, 81, 49–54. [Google Scholar] [CrossRef] [Scilit]
- Louhaichi, M.; Borman, M.M.; Johnson, D.E. Spatially located platform and aerial photography for documentation of grazing impacts on wheat. Geocarto Int. 2001, 16, 65–70. [Google Scholar] [CrossRef] [Scilit]
- Gitelson, A.A.; Kaufman, Y.J.; Stark, R.; Rundquist, D. Novel algorithms for remote estimation of vegetation fraction. Remote Sens. Environ. 2002, 80, 76–87. [Google Scholar] [CrossRef] [Scilit]
- Meyer, G.E.; Neto, J.C. Verification of color vegetation indices for automated crop imaging applications. Comput. Electron. Agric. 2008, 63, 282–293. [Google Scholar] [CrossRef] [Scilit]
- Guijarro, M.; Pajares, G.; Riomoros, I.; Herrera, P.J.; Burgos-Artizzu, X.P.; Ribeiro, A. Automatic segmentation of relevant textures in agricultural images. Comput. Electron. Agric. 2010, 75, 75–83. [Google Scholar] [CrossRef] [Scilit]
- Torres-Sánchez, J.; Peña, J.M.; Castro, A.D.; López-Granados, F. Multi-temporal mapping of the vegetation fraction in early-season wheat fields using images from UAV. Comput. Electron. Agric. 2014, 103, 104–113. [Google Scholar] [CrossRef] [Scilit]
- Hague, T.; Tillett, N.D.; Wheeler, H. Automated crop and weed monitoring in widely spaced cereals. Precis. Agric. 2006, 7, 21–32. [Google Scholar] [CrossRef] [Scilit]
- Saberioon, M.M.; Amin, M.S.M.; Anuar, A.R.; Gholizadeh, A.; Wayayok, A.; Khairunniza-Bejo, S. Assessment of rice leaf chlorophyll content using visible bands at different growth stages at both the leaf and canopy scale. Int. J. Appl. Earth Obs. 2014, 32, 35–45. [Google Scholar] [CrossRef] [Scilit]
- Kataoka, T.; Kaneko, T.; Okamoto, H.; Hata, S. Crop growth estimation system using machine vision. In Proceedings of the 2003 IEEE/ASME International Conference on Advanced Intelligent Mechatronics (AIM 2003), Kobe, Japan, 20–24 July 2003. [Google Scholar] [CrossRef] [Scilit]
- Sun, F.D.; Chen, D.W.; Li, L.H.; Zhang, Q.Q.; Yuan, X.; Liao, Z.H.; Xiang, C.L.; Liu, L.; Zhou, J.Q.; Shrestha, M.; et al. Machine Learning Models Based on UAV Oblique Images Improved Above-Ground Biomass Estimation Accuracy Across Diverse Grasslands on the Qinghai-Tibetan Plateau. Land Degrad. Dev. 2024, 36, 585–598. [Google Scholar] [CrossRef] [Scilit]
- Lu, N. Monitoring Aboveground Biomass and Nitrogen Nutrition in Winter Wheat with Multi-Angular Imagery from Unmanned Aerial Vehicles. Ph.D. Thesis, Nanjing Agricultural University, Nanjing, China, 2020. [Google Scholar] [CrossRef]
- Khun, K.; Tremblay, N.; Panneton, B.; Vigneault, P.; Lord, E.; Cavayas, F.; Codjia, C. Use of Oblique RGB Imagery and Apparent Surface Area of Plants for Early Estimation of Above-Ground Corn Biomass. Remote Sens. 2021, 13, 4032. [Google Scholar] [CrossRef] [Scilit]
- Ferreira, L.; Marques, P.; Peres, E.; Morais, R.; Sousa, J.J.; Pádua, L. Grapevine Canopy Volume Estimation from UAV Photogrammetric Point Clouds at Different Flight Heights. Remote Sens. 2026, 18, 409. [Google Scholar] [CrossRef] [Scilit]
- Wu, J.M.; Wang, Y.X.; Hong, L.; Sun, B.; He, Z.P.; Li, Z.J.; Ma, Z.J. A novel UAV lidar-derived shrub structural index for estimating above-ground biomass. Remote Sens. Environ. 2026, 334, 115189. [Google Scholar] [CrossRef] [Scilit]

Disclaimer/Publisher’s Note: The statements, opinions and data contained in all publications are solely those of the individual author(s) and contributor(s) and not of MDPI and/or the editor(s). MDPI and/or the editor(s) disclaim responsibility for any injury to people or property resulting from any ideas, methods, instructions or products referred to in the content. |
© 2026 by the authors. Licensee MDPI, Basel, Switzerland. This article is an open access article distributed under the terms and conditions of the Creative Commons Attribution (CC BY) license.