


Highlights
What are the main findings?
- Quadruple Collocation Analysis (QCA) provides reliable error estimates for global evapotranspiration (ET) products.
- Integrating QCA with a Random Forest model successfully resolves algorithmic non-convergence, yielding spatially seamless global ET error maps with an exceptionally low mean prediction error of approximately 0.03 mm/day.
What are the implications of the main findings?
- The seamless error reconstruction redefines the global map of product with the lowest estimated collocation error, with the lowest random uncertainty, demonstrating that after spatial gap-filling, the coverage of ERA5 exhibiting the minimum QCA-estimated error increased from approximately 45% to 48% of the land surface (mainly in tropics and mid-to-high latitudes), while the coverage of GLEAM demonstrating the lowest random error variance expanded from roughly 28% to 30% (particularly in arid and glaciated regions).
- The spatially explicit error characteristics offer direct and quantitative pixel-level guidance and useful geographic guidance for optimizing multi-source data merging and land data assimilation frameworks in future hydrological studies.
Abstract
Accurate estimation of global terrestrial evapotranspiration (ET) is fundamental for understanding the Earth’s water and energy cycles, yet existing multi-source ET products inevitably contain uncertainties that require spatially explicit characterization for optimal data merging or data assimilation. While Quadruple Collocation Analysis (QCA) offers a robust and reference-free approach to quantify uncertainties, its reliability in the ET discipline remains underexplored, and algorithmic non-convergence frequently results in substantial spatial data gaps. To address these limitations, this study evaluated the accuracy of the QCA method using validation errors derived from high-quality FLUXNET sites (N = 55). Moreover, we employed a Random Forest (RF) framework that is driven by 17 environmental variables to generate spatially seamless error maps for four mainstream ET products, i.e., ERA5, GLDAS, GLEAM, and MERRA2, from 2000 to 2020. Results demonstrate that QCA-based errors strongly correlated with ground-based errors as Pearson’s correlation coefficient was >0.3 for all four ET products. Furthermore, the RF model successfully reconstructed the spatial gaps in QCA errors, achieving an exceptionally low mean prediction error of approximately 0.03 mm/day. Based on these seamless maps, the global mean ET error is estimated at roughly 0.3 mm/day, with pronounced high-error clusters emerging in regions such as central Canada and northern Argentina driven by underlying land cover heterogeneity. Ultimately, this seamless gap-filling redefined the global map of product with the lowest estimated collocation error. ERA5 emerged as the superior choice across approximately 45% of the land surface (predominantly in the tropics and mid-to-high latitudes). Meanwhile, before algorithmic gap-filling, GLEAM was optimal across approximately 28% of the valid land pixels; after spatial gap-filling, it proved most effective across approximately 30% of the globe, particularly within arid deserts and glaciated regions. Our work provides useful geographic guidance for optimizing multi-source data merging and land data assimilation frameworks in future global hydrological studies.
1. Introduction
Evapotranspiration (ET) is a pivotal physical variable governing the transfer of water and energy from the land surface to the atmosphere. It intrinsically links the Earth’s water cycle, energy balance, and carbon dynamics, making its accurate estimation fundamental for global climate change research, drought monitoring, and agricultural water management [1]. However, constrained by satellite sensor limitations and the inherent uncertainties in forcing data and retrieval algorithms, existing satellite-derived ET estimates, land surface model simulations, and reanalysis products inevitably contain uncertainties [2]. A comprehensive understanding of these error characteristics is therefore crucial for optimally merging multi-source ET products and effectively assimilating them into land surface models [3]. While collocation analysis has emerged as a viable and reference-free approach for estimating product uncertainties [4], its evaluation reliability within the ET discipline requires further systematic investigation. Furthermore, the generation of spatially seamless global ET error maps remains a critical gap in current literature.
Currently, the quantification of uncertainties in global ET products predominantly relies on two methodological frameworks, i.e., direct validation against in situ measurements and collocation analysis. Traditional site-based validation typically employs observations derived from eddy covariance towers as the empirical “ground truth”. Although these in situ datasets are widely regarded as high-quality benchmarks, their remarkably sparse and uneven global distribution restricts their utility to localized accuracy assessments, rendering them inadequate for comprehensive global validations [5]. In contrast, Triple/Quadruple Collocation Analysis (TCA/QCA) techniques circumvent this spatial limitation by formulating mathematical relationship models among multiple independent ET products and the underlying unknown true ET signal.
Currently, the application of TCA and QCA methods has been predominantly concentrated in the soil moisture domain [6], with comparatively limited adoption in evapotranspiration (ET) research. Since Scipal et al. [7] pioneered the use of TCA for soil moisture error estimation [7], the technique has been extensively deployed to characterize soil moisture uncertainties at both global [8,9,10] and regional scales such as Western Europe [11], China [12], and the United States [13]. Concurrently, several studies have corroborated the reliability of TCA/QCA-derived errors through rigorous ground-based site validations [10,12,14,15,16]. In contrast, the integration of TCA/QCA frameworks into the ET discipline has lagged behind soil moisture research by approximately a decade. Khan et al. [15] first introduced TCA to the ET discipline to evaluate the error characteristics of MODIS (Moderate Resolution Imaging Spectroradiometer), GLEAM (Global Land Evapotranspiration Amsterdam Model), and GLDAS (Global Land Data Assimilation System) products across Asia [15]. To date, TCA/QCA techniques have been maturely utilized for uncertainty quantification in multi-source data merging studies at various spatial scales, spanning the United States [16], Northern Europe [17], China [3,18], and globally [3,4,19]. Notably, empirical evaluations of TCA/QCA reliability within the ET domain using in situ observations remain exceedingly scarce, with only a single study documented thus far [19]. Furthermore, the stringent quality control applied to the FLUXNET data utilized by Li et al. [20] constrained their TCA accuracy assessment to specific and discontinuous temporal periods. Recently, Li et al. [20] developed a robust gap-filling and prolongation framework to generate a high-quality and temporally continuous global ET reference dataset, offering crucial empirical support for comprehensive product evaluations. Despite this significant advancement, no existing literature has yet leveraged this continuous benchmark dataset to systematically validate the accuracy of TCA/QCA-estimated ET errors.
However, TCA- or QCA-based error estimates may fail to converge, e.g., producing negative variance values, due to the violation of their underlying statistical assumptions, such as error independence, orthogonality, and stationarity [19]. This algorithmic non-convergence inevitably leads to spatial data gaps in actual ET error estimates, particularly over regions with limited availability of samples or pronounced spatial heterogeneity [21]. Machine learning has emerged as a highly effective solution to fundamentally resolve this challenge [22]. Recently, researchers have successfully harnessed machine learning techniques to reconstruct spatial gaps in TCA/QCA-derived soil moisture errors, thereby generating spatially seamless error maps [22,23,24,25]. Nevertheless, these gap-filling efforts have been exclusively confined to the soil moisture domain. To date, no studies have integrated machine learning algorithms with TCA/QCA frameworks to derive globally seamless ET error maps yet.
To address these critical research gaps, this study leveraged the high-quality and temporally continuous in situ ET dataset developed by Li et al. [20] to systematically validate the reliability of the QCA method within the ET domain. Subsequently, a Random Forest (RF) machine learning framework was employed to reconstruct the non-converged spatial gaps inherent in QCA, thereby generating globally seamless ET error maps for four mainstream products including ERA5, GLDAS, GLEAM, and MERRA2. Specifically, our work aims to address the following two primary objectives: (i) to rigorously validate the evaluation efficacy of the QCA method against ground-based benchmarks (Section 3.1), and (ii) to generate and comprehensively analyze spatially seamless error characteristics for the evaluated ET products (Section 3.2). Ultimately, this research offers critical insights into the spatiotemporal dynamics of global ET uncertainties, providing a foundational geographic blueprint for optimizing multi-source data merging and land data assimilation frameworks.
2. Data and Methodology
2.1. ET Products
In this study, four mainstream global ET products, i.e., ERA5, GLDAS (v2.1 Nosh-based), MERRA2, and GLEAM (version 4.2a), were selected for the period from 1 January 2000 to 31 December 2020. Specifically, ERA5 is the fifth-generation atmospheric reanalysis dataset developed by the European Centre for Medium-Range Weather Forecasts (ECMWF) using advanced data assimilation techniques [26] (available at https://cds.climate.copernicus.eu/). GLDAS (Version 2.1) is generated by the Noah land surface model driven by meteorological forcing data [27] (available via NASA GES DISC at https://disc.gsfc.nasa.gov/). GLEAM was jointly developed by Vrije Universiteit Amsterdam, Ghent University, and the European Space Agency (ESA) using high-resolution satellite and meteorological data. It estimates ET based on the Priestley-Taylor equation and optimizes physical mechanisms such as rainfall interception and soil moisture stress [28,29] (available at https://www.gleam.eu/). MERRA2 is an atmospheric reanalysis dataset produced by NASA using the GEOS-5 model, which assimilated vast amounts of conventional meteorological observations, satellite radiances, and global aerosol data via 3D-Var assimilation techniques [30] (available at https://disc.gsfc.nasa.gov/). All datasets were accessed on 18 April 2026, in addition, we utilize MATLAB (v2024) for data processing and analysis, and ArcGIS (v10.8) and Origin (v2024) for plotting and analysis.
To coordinate the spatiotemporal resolutions across the four ET products, spatial and temporal processing was considered. To match the ERA5 dataset, all ET products were temporally aggregated to a daily scale with a unified unit of mm/day and spatially resampled to align with the corresponding ERA5 grid cells.
2.2. Land Cover Type and FLUXNET Observations
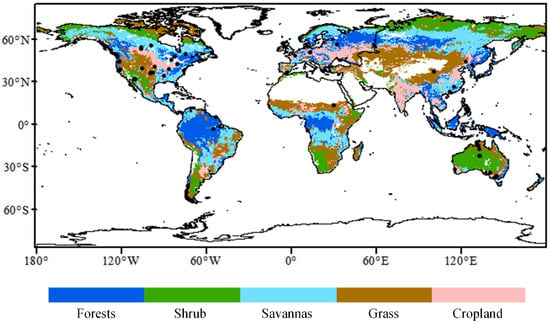
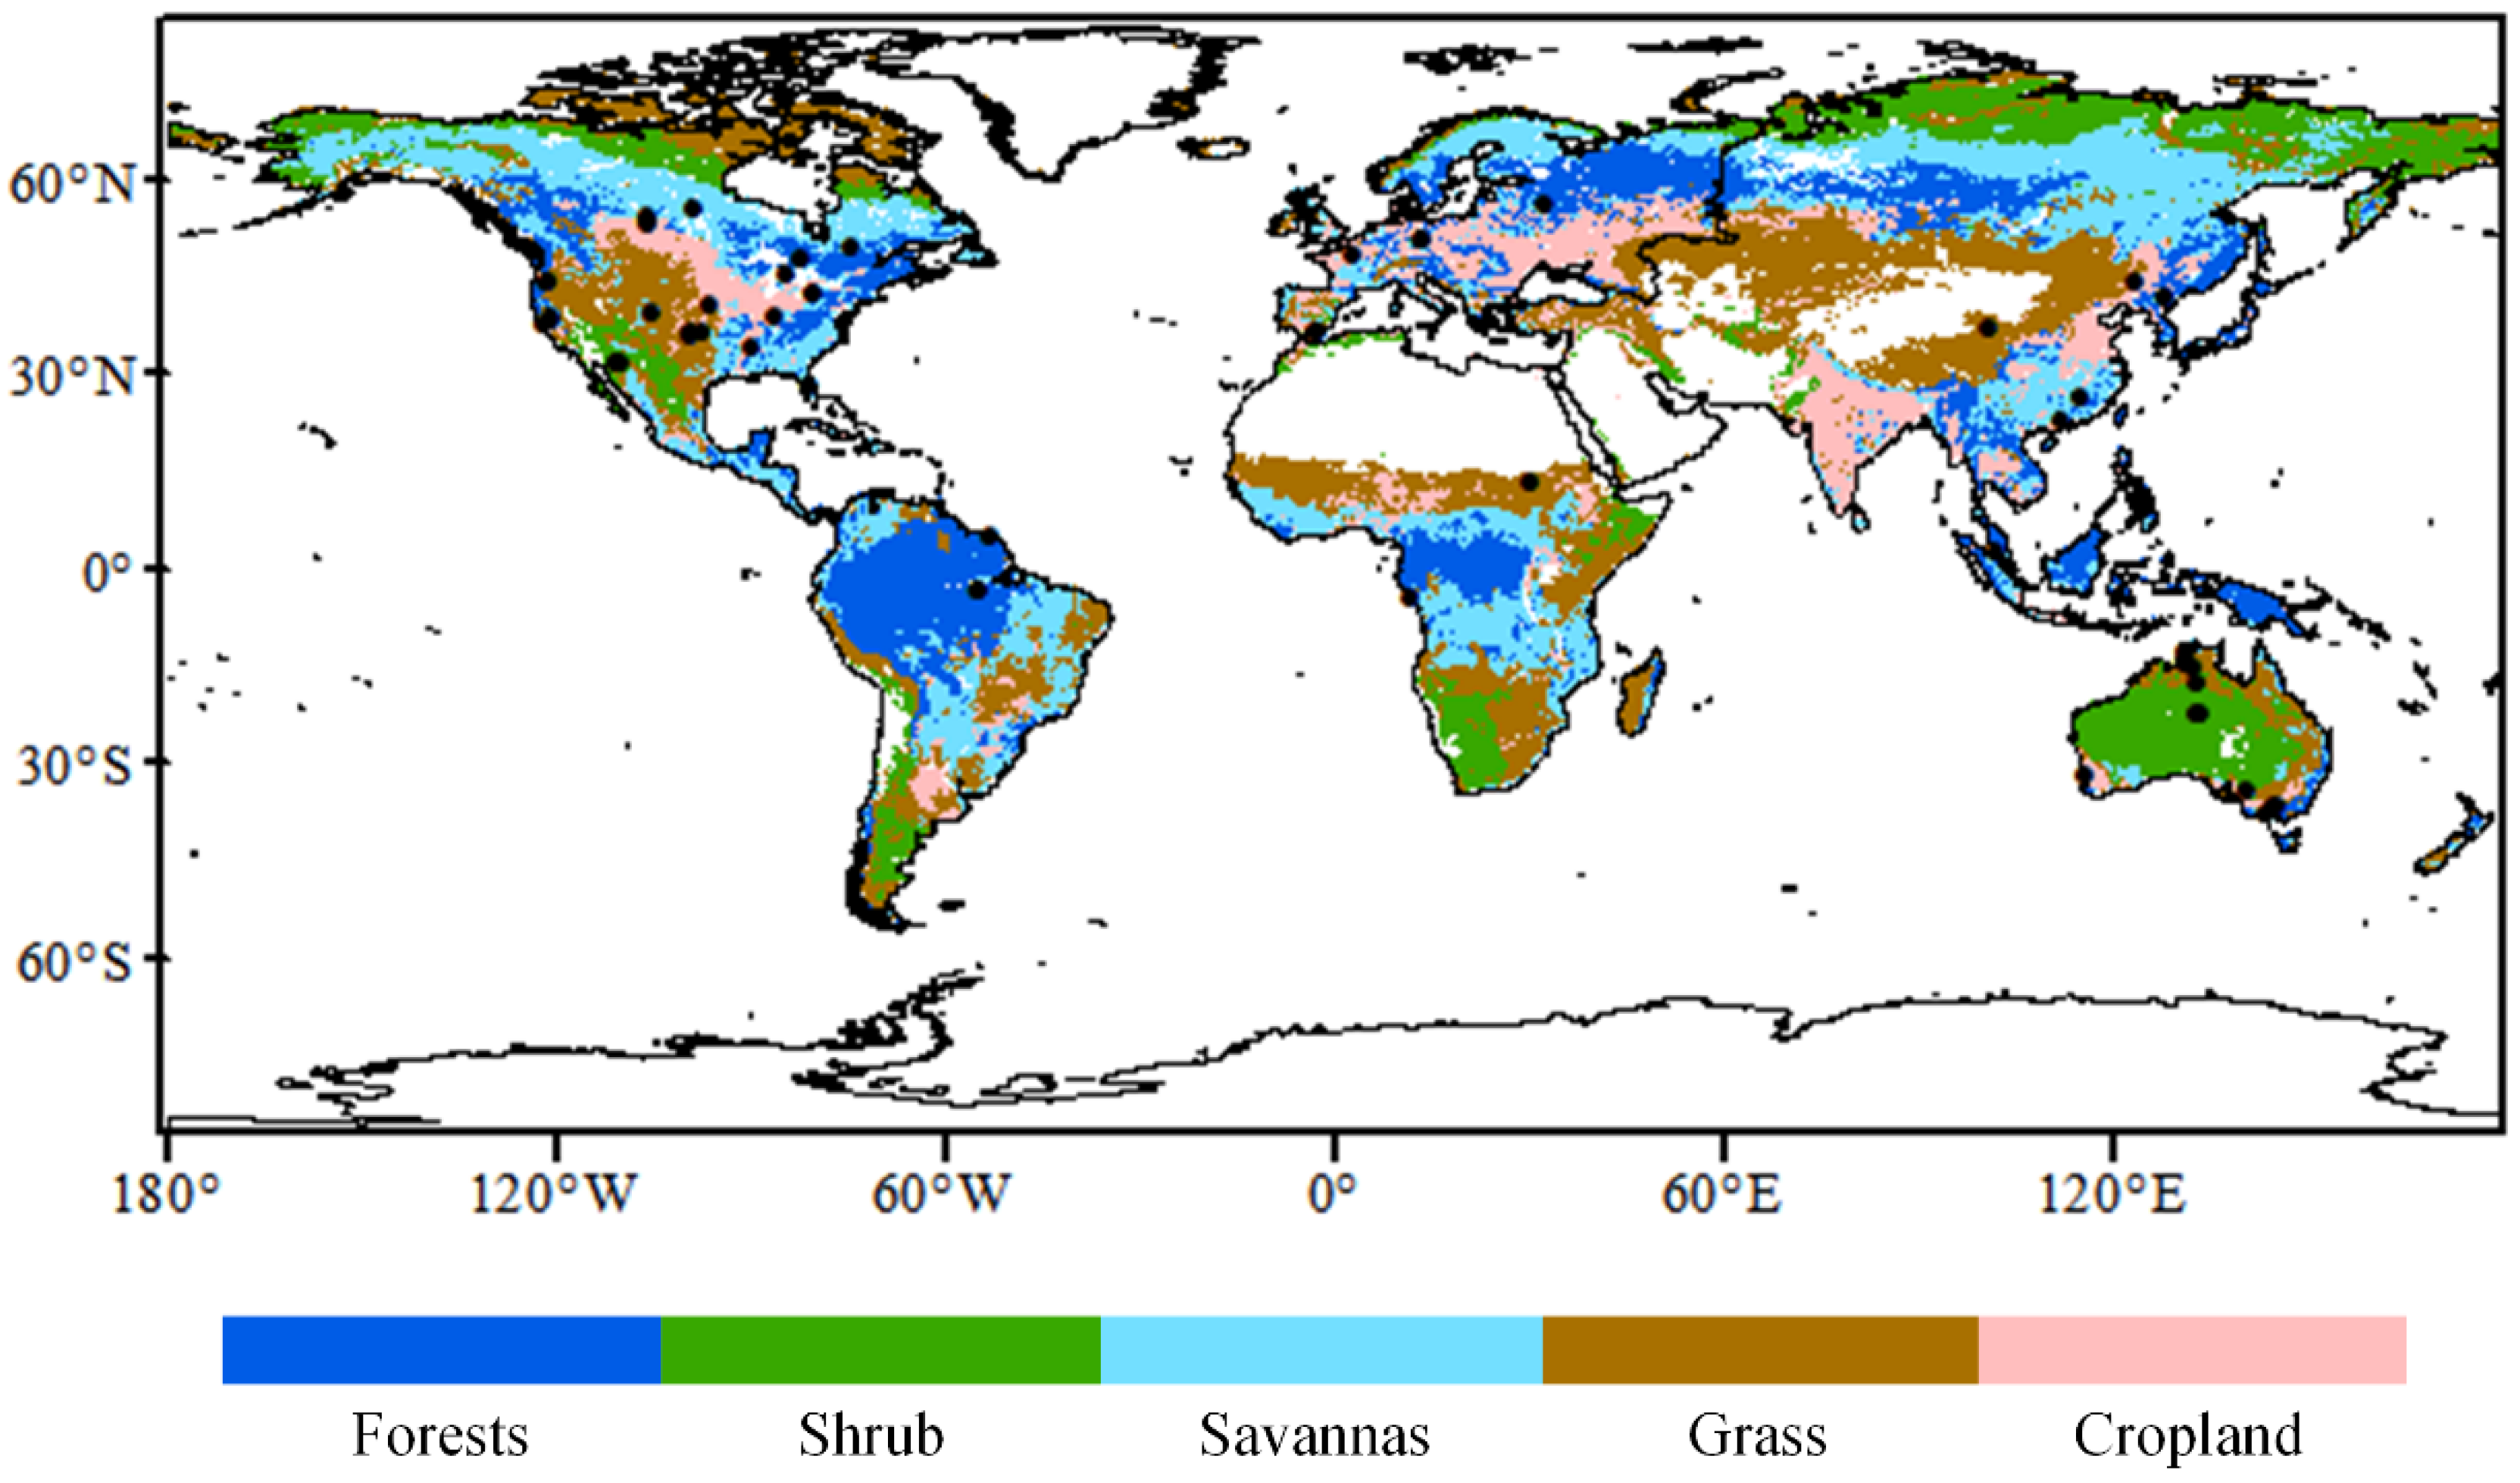
To evaluate the accuracy of the QCA method in quantifying ET data uncertainties across different land cover types, we utilized the annual MODIS MOD12C1 land cover product. This dataset is freely available from NASA (https://modis.gsfc.nasa.gov/, accessed on 16 April 2026). For simplicity, we reclassified the original 17 International Geosphere-Biosphere Programmer (IGBP) land cover types into five broader categories, i.e., forests (classes 1–5), shrublands (classes 6–7), savannas (classes 8–9), grasslands (class 10), and croplands (classes 12 and 14). The original MODIS land cover type data features a spatial resolution of 0.05° × 0.05°. Spatially, we applied the majority voting resampling method to upscale the land cover type data to the 0.25° × 0.25° ERA5 grid (Figure 1).
Figure 1.
Spatial distribution of the FLUXNET sites (N = 55) considered in our work. The underlying map describes the reclassified MODIS land cover type data.
Table 1 presents the data from 55 FLUXNET sites used in our analysis, along with relevant information on the site’s Shannon-Wiener Diversity Index (SHDI).
Table 1.
A summary of the FLUXNET sites used in our work (N = 55).
Latent heat flux (LE) observed via eddy covariance towers from FLUXNET (A Global Network of Eddy-Covariance Flux Towers) [31] has been widely utilized as a benchmark for evaluating global ET estimates [4,18,32]. Given the extensive missing values in raw FLUXNET observations after a careful quality control process, we employed a high-quality and temporally continuous global reference dataset developed by Li et al. [20]. This dataset provides crucial empirical support for the comprehensive quality assessment of ET products and is freely accessible via Zenodo (https://zenodo.org/records/13853409, accessed on 1 March 2026). The FLUXNET ET data developed by Li et al. [20] extended and gap-filled the FLUXNET2015 hourly ET observations using the bias-corrected RF algorithm. To match the units and temporal resolution of other considered ET products, the ground-based LE observations (W·m−2), from 1 January 2000 to 31 December 2020, were physically converted into daily ET observations (mm·day−1) using the latent heat of vaporization following [31]. In addition, we also analyzed the pre-gap-filled FLUXNET data from Li et al. [20] in Figure S4. We found the differences between these two validations were relatively small (Table S1).
Furthermore, we used the Shannon fragmentation index (SHDI) to evaluate the spatial representativeness error in ground observations. According to [33], an SHDI > 1.0 indicates severe landscape fragmentation. Our results revealed that only 4 out of 55 sites fall into this severely fragmented category. This demonstrates that the spatial representativeness error issue is not a major concern in our validations.
2.3. QCA- and Ground-Based Validations
Quadruple Collocation Analysis (QCA), an extension of TCA, can effectively estimate the error variances of multiple datasets in the absence of absolute ground truth. While traditional TCA strictly assumes zero error cross-correlation (ECC) among all input products, the core advantage of QCA lies in its ability to incorporate a fourth observation dataset, thereby analytically resolving and quantifying potential non-zero ECC between two specific products [10]. We examined the ECC between ERA5-GLEAM and ERA5-MERRA2 data pairs (Figure S1). Typically, the ECC values were small. For ERA5-GLEAM, the ECC average is 0.01 (median = 0.01). As for ERA5-MERRA2, the ECC average is 0.004 (median = 0.005). The proportions of non-convergent pixels for the four ET products are presented in Figure S2, all of which are consistently below 3.3%.
In this study, QCA assumes a strictly linear relationship between the four considered ET products and the unknown true ET signal θ:
where a represents ERA5, b represents MERRA2, c represents GLDAS, and d represents GLEAM; and are the additive and multiplicative scaling coefficients, respectively; and is the zero-mean additive random error term with a variance of .
ERA5 and MERRA2 share a substantial amount of conventional observations and satellite radiance data through their respective data assimilation systems. Consequently, the Error Cross-Correlation (ECC) between the ERA5 and MERRA2 data pair is regarded as non-zero here. Specific QCA calculation formulas are as follows:
The least squares solution for x is as follows:
The calculation formula for the ERA5-MERRA2 ECC is:
To ensure reliable QCA errors, pixels with available temporally collocated observations, i.e., ERA5, GLDAS, GLEAM, MERRA2, fewer than 100 were discarded prior to the QCA calculation [7,10,34]. All input time series were first converted to anomalies by subtracting the 31-day moving-window climatological means to satisfy the temporal stationarity assumption of QCA.
Finally, to make the QCA-estimated error standard deviations (, mm/day) dimensionally comparable with site-based validation metrics, systematic biases were removed by applying Min-Max scaling to MERRA2, GLDAS, and GLEAM using ERA5 as the reference product:
where and are the rescaled and original target ET product, and are the minimum and maximum ET values, respectively. and represent the maximum and minimum values of the reference product, i.e., here refer to the ERA5 ET product.
Here, only time-invariant errors were estimated and considered in the following analysis.
Following the systematic bias removal, we calculated the Root Mean Square Error (RMSE) between the in situ observations and the rescaled ET products to evaluate their temporal consistency:
where represents the rescaled ET value of the evaluated product at time step t, is the corresponding in situ eddy covariance observation, and N denotes the length of the time-series.
It is crucial to emphasize that we considered the error standard deviation (, mm/day) rather than the error variance. As demonstrated by relevant methodological studies [10,35], after appropriate rescaling and dimensional matching, the RMSE from site-based validation is conceptually comparable to the QCA-estimated error standard deviation, as both metrics reflect the random deviation of the product estimates from a reference benchmark.
2.4. RF
We employed the Random Forest (RF) model to fill the spatial gaps in QCA-based ET errors. As an ensemble learning algorithm based on decision trees, RF effectively mitigates the over-fitting issues commonly observed in a single decision tree by incorporating bootstrap sampling and random feature selection [36,37]. Compared to traditional geostatistical interpolation or linear models, RF requires no prior assumptions regarding data distribution and excels at capturing complex non-linear and non-monotonic relationships between environmental drivers and target variable [38].
To ensure only related variables are incorporated into the RF model, we first calculated Spearman’s correlation coefficients between an initial pool of 19 candidate environmental variables and QCA errors. Variables with correlation coefficients lower than 0.1 were excluded. These two variables are longitude and soil porosity. Candidate variables and QCA errors. Predictors with correlation coefficients lower than 0.1 were excluded. Consequently, 17 environmental variables were kept as final predictors, encompassing geographic location (Lat), topography (Digital Elevation Model, DEM), soil properties at topmost 0–30 cm (clay, sand, silt, soil texture, soil moisture), vegetation status (land cover type, Leaf Area Index), and meteorological forcing (temperature, precipitation, solar radiation, skin temperature, cloud cover, snow depth, surface pressure, and wind speed). To align with the time-aggregated QCA error targets, all dynamic predictors (e.g., LAI, soil moisture, and meteorological forcings) were averaged over the 21-year period (2000–2020), ensuring a consistent spatial baseline with static variables (e.g., Lat, DEM, and soil properties).
Since RF performance is highly sensitive to the choice of hyperparameters, we implemented a Bayesian Optimization approach for global parameter tuning. to maximize reconstruction accuracy while strictly controlling model complexity. Rather than relying on manual searches, this method allowed us to systematically explore the search space, for four core hyperparameters, i.e., the number of decision trees (NumLearningCycles, [50, 600]), the minimum samples per leaf (MinLeafSize, the range is 1 to 20), the maximum number of variables to sample at each split (NumVariablesToSample, the range is 1 to 20), and the maximum number of splits per tree (MaxNumSplits, [10, 600]). To ensure the model reached its optimal state without excessive computational cost, we limited the optimization to a maximum of 500 objective function evaluations. The algorithm internally utilized the Out-of-Bag error for rapid iteration, and the final set of hyperparameters was determined by selecting the combination that minimized this internal validation error, which was then used to construct our global ET error gap-filling model.
To evaluate the predictive performance of each RF model, we implemented a 5-fold cross-validation scheme following the approach of Mushagalusa et al. [39]. Specifically, the study area was partitioned into five spatially contiguous blocks rather than randomly assigning pixels, ensuring that the training and validation sets remained spatially independent. In addition, we also considered the SHAP (SHapley Additive exPlanations) analysis to disentangle the impacts of the environmental predictors on ET error prediction.
3. Results
3.1. QCA- and Ground-Based Evaluation for the Four ET Products
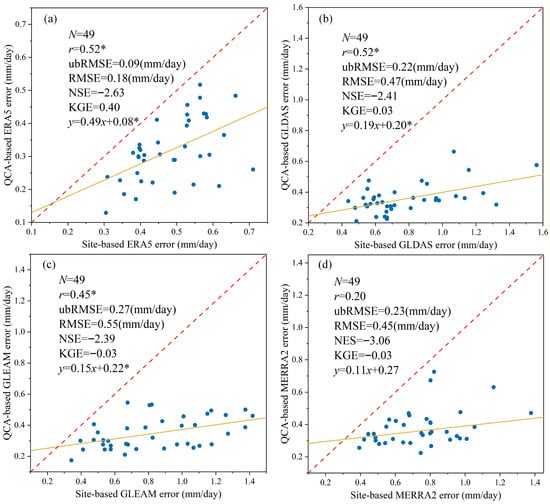
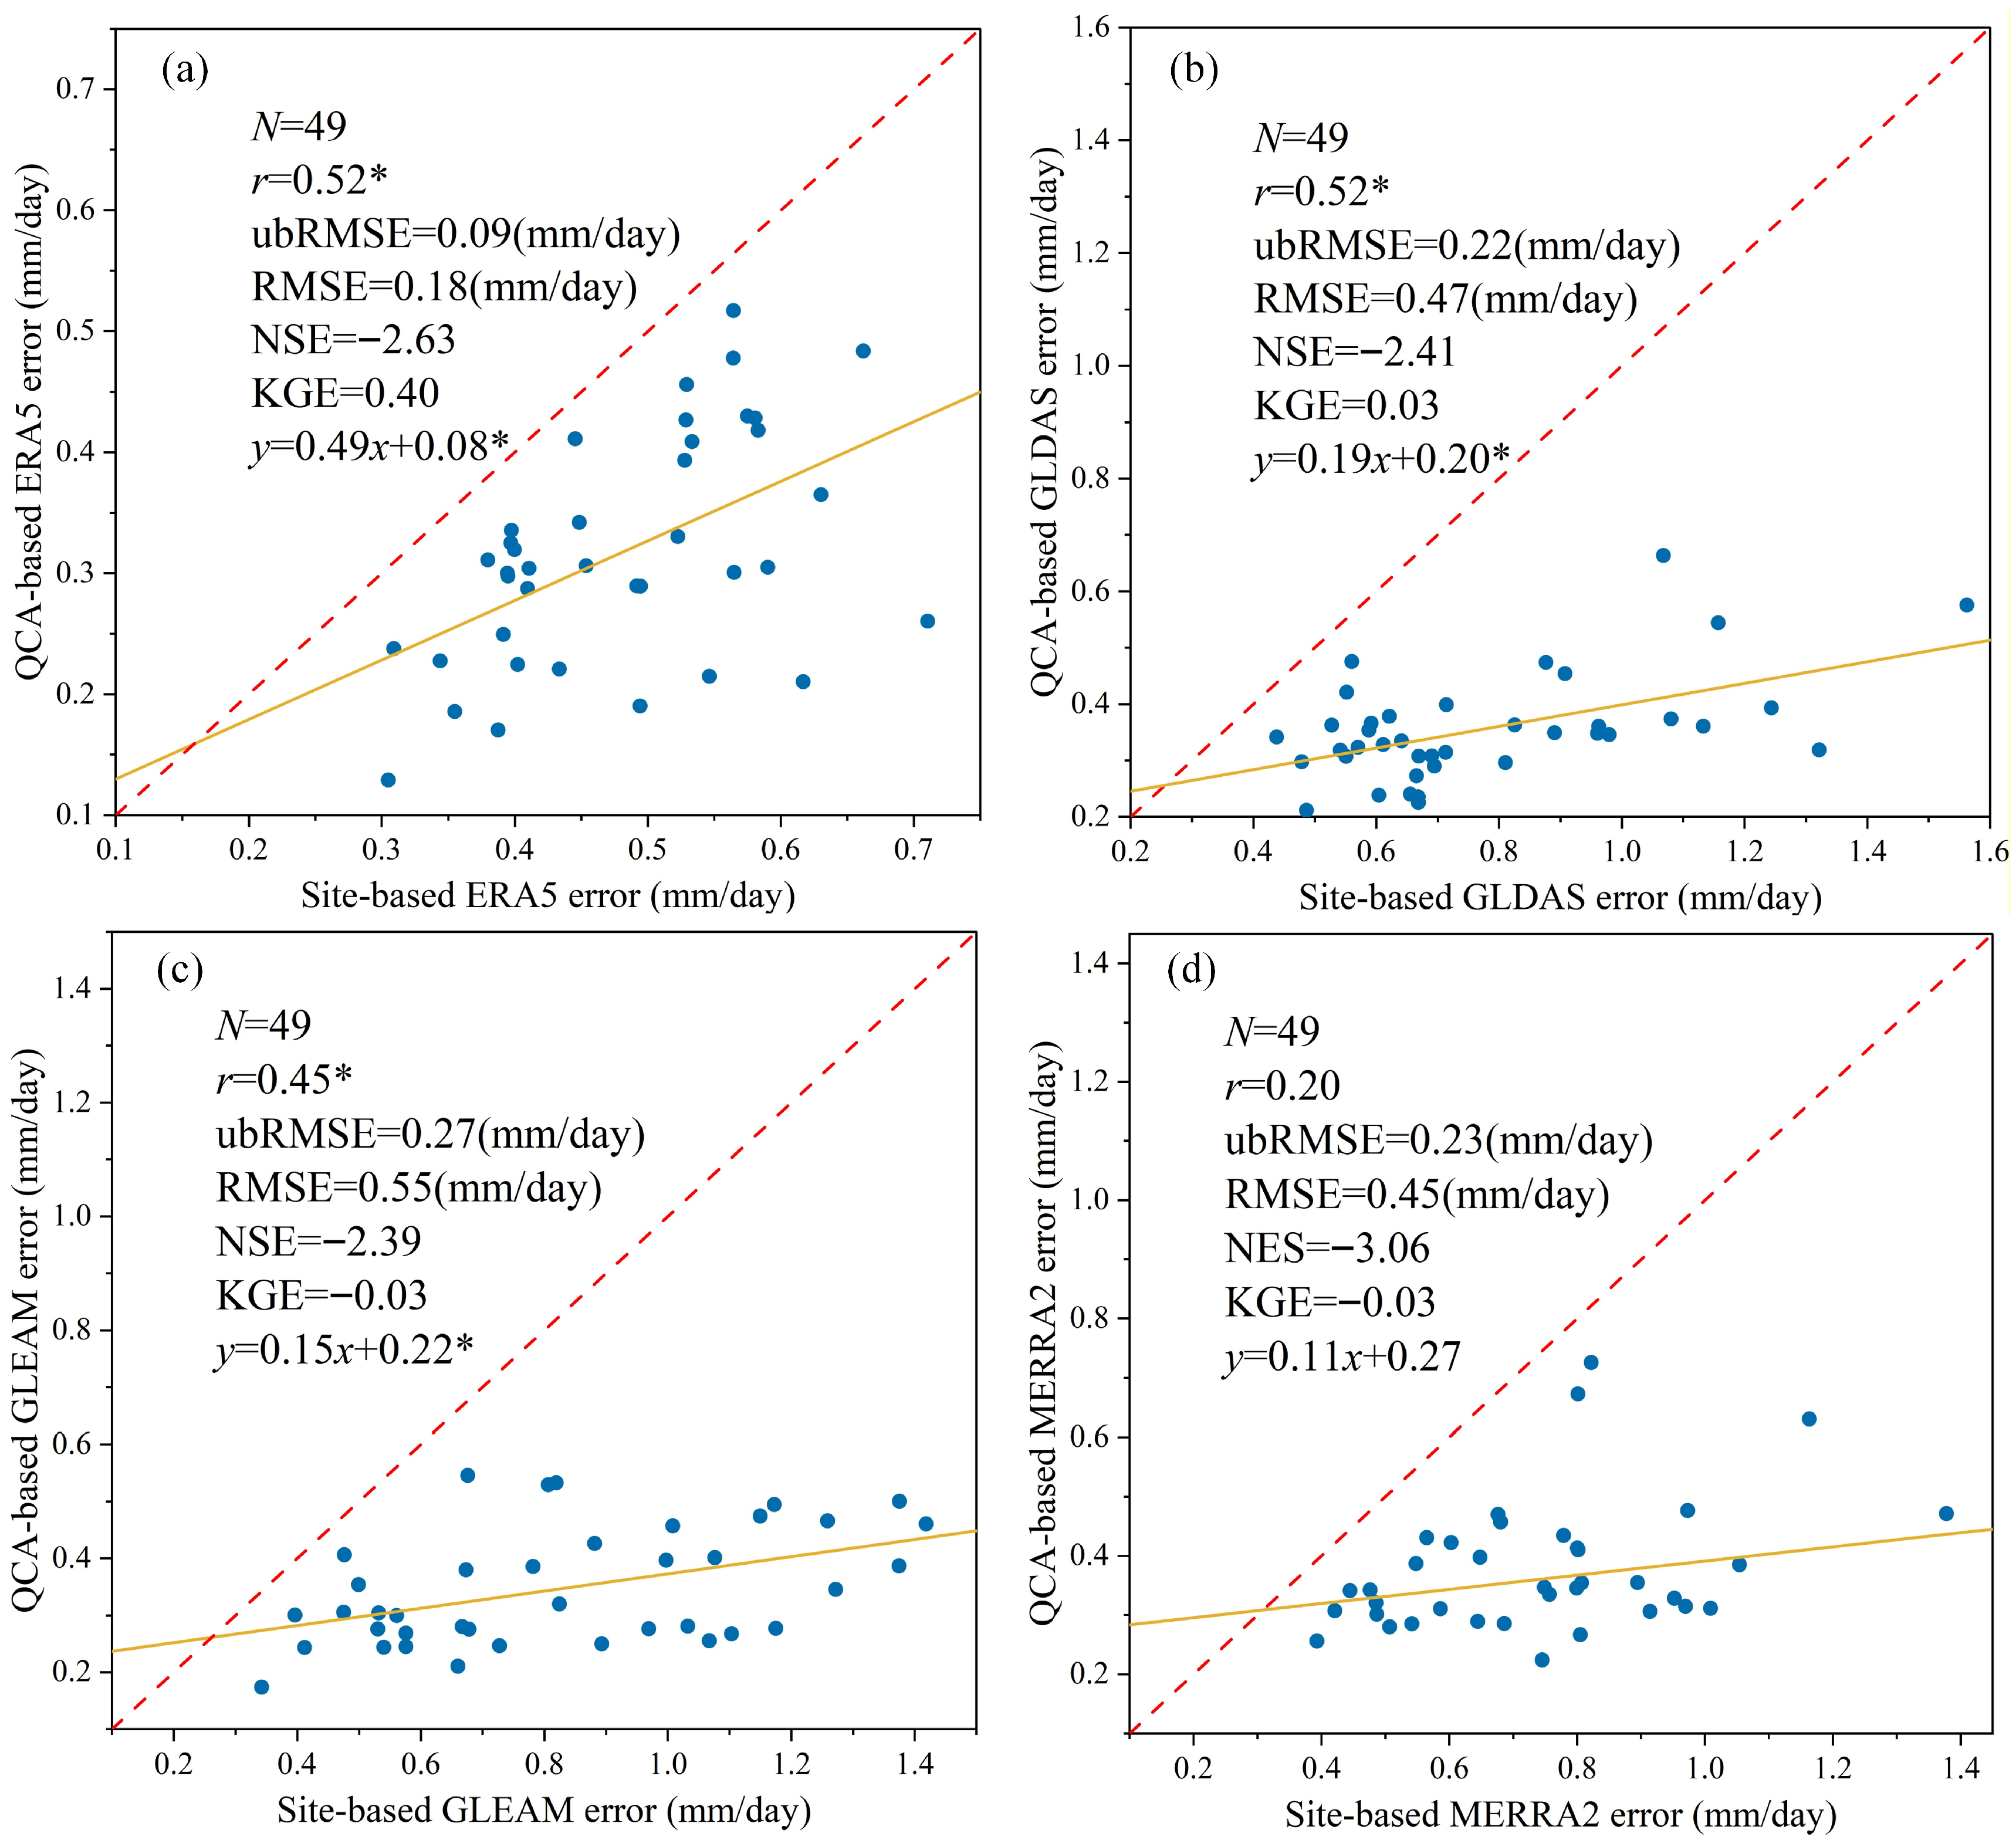
Figure 2 demonstrates that ground- and QCA-based errors are correlated for the four products. Among them, ERA5 and GLDAS showed the highest correlation coefficient (r = 0.52) while MERRA2 exhibited the smallest correlation (r = 0.20). Notably, the scatter points in Figure 2a–d are predominantly distributed below the 1:1 line, indicating that the QCA method tends to underestimate the ET errors when compared with the ground-based error estimates. In addition, in Figure S4, we analyzed the pre-gap-filled FLUXNET data from Li et al. [20]. and observed minimal differences between the two datasets.
Figure 2.
Scatterplots of ground- and QCA-based errors for (a) ERA5, (b) GLDAS, (c) GLEAM, and (d) MERRA2 products across 49 sites (N = 49). The QCA errors here refer to error standard deviation (, mm/day). The r represents Pearson’s correlation coefficient between ground- and QCA-based ET errors, with the asterisk * indicating that the correlation coefficient passed the statistical significance test (p < 0.05). Additional evaluation metrics presented include the Root Mean Square Error (RMSE), unbiased Root Mean Square Error (ubRMSE), Nash-Sutcliffe Efficiency (NSE), and Kling-Gupta Efficiency (KGE). The red dashed line indicates the 1:1 line of equality, while the yellow solid line shows the linear fit for the site-based versus QCA-based errors.
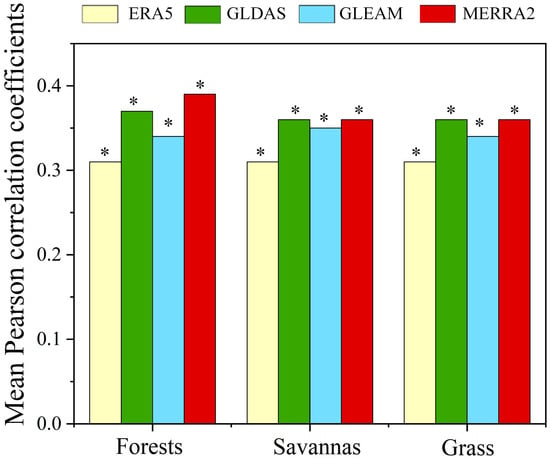
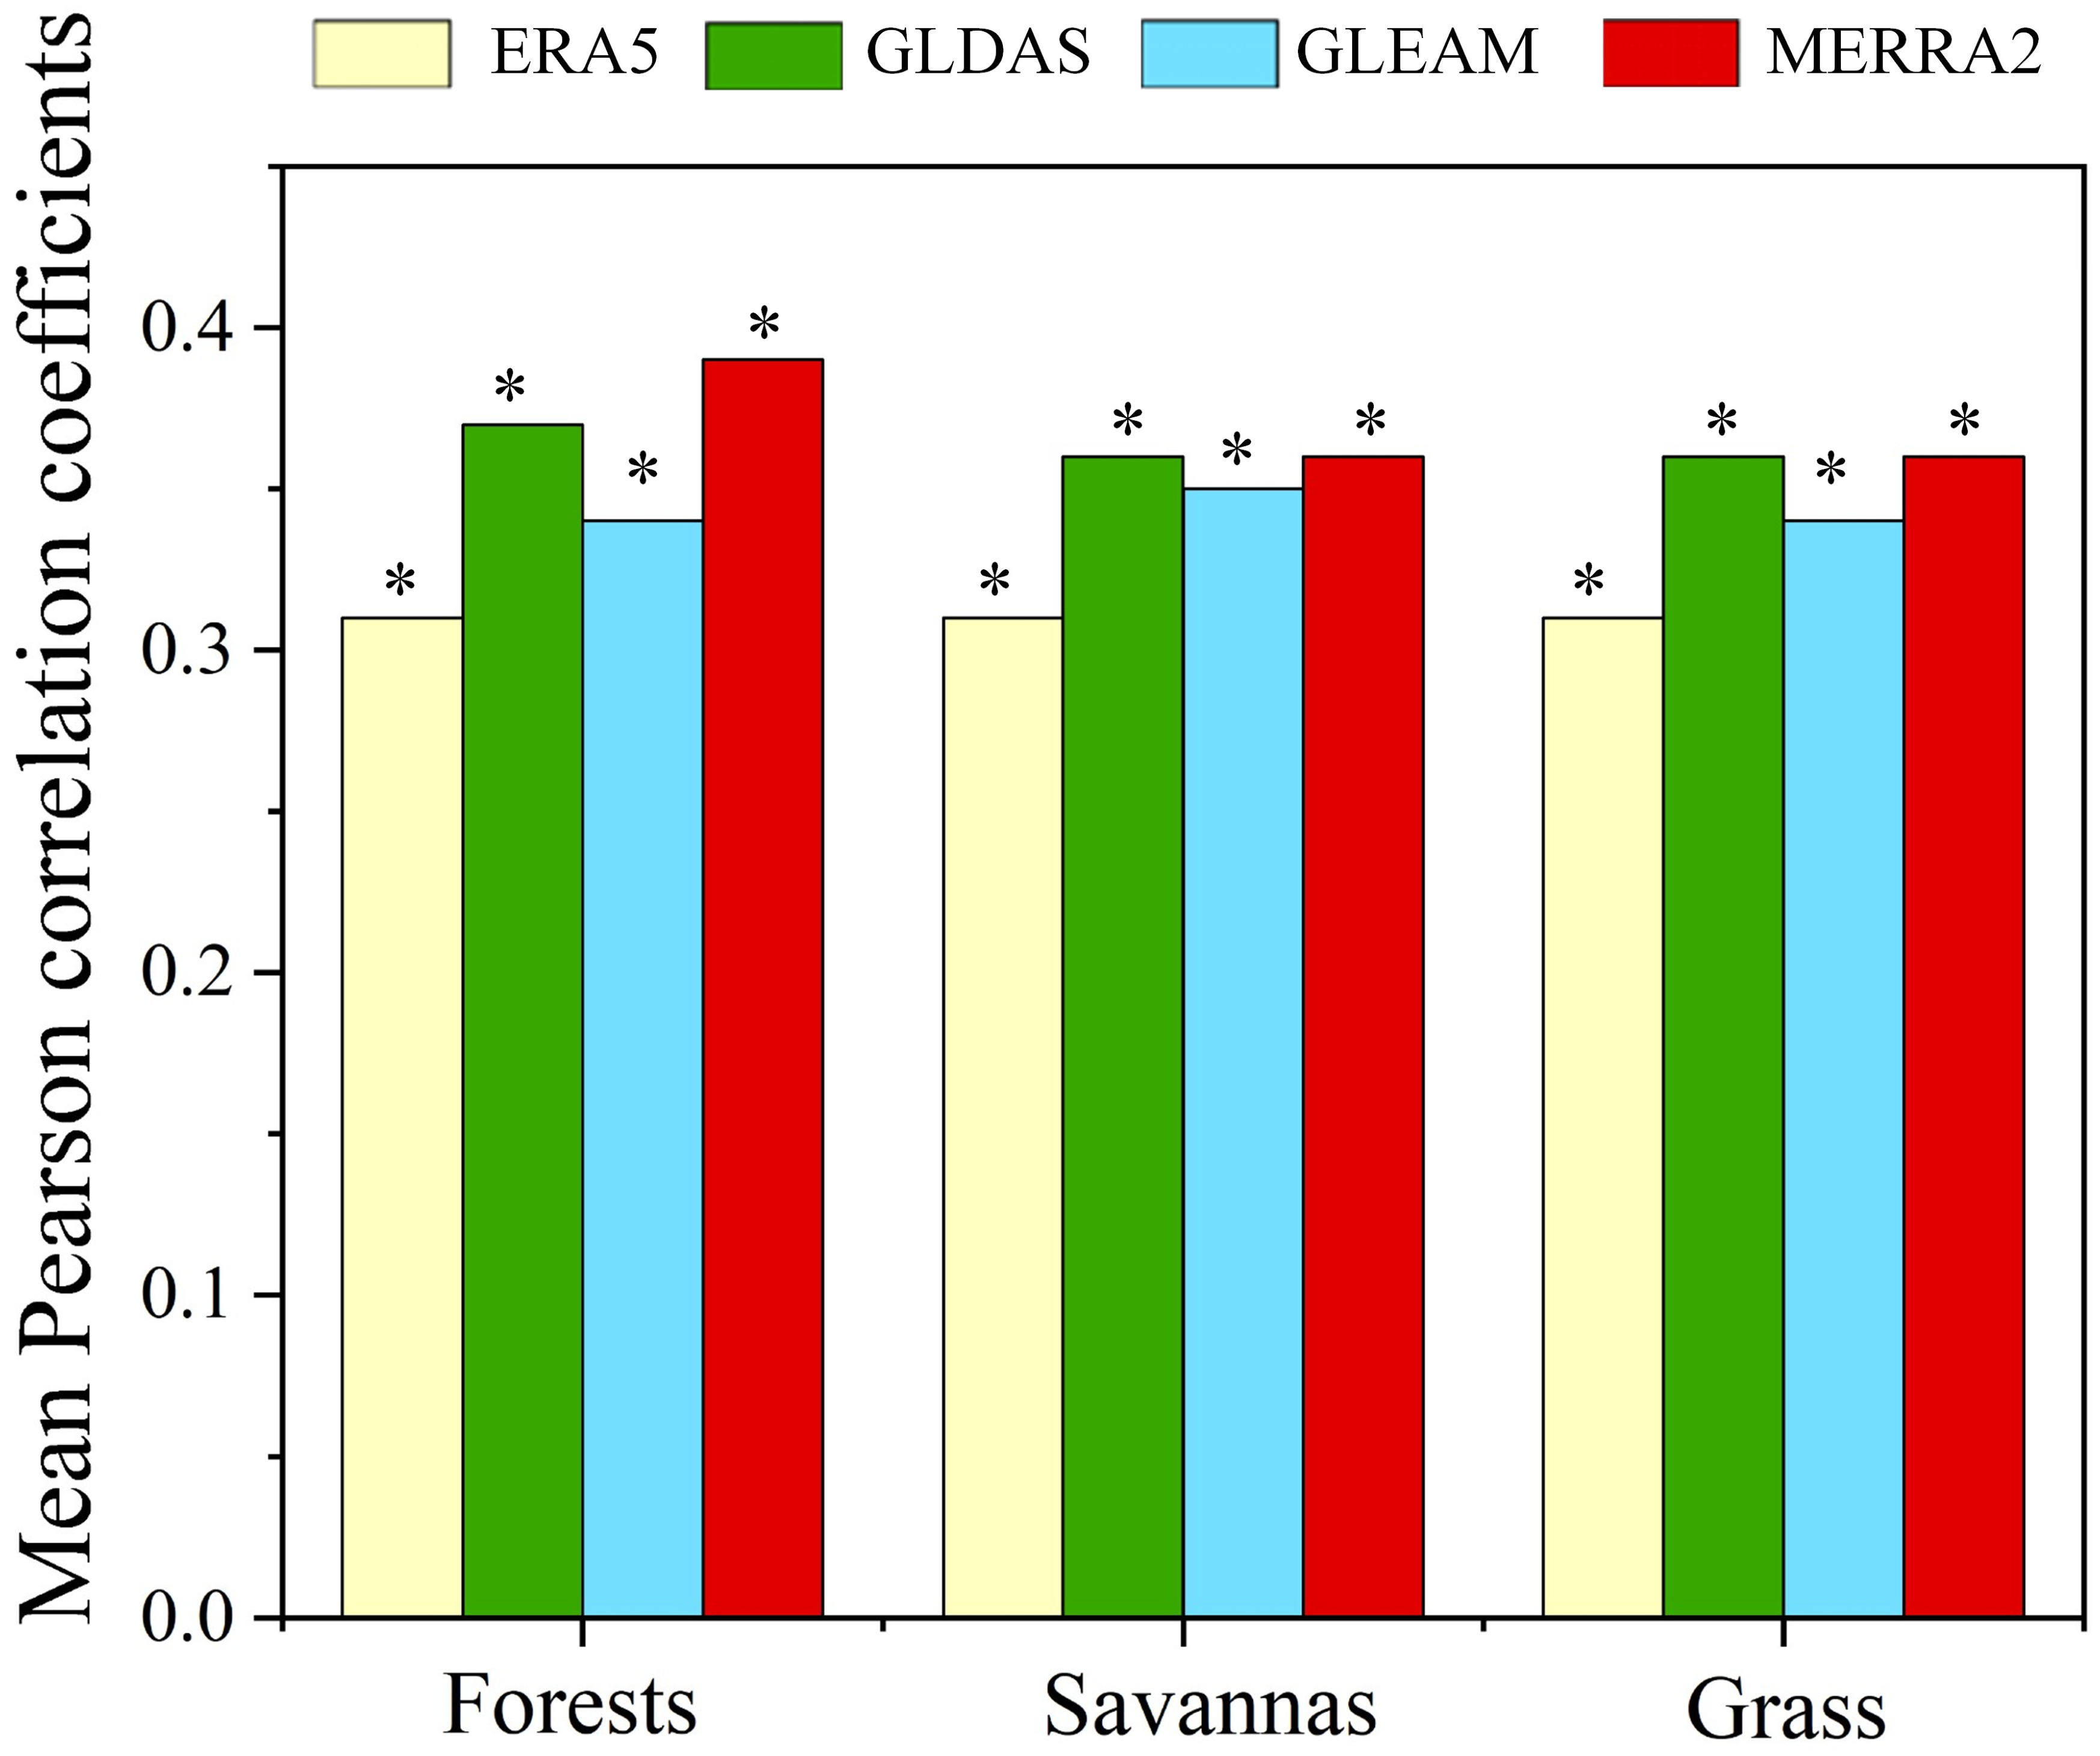
Figure 3 shows that across various land cover types, the QCA-estimated ET errors generally maintain strong correlations with the ground-based errors for all four ET products. However, the performance of each product varies notably across specific vegetation types. Specifically, MERRA2 exhibited consistently high correlations in forests, savannas, and grasslands (r > 0.3) while GLDAS also exhibited strong correlations across all three vegetation types (r > 0.35), performing comparably to MERRA2 in savannas and grass. In contrast, GLEAM maintained stable but slightly lower correlation coefficients (around 0.34 to 0.35) across these land cover types. Given that the available valid sites for shrubland and cropland fell short of the required threshold, these two land cover types were omitted from the present analysis. Given that the available sites for shrubland and cropland were limited (N = 5 for shrubland and N = 4 for cropland), these two land cover types were screened out in the following analysis.
Figure 3.
Correlation coefficients average between QCA- and site-based ET errors in different land cover types. Cases with less than 8 available samples were excluded and remained blank. The asterisk (*) indicates that the correlation coefficients passed the statistical significance test (p < 0.05).
3.2. Spatial Patterns of Gap-Filled QCA Errors for the Four ET Products
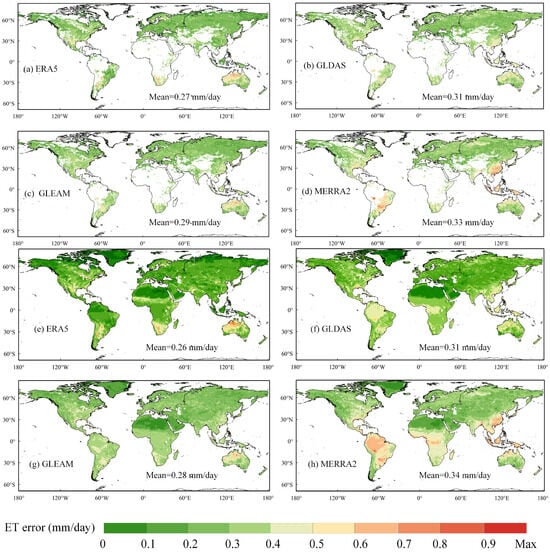
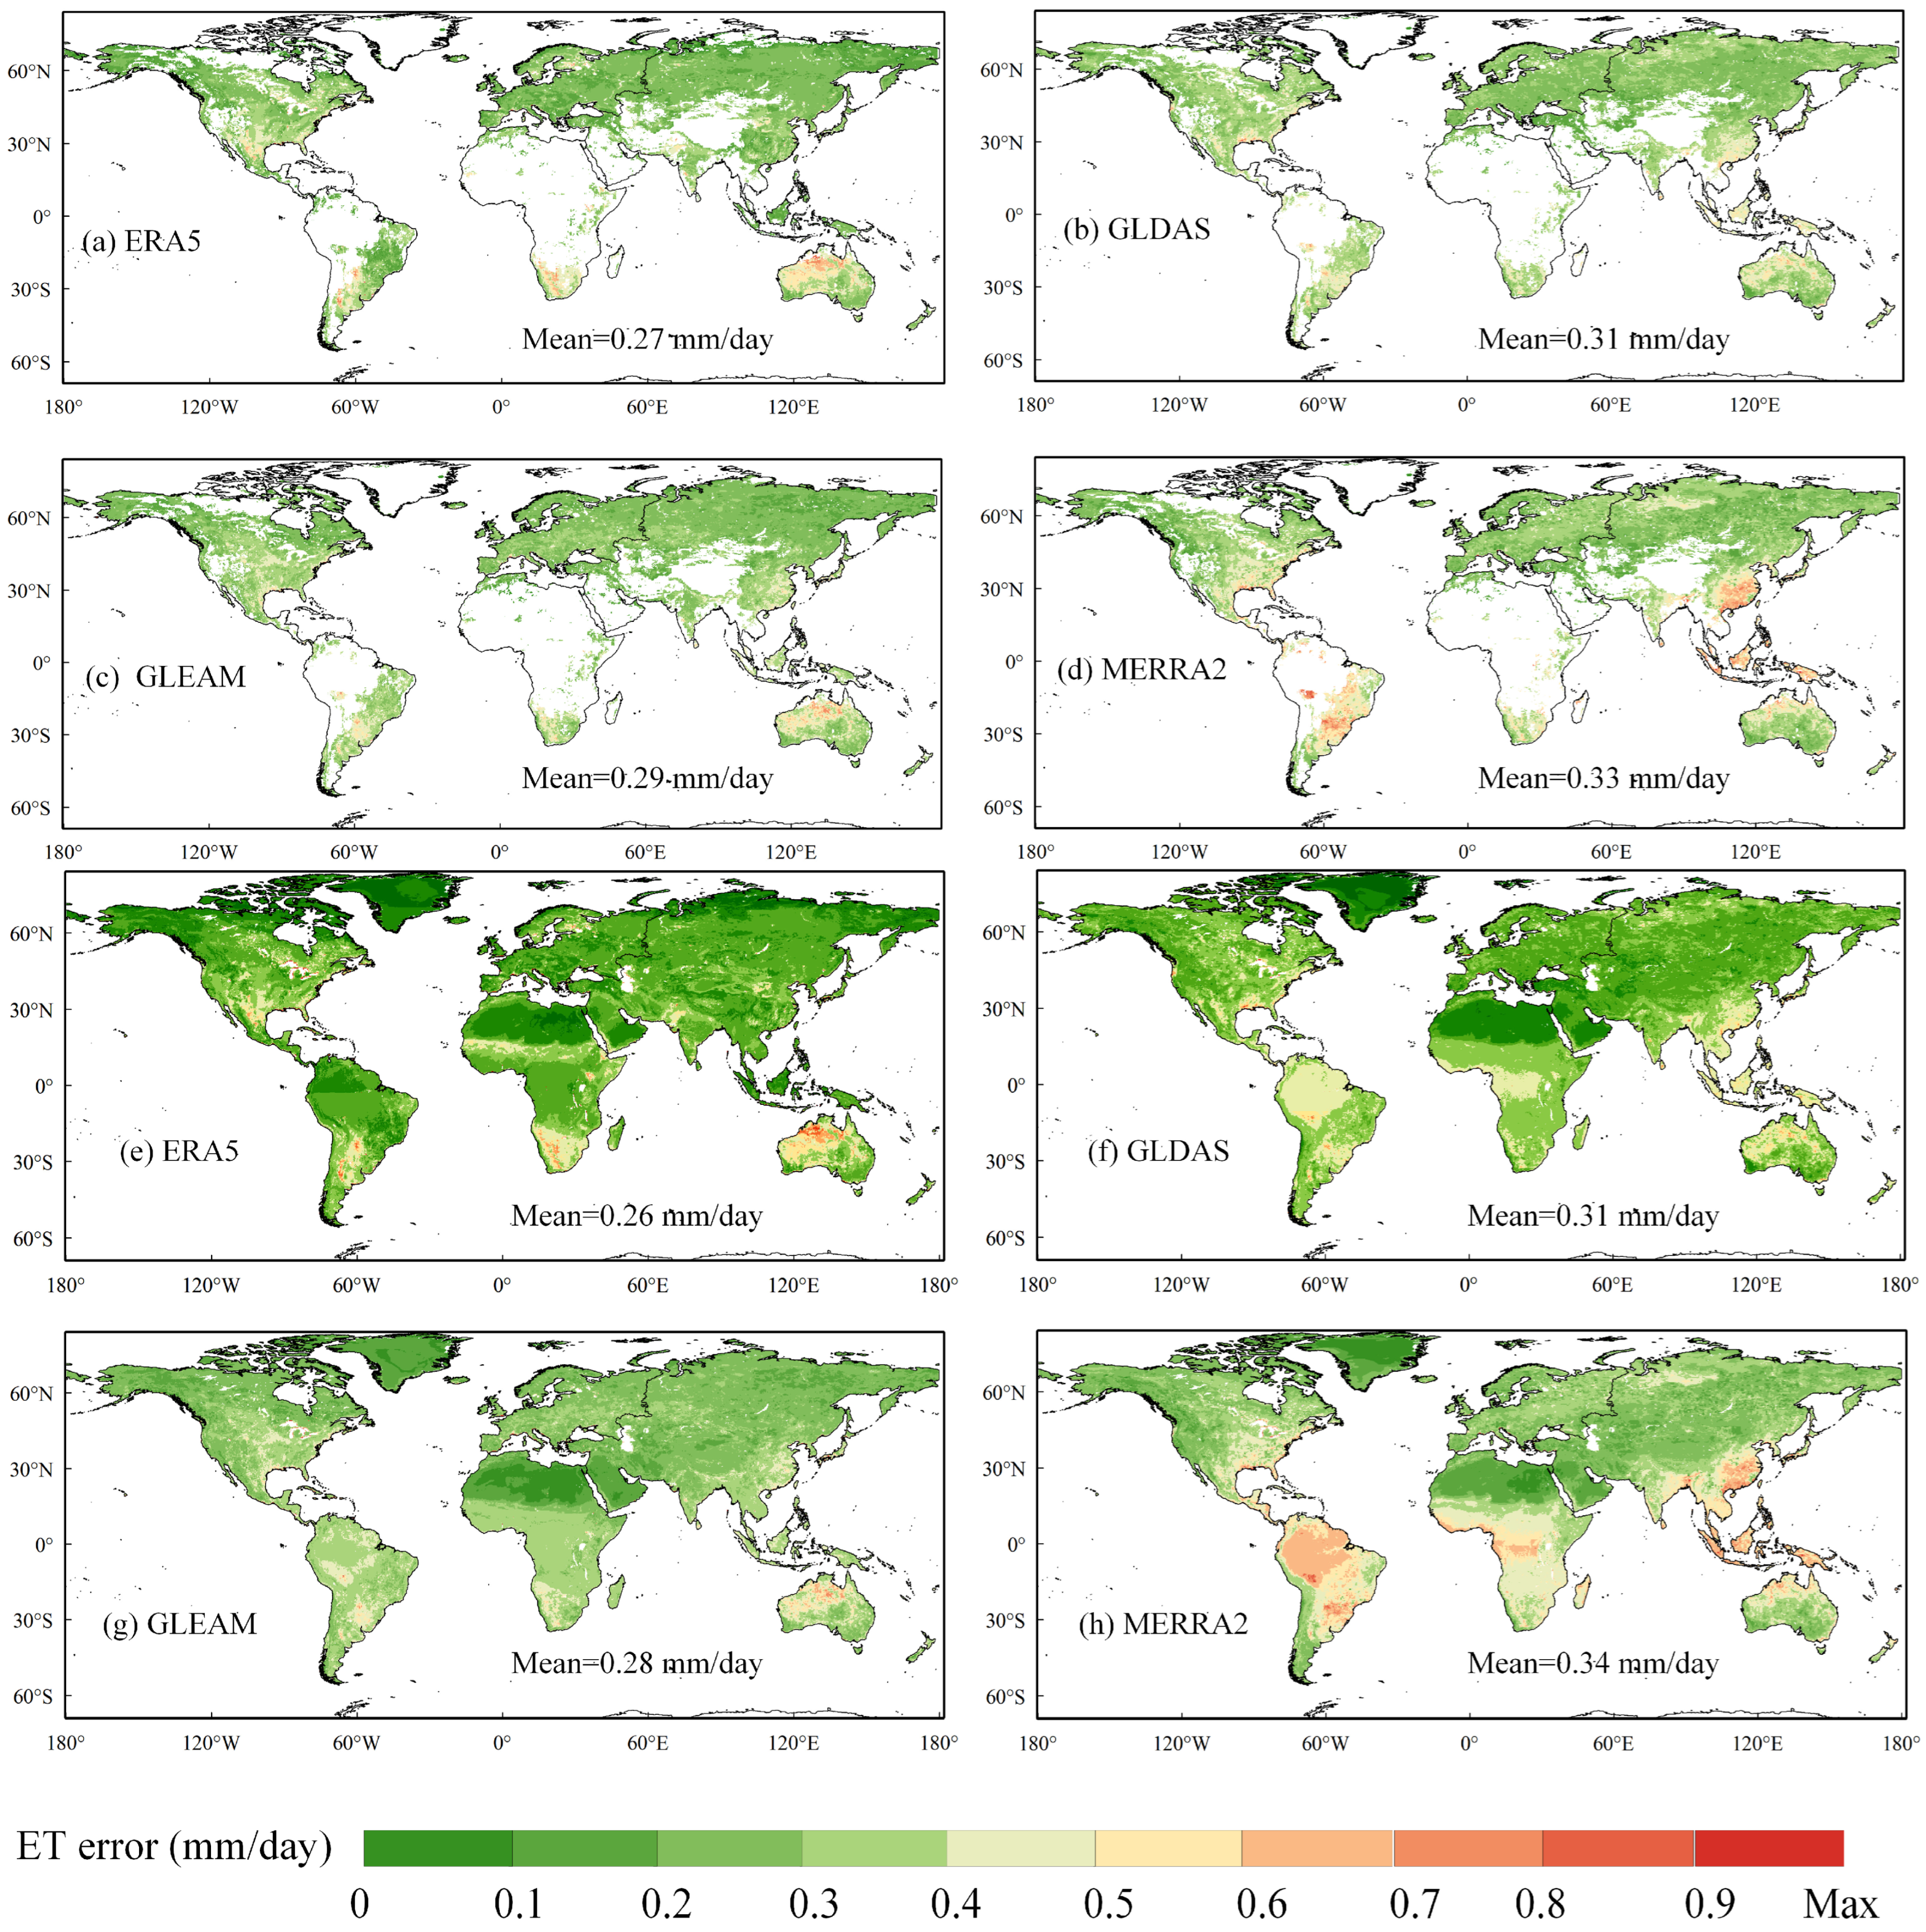
Figure 4 illustrates that the global mean values are typically around 0.3 mm/day for both the original and gap-filled QCA errors. Spatially, all four ET products exhibited pronounced high-error patterns in central Canada, northern Argentina, and northern Australia. Notably, the spatial distribution of MERRA2 ET errors in Figure 4h reveals extensive regions with high error values across the Southern Hemisphere.
Figure 4.
Spatial distribution of the original QCA errors (a–d) and corresponding seamless QCA error maps (e–h) generated using the RF gap-filling method.
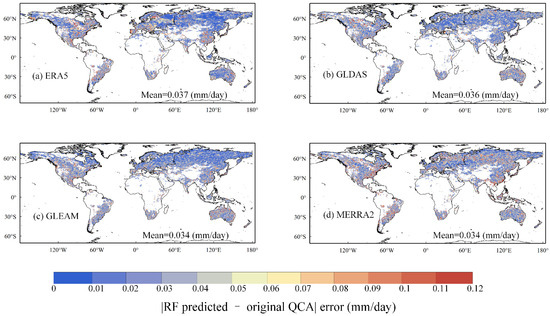
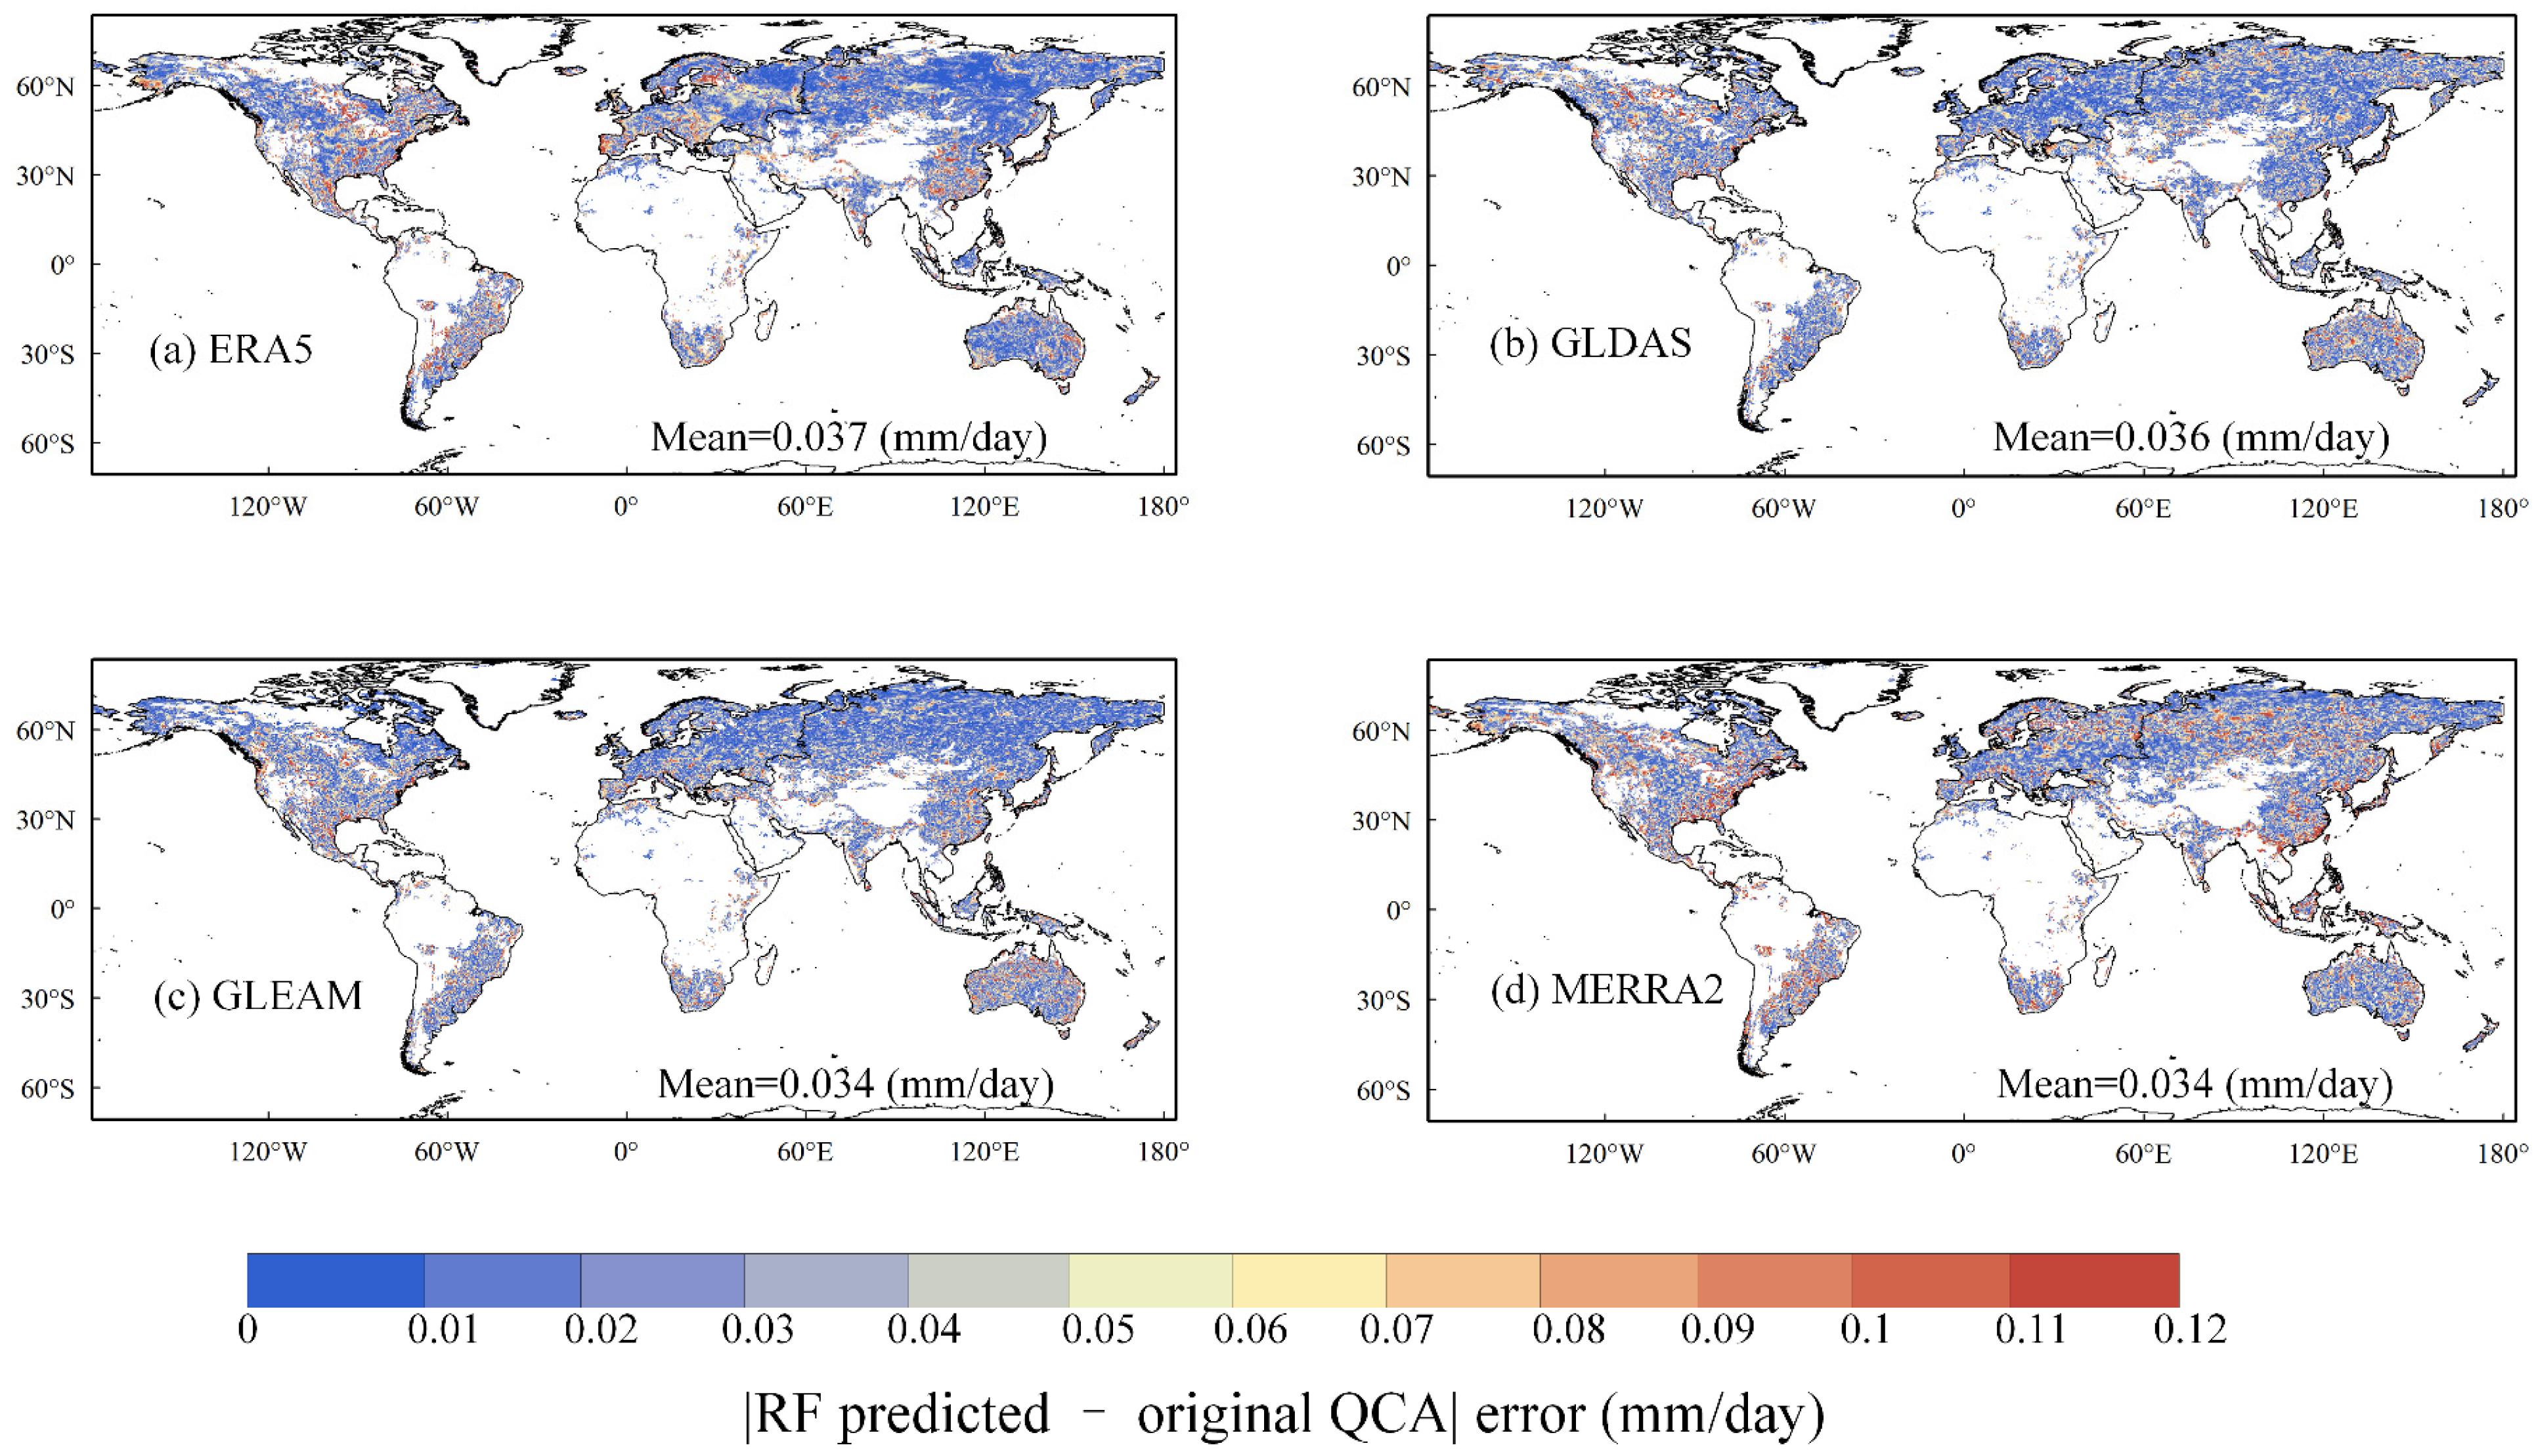
Overall, the RF model demonstrated exceptionally low gap-filling errors, with the mean prediction error remaining at approximately 0.03 mm/day for all four ET products. The RF model generally performed better in high-latitude regions of the Northern Hemisphere (Figure 5). However, the gap-filling performance exhibited distinct spatial variations among the four products. Specifically, GLEAM and MERRA2 exhibited the best performance as they yielded the lowest error among the four ET products. Comparatively, their errors were relatively uniform in space compared to the other two ET products. Spatially GLEAM showed lower errors than other ET data across most of South America, South Africa, and the high latitudes of Eurasia. But it performed relatively poorly in the high latitudes of North America and the Middle East. As for MERRA2 ET data, regions with large gap-filling errors were primarily concentrated in the Indochinese Peninsula and certain parts of North America. Among the four ET products, ERA5 showed the highest gap-filling errors. Spatially, high ERA5 ET errors were mainly clustered in South America and southern Eurasia, whereas its ET errors remained low in the high latitudes of North America and northern Asia.
Figure 5.
Spatial distribution of the absolute differences between RF-predicted errors and the original QCA-estimated errors for the four ET products.
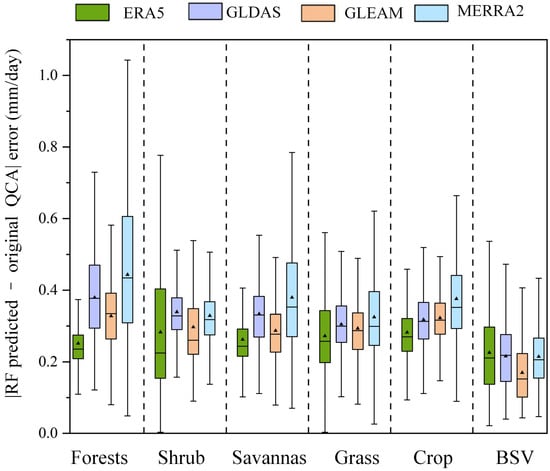
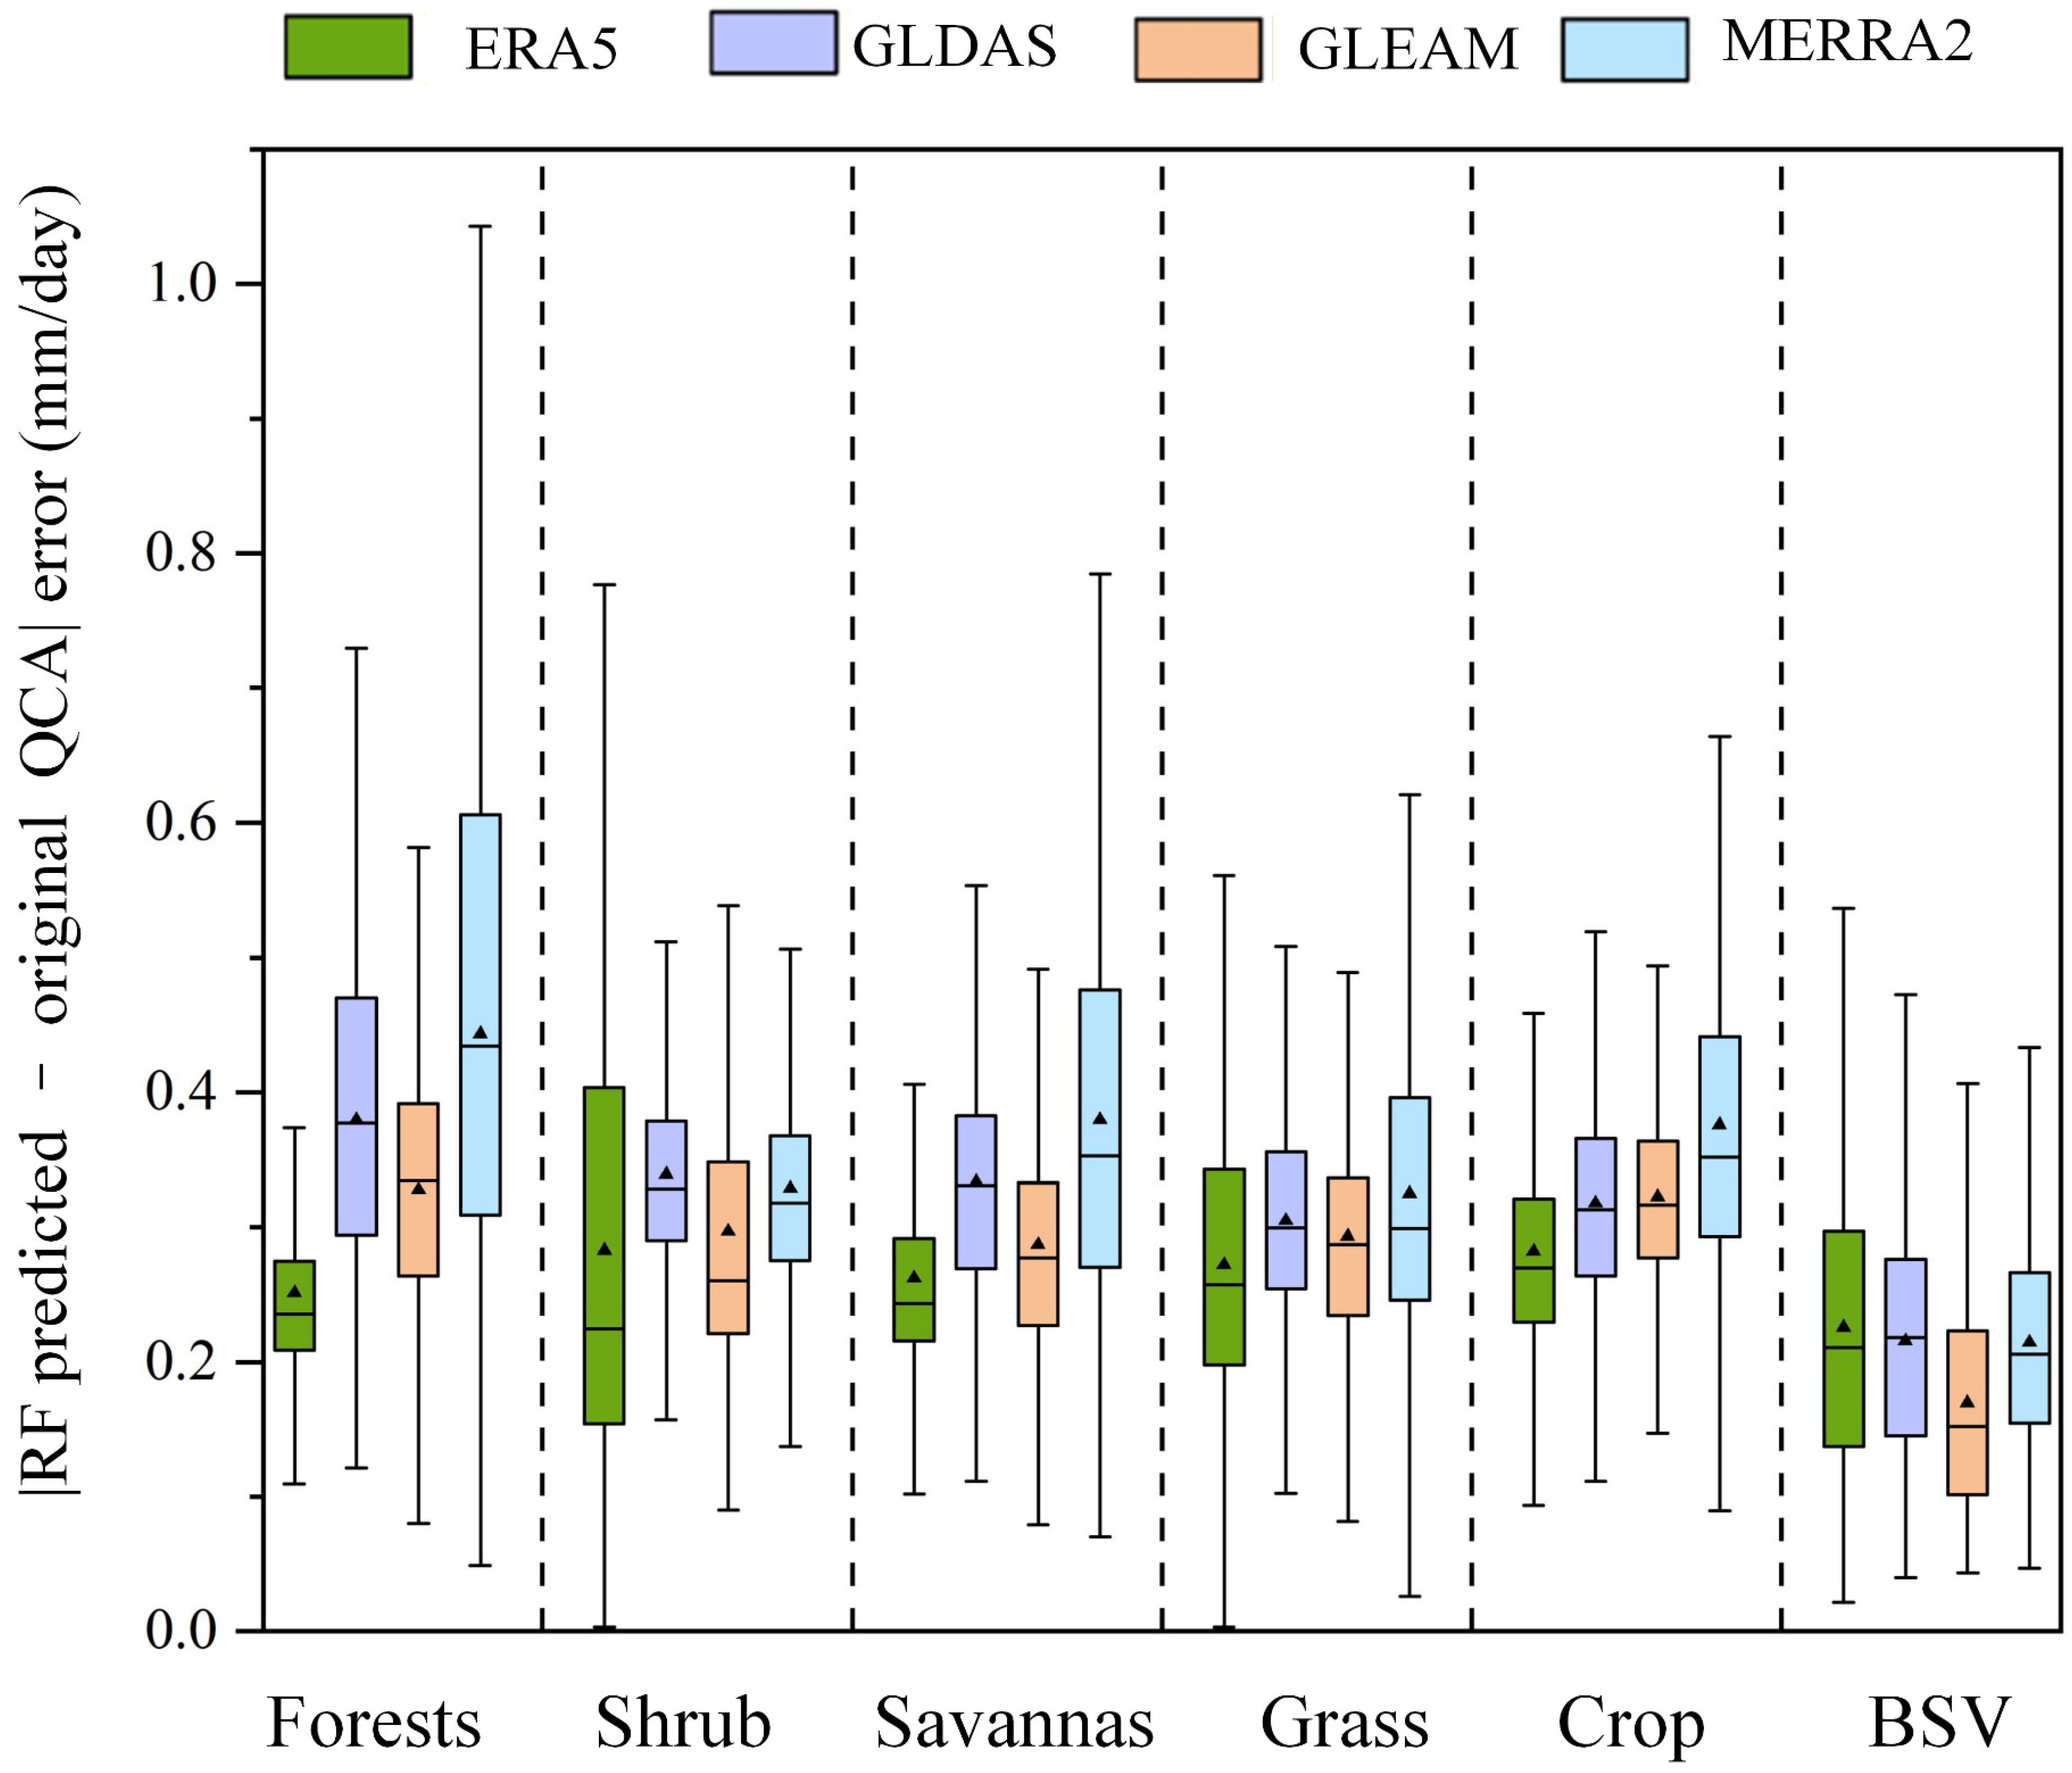
The predictive performance of the RF models was highly sensitive to both the underlying ET product and land cover type heterogeneity, yielding distinct error distributions (Figure 6). Among the evaluated products, ERA5 consistently demonstrated the most robust performance across most biomes, exhibiting the lowest mean prediction errors and narrowest interquartile ranges in forests, savannas, grasslands, and croplands. Conversely, the MERRA2-based RF model showed the highest uncertainty, characterized by large error spreads and the highest mean values, particularly in forests, grasslands, and croplands. In contrast, in landscapes with simple structures such as shrublands and BSV (Barren Sparse Vegetation), the error spread was tightly constrained across all four ET products. As for GLDAS- and GLEAM-based RF models, GLDAS exhibited the highest prediction errors in forests, whereas GLEAM showed the lowest prediction errors in BSV.
Figure 6.
Boxplots of prediction errors across different land cover types for the four ET products. In each box, the black triangle and the horizontal solid line represent the mean and median values, respectively. The vertical lines outside the boxes denote whiskers.
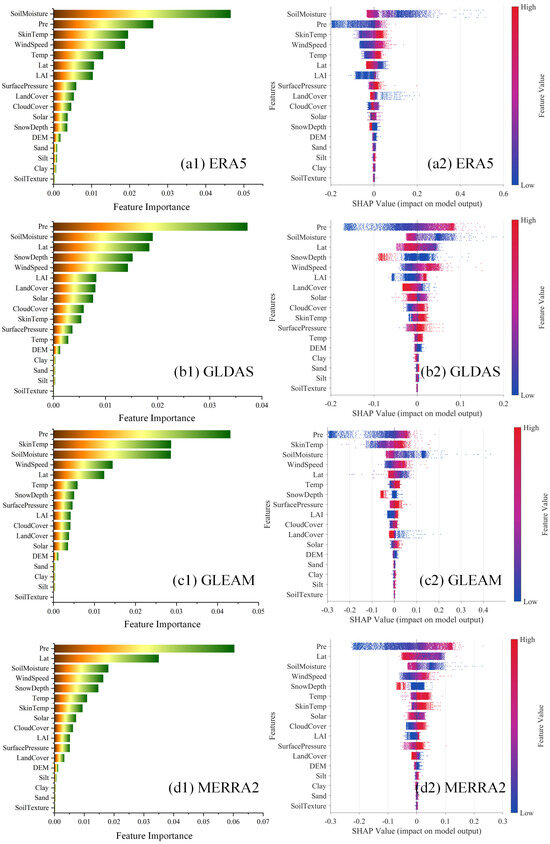
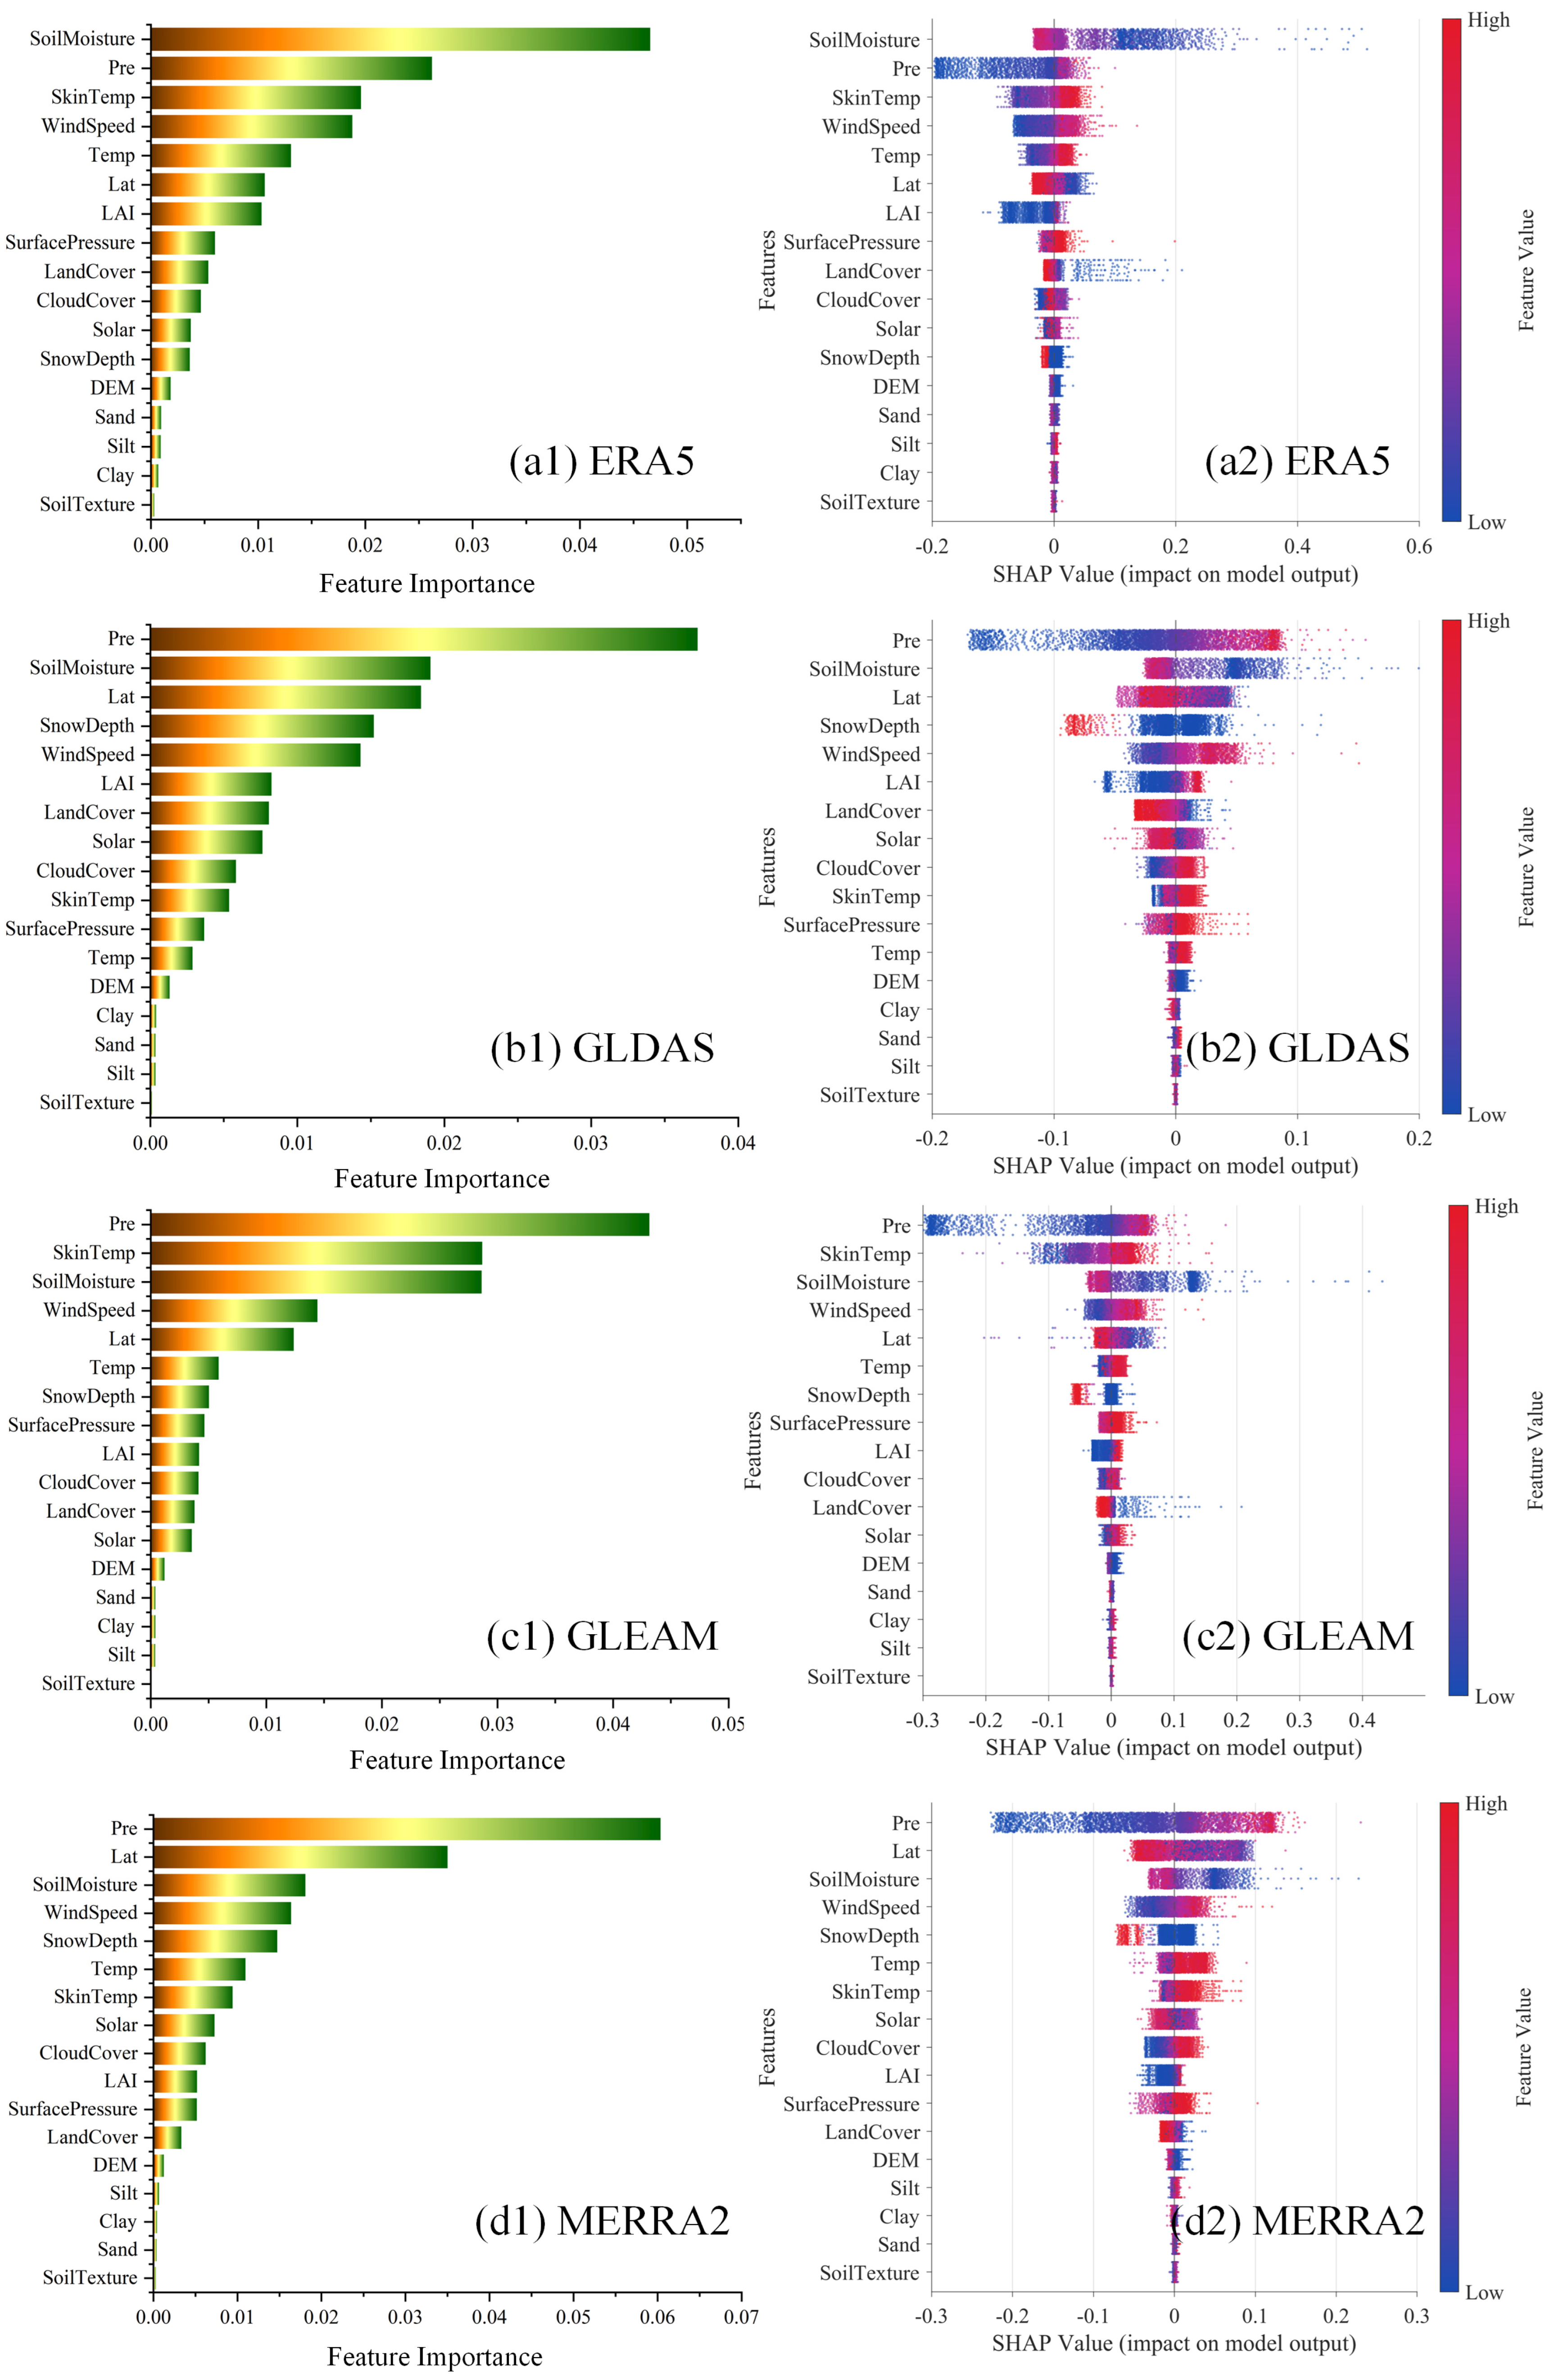
To elucidate the driving mechanisms underlying the RF gap-filling models, we employed SHAP analysis to evaluate the global importance of the 17 environmental predictors (Figure 7). The feature importance plots (Figure 7(a1–d1)) reveal that GLDAS, GLEAM, and MERRA2 are predominantly influenced by precipitation, whereas ERA5 is more highly sensitive to soil moisture. Overall, precipitation and soil moisture emerge as the most critical drivers across all four ET products. Additionally, latitude plays a substantial role in shaping GLDAS and MERRA2 outputs. Conversely, soil properties such as clay, silt, and soil texture exert the minimal impact on the gap-filling models.
Figure 7.
SHAP analysis of the environmental predictors for the RF-based error gap-filling models across four ET products: (a1,a2) ERA5, (b1,b2) GLDAS, (c1,c2) GLEAM, and (d1,d2) MERRA2. The left panels (a1–d1) display the mean absolute SHAP values, ranking the overall global feature importance. The right panels (a2–d2) present the SHAP swarm plots, illustrating the distribution of impacts for each feature. In the swarm plots, color represents the actual feature value (from blue/low to red/high), and the horizontal axis indicates the corresponding SHAP value (the impact on the model prediction).
Furthermore, the SHAP summary plots (Figure 7(a2–d2)) demonstrate the directional relationships. Soil moisture exhibits a consistent negative correlation with the predictions across all four ET products, while precipitation shows a universally positive correlation. Latitude is positively correlated with the model outputs for GLDAS and MERRA2. Finally, the aforementioned soil attributes (clay, silt, and soil texture) show negligible directional correlation with the gap-filling models across all datasets.
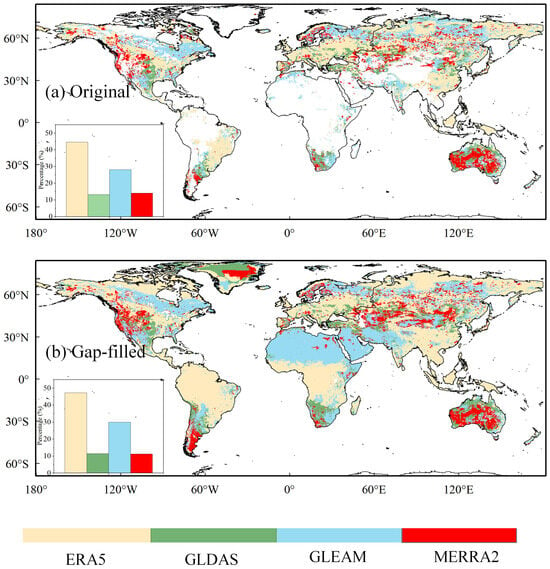
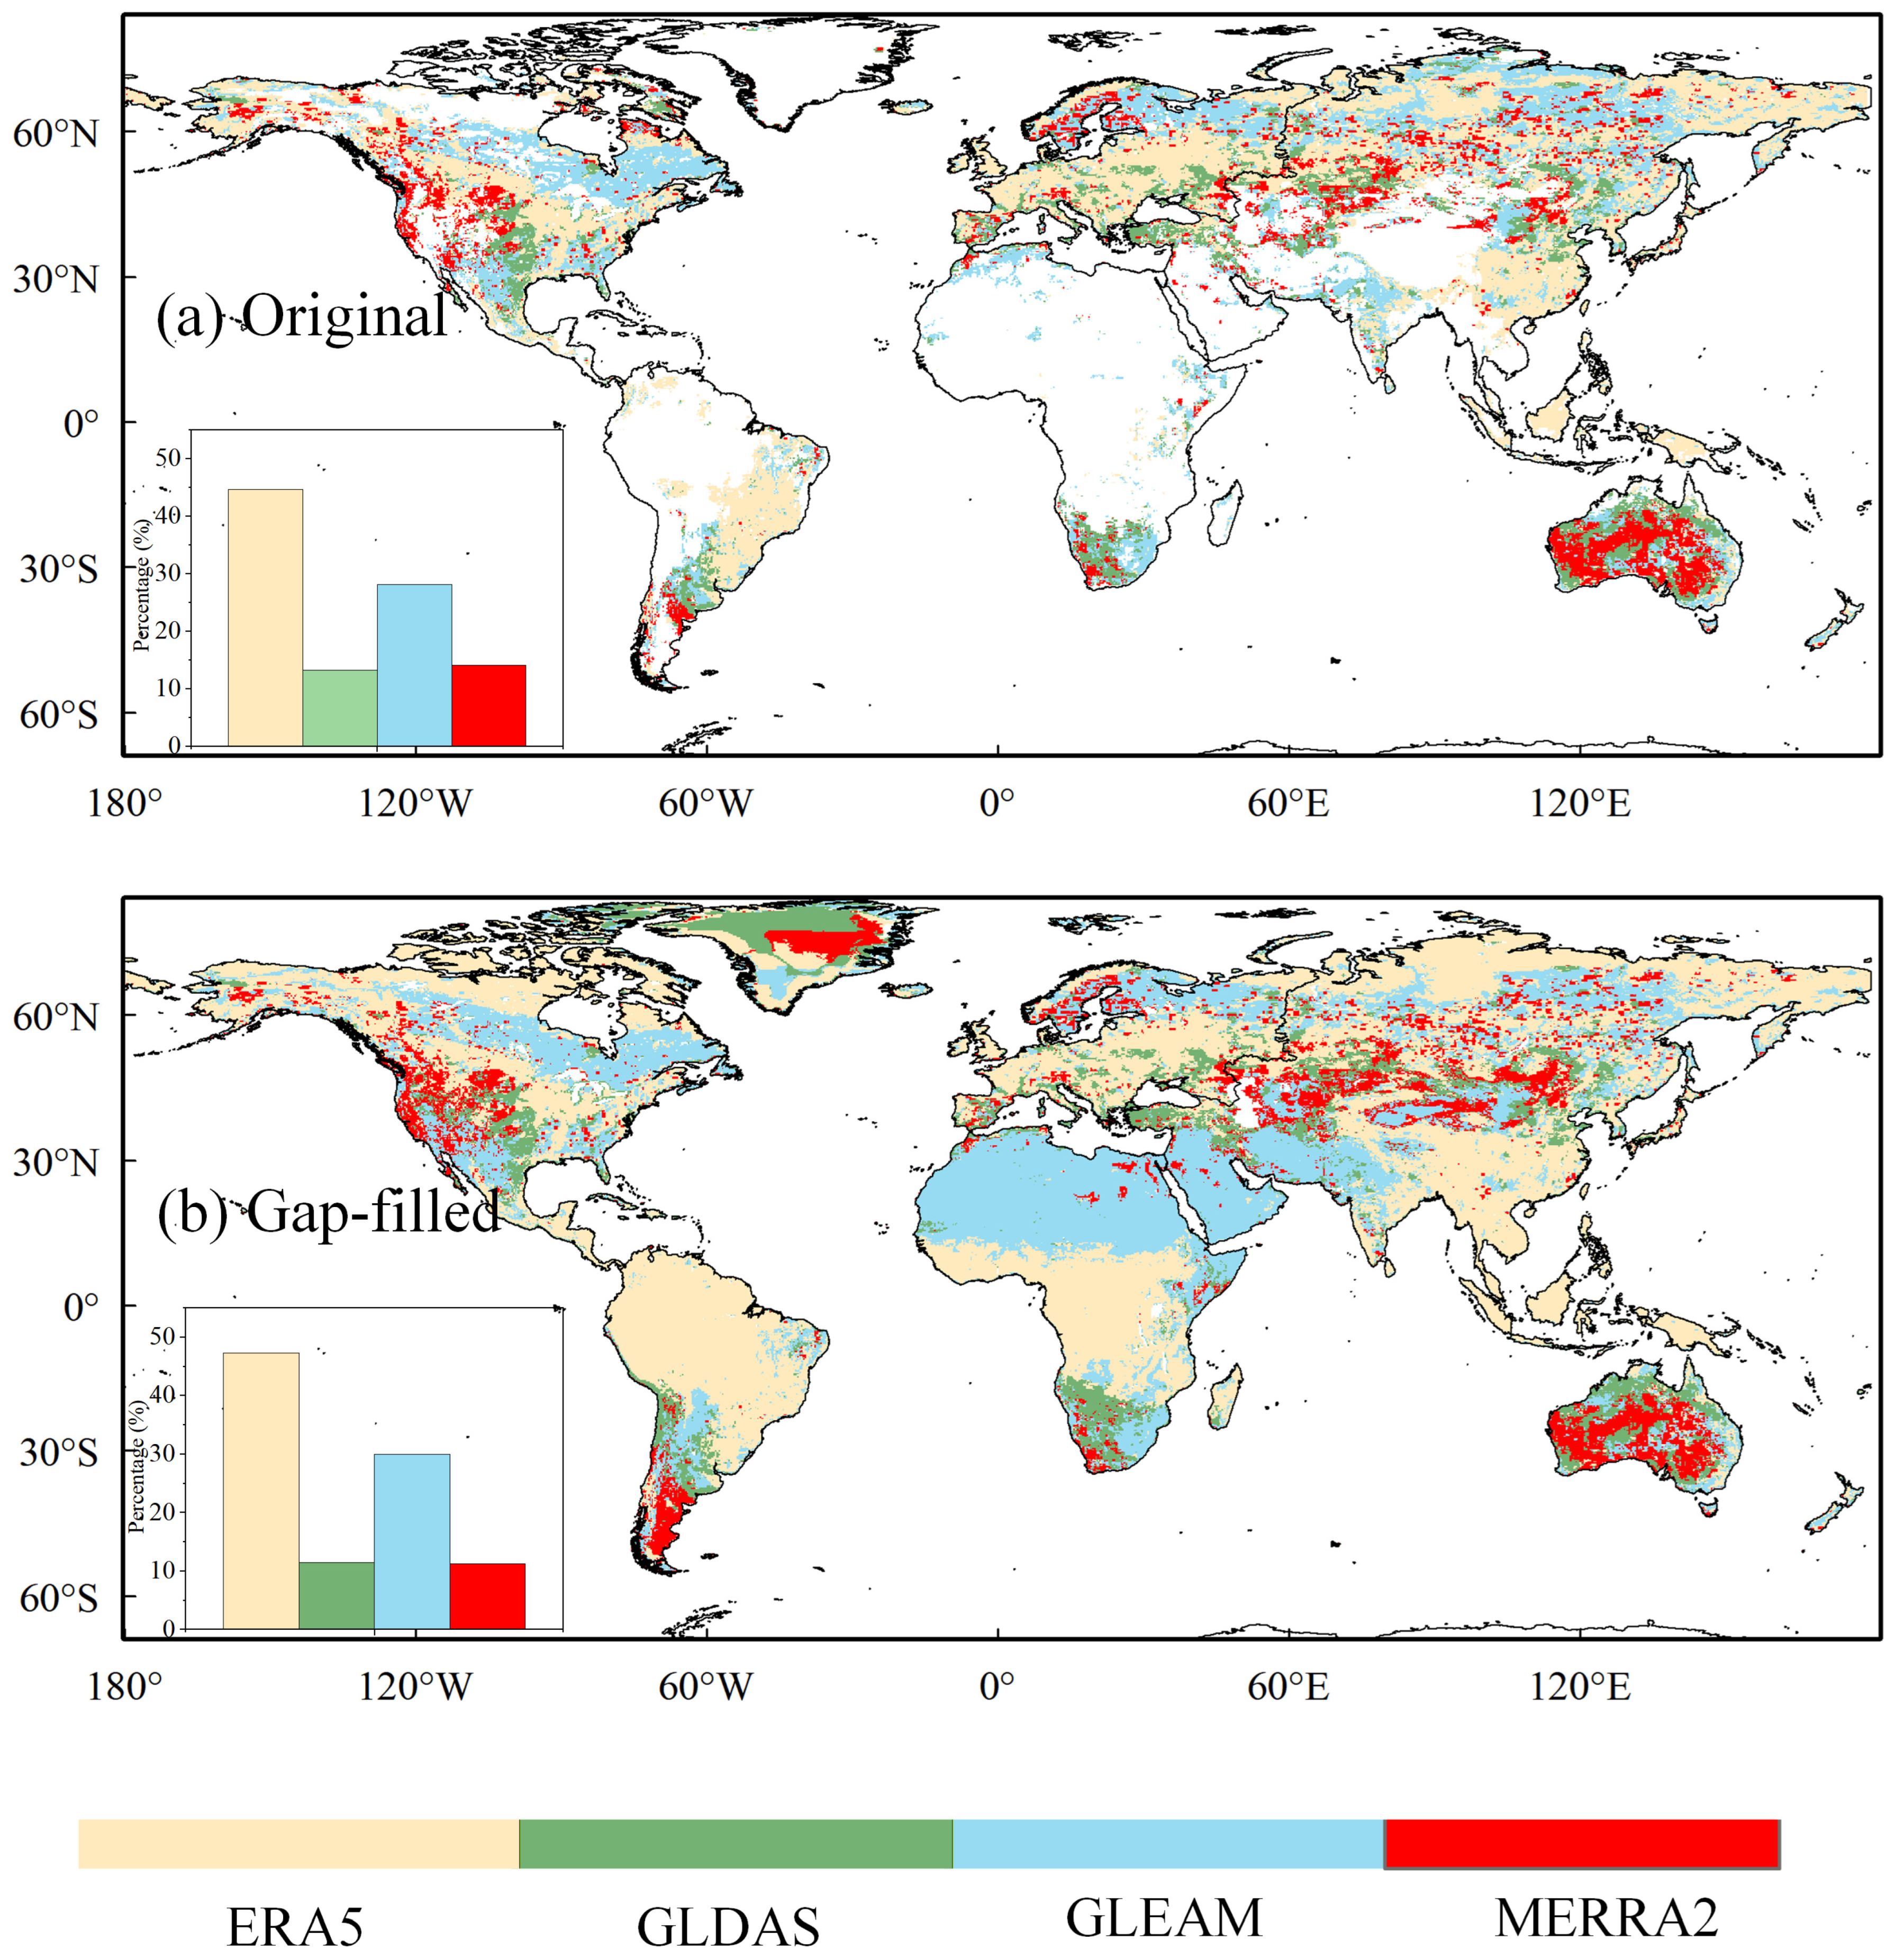
Global distribution of the ET product with the smallest QCA error exhibited distinct spatial patterns in Figure 8. In the original dataset before gap-filling (Figure 8a) ERA5 covered the largest area, which was mainly observed at mid-to-high latitudes. GLEAM ranked second (approximately 28%). Meanwhile, GLDAS (around 11%) and MERRA2 (around 11%) captured the remaining fragmented regions, with GLDAS concentrating heavily within dense tropical biomes.
Figure 8.
The ET product (ERA5, GLDAS, GLEAM, and MERRA2) with the smallest QCA error. (a) original QCA error and (b) spatially gap-filled QCA error using the RF model.
In general, the RF model effectively filled spatial gaps, primarily in Northern Africa and Greenland the gap-filled dataset in Figure 8b. The addition of these regions has shifted the overall areal proportions for the four ET products. Because GLEAM represented the product with the lowest estimated collocation error in these newly filled desert areas (e.g., Northern Africa) and MERRA2 dominated the glaciated areas (e.g., Greenland), their spatial footprints changed. By contrast, ERA5 yielded the lowest random errors in global tropical regions and the high-latitude regions of the Eurasian continent. Consequently, in the gap-filled dataset, the relative share of ERA5 and GLEAM slightly increased to approximately 48% and 30%, respectively, while GLDAS and MERRA2 increased to roughly 13% and 14%. Additionally, we analyzed the error differences of the product with the smallest error and the product with the second-smallest error in Figure S3. We found that the error differences were large in the tropics and northern areas of Siberia.
4. Discussion
Our findings assessed the evaluation power of the QCA method for ET products, as evidenced by the strongly positive correlations between QCA- and ground-based errors across all evaluated datasets (Figure 2). However, the systematic tendency of QCA to underestimate ET errors relative to the in situ benchmark highlights a critical inherent limitation in direct site-to-pixel validation, i.e., the spatial representativeness error [19,40]. Eddy covariance towers typically possess a limited measurement footprint that struggles to capture the extensive spatial heterogeneity encapsulated within a coarse 0.25° × 0.25° satellite or reanalysis grid cell [39,40,41]. Consequently, ground-based error estimates inevitably conflate the product’s intrinsic algorithmic error with the spatial mismatch between point-scale observations and gridded ET estimates.
By operating at the native grid scale, QCA circumvents the spatial mismatch between tower footprints and satellite pixels, which physically explains why its error estimates are systematically lower than ground-based metrics [3,35]. Furthermore, by stripping away this spatial representativeness artifact, QCA effectively separates the intrinsic algorithmic uncertainties of the ET datasets [19]. These algorithmic uncertainties stem directly from how each model parameterizes complex land surface processes, such as canopy conductance and soil evaporation. Therefore, isolating these structural biases allows us to objectively assess the algorithmic performance of each product across diverse land cover types in terms of the random error characteristics. Consequently, the distinct performance divergence observed among the products in highly structured biomes, such as forests and savannas, reflects genuine disparities in their underlying structural parameterizations rather than mere spatial scaling noise [8].
Building upon this validation, the seamless error maps identify distinct zones of algorithmic vulnerability, with pronounced high-error patterns emerging across central Canada, northern Argentina, and northern Australia (Figure 4). This spatial aggregation of uncertainty is strongly mediated by land cover heterogeneity [42]. Structurally simple biomes, such as shrublands and barren surfaces, tightly constrain error spreads and foster high consistency among all four ET products. Conversely, complex ecosystems characterized by dense canopies exacerbate predictive uncertainties. This discrepancy partly stems from the structural limitations of land surface models and reanalysis frameworks [43]. Complex landscapes necessitate intricate parameterizations for stomatal conductance, root-zone soil moisture stress, and canopy interception, thereby amplifying the error propagation derived from meteorological forcing data [3,42,43,44].
To overcome the inherent algorithmic non-convergence of QCA in data-sparse or highly heterogeneous regions, the integration of the RF model proved highly robust, yielding an exceptionally low mean prediction error of approximately 0.03 mm/day (Figure 5). Yet, the efficacy of this machine learning gap-filling varied spatially across products. GLEAM exhibited the most stable and spatially uniform performance, whereas the ERA5-based RF model demonstrated substantial skewed uncertainties, particularly in Mexico, Canada, the United States, the northern tropical regions of South America, and Europe. The elevated uncertainty in these tropical zones is likely attributable to the profound complexities of tropical cloud-radiation feedbacks and frequent convective precipitation, which inherently degrade the accuracy of the shortwave radiation and precipitation forcing ingested by the ERA5 atmospheric reanalysis [3,45,46].
Ultimately, the generation of a spatially seamless error map does more than merely patch data voids. It fundamentally redefines the geographic distribution of the product with the lowest estimated collocation error (Figure 8). Following the RF-based gap-filling, GLEAM’s optimal footprint notably expanded within arid deserts and glaciated terrains. By operating on the empirical Priestley-Taylor equation, GLEAM effectively circumvents the physiological parameterization pitfalls that plague complex land surface models in sparsely vegetated or extreme environments [29,47,48]. Conversely, the advanced data assimilation techniques underlying ERA5 enable it to consistently outperform other products across the hydro-climatically dynamic tropics and high-latitude Eurasia [3,42,49]. By delineating the precise spatial domains where each ET product performs best, our results underscore the limitations of relying solely on global average errors. This regional insight provides useful geographic guidance for optimizing multi-source data merging and land data assimilation frameworks in future global hydrological studies.
4.1. Limitations
The considered FLUXNET sites (N = 55) are mostly concentrated in Australia, North America, and sparse China or Europe locations. This may exert potential impacts on the global reliability claims for the QCA technique. More studies are needed in the future to incorporate more reliable site observations in the validation of the QCA reliability. Constrained by the limited geographical distribution of in situ data, the suitability of our constructed RF model needs further investigation across permafrost regions.
Because the predictor variables employed in our RF framework overlap with the input variables of the considered ET products, there is a potential circularity risk in the RF implementation.
ET errors were underestimated by the QCA method as most points fell below the 1:1 line in Figure 2a–d. Besides the spatial representativeness error, this may also stem from the inherent underestimation driven by energy balance closure uncertainty in eddy covariance measurements [50].
4.2. Future Prospects
As previous studies suggest time-variant error can largely deviate from time-invariant errors [34,51], future research may consider time-variant error characteristics.
5. Conclusions
This study evaluated the error characteristics of four mainstream global ET products (ERA5, GLDAS, GLEAM, and MERRA2) in 2000–2020. We first evaluated the reliability of the QCA method against eddy covariance measurements (N = 55) and then employed an RF algorithm driven by 17 environmental predictors to reconstruct spatially seamless ET error maps. The principal findings are summarized as follows:
- (1)
- The QCA-derived ET errors are correlated with ground-based errors across all four products, with Pearson’s correlation coefficients typically > 0.3. However, the QCA method tends to underestimate the ET errors when compared with the ground-based error estimates.
- (2)
- Implementation of the RF model successfully generated spatially seamless ET error maps with an exceptionally low mean prediction error of approximately 0.03 mm/day. These reconstructed maps show that the global average ET error is approximately 0.3 mm/day. There are consistently high error areas in the central part of Canada, the northern part of Argentina, the Indochinese Peninsula, and the northern part of Australia.
- (3)
- The gap-filling uncertainties are highly sensitive to both specific products and land cover types. GLEAM and MERRA2 demonstrated the most robust gap-filling performance with the lowest mean prediction errors and narrowest interquartile ranges across most biomes. Conversely, the ERA5-based RF model exhibited the highest uncertainties, characterized by highly skewed error distributions in complex land cover types such as forests, grasslands, and croplands.
- (4)
- The seamless reconstruction of extreme environments, such as Northern Africa and Greenland, shifted the global areal proportions of the ET products with the lowest random uncertainty. After spatial gap-filling, ERA5 exhibits the minimum QCA-estimated error over approximately 48% of the global land surface, primarily in tropical and mid-to-high latitudes, while GLEAM’s coverage demonstrates the lowest random error variance, expanded to roughly 30% due to its high temporal consistency in these newly filled desert and glaciated regions.
Our work provides critical insights into the spatially explicit error characteristics, offering direct and quantitative pixel-level guidance for optimizing multi-source ET data merging and land data assimilation frameworks globally.
Supplementary Materials
The following supporting information can be downloaded at: https://www.mdpi.com/article/10.3390/rs18081239/s1, Figure S1: ECC of the ERA5-GLEAM and ERA5-MERRA2 pairs; Figure S2: Percentage of non-convergent pixels for the (a) ERA4, (b) GLDAS, (c) GLEAM, and (d) MERRA2 ET products; Figure S3: Error differences of the product with the smallest error and the product with the second smallest error. Figure S4: The same as Figure 2 but for pre-gap-filled FLUXNET data derived from Li et al. [20]. Table S1: Correlation coefficients between QCA- and site-based ET errors for the pre-gap-filled (left panel) and gap-filled (right panel) sites data derived from Li et al. [20]. Table S2: Optimization parameters. Reference [20] has been utilized in the supplementary materials
Author Contributions
Methodology, W.Y. and T.J.; software, W.Y.; formal analysis, J.C.; investigation, T.J.; writing—original draft preparation, W.Y. and T.J.; writing—review and editing, W.Y., T.J., J.C. and K.W.; visualization, W.Y., T.J. and C.Z.; supervision, K.W.; funding acquisition, K.W. All authors have read and agreed to the published version of the manuscript.
Funding
This research was funded by the National Natural Science Foundation of China (32560278), the Hainan Province Natural Science Foundation of China (425QN249, 623RC447), and the Hainan University start-up fund (KYQD(ZR)22084).
Data Availability Statement
The original contributions presented in the study are included in the article; further inquiries can be directed to the corresponding author.
Acknowledgments
We acknowledge the FLUXNET2015 Dataset. This work used eddy covariance data acquired and shared by the FLUXNET community, including these networks: AmeriFlux, AfriFlux, AsiaFlux, CarboAfrica, CarboEuropeIP, CarboItaly, CarboMont, ChinaFlux, Fluxnet-Canada, GreenGrass, ICOS, KoFlux, LBA, NECC, OzFlux-TERN, TCOS-Siberia, and USCCC. The FLUXNET eddy covariance data processing and harmonization was carried out by the ICOS Ecosystem Thematic Center, AmeriFlux Management Project and Fluxdata project of FLUXNET, with the support of CDIAC, and the OzFlux, ChinaFlux and AsiaFlux offices. The list of sites used is provided in Supplementary Materials Table S1.
Conflicts of Interest
The authors declare no conflicts of interest.
References
- Fisher, J.B.; Melton, F.; Middleton, E.; Hain, C.; Anderson, M.; Allen, R.; McCabe, M.F.; Hook, S.; Baldocchi, D.; Townsend, P.A.; et al. The Future of Evapotranspiration: Global Requirements for Ecosystem Functioning, Carbon and Climate Feedbacks, Agricultural Management, and Water Resources. Water Resour. Res. 2017, 53, 2618–2626. [Google Scholar] [CrossRef] [Scilit]
- Pan, S.; Pan, N.; Tian, H.; Friedlingstein, P.; Sitch, S.; Shi, H.; Arora, V.K.; Haverd, V.; Jain, A.K.; Kato, E.; et al. Evaluation of Global Terrestrial Evapotranspiration Using State-of-the-Art Approaches in Remote Sensing, Machine Learning and Land Surface Modeling. Hydrol. Earth Syst. Sci. 2020, 24, 1485–1509. [Google Scholar] [CrossRef] [Scilit]
- Li, C.; Yang, H.; Yang, W.; Liu, Z.; Jia, Y.; Li, S.; Yang, D. Error Characterization of Global Land Evapotranspiration Products: Collocation-Based Approach. J. Hydrol. 2022, 612, 128102. [Google Scholar] [CrossRef] [Scilit]
- Li, C.; Han, J.; Liu, Z.; Tu, Z.; Yang, H. A Harmonized Global Gridded Transpiration Product Based on Collocation Analysis. Sci. Data 2024, 11, 604. [Google Scholar] [CrossRef] [Scilit]
- Zhang, B.; Xia, Y.; Long, B.; Hobbins, M.; Zhao, X.; Hain, C.; Li, Y.; Anderson, M.C. Evaluation and Comparison of Multiple Evapotranspiration Data Models over the Contiguous United States: Implications for the Next Phase of NLDAS (NLDAS-Testbed) Development. Agric. For. Meteorol. 2020, 280, 107810. [Google Scholar] [CrossRef] [Scilit]
- Xie, Q.; Jia, L.; Menenti, M.; Hu, G. Global Soil Moisture Data Fusion by Triple Collocation Analysis from 2011 to 2018. Sci. Data 2022, 9, 687. [Google Scholar] [CrossRef] [Scilit]
- Scipal, K.; Holmes, T.; de Jeu, R.; Naeimi, V.; Wagner, W. A Possible Solution for the Problem of Estimating the Error Structure of Global Soil Moisture Data Sets. Geophys. Res. Lett. 2008, 35, L24403. [Google Scholar] [CrossRef] [Scilit]
- Chen, F.; Crow, W.T.; Bindlish, R.; Colliander, A.; Burgin, M.S.; Asanuma, J.; Aida, K. Global-Scale Evaluation of SMAP, SMOS and ASCAT Soil Moisture Products Using Triple Collocation. Remote Sens. Environ. 2018, 214, 1–13. [Google Scholar] [CrossRef] [Scilit]
- Kim, H.; Wigneron, J.-P.; Kumar, S.; Dong, J.; Wagner, W.; Cosh, M.H.; Bosch, D.D.; Collins, C.H.; Starks, P.J.; Seyfried, M.; et al. Global Scale Error Assessments of Soil Moisture Estimates from Microwave-Based Active and Passive Satellites and Land Surface Models over Forest and Mixed Irrigated/Dryland Agriculture Regions. Remote Sens. Environ. 2020, 251, 112052. [Google Scholar] [CrossRef] [Scilit]
- Wu, K.; Ryu, D.; Wagner, W.; Hu, Z. A Global-Scale Intercomparison of Triple Collocation Analysis- and Ground-Based Soil Moisture Time-Variant Errors Derived from Different Rescaling Techniques. Remote Sens. Environ. 2023, 285, 113387. [Google Scholar] [CrossRef] [Scilit]
- Zhao, H.; Montzka, C.; Vereecken, H.; Franssen, H.-J.H. A Comparative Analysis of Remote Sensing Soil Moisture Datasets Fusion Methods: Novel LSTM Approach Versus Widely Used Triple Collocation Technique. IEEE J. Sel. Top. Appl. Earth Obs. Remote Sens. 2024, 17, 16659–16671. [Google Scholar] [CrossRef] [Scilit]
- Wu, X.; Lu, G.; Wu, Z.; He, H.; Scanlon, T.; Dorigo, W. Triple Collocation-Based Assessment of Satellite Soil Moisture Products with In Situ Measurements in China: Understanding the Error Sources. Remote Sens. 2020, 12, 2275. [Google Scholar] [CrossRef] [Scilit]
- Ford, T.W.; Quiring, S.M.; Zhao, C.; Leasor, Z.T.; Landry, C. Triple Collocation Evaluation of In Situ Soil Moisture Observations from 1200+ Stations as Part of the U.S. National Soil Moisture Network. J. Hydrometeorol. 2020, 21, 2537–2549. [Google Scholar] [CrossRef] [Scilit]
- Xu, L.; Chen, N.; Zhang, X.; Moradkhani, H.; Zhang, C.; Hu, C. In-Situ and Triple-Collocation Based Evaluations of Eight Global Root Zone Soil Moisture Products. Remote Sens. Environ. 2021, 254, 112248. [Google Scholar] [CrossRef] [Scilit]
- Khan, M.S.; Liaqat, U.W.; Baik, J.; Choi, M. Stand-Alone Uncertainty Characterization of GLEAM, GLDAS and MOD16 Evapotranspiration Products Using an Extended Triple Collocation Approach. Agric. For. Meteorol. 2018, 252, 256–268. [Google Scholar] [CrossRef] [Scilit]
- McCormick, E.L.; Sanders, L.E.; McColl, K.A.; Konings, A.G. Triple Collocation Validates CONUS-Wide Evapotranspiration Inferred from Atmospheric Conditions. EGUsphere 2025, 1–29. [Google Scholar] [CrossRef] [Scilit]
- Li, X.; Zhang, W.; Vermeulen, A.; Dong, J.; Duan, Z. Triple Collocation-Based Merging of Multi-Source Gridded Evapotranspiration Data in the Nordic Region. Agric. For. Meteorol. 2023, 335, 109451. [Google Scholar] [CrossRef] [Scilit]
- Wang, D.; Liu, S.; Wang, D. Triple Collocation-Based Uncertainty Analysis and Data Fusion of Multi-Source Evapotranspiration Data Across China. Atmosphere 2024, 15, 1410. [Google Scholar] [CrossRef] [Scilit]
- Park, J.; Baik, J.; Choi, M. Triple Collocation-Based Multi-Source Evaporation and Transpiration Merging. Agric. For. Meteorol. 2023, 331, 109353. [Google Scholar] [CrossRef] [Scilit]
- Li, W.; Yao, Z.; Qu, Y.; Yang, H.; Song, Y.; Song, L.; Wu, L.; Cui, Y. A Benchmark Dataset for Global Evapotranspiration Estimation Based on FLUXNET2015 from 2000 to 2022. Earth Syst. Sci. Data 2025, 17, 3835–3855. [Google Scholar] [CrossRef] [Scilit]
- Gruber, A.; Su, C.-H.; Zwieback, S.; Crow, W.; Dorigo, W.; Wagner, W. Recent Advances in (Soil Moisture) Triple Collocation Analysis. Int. J. Appl. Earth Obs. Geoinf. 2016, 45, 200–211. [Google Scholar] [CrossRef] [Scilit]
- Kim, H.; Crow, W.; Li, X.; Wagner, W.; Hahn, S.; Lakshmi, V. True Global Error Maps for SMAP, SMOS, and ASCAT Soil Moisture Data Based on Machine Learning and Triple Collocation Analysis. Remote Sens. Environ. 2023, 298, 113776. [Google Scholar] [CrossRef] [Scilit]
- Ming, W.; Ji, X.; Zhang, M.; Li, Y.; Liu, C.; Wang, Y.; Li, J. A Hybrid Triple Collocation-Deep Learning Approach for Improving Soil Moisture Estimation from Satellite and Model-Based Data. Remote Sens. 2022, 14, 1744. [Google Scholar] [CrossRef] [Scilit]
- Liu, K.; Li, X.; Wang, S.; Zhang, H. A Robust Gap-Filling Approach for European Space Agency Climate Change Initiative (ESA CCI) Soil Moisture Integrating Satellite Observations, Model-Driven Knowledge, and Spatiotemporal Machine Learning. Hydrol. Earth Syst. Sci. 2023, 27, 577–598. [Google Scholar] [CrossRef] [Scilit]
- Min, X.; Shangguan, Y.; Shi, Z. A Novel Merging Framework for Generating High-Accuracy Global Soil Moisture by Error Decomposition Through Multiple Collocation Analysis. IEEE Trans. Geosci. Remote Sens. 2024, 62, 4512219. [Google Scholar] [CrossRef] [Scilit]
- Keune, J.; Di Giuseppe, F.; Barnard, C.; Damasio da Costa, E.; Wetterhall, F. ERA5–Drought: Global Drought Indices Based on ECMWF Reanalysis. Sci. Data 2025, 12, 616. [Google Scholar] [CrossRef] [Scilit] [PubMed]
- Rodell, M.; Houser, P.R.; Jambor, U.; Gottschalck, J.; Mitchell, K.; Meng, C.-J.; Arsenault, K.; Cosgrove, B.; Radakovich, J.; Bosilovich, M.; et al. The Global Land Data Assimilation System. Bull. Am. Meteorol. Soc. 2004, 85, 381–394. [Google Scholar] [CrossRef] [Scilit]
- Miralles, D.G.; Holmes, T.R.H.; De Jeu, R.a.M.; Gash, J.H.; Meesters, A.G.C.A.; Dolman, A.J. Global Land-Surface Evaporation Estimated from Satellite-Based Observations. Hydrol. Earth Syst. Sci. 2011, 15, 453–469. [Google Scholar] [CrossRef] [Scilit]
- GLEAM4: Global Land Evaporation Dataset at 0.1° Resolution from 1980 to Near Present. Available online: https://repository.kaust.edu.sa/items/0980d173-e356-48b9-9bae-19c81d830eb7 (accessed on 9 March 2026).
- Gelaro, R.; McCarty, W.; Suárez, M.J.; Todling, R.; Molod, A.; Takacs, L.; Randles, C.A.; Darmenov, A.; Bosilovich, M.G.; Reichle, R.; et al. The Modern-Era Retrospective Analysis for Research and Applications, Version 2 (MERRA-2). J. Clim. 2017, 30, 5419–5454. [Google Scholar] [CrossRef] [Scilit]
- The FLUXNET2015 Dataset and the ONEFlux Processing Pipeline for Eddy Covariance Data|Scientific Data. Available online: https://www.nature.com/articles/s41597-020-0534-3 (accessed on 9 March 2026).
- Li, C.; Liu, Z.; Yang, W.; Tu, Z.; Han, J.; Li, S.; Yang, H. CAMELE: Collocation-Analyzed Multi-Source Ensembled Land Evapotranspiration Data. Earth Syst. Sci. Data 2024, 16, 1811–1846. [Google Scholar] [CrossRef] [Scilit]
- Zeng, C.; Liu, P.; Huang, L.; Feng, S.; Li, Y. Features of Architectural Landscape Fragmentation in Traditional Villages in Western Hunan, China. Sci. Rep. 2023, 13, 18633. [Google Scholar] [CrossRef] [Scilit] [PubMed]
- Wu, K.; Ryu, D.; Nie, L.; Shu, H. Time-Variant Error Characterization of SMAP and ASCAT Soil Moisture Using Triple Collocation Analysis. Remote Sens. Environ. 2021, 256, 112324. [Google Scholar] [CrossRef] [Scilit]
- Chen, F.; Crow, W.T.; Colliander, A.; Cosh, M.H.; Jackson, T.J.; Bindlish, R.; Reichle, R.H.; Chan, S.K.; Bosch, D.D.; Starks, P.J.; et al. Application of Triple Collocation in Ground-Based Validation of Soil Moisture Active/Passive (SMAP) Level 2 Data Products. IEEE J. Sel. Top. Appl. Earth Obs. Remote Sens. 2017, 10, 489–502. [Google Scholar] [CrossRef] [Scilit]
- Breiman, L. Random Forests. Mach. Learn. 2001, 45, 5–32. [Google Scholar] [CrossRef] [Scilit]
- Belgiu, M.; Drăguţ, L. Random Forest in Remote Sensing: A Review of Applications and Future Directions. ISPRS J. Photogramm. Remote Sens. 2016, 114, 24–31. [Google Scholar] [CrossRef] [Scilit]
- Hobeichi, S.; Abramowitz, G.; Evans, J.; Ukkola, A. Derived Optimal Linear Combination Evapotranspiration (DOLCE): A Global Gridded Synthesis ET Estimate. Hydrol. Earth Syst. Sci. 2018, 22, 1317–1336. [Google Scholar] [CrossRef] [Scilit]
- Mushagalusa, C.A.; Fandohan, A.B.; Glèlè Kakaï, R. Random Forest and Spatial Cross-Validation Performance in Predicting Species Abundance Distributions. Environ. Syst. Res. 2024, 13, 23. [Google Scholar] [CrossRef] [Scilit]
- Chu, H.; Luo, X.; Ouyang, Z.; Chan, W.S.; Dengel, S.; Biraud, S.C.; Torn, M.S.; Metzger, S.; Kumar, J.; Arain, M.A.; et al. Representativeness of Eddy-Covariance Flux Footprints for Areas Surrounding AmeriFlux Sites. Agric. For. Meteorol. 2021, 301–302, 108350. [Google Scholar] [CrossRef] [Scilit]
- Jin, T.; Zhong, C.; Yang, H.; Chen, J.; Zhang, Z.; Hu, Z.; Wu, K.; Shen, Y. Greater Climate Sensitivity of Older Forests than Younger Forests in the Extratropical Northern Hemisphere. Agric. For. Meteorol. 2026, 380, 111081. [Google Scholar] [CrossRef] [Scilit]
- Jiang, Q.; Li, W.; Fan, Z.; He, X.; Sun, W.; Chen, S.; Wen, J.; Gao, J.; Wang, J. Evaluation of the ERA5 Reanalysis Precipitation Dataset over Chinese Mainland. J. Hydrol. 2021, 595, 125660. [Google Scholar] [CrossRef] [Scilit]
- Michel, D.; Jiménez, C.; Miralles, D.G.; Jung, M.; Hirschi, M.; Ershadi, A.; Martens, B.; McCabe, M.F.; Fisher, J.B.; Mu, Q.; et al. The WACMOS-ET Project—Part 1: Tower-Scale Evaluation of Four Remote-Sensing-Based Evapotranspiration Algorithms. Hydrol. Earth Syst. Sci. 2016, 20, 803–822. [Google Scholar] [CrossRef] [Scilit]
- Anav, A.; Proietti, C.; Menut, L.; Carnicelli, S.; De Marco, A.; Paoletti, E. Sensitivity of Stomatal Conductance to Soil Moisture: Implications for Tropospheric Ozone. Atmos. Chem. Phys. 2018, 18, 5747–5763. [Google Scholar] [CrossRef] [Scilit]
- Baker, J.C.A.; Garcia-Carreras, L.; Gloor, M.; Marsham, J.H.; Buermann, W.; da Rocha, H.R.; Nobre, A.D.; de Araujo, A.C.; Spracklen, D.V. Evapotranspiration in the Amazon: Spatial Patterns, Seasonality, and Recent Trends in Observations, Reanalysis, and Climate Models. Hydrol. Earth Syst. Sci. 2021, 25, 2279–2300. [Google Scholar] [CrossRef] [Scilit]
- Xu, C.; Wang, W.; Hu, Y.; Liu, Y. Evaluation of ERA5, ERA5-Land, GLDAS-2.1, and GLEAM Potential Evapotranspiration Data over Mainland China. J. Hydrol. Reg. Stud. 2024, 51, 101651. [Google Scholar] [CrossRef] [Scilit]
- Priestley, C.H.B.; Taylor, R.J. On the Assessment of Surface Heat Flux and Evaporation Using Large-Scale Parameters. Mon. Weather Rev. 1972, 100, 81–92. [Google Scholar] [CrossRef] [Scilit]
- Fisher, J.B.; Tu, K.P.; Baldocchi, D.D. Global Estimates of the Land–Atmosphere Water Flux Based on Monthly AVHRR and ISLSCP-II Data, Validated at 16 FLUXNET Sites. Remote Sens. Environ. 2008, 112, 901–919. [Google Scholar] [CrossRef] [Scilit]
- The ERA5 Global Reanalysis—Hersbach—2020—Quarterly Journal of the Royal Meteorological Society—Wiley Online Library. Available online: https://rmets.onlinelibrary.wiley.com/doi/full/10.1002/qj.3803 (accessed on 9 March 2026).
- Wilson, K.; Goldstein, A.; Falge, E.; Aubinet, M.; Baldocchi, D.; Berbigier, P.; Bernhofer, C.; Ceulemans, R.; Dolman, H.; Field, C.; et al. Energy Balance Closure at FLUXNET Sites. Agric. For. Meteorol. 2002, 113, 223–243. [Google Scholar] [CrossRef] [Scilit]
- Alcantara, A.L.; Ahn, K.-H. Time-Varying Quadruple Collocation for Enhanced Satellite and Reanalysis Precipitation Data Error Estimation and Integration. Int. J. Appl. Earth Obs. Geoinf. 2024, 127, 103692. [Google Scholar] [CrossRef] [Scilit]

Disclaimer/Publisher’s Note: The statements, opinions and data contained in all publications are solely those of the individual author(s) and contributor(s) and not of MDPI and/or the editor(s). MDPI and/or the editor(s) disclaim responsibility for any injury to people or property resulting from any ideas, methods, instructions or products referred to in the content. |
© 2026 by the authors. Licensee MDPI, Basel, Switzerland. This article is an open access article distributed under the terms and conditions of the Creative Commons Attribution (CC BY) license.