


Highlights
What are the main findings?
- The Yangtze River Basin exhibited a distinct day–night asymmetric thermal evolution, with daytime SUHII intensifying significantly in downstream agglomerations.
- The proposed Risk Amplification Index (Ri) decoupled extreme heat from background warming, revealing that extreme temperatures amplify 1.5 to >5 times faster than the background climate.
- A critical threshold was identified: absolute Impervious Surface Area (ISA) density exceeding 70% triggers acute extreme heat amplification (Ri > 1.5) in contiguous urban zones.
What are the implications of the main findings?
- Urban heat governance must fundamentally shift from traditional “mean-state” UHI mitigation to targeted “extreme-event” climate adaptation.
- Time-specific strategies are urgently needed: prioritizing daytime evapotranspiration compensation in >70% ISA cores, while optimizing morphology for nighttime heat dissipation.
Abstract
Against the backdrop of global climate warming and rapid urbanization, urban thermal environments exhibit strong spatiotemporal heterogeneity and diurnal contrasts. Based on the high-resolution, seamless land surface temperature dataset (GSHTD), this study systematically evaluates the evolution of extreme urban thermal environments across 107 cities in the Yangtze River Basin (YRB) from 2001 to 2020. Urban cores were delineated using high-density impervious surface area (ISA ≥ 50%), and rural background temperatures were elevation-corrected. To quantify the asynchrony between extreme heat intensification and seasonal background warming, we propose “Risk Amplification Index (Ri)”. The results reveal that: (1) The surface urban heat island intensity (SUHII) intensified across the entire basin, with daytime increases being significantly stronger and more spatially consistent than nighttime ones. (2) The intra-annual SUHII cycle exhibits a unimodal pattern peaking in August, with widening inter-city disparities during the warm season. (3) The intensification of extreme heat is often asynchronous with background warming. Combined with land-use change intensity (ΔISA), our analysis indicates that small and medium-sized cities undergoing rapid expansion (high ΔISA) exhibit a stronger heat-risk amplification effect (higher Ri), whereas mature megacities (high total ISA but low ΔISA) show relatively synchronous thermal evolution. The results suggest that an ISA density of around 70% may act as a threshold beyond which extreme-heat amplification is more likely to intensify. These findings suggest that future heat-risk governance should be time- and region-specific, shifting the focus of climate-adaptive planning from solely megacities to mitigating extreme-heat risk amplification during the rapid urbanization of small and medium-sized cities.
1. Introduction
Driven jointly by global climate warming and human activities, the rapid deterioration of urban thermal environments has become a central concern in global environmental science [1,2,3]. Traditional urban heat island (UHI) research has predominantly focused on the mean temperature differences between urban and rural areas. However, with the increasing frequency of extreme weather events, the academic focus is shifting from the “mean thermal state” to “extreme heat events” [4,5]. In this context, the “Risk Amplification” effect has become increasingly prominent. From the perspectives of climate statistics and physical mechanisms, risk amplification refers to the phenomenon where the rate of extreme heat intensification significantly outpaces the background mean warming rate, representing a nonlinear shift in the “tail behavior” of temperature distributions [6,7,8]. This “asynchrony” between extreme heat and background warming not only triggers more severe public health crises but also poses devastating threats to urban infrastructure [9,10]. Therefore, accurately capturing and quantifying this risk amplification effect is an urgent requirement for current urban climate adaptation studies.
Despite numerous evaluations of regional or global land surface temperature (LST) trends using remote sensing, significant physical and methodological bottlenecks remain in characterizing extreme heat events [11,12,13]. First, most existing studies rely on traditional optical remote sensing data (e.g., MODIS). However, extreme heatwaves are often accompanied by strong convective activities or cloud cover, leading to severe “clear-sky bias” and massive data gaps in optical satellite observations during extreme weather [14,15]. Consequently, traditional studies often capture only the “mean state” while severely underestimating the true “extreme peaks.” Second, traditional temperature trend analyses (such as simple linear regression) tend to treat all observations in a time series equally, smoothing out the abrupt characteristics of extreme heat and failing to isolate the independent evolutionary trajectories of extreme heat risks [16,17]. Thus, it is imperative to introduce spatiotemporally continuous, seamless temperature datasets (such as GSHTD) to overcome data-missing limitations and truly reconstruct the evolution of extreme thermal environments [18].
Furthermore, existing assessment frameworks suffer from potential cognitive biases when measuring the heat-risk vulnerability of cities of different sizes. Without a specific risk amplification metric, policymakers and researchers may naturally assume that mature megacities—which possess the highest absolute temperatures—face the most severe warming threats [19,20]. However, the land-surface modification in megacities is often saturated, and their thermal environments may have entered a “plateau phase.” In contrast, small and medium-sized cities undergoing extensive sprawl experience rapid increases in impervious surface area (ΔISA), which may exert more drastic marginal disturbances on local microclimates [21]. Without a quantitative tool like the Extreme-Heat Risk Amplification Index (Ri), academia might fail to identify these hidden “amplification hotspots,” leading to a disproportionate allocation of cooling resources to megacities while neglecting the more climate-vulnerable small and medium-sized cities.
To address these issues, this study targets 2001–2020, a peak period of urbanization, and uses the high-resolution, spatiotemporally continuous GSHTD temperature dataset to reconstruct the diurnal evolution of SUHI across 107 cities in the YRB. Scientifically, rather than merely a socio-economic milestone, this two-decade window represents a critical biophysical transition phase for urban land surfaces in the basin [22]. During this period, the massive and rapid conversion of natural landscapes to high-density impervious surfaces fundamentally altered the regional surface energy balance—specifically through the sharp reduction in latent heat flux and the dramatic increase in thermal inertia [23,24,25]. These rapid alterations triggered distinct physical responses under solar forcing (daytime sensible heat dominance) and nocturnal cooling (heat storage release), making this period an ideal “natural laboratory” to capture the emergence and intensification of diurnal asymmetric warming [26,27]. By providing a basin-wide, long-term perspective over a period of rapid change, this work aims to establish a historical baseline for the urban thermal environment after profound transformations in land-surface cover. Methodologically, we develop a two-dimensional quadrant framework based on “intensity differences–trend differences” to identify asymmetric diurnal pathways of SUHI evolution, with particular attention to spatial contrasts among the upper, middle, and lower reaches of the river system and the regulating influence of the Meiyu (plum-rain) season [28]. We also introduce the Risk Amplification Index (Ri) to detect “risk points” where the warming rate of extreme heat outpaces background warming. By quantifying departures of city-level trends in annual extreme heat relative to background trends, we further examine the sensitivity and marginal effects of small and medium-sized cities [29]. These results help clarify the long-term cumulative influence of high-intensity urbanization on regional climate and provide historical evidence to support climate-adaptive planning and sustainable development for urban agglomerations under the broader context of Yangtze River protection.
2. Materials and Methods
2.1. Study Area
The Yangtze River Basin (90°33′E–122°25′E, 24°30′N–35°45′N) spans the three major topographic steps of China. The main stem is approximately 6300 km long, and the basin covers about 1.8 million km2, accounting for roughly 18.8% of China’s land area X (Figure 1). The region exhibits highly complex terrain, ranging from alpine valleys and gorges in the upper reaches and the Sichuan Basin to riverine plains and deltaic areas in the middle and lower reaches. Large elevation gradients and diverse landforms provide a heterogeneous surface background that strongly modulates local thermal environments [30].
Figure 1.
Location of the Yangtze River Basin (panel (a)), topographic features (panel (b)), and land-use/land-cover distribution (panel (c)).
Most of the basin lies within the subtropical monsoon climate zone, characterized by warm and highly humid conditions. Under the influence of the East Asian summer monsoon, summers are hot and wet. In particular, the middle and lower reaches are frequently controlled by the western Pacific subtropical high, triggering severe and prolonged summer heatwaves. The coupling of high temperatures and high humidity significantly elevates the wet-bulb temperature, leading to acute human heat stress [31]. This makes the YRB a highly climate-vulnerable region and a representative natural laboratory for studying urban thermal responses to extreme climate events.
Furthermore, as one of China’s most densely populated regions (supporting roughly 32% of the national population), the basin has experienced rapid and contiguous urbanization, forming three major urban agglomerations: the Yangtze River Delta, the Middle Reaches of the Yangtze River, and the Chengdu–Chongqing region. The massive expansion of impervious surfaces (ISA) and the spatial restructuring of urban forms have drastically altered the regional surface energy balance and anthropogenic heat emissions [32]. Consequently, long-term, basin-wide monitoring of urban thermal environments is essential not just for ecological security, but critically for safeguarding public health against accelerating extreme heat risks in this highly vulnerable region.
2.2. Data Source
This study focuses on the Yangtze River Basin (YRB) and quantifies the surface urban heat island (SUHI) using satellite-based temperature products. Because our analyses require monthly (2001–2020; 240 months) multi-dimensional comparisons across all-sky vs. clear-sky, day vs. night, and Tmax/Tmin/Tmean conditions, we selected spatially continuous and gap-free gridded temperature datasets, and used land cover and DEM data to delineate urban/rural zones and characterize topographic background.
2.2.1. Surface Temperature (LST) Data
The thermal data were derived from the Global Seamless Surface Temperature Dataset (GSHTD) developed by Yao et al. [33]. This dataset provides seamless global LST and near-surface air temperature at a 30-arcsecond spatial resolution from 2001 to 2023. The near-surface air temperature (Ta) component is based on the Global Surface Daily Summary Data provided by the National Climatic Data Center (NCDC), incorporating quality control across 6554 to 11,215 stations. Generated via the Cubist machine learning algorithm using MODIS observations, the GSHTD features global coverage and zero missing values. The dataset employs the Enhanced Thermal Unmixing (ETD) method to reconstruct clear-sky LST and integrates ERA5-Land reanalysis data to simulate all-sky LST under cloudy conditions. Although the reconstructed clear-sky LST represents a simulated state rather than instantaneous observation, it has been validated and widely utilized in long-term thermal climate studies.
2.2.2. Land Cover Data
Land cover characteristics were obtained from the China Land Cover Dataset (CLCD) produced by Yang and Huang [34]. This dataset provides annual land cover information for China at a 30 m resolution. It was generated on the Google Earth Engine (GEE) platform by applying a random forest classifier to Landsat imagery, supplemented by spatiotemporal filtering post-processing. With an overall accuracy of 79.31%, the CLCD outperforms global products such as MCD12Q1 and GlobeLand30 in the Chinese context. The dataset’s precise mapping of impervious surfaces, forests, and water bodies facilitates an accurate demarcation of urban-rural boundaries and the analysis of land-use dynamics across the 107 studied cities.
2.2.3. Digital Elevation Data
The Digital Elevation Model (DEM) data used in this study were derived from the Shuttle Radar Topography Mission (SRTM) dataset at a spatial resolution of 30 m, accessed via the Geospatial Data Cloud platform (http://www.gscloud.cn (accessed on 7 April 2025)). Prior to spatial analysis, the raw DEM tiles were mosaicked, reprojected to match the coordinate reference system of the land surface temperature (LST) products, and spatially resampled to a 1 km resolution to ensure pixel-to-pixel alignment.
This topographic dataset was utilized to extract the mean elevation of the urban cores and to implement strict elevation-based constraints for rural background selection. Specifically, a buffer threshold of ±50 m relative to the mean urban elevation was applied to filter eligible rural pixels. Because the typical environmental lapse rate dictates a temperature decrease of approximately 0.65 °C per 100 m of elevation gain, this ±50 m constraint effectively restricts topography-induced temperature variations to within ±0.3 °C. Consequently, this preprocessing step strictly eliminates the confounding influence of terrain relief, ensuring that the estimated Surface Urban Heat Island (SUHI) intensity purely reflects thermal differences driven by land cover variations rather than altitudinal gradients.
2.3. Urban–Rural Delineation and SUHI Construction
2.3.1. Urban Footprint Extraction and Spatial Resampling
To ensure cross-city comparability, this study utilizes the impervious surface area (ISA) as the proxy for urban built-up regions. Initially, ISA data were processed within the ENVI 5.1 environment using a decision-tree classification algorithm [32,35]. To align with the spatial scale of the temperature products, the 30 m ISA rasters were resampled to a 1 km resolution using the pixel aggregate method. Subsequently, the urban core was identified based on a specific ISA proportion threshold of 50% [36].
Specifically, the urban footprint of the final year (2020) was extracted and applied as a fixed spatial mask across the entire 2001–2020 study period. As demonstrated in recent long-term SUHI studies, using dynamically updated annual boundaries introduces a spatial sampling bias, where the continuous inclusion of newly urbanized, relatively cooler peripheral pixels artificially dilutes the mean urban temperature over time. By utilizing the maximum urban extent as a static Region of Interest (ROI), this study tracks the exact same spatial domain over two decades, ensuring that the calculated temporal trends purely reflect the long-term thermal evolution rather than mathematical artifacts caused by expanding calculation areas [37,38].
2.3.2. Rural Background Definition
The scientific delineation of rural background areas is essential for an accurate assessment of heat island intensity [39,40]. In this study, rural backgrounds were defined using a 10–15 km buffer ring. Specifically, buffer zones of 10 km and 15 km were constructed around the urban core boundary, and the inner buffer was erased from the outer one to create a ring-shaped reference area [39,41]. This strategy effectively minimizes the influence of mixed pixels in the urban-rural fringe and avoids the introduction of significant climatic or topographic heterogeneity associated with more distant regions. To maintain spatial integrity, all geospatial operations were conducted within a unified coordinate system, thereby eliminating uncertainties and geometric anomalies potentially caused by on-the-fly projection transformations [42]. While this fixed static buffer ensures the spatial consistency required for robust long-term time-series analysis (2001–2020), the potential uncertainties arising from gradual rural urbanization over time are acknowledged and thoroughly discussed in Section 4.3.2.
2.3.3. SUHI Calculation
Based on the delineated urban and rural domains, the Surface Urban Heat Island (SUHI) intensity is quantified as the urban–rural difference in land surface temperature. For city i, month t, and temperature condition k (seven categories), SUHI is defined as:
where
is the surface urban heat island intensity of city i in month t under condition k (°C);
is the mean land surface temperature over the urban core (°C);
is the mean land surface temperature over the rural reference zone (°C);
k denotes the temperature condition (7 classes): clear-sky daytime Ts, clear-sky nighttime Ts, all-sky daytime Ts, all-sky nighttime Ts, Ts mean, Ts maximum, and Ts minimum.
Furthermore, to enhance the mechanistic interpretation and attribution analysis, the absolute temperature trends for both urban and rural components were preserved and analyzed independently [43]. By distinguishing these trends, this study can discern whether observed changes in SUHI intensity are primarily driven by accelerated urban warming or by variations in the rural background environment, providing a more nuanced understanding of urban thermal dynamics.
2.4. Statistical Analysis Methods
2.4.1. Elevation Correction for Rural LST
Because the rural reference zone may have higher elevation than the urban core, rural LST is corrected using the widely accepted empirical environmental lapse rate of 0.006 °C m−1 [44,45]. Given the lack of high-resolution, long-term 3D atmospheric profile data across the entire basin, employing this standard constant provides a practical and consistent baseline for macro-scale topographic correction (potential uncertainties regarding this constant are further discussed in Section 4.3.2). Let the representative elevations of the urban and rural zones be and (m), respectively. The lapse rate is denoted as °C m−1 [46]. The rural temperature is adjusted to the urban elevation baseline as:
Thus, the elevation-corrected SUHI is:
where
is the elevation-corrected rural mean LST (°C);
is the SUHI after applying the rural elevation correction (°C);
and are representative elevations (m) of urban and rural zones;
γ is the environmental lapse rate.
2.4.2. Calculation of Monthly Climatology and Anomalies
Monthly time series commonly exhibit strong seasonal cycles [47]. To reduce the influence of seasonality on trend estimation, monthly anomalies are computed. For any variable Xi,t,k (e.g., LSTu, LSTr, SUHI or SUHIcorr), let m(t) ∈ {1, …, 12} be the calendar month corresponding to time t. The monthly climatology is defined as:
The monthly anomaly (deseasonalized series) is then defined as:
where
is the multi-year mean (2001–2020) for city i, month m, and condition k;
Nm is the sample size for month m;
Xi,t,k′ is the anomaly series used for interannual comparison and long-term trend testing.
2.4.3. Trend Significance Test
To test whether the monthly series exhibits a significant monotonic trend, the Seasonal Mann–Kendall (SK) trend test is applied [48,49]. The SK test uses calendar month as the seasonal block, calculates Kendall scores within each month, and then aggregates them to assess an overall monotonic trend.
where
denotes the monthly time series under test (either Xi,t,k or X′i,t,k).
τ is Kendall’s rank-based trend statistic.
p is the significance level.
2.4.4. Trend Magnitude Estimation
To obtain a trend estimate that is robust to outliers, Sen’s slope (Theil–Sen estimator) is used [50]. It is defined as the median of slopes computed from all pairs of observations:
where
is Sen slope;
and are time indices.
When t is measured in months, has units of °C/month. For consistency with common climate-trend reporting, the slope is converted to °C/10a
Here, 120 is the number of months in a decade, i.e., 10 × 12.
2.4.5. Significance Criterion and Reported Outputs
A trend is considered statistically significant when p < 0.05. A binary significance indicator is defined as:
Finally, for each city i and temperature condition k, the reported outputs include the trend magnitude (e.g., β10a), the p-value, and Sigi,k, these outputs are used for spatial mapping and grouped statistical comparisons in Section 3.
2.5. Construction of Risk Amplification Index (Ri)
To evaluate the disproportionate escalation of urban extreme heat relative to the overall summer background temperature, this study constructs the Risk Amplification Index (Ri). Rather than serving as a mechanistic attribution model, Ri is designed as a phenomenological indicator to quantify the asymmetric warming characteristics—specifically, whether the upper tail of the temperature distribution is widening faster than the mean state is shifting. Defined as the ratio of the trend rate of annual extreme high temperature to that of the summer average high temperature, this index provides a statistical measure of this non-synchronous growth.
2.5.1. Annual Maximum Series and Trend (TXx)
For each city c and each year y, the annual maximum (TXx) is extracted based on the daily maximum land surface temperature (Tmax) series, consistent with the temporal resolution of the dataset. The calculation is as follows:
where
is the annual maximum for city c in year y.
is the Tmax for city c at time t.
denotes that time t belongs to year y.
2.5.2. Warmest Quarter Series and Trend (TWQ)
To characterize the background summer heat level in each year, we select, within each year, the three calendar months (out of 12) with the highest Tmax and compute the mean across these three months, thereby constructing an annual “mean of the hottest three months” time series. This series is used to describe interannual variations in the background high-temperature level.
where
denotes the annual warm-quarter (hottest-three-month) mean Tmax for city c in year y;
denotes the set of the hottest three months in that year;
denotes the monthly Tmax value for the corresponding month m in year y for city c.
2.5.3. Trend Magnitude (Sen’s Slope) and Significance (Mann–Kendall Test)
Trend estimation and significance testing are conducted separately for the annual maximum series and the hottest-three-month mean series . Trend magnitude is represented by Sen’s slope, and statistical significance is quantified by the p-value derived from the Mann–Kendall (MK) trend test, which together are used to identify trends and estimate their rates.
where
c and are the Sen’s slope estimates for and , respectively (unit: °C/10a);
and are the corresponding MK-test p-values;
SenSlope(⋅)and MK(⋅)denote the procedures for Sen’s slope estimation and the MK trend test, respectively.
2.5.4. Definition of Ri and Risk Classification
To quantify the amplification of the extreme-end warming rate relative to the background high-temperature warming rate, the extreme-heat Risk Amplification Index for city c is defined as the ratio of the two trend magnitudes. Specifically, Ric > 1 indicates that extreme heat increases faster than background warming, whereas Ric < 1 indicates that extreme heat increases more slowly than background warming.
where
denotes the extreme-heat Risk Amplification Index (dimensionless) for city c;
is the trend magnitude of the annual-maximum series;
is the trend magnitude of the hottest-three-month mean series.
2.5.5. Physical and Statistical Rationale:
Mechanistically, the background warming trend () is primarily governed by long-term radiative forcing and gradual urban surface modifications, representing a shift in the mean climate state. In contrast, extreme heat trends () are often driven by the complex coupling of synoptic-scale circulation anomalies and local urban land-atmosphere feedbacks [51,52]. Therefore, is not a causal attribution model assuming that background warming directly drives extreme warming. Instead, it serves as a phenomenological exposure metric. Specifically, > 1 indicates a synergistic penalty where extreme thermal stress escalates disproportionately compared to the background trend, exposing urban populations to amplified risks.
Furthermore, to address the inherent mathematical volatility of extreme values, which could theoretically cause instability in a ratio-based index, this study utilizes the Theil-Sen estimator for all trend extractions (as detailed in Section 2.5.3). As a robust, non-parametric median-based method, Sen’s slope effectively dampens the noise and transient fluctuations of extreme events [53], ensuring that reflects a stable, long-term structural divergence rather than mathematical artifacts.
2.5.6. Ri Classification Rules
To facilitate result interpretation, cross-city comparison, and practical urban risk management, the continuous index Ri is further classified into discrete risk categories. Because Ri is a novel metric proposed in this study to quantify warming asymmetry, there are no established thresholds in the existing literature. Therefore, the classification thresholds were heuristically determined based on a combination of baseline logic (Ri = 1 representing synchronous warming), statistical distribution, and policy operability. The specific categories are defined as follows:
High Risk ( > 1.5): Extreme warming is significantly faster than overall warming. A threshold of 1.5 conceptually represents a scenario where the extreme trend outpaces the background trend by more than 50%, serving as a clear operational boundary for policymakers to identify cities facing severe thermal amplification.
Moderate Risk (1.1 < ≤1.5): Extreme warming is moderately faster than background warming, representing a recognizable but non-extreme amplification (approximately 10% to 50%).
Synchronous (0.9 ≤ ≤ 1.1): The difference between the two trend magnitudes is within ±10%, which is considered approximately synchronous.
Low Risk ( < 0.9): Extreme warming is slower than overall warming.
While this classification primarily serves to facilitate risk stratification and the selection of representative cities, we acknowledge that these specific cutoff values are empirical rather than absolute physical constants. To ensure the robustness of our findings, we report continuous Ri values throughout the analysis.
2.6. Extraction of Impervious Surfaces and Calculation of Urban Expansion Intensity
We extracted the spatial distribution of impervious surface area (ISA) for 107 cities in the Yangtze River Basin in 2001 and 2020 using 30 m resolution land cover raster data [38]. To precisely quantify the expansion intensity of each city, an automated pixel-based spatial analysis workflow was implemented. Initially, the vector data of municipal boundaries were utilized as spatial masks to extract the regional land cover data [51]. To ensure statistical accuracy, background ‘NoData’ pixels located outside the irregular administrative boundaries were excluded. Subsequently, the total valid pixels (Ntotal and the pixels specifically classified as ISA (Nisa) within each boundary were extracted and counted. The ISA ratio (ISAratio) for a given year and the urban expansion intensity (ΔISA) over the study period were defined as follows:
where
ISAratio represents the proportion of impervious surface coverage for a specific year;
Nisa denotes the total number of pixels classified as impervious surfaces (e.g., buildings, roads) within the masked municipal boundary;
Ntotal is the total number of valid pixels within the boundary (excluding background values and NoData regions);
ΔISA represents the absolute net change in the ISA ratio from 2001 to 2020, serving as the indicator of urban expansion intensity;
ISAratio_2020 and ISAratio_2001 denote the ISA proportions in 2020 and 2001, respectively.
3. Results
3.1. Monthly Urban–Rural LST and SUHII Time-Series Characteristics
3.1.1. Overall Evolution of Urban and Rural LST and SUHI
Figure 2 illustrates the diurnal evolution of monthly urban LST, rural LST, and SUHII (urban minus rural) for the study cities in the Yangtze River Basin (YRB) during 2001–2020. The six panels correspond to daytime/nighttime urban and rural LST, as well as daytime and nighttime SUHII.
Figure 2.
Monthly scale diurnal evolution and long-term trends of urban and rural land surface temperature (LST) and SUHII in the Yangtze River Basin, 2001–2020.
Overall, both the urban and rural temperature series exhibit a pronounced intra-annual (seasonal) cycle, characterized by higher values in the warm season and lower values in the cold season. This stable seasonal cycle indicates that monthly LST (and SUHII) is strongly controlled by seasonality.
In terms of long-term change, the warming trend of daytime urban LST is the most pronounced (+1.13 °C/decade), while nighttime urban LST also shows warming (+0.68 °C/decade). By contrast, warming in daytime and nighttime rural LST is weaker, at +0.54 °C/decade and +0.48 °C/decade, respectively. The difference in warming rates between urban and rural areas produces a clear intensification signal in SUHII: the daytime SUHII trend is +0.59 °C/decade, exceeding the nighttime SUHII trend of +0.21 °C/decade.
The 95% confidence intervals in the figure reflect the degree of dispersion across cities and reveal substantial inter-city differences [54]. In most months, the dispersion bands for urban/rural LST and SUHII are visibly wide, indicating that the thermal environment and heat-island intensity across YRB cities are not synchronized, but instead display strong spatial heterogeneity [55].
3.1.2. Results of Monthly Climatology and Anomalies
The intra-annual distribution of SUHII in the YRB generally follows a unimodal pattern [56], but with a distinct plateau/slowed increase during May–June, followed by a peak in August (upper panel of Figure 3) [57]. Daytime SUHII increases month by month from winter and reaches its maximum in midsummer, with August as the peak month; across cities, the peak-month intensity has a mean of 6.209 °C and a median of 3.629 °C. It then decreases rapidly from autumn onward and remains low in winter [58,59]. The seasonal curve of nighttime SUHII is comparatively flatter, but the peak month is also August, with a cross-city mean of 3.752 °C and a median of 1.171 °C.
Figure 3.
Monthly climatological seasonal cycle and anomaly evolution of surface SUHII in the Yangtze River Basin.
For both daytime and nighttime, the peak month shows a mean clearly higher than the median, implying a potentially right-skewed distribution across cities (i.e., a small number of cities with very high SUHII elevates the mean). Against this background, we use the cross-city median and interquartile range (P25–P75) to represent the central tendency and typical dispersion of the seasonal cycle in a more robust manner: the line denotes the cross-city median, and the shaded band denotes the range spanning the middle 50% of cities. The width of the shaded band indicates that the dispersion of daytime SUHII is much larger in the warm season than in the cold season, suggesting that inter-city differences in heat-island intensity are more pronounced in summer [60,61].
Based on the heatmap of monthly SUHII anomalies (lower panel of Figure 3), removing the seasonal cycle allows interannual anomalous phases to be identified more clearly. Overall, both daytime and nighttime anomalies exhibit a staged shift from predominantly negative anomalies in the early period to more frequent positive anomalies in the later period: during 2001–2010, negative anomalies dominate in most months; since 2011, positive anomalies occur more frequently and are particularly prominent in warm-season months in some years [62,63]. Compared with daytime anomalies, nighttime anomalies show a more continuous pattern of positive anomalies after 2010, whereas daytime anomalies display larger interannual variability and stronger month-to-month contrasts [64].
3.1.3. Long-Term Trend Characteristics of SUHII and Its Spatial Differences
Table 1 shows that daytime SUHII generally exhibits a widespread strengthening trend during the study period [65,66]. Most cities show an increasing trend in daytime heat-island temperature [67,68] and pass the significance test, indicating that daytime heat-island intensity in most cities has a stable long-term increasing signal. The inter-city differences in daytime trend magnitude are significant, with the strengthening rate ranging from near zero to high values. Cities with relatively large increases include Jiangbei County (about 1.64 °C/10a), Chongqing County (about 1.43 °C/10a), Nankang County (about 1.28 °C/10a), and Deqing County (about 1.14 °C/10a), suggesting that the enhancement of daytime SUHII is not only widespread, but also presents a stronger amplification effect in some cities [69]. Meanwhile, a small number of cities show non-significant changes or slightly negative slopes that are not significant (e.g., Jiaxing and Haining), indicating that the strengthening of daytime SUHII does not occur synchronously in all cities, and its long-term evolution still has clear spatial heterogeneity [66,70].
Table 1.
Daytime and nighttime SUHII trend slopes (Sen’s slope) and significance for representative cities in the Yangtze River Basin.
Nighttime trends are still dominated by strengthening overall [43,69,71,72]. Most cities still show an increasing trend in heat-island temperature at night, and a considerable proportion reach significance; however, the number of cities without significant nighttime trends increases noticeably, and a few cities even show significant weakening, such as Shashi (about −0.19 °C/10a, p < 0.01) and Guixi (about −0.15 °C/10a, p ≈ 0.03). The magnitude of nighttime strengthening is overall smaller than that of daytime; the maximum nighttime strengthening rates are about 0.85 °C/10a in Dengzhou, 0.75 °C/10a in Nanyang, and 0.66 °C/10a in Nanchong County.
3.2. Characteristics of Day–Night Differences in the Urban Heat Island Effect
3.2.1. Overall Pattern and Sub-Regional Differences in Day–Night SUHII and Trend
Table 2 presents the results that among the 107 cities, only 9 cities show “stronger at night”, accounting for 8.49%. The overall median Δmean is −1.297 °C (IQR: −1.957 to −0.625 °C), and the mean is −1.389 ± 1.279 °C. The sub-regional comparison further shows that the downstream group most prominently exhibits stronger daytime SUHII relative to the upstream and midstream groups: the number of downstream cities with stronger nighttime SUHII than daytime is 0, and the median Δmean reaches −1.943 °C (mean: −2.219 ± 1.267 °C), substantially stronger than the upstream (median: −0.860 °C) and midstream (median: −0.945 °C). Although the upstream is still dominated by stronger daytime SUHII, the proportion of cities with stronger nighttime SUHII is relatively higher (21.74%). In terms of long-term trends, the day–night difference is also dominated by “faster daytime increase”. Among the 107 cities, only 16 cities meet the criterion of faster nighttime increase, accounting for 15.09%. The overall median Δtrend is −0.406 °C/10a (IQR: −0.590 to −0.166 °C/10a), and the mean is −0.390 ± 0.356 °C/10a.
Table 2.
Day–night comparison statistics of mean SUHII (Δmean) and long-term trend (Δtrend) for Yangtze River Basin cities by sub-region (Upper/Middle/Lower), 2001–2020.
3.2.2. Distribution Patterns and Evolutionary Modes of Day–Night Heat-Island Intensity
To further analyze the spatial differentiation and dynamic evolution of urban heat islands in the Yangtze River Basin at the day–night scale, this study constructed a scatter plot comparing daytime and nighttime mean SUHII and a two-dimensional quadrant plot of “intensity difference–trend difference” (Figure 4).
Figure 4.
Scatter plot of mean daytime versus nighttime SUHII across the Yangtze River Basin (2001–2020).
Figure 4 shows that most downstream city points are distributed in a high-value range of 2.0–4.5 °C on the x-axis (daytime mean), whereas the y-axis (nighttime mean) is mostly concentrated between −1.0 and 1.0 °C; some cities even show an extreme contrast of a significant heat island in the daytime but a cool island at night [65,73]. The color scale indicates that the absolute day–night intensity difference in downstream cities is generally large, suggesting that this region has the most pronounced day–night asymmetry in the thermal environment [74]. Upstream and midstream cities show a relatively more compact distribution and are closer to the 1:1 line; some upstream cities are even located above the line, corresponding to a few special cases where nighttime heat-island intensity is slightly higher than daytime. This indicates that, compared with the downstream, the magnitude of day–night heat-island differences in the upstream and midstream is smaller [55,75].
From the “intensity–trend” two-dimensional evolutionary pattern, Figure 5 constructs four quadrants using Δmean (x-axis) and Δtrend (y-axis) to identify the matching relationship between SUHII and its rate of change. The results show a pronounced clustering in the third quadrant. This negative distribution featuring “synchrony in intensity and rate” indicating that daytime has generally larger SUHII changes than nighttime. In addition, the heterogeneity of spatial gradients is clearly reflected in the two-dimensional quadrant plot. Square points representing the downstream are almost all densely concentrated in the lower-left corner of the third quadrant, showing extremely large negative differences. Triangle points representing the upstream are the most dispersed, spanning three quadrants. In addition to the main cluster in the third quadrant, some upstream cities are located in the first quadrant, showing stronger nighttime heat islands and faster nighttime intensification; a very small number of cities are located in the second quadrant, indicating that although nighttime intensity is weaker, nighttime intensification has already exceeded daytime, showing a catching-up trend. Overall, the day–night evolutionary patterns of urban heat islands in the Yangtze River Basin exhibit significant spatial differentiation: the downstream shows a generally similar daytime-dominated pattern, whereas the upstream presents more diverse evolutionary pathways [76].
Figure 5.
Two-dimensional quadrant analysis of the differences in intensity (Δmean) and trend (Δtrend) between nighttime and daytime SUHII.
3.3. Characteristics of Extreme High Temperature Relative to Background Warming
To reveal the evolution characteristics of extreme high-temperature events under the background of climate warming, this section compares cities across the entire basin using the amplification ratio (Amplification Ratio, Ri).
3.3.1. Comparison of Representative Cities in the Upper, Middle, and Lower Reaches
To characterize the annual background high-temperature level, this study selects, for each year, the three calendar months with the highest land surface temperature and takes their mean to construct an annual “mean of the hottest three months” series.
It should be noted that the combination of the three months is not required to be consecutive; therefore, the “Months” in Table 2 may present non-consecutive month combinations.
Table 3 shows the summer background trend, the annual extreme trend, and their ratio Ri, which can visually reflect the difference between “synchronous warming” and “non-synchronous amplification. “Among upstream cities, Chongqing has Ri = 1.06, close to 1, indicating that the annual extreme endpoint and the summer background warming are generally synchronous; Chengdu has Ri = 1.22, entering the moderate-risk range, showing that the extreme endpoint warms slightly faster than background warming; Yibin has Ri = 0.46, indicating that the extreme endpoint changes significantly more slowly than background warming. Among midstream representative cities, Wuhan has Ri = 1.21, indicating moderate risk, while Changsha has Ri = 1.52, close to the high-risk threshold, suggesting a stronger amplification feature of annual extreme endpoint warming; Nanchang has Ri ≈ 1, indicating a synchronous type. Downstream cities also show clear differences: Nanjing has Ri = 1.77 and is a high-risk city; Hangzhou and Hefei have Ri = 1.34 and are moderate risk; while Shanghai has Ri = 0.89 and falls into the low-risk range, showing that extreme endpoint warming is weaker than background warming. Overall, the comparison of representative cities indicates that even within the same basin, Ri can still span multiple levels from “low risk—synchronous—moderate—high risk,” reflecting that differences in extreme endpoint changes relative to background warming are not uniform [10,77].
Table 3.
Comparison of hot-season mean SUHII trends and annual-maximum SUHII trends in selected representative cities across the Yangtze River Basin, and the derived Extreme Sensitivity Index (Ri).
3.3.2. City Comparison and Significance Under Ri Ranking
Figure 6 further provides a ranked comparison for cities across the entire basin: the upper panel shows the top 15 cities with the highest Ri (from high to low), and the lower panel shows the bottom 15 cities with the lowest Ri (from low to high), to highlight the strongest and weakest tail samples. Among the high-Ri samples in Figure 6, Suining has Ri = 2.25 (summer-mean trend 0.304, annual-maximum trend 0.683), Dengzhou has Ri = 1.58 (0.460 ** and 0.728), Ma’anshan has Ri = 1.57 (0.319 and 0.499), Nanjing has Ri = 1.77 (0.140 and 0.247), Zhenjiang has Ri = 1.73 (0.136 and 0.235), Jintan County has Ri = 1.54 (0.280 ** and 0.432), and Changde has Ri = 1.70 (0.219 and 0.373), all of which show a clear uplift of annual extreme endpoint trends relative to background trends.
Figure 6.
Summer mean warming trends of the top and bottom 15 cities ranked by the Risk Amplification Ratio (Ri).
Low-Ri cities reflect “background warming exists, but the extreme endpoint warms relatively slowly or is not significant.” Typical examples include Yangzhong County with Ri = 0.20 (0.064 and 0.013), Nantong with Ri = 0.23 (0.080 and 0.018), Wujin County with Ri = 0.29 (0.202 * and 0.059), and Ziyang City with Ri = 0.19 (0.204 * and 0.039). However, a low Ri does not mean “no warming,” but rather emphasizes that “the amplification of the extreme endpoint relative to the background is weaker.”
3.3.3. Two-Dimensional Correspondence Between Background Trends and Extreme Trends
Figure 7 uses the summer background trend as the x-axis and the annual extreme endpoint trend as the y-axis, with y = x as the reference line for Ri = 1. From the distribution, most city points form a band near y = x, showing that enhanced background warming is usually accompanied by a synchronous rise in the annual extreme endpoint, presenting an overall positive correspondence.
Figure 7.
Relationship between the summer mean warming trend and the yearly maximum temperature trend with risk amplification characteristics.
Meanwhile, the deviation of points relative to y = x reveals significant non-synchronicity. Cities clearly above the reference line correspond to Ri > 1, representing that “extreme endpoint warming leads background warming”; cities below the reference line correspond to Ri < 1, representing that “extreme endpoint warming lags behind background warming.” Such deviations can occur in cities with either large background trends or small background trends; especially when the background trend approaches zero, points can show stronger vertical instability, causing Ri values to fluctuate sharply.
3.4. Combined Analysis of Ri and Impervious Surface Dynamics
3.4.1. Spatial-Temporal Expansion Characteristics of Impervious Surfaces in the YRB
Based on the LULC extraction results from 2001 to 2020 (Figure 8), all sampled cities across the YRB experienced significant ISA expansion. Spatially, the expansion intensity (ΔISA) exhibited substantial regional heterogeneity [78,79]. For instance, the net ISA growth in Hefei (downstream) and Changsha (midstream) reached 0.477 and 0.451, respectively (Table 4). Expansion in certain county-level cities or emerging urban districts was even more drastic, with ΔISA reaching 0.691 in Xinjian and 0.671 in Jiangbei. In contrast, mature megacities demonstrated distinct statistical patterns [80,81]. Shanghai, for example, had an initial ISA ratio of 0.512 in 2001, which grew to 0.806 in 2020. Despite this high absolute coverage, its net growth intensity during the study period remained relatively moderate (ΔISA = 0.294).
Figure 8.
Spatial coupling patterns between urbanization intensity (ΔISA) and the extreme heat Risk Amplification Index (Ri) in the Yangtze River Basin from 2001 to 2020.
Table 4.
Representative cities across the Upstream, Midstream, and Downstream of the Yangtze River Basin, illustrating the spatial heterogeneity between urbanization intensity (ΔISA) and extreme heat risk amplification (Ri).
3.4.2. Spatial Correlation Between Urbanization Intensity and Ri
Figure 8 and Table 4 reveal a non-linear coupling relationship between ΔISA and Ri. In the densely populated urban agglomerations of the Yangtze River Delta and the midstream region, high-intensity urban expansion frequently coincided with significant extreme heat risk amplification [82,83,84]. Specifically, Hefei (ΔISA = 0.477) and Changsha (ΔISA = 0.451), both underwent rapid expansion, recorded Ri values of 1.34 and 1.52, respectively. However, the data also indicate that ΔISA is not the sole determinant of Ri magnitude [85,86]. Downstream, despite Shanghai’s massive absolute ISA proportion, its Ri was only 0.64 (low-risk category). Upstream, Guiyang exhibited a high Ri of 2.36 despite a minimal ΔISA of 0.130.
4. Discussion
4.1. Drivers of the Spatiotemporal Evolution of the Urban Thermal Environment in the Yangtze River Basin
4.1.1. Seasonal Rhythm and Extreme Events Regulated by the Climatic Background
The seasonal evolution of surface urban heat island intensity (SUHII) in the Yangtze River Basin is not a simple unimodal curve (Figure 2), but is influenced by the region’s unique climatic background. This study finds that daytime SUHII shows a pronounced growth stagnation or even fluctuations in May–June. Based on the existing literature, this feature may be closely related to the “Meiyu (plum-rain)” season under the control of the East Asian summer monsoon [87,88].
Previous studies suggest that during the Meiyu period, widespread cloud cover and persistent precipitation can attenuate the solar shortwave radiation reaching the surface, potentially weakening the warming advantage of urban impervious surfaces relative to rural vegetation. This mechanism likely explains the observed suppression of the rise in heat-island intensity in early summer [39,89,90], though the exact radiative contributions require further verification. As the region enters the hot-dry period after the Meiyu season in July–August, under the influence of the subtropical high, stronger clear-sky radiation and enhanced urban–rural contrasts in evapotranspirative cooling versus sensible heating may contribute to the annual SUHII peak observed in August [91,92,93]. In addition, the wider interquartile range (IQR) in summer indicates greater inter-city variability under strong-radiation and high-temperature conditions, suggesting that climate-adaptive planning may need to pay particular attention to inter-city differences during summer extremes [94,95].
At the interannual scale, the evolution trajectory of SUHII reveals a nonlinear response of the urban thermal environment to extreme meteorological events [96]. The deep red patches in the daytime SUHII anomaly map are mainly concentrated in the summers of 2013, 2017, and 2019–2020, which is temporally close to historically recorded extreme heat-wave events in the Yangtze River Basin [97,98]. This temporal synchrony suggests a possible co-intensification of daytime SUHII and extreme heat events. Based on previous studies, one possible explanation is that, under extreme high-temperature conditions, dense urban building clusters may enhance longwave radiation trapping, while increased cooling demand may raise anthropogenic heat flux (AHF), together reinforcing urban warming [99,100]. Such a synergistic effect may cause urban warming in heat-wave years to exceed the average fluctuations of the background climate, thereby potentially increasing summer heat-exposure risk for urban residents [101].
Unlike the “event-driven” feature of daytime SUHII dominated by meteorological fluctuations, nighttime SUHII exhibits a robust and continuous shift from cold to warm, indicating the cumulative reshaping of the regional thermal environment by rapid urbanization [102,103]. The nighttime anomaly map shows that since the 2010s, positive anomalies have gradually become dominant, and their intensity has steadily increased year by year. This trend appears to coincide with the rapid increase in impervious surface area (ISA) proportion and nighttime light (NTL) intensity in the Yangtze River Basin [85,104]. With the expansion of urban physical boundaries, high-heat-capacity artificial surfaces replace natural land surfaces, which may enhance daytime heat storage and nighttime heat release; meanwhile, anthropogenic heat emissions from nighttime activities may further weaken nighttime cooling efficiency [105,106,107]. This structure-driven warming pattern suggests that urbanization may alter the nighttime thermal environment in a cumulative and persistent manner; even in relatively cool meteorological years, nighttime heat-island intensity may not easily return to the lower levels seen in the early 2000s [103,108,109].
4.1.2. Different Impacts of Heterogeneous Urbanization Processes on Day–Night Heat-Island Evolution
Figure 8 reveals that SUHII evolution in the Yangtze River Basin features pronounced day–night asymmetry and regional stage-dependent characteristics. This differentiation may partly reflect the differential regulation of surface energy balance across urbanization stages [110,111]. Specifically, daytime heat-island evolution appears to be largely driven by changes in radiative budget induced by abrupt shifts in land cover, exhibiting an “event-driven” feature, whereas nighttime heat islands are likely modulated by the accumulated thermal inertia of urban three-dimensional structures, exhibiting a “structure-driven” feature.
As shown in Figure 9a, the growth rate of daytime SUHII appears to be more closely related to the pace of urbanization expansion than to the absolute level of urbanization, with a likely nonlinear relationship to the latter [55]. In rapidly urbanizing regions such as the upper reaches of the Yangtze River and southern Jiangxi, drastic land-cover conversion is the dominant factor driving the deterioration of the thermal environment [112,113]. The rapid increase observed in areas such as Jiangbei County (Table 1) may be related to abrupt changes in underlying-surface properties, where vegetation and water bodies are rapidly replaced by impervious surfaces (ISA). In contrast, in mature urban agglomerations such as the Yangtze River Delta, the long-term trend of daytime SUHII becomes flatter, and some cities even show slight negative trends (e.g., Shanghai). This suggests that, at highly urbanized stages, further enhancement of daytime heat-island intensity may show diminishing marginal increases [114]. Existing studies indicate that aerosols can affect the surface energy balance through radiative effects and may weaken (daytime) surface heat-island intensity in summer; in addition, advective processes such as sea–land breezes in coastal areas may also regulate daytime warming [115,116,117].In this study, the above factors have not been directly quantified and tested; therefore, these explanations need to be further verified in future work by incorporating AOD, wind fields, and greening indicators. Therefore, the evolutionary characteristics of daytime heat islands to some extent reflect the transition of urbanization from rapid expansion toward a stage of stock optimization [118,119,120].
Figure 9.
Spatial distribution of development trends in daytime SUHII (a) and nighttime SUHII (b) across cities in the Yangtze River Basin.
Figure 9b shows that, compared with the spatial differences in daytime SUHII, nighttime SUHII exhibits a more consistent increasing trend in most cities (e.g., Nanyang City). This day–night difference may be partly explained by stronger nighttime influences of heat storage–release and constrained radiative cooling: impervious surfaces and building materials can store heat during the day and release it slowly at night, while street-canyon structures may reduce the sky view factor (SVF) and the efficiency of longwave radiative loss, thereby weakening nighttime cooling [121,122]. Because this study did not directly quantify SVF or urban morphological parameters, these structure-driven mechanisms serve as theoretical interpretations of our observed data and require further empirical verification. Even in cities such as Shanghai and Jiaxing, where daytime heat islands tend to saturate, nighttime heat islands still maintain significant positive growth [123]. This suggests that the nighttime thermal environment may be more sensitive to the accumulation of urban three-dimensional morphology, and may be less effectively mitigated by surface greening alone [123,124,125]. In addition, the cumulative effect of nighttime anthropogenic heat emissions (e.g., from air conditioning and transportation) may be more pronounced in densely populated mature urban agglomerations, potentially further intensifying nighttime heat-island strength [100,126]. This asymmetric evolution of stable daytime but increasing nighttime suggests that as urbanization enters the mid-to-late stages, the focus of thermal-environment governance should shift from simply controlling impervious-surface expansion to structural strategies such as optimizing urban ventilation corridors, reducing anthropogenic heat emissions, and improving the thermal performance of building materials [127].
4.2. The Driving Mechanisms of the Non-Synchronous Response of Extreme High Temperatures
The evolution of warm-season mean air temperature and extreme high temperatures in cities of the Yangtze River Basin exhibits significant nonlinear characteristics, especially with high-Ri areas clustering toward small and medium-sized cities (e.g., Suining and Guixi), whereas megacities (e.g., Shanghai) and some high-background cities (e.g., Guangyuan) instead show low-Ri characteristics. This non-synchronous change in extremes relative to the background is consistent with recent studies showing that, at global and regional scales, extreme high temperatures may increase faster than background mean warming, with pronounced spatial heterogeneity [128,129].
4.2.1. Potential Perturbations of Extreme Heat Risk by Urbanization Phases
The data suggest that high-intensity ISA expansion in the mid-to-downstream YRB often accompanies elevated risk amplification (Ri > 1.5). This non-synchronous response might relate to the severe alteration of local surface energy balances driven by rapid urbanization [130,131]. The large-scale, short-term replacement of natural surfaces with impervious materials diminishes latent heat fluxes and increases sensible heat release, which to some extent exacerbates local heat stress during extreme weather events (e.g., heatwaves) [132]. Nevertheless, the relationship between Ri and ΔISA is not simply causal. Taking Shanghai (Table 4) as an example: although its absolute ISA ratio reached 0.806 in 2020, its Ri remained in the low-risk category (0.64), likely because the city was already in a mature urbanization phase during the study period (ΔISA = 0.294). This phenomenon implies that the dynamic process of converting new construction land into impervious surfaces might exert a stronger marginal perturbation on extreme microclimates than the static presence of mature megacities [133,134]. Naturally, this statistical inference requires further physical quantification using Urban Canopy Models in future research.
4.2.2. Synergistic Regulation by Geography, Topography, and Large-Scale Climate Background
As illustrated in Figure 8, certain upstream cities (e.g., Guiyang, Chongqing) maintained high Ri values despite limited ΔISA. This indicates that the risk amplification captured by Ri cannot be solely attributed to local land cover changes [135]. The upstream YRB features complex topography, characterized by intersecting basins and valleys [136]. Such enclosed or semi-enclosed terrain facilitates heat accumulation, making peak extreme temperatures more susceptible to amplification under large-scale synoptic forcing, such as the subtropical high [137]. Consequently, the proposed Ri index reflects a composite outcome of local urban forcing, regional topographical characteristics, and large-scale background climate. Future attribution analyses must carefully delineate the respective contributions of external climate forcing and internal urbanization effects.
4.2.3. Seasonal Mismatch in the Climatic Background
The month-identification results indicate a clear seasonal mismatch of heat risk across different regions. For example, upstream Chengdu shows an “early-spring type” (FMA) warming feature. This rapid early-spring warming suggests that the heat-risk management window in upstream basin areas may need to be advanced toward the crop-sowing period, rather than focusing only on the traditional midsummer [138]. In contrast, the “split-type” high-temperature patterns in places such as Nanjing and Chongqing in the middle and lower reaches may be related to the advance and retreat of the East Asian summer monsoon and the subtropical high [139,140].
Precipitation during the Meiyu period likely suppresses early-summer high temperatures, which may shift heat risk toward the pre-Meiyu period and the hot-dry period after Meiyu [141]. This seasonal non-synchronicity suggests that a single summer (JJA) analytical framework may be insufficient to capture the full characteristics of urban heat-island evolution across the basin, and that cities in different reaches may require differentiated adaptation strategies according to their dominant climatic drivers [142].
4.3. Governance Implications, Limitations, and Future Prospects
4.3.1. Governance Implications for Asymmetric Day–Night Heat-Island Evolution
The asymmetric day–night evolution characteristics of SUHII revealed in this study provide a scientific basis for formulating targeted urban heat-environment mitigation strategies. Given that daytime heat islands are mainly controlled by the reduction in latent heat flux caused by land-cover change, governance should prioritize the stock optimization of “blue–green infrastructure” [143,144]. In mature urban agglomerations such as the Yangtze River Delta, increasing high-canopy street trees, promoting vertical greening, and implementing rooftop gardens can effectively compensate for evapotranspiration losses caused by impervious-surface expansion, thereby curbing peak daytime extreme high temperatures [134,145].
In contrast, for nighttime heat islands mainly driven by the thermal inertia of urban three-dimensional structures and anthropogenic heat emissions, governance strategies need to shift toward “morphological optimization and source reduction”. For rapidly expanding upstream and midstream cities (e.g., the Chengdu–Chongqing region), ventilation corridors parallel to the prevailing wind direction should be reserved at the planning stage to avoid forming a closed canyon effect, thereby promoting nighttime longwave radiation loss and cold-air advection. For megacities where the thermal environment has tended to saturate, efforts should focus on improving the thermal performance of building materials to reduce daytime heat storage, while coordinating transportation and building energy-saving policies to reduce waste-heat emissions from nighttime air conditioning and transportation, thereby alleviating the structural thermal risk of “stable daytime but increasing nighttime” [146].
4.3.2. Research Limitations
Although this study reveals the spatiotemporal evolution patterns of the urban thermal environment in the Yangtze River Basin, some limitations still exist.
First, the MODIS LST data used in this study represent only clear-sky surface temperature [11,147]. Because heat-island characteristics during the summer Meiyu period or under cloudy conditions may differ significantly from those on clear-sky days, this bias may introduce uncertainty in evaluating all-weather thermal-environment characteristics [148].
Second, the SUHII calculation depends heavily on the selection of the rural reference area. Although a 10–15 km buffer was initially designed to minimize the footprint of the urban core, with the rapid advancement of urbanization over the 20-year study period (2001–2020), parts of this originally defined rural buffer zone may have gradually transformed into suburban or semi-urbanized areas. This dynamic change in the baseline over time may, to some extent, mask the true magnitude of rural temperatures, thereby underestimating the long-term heat-island growth trend [149]. However, using a static buffer ensures spatial consistency for long-term time-series comparisons, avoiding the artificial sudden shifts in LST that a dynamically changing boundary might introduce.
Furthermore, a constant environmental lapse rate of 6 °C/1000 m was applied for the topographic correction of LST. While this empirical constant is widely adopted as a standard practice in macro-scale urban thermal environment studies, we acknowledge that the actual lapse rate in the Yangtze River Basin—a region characterized by complex topography and distinct seasonal variations—may fluctuate spatially and temporally. Relying on a fixed constant might introduce localized uncertainties in the elevation-adjusted LST, particularly in mountainous areas with extreme elevation gradients. Future studies could incorporate dynamic, localized lapse rates derived from meteorological sounding data to further refine topographic corrections.
In addition, the discussions of aerosols (AOD), sky view factor (SVF), and anthropogenic heat flux (AHF) in this study are mainly based on statistical correlations and theoretical inference, lacking quantitative attribution of each term in the surface energy balance equation; therefore, explanations of specific driving mechanisms remain at the level of qualitative analysis.
4.3.3. Future Prospects
To address the above limitations, future studies will focus on deepening multi-source data fusion and mechanism quantification. Future work plans to introduce all-weather LST retrieval algorithms, and integrate high-resolution radiation flux, evapotranspiration (ET) products, and near-surface wind-field data to build physical models for refined decomposition of surface energy balance. Meanwhile, three-dimensional urban building models will be used to calculate morphological parameters such as sky view factor (SVF) and frontal area density (FAD), thereby directly quantifying the specific contributions of urban geometric structure to nighttime heat islands and ventilation–heat dissipation [150]. On this basis, energy-consumption statistics or nighttime lights will be combined to construct more accurate anthropogenic-heat proxy indicators, and geographically weighted regression (GWR) or machine-learning attribution methods will be applied to clarify the relative contributions of physical-geographical factors, urban morphology, and socioeconomic activities to heat-island effects across different seasons and times of day, thereby providing more operational quantitative support for climate-adaptive urban planning in the Yangtze River Basin.
5. Conclusions
This study systematically investigated the spatiotemporal evolution of Surface Urban Heat Island Intensity (SUHII) and the characteristics of extreme high temperatures relative to background warming across the Yangtze River Basin from 2001 to 2020. Over the past two decades, the regional thermal environment exhibited distinct day–night asymmetric evolution. Specifically, the daytime SUHII showed a significant intensifying trend, with the most pronounced warming observed in downstream urban agglomerations such as Jiangbei and Chongqing County. In contrast, the nighttime SUHII maintained a steadily but slowly increasing state, primarily concentrated in midstream and upstream megacities like Wuhan and Chongqing. This structural asymmetry indicates a fundamental shift in the diurnal thermal dynamics of rapidly urbanizing river basins.
By introducing the Ri index, this research successfully decoupled the amplification effect of extreme urban heat from general background warming, revealing an escalating structural thermal risk. The findings demonstrate that the warming rate of extreme high temperatures in urban cores significantly exceeds that of the background climate. Notably the Ri values in high-risk areas broadly exceeded 1.5 and peaked at staggering values between 4.63 and 5.63 (e.g., Jingzhou and Guixi). Geographically, these extreme heat amplification zones are widely distributed across the basin, forming prominent clusters in the Middle Reaches (particularly in Hunan and Hubei provinces, such as Huaihua and Yueyang), the densely populated Lower Reaches (the Yangtze River Delta region, including Nanjing, Zhenjiang, and Jiaxing), and the Upper Reaches (such as the Sichuan Basin and Guizhou, including Guanghan and Guiyang). This implies that for every 1 °C of background warming, the extreme high temperatures in these severely affected urban areas are disproportionately amplified by 1.5 to over 5 °C. Such asymmetric amplification highlights that traditional mean-temperature assessments substantially underestimate the actual extreme heat exposure faced by urban residents.
Furthermore, the contiguous expansion of Impervious Surface Area (ISA) serves as the primary physical driver for this extreme thermal amplification. Spatial correlation analysis reveals a robust alignment between high Ri distribution and intensive ISA growth. The extreme heat amplification effect becomes particularly acute when the regional ISA density exceeds the critical threshold of 70%. As evidenced by the data, all cities experiencing severe thermal risk (Ri > 1.5) had reached an absolute ISA coverage of over 70% by 2020. In typical contiguous high-density urban zones, such as the Chang-Zhu-Tan (Changsha-Zhuzhou) agglomeration and the Yangtze River Delta megaregion (including Nanjing, Ma’anshan, and Jiaxing), the leap-like increase in impervious surfaces has drastically altered the surface energy balance. This widespread land-cover transformation leads to severe latent heat loss during the day and enhanced heat storage at night, thereby exacerbating the day–night asymmetric thermal stress.
Ultimately, the decoupling of day–night thermal dynamics and the amplification of extreme heat necessitate time-specific, targeted urban climate mitigation strategies. The findings underscore the critical need to shift from “mean-state” UHI mitigation to “extreme-event” climate adaptation. Future urban planning in the Yangtze River Basin must prioritize compensating for daytime evapotranspiration loss through blue–green infrastructure in high-density core areas (especially where ISA exceeds the 70% threshold), while simultaneously optimizing urban morphology to alleviate nighttime heat retention in rapidly expanding cities.
Author Contributions
Conceptualization, H.Z.; Methodology, R.Y. and H.Z.; Software, R.Y.; Validation, H.W. and R.Y.; Formal Analysis, H.W.; Investigation, H.W.; Data Curation, H.W.; Writing—Original Draft, H.W.; Writing—Review and Editing, H.Z.; Visualization, H.W.; Supervision, H.Z. and R.Y.; Funding Acquisition, H.Z. All authors have read and agreed to the published version of the manuscript.
Funding
This research was funded by the National Natural Science Foundation of China (grant number 42507651).
Data Availability Statement
The original contributions presented in the study are included in the article, and further inquiries can be directed to the corresponding author.
Acknowledgments
I am deeply thankful to the anonymous reviewers for their constructive comments, which have significantly improved this manuscript. Additionally, I extend my appreciation to all individuals and institutions that supported and contributed to this research.
Conflicts of Interest
The authors declare no conflicts of interest.
References
- Ren, Z.; Fu, Y.; Dong, Y.; Zhang, P.; He, X. Rapid urbanization and climate change significantly contribute to worsening urban human thermal comfort: A national 183-city, 26-year study in China. Urban Clim. 2022, 43, 101154. [Google Scholar] [CrossRef] [Scilit]
- Tuholske, C.; Caylor, K.; Funk, C.; Verdin, A.; Sweeney, S.; Grace, K.; Peterson, P.; Evans, T. Global urban population exposure to extreme heat. Proc. Natl. Acad. Sci. USA 2021, 118, e2024792118. [Google Scholar] [CrossRef] [Scilit]
- Zhou, Z.; Nguyen-Xuan, T.; Liao, H.; Qiu, L.; Im, E.-S. Characterization of temperature and humidity effects on extreme heat stress under global warming and urban growth in the Pearl and Yangtze River Deltas of China. Weather Clim. Extrem. 2024, 44, 100659. [Google Scholar] [CrossRef] [Scilit]
- Pennino, S. Global warming or global warning? A review of urban practices for adaptation to extreme heat. TeMA-J. Land Use Mobil. Environ. 2024, 17, 373–381. [Google Scholar]
- Zhang, L.; Yu, X.; Zhou, T.; Zhang, W.; Hu, S.; Clark, R. Understanding and attribution of extreme heat and drought events in 2022: Current situation and future challenges. Adv. Atmos. Sci. 2023, 40, 1941–1951. [Google Scholar] [CrossRef] [Scilit]
- Ortiz, L.; Braneon, C.; Horton, R.; Bader, D.; Orton, P.; Gornitz, V.; Rosenzweig, B.; McPhearson, T.; Smalls-Mantey, L.; Sheerazi, H.; et al. NPCC4: Tail Risk, Climate Drivers of Extreme Heat, and New Methods for Extreme Event Projections; Wiley Online Library: Hoboken, NJ, USA, 2024. [Google Scholar]
- Bjarke, N.; Barsugli, J.; Hoerling, M.; Quan, X.-W.; Livneh, B. When record breaking heat waves should not surprise: Skewness, heavy tails and implications for risk assessment. Authorea Prepr. 2023. [Google Scholar] [CrossRef] [Scilit]
- Ruff, T.W.; Neelin, J.D. Long tails in regional surface temperature probability distributions with implications for extremes under global warming. Geophys. Res. Lett. 2012, 39, L04704. [Google Scholar] [CrossRef] [Scilit]
- Chen, J.; Yang, Z.; Jiang, Y.; Yang, H.; Yang, L. Rising heat, rising sirens: Spatiotemporal disparities and socio-spatial drivers of heat-related illness exposure risk in Japan. Sustain. Cities Soc. 2026, 139, 107210. [Google Scholar] [CrossRef] [Scilit]
- Khanum, R.; Naser, A.; Shibly Numan, M.; Nabi, S.F.; Saha, A.; Samiullah, M.; Lima, M.N. Heat Waves and Climate Change: Evaluating Long-Term Public Health Risks in Urban and Rural Environments. J. Comput. Anal. Appl. 2024, 33. [Google Scholar] [CrossRef] [Scilit]
- Ma, J.; Zhou, J.; Zhang, T.; Tang, W.; Liao, Y.; Yang, M. Non-negligible clear-sky biases of satellite thermal infrared observations for analyzing surface urban heat island intensity: A case study in China. Sci. Total Environ. 2024, 949, 174928. [Google Scholar] [CrossRef] [Scilit]
- Pan, X.; Wang, Z.; Liu, S.; Yang, Z.; Guluzade, R.; Liu, Y.; Yuan, J.; Yang, Y. The impact of clear-sky biases of land surface temperature on monthly evapotranspiration estimation. Int. J. Appl. Earth Obs. Geoinf. 2024, 129, 103811. [Google Scholar] [CrossRef] [Scilit]
- Mao, Q.; Peng, J.; Wang, Y. Resolution enhancement of remotely sensed land surface temperature: Current status and perspectives. Remote Sens. 2021, 13, 1306. [Google Scholar] [CrossRef] [Scilit]
- Yoo, C.; Im, J.; Cho, D.; Yokoya, N.; Xia, J.; Bechtel, B. Estimation of all-weather 1 km MODIS land surface temperature for humid summer days. Remote Sens. 2020, 12, 1398. [Google Scholar] [CrossRef] [Scilit]
- Kim, Y.; Yoo, C.; Im, J. Nighttime satellite land surface temperature for urban applications: Achievements, challenges, and future prospects. GIScience Remote Sens. 2025, 62, 2527990. [Google Scholar] [CrossRef] [Scilit]
- Li, F.; Yigitcanlar, T.; Nepal, M.; Thanh, K.N.; Dur, F. A novel urban heat vulnerability analysis: Integrating machine learning and remote sensing for enhanced insights. Remote Sens. 2024, 16, 3032. [Google Scholar] [CrossRef] [Scilit]
- Liu, M.; Li, X.; Chai, Z.; Chen, A.; Zhang, Y.; Zhang, Q. Dense temperature mapping and heat wave risk analysis based on multisource remote sensing data. IEEE J. Sel. Top. Appl. Earth Obs. Remote Sens. 2023, 16, 3148–3157. [Google Scholar] [CrossRef] [Scilit]
- Tang, Y.; Zhao, Y.; Sun, Y.; Ren, S.; Li, Z. Seamless Reconstruction of MODIS Land Surface Temperature via Multi-Source Data Fusion and Multi-Stage Optimization. Remote Sens. 2025, 17, 3374. [Google Scholar] [CrossRef] [Scilit]
- Li, K.; Chen, Y. Identifying and characterizing frequency and maximum durations of surface urban heat and cool island across global cities. Sci. Total Environ. 2023, 859, 160218. [Google Scholar] [CrossRef] [Scilit]
- Manoli, G.; Fatichi, S.; Schläpfer, M.; Yu, K.; Crowther, T.W.; Meili, N.; Burlando, P.; Katul, G.G.; Bou-Zeid, E. Magnitude of urban heat islands largely explained by climate and population. Nature 2019, 573, 55–60. [Google Scholar] [CrossRef] [Scilit]
- Wang, Z.; Zhou, R.; Yu, Y. The impact of urban morphology on land surface temperature under seasonal and diurnal variations: Marginal and interaction effects. Build. Environ. 2025, 272, 112673. [Google Scholar] [CrossRef] [Scilit]
- Ahmad, A.S.; Yi, L.; Biswas, A.; Song, X.; Ishchanov, J.; Siddique, H.M.K. Metabolic Transformation and Urban Heat Island Dynamics: Achieving Thermal Balance in Chinese Megacities. Int. J. Environ. Res. 2026, 20, 63. [Google Scholar] [CrossRef] [Scilit]
- Sinha, S.; Banerjee, A. A systematic review of land use and land cover changes and their influence on urban heat island dynamics. Discov. Geosci. 2025, 3, 253. [Google Scholar] [CrossRef] [Scilit]
- Shen, P.; Zhao, S.; Ma, Y. Perturbation of urbanization to Earth’s surface energy balance. J. Geophys. Res. Atmos. 2021, 126, e2020JD033521. [Google Scholar] [CrossRef] [Scilit]
- Hou, H.; Su, H.; Liu, K.; Li, X.; Chen, S.; Wang, W.; Lin, J. Driving forces of UHI changes in China’s major cities from the perspective of land surface energy balance. Sci. Total Environ. 2022, 829, 154710. [Google Scholar] [CrossRef] [Scilit]
- Yu, Z.; Chen, T.; Yang, G.; Sun, R.; Xie, W.; Vejre, H. Quantifying seasonal and diurnal contributions of urban landscapes to heat energy dynamics. Appl. Energy 2020, 264, 114724. [Google Scholar] [CrossRef] [Scilit]
- Yang, J.; Wu, Z.; Menenti, M.; Wong, M.S.; Xie, Y.; Zhu, R.; Abbas, S.; Xu, Y. Impacts of urban morphology on sensible heat flux and net radiation exchange. Urban Clim. 2023, 50, 101588. [Google Scholar] [CrossRef] [Scilit]
- He, Y.; Zhang, H.; Chen, Q.; Zhang, X. Spatio-Temporal Variation in Water Quality in Urban Lakes and Land Use Driving Impact: A Case Study of Wuhan. Water 2026, 18, 153. [Google Scholar] [CrossRef] [Scilit]
- Ahmed, S.; Eklund, E.; Kiester, E. Small and mid-sized cities at the centre of climate adaptation in the global South: Planning and policy responses. Int. Dev. Plan. Rev. 2025, 47, 141–151. [Google Scholar] [CrossRef] [Scilit]
- Yang, X.; Meng, F.; Fu, P.; Zhang, Y.; Liu, Y. Spatiotemporal change and driving factors of the Eco-Environment quality in the Yangtze River Basin from 2001 to 2019. Ecol. Indic. 2021, 131, 108214. [Google Scholar] [CrossRef] [Scilit]
- Wang, M.; Li, M.; An, Q.; Zhang, Z.; Lu, J. Investigating the seasonal effect of climatic factors on evapotranspiration in the monsoon climate zone: A case study of the Yangtze River Basin. Atmosphere 2023, 14, 1282. [Google Scholar] [CrossRef] [Scilit]
- Shi, Z.; Li, X.; Hu, T.; Yuan, B.; Yin, P.; Jiang, D. Modeling the intensity of surface urban heat island based on the impervious surface area. Urban Clim. 2023, 49, 101529. [Google Scholar] [CrossRef] [Scilit]
- Yao, R.; Wang, L.; Huang, X.; Cao, Q.; Wei, J.; He, P.; Wang, S.; Wang, L. Global seamless and high-resolution temperature dataset (GSHTD), 2001–2020. Remote Sens. Environ. 2023, 286, 113422. [Google Scholar] [CrossRef] [Scilit]
- Yang, J.; Huang, X. The 30 m annual land cover dataset and its dynamics in China from 1990 to 2019. Earth Syst. Sci. Data Discuss. 2021, 13, 3907–3925. [Google Scholar] [CrossRef] [Scilit]
- Li, X.; Gong, P.; Zhou, Y.; Wang, J.; Bai, Y.; Chen, B.; Hu, T.; Xiao, Y.; Xu, B.; Yang, J.; et al. Mapping global urban boundaries from the global artificial impervious area (GAIA) data. Environ. Res. Lett. 2020, 15, 094044. [Google Scholar] [CrossRef] [Scilit]
- Wang, M.; de Vries, W.T.; Sang, W.; Bao, H.; Lyu, Y.; Liu, S. A Method for Delineating Urban Development Boundaries Based on the Urban–Rural Integration Perspective. Land 2025, 14, 859. [Google Scholar] [CrossRef] [Scilit]
- Zhao, C.; Li, Y.; Weng, M. A fractal approach to urban boundary delineation based on raster land use maps: A case of Shanghai, China. Land 2021, 10, 941. [Google Scholar] [CrossRef] [Scilit]
- Deng, J.; Hong, D.; Li, C.; Yokoya, N. Joint super-resolution and segmentation for 1-m impervious surface area mapping in China’s Yangtze river economic belt. GIScience Remote Sens. 2026, 63, 2610548. [Google Scholar] [CrossRef] [Scilit]
- Peng, W.; Yang, X.; Chen, S.S. Effect of the reference rural landscape on annual variations in surface urban heat island intensity. Sustain. Cities Soc. 2024, 115, 105804. [Google Scholar] [CrossRef] [Scilit]
- Li, K.; Chen, Y.; Wang, M.; Gong, A. Spatial-temporal variations of surface urban heat island intensity induced by different definitions of rural extents in China. Sci. Total Environ. 2019, 669, 229–247. [Google Scholar] [CrossRef] [Scilit]
- Zhang, J.; Tu, L.; Wang, X.; Liang, W. Comparison of urban heat Island differences in the Yangtze river delta urban agglomerations based on different urban–Rural dichotomies. Remote Sens. 2024, 16, 3206. [Google Scholar] [CrossRef] [Scilit]
- Zhao, Z.; Sharifi, A.; Dong, X.; Shen, L.; He, B.-J. Spatial variability and temporal heterogeneity of surface urban heat island patterns and the suitability of local climate zones for land surface temperature characterization. Remote Sens. 2021, 13, 4338. [Google Scholar] [CrossRef] [Scilit]
- Guan, Y.; Quan, J.; Ma, T.; Cao, S.; Xu, C.; Guo, J. Identifying major diurnal patterns and drivers of surface urban heat island intensities across local climate zones. Remote Sens. 2023, 15, 5061. [Google Scholar] [CrossRef] [Scilit]
- He, P.; Ren, J.; Ye, N.; Chao, J.; Zeng, Y.; Li, J.; Zhang, Q.; Xiao, J.; Zhu, S.; Ma, J. Unanticipated cooling gains from afforestation in Southwestern China. Environ. Res. Lett. 2025, 20, 124013. [Google Scholar] [CrossRef] [Scilit]
- Liu, H.; Hai, R.; Zheng, Q.; Jin, M. Quantifying the Spatial Antagonism Between Urban Morphology and Ecological Infrastructure on Land Surface Temperature: An Explainable Machine Learning Approach with Spatial Lags. Buildings 2026, 16, 991. [Google Scholar] [CrossRef] [Scilit]
- Miyawaki, O.; Shaw, T.A.; Jansen, M.F. Quantifying energy balance regimes in the modern climate, their link to lapse rate regimes, and their response to warming. J. Clim. 2022, 35, 1045–1061. [Google Scholar] [CrossRef] [Scilit]
- Hoa, P.V.; Binh, N.A.; Thao, G.T.P.; An, N.N.; Trinh, P.T.; Tuan, N.Q.; Hanh, N.C. Long-term trend and seasonal cycles of gap-free downscaled diurnal/nocturnal LST and the interaction to functional plant trait under tropical monsoon climate. Earth Space Sci. 2025, 12, e2024EA003888. [Google Scholar] [CrossRef] [Scilit]
- Güçlü, Y.S.; Acar, R.; Saplıoğlu, K. Seasonally adjusted periodic time series for Mann-Kendall trend test. Phys. Chem. Earth Parts A/B/C 2025, 138, 103848. [Google Scholar] [CrossRef] [Scilit]
- Agbo, E.P.; Nkajoe, U.; Edet, C.O. Comparison of Mann–Kendall and Şen’s innovative trend method for climatic parameters over Nigeria’s climatic zones. Clim. Dyn. 2023, 60, 3385–3401. [Google Scholar] [CrossRef] [Scilit]
- Zhang, Q.; Feng, T.; Wang, M.; Yang, G.; Lu, H.; Sun, W. A Twenty-Year Assessment of Spatiotemporal Variation of Surface Temperature in the Yangtze River Delta, China. Remote Sens. 2023, 15, 2274. [Google Scholar] [CrossRef] [Scilit]
- Ye, C.; Jiang, J.; Li, L.; Jin, Y. Analysis of urban expansion patterns in the Yangtze River Delta based on the fusion impervious surfaces dataset. Open Geosci. 2025, 17. [Google Scholar] [CrossRef] [Scilit]
- McGregor, G. Surface Atmosphere Interactions and Heatwaves. In Heatwaves: Causes, Consequences and Responses; Springer: Berlin/Heidelberg, Germany, 2024; pp. 261–304. [Google Scholar]
- Chang, K.-L.; Schultz, M.G.; Lan, X.; McClure-Begley, A.; Petropavlovskikh, I.; Xu, X.; Ziemke, J.R. Trend detection of atmospheric time series: Incorporating appropriate uncertainty estimates and handling extreme events. Elem. Sci. Anth. 2021, 9, 00035. [Google Scholar] [CrossRef] [Scilit]
- Wang, C.; Feng, Z.; Wang, X. Diurnal–Seasonal Contrast of Spatiotemporal Dynamic and the Key Determinants of Surface Urban Heat Islands Across China’s Humid and Arid Regions. Sustainability 2026, 18, 1093. [Google Scholar] [CrossRef] [Scilit]
- Shi, S.; Ji, S.; Luo, Z. Spatial heterogeneity, interaction and multi-scale effects of driving factors of heat island intensity in different urban agglomerations. Sustain. Cities Soc. 2025, 126, 106401. [Google Scholar] [CrossRef] [Scilit]
- Qin, Y.; Qin, Y.; Shen, Y.; Li, Y.; Xiang, B. Numerical study on the effects of intraseasonal oscillations for a persistent drought and hot event in South China summer 2022. Remote Sens. 2023, 15, 892. [Google Scholar] [CrossRef] [Scilit]
- Žiberna, I.; Pipenbaher, N.; Donša, D.; Škornik, S.; Kaligarič, M.; Bogataj, L.K.; Črepinšek, Z.; Grujić, V.J.; Ivajnšič, D. The impact of climate change on urban thermal environment dynamics. Atmosphere 2021, 12, 1159. [Google Scholar] [CrossRef] [Scilit]
- Derdouri, A.; Wang, R.; Murayama, Y.; Osaragi, T. Understanding the links between LULC changes and SUHI in cities: Insights from two-decadal studies (2001–2020). Remote Sens. 2021, 13, 3654. [Google Scholar] [CrossRef] [Scilit]
- Manoli, G.; Fatichi, S.; Bou-Zeid, E.; Katul, G.G. Seasonal hysteresis of surface urban heat islands. Proc. Natl. Acad. Sci. USA 2020, 117, 7082–7089. [Google Scholar] [CrossRef] [Scilit]
- Yang, Q.; Huang, X.; Tang, Q. The footprint of urban heat island effect in 302 Chinese cities: Temporal trends and associated factors. Sci. Total Environ. 2019, 655, 652–662. [Google Scholar] [CrossRef] [Scilit]
- Xin, J.; Yang, J.; Wang, L.-e.; Jin, C.; Xiao, X.; Xia, J. Seasonal differences in the dominant factors of surface urban heat islands along the urban-rural gradient. Front. Environ. Sci. 2022, 10, 974811. [Google Scholar] [CrossRef] [Scilit]
- Yu, H.; Sun, D. Quantification of urban heat island effect and differences in regional influence based on footprint analysis: A case study of the Beijing–Tianjin–Hebei urban agglomeration. IEEE J. Sel. Top. Appl. Earth Obs. Remote Sens. 2024, 17, 6910–6919. [Google Scholar] [CrossRef] [Scilit]
- Li, L.; Zhan, W.; Du, H.; Lai, J.; Wang, C.; Fu, H.; Huang, F.; Liu, Z.; Wang, C.; Li, J.; et al. Long-term and fine-scale surface urban heat island dynamics revealed by Landsat data since the 1980s: A comparison of four megacities in China. J. Geophys. Res. Atmos. 2022, 127, e2021JD035598. [Google Scholar] [CrossRef] [Scilit]
- Zargari, M.; Mofidi, A.; Entezari, A.; Baaghideh, M. Climatology of Tehran surface heat Island: A satellite-based spatial analysis. Sci. Rep. 2025, 15, 10567. [Google Scholar] [CrossRef] [Scilit] [PubMed]
- Qiu, R.; Zhan, Q.; Tu, S. Long-term global trends and influencing factors of surface urban cool and heat islands. Int. J. Digit. Earth 2025, 18, 2489731. [Google Scholar] [CrossRef] [Scilit]
- Liu, Z.; Li, J.; Wu, Y.; Qin, C.; Liu, Y. Temporal trend of the frequency and maximum durations of surface urban heat islands over global cities. Sustain. Cities Soc. 2025, 120, 106141. [Google Scholar] [CrossRef] [Scilit]
- Si, M.; Li, Z.-L.; Nerry, F.; Tang, B.-H.; Leng, P.; Wu, H.; Zhang, X.; Shang, G. Spatiotemporal pattern and long-term trend of global surface urban heat islands characterized by dynamic urban-extent method and MODIS data. ISPRS J. Photogramm. Remote Sens. 2022, 183, 321–335. [Google Scholar] [CrossRef] [Scilit]
- Karimi Firozjaei, M.; Mahmoodi, H.; Jokar Arsanjani, J. Daytime surface urban heat island variation in response to future urban expansion: An assessment of different climate regimes. Remote Sens. 2025, 17, 1730. [Google Scholar] [CrossRef] [Scilit]
- Wang, H.; Yi, T.; Lu, Y.; Wang, Y.; Wu, J. Patterns of nighttime surface urban heat island patch in mega urban agglomerations: A case study in the Pearl River Delta, China. Sustain. Cities Soc. 2025, 128, 106465. [Google Scholar] [CrossRef] [Scilit]
- Shen, P.; Zhao, S. Intensifying urban imprint on land surface warming: Insights from local to global scale. iScience 2024, 27, 109110. [Google Scholar] [CrossRef] [Scilit]
- Geng, X.; Zhang, D.; Li, C.; Yuan, Y.; Yu, Z.; Wang, X. Impacts of climatic zones on urban heat island: Spatiotemporal variations, trends, and drivers in China from 2001–2020. Sustain. Cities Soc. 2023, 89, 104303. [Google Scholar] [CrossRef] [Scilit]
- She, Y.; Liu, Z.; Zhan, W.; Lai, J.; Huang, F. Strong regulation of daily variations in nighttime surface urban heat islands by meteorological variables across global cities. Environ. Res. Lett. 2022, 17, 014049. [Google Scholar] [CrossRef] [Scilit]
- Berk, S. Statistical Modelling of Urban Heat Islands Under Present and Future Climate. Ph.D. Thesis, University of East Anglia, Norwich, UK, 2023. [Google Scholar]
- Deng, X.; Yu, W.; Shi, J.; Huang, Y.; Li, D.; He, X.; Zhou, W.; Xie, Z. Diminished mitigating effect of vegetation on surface urban heat islands in large cities. SSRN 2023. [Google Scholar] [CrossRef] [Scilit]
- Xiong, P.; Guan, D.; Su, Y.; Zeng, S. Summer cooling effect of rivers in the Yangtze Basin, china: Magnitude, threshold and mechanisms. Land 2025, 14, 1511. [Google Scholar] [CrossRef] [Scilit]
- Qi, L.; Hu, Y.; Bu, R.; Li, B.; Gao, Y.; Li, C. Evaluation of the thermal environment based on the urban neighborhood heat/cool island effect. Land 2024, 13, 933. [Google Scholar] [CrossRef] [Scilit]
- Shafizadeh-Moghadam, H.; Xu, T.; Murayama, Y. Climate-specific trends in urban land surface temperature: A global analysis of 432 cities (2014–2024). J. Environ. Manag. 2025, 395, 127789. [Google Scholar] [CrossRef] [Scilit]
- Yi, Y.; Zhang, C.; Zhang, G.; Xing, L.; Zhong, Q.; Liu, J.; Lin, Y.; Zheng, X.; Yang, N.; Sun, H.; et al. Effects of urbanization on landscape patterns in the middle reaches of the Yangtze River Region. Land 2021, 10, 1025. [Google Scholar] [CrossRef] [Scilit]
- Zang, Y.; Zhu, J.; Han, X.; Lv, L. Dynamics between population growth and construction land expansion: Evidence from the Yangtze River economic belt of China. Land 2023, 12, 1288. [Google Scholar] [CrossRef] [Scilit]
- Cai, E.; Zhang, S.; Chen, W.; Li, L. Spatio–temporal dynamics and human–land synergistic relationship of urban expansion in Chinese megacities. Heliyon 2023, 9, e19872. [Google Scholar] [CrossRef] [Scilit]
- Yu, W.; Zhou, W. The spatiotemporal pattern of urban expansion in China: A comparison study of three urban megaregions. Remote Sens. 2017, 9, 45. [Google Scholar] [CrossRef] [Scilit]
- Ma, X.; Miao, S.; Masson, V.; Wurtz, J.; Zhang, Y.; Wang, J.; Huang, X.-Y.; Yan, C. The synergistic effects of urbanization and an extreme heatwave event on urban thermal environment in Paris. Urban Clim. 2024, 53, 101785. [Google Scholar] [CrossRef] [Scilit]
- Wu, S.; Wang, P.; Tong, X.; Tian, H.; Zhao, Y.; Luo, M. Urbanization-driven increases in summertime compound heat extremes across China. Sci. Total Environ. 2021, 799, 149166. [Google Scholar] [CrossRef] [Scilit] [PubMed]
- Qiao, Z.; Wang, N.; Chen, J.; Xu, X.; Liu, L.; Han, D. Understanding the differences in the contribution and impact of urbanization on urban warming during heatwave and non-heatwave periods in China. J. Clean. Prod. 2024, 474, 143626. [Google Scholar] [CrossRef] [Scilit]
- Shao, L.; Liao, W.; Li, P.; Luo, M.; Xiong, X.; Liu, X. Drivers of global surface urban heat islands: Surface property, climate background, and 2D/3D urban morphologies. Build. Environ. 2023, 242, 110581. [Google Scholar] [CrossRef] [Scilit]
- Shi, T.; Yang, Y.; Qi, P.; Lolli, S. Diurnal asymmetry in nonlinear responses of canopy urban heat island to urban morphology in Beijing during heat wave periods. Atmos. Chem. Phys. 2025, 25, 17069–17090. [Google Scholar] [CrossRef] [Scilit]
- Gao, C.; Li, G.; Xu, B.; Li, X. Effect of spring soil moisture over the Indo-China Peninsula on the following summer extreme precipitation events over the Yangtze River basin. Clim. Dyn. 2020, 54, 3845–3861. [Google Scholar] [CrossRef] [Scilit]
- Tian, Y.; Yao, R.; Zhao, E.; Yao, Q.; Pan, X. The space conceptual models and water vapor characteristics of typical rainstorms during plum rain season. Adv. Meteorol. 2022, 2022, 6971110. [Google Scholar] [CrossRef] [Scilit]
- Yang, X.; Yao, L. Reexamining the relationship between surface urban heat island intensity and annual precipitation: Effects of reference rural land cover. Urban Clim. 2022, 41, 101074. [Google Scholar] [CrossRef] [Scilit]
- Vo, T.T.; Hu, L.; Xue, L.; Li, Q.; Chen, S. Urban effects on local cloud patterns. Proc. Natl. Acad. Sci. USA 2023, 120, e2216765120. [Google Scholar] [CrossRef] [Scilit]
- Xi, M.; Zhang, W.; Li, W.; Liu, H.; Zheng, H. Distinguishing dominant drivers on LST dynamics in the Qinling-Daba Mountains in Central China from 2000 to 2020. Remote Sens. 2023, 15, 878. [Google Scholar] [CrossRef] [Scilit]
- Wang, J.; Wang, Y.; Chen, T. Spatiotemporal Impacts and Mechanisms of Multi-Dimensional Urban Morphological Characteristics on Regional Heat Effects in the Guangdong–Hong Kong–Macao Greater Bay Area. Land 2025, 14, 729. [Google Scholar] [CrossRef] [Scilit]
- Begum, M.S.; Bala, S.K.; Islam, A.K.M.S.; Islam, G.M.T.; Roy, D. An analysis of spatio-temporal trends of land surface temperature in the Dhaka metropolitan area by applying Landsat images. J. Geogr. Inf. Syst. 2021, 13, 538–560. [Google Scholar] [CrossRef]
- Yang, X.; Xu, S.; Peng, L.L.H.; Chen, Y.; Yao, L. General Air Temperature and Humidity Features of Local Climate Zones: A Multi-City Observational Study in Eastern China. Urban Climate 2023, 51, 101652. [Google Scholar] [CrossRef] [Scilit]
- Halder, D.; Garg, R.D. How spatiotemporal urban expansion shapes heat trends in coastal megacities: Developed vs. developing nations. Urban Clim. 2025, 64, 102704. [Google Scholar] [CrossRef] [Scilit]
- Wang, C.; Ren, Z.; Guo, Y.; Zhang, P.; Hong, S.; Ma, Z.; Hong, W.; Wang, X. Assessing urban population exposure risk to extreme heat: Patterns, trends, and implications for climate resilience in China (2000–2020). Sustain. Cities Soc. 2024, 103, 105260. [Google Scholar] [CrossRef] [Scilit]
- Ma, F.; Yuan, X. When will the unprecedented 2022 summer heat waves in Yangtze River basin become normal in a warming climate? Geophys. Res. Lett. 2023, 50, e2022GL101946. [Google Scholar] [CrossRef] [Scilit]
- Li, L.; Ding, T.; Gao, H.; Ke, Z. Entire-Basin Heat Wave in the Yangtze River Is Becoming the New Normal. J. Appl. Meteorol. Clim. 2025, 64, 761–775. [Google Scholar] [CrossRef] [Scilit]
- Zhao, L.; Fan, X.; Hong, T. Urban heat island effect: Remote sensing monitoring and assessment—Methods, applications, and future directions. Atmosphere 2025, 16, 791. [Google Scholar] [CrossRef] [Scilit]
- Vahmani, P.; Luo, X.; Jones, A.; Hong, T. Anthropogenic heating of the urban environment: An investigation of feedback dynamics between urban micro-climate and decomposed anthropogenic heating from buildings. Build. Environ. 2022, 213, 108841. [Google Scholar] [CrossRef] [Scilit]
- Luo, Y.; Cheng, X.; He, B.-J.; Dewancker, B. Identification and assessment of heat disaster risk: A comprehensive framework based on hazard, exposure, adaptation and vulnerability. Int. J. Environ. Sci. Technol. 2025, 22, 11275–11294. [Google Scholar] [CrossRef] [Scilit]
- He, C.; Kim, H.; Hashizume, M.; Lee, W.; Honda, Y.; Kim, S.E.; Kinney, P.L.; Schneider, A.; Zhang, Y.; Zhu, Y.; et al. The effects of night-time warming on mortality burden under future climate change scenarios: A modelling study. Lancet Planet. Health 2022, 6, e648–e657. [Google Scholar] [CrossRef] [Scilit]
- Zhao, C.; Zhu, H.; Zhang, S.; Jin, Z.; Zhang, Y.; Wang, Y.; Shi, Y.; Jiang, J.; Chen, X.; Liu, M. Long-term trends in surface thermal environment and its potential drivers along the urban development gradients in rapidly urbanizing regions of China. Sustain. Cities Soc. 2024, 105, 105324. [Google Scholar] [CrossRef] [Scilit]
- Moazzam, M.F.U.; Lee, B.G. Urbanization influenced SUHI Of 41 megacities of the world using big geospatial data assisted with google earth engine. Sustain. Cities Soc. 2024, 101, 105095. [Google Scholar] [CrossRef] [Scilit]
- Li, Z.; Chen, J.; Wang, C.; Wang, W.; Fu, Y.; Chen, X.; Zhang, R.; Pan, A.; Ho, T.C.; Lin, K.; et al. Enhancing sustainable urban environments in China: Daytime radiative cooling for building energy efficiency and heat island mitigation. Appl. Energy 2025, 393, 126138. [Google Scholar] [CrossRef] [Scilit]
- Li, N.; Guo, F.; Dou, J.; Miao, S.; Zheng, C. Remote sensing-driven analysis of hourly urban heat storage and its effects on air temperature in China. IEEE Trans. Geosci. Remote Sens. 2026, 64, 5001412. [Google Scholar] [CrossRef] [Scilit]
- Shen, P.; Zhao, S.; Ma, Y.; Liu, S. Urbanization-induced Earth’s surface energy alteration and warming: A global spatiotemporal analysis. Remote Sens. Environ. 2023, 284, 113361. [Google Scholar] [CrossRef] [Scilit]
- Li, D.; Wang, L.; Liao, W.; Sun, T.; Katul, G.; Bou-Zeid, E.; Maronga, B. Persistent urban heat. Sci. Adv. 2024, 10, eadj7398. [Google Scholar] [CrossRef] [Scilit]
- Wei, Y.; Chen, H.; Huang, J.J. Dynamics of urban latent heat in response to climate change and urbanization: What would be a global threshold? J. Hydrol. 2024, 643, 132002. [Google Scholar] [CrossRef] [Scilit]
- Yeboah, E.; Wang, G.; Cabral, P.; Sarfo, I.; Wei, X.; Liu, H.; Shao, Y.; Amankwah, S.O.Y.; Shwe, M.M.; Iqbal, J.; et al. Urban Heat Island Response to Projected Land-Use Change and Surface Energy Balance Modifications in Chongqing City, China. J. Geovis. Spat. Anal. 2025, 9, 37. [Google Scholar] [CrossRef] [Scilit]
- Barlage, M.; Chen, F. Human Impacts on Land Surface-Atmosphere Interactions. Fast Process. Large-Scale Atmos. Models Prog. Chall. Oppor. 2023, 213–228. [Google Scholar] [CrossRef] [Scilit]
- Si, M.; Li, Z.-L.; Tang, B.-H.; Liu, X.; Nerry, F. Spatial heterogeneity of driving factors-induced impacts for global long-term surface urban heat island. Int. J. Remote Sens. 2024, 45, 7139–7159. [Google Scholar] [CrossRef] [Scilit]
- Yang, C.; Zhao, S. Diverse seasonal hysteresis of surface urban heat islands across Chinese cities: Patterns and drivers. Remote Sens. Environ. 2023, 294, 113644. [Google Scholar] [CrossRef] [Scilit]
- Zhang, Q.; Wu, Z.; Yu, H.; Zhu, X.; Shen, Z. Variable urbanization warming effects across metropolitans of China and relevant driving factors. Remote Sens. 2020, 12, 1500. [Google Scholar] [CrossRef] [Scilit]
- Ramamurthy, P.; Pena, J.C.; Liu, S.; Gonzalez-Cruz, J. The interaction between urban heat island intensity and sea-breeze effect. Philos. Trans. R. Soc. A Math. Phys. Eng. Sci. 2025, 383, 20240578. [Google Scholar] [CrossRef] [Scilit]
- Xiao, Y.; Yang, J.; Cui, L.; Deng, J.; Fu, P.; Zhu, J. Weakened sea-land breeze in a coastal megacity driven by urbanization and ocean warming. Earth’s Future 2023, 11, e2022EF003341. [Google Scholar] [CrossRef] [Scilit]
- Zhou, Y. Characterization and Modelling of Sea Breeze Cooling in Coastal Cities. Ph.D. Thesis, Flinders University, Adelaide, Australia, 2022. [Google Scholar]
- Jun, M.-J.; Kim, J.-I.; Kim, H.-J.; Yeo, C.-H.; Hyun, J.-Y. Effects of two urban development strategies on changes in the land surface temperature: Infill versus suburban new town development. J. Urban Plan. Dev. 2017, 143, 04017010. [Google Scholar] [CrossRef] [Scilit]
- Lin, L.; Zhao, Y. Optimizing local climate zones to mitigate urban heat risk: A multi-models coupled approach in the context of urban renewal. Build. Environ. 2025, 282, 113282. [Google Scholar] [CrossRef] [Scilit]
- Wang, B.; Yu, P.; Wang, J.; Wei, Y.; Li, Z.; Leng, A.; He, Q.; Li, Z.; Liu, Y.; Chen, Y. Compact infill expansion: A spatially efficient and low-carbon path to sustainable urbanization. Sustain. Cities Soc. 2025, 135, 106979. [Google Scholar] [CrossRef] [Scilit]
- Cuesta Fernández, R. Estimation of View Factors and Modelling of Longwave Radiation in Urban Environments. Master’s Thesis, University of Ljubljana, Ljubljana, Slovenia, 2025. [Google Scholar]
- Gong, F.-Y. Urban Canyon Morphology and Solar Radiation Dynamics. In Street Sensing: Urban Thermal Environment Assessment Using Street View Images; Springer: Berlin/Heidelberg, Germany, 2025; pp. 15–28. [Google Scholar]
- Zhao, J.; Yu, L.; Zhao, L.; Fu, H.; Gong, P. Asymmetric influence of urban morphology changes on land surface temperature between daytime and nighttime. Sustain. Cities Soc. 2025, 124, 106307. [Google Scholar] [CrossRef] [Scilit]
- Wu, W.; Guo, F.; Elze, S.; Knopp, J.; Banzhaf, E. Deciphering the effects of 2D/3D urban morphology on diurnal cooling efficiency of urban green space. Build. Environ. 2024, 266, 112047. [Google Scholar] [CrossRef] [Scilit]
- Wu, X.; Zhang, X.; Liao, W.; Chen, G.; Luo, M.; Liu, X. Contrasting 2D/3D urban morphology drivers of surface and canopy temperatures under different spatial scales. Build. Environ. 2025, 283, 113389. [Google Scholar] [CrossRef] [Scilit]
- Lu, Y.; Shao, Z.; Lu, H. Quantification of anthropogenic heat and simulation of its effects on environment and climate: A comprehensive review. Renew. Sustain. Energy Rev. 2024, 204, 114802. [Google Scholar] [CrossRef] [Scilit]
- Shen, P.; Li, Y.; Gao, X.; Chen, S.; Cui, X.; Zhang, Y.; Zheng, X.; Tang, H.; Wang, M. Climate adaptability of building passive strategies to changing future urban climate: A review. Nexus 2025, 2, 100061. [Google Scholar] [CrossRef] [Scilit]
- Simolo, C.; Corti, S. Quantifying the role of variability in future intensification of heat extremes. Nat. Commun. 2022, 13, 7930. [Google Scholar] [CrossRef] [Scilit]
- Cebrián, A.C.; Asín, J.; Gelfand, A.E.; Schliep, E.M.; Castillo-Mateo, J.; Beamonte, M.A.; Abaurrea, J. Spatio-temporal analysis of the extent of an extreme heat event. Stoch. Environ. Res. Risk Assess. 2022, 36, 2737–2751. [Google Scholar] [CrossRef] [Scilit]
- Li, D.; Sun, T.; Liu, M.; Yang, L.; Wang, L.; Gao, Z. Contrasting responses of urban and rural surface energy budgets to heat waves explain synergies between urban heat islands and heat waves. Environ. Res. Lett. 2015, 10, 054009. [Google Scholar] [CrossRef] [Scilit]
- Wei, Y.; Chen, H.; Huang, J.J. Response of surface energy components to urban heatwaves and its impact on human comfort in coastal city. Urban Clim. 2024, 54, 101836. [Google Scholar] [CrossRef] [Scilit]
- McGregor, G. The urban surface and heatwaves. In Heatwaves: Causes, Consequences and Responses; Springer: Berlin/Heidelberg, Germany, 2024; pp. 305–356. [Google Scholar]
- Qi, L.; Najam, H.; Oskenbayev, Y.; Alisher, S.; Hairis, K. Impact of rapid urban construction land expansion on spatial inequalities of ecosystem health in China: Evidence from national, economic regional, and urban agglomeration perspectives. Ecol. Indic. 2025, 172, 113196. [Google Scholar] [CrossRef] [Scilit]
- Irfeey, A.M.M.; Chau, H.-W.; Sumaiya, M.M.F.; Wai, C.Y.; Muttil, N.; Jamei, E. Sustainable mitigation strategies for urban heat island effects in urban areas. Sustainability 2023, 15, 10767. [Google Scholar] [CrossRef] [Scilit]
- Deng, J.; Lai, G.; Fan, A. Effects of the Western Pacific Subtropical High on the urban heat island characteristics in the middle and lower reaches of the Yangtze River, China. Comput. Urban Sci. 2024, 4, 25. [Google Scholar] [CrossRef] [Scilit]
- Zheng, Z.; Lin, X.; Chen, L.; Yan, C.; Sun, T. Effects of urbanization and topography on thermal comfort during a heat wave event: A case study of Fuzhou, China. Sustain. Cities Soc. 2024, 102, 105233. [Google Scholar] [CrossRef] [Scilit]
- Lei, C.; Pan, C.; Wang, Y.; Han, L.; Song, S. Urbanization effects on heat waves characterized by high topographic relief in a typical mountainous urban region. Urban Clim. 2025, 62, 102538. [Google Scholar] [CrossRef] [Scilit]
- Yang, X.; Zhang, Y.; Tang, H.; Huang, P.; Ling, X.; Peng, S.; Xiong, D. Spring rapid temperature variability in Southern China: Characteristics, decadal trend and associated climate impacts on crop yield. Int. J. Clim. 2025, 45, e8880. [Google Scholar] [CrossRef] [Scilit]
- Song, C.; Wang, J.; Liu, Y.; Ding, Y. Impact of the East Asian subtropical westerly jet on the interannual variability of the South China Sea summer monsoon onset and associated precursory thermal forcing role of the Tibetan Plateau. Int. J. Climatol. 2024, 44, 4326–4336. [Google Scholar]
- Fang, X.; Zhang, J.; Hu, R. Antarctic warming induced South Atlantic warming effect on the heatwaves in East Asia in 2022. Clim. Dyn. 2024, 62, 10247–10263. [Google Scholar] [CrossRef] [Scilit]
- Zhu, T.; Dai, W.; Wang, Y.; Xie, M. Two-Stage Process for Understanding Summer Monsoon Impact on Ozone over Eastern China. Atmosphere 2025, 16, 444. [Google Scholar] [CrossRef] [Scilit]
- Duan, Z.; Fan, S.; Zhang, Y.; Ji, T. Contrasting boundary-layer energy budgets during daytime, nighttime, and compound heatwaves in eastern China. iScience 2026, 29, 114892. [Google Scholar] [CrossRef] [Scilit] [PubMed]
- Malik, A.; Singh, H. Urban Green Spaces and Blue-Green Infrastructure: Pathways to Carbon Neutrality and Building Sustainable Cities. In Forestry for a Carbon-Neutral and Sustainable Future: A Scientific Perspective; Springer: Berlin/Heidelberg, Germany, 2026; pp. 433–452. [Google Scholar]
- Dhyani, S.; Singh, S.; Basu, M.; Dasgupta, R.; Santhanam, H. Blue-green infrastructure for addressing urban resilience and sustainability in the warming world. In Blue-Green Infrastructure Across Asian Countries: Improving Urban Resilience and Sustainability; Springer: Berlin/Heidelberg, Germany, 2022; pp. 1–22. [Google Scholar]
- Lin, H.; Li, X. The role of urban green spaces in mitigating the urban heat island effect: A systematic review from the perspective of types and mechanisms. Sustainability 2025, 17, 6132. [Google Scholar] [CrossRef] [Scilit]
- Almusaed, A.; Yitmen, I.; Myhren, J.A.; Almssad, A. Assessing the impact of recycled building materials on environmental sustainability and energy efficiency: A comprehensive framework for reducing greenhouse gas emissions. Buildings 2024, 14, 1566. [Google Scholar] [CrossRef] [Scilit]
- Li, Z.L.; Wu, H.; Duan, S.B.; Zhao, W.; Ren, H.; Liu, X.; Leng, P.; Tang, R.; Ye, X.; Zhu, J.; et al. Satellite remote sensing of global land surface temperature: Definition, methods, products, and applications. Rev. Geophys. 2023, 61, e2022RG000777. [Google Scholar] [CrossRef] [Scilit]
- Zhang, X.; Meng, C.; Gou, P.; Huang, Y.; Ma, Y.; Ma, W.; Wang, Z.; Hu, Z. Evaluating the reconstructed all-weather land surface temperature for urban heat island analysis. Remote Sens. 2024, 16, 373. [Google Scholar] [CrossRef] [Scilit]
- Fu, X.; He, B.-J.; Liu, H. Uncertainties of urban heat island estimation with diverse reference delineation methods based on urban–rural division and local climate zone. IEEE J. Sel. Top. Appl. Earth Obs. Remote Sens. 2024, 17, 18818–18833. [Google Scholar] [CrossRef] [Scilit]
- Pakarnseree, R.; Takkanon, P. Sky view factor in urban climate studies: Clarification, methods, and framework for future applications. SSRN 2024. [Google Scholar] [CrossRef] [Scilit]
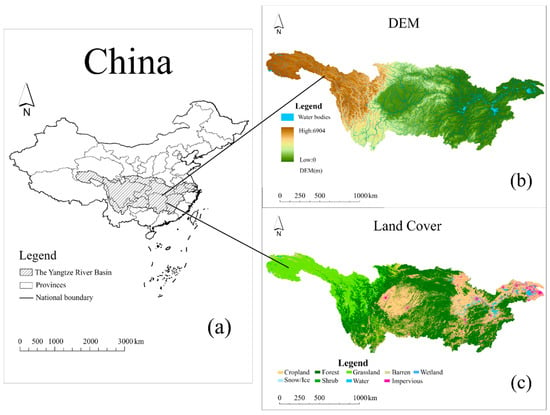
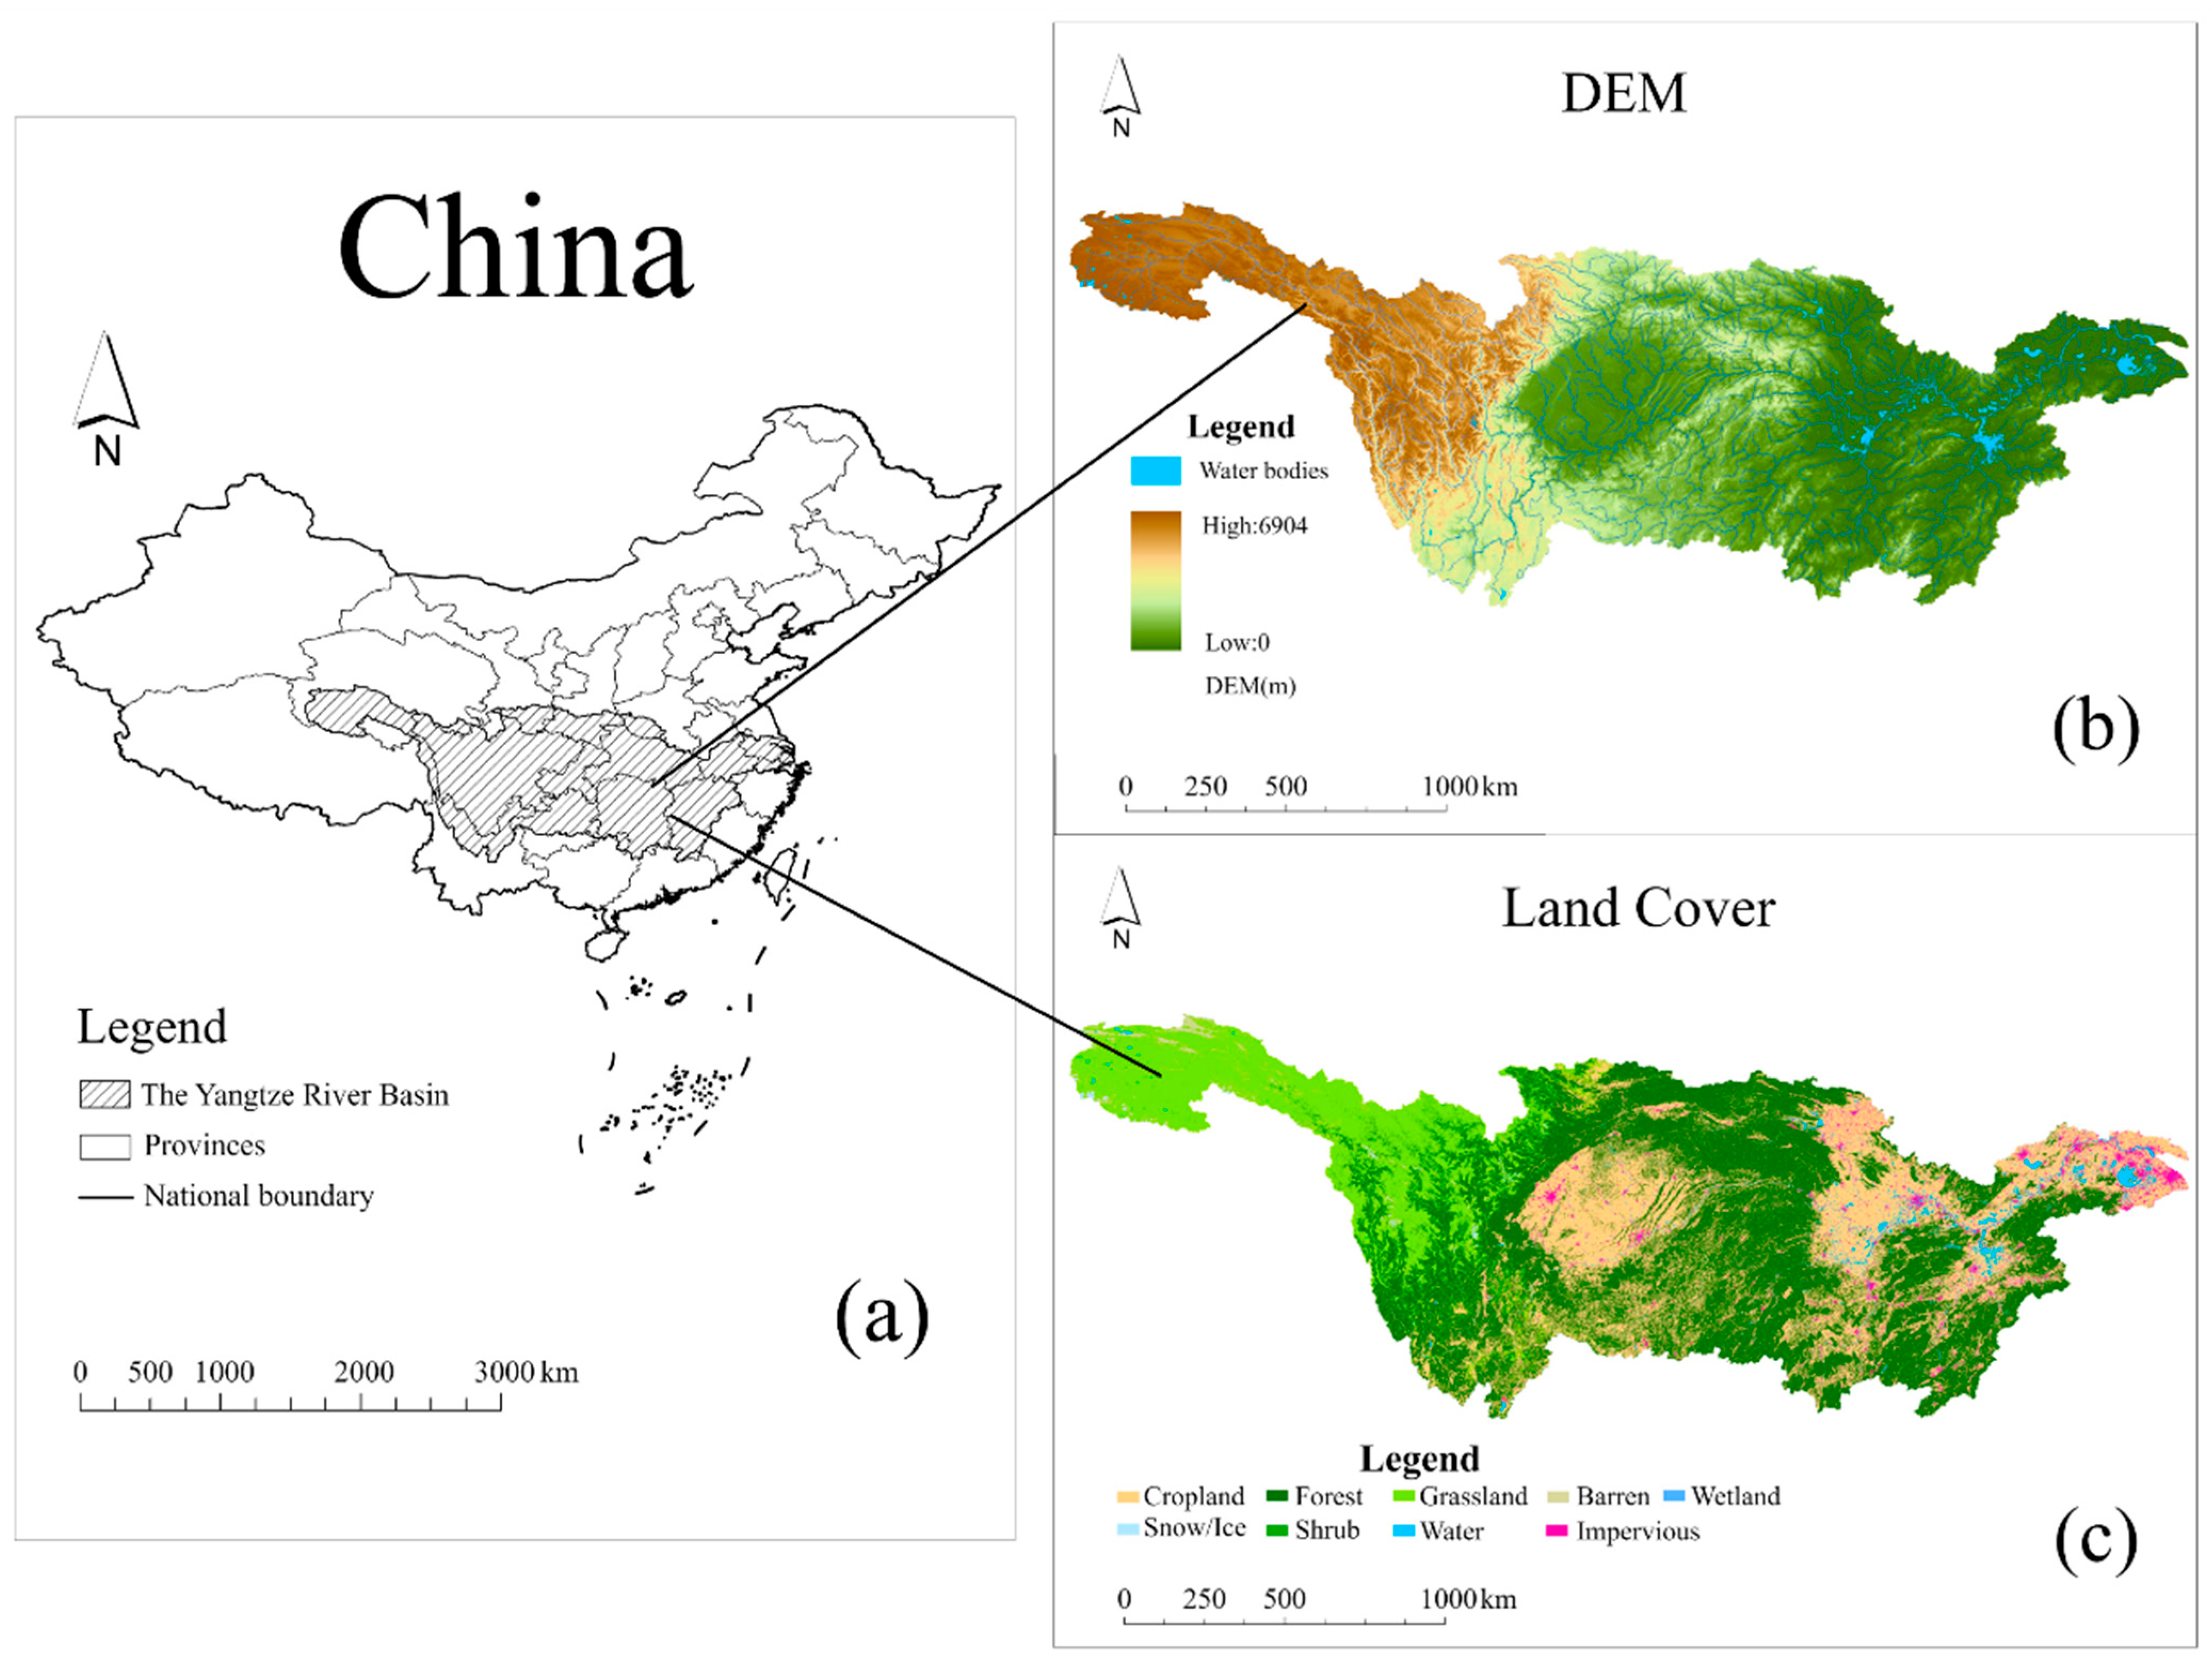
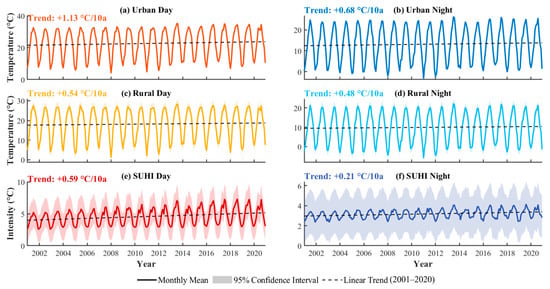
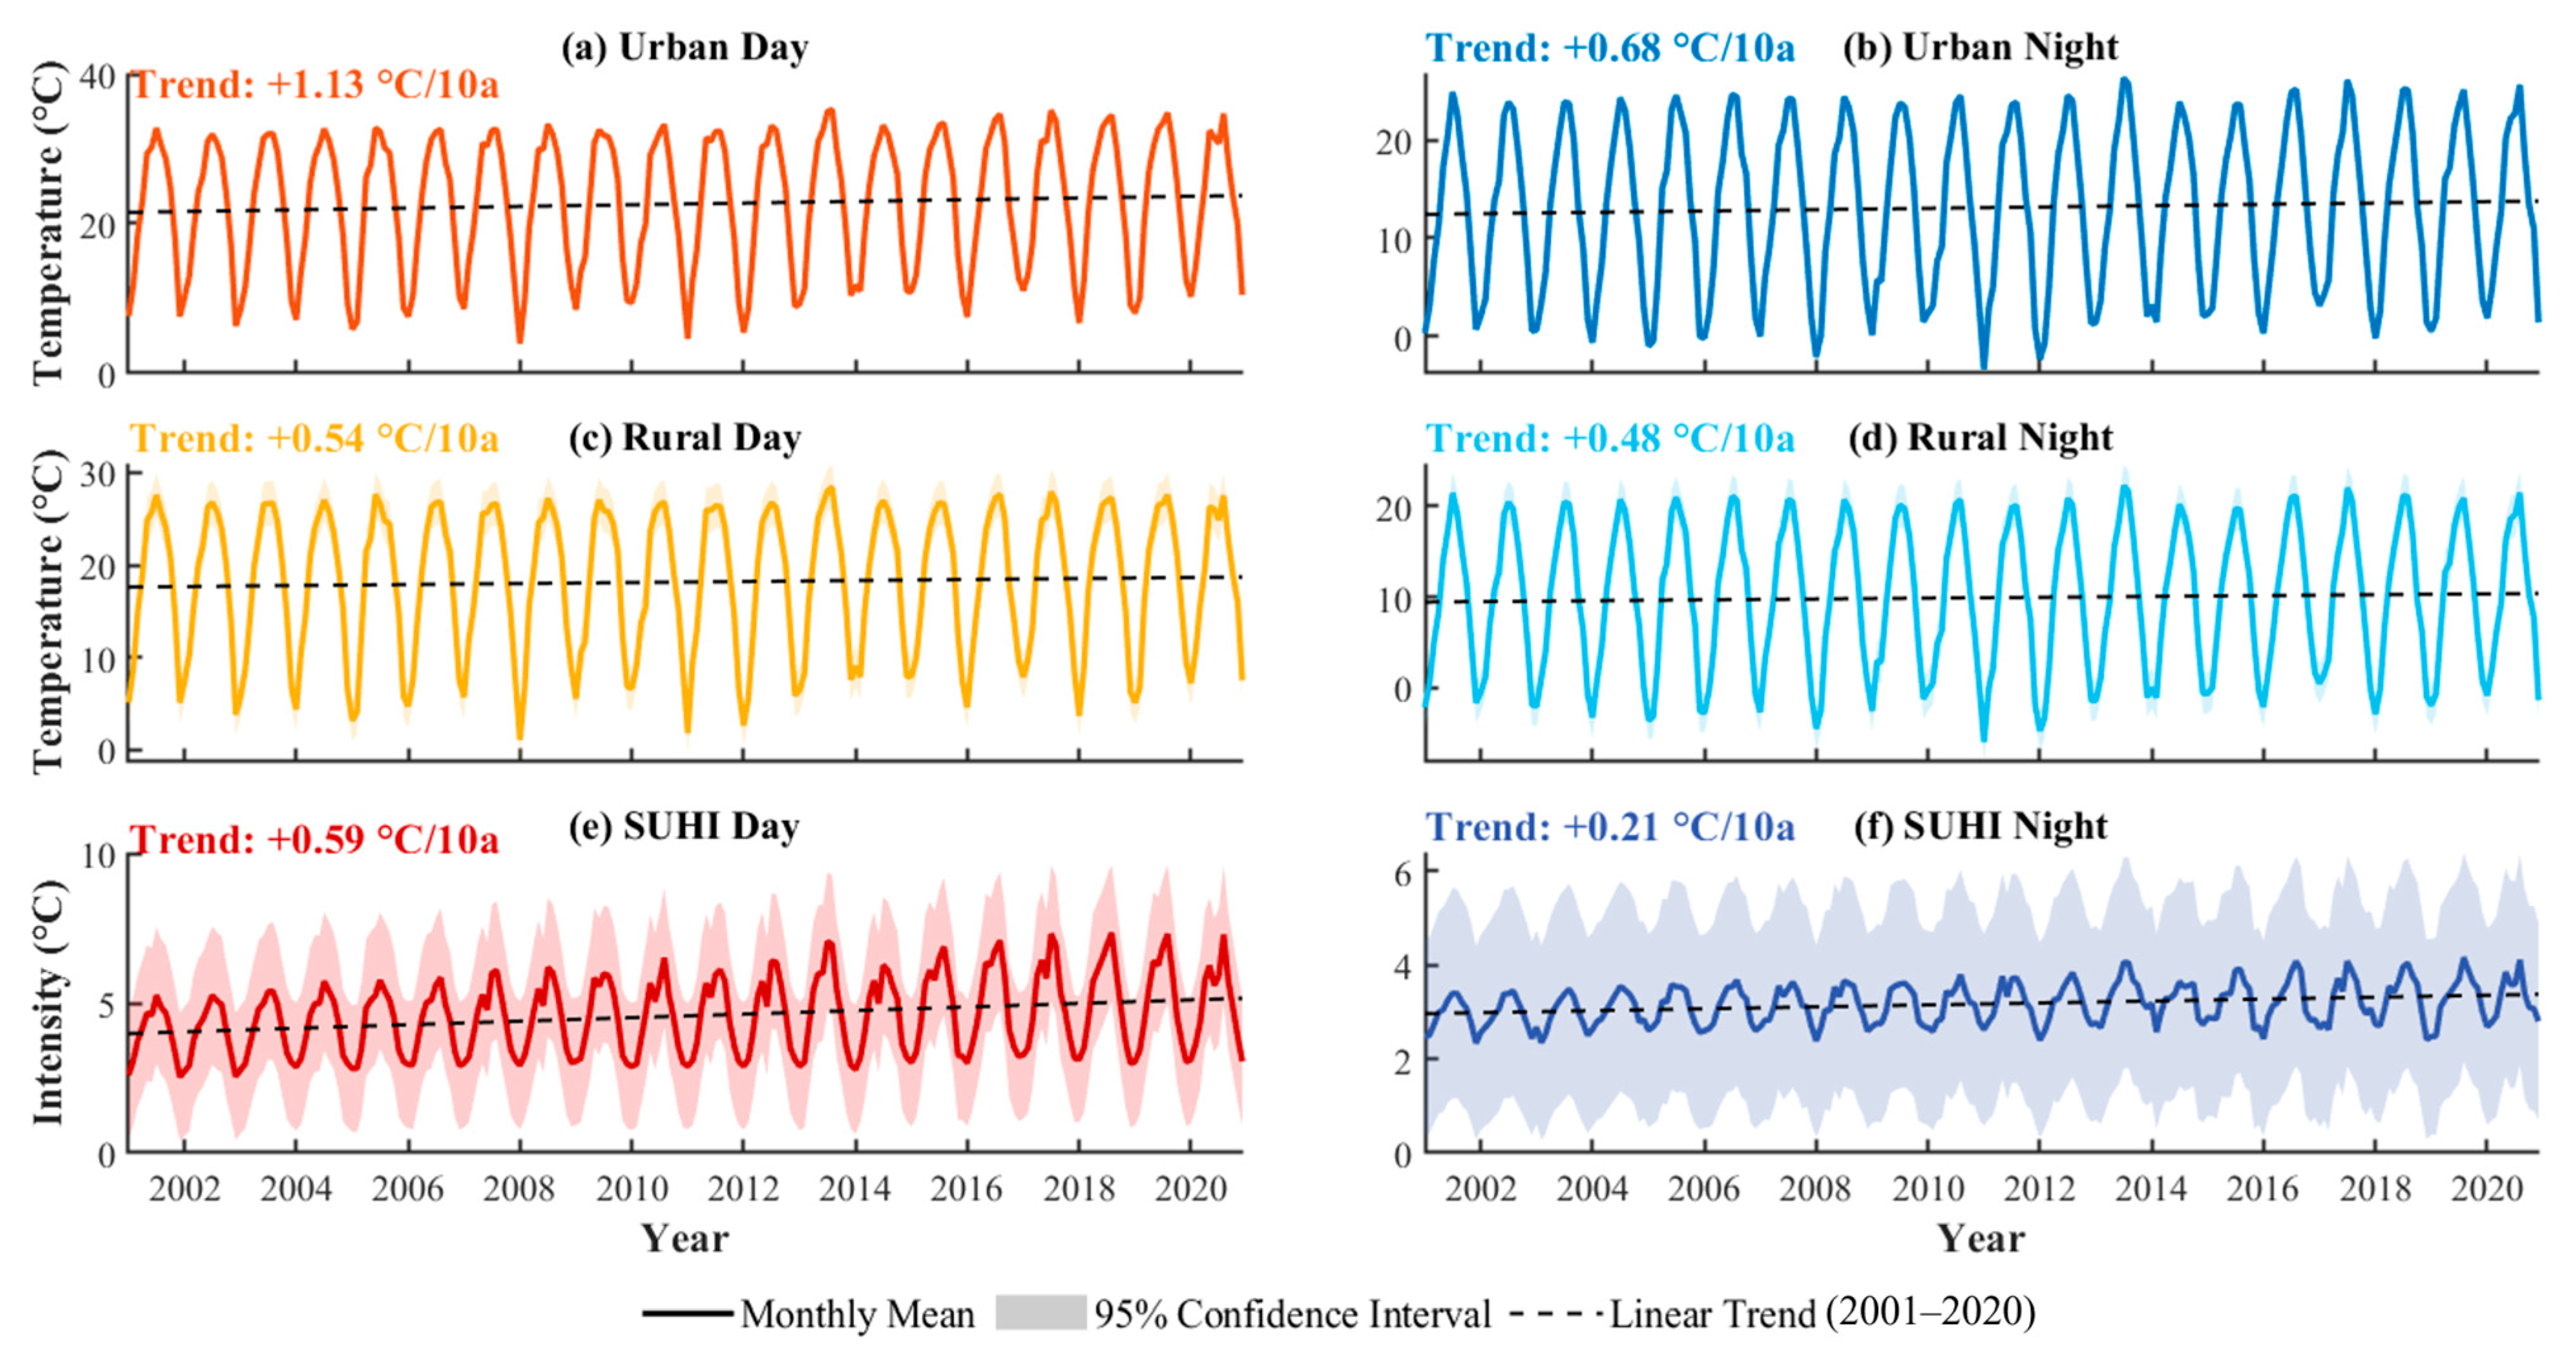
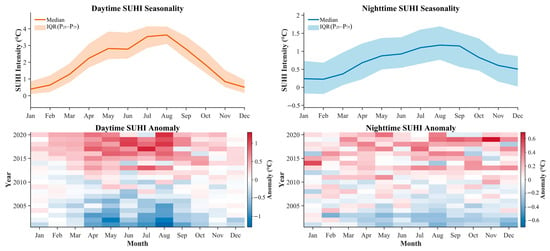
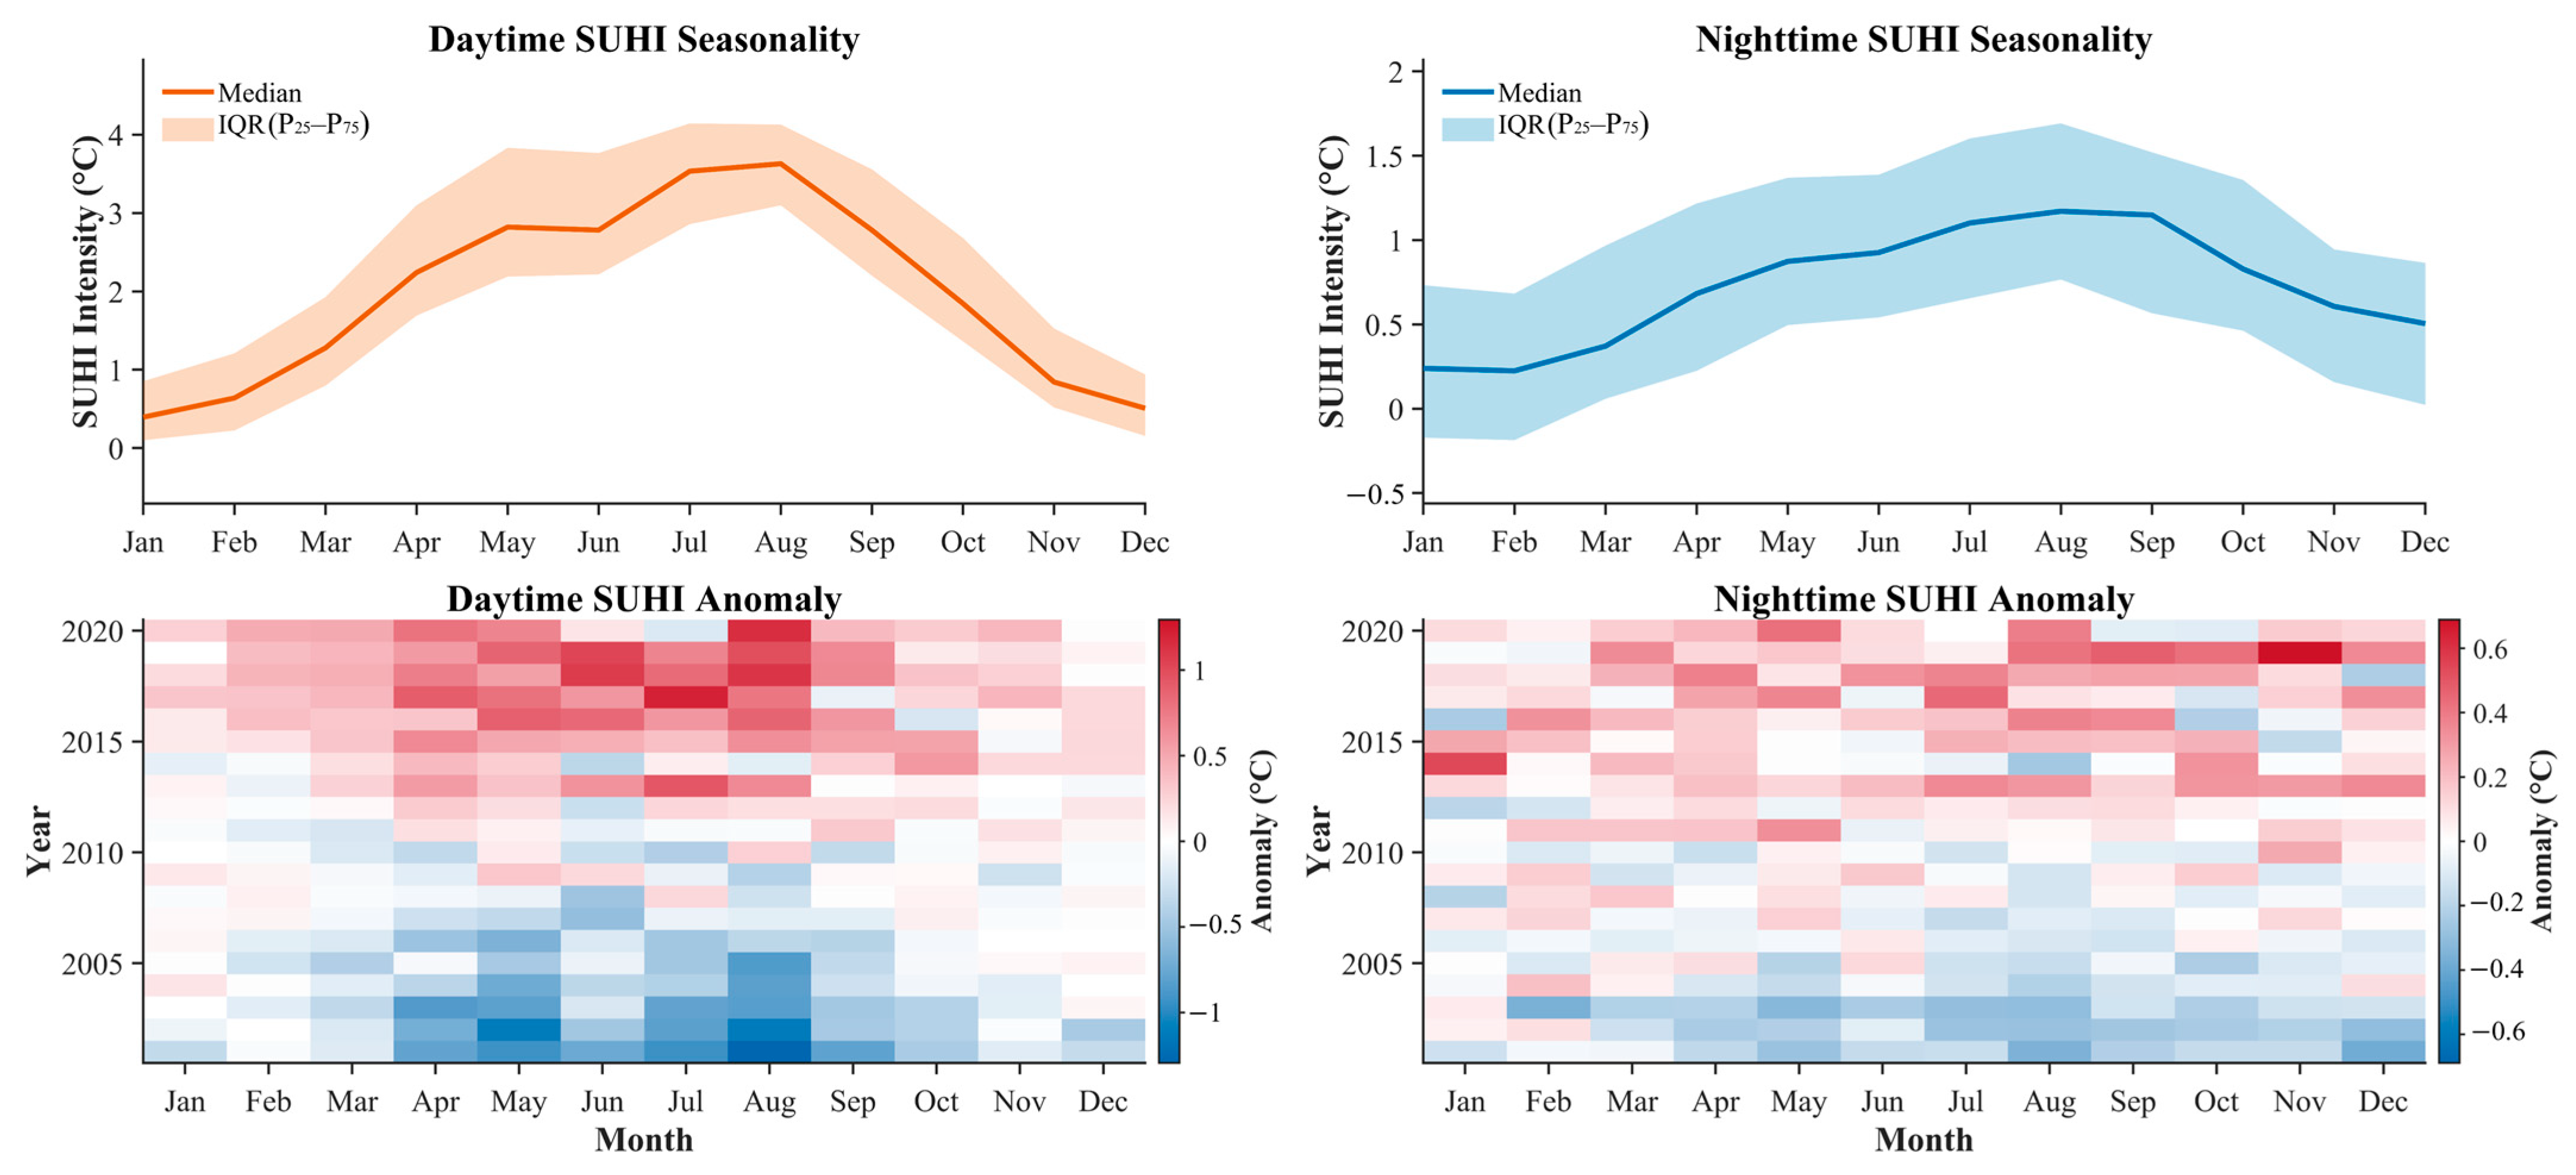
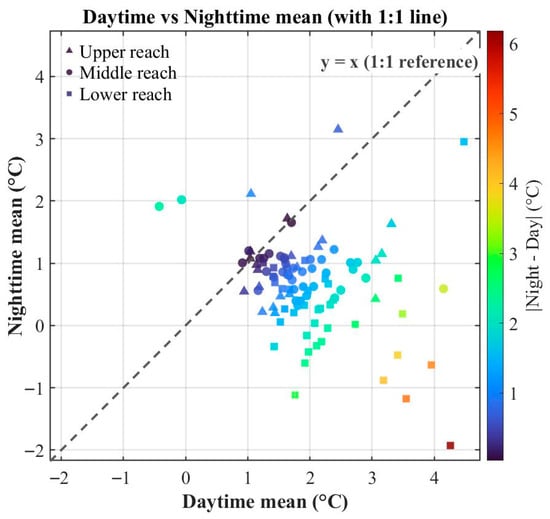
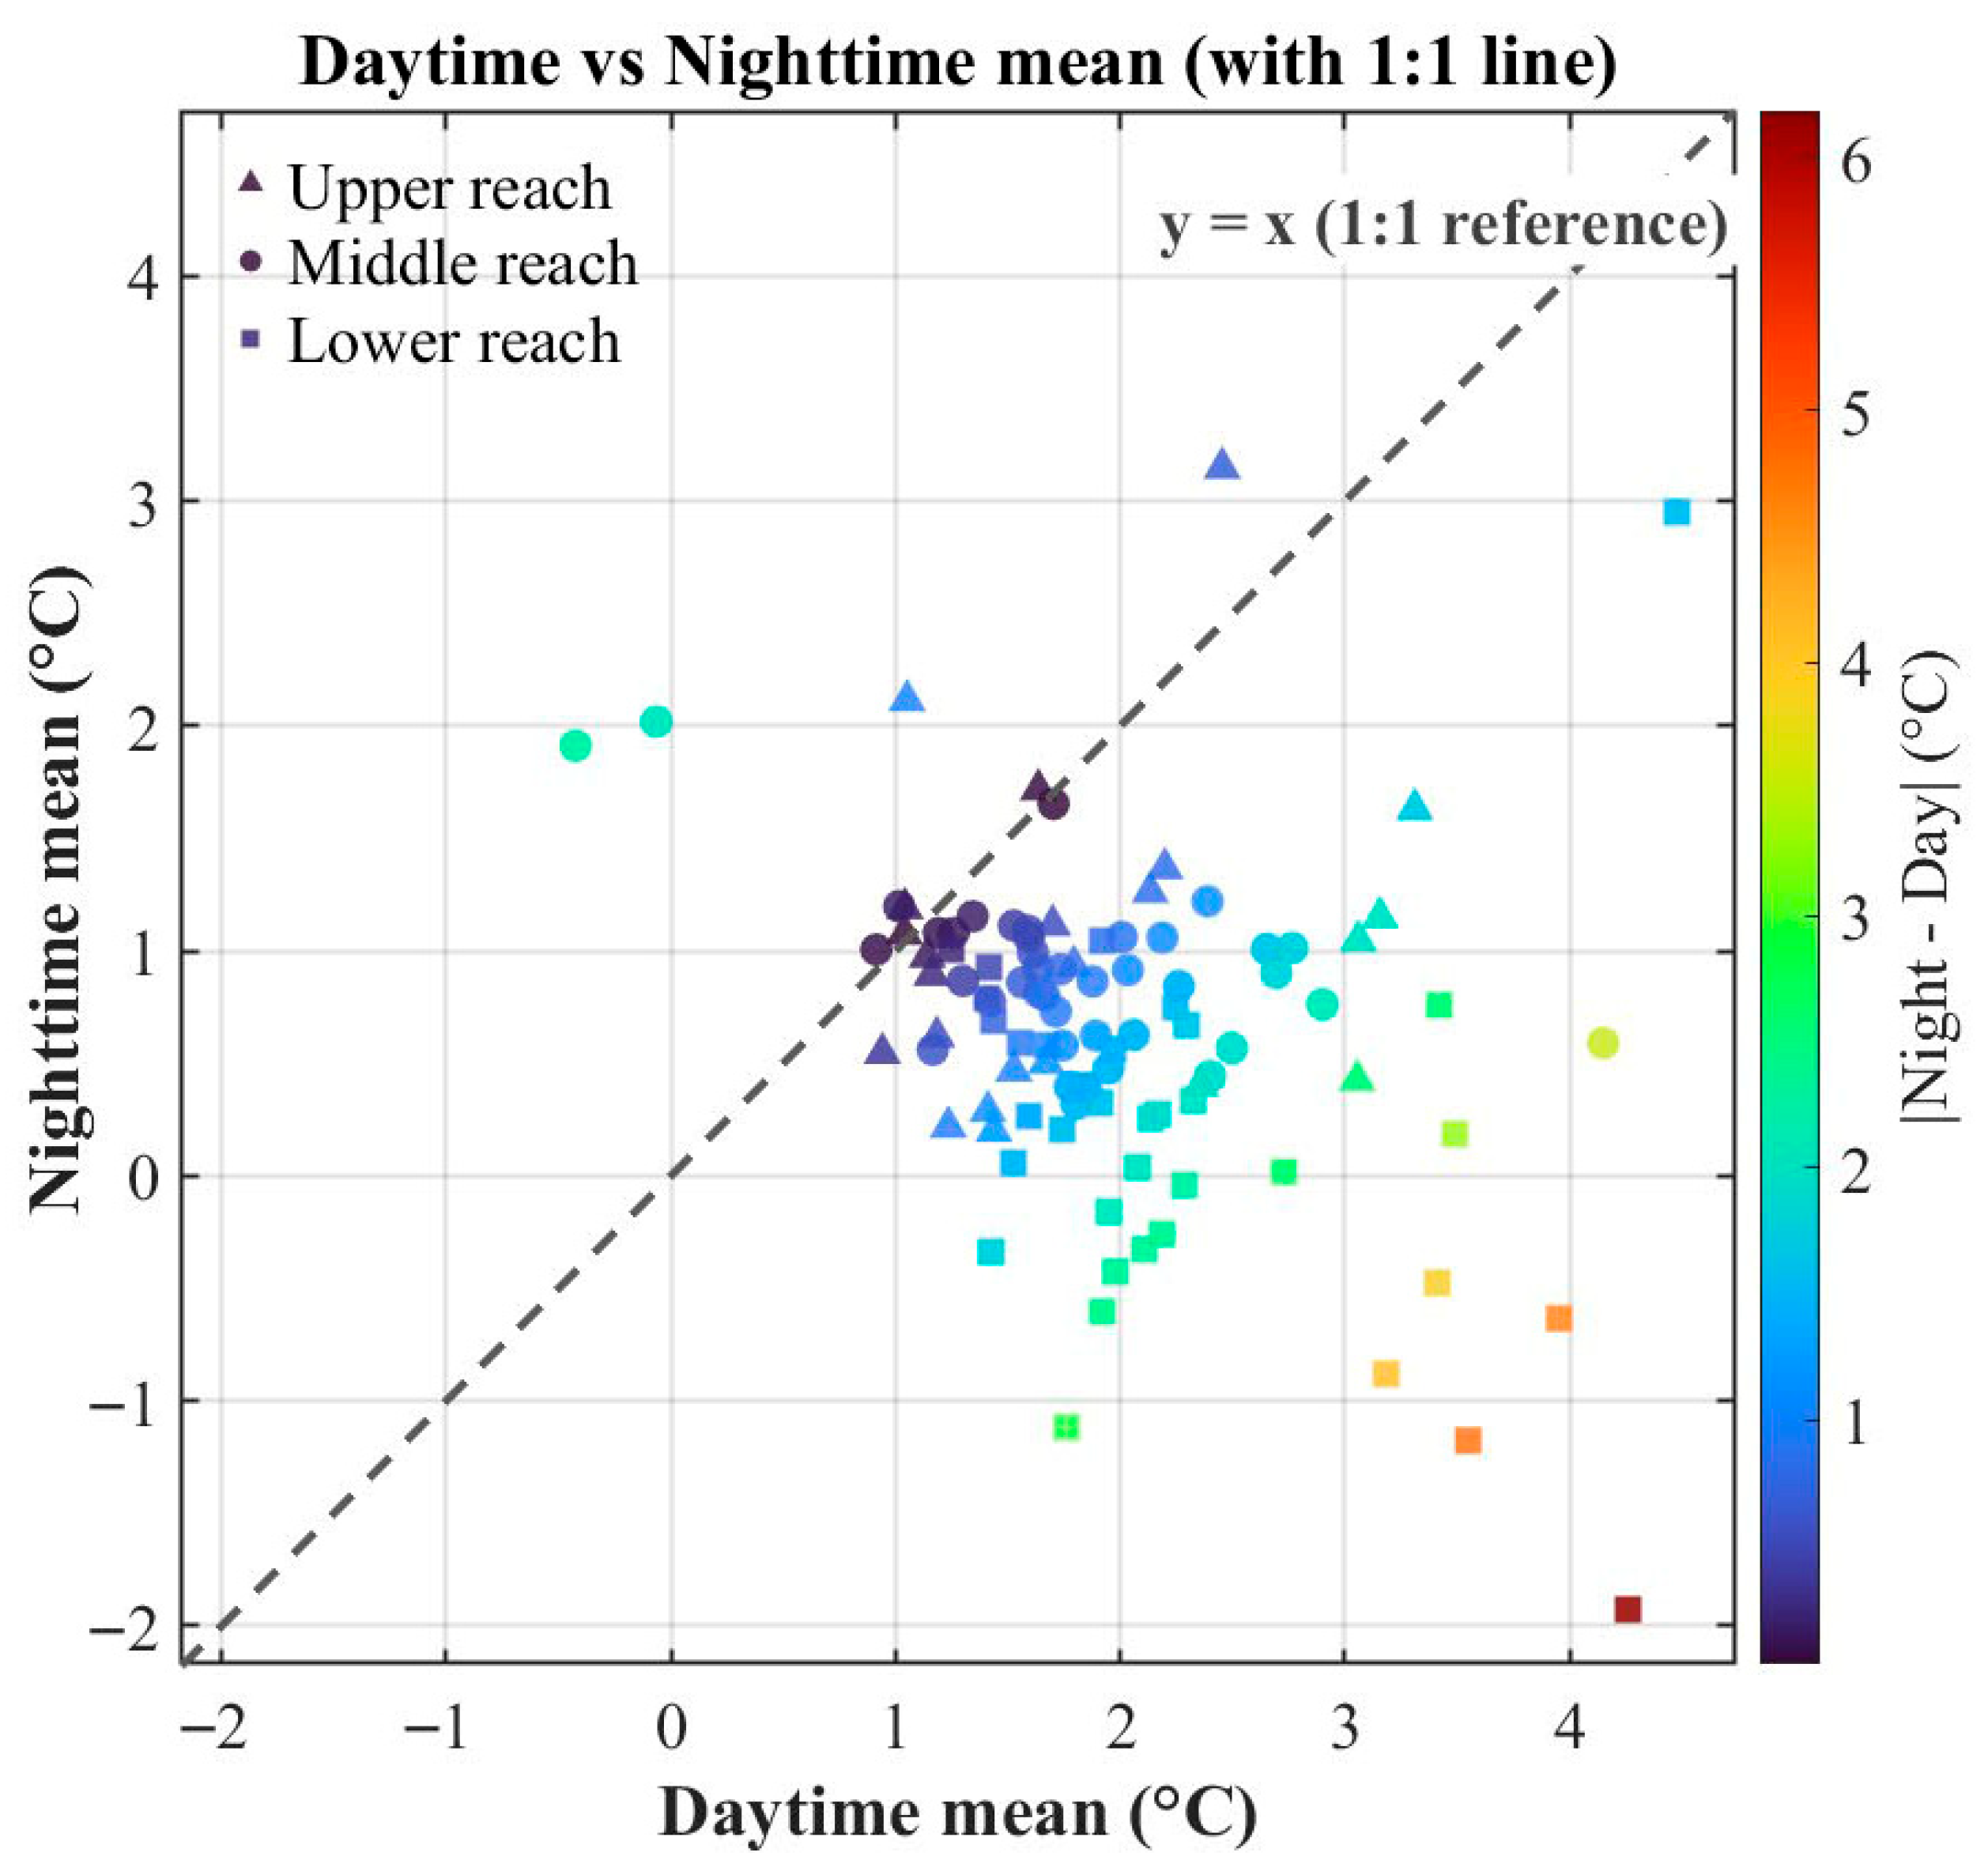
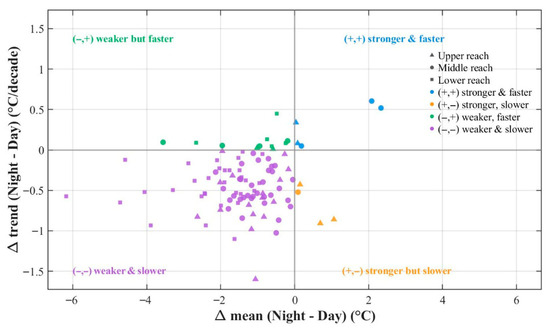
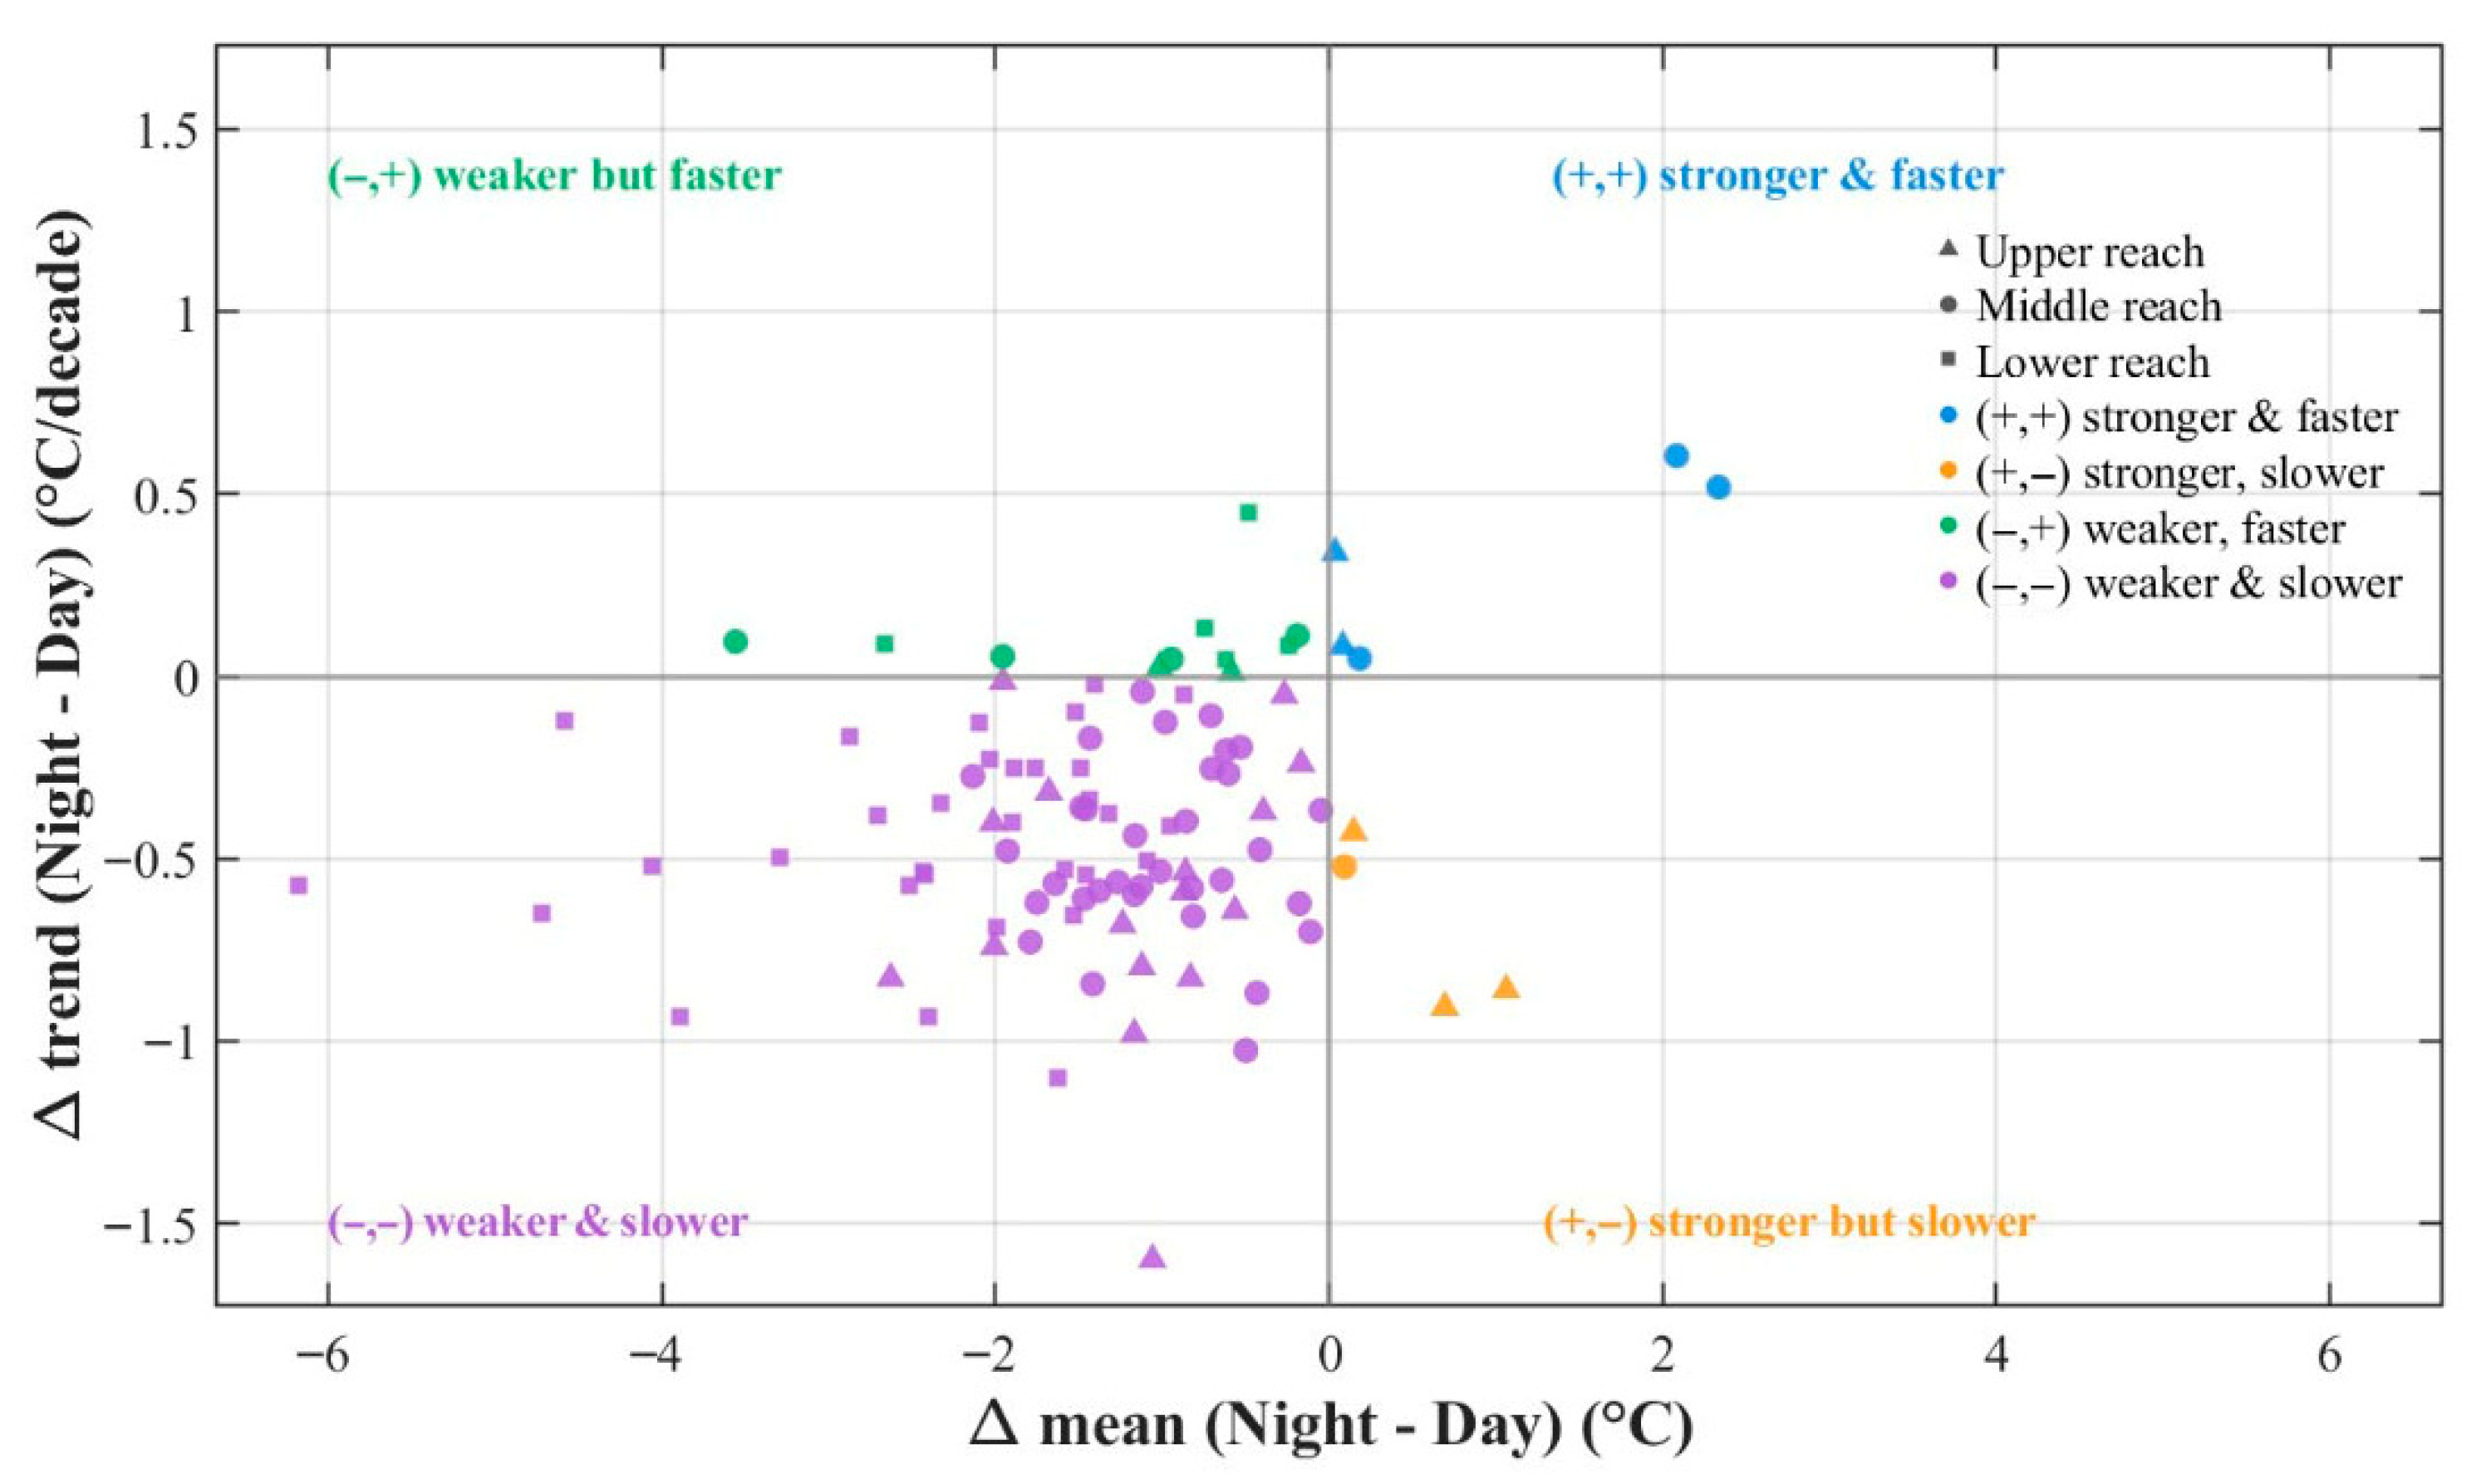
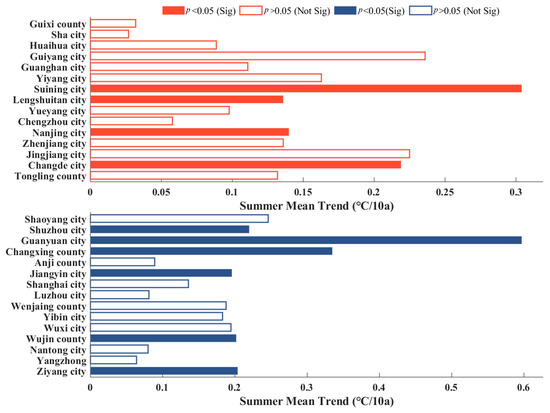
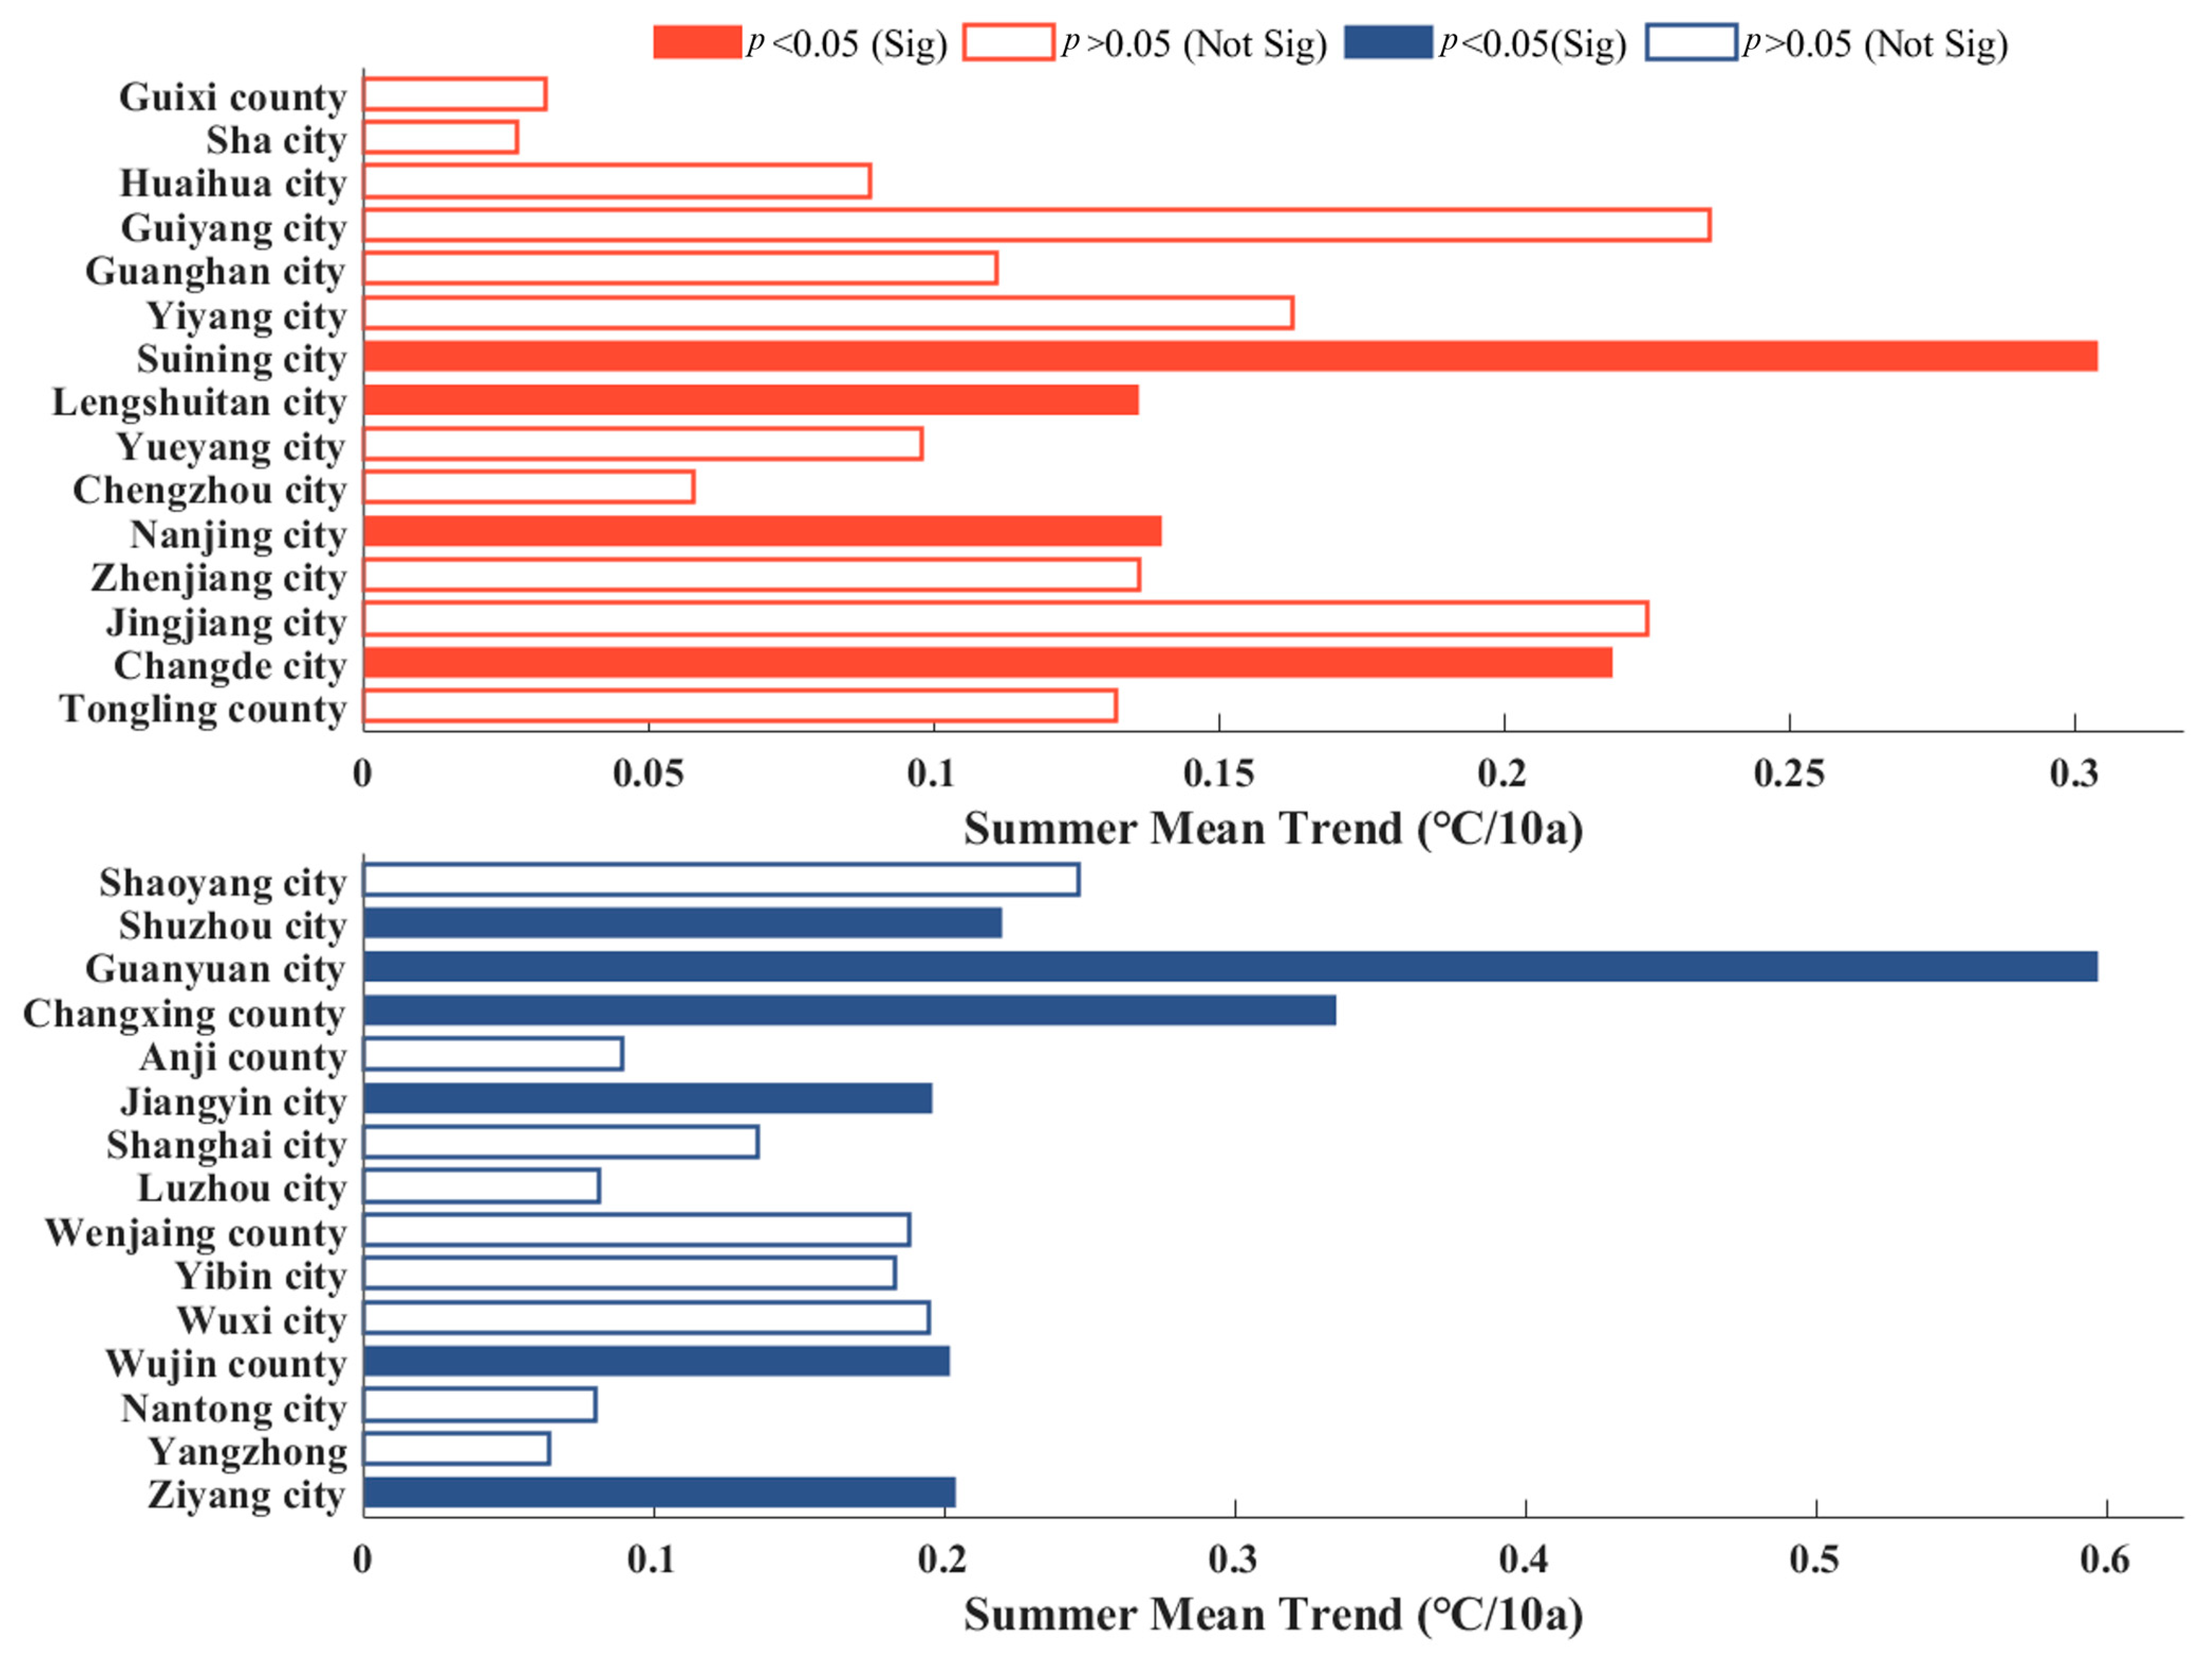
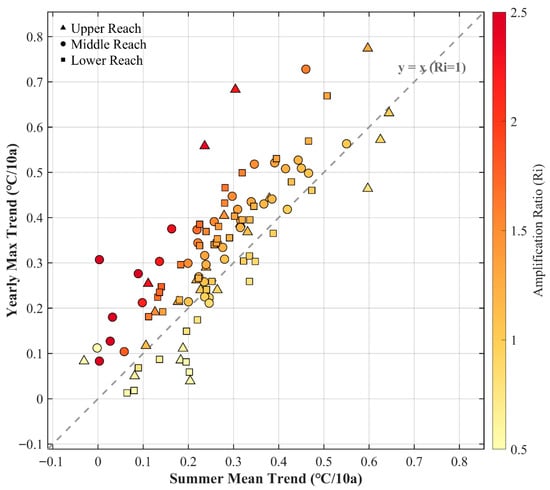
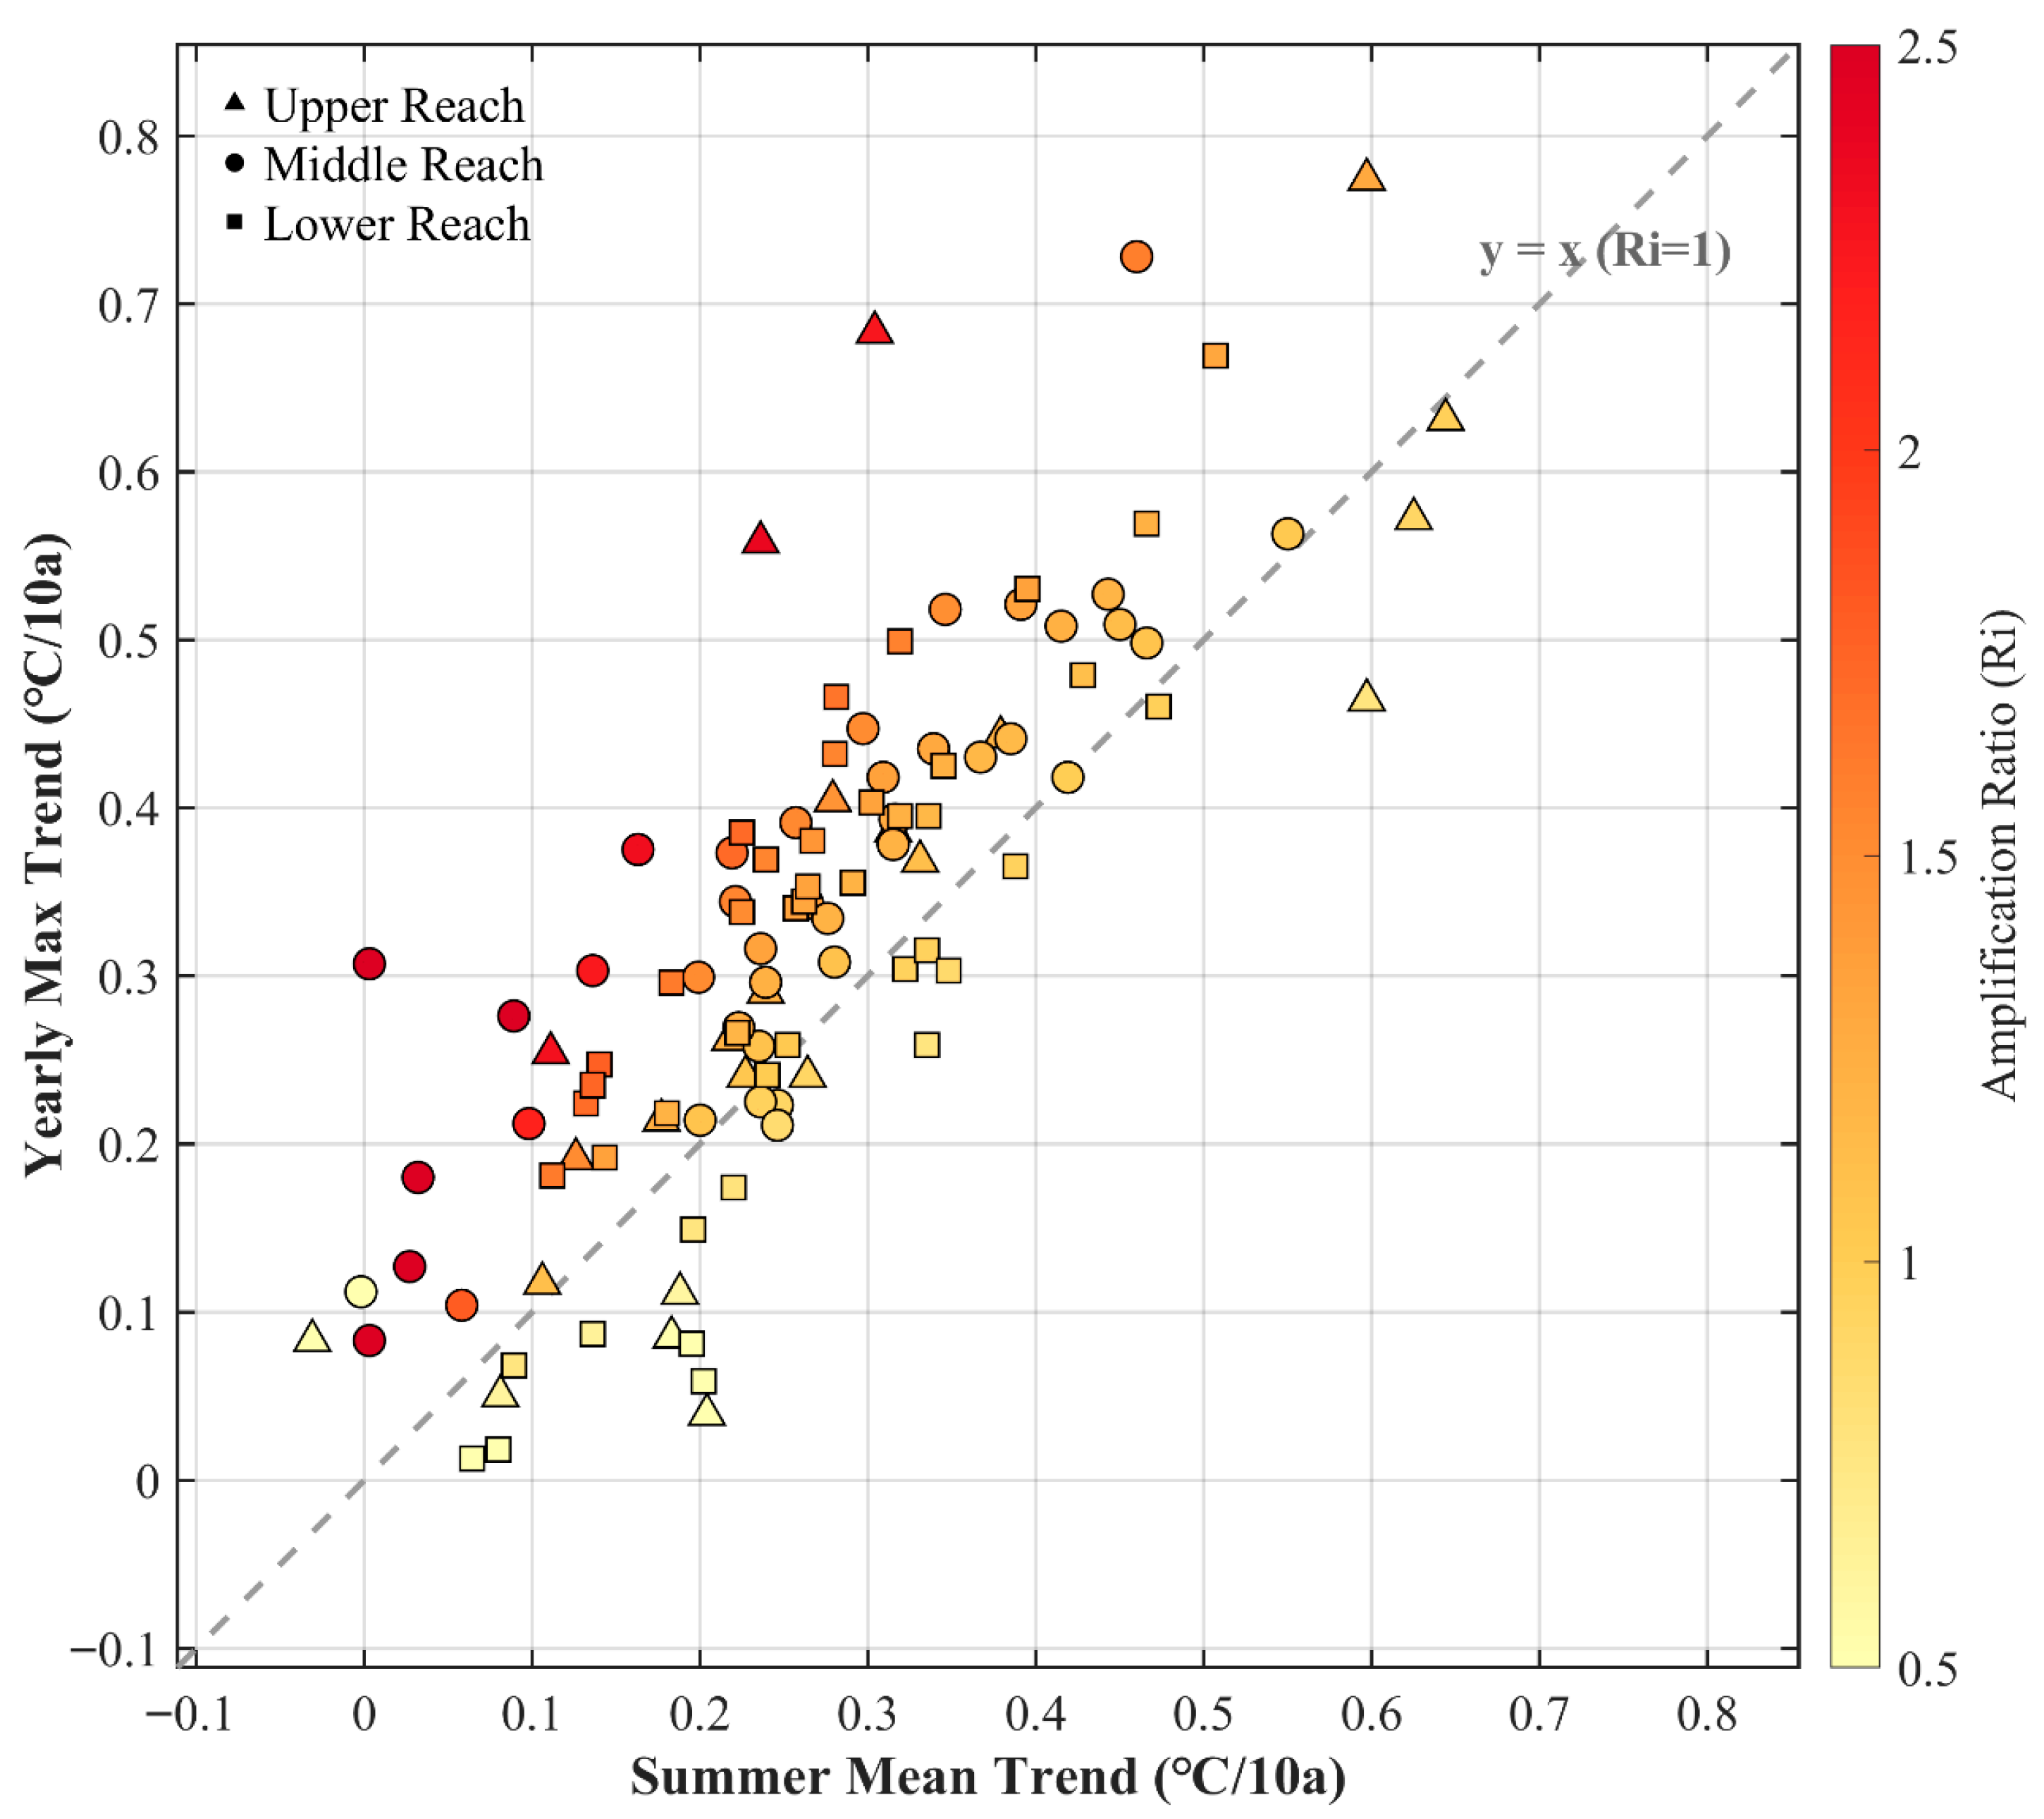
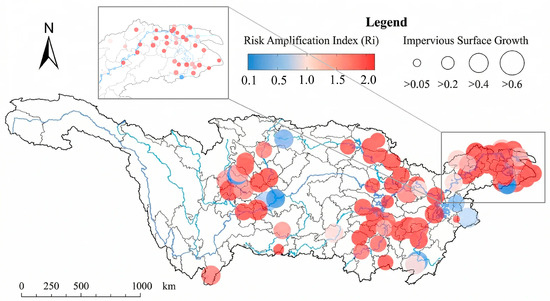
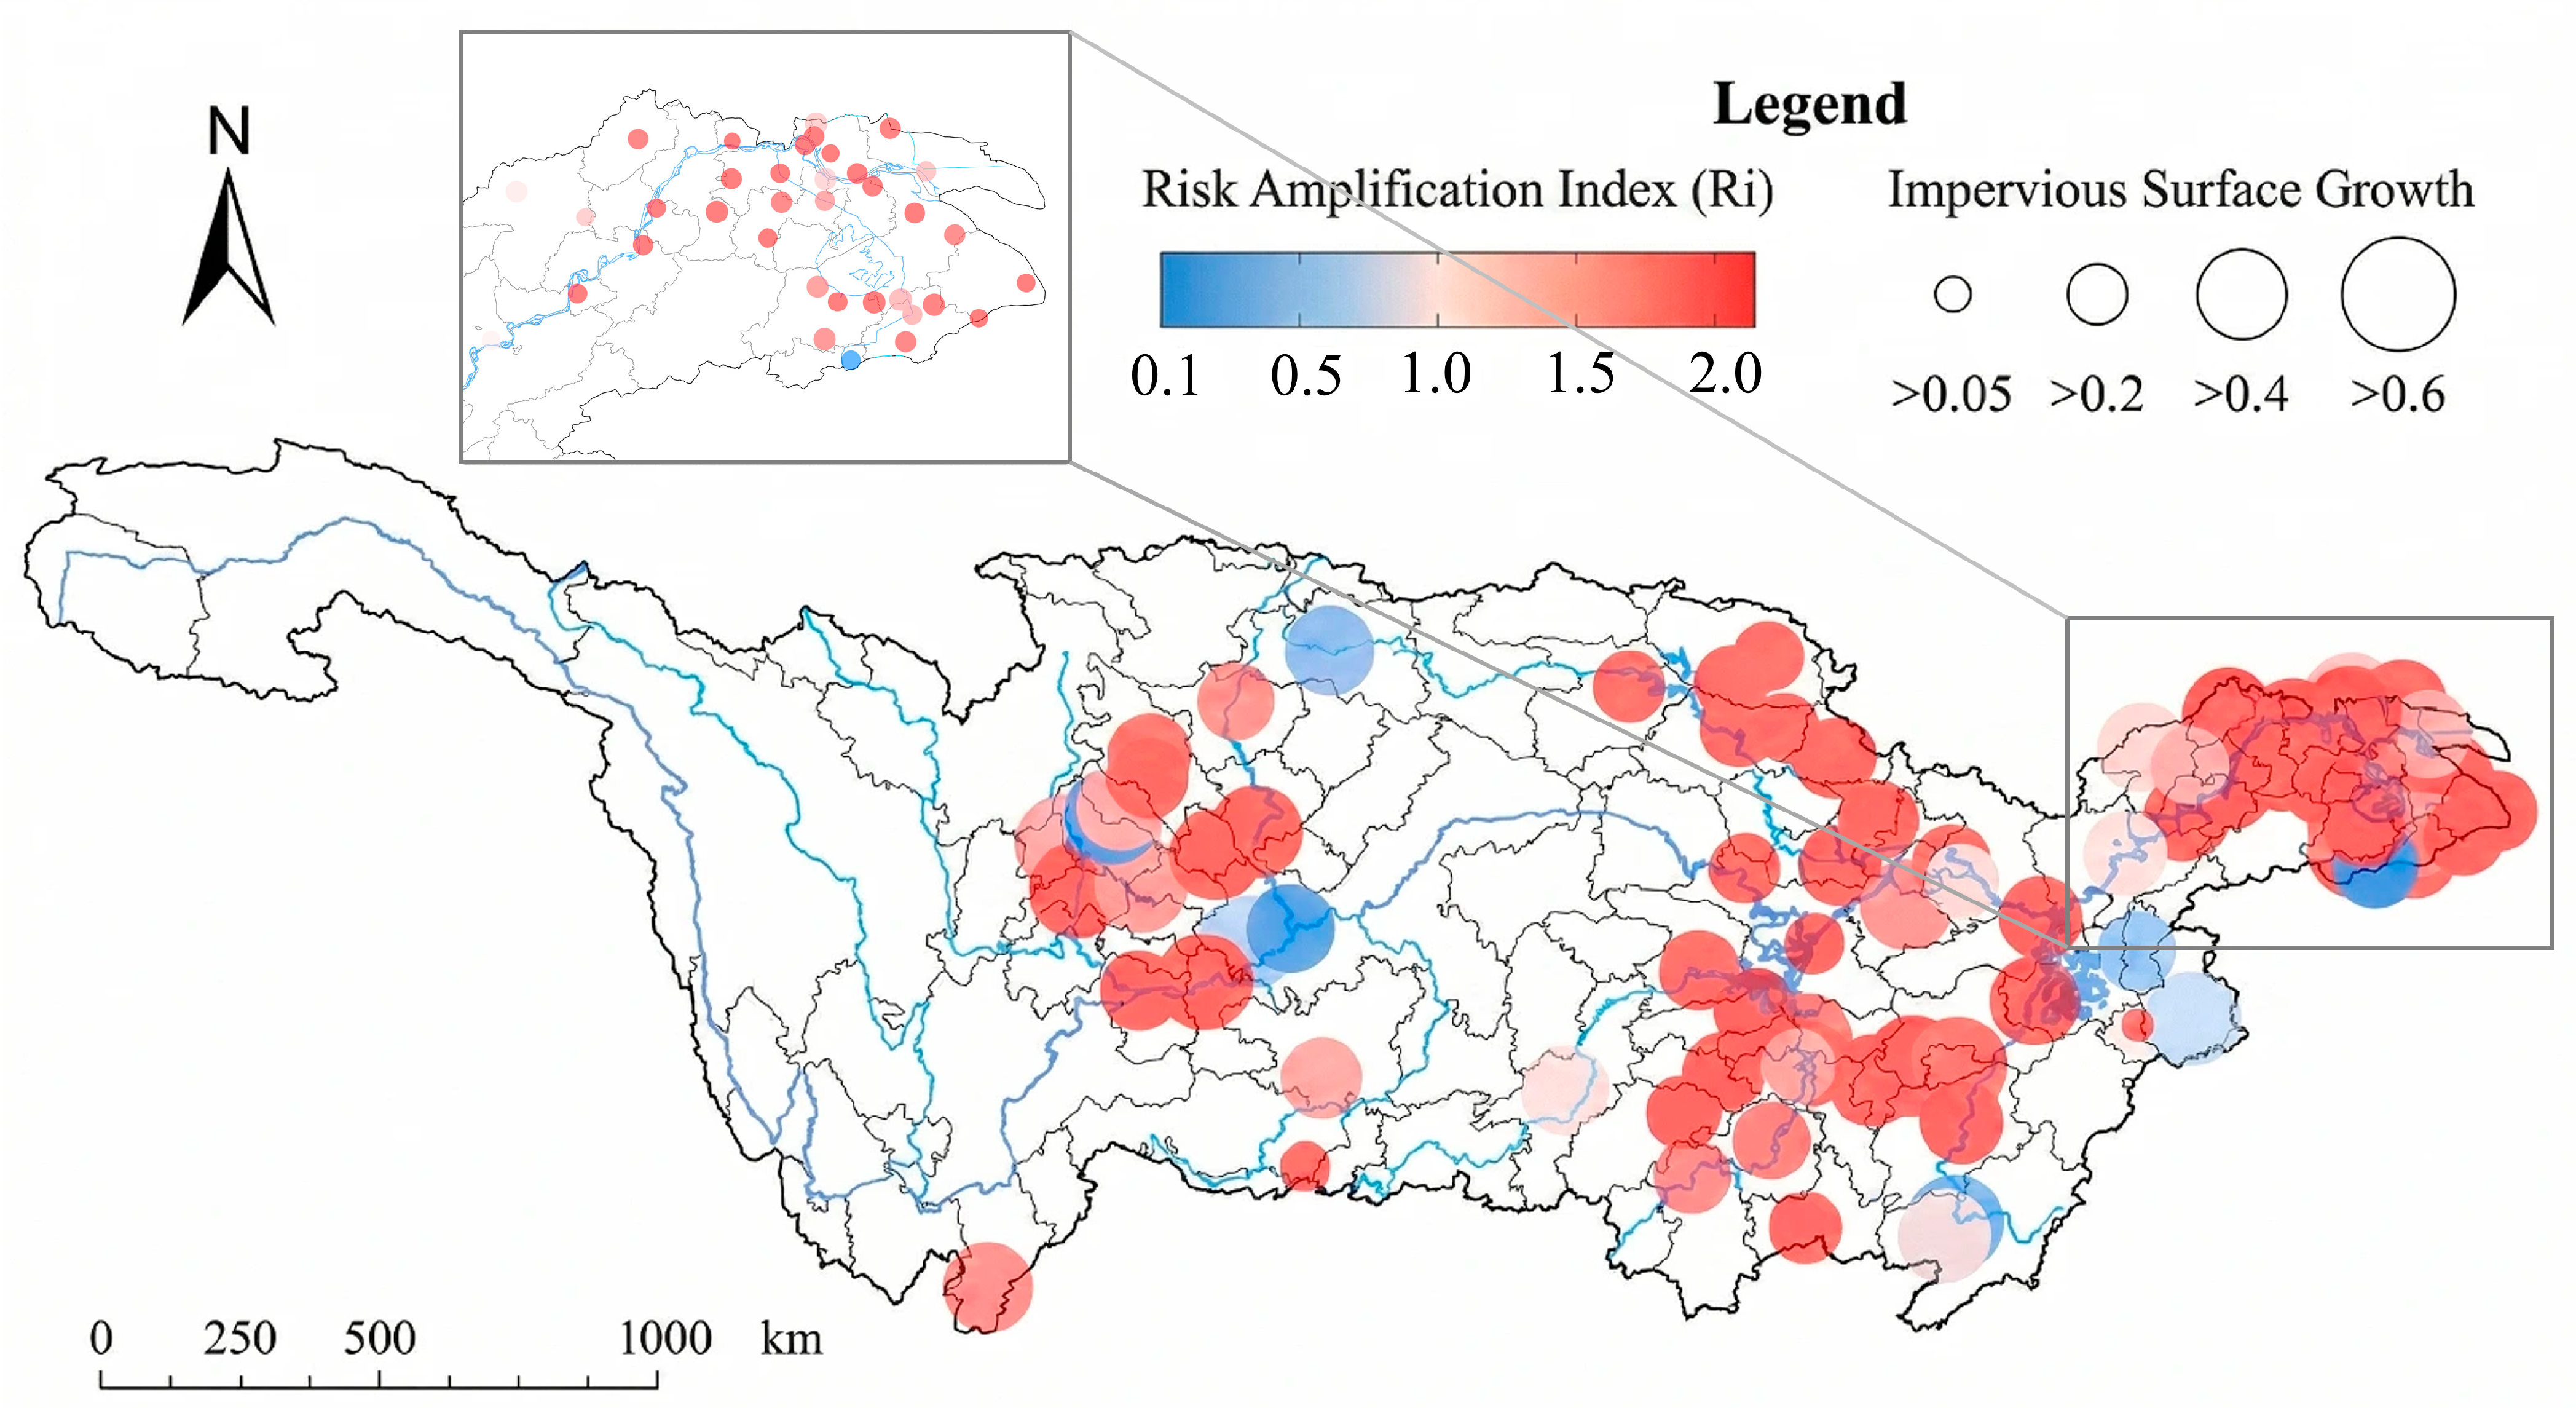
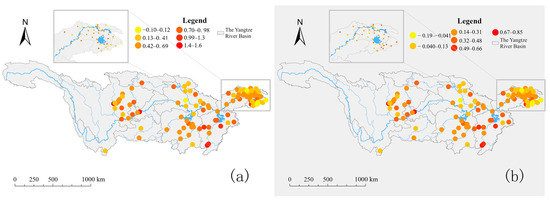
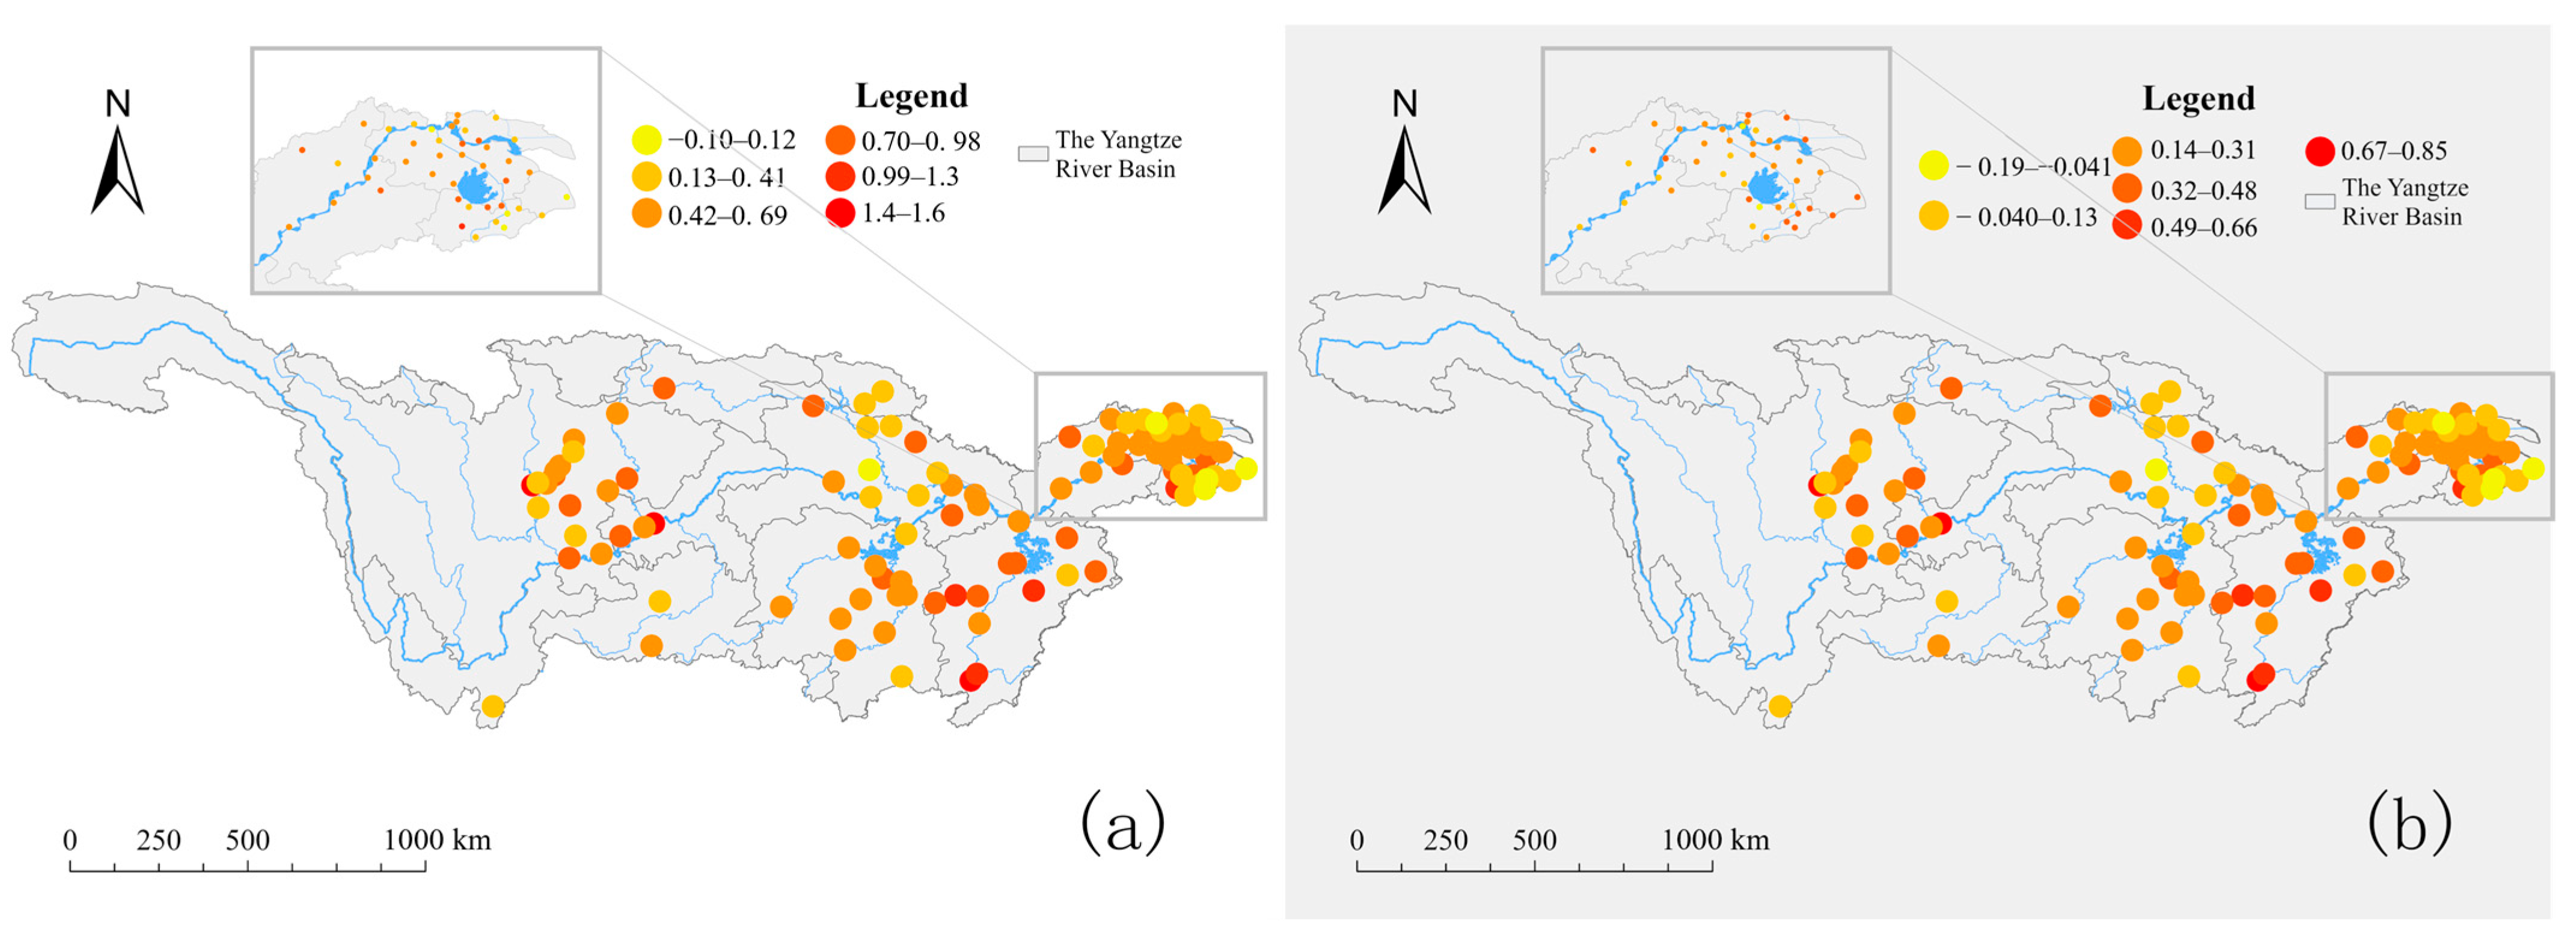

Disclaimer/Publisher’s Note: The statements, opinions and data contained in all publications are solely those of the individual author(s) and contributor(s) and not of MDPI and/or the editor(s). MDPI and/or the editor(s) disclaim responsibility for any injury to people or property resulting from any ideas, methods, instructions or products referred to in the content. |
© 2026 by the authors. Licensee MDPI, Basel, Switzerland. This article is an open access article distributed under the terms and conditions of the Creative Commons Attribution (CC BY) license.