


Highlights
What are the main findings?
- The existence of a statistically significant and unidirectional drift in the difference between the AIRS CH4 satellite instrument readings and the ground-based data was identified and confirmed. Although the precise cause of this drift is currently uncertain, a number of hypotheses have been proposed.
- The study presents a novel, data-driven correction method for AIRS CH4 total content that has been shown to improve agreement with ground-based observations and convergence of trend estimates.
What are the implications of the main findings?
- The proposed method enables statistical correction, aimed at increasing the consistency between satellite and ground-based measurements, as well as improving the corresponding climate and air-quality projections.
- The method can be applied to correct other long-term satellite observations, such as those relating to atmospheric composition, underlying surface parameters, climatic and meteorological parameters, and radiation characteristics, provided that the necessary high-precision ground-based measurement series and datasets are available.
Abstract
The study aims to develop a methodology for identifying and correcting drift in the quality of orbital data to improve the accuracy of long-term trend estimates and enhance the representativeness of orbital monitoring. We establish the presence of unidirectional, statistically significant drift in the difference between satellite instrument readings and ground-based observations. We compare the last two versions of methane (CH4) measurements from the Atmospheric InfraRed Sounder (AIRS)—specifically, Level 3 versions 6 and 7 (“IR-AIRS Only”)—with data from 18 ground-based stations of the Network for the Detection of Atmospheric Composition Change (NDACC) and 11 stations of the Total Carbon Column Observing Network (TCCON) for the 2003–2022 period. We determine that adjusting ground-based measurement data to sea level using the barometric formula, which is a necessary step for proper validation, results in significant errors, especially at high altitudes. It is proposed that such an adjustment should be based on pressure measured directly at a station. Implementing this over the examined period, we determine that the residual drift of the satellite spectrometer (Satellite Spectrometer Drift or SSD) is negative and equal to 1.64 × 10¹⁴ molecules/cm2 per day or 7.62 × 10⁻⁶ ppm per day for AIRS v6 and 7.20 × 10⁻⁶ ppm per day for AIRS v7. The correction implementation significantly improves the correspondence between AIRS v6 and v7 methane data and NDACC data, resulting in close estimates of methane trends from satellite and ground-based measurements. The robustness of the proposed correction has been demonstrated by the improvement in the consistency of station-by-station trend estimates obtained for corrected AIRS data and independent TCCON ground-based observations.
1. Introduction
Methane is the second most important greenhouse gas for driving climate change after CO2 and the most potent on a per-molecule basis [1]. Compared to CO2, CH4 has a much shorter atmospheric lifetime, ~10 years compared to centuries for CO2 [2]. On a 100-year timescale, methane has a greenhouse potential that is 28–32 times greater than that of carbon dioxide [1,3], and it can accelerate processes of global warming [4,5]. Therefore, accurately assessing methane trends and emissions is an important task attracting the attention of many researchers and research teams. As methane concentration trends are changing and the causes of these changes are not fully understood [6], long-term measurements of atmospheric methane in different regions of the globe are of great scientific interest [7]. Given the absence of consistent, long-term, ground-based measurements in remote areas and over the ocean, orbital monitoring data is a viable alternative for addressing this issue [8].
Although measurements from long-flight spacecraft have a relatively low resolution, they remain relevant for analyzing and assessing long-term changes in atmospheric parameters, such as trends in atmospheric composition. One such long-running instrument is the Atmospheric Infra-Red Sounder (AIRS) spectrometer that was launched into near-Earth orbit aboard the AQUA satellite on 4 May 2002 [9]. AIRS is a hyperspectral instrument with 2378 infrared channels on board the satellite, and it has successfully provided daily measurements of atmospheric parameters (including meteorological data and the content of certain gases and water vapour in the atmosphere) for many years. It covers a wide swath (800 km on either side of the trajectory) and virtually the entire Earth, from −180° to +180° longitude and from −90° to +90° latitude [10]. AIRS records the absorption spectra of the Earth’s infrared radiation in the 3.75–15.4 μm spectral range and has a 1° × 1° data bin resolution for L3 (Level 3) [9]. This hyperspectral sounder was originally designed to retrieve atmospheric temperature and moisture data. However, the channels near the 7.66 μm absorption band can also be used to detect methane concentrations [11]. Data from various levels (L1, L2, and L3) and versions of AIRS satellite measurements are freely available at https://disc.gsfc.nasa.gov/ and https://airs.jpl.nasa.gov/data/products/products-overview (accessed on 8 September 2025). The latest version of AIRS L3 measurements is version 7 [12]. As [13] reports, the calculation algorithms of v6 and v7 are sufficiently similar.
Due to their long time series, good coverage and numerous validation studies the AIRS data are an effective tool for analyzing long-term changes in atmospheric parameters in different regions of the Earth [14,15]. Also, the AIRS data are widely used, e.g., for analysis of the transport of pollutants over long distances and emissions from forest fires and human sources [15,16,17], for studying global and regional features of atmospheric composition [14,15,18,19,20]. Different AIRS product versions were presented [11,21,22] and carefully compared with data of aircraft measurement companies HIPPO [23], NOAA GML [24], and ATom [25]. Study [26] discussed the comparison of AIRS v7 CH4 profiles with aircraft measurements in different geographical regions, as well as the decrease in errors when averaging AIRS data seasonally from 24 ppb for single AIRS measurements to 17 ppb (daily averaging for cell 1° × 1°), 10 ppb (monthly averages), and 7 ppb for seasonal averages. However, several recent studies noted that AIRS underestimates the magnitude of the methane trend compared to estimates based on ground-based spectroscopic data [14,20]. Other studies reported on phase shifts in seasonal cycles of surface methane concentrations and similar data obtained using AIRS [11]. Additionally, the dependence of v7 errors on geographic locations and the absence of significant differences between land and ocean was reported [11]. The aforementioned studies primarily focused on investigating discrepancies between satellite instrument measurements and ground-based or airborne measurements and examined the causes of these discrepancies and methods for correcting AIRS data over a limited time period. However, they did not address issues related to the possibility of long-term drift existence in the AIRS methane measurements.
Studying the long-term variability of the quality of orbital datasets is relevant for all satellite monitoring systems and particularly important for older-generation satellites launched more than 10 years ago. Satellites such as Aqua may be subject to degradation processes, i.e., data drift and a decline in representativeness. For example, a study [27] reported on such possibilities and provides a list of spectroscopic and energetic events that occurred with the AIRS spectrometer after its launch. We previously established a drift in the divergence of long-term measurement series for CH4 by AIRS and NDACC [28]. The MOPITT project group addressed the issue of detecting drift [29,30], which is a systematic discrepancy between satellite and ground-based measurements. Study [29] investigated the bias drift between different MOPITT data versions and NOAA flask measurements and reported multidirectional displacement drift in various latitudinal zones and at different altitudes. Unidirectional, though statistically insignificant, drift between MOPITT’s CO measurements and ground-based TCCON spectrometers was also found [30].
To assess the quality of satellite data, ground-based measurements are widely used as reference data. In particular, data from global measurement networks as the Network for the Detection of Atmospheric Composition Change (NDACC) (https://ndacc.larc.nasa.gov, accessed on 23 September 2025) [31] and the Total Carbon Column Observing Network (TCCON) (https://tccondata.org, accessed on 23 September 2025) [32] are used. Stations in both networks are located in various regions around the world and provide information on trace gases in the atmosphere, as well as useful meteorological parameters for validating satellite measurements and assessing long-term changes.
Although numerous validation studies have identified and analyzed the causes of errors in satellite algorithms and proposed improvements (see, e.g., [11,21,22,28,29,30]), long-term changes in the matching characteristics of orbital and ground-based data, as well as the causes of these changes, remain understudied. The lack of such information may lead to errors in trend and emission calculations. The evolution of the quality of atmospheric composition measurements, not only from AIRS but also from other satellite sounders (e.g., CriS [33]), has barely been addressed in the scientific literature (except for the studies cited above [29,30]). A noteworthy exception is the TROPOMI validation server [34], which allows users to calculate the residual characteristics of several atmospheric pollutant measurements using data on various gases from the NDACC and Pandora ground-based monitoring networks. For AIRS, specifically for v7, the problem of long-term drift in the quality of satellite measurements remains relevant.
This work examines long-term changes in the quality of methane content and concentration measurements, using AIRS v6 and v7 as examples. Advancing this field will improve the accuracy of trends and emission estimates obtained from satellite monitoring. This will provide significant benefits to the study of variations in atmospheric composition and parameters over multiple periods. Moreover, the approach and methodology developed for determining quality drift and subsequently correcting measurement data are intended to be universal. This methodology can be applied to any long-term satellite dataset, provided that reference ground-based datasets of comparable duration and statistical reliability are available. It can be used not only for methane and other atmospheric gases, but also for meteorological, climatic and radiation parameters.
2. Materials and Methods
2.1. Ground-Based Data and Their Pre-Processing
2.1.1. NDACC, CH4 Total Content (TC)
To validate the AIRS measurements, spectroscopic data from NDACC stations [31] were used as reference values for the CH4 total content of the air column. The NDACC network began its observations in 1991, and it has long-term data from many measurement sites around the world equipped with Fourier-transform infrared spectrometers (FTIR). The accuracy of a single CH4 measurement is about 1% [35]. The NDACC FTIRs provide total content (TC) data for several gases, including CH4, CO, O3, N2O, HCl, HF, ClONO2, HNO3, etc. TC is measured in molecules per cm2 and is calculated from the absorption of solar radiation passing through the atmosphere at different wavelengths in the mid-infrared region, depending on the measured trace gas.
Using the same absorption spectroscopy principle as NDACC, TCCON records direct absorption spectra of solar radiation in the near-infrared region and provides column-averaged mole fractions (volume-averaged concentrations, X[GAS]) of CO2, CH4, CO, N2O, HF, H2O and HDO [32]. These measurement data are freely accessible online and published no later than one year after the spectra are registered (http://www.tccon.org, accessed on 23 September 2025). Some stations (Eureka, Ny Alesund, Bremen, Zugspitze, Rikubetsu, Izana, Reunion, Wollongong and Lauder) are part of both networks and use the same Fourier spectrometer for measurements, albeit in different spectral ranges. However, the measurement series at TCCON sites is generally significantly shorter than at NDACC sites.
The longer duration of NDACC data determined our preference for this as the primary ground-based dataset for validation. Data from several TCCON sites with the longest measurement series were also used for additional verification purposes, as well as to demonstrate the versatility and effectiveness of the developed methodology. It should be noted that, at stations which are part of both networks, the measurement days under the NDACC and TCCON programs are often not the coincident.
NDACC data represent the total impurity content in the air column from the altitude of the instrument to its detection threshold, expressed in molecules/cm2. However, this requires the data to be adjusted to sea level in order to standardize the compared values. The geographic locations of NDACC sites used in the paper are illustrated on Figure 1. Table 1 presents a complete list of the measurement sites used in the analysis, their geographic locations and the available measurement periods. The selection of sites was primarily determined by the duration of the measurement series and their statistical reliability.
Figure 1.
The location of NDACC stations with the surface altitude above sea level (asl) with a resolution of 0.1° × 0.1°.
Table 1.
The location, altitude, and considered periods of observations of the NDACC network stations involved in the analysis. The bold font stands for the names (abbreviated names) that are used in other tables and/or in the text.
2.1.2. Conversion of NDACC Data to Sea Level
In [28], drift estimation is based on NDACC data converted to sea level using the classical barometric formula [36]. A similar conversion method is used by many research groups when comparing satellite and ground-based measurements, when it is necessary to combine the parameters provided for different altitudes of the comparison point, for example, ref. [37]. In this case, if the ground station is located at an altitude significantly higher than the lower level of satellite measurements, the method of filling in the missing values of the ground instrument is considered more preferable, i.e., interpolation of the profile of the ground instrument in order to combine the analyzed atmospheric layers [37]. We also used a method similar to the one recommended in [37]. The results are presented below and in the Supplementary Materials.
To achieve this, the altitude of the stations is used to determine the conversion coefficients K (see Table 2), which are then calculated using the barometric formula (see Supplementary Materials, Section S1, for more details).
Table 2.
Altitudes of measurement sites and comparison of data conversion factors to sea level, calculated based on the barometric formula and the average pressure measured at the sites throughout the study period. The stations for which the greatest changes were obtained when converted using their own measured pressure are marked in bold.
It should be noted that in our previous study [28], we encountered some difficulties when comparing satellite data with ground measurements from high-altitude stations. In our opinion, these difficulties could have been partly caused by inaccuracies in converting ground data to sea level using the classical barometric formula. Therefore, we decided to apply and test an alternative method of converting NDACC data to sea level. An alternative method for converting data to sea level could be to use the average pressure measured at the station for the period under study from 2003 to 2022, i.e., P used in the formula for calculating K becomes a measured value rather than a calculated value (see Section 3 and Section 3.1 ‘Results’ below). The calculated coefficients and the effectiveness of using the alternative method during validation will be described below in Table 2.
In anticipation of the results obtained using this alternative method and looking ahead, we note two important methodological points:
1. Our use of own mean measured pressure is a necessary measure; it would be more appropriate to use daily pressure data at each station. Unfortunately, the statistical reliability of the available atmospheric pressure series at many NDACC stations was low. Mean pressure data (like the classical barometric formula) do not account for seasonal and climatic variations in pressure, leading to inaccuracies in both methods.
2. However, as the results will show, adjusting the NDACC data to sea level using own mean measured pressure improved the agreement between the AIRS and NDACC measurements.
2.1.3. Selective Filtration of Ground-Based Data
The choice of filtering method is aimed at eliminating episodic unrealistic values from the analysis, ensuring methodological uniformity while preserving the maximum set of data for those measurement points where uneven data quality is observed. Filtering was applied to stations with unrealistic values, such as 1.94 × 10¹⁹ molecules/cm2 (e.g., Ny Alesund), as well as to stations with isolated outliers. This method involved removing 3 maximum and 3 minimum values (for a total of five stations out of eighteen). The filtering was performed independently of satellite values, i.e., only within the series of ground-based measurements. This had a different effect on the number of comparison pairs used to validate satellite measurements against ground-based ones, since not all of the ground-based measurements that were filtered had synchronous satellite measurements. Consequently, at certain stations, fewer than 6 comparison pairs were filtered out (e.g., 3–5). It should be noted that the statistical reliability of synchronized datasets changes very little. The number of comparison pairs before and after filtering, as well as the list of stations that passed the filtering, can be found in Table S1 in the Supplementary Materials. A complete list of the removed data for each station is presented in the Supplementary Materials, Table S2. As the Table S2 shows, the number of matching pairs after this filtering decreased slightly (by 0.4–1.4%) compared to the number of pairs without filtering. Thus, the amount of filtered data was significantly smaller than with the commonly used 95th percentile method.
We do not characterize the applied filtration method as universal. For other data sets, the filtering method should be chosen based on the principle of minimally sufficient intervention to perform data quality control and remove unrepresentative measurements (artifactual values).
2.1.4. Conversion of TC to X[GAS]
To ensure accurate data NDACC and AIRS v7 comparison, it is necessary to convert the total gas content (TC[GAS]) into the column-averaged relative volume concentration X[GAS]. Thus, after adjusting the NDACC data to sea level, the data were converted to the average concentration (ppm) as described in [38,39] as follows:
where
TC[GAS] is total content,
Pdryair—dry air pressure—calculated using the formula:
where:
m(H2O)—molecular weight of water (18.02 × 10⁻³/NA kg molecule−1);
m(dryair)—molecular weight of dry air (28.964 × 10⁻³/NA kg molecule−1);
NA—Avogadro’s number 6.022 140 76 × 1023 mole−1, (molecule/mole);
g—average gravity acceleration for the column—9.81 m/s2;
P—pressure at sea level, mbar.
A similar method of conversion from TC to X[GAS] was also applied to the average daily drift coefficient obtained by us based on AIRS v6 data (see Section 3.2 below).
2.1.5. TCCON, Concentration of CH4, ppmv
The stations of the TCCON measuring network provide data in ppmv (dry mole fractions, X[GAS])—the volumetric concentration (VMR) of a trace gas, averaged over the entire atmospheric column from the station’s altitude up to the instrument’s detection threshold [32]. The first TCCON measurements were made in 2004 at the Park Falls and Lauder stations. Other network stations joined the measurement programme much later, with the exception of Ny Alesund, where measurements began in 2005. Thus, as we previously reported, the duration (and often the uniformity) of the measurement series of this network’s stations was insufficient to address the primary objective of our study. Therefore, we only calculated the residual drift for eleven TCCON stations, seven from which are also part of the NDACC network (Eureka, Ny Alesund, Bremen, Rikubetsu, Izana, Wollongong and Lauder) and for five additional stations with relatively long and statistically supported measurement series. We then compared the calculated X[CH4] trends for these stations with the AIRS v7 trends, applying the correction coefficient obtained for the NDACC stations. For more information on the stations and the results, see the Supplementary Materials, Section S7.
We did not adjust the TCCON data to sea level, as it is difficult to determine the scale of the underestimation based solely on the average air concentration above the station. It should be noted that errors in adjusting to sea level may affect the compliance parameters for high-altitude measurement sites. However, this is not necessary for the purposes of this paper, as the TCCON data are used here for auxiliary purposes and the actual values of the average residual drift are not determined.
2.2. Satellite Data and Their Pre-Processing
2.2.1. AIRS v6 L3 CH4 TC
AIRS v6 Standard L3 IR Only Ascending CH4 data (i.e., daytime data from ascending orbit around 13:30 LT) represent the total methane content in the vertical atmospheric column (in molecules per cm2) and roughly coincide with ground-based measurements, to within a few hours. L3 data are initially presented at sea level in 1° × 1° cells. For more details on the levels and data structure, see [40,41].
For satellite measurements, the coordinates of the NDACC stations in Table 1 are the center of a 1° × 1° cell. This is achieved using the Tropomi Tools v8.01 software package [42], which can process various data formats and calculate statistical characteristics (e.g., retrieving the specified variable values for a selected averaging area based on specified coordinates using satellite data; filtering by additional variables; performing dynamic correction by introducing analytical formulas; evaluating trends and their confidence intervals including the use of correction; and visualising the obtained information in the form of distributions).
2.2.2. AIRS v7 L3, Concentration of CH4
AIRS v7, which is recommended by its developers for scientific research [12], is an improved version of v6. The air methane content of AIRS v7 is displayed as a relative volumetric concentration profile (expressed in ppbv/ppmv) on a fixed-pressure grid. These discrete level data values at 24 pressure levels, ranging from 1000 mbar (level 1) to 1 mbar (level 24), cannot be used for validation without additional manipulation. This information is collected when the spacecraft is in the ascending portion of its orbit (ascending only, i.e., daytime data, excluding data near the poles) [12]. As with earlier versions, AIRS v7 L3 data are initially presented for 1° × 1° cells. Similar to v6, the approximate time of measurements for each cell is around 13:30 local astronomical time.
Discrete values at 24 levels are converted into an average value for the entire column by taking into account the weight of each level according to the principle that the VMR (given in ppb) in the column is calculated as the average concentration value between the boundaries of adjacent levels, weighted by pressure.
where:
VMRi is value at level i;
∆pi = pi − p(i + 1)—pressure difference between adjacent levels in gPa.
The data are considered adjusted to sea level, as the methodology takes all 24 levels into account. If values are missing at the 1000 mbar and 925 mbar levels, they can be reconstructed. However, if more than two levels are missing from the daily value column table, the data are excluded from the calculations. This is directly related to the method of reconstructing values using regression analysis.
Comparing two boundary levels enables us to establish a linear regression equation of the form y = ax + b. Here,
a is the slope coefficient (SC);
b is the drift coefficient (free term) of the regression;
x is the value of level i;
y is the value of level i − 1.
The correlation between data in adjacent levels, as well as the slope coefficient, is close to 1. This confirms the validity of linear regression and allows us to use this method with a high degree of certainty to standardise calculations for restoring missing values.
The predicted value for the adjacent i − 2 level is calculated using the following linear regression equation:
where a and b are the established slope and drift coefficients, and y is the value of level i − 1.
The operation is repeated to compare levels 3 and 2 in order to restore level 1.
2.3. Statistical Methods
As in [28], orthogonal regression analysis is used to assess the compliance parameters between satellite and ground-based measurements, while linear regression is used to determine the time-dependent trend. Linear regression provides high accuracy when predicting a value that has an exact relationship with another variable (predicting y from a given x, for example, the dependence of data over a time period, i.e., daily measurements over a period). Orthogonal regression, on the other hand, is more suitable for describing the relationship between two values with comparable errors in both x and y (for example, when comparing satellite data with ground-based measurements). Both methods are often used by researchers when performing validation work, for example, when studying the correlation of orbital data with ground-based data (linear or orthogonal regression, refs. [30,43]) and when assessing trends in gas abundance (linear regression, refs. [15,30]).
3. Results
3.1. Adjusting Ground-Based Data to Sea Level
When applying the barometric formula to adjust the NDACC CH4 TC data to sea level, the authors in [28] faced the challenge of dividing the single dataset of CH4 TC data from all the stations included in the study (see Table 1) into multiple subsets with distinct correlation parameters and SCs. Further study was required to understand the nature of this division, since it was not explained by the geographic location or errors in determining the station elevations by the satellite. Errors occurred when the satellite underestimated the elevation of the measurement sites in complex landscapes and when the measurement sites were located high in the mountains or on small islands (e.g., the Izana station). In these cases, the satellite even assumed the elevation of the measurement cell to be at sea level. Having carefully studied both ground-based and orbital datasets, we found no obvious reasons for this division in the satellite data, so we focused our attention on the ground-based datasets and the methods used to adjust them to sea level. A more detailed description of the effect of individual stations on the overall correlation array is given in the Supplementary Materials, Section S4, Figure S1.
By comparing TCCON (averaged relative columnar concentration X[GAS] from the station’s location to the instrument’s sensitivity altitude) and NDACC (total concentration data converted to sea level using various methods), as well as AIRS v7 (data adjusted to sea level based on all 24 pressure levels), we could clearly evaluate the effectiveness of using the barometric formula and our own measured pressure to convert NDACC data to sea level. For ease of comparison, the values are then converted to the average columnar concentration using the method described in Section 2.1.3.
It was found that, when converted to sea level using the barometric formula, the NDACC values for some ground-based stations differ significantly from the TCCON and AIRS v7 estimates for high-altitude stations. For instance, at the Izana measurement site, which is located at an altitude of 2367 m above sea level, the NDACC values exceed those measured at this site by both AIRS and TCCON (see Figure 2a). To determine the cause of this discrepancy, the authors used an alternative method of converting the data to sea level: using the mean proper pressure measured directly at the NDACC sites (see Figure 2b). After applying this approach, using the mean pressure at the station over the entire comparison period, the NDACC series for Izana, converted to X[GAS], practically coincided with the AIRS v7 and TCCON series (see Figure 2b).
Figure 2.
X[CH4] for three comparison series: TCCON, AIRS v.7 and NDACC data, ppm. The NDACC data were converted to sea level using the barometric formula (a) and the mean pressure at the Izana station (b).
A more accurate method would be to make the calculation using the measured daily pressure. This method requires sufficient statistical coverage of pressure data. However, our analysis revealed that there is insufficient atmospheric pressure data at NDACC stations. For instance, some NDACC sites lack synchronous pressure measurements with spectroscopic observations. The Harestua site, for instance, has only 67 atmospheric pressure measurements for the entire study period from 2003 to 2022, which makes calculations using daily pressure impossible (see Table 3). We also note that the station-by-station pressure data presented in Table 3 applies to the entire 2003–2022 period. Additionally, we should mention that these data do not always correspond to the dates used in the validation.
Table 3.
Linear regression slope and ±95% confidence interval for the AIRS v7-GR X[CH4] difference, ppm/day, correlation coefficient, and number of comparison pairs for each NDACC monitoring network site from Table 1.
The statistical reliability and discrepancy of the conversion factors for converting to sea level using the barometric formula and its own average pressure were analyzed during the work (see Table 2).
The largest discrepancy in the conversion factors is observed not only for high-altitude stations, but also for a measurement site like Arrival Heights, located at 184 m above sea level. While the uncertainty in the barometric formula can easily be explained for high-altitude stations, for a low-altitude station such an estimation error may be due to local atmospheric circulation and meteorological conditions. Nevertheless, it is clear that such discrepancies must be accounted for. Figure 2 clearly demonstrates the overestimation of NDACC measurements that occurs when using the barometric formula, using a combination of NDACC, TCCON and AIRS v7 measurements.
For the analyzed 2003–2022 period, we identified the stations with the least available pressure data: Harestua (67 values) and Paramaribo (178 values). As the differences between the calculated and actual coefficients for these two stations are insignificant, further calculations were based on the average measured pressure for all stations. As shown in Table 2 and Figure 2b above, this method of adjustment yields slightly different results. As will be demonstrated below, it improves the agreement between satellite and ground-based measurements and enables more accurate assessment of the diurnal drift of AIRS v6 and v7 data.
Using the mean atmospheric pressure at each station to adjust the data to sea level also solved the problem of dividing the entire NDACC network dataset from Table 1 into subsets for comparison with AIRS v6 CH4 satellite data. This issue, as highlighted in [28], was specifically related to the fact that using the barometric formula to determine the sea level conversion factor was not always an accurate reflection of the actual situation (see Figure 3).
Figure 3.
Results of comparison of AIRS v6 (Standard L3 v.6 IR AIRS Only Daily) CH4 TC data with NDACC ground-based measurements for all stations from Table 1, at all available periods. NDACC data are converted to standard latitudes using: (a) the barometric formula; (b) the own mean measured pressure; (c) the own mean measured pressure after applying the SSD drift correction factor (1.64 × 10¹⁴ molecules/cm2/day). The vertical scale and its gradation in figures (a–c) are the same.
As can be seen in Figure 3, the slope coefficient of the orthogonal regression line (i.e., the dataset’s slope) is most strongly affected by data from three high-altitude stations: Jungfraujoch, Mauna Loa and Zugspitze. For a correlation diagram that excludes these stations, along with the corresponding discussion, see Supplementary Materials, Figure S2.
It should be noted here that we assessed the uncertainty associated with using mean measured pressure instead of daily mean pressure for the NDACC stations most provided with this data (see Section 4). Looking ahead, we report that, for stations with sufficient pressure measurement data, the application of both methods did not reveal significant differences in determining the AIRS-GR (AIRS data minus ground-based station data) difference drift, which was one of the main objectives of our research.
3.2. Determination of the Refined Drift Coefficient for AIRS v6 TC CH4 Satellite Measurements
The magnitude of the daily drift of the AIRS satellite spectrometer was identified based on AIRS v6 data and NDACC monitoring network data, which was adjusted to sea level, but using not the classic barometric formula, rather its own measured average pressure. The parameters of the linear trend of the AIRS-GR difference were then calculated for the statistically supported measurement sites pointed in Table 1. As with the barometric formula, the slope of the trend of the difference is negative and similar in magnitude for all measurement points (see Table S3 and Figure S3).
Thus, the refined dynamic SSD coefficient (i.e., taking into account daily correction and error growth) is 1.64 × 10¹⁴ molecules/cm2 per day (or 7.62 × 10⁻⁶ ppm/day), compared to the estimated value of 1.69 × 10¹⁴ molecules/cm2 per day in [28]. While the difference between these coefficients is only around 3%, the authors claim that using the station’s own average pressure when recalculating values to sea level, as well as removing artifacts and outliers, enables the coefficient to be refined for use in subsequent calculations.
Next, we applied the dynamic correction technique developed in [28], but used a refined drift coefficient (see also Supplementary Materials, Section S2). As before, applying this refined coefficient improves the compliance parameters for each station (Table S4) and for the overall dataset, increasing the correlation coefficient from R = 0.51 to R = 0.57 (see Figure 3c). Refining the drift coefficient using the average measured pressure improved the station-by-station agreement (see Table S4) and brought the trend estimates based on satellite and ground-based measurements closer together (see Table S5). The average CH4 TC trend using measured pressure after correction is 0.42% per year, compared to 0.43% per year when the drift coefficient is calculated using the barometric formula [28], and 0.40% per year based on ground-based measurements. The improved agreement between station trends is also maintained.
To confirm the feasibility of using a linear regression model to assess the agreement between ground-based and satellite measurements, a residual analysis was conducted for the dataset of all 18 ground stations compared to AIRS v6 (see Figure S4). In addition to the station-by-station estimates of CH4 TC trends based on AIRS v6 data (Table S5), the Supplementary Materials present the distributions of trends and confidence intervals for the Northern Hemisphere for the period 2003–2024, based on both the original v6 data and the corrected version (Figures S7 and S8).
3.3. Determination of the Drift Coefficient of AIRS v7 L3 CH4 Satellite Measurements
The AIRS-GR difference trend slopes at each station were calculated using AIRS v7 CH4 data and NDACC network data converted to ppm (see Table 3 and Figure S3). These results were similar to those of the AIRS v6 CH4 TC product. All stations showed a unidirectional AIRS-GR difference trend, with a negative slope that was similar for all stations. This was also determined to be a persistent unidirectional drift of the satellite instrument match parameters. The average drift correction coefficient obtained was 7.20 × 10⁻⁶ ppm/day. Statistically poorly supported stations (namely Rikubetsu and Paramaribo) were excluded from the calculation of the average coefficient.
The SSD coefficient, which was previously estimated based on v6 data and found to be equal to 7.62 × 10⁻⁶ ppm/day (with a total of 16,128 comparison pairs), is slightly higher than the drift coefficient, which was estimated based on AIRS v7 data and found to be equal to 7.20 × 10⁻⁶ ppm/day (with a total of 15,677 comparison pairs). This difference of approximately 5% may be due to natural errors arising from the difference in the number of comparison pairs for the two products, and consequently from the conversion of one unit to another (CH4 TC NDACC molecules/cm2 to X[GAS], ppm). Therefore, the SSD estimates obtained for v6 and v7 are fairly consistent.
3.4. Application of the Correction Factor to the CH4 AIRS v7 Concentration Product, Ppm
The drift coefficient, calculated daily for a satellite data series, characterizes the daily increase in measurement error. When applied, the correction for each subsequent point increases based on daily underestimation of values. Figure 4 clearly illustrates the application of the drift coefficient.
Figure 4.
Series of NDACC ground-based measurements and X[CH4] AIRS v7 satellite measurements for the Jungfraujoch station, ppm: (a) initial, (b) after correction (SSD = 7.20 × 10⁻⁶ ppm/day). NDACC data converted to X[GAS].
After applying the drift coefficient, the AIRS v7 values lie slightly higher on the graphs than the ground-based measurement series for most stations (except Toronto, where the average difference is 0.003, i.e., near zero, due to the overlap of satellite and ground-based measurements). Table 4 provides an estimate of this value, and the average difference between satellite and ground-based measurements (AIRS-GR) is −0.03 ppm, i.e., approximately 2% of the average concentration values of both ground-based and satellite measurement series. This discrepancy is natural, given the possible uncertainty in converting NDACC ground-based measurements from TC to X[GAS], as well as the error in reconstructing the average column concentration from 24 discrete levels. It is insignificant and does not require additional correction.
Table 4.
Average difference between satellite AIRS v7 and ground-based NDACC X[CH4] measurements (AIRS-GR) after correction for the drift coefficient SSD = 7.20 × 10⁻⁶ ppm/day.
Subsequently, the corrected satellite measurement series were analysed in comparison with the NDACC ground-based measurements. Although the station-by-station comparison parameters between AIRS v7 and NDACC are somewhat lower than those for AIRS v6, they improve after applying the drift correction technique (see Table S3). The correlation coefficient R increased for all stations. For measurement points such as Eureka (R = 0.38) and Arrival Heights (R = 0.32), where the initial correlation between the ground-based and satellite measurement series is virtually absent, the correlation becomes significant, amounting to 0.49 and 0.46, respectively. The low correlation coefficient at high-latitude stations can be explained by the AIRS satellite instrument’s measurement uncertainties in circumpolar regions [12], as well as the seasonality of the ground-based data (March–September).
However, when satellite data was compared with ground-based data, it was found that the correlation in the overall dataset was slightly higher for version v7 than for the similar version v6. Without correction, the correlation coefficient R is 0.66 (versus 0.51 for v6; see Figure 5a and Figure 2b). The shift coefficient (the value of the intercept of the orthogonal regression equation) is also somewhat better than for v6. After correction using the drift coefficient, SSD (v7) = 7.20 × 10⁻⁶ ppm/day, the correlation between the two data series is 0.73 (Figure 5b). The first term of the overall data set’s orthogonal regression significantly approaches 1, amounting to 0.94 ppm, while the data set’s shift (free term) decreases from 0.51 ppm to 0.15 ppm.
Figure 5.
Results of comparing X[CH4] data from AIRS v7 (Standard L3 v7 IR AIRS Only Daily) with NDACC ground-based measurements for all stations in Table 1, all available periods, ppm. NDACC data are adjusted to sea level using their own average measured pressure. (a) before correction (b) after correction for SSD drift coefficient (7.20 × 10⁻⁶ ppm/day). The scales of Y-axis and their gradation in (a,b) are the same.
The results of trend estimation based on both the original series and the adjusted AIRS v7 data are presented in Table 5. For version 7, the correction technique also positively affects the consistency of trend estimation. Initially, the satellite underestimated the values (the average trend was 0.27 ± 0.02% per year versus the ground-based system estimate of 0.41 ± 0.03% per year), but after correction with the drift coefficient SSD v7 = 7.20 × 10⁻⁶ ppm/day, the average trend equaled to 0.41 ± 0.03% per year. This is also in good agreement with the results obtained by correcting version 6 of the AIRS total CH4 content product. When comparing trend estimates for NDACC ground-based data in molecules/cm2 with AIRS v6 (Table S5) and converted NDACC data in ppm with AIRS v7 (Table 5), slight discrepancies are evident in both the station-by-station and the overall methane trends based on ground-based measurements (‘Initial Trend, GR’ column in Table 5 and Table S5). This is neither a calculation error nor a bias. The reason for this lies in the differences in the number and dates of the comparison pairs for the various products, which results in discrepancies in the figures. It is important to note that only paired satellite–ground data were used in the calculations and that the number of initial ground-based sample values for different products does not match.
Table 5.
X[CH4] trends ± 95% confidence interval for all stations NDACC(GR) from Table 1 for the period from 2003 to 2022 for the original AIRS v7 data series and with satellite drift correction (SSDv7 = 7.20 × 10⁻⁶ ppm/day).
Similarly to the v6 case, residual analyses were performed on the datasets from all ground stations, comparing them with AIRS v7 before and after the correction (see Figure S5). In addition to the station-by-station estimates of X[CH4] trends based on AIRS v7 data (Table 5), the Supplementary Materials present the distributions of trends and confidence intervals for the Northern Hemisphere for the period 2003–2024, based on both the original v7 and the corrected data (Figures S9 and S10).
4. Discussion
4.1. Possible Causes of the Obtained Drift
The main objectives of this study were to investigate the long-term evolution of methane measurement quality by the AIRS satellite instrument, to validate the latest AIRS v7 product and to identify why the total correlation array of all the stations studied in Table 1 differs from that in version v6 [28]. However, the presented study does not aim to analyze the spectroscopic and climatic causes of discrepancies between AIRS and ground-based Fourier-transform spectrometer measurements in detail, as these issues have already been the subject of numerous studies, but rather to complement previous validation works.
The unidirectional negative drift of the AIRS v7-GR difference was expected in principle, and the close proximity of its value (SSD v7 = 7.20 × 10⁻⁶ ppm/day) to that of v6 (SSD v6 = 7.62 × 10⁻⁶ ppm/day) confirmed the accuracy of our approach and conclusion regarding the drift of the satellite instrument readings. We confirmed that the unidirectional negative drift of the AIRS-GR difference is a feature of both AIRS v6 and v7 products, and the slight discrepancy in the estimates can be attributed to inaccuracies in converting the total content to X[GAS] and vice versa. The possible reasons for this drift were preliminarily discussed in [28]: this could be either the degradation (i.e., a change in the parameters) of the instrument itself within the spectral range in which methane is measured (i.e., around 8 μm), or an underestimation of ongoing changes in water vapour content. The intense absorption lines of water vapour are superimposed on the methane absorption lines in AIRS measurements [14], whereas ground-based NDACC spectrometers measure methane in the 3.5 μm range [44], which is relatively free of H2O absorption lines.
According to AIRS product developers [45], the presence of a water vapour absorption band near the 7–8 µm region affects the accuracy of total content and X[CH4] measurements. The close proximity of spectral intervals when measuring both impurities can lead to simultaneous long-term degradation of the instrumentation for the corresponding spectral channels. Another possible cause of the deterioration in methane measurement quality is insufficient consideration of the water vapour effect. To determine the precise cause of the observed drift, it would be useful to investigate the dependence of the AIRS methane data quality on water vapour content, or to examine the AIRS H2O series for drift in the difference with high-precision ground-based atmospheric measurements. Unfortunately, NDACC spectrometers do not provide H2O data, and the duration of TCCON measurements are significantly shorter in duration.
In any case, the proposed study is beyond the scope of this article and will be a logical continuation of our work (for more details on future research directions, see Section 4.3). It should also be noted that it is not only individual AIRS products that require quality drift research, as we have obtained preliminary results on the unidirectional, emerging, or as yet statistically insignificant drift of the measurement series of other operating orbital systems for monitoring the atmospheric composition.
Also, applying a selective correction to satellite datasets for several TCCON stations based on the calculated SSD drift coefficient, following a comparison of v6 and v7 with the NDACC datasets, significantly improved compliance parameters and station-by-station trend estimates. Furthermore, the mean discrepancy between the X[CH4] value measured by TCCON and the corresponding NDACC parameter across five stations was found to be 1.25% when the barometric formula was employed, and 0.68% when the average measured pressure was used (see Table S7).
Therefore, another reason for the increasing discrepancy between AIRS data and ground-based spectrometer measurements may be the drift of the satellite spectrometer’s parameters. The accuracy of AIRS trace gas profile retrieval is known to be highly dependent on the accuracy of humidity and temperature profile measurements, as well as on the accuracy of surface brightness parameter determination [27]. The cited paper claims good orbital stability for the Aura satellite carrying AIRS, meaning there are no concerns regarding surface energy drift. Ref. [27] assesses the stability of AIRS in temperature profile measurements as high. Nevertheless, they acknowledge that drift may occur in gas content measurements due to insufficient consideration of the effect of rising CO2 on the accuracy of humidity and temperature profile measurements. Consequently, there is a possibility of drift in CH4 retrieval.
Thus, despite the stability of AIRS energy parameters in one of the channel groups reported in [27,46], this is not sufficient to guarantee stability in other channels. Insufficient ability to fully adjust the instrumentation may well lead to changes in the instrument’s parameters. For example, ref. [27] provides a list of energetic and spectroscopic events that occurred with AIRS between 2003 and 2016. When preparing our work, we considered all of these events and their dates. However, when calculating the station-by-station correspondence characteristics and the overall residual drift, we tested different time periods, including before and after 2010–2012, and obtained similar estimates for all time periods tested. For instance, we obtained AIRS v6 satellite drift values for overall dataset equal to 1.82 × 10¹⁴ ± 1.62 × 10¹⁴ for 2003–2009 and 2.23 × 10¹⁴ ± 4.16 × 10¹³ molecules/cm2/day for 2010–2022. As seen here, the presented values intersect within the confidence intervals. The verification period was chosen according to data [27] on energetic and spectroscopic events, one of which occurred in January 2010.
4.2. Method Limitations
The proposed method has some limitations that should be taken into account. The first limitation is associated with the usage of average pressure data at stations instead of daily pressure data. As previously reported, this measure was necessary due to the lack of representative measurement series with daily average pressure at a number of stations. However, even this approximation in adjusting NDACC data to sea level improved the agreement between ground-based and satellite CH4 data at most stations compared to using the classical barometric formula. We note here that this conversion method, as well as the barometric formula, does not account for seasonal and climatic variations in pressure. Therefore, here we present calculations of the AIRS–GR drift, performed using both average and daily pressure (see Table 6). The AIRS–GR difference trend was calculated for the 12 most statistically well-covered NDACC sites using two methods to adjust surface data to sea level (see Table 6). The first method relied on daily measured atmospheric pressure data at the station. Synchronous daily pressure and methane TC measurements were used. The second method used surface pressure values averaged over the entire study period. Therefore, we perform a sensitivity analysis for these two different approaches.
Table 6.
Linear regression slope and ±95% confidence interval for AIRS v6 and GR TC CH4 difference [molecules/cm2/day], and number of comparison pairs for each NDACC monitoring network site. The time period for the comparison is 2003–2022.
The comparative Table 6 presents the drift values only for stations with sufficient statistical coverage of pressure data. The results show that the difference trend magnitude differs only slightly when using different methods at most sites. The effect of using daily pressure was multidirectional, ranging from a 25% increase in the slope of the AIRS–GR difference trend line (Ny Alesund) to a 23% decrease (Jungfraujoch). It should be noted that in both cases, the average slope coefficients calculated based on 12 stations are identical (−1.709 (×10)14 molecules/cm2/day when using daily pressure data, and −1.705 (×10)14 molecules/cm2/day when using station-by-station pressure averaged over the entire study period). It is also important to note that these differences do not affect the overall conclusions regarding the sign and magnitude of the drift.
Therefore, in the absence of daily data, the use of long-term average surface pressure values is a reasonable approximation that does not significantly affect the main results (i.e., the magnitude of the average drift). However, if daily pressure data are available, the authors believe it is more appropriate to use these data to adjust the values to sea level, even for stations at low altitudes, as indicated in Section 2.1.2 of the manuscript. This opinion is supported by specific differences in the drift coefficient calculated for the same sites using two different methods.
The second limitation is related to the use of the minimum necessary filtering. In our study, we limited ourselves to removing three minimum and three maximum values at five ground stations. Although this filtering method automatically eliminated several unrealistic CH4 values at 5 of the 18 NDACC stations, it cannot be recommended as a universal approach. For other cases and data series, different methods may be more appropriate, keeping in mind the principle of minimum interference.
We also note that the quantitative reduction in series resulting from the filtering was insignificant (see Supplementary Table S1). Although the correlation improved at four out of five stations, the AIRS–GR drift coefficient (SSD) changed significantly at two stations (Ny Alesund and Bremen), where a few unrealistic values were excluded. At one station (Mauna Loa), the change in SSD value was insignificant (within 1.4%), and there were no changes in SSD value at one station (Harestua).
Another limitation is related to the linearity of our approach to estimating AIRS–GR drift and trends. Naturally, drift at individual stations is not strictly linear, as it is in certain time intervals. Furthermore, this approach does not account for seasonal variations in the AIRS–GR difference, which manifest differently at individual stations and are likely related to geographical features, as well as possibly insufficient consideration of water vapour content and its variability.
Despite the aforementioned limitations, we believe that our results are robust enough to be considered in further validation studies of AIRS methane measurements, as well as in studies of atmospheric methane trends.
4.3. Future Study Directions
To overcome the limitations of the proposed methods several studies can be conducted. For example, it would be interesting and important to compare the fit characteristics of satellite and ground-based data obtained using different pressure datasets. We are planning further research in this area; however, the lack of complete pressure datasets at NDACC stations currently limits this progress.
The next issue to address is the influence of water vapour content and concentration profiles, specifically the impact of its long-term and seasonal variations, on the parameters of the match between satellite and ground-based CH4 data. As previously reported, the spectral range in which AIRS measures methane (~7.66 μm) is overlapped by a strong absorption band of H2O. That is, failing to consider the seasonal variability and trends of water vapour can lead to uncertainties in methane retrieval. Accounting for this dependence (as well as the geographical dependence of the matching characteristics) is a very complex and multifaceted task, and we are only at the beginning of its solution. Additional calculations revealed positive trends in H2O content at 16 out of 18 NDACC stations studied (see Table S8). However, this trend was statistically significant at only six out of eighteen stations. Thus, it would be desirable to continue this line of research involving TCCON sites and assessing the impact of seasonal variations, but that would go beyond the scope of this work. Further studies are complicated by the different durations and uniformity of ground-based measurements by NDACC and TCCON. This makes rapid analysis difficult and hinders the interpretation and generalization of results. One simple example of these difficulties is the Ny Alesund station, which is part of both networks. The number of measurements taken during the same period varies significantly. For this station, the number of synchronous pairs of NDACC, TCCON, and AIRS v7 in the available synchronous period (2005–2021) is only 323, compared to 1008 for Ny Alesund (synchronized AIRS and TCCON series) and 412 for Ny Alesund (AIRS and NDACC) (see Table S8).
Further development of the proposed method involves clarifying the issue of AIRS drift in H2O content measurements (recall that the spectral range used in methane measurements overlaps with intense water vapour absorption lines), as well as identifying and taking into account the influence of seasonal discrepancies (and discrepancies on various pressure levels) between CH4 AIRS measurements and data from ground-based spectrometers NDACC and TCCON.
It should also be noted that similar studies have recently been carried out not only by our group. For example, the creators of the validation server for the relatively recently launched (end of 2017) orbital instrument TROPOMI followed a similar path [34], including in the validated parameters an estimate of the drift of the difference in measurements of TROPOMI and ground-based spectrometers for the main measured components, including CH4 [https://mpc-vdaf-server.tropomi.eu/ch4, accessed on 22 January 2026].
5. Conclusions
The following main results have been obtained:
1. Based on the results of the validation of the last two L3 versions (6 and 7) of methane measurements from the Atmospheric InfraRed Sounder (AIRS) at 18 ground-based stations of the NDACC monitoring network, for the 2003–2022 period, unidirectional and statistically significant drift in the difference between satellite instrument readings and ground-based data was identified for all sites involved in the comparison.
2. During the validation process, artifact values and random outliers in the NDACC ground data were filtered out, since they significantly impact the slope differences between the datasets and result in calculation errors.
3. Using the classic barometric formula introduces uncertainties into the conversion factor, particularly for measurement sites at high elevations, resulting in additional validation errors. When adjusting ground-based measurement data to sea level, it is preferable to use the atmospheric pressure measured at the station itself.
4. The issue of dividing the total station dataset into subsets for comparing satellite AIRS v6 and ground-based NDACC CH4 TC measurements has been resolved. Using the station-specific average pressure improves the comparison parameters for the total station dataset, with R = 0.51 when the data are subsetted and adjusted to sea level using the barometric formula and R = 0.57 when the station-specific average pressure is used.
5. The adjusted drift coefficient of the CH4 TC product AIRS v6 was calculated to be 1.64 × 10¹⁴ molecules/cm2 per day (or 7.62 × 10⁻⁶ ppm/day), and a correction technique was applied to the satellite measurement values. This resulted in improved consistency between satellite (AIRS v6) and ground-based (NDACC) measurements, as well as a convergence of trend estimates. The initial AIRS estimates were 0.27 ± 0.03 (% per year, 95% confidence interval). Following correction, the estimate was 0.42 ± 0.03, compared to ground-based estimates of 0.40 ± 0.03.
6. The drift coefficient of the X[CH4] product for the latest AIRS v7 version was calculated to be 7.20 × 10⁻⁶ ppm/day (1.55 × 10¹⁴ molecules/cm2/day), which is consistent with similar estimates for AIRS v6. A correction technique was applied to the AIRS v7 measurement series, significantly improving the agreement between satellite (AIRS v7) and ground-based (NDACC) measurements, as well as convergence of trend estimates (both station-by-station and averaged). The average annual methane content trend based on ground-based estimates was 0.41 ± 0.03% per year, whereas the synchronous AIRS v7 series after the correction yielded an estimate of 0.41 ± 0.02% per year, compared to the original uncorrected estimate of 0.27 ± 0.02% per year.
7. The application of the calculated SSD drift coefficient, following a comparison of AIRS v6 and v7 with the NDACC datasets, significantly improved the compliance parameters and station-by-station trend estimates obtained from satellite data and an independent set of ground-based observations (11 TCCON sites).
8. Despite the similarity of the satellite drift correction factors for AIRS v6 (7.62 × 10⁻⁶ ppm/day) and v7 (7.20 × 10⁻⁶ ppm/day), we cannot confidently state its universality for various AIRS methane products. The difference of approximately 5% may be due to errors when converting values from TC to X[GAS], or when reconstructing discrete values into the average air column concentration. Nevertheless, this small discrepancy confirms the presence of drift in the absorption band of the AIRS satellite spectrometer used to determine the methane products.
The method developed for correcting long-term satellite data series can be applied to other satellite observations, such as those relating to atmospheric composition, underlying surface parameters, climatic and meteorological parameters, and radiation characteristics, provided that the necessary high-precision ground-based measurement series and datasets are available.
Supplementary Materials
The following supporting information can be downloaded at: https://www.mdpi.com/article/10.3390/rs18081162/s1, S1: Conversion of NDACC data to sea level with use the barometrical formula; S2: Method of dynamic correction; S3: Application of selective filtering; S4: The impact of high-altitude stations on the correlation of the total AIRS v6 array; S5: Characteristics of the correspondence between satellite (AIRS v6) and ground-based (NDACC) data using different methods of converting ground-based data to sea level; S6: Station-to-station drift of SAT-GR difference for AIRS v6 and v7; S7: Application of corrections to AIRS v6 and v7 measurement series when comparing with TCCON trend estimates; S8: The compliance parameters of individual TCCON and NDACC sites; S9: Water vapour trends; S10: Distribution of methane trends according to AIRS v6 and v7 data before and after correction; Table S1: Changes in the compliance parameters of satellite and ground-based measurements (AIRS v6/NDACC) at several stations following the application of a filtering process based on the removal of 3 minimum and 3 maximum values; Table S2: Filtered NDACC stations. Dates and removed maximum and minimum values, TC CH4, molecules/cm2; Table S3: Linear regression slope coefficient ±95% confidence interval for the difference between AIRS v6 and GR TC CH4 [molecules/cm2/day], and number of comparison pairs for each monitoring site (see Table 1); Table S4: Correlation coefficient (R) values and orthogonal regression equations for NDACC sites for the original series and after AIRS v6 satellite data correction for the drift coefficient (SSD v6 = 1.64 × 10¹⁴ molecules/cm2, retrieved with use the average pressure measured at the site); Table S5: CH4 TC trends ± 95% confidence interval for NDACC sites, for the period from 2003 to 2022 for the original AIRS v6—GR NDACC data series and with satellite drift correction (SSD v6 = 1.64 × 10¹⁴ molecules/cm2, retrieved with use the average pressure measured at the site); Table S6: Location, altitude, and considered periods of observation for TCCON stations involved in the analysis; Table S7: Trends for CH4 AIRS v6 and v7 (trend ± 95% confidence interval) and GR TCCON for various periods: initial values and with SSD satellite drift correction. The values SSDv6 = 7.62 × 10⁻⁶ ppm/day and SSDv7 = 7.20 × 10⁻⁶ ppm/day are calculated based on comparison with NDACC stations. Station Lauder (highlighted in bold) has a short observation period and is therefore not included in the calculation of average trends; Table S8: Average relative difference Δ = (NDACC-TCCON)/NDACCavg. of measured values X[CH4] and correlation coefficient R for stations included in both networks—using the barometric formula (BF) and mean measured pressure (MMP) to adjust NDACC data to sea level; Table S9: H2O total content trends and their ±95% confidence intervals according to the AIRS v7 L3 data for each NDACC monitoring network site from Table 1. The time period is 2003–2022 and includes the complete satellite series (approximately 320–350 measurements per year for each site). The six sites in the table whose trend magnitude was statistically significant are highlighted in bold; Figure S1: Correlation dataset after correction using own pressure (comparison of AIRS v6 TC CH4 data with NDACC ground measurements), excluding Jungfraujoch, Mauna Loa, Zugspitze and Lauder, for stations from Table 1; Figure S2: Trend of the AIRS v6-GR difference (drift of discrepancy) between satellite and ground-based measurements of CH4 TC for 2003–2022 (all available periods, molecules/cm2) at all studied monitoring sites, p. (a) Eureka; (b) Ny Alesund; (c) Thule; (d) Kiruna; (e) Harestua; (f) SPB; (g) Bremen; (h) Zugspitze; (i) Jungfraujoch; (j) Toronto; (k) Rikubetsu; (l) Izana; (m) Mauna Loa; (n) Paramaribo; (o) Reunion Maido; (p) Wollongong; (q) Lauder; (r) Arrival Heights.; Figure S3: Trend of the AIRS v7-GR difference (drift of discrepancy) between satellite and ground-based measurements of CH4 for 2003–2022 (all available periods, ppm) at all studied monitoring sites, p. (a) Eureka; (b) Ny Alesund; (c) Thule; (d) Kiruna; (e) Harestua; (f) SPB; (g) Bremen; (h) Zugspitze; (i) Jungfraujoch; (j) Toronto; (k) Rikubetsu; (l) Izana; (m) Mauna Loa; (n) Paramaribo; (o) Reunion Maido; (p) Wollongong; (q) Lauder; (r) Arrival Heights; Figure S4: Analysis of the residuals of AIRS v6 CH4 satellite measurements for the dataset of all 18 measurement points, ppm: (a)—original AIRS v6 data, all of stations; (b)—original AIRS v6 data without Jungfraujoch, Mauna Loa, Zugspitze and Lauder; Figure S5: Analysis of the residuals of AIRS v7 CH4 satellite measurements for the dataset of all 18 measurement points, ppm: (a)—original AIRS v7 data; (b)—AIRS v7 data after correction; Figure S6: The location of TCCON station with the surface altitude above sea level (asl) with a resolution of 0.1° × 0.1°.; Figure S7: CH4 TC trend distribution (a) and it 95% confidence interval (b) for NH, 2003–2024, without correction (original AIRS v6 satellite data-sets). Grey areas indicate the surface altitude more than 925 mbar.; Figure S8: CH4 TC trend distribution (a) and it 95% confidence interval (b) for NH, 2003–2024, after correction (corrected AIRS v6 satellite data-sets). Grey areas indicate the surface altitude was more than 925 mbar.; Figure S9: X[CH4] trend distribution (retrieved for 925–1.5 mbar layer) (a) and it 95% confidence interval (b) for NH, 2003–2024, without correction (original AIRS v7 satellite data-sets). Grey areas indicate the surface altitude was more than 925 mbar.; Figure S10: X[CH4] trend distribution (retrieved for the 925–1.5 mbar layer) (a) and it 95% confidence interval (b) for NH, 2003–2024, after correction (corrected AIRS v7 satellite data-sets). Grey areas indicate the surface altitude was more than 925 mbar.
Author Contributions
Conceptualization, V.R., E.F. and A.S.; methodology, V.R.; software, E.F.; validation, E.F. and N.K.; formal analysis, E.F., V.R. and N.K.; investigation, V.R. and E.F.; resources, N.K.; data curation, E.F.; writing—original draft preparation, E.F., V.R. and A.S.; writing—review and editing, V.R., A.C. and A.S.; visualization, V.R., E.F. and N.K.; supervision, A.S. and A.C.; project administration, A.C.; funding acquisition, A.C. All authors have read and agreed to the published version of the manuscript.
Funding
The study was funded by the Russian Science Foundation, project No. 25-77-31009.
Data Availability Statement
Data underlying the results presented in this paper are available on request from the authors. Publicly available datasets were analyzed in this study.
Acknowledgments
The authors are grateful to all principal investigators (PIs) and supporting staff of NDACC and TCCONs and of AIRS team for deploying, maintaining and making available data from numerous observation sites and the AIRS long-term orbital mission used in the paper, as well as to all the funding agencies which have contributed to these programmes over the years.
Conflicts of Interest
The authors declare no conflicts of interest.
Abbreviations
The following abbreviations are used in this manuscript:
| AIRS v6/v7 | Atmospheric InfraRed Sounder version 6/7 |
| L3 | Level 3 (3rd data level) |
| NDACC | Network for the Detection of Atmospheric Composition Change |
| TCCON | Total Carbon Column Observing Network |
| SSD | Satellite Spectrometer Drift |
| SAT-GR/AIRS-GR | Satellite data minus Ground-based data (the difference between Satellite and Ground-based data) |
| Ppm/Ppb | Parts per million/billion |
| NASA | National Aeronautics and Space Administration |
| TC | Total Column |
| FTIR | Fourier-Transform InfraRed spectrometer |
| X[GAS] | Thickness-averaged relative volume concentration of the detected gas in ppm/ppb |
| VMR | Volume Mixing Ratio |
| SC | Slope Coefficient |
| asl | Above See Level |
| BF | Barometric Formula |
| AP | Average Pressure |
| ND | No Data |
References
- Myhre, G.; Shindell, D.; Bréon, F.-M.; Collins, W.; Fuglestvedt, J.; Huang, J.; Koch, D.; Lamarque, J.-F.; Lee, D.; Mendoza, B.; et al. Anthropogenic and natural radiative forcing. In Climate Change 2013: The Physical Science Basis; Contribution of Working Group I to the Fifth Assessment Report of the Intergovernmental Panel on Climate Change; Stocker, T.F., Ed.; Cambridge University Press: Cambridge, UK; New York, NY, USA, 2013; pp. 659–740. [Google Scholar] [CrossRef] [Scilit]
- Sonnemann, G.R.; Grygalashvyly, M. Global annual methane emission rate derived from its current atmospheric mixing ratio and estimated lifetime. Ann. Geophys. 2014, 32, 277–283. [Google Scholar] [CrossRef] [Scilit]
- Etminan, M.; Myhre, G.; Highwood, E.J.; Shine, K.P. Radiative forcing of carbon dioxide, methane, and nitrous oxide: A significant revision of the methane radiative forcing. Geophys. Res. Lett. 2016, 43, 12614–12623. [Google Scholar] [CrossRef] [Scilit]
- Saunois, M.; Stavert, A.R.; Poulter, B.; Bousquet, P.; Canadell, J.G.; Jackson, R.B.; Raymond, P.A.; Dlugokencky, E.J.; Houweling, S.; Patra, P.K.; et al. The Global Methane Budget 2000–2017. Earth Syst. Sci. Data 2020, 12, 1561–1623. [Google Scholar] [CrossRef] [Scilit]
- Saunois, M.; Martinez, A.; Poulter, B.; Zhang, Z.; Raymond, P.A.; Regnier, P.; Canadell, J.G.; Jackson, R.B.; Patra, P.K.; Bousquet, P.; et al. Global Methane Budget 2000–2020. Earth Syst. Sci. Data 2025, 17, 1873–1958. [Google Scholar] [CrossRef] [Scilit]
- Michel, S.E.; Lan, X.; Miller, J.; Tans, P.; Clark, J.R.; Schaefer, H.; Sperlich, P.; Brailsford, G.; Morimoto, S.; Moossen, H.; et al. Rapid shift in methane carbon isotopes suggests microbial emissions drove record high atmospheric methane growth in 2020–2022. Proc. Natl. Acad. Sci. USA 2024, 121, e2411212121. [Google Scholar] [CrossRef] [Scilit] [PubMed]
- Skeie, R.B.; Hodnebrog, Ø.; Myhre, G. Trends in atmospheric methane concentrations since 1990 were driven and modified by anthropogenic emissions. Commun. Earth Environ. 2023, 4, 317. [Google Scholar] [CrossRef] [Scilit]
- Jacob, D.J.; Varon, D.J.; Cusworth, D.H.; Dennison, P.E.; Frankenberg, C.; Gautam, R.; Guanter, L.; Kelley, J.; McKeever, J.; Ott, L.E.; et al. Quantifying methane emissions from the global scale down to point sources using satellite observations of atmospheric methane. Atmos. Chem. Phys. 2022, 22, 9617–9646. [Google Scholar] [CrossRef] [Scilit]
- Aumann, H.H.; Chahine, M.T.; Gautier, C.; Goldberg, M.; Kalnay, E.; McMillin, L.; Revercomb, H.; Rosenkranz, P.W.; Smith, W.L.; Staelin, D.; et al. AIRS/AMSU/HSB on the Aqua mission: Design, science objectives, data products and processing systems. IEEE Trans. Geosci. Remote Sens. 2003, 41, 253–264. [Google Scholar] [CrossRef] [Scilit]
- Thrastarson, H.T.; Fetzer, E.J.; Ray, S. Overview of the AIRS Mission: Instruments, Processing Algorithms, Products, and Documentation, 2nd Edition, The AIRS-team and the CLIMCAPS Algorithms, Jet Propulsion Laboratory, California Institute of Technology, Thomas Hearty, NASA/GES DISC, Nadia Smith, Science and Technology Corporation, 6 May 2021, Document Edition 2.0. Available online: https://docserver.gesdisc.eosdis.nasa.gov/public/project/AIRS/Overview_of_the_AIRS_Mission.pdf (accessed on 8 September 2025).
- Zhou, L.; Warner, J.; Nalli, N.R.; Wei, Z.; Oh, Y.; Bruhwiler, L.; Liu, X.; Divakarla, M.; Pryor, K.; Kalluri, S.; et al. Spatiotemporal Variability of Global Atmospheric Methane Observed from Two Decades of Satellite Hyperspectral Infrared Sounders. Remote Sens. 2023, 15, 2992. [Google Scholar] [CrossRef] [Scilit]
- Tian, B.; Manning, E.; Roman, J.; Thrastarson, H.; Fetzer, E.; Monarrez, R. AIRS Version 7 Level 3 Product User Guide. Jet Propulsion Laboratory, California Institute of Technology, July 2020. Available online: https://docserver.gesdisc.eosdis.nasa.gov/public/project/AIRS/V7_L3_Product_User_Guide.pdf (accessed on 9 September 2025).
- Thrastarson, H.T. (Ed.) AIRS/AMSU/HSB Version 7 Level 2 Product User Guide. 2021. Available online: https://docserver.gesdisc.eosdis.nasa.gov/public/project/AIRS/V7_L2_Product_User_Guide.pdf (accessed on 22 January 2026).
- Zou, M.; Xiong, X.; Wu, Z.; Li, S.; Zhang, Y.; Chen, L. Increase of Atmospheric Methane Observed from Space-Borne and Ground-Based Measurements. Remote Sens. 2019, 11, 964. [Google Scholar] [CrossRef] [Scilit]
- Reddy, P.J.; Taylor, C. Downward trend in methane detected in a northern Colorado oil and gas production region using AIRS satellite data. Earth Space Sci. 2022, 9, e2022EA002609. [Google Scholar] [CrossRef] [Scilit]
- Yurganov, L.N.; Rakitin, V.; Dzhola, A.; August, T.; Fokeeva, E.; George, M.; Gorchakov, G.; Grechko, E.; Hannon, S.; Karpov, A.; et al. Satellite-and ground-based CO total column observations over 2010 Russian fires: Accuracy of top-down estimates based on thermal IR satellite data. Atmos. Chem. Phys. 2011, 11, 7925–7942. [Google Scholar] [CrossRef] [Scilit]
- Krol, M.; Peters, W.; Hooghiemstra, P.; George, M.; Clerbaux, C.; Hurtmans, D.; McInerney, D.; Sedano, F.; Bergamaschi, P.; El Hajj, M.; et al. How much CO was emitted by the 2010 fires around Moscow? Atmos. Chem. Phys. 2013, 13, 4737–4747. [Google Scholar] [CrossRef] [Scilit]
- Abed, F.G.; Al-Salihi, A.M.; Rajab, J.M. Space-borne observation of methane from atmospheric infrared sounder: Data analysis and distribution over Iraq. J. Appl. Adv. Res. 2017, 4, 256–264. [Google Scholar] [CrossRef] [Scilit]
- Wang, P.; Elansky, N.F.; Timofeev, Y.M.; Wang, G.; Golitsyn, G.S.; Makarova, M.V.; Rakitin, V.S.; Shtabkin, Y.; Skorokhod, A.I.; Grechko, E.I.; et al. Long-term trends of carbon monoxide total columnar amount in urban areas and background regions: Ground-and satellite-based spectroscopic measurements. Adv. Atmos. Sci. 2018, 35, 785–795. [Google Scholar] [CrossRef] [Scilit]
- Rakitin, V.S.; Skorokhod, A.I.; Pankratova, N.V.; Shtabkin, Y.A.; Rakitina, A.V.; Wang, G.; Vasilieva, A.V.; Makarova, M.V.; Wang, P. Recent changes of atmospheric composition in background and urban Eurasian regions in XXI-th century. IOP Conf. Ser. Earth Environ. Sci. 2020, 606, 012048. [Google Scholar] [CrossRef] [Scilit]
- Susskind, J.; Barnet, C.D.; Blaisdell, J.M. Retrieval of atmospheric and surface parameters from AIRS/AMSU/HSB data in the presence of clouds. IEEE Trans. Geosci. Remote Sens. 2003, 41, 390–409. [Google Scholar] [CrossRef] [Scilit]
- Xiong, X.; Weng, F.; Liu, Q.; Olsen, E. Space-borne observation of methane from atmospheric infrared sounder version 6: Validation and implications for data analysis. Atmos. Meas. Tech. Discuss. 2015, 8, 8563–8597. [Google Scholar] [CrossRef] [Scilit]
- Wofsy, S.C.; Daube, B.C.; Jimenez, R.; Kort, E.; Pittman, J.V.; Park, S.; Commane, R.; Xiang, B.; Santoni, G.; Jacob, D.; et al. HIPPO Merged 10-Second Meteorology, Atmospheric Chemistry Aerosol Data (R_20121129). NSF NCAR Earth Observing Laboratory. 2017. Available online: https://data.eol.ucar.edu/dataset/112.123 (accessed on 22 January 2026).
- Sweeney, C.; Karion, A.; Wolter, S.; Newberger, T.; Guenther, D.; Higgs, J.A.; Andrews, A.E.; Lang, P.M.; Neff, D.; Dlugokencky, E.; et al. Seasonal climatology of CO2 across North America from aircraft measurements in the NOAA/ESRL Global Greenhouse Gas Reference Network. J. Geophys. Res.-Atmos. 2015, 120, 5155–5190. [Google Scholar] [CrossRef] [Scilit]
- Wofsy, S.C.; Afshar, S.; Allen, H.M.; Apel, E.C.; Asher, E.C. ATom: Merged Atmospheric Chemistry, Trace Gases, and Aerosols; ORNL DAAC: Oak Ridge, TN, USA, 2018. Available online: https://www.earthdata.nasa.gov/data/catalog/ornl-cloud-atom-merge-1581-1.5 (accessed on 22 January 2026).
- Kulawik, S.S.; Worden, J.R.; Payne, V.H.; Fu, D.; Wofsy, S.C.; McKain, K.; Sweeney, C.; Daube, B.C., Jr.; Lipton, A.; Polonsky, I.; et al. Evaluation of single-footprint AIRS CH4 profile retrieval uncertainties using aircraft profile measurements. Atmos. Meas. Tech. 2021, 14, 335–354. [Google Scholar] [CrossRef] [Scilit]
- Strow, L.L.; DeSouza-Machado, S. Establishment of AIRS climate-level radiometric stability using radiance anomaly retrievals of minor gases and sea surface temperature. Atmos. Meas. Tech. 2020, 13, 4619–4644. [Google Scholar] [CrossRef] [Scilit]
- Rakitin, V.; Fedorova, E.; Skorokhod, A.; Kirillova, N.; Pankratova, N.; Elansky, N. Principles of Correction for Long-Term Orbital Observations of Atmospheric Composition, Applied to AIRS v.6 CH4 and CO Data. Remote Sens. 2025, 17, 2323. [Google Scholar] [CrossRef] [Scilit]
- Deeter, M.N.; Edwards, D.P.; Francis, G.L.; Gille, J.C.; Martínez-Alonso, S.; Worden, H.M.; Sweeney, C. A climate-scale satellite record for carbon monoxide: The MOPITT Version 7 product. Atmos. Meas. Tech. 2017, 10, 2533–2555. [Google Scholar] [CrossRef] [Scilit]
- Hedelius, J.K.; He, T.-L.; Jones, D.B.A.; Baier, B.C.; Buchholz, R.R.; De Mazière, M.; Deutscher, N.M.; Dubey, M.K.; Feist, D.G.; Griffith, D.W.T.; et al. Evaluation of MOPITT Version 7 joint TIR–NIR XCO retrievals with TCCON. Atmos. Meas. Tech. 2019, 12, 5547–5572. [Google Scholar] [CrossRef] [Scilit]
- De Mazière, M.; Thompson, A.M.; Kurylo, M.J.; Wild, J.D.; Bernhard, G.; Blumenstock, T.; Braathen, G.O.; Hannigan, J.W.; Lambert, J.-C.; Leblanc, T.; et al. The Network for the Detection of Atmospheric Composition Change (NDACC): History, status and perspectives. Atmos. Chem. Phys. 2018, 18, 4935–4964. [Google Scholar] [CrossRef] [Scilit]
- Laughner, J.L.; Toon, G.C.; Mendonca, J.; Petri, C.; Roche, S.; Wunch, D.; Blavier, J.-F.; Griffith, D.W.T.; Heikkinen, P.; Keeling, R.F.; et al. The Total Carbon Column Observing Network’s GGG2020 data version. Earth Syst. Sci. Data 2024, 16, 2197–2260. [Google Scholar] [CrossRef] [Scilit]
- Nalli, N.R.; Tan, C.; Warner, J.; Divakarla, M.; Gambacorta, A.; Wilson, M.; Zhu, T.; Wang, T.; Wei, Z.; Pryor, K.; et al. Validation of Carbon Trace Gas Profile Retrievals from the NOAA-Unique Combined Atmospheric Processing System for the Cross-Track Infrared Sounder. Remote Sens. 2020, 12, 3245. [Google Scholar] [CrossRef] [Scilit]
- Validation Facility. Sentinel-5 Precursor Missiom Perfomance Center. Available online: https://mpc-vdaf.tropomi.eu/ (accessed on 22 January 2026).
- Timofeev, Y.M.; Polyakov, A.V.; Virolainen, Y.A.; Makarova, M.V.; Ionov, D.V.; Poberovsky, A.V.; Imhasin, H.H. Estimates of trends of climatically important atmospheric gases near St. Petersburg. Izv. Atmos. Ocean. Phys. 2020, 56, 79–84. [Google Scholar] [CrossRef] [Scilit]
- Hrgian, A.H. Fizika Atmosfery (Atmospheric Physics); Hydrometeorological Izd.: Saint-Petersburg, Russia, 1969; 644p. (In Russian) [Google Scholar]
- Buchholz, R.R.; Deeter, M.N.; Worden, H.M.; Gille, J.; Edwards, D.P.; Hannigan, J.W.; Jones, N.B.; Paton-Walsh, C.; Griffith, D.W.T.; Smale, D.; et al. Validation of MOPITT carbon monoxide using ground-based Fourier transform infrared spectrometer data from NDACC. Atmos. Meas. Tech. 2017, 10, 1927–1956. [Google Scholar] [CrossRef] [Scilit]
- Sha, M.K.; Langerock, B.; Blavier, J.-F.L.; Blumenstock, T.; Borsdorff, T.; Buschmann, M.; Dehn, A.; De Mazière, M.; Deutscher, N.M.; Feist, D.G.; et al. Validation of methane and carbon monoxide from Sentinel-5 Precursor using TCCON and NDACC-IRWG stations. Atmos. Meas. Tech. 2021, 14, 6249–6304. [Google Scholar] [CrossRef] [Scilit]
- Kiel, M.; Hase, F.; Blumenstock, T.; Kirner, O. Comparison of XCO abundances from the Total Carbon Column Observing Network and the Network for the Detection of Atmospheric Composition Change measured in Karlsruhe. Atmos. Meas. Tech. 2016, 9, 2223–2239. [Google Scholar] [CrossRef] [Scilit]
- AIRS/AMSU/HSB. Version 6 Data Release User Guide, Olsen, E.T. (ed.), Jet Propulsion Laboratory, California Institute of Technology, Pasadena, 2017. Available online: https://docserver.gesdisc.eosdis.nasa.gov/repository/Mission/AIRS/3.3_ScienceDataProductDocumentation/3.3.4_ProductGenerationAlgorithms/V6_Data_Release_User_Guide.pdf (accessed on 21 February 2026).
- Susskind, J.; Blaisdell, J.M.; Iredell, L. Improved methodology for surface and atmospheric soundings, error estimates, and quality control procedures: The atmospheric infrared sounder science team version-6 retrieval algorithm. J. Appl. Remote Sens. 2014, 8, 084994. [Google Scholar] [CrossRef] [Scilit]
- Rakitin, V.S.; Kazakov, A.V.; Elansky, N.F. Multifunctional software of the OIAP RAS for processing and analysis of orbital data on the atmospheric composition: Tasks, possibilities, application results, and ways of development. In Proceedings of the 29th International Symposium on Atmospheric and Ocean Optics: Atmospheric Physics; SPIE: Bellingham, WA, USA, 2023; Volume 12780, p. 127805T. [Google Scholar] [CrossRef] [Scilit]
- Buchholz, R.R.; Worden, H.M.; Park, M.; Francis, G.; Deeter, M.N.; Edwards, D.P.; Emmons, L.K.; Gaubert, B.; Gille, J.; Martínez-Alonso, S.; et al. Air pollution trends measured from Terra: CO and AOD over industrial, fire-prone, and background regions. Remote Sens. Environ. 2021, 256, 112275. [Google Scholar] [CrossRef] [Scilit]
- Timofeyev, Y.; Virolainen, Y.; Makarova, M.; Poberovsky, A.; Polyakov, A.; Ionov, D.; Osipov, S.; Imhasin, H. Ground-based spectroscopic measurements of atmospheric gas composition near Saint Petersburg (Russia). J. Mol. Spectrosc. 2016, 323, 2–14. [Google Scholar] [CrossRef] [Scilit]
- Monarrez, R. NASA CLIMCAPS Level-2 Products User Guide: File Format and Definition. Version 2.1. Goddard Earth Sciences Data and Information Services Center (GES DISC). Greenbelt, MD 20771 USA. April 2021. Available online: https://docserver.gesdisc.eosdis.nasa.gov/public/project/Sounder/CLIMCAPS.V2.README.pdf (accessed on 20 January 2026).
- Aumann, H.H.; Broberg, S.; Manning, E.; Pagano, T. Radiometric Stability Validation of 17 Years of AIRS Data Using Sea Surface Temperatures. Geophys. Rese. Lett. 2019, 46, 12504–12510. [Google Scholar] [CrossRef] [Scilit]
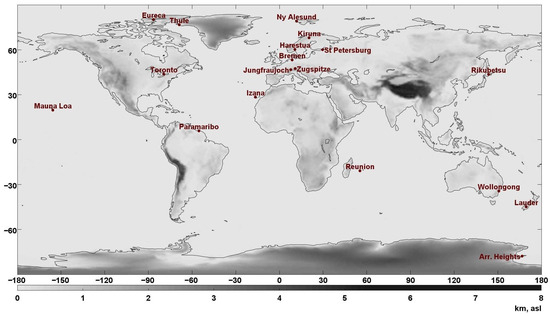
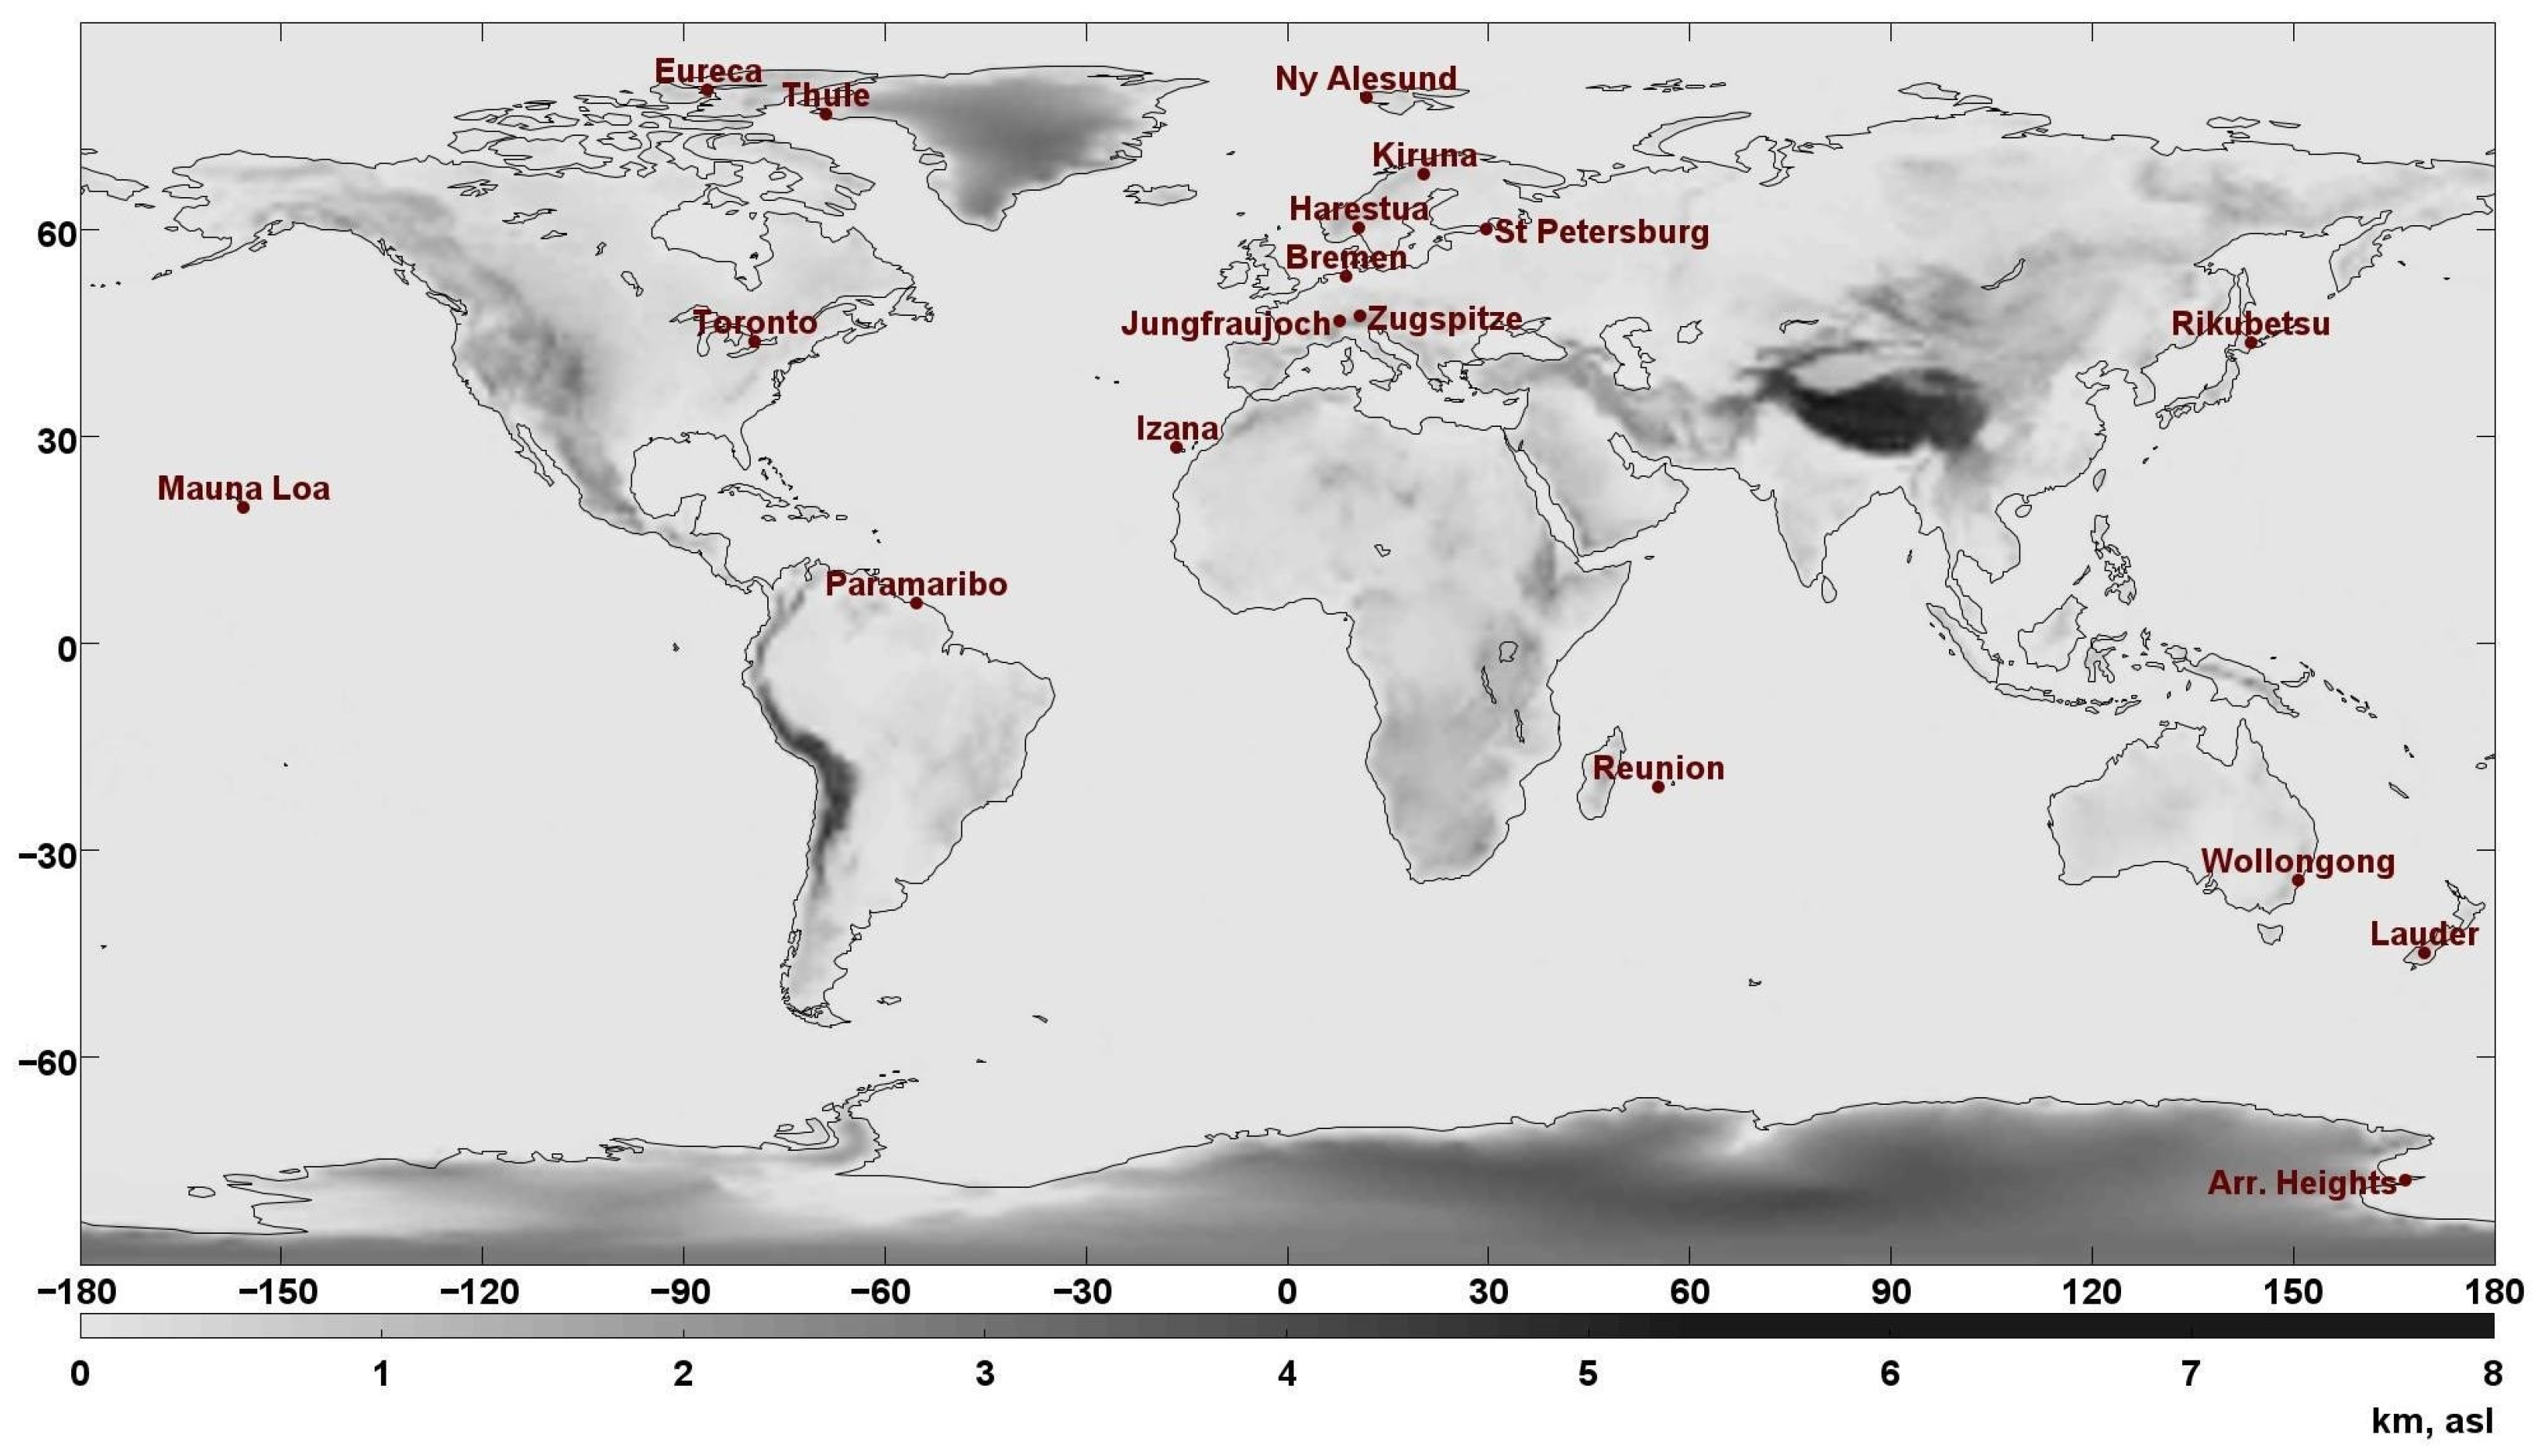
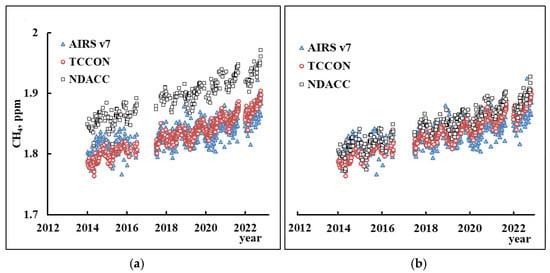
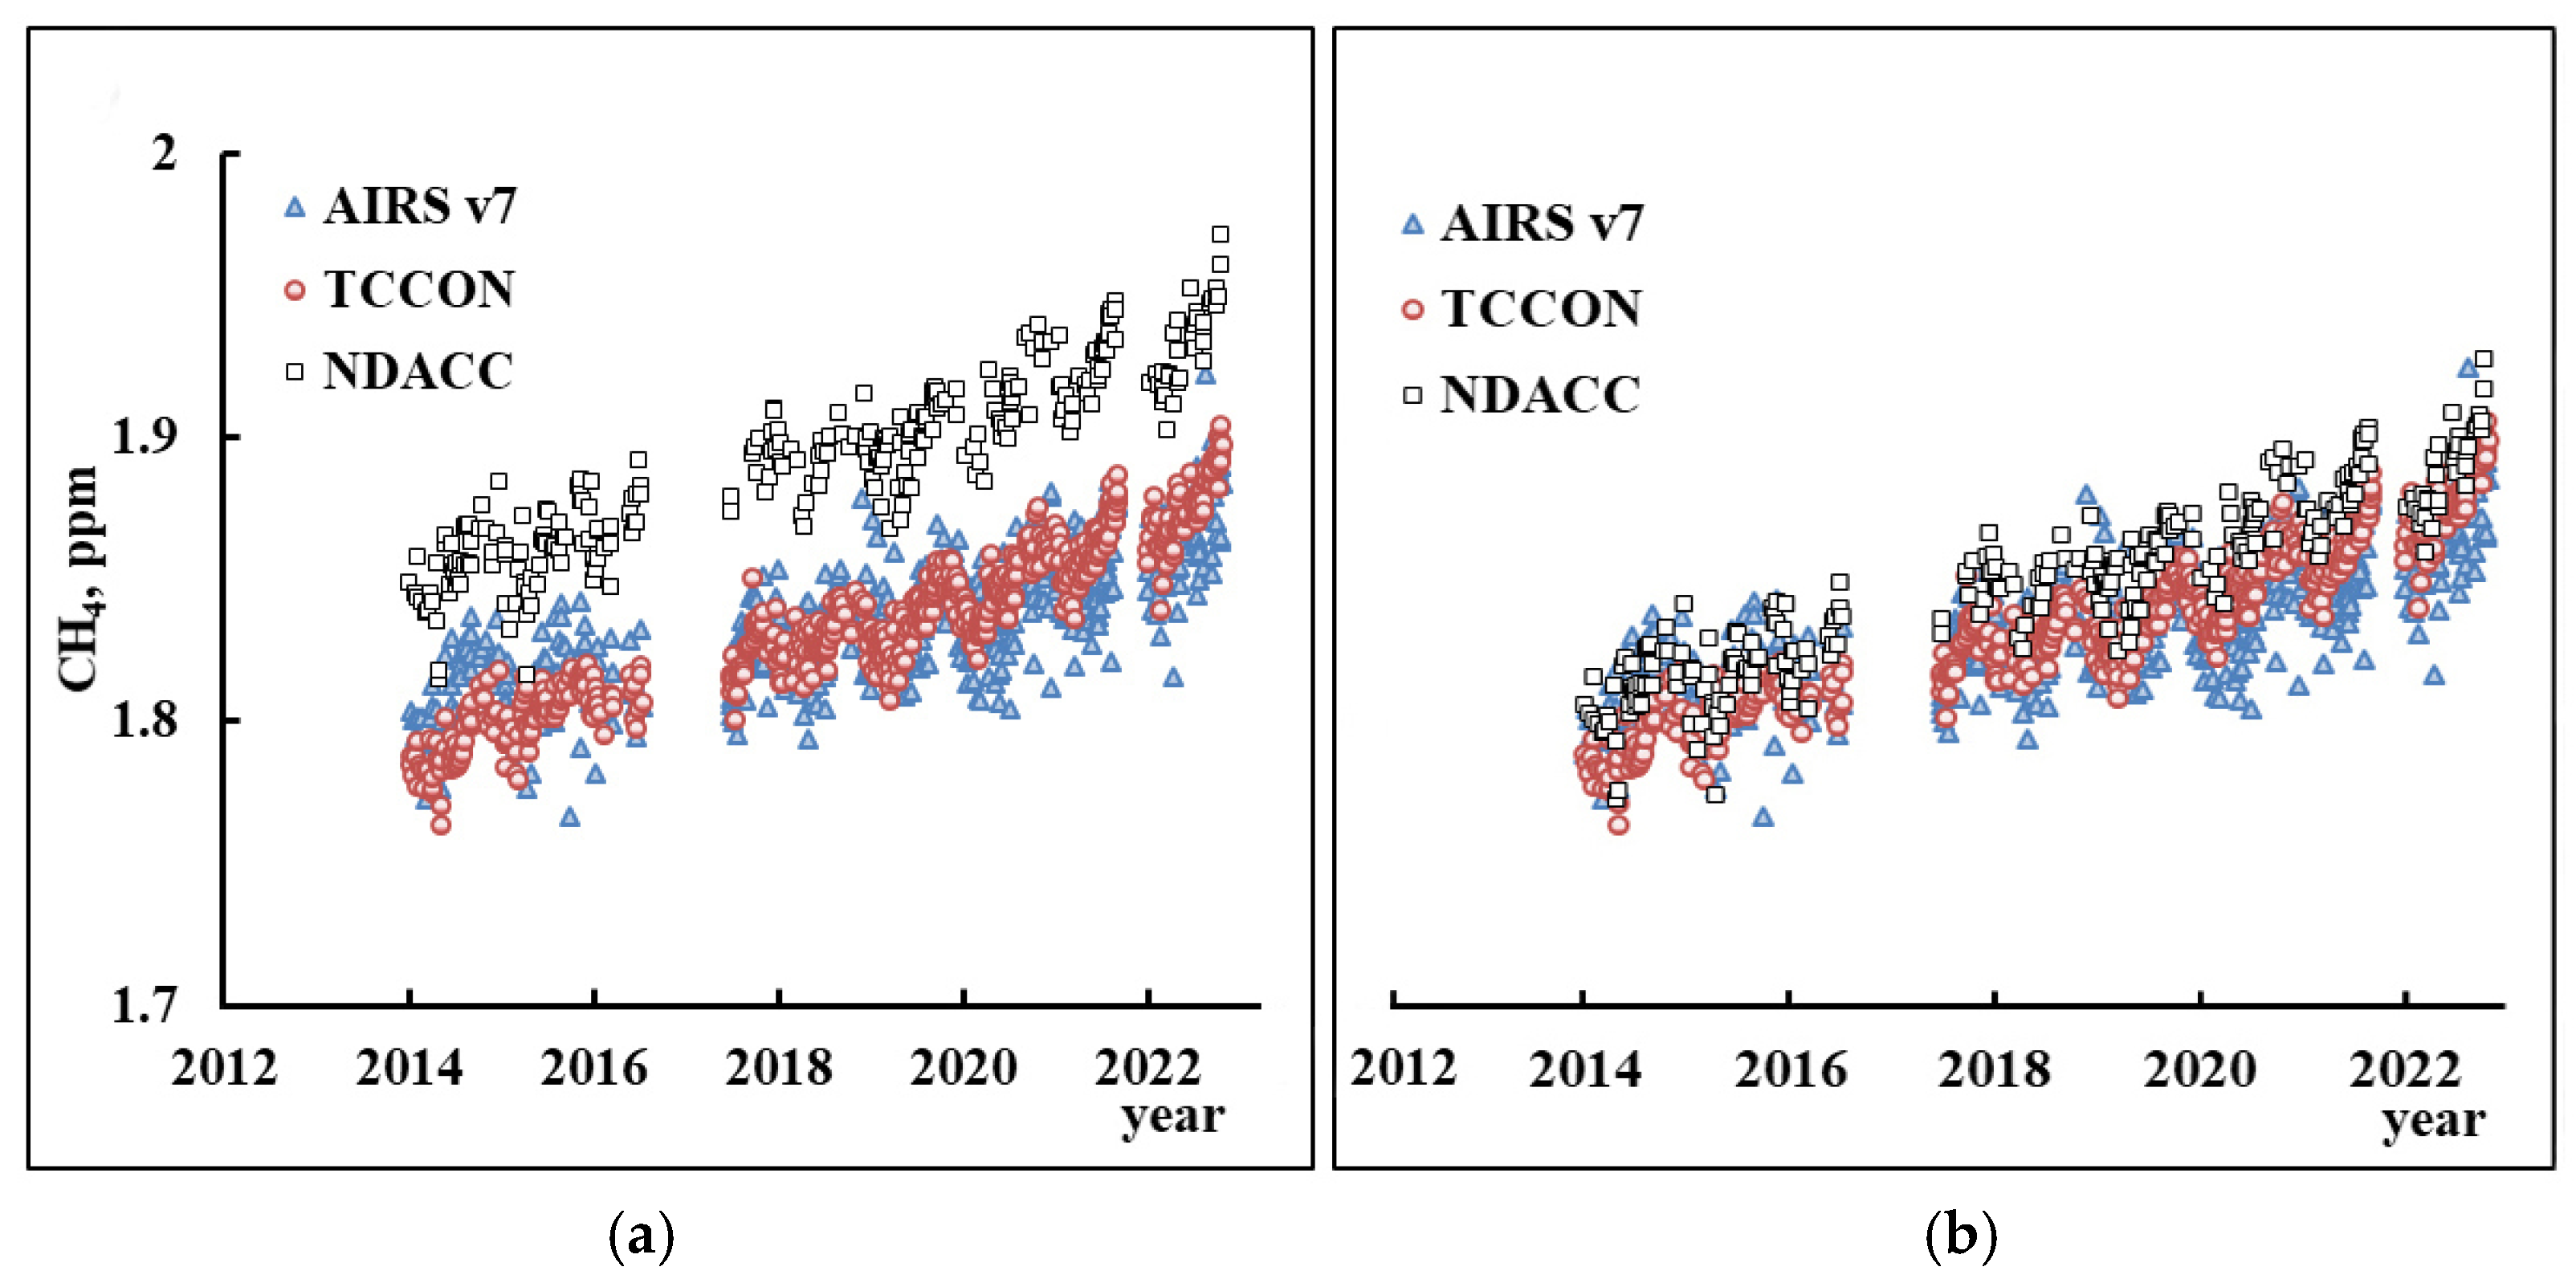
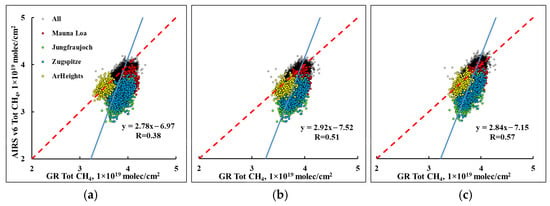
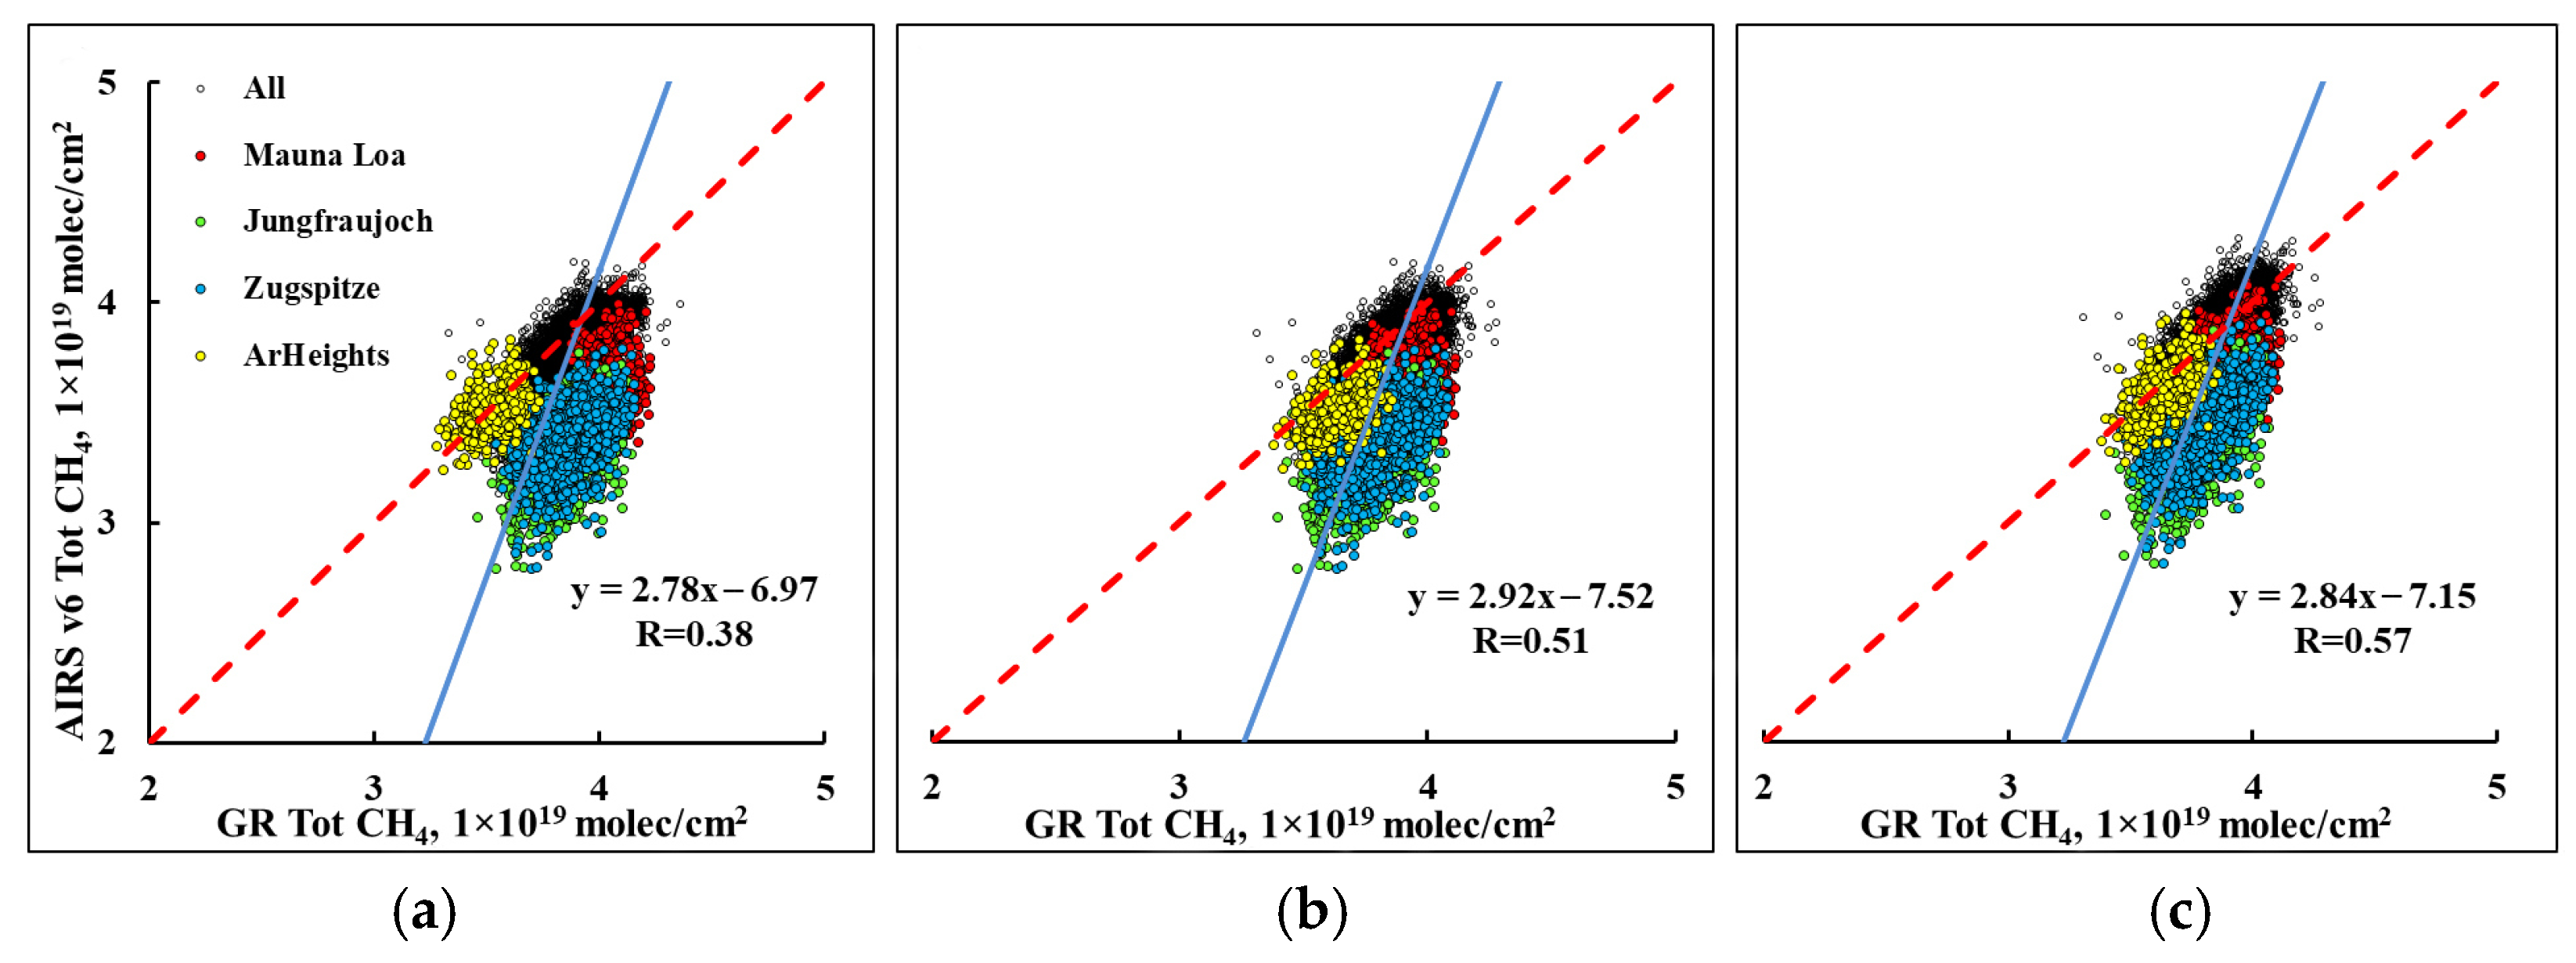
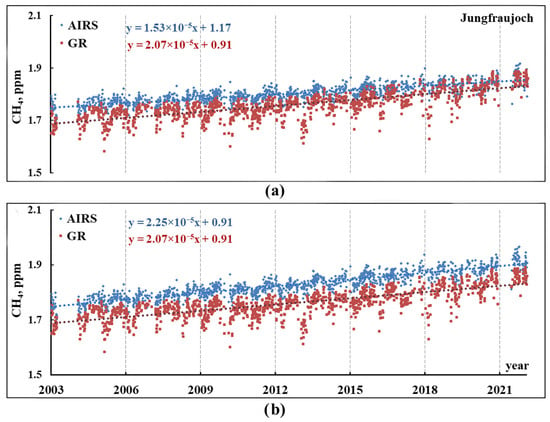
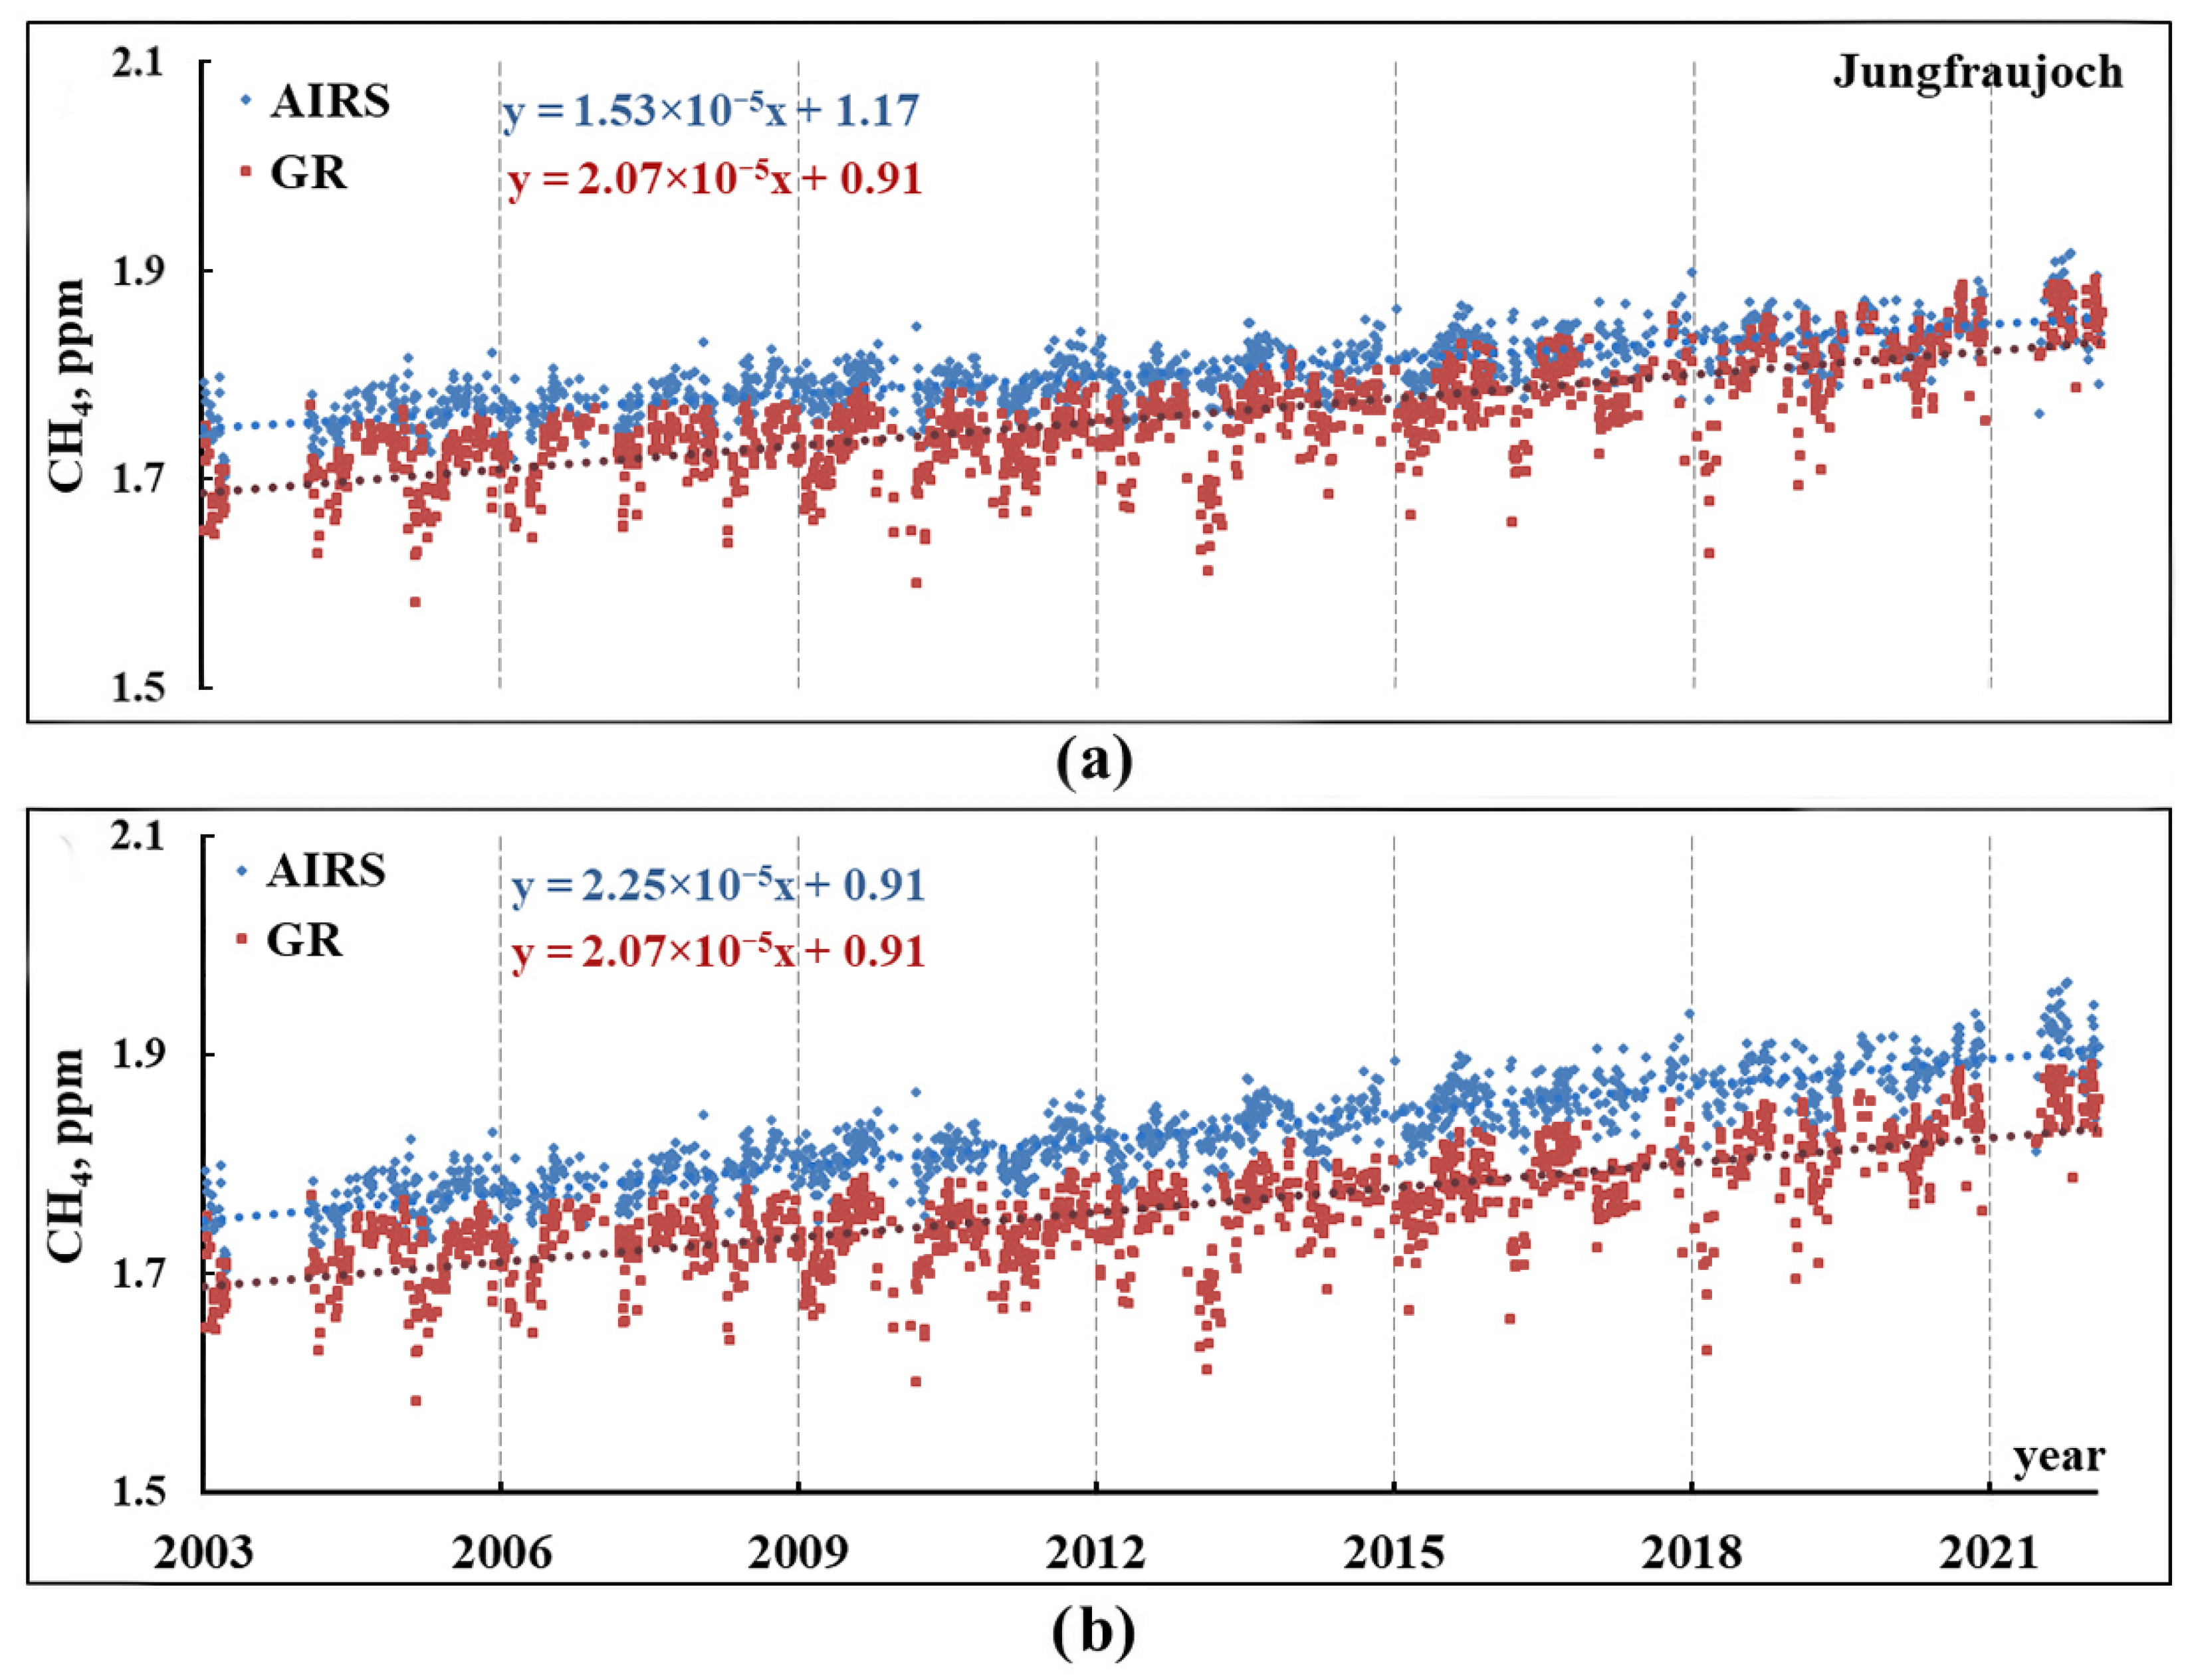
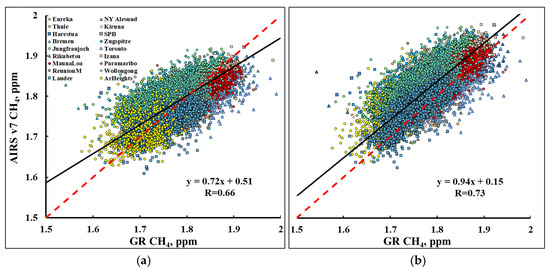

Disclaimer/Publisher’s Note: The statements, opinions and data contained in all publications are solely those of the individual author(s) and contributor(s) and not of MDPI and/or the editor(s). MDPI and/or the editor(s) disclaim responsibility for any injury to people or property resulting from any ideas, methods, instructions or products referred to in the content. |
© 2026 by the authors. Licensee MDPI, Basel, Switzerland. This article is an open access article distributed under the terms and conditions of the Creative Commons Attribution (CC BY) license.