


Highlights
What are the main findings?
- A multi-channel super-resolution reconstruction model is developed to enhance S-band radar reflectivity using dual-band (S- and X-band) weather radar observations.
- Joint incorporation of reflectivity and key polarimetric parameters improves spatial detail representation and structural reconstruction under severe convective weather conditions.
What are the implications of the main finding?
- The proposed method effectively alleviates resolution mismatch between multi-band weather radars, providing a better foundation for subsequent radar network mosaicking and data integration.
- The results demonstrate the potential of dual-band radar fusion for improving high-resolution radar observations compared with single S-band super-resolution approaches.
Abstract
Dual-band weather radar networks enable complementary multi-radar observations, improving the accuracy, three-dimensional characterization, and early warning capability for severe convective weather. S-band radar provides strong penetration and long detection range but suffers from limited spatial resolution, whereas X-band radar offers high resolution with weaker penetration, posing challenges for dual-frequency data fusion. To address the resolution mismatch and fusion modeling issues between dual-band radars, this study proposes a super-resolution reconstruction method for S-band reflectivity based on dual-frequency radar observations. S-band and X-band radar data, together with key polarimetric parameters, are jointly incorporated into a deep neural network-based fusion model to enhance the spatial resolution of S-band reflectivity. Experimental results under typical severe weather conditions demonstrate that the proposed method achieves improved detail recovery and structural reconstruction, with the model achieving PSNR 30.84, SSIM 0.8755, and MAE 0.24178, which shows obvious advantages compared with other models and effectively enhances radar network data quality, and it outperforms single S-band super-resolution approaches in both objective metrics and subjective evaluations.
1. Introduction
In the context of accelerating global climate change, China has deployed 546 new-generation weather radars, forming a nationwide observation network that plays a crucial role in operational severe convective weather forecasting [1]. S-band weather radars exhibit strong penetration capability [2], enabling reliable large-scale precipitation detection and effective monitoring of long-duration severe weather systems such as convective storms and heavy rainfall [3]. However, their relatively low spatial resolution and limited vertical coverage constrain their ability to detect short-term, localized, and fine-scale weather features [4,5].
X-band weather radars complement S-band systems by providing higher spatiotemporal resolution, allowing detailed observation of rapidly evolving weather phenomena, including mesocyclones, localized heavy rainfall, and severe convective events such as storms and tornadoes [6,7]. Nevertheless, X-band radars suffer from significant signal attenuation in heavy precipitation, which degrades detection accuracy [8,9]. Despite this limitation, their advantages in low-altitude coverage, vertical structure resolution, high temporal resolution, compact size, low cost, and flexible deployment make them well suited for localized networked observations and for compensating S-band radar coverage blind spots [3].
In recent years, advances in mobile and hybrid radar network deployment have significantly improved the accuracy and timeliness of meteorological monitoring systems. A newly developed X-band phased-array radar system in southern China was shown to enhance three-dimensional wind-field retrieval and enable earlier hail warnings [10]. A common approach for S/X-band collaboration involves joint gridding and data fusion, allowing X-band radars to mitigate low-altitude blind zones of S-band systems, while S-band radars compensate for X-band signal attenuation under heavy rainfall conditions [11,12]. Over the recent two decades, substantial progress has been made in dual-band radar networking, exemplified by the CASA Integrated Project (IP), which deployed multiple X-band radar networks for low-level wind hazard monitoring, urban flood forecasting, and tropical precipitation observation [13,14,15,16].
Similar progress has been reported in other regions. Three-dimensional mosaic fusion methods were introduced to address low-level blind zones and terrain-induced coverage gaps) [17], while the impact of attenuation on X-band radar signals was analyzed and networking strategies were proposed to mitigate signal degradation under heavy precipitation [18]. Further studies demonstrated that polarimetric parameters from networked X-band radar systems outperform those from single-radar configurations [19], and quantitative comparisons of dual-polarization variables across frequency bands provided valuable insights for data fusion strategies. In Europe, the Deutscher Wetterdienst deployed a high-resolution three-dimensional Doppler radar network using the POLARA framework [20]. Despite these advances, most existing dual-band fusion methods rely on physical registration combined with grid interpolation or weighted mosaicking, which limits fine echo detail recovery, high-frequency spatial information extraction, and reconstruction of occluded radar regions, while deep statistical correlations between dual-band observations remain underutilized.
Radar super-resolution reconstruction has been extensively studied using traditional signal processing and optimization-based approaches. Early methods focused on improving effective beamwidth and angular resolution through oversampling, inverse filtering, and digital beamforming [21,22], as well as deconvolution and spectral estimation techniques [23], although these methods often suffered from noise sensitivity and limited robustness. Subsequent studies introduced enhanced optimization strategies to improve reconstruction stability and accuracy [24]. Prior-based methods further advanced high-resolution reconstruction by exploiting non-local self-similarity, sparse-domain regularization, and total variation constraints [25,26]. More recently, deep learning-based methods have demonstrated superior performance, including complex-valued convolutional neural networks [27], U-Net-based architectures [28], GAN-guided angular resolution enhancement [29], and attention-based reconstruction networks [30,31].
In this study, a neural network-based method for S/X-band radar data fusion and super-resolution reconstruction is proposed to recover high-resolution S-band radar reflectivity through a data-driven modeling approach. The model is trained to learn the mapping from fine-scale structural information in X-band observations to robust echo features in S-band data, thereby enhancing the representation and reconstruction of complex radar echoes. The remainder of this paper is organized as follows. Section 2 consists of the Materials and Methods, describing the data sources, preprocessing procedures, dataset construction, and the proposed deep learning models and methodologies. Section 3 presents performance evaluation and sensitivity analysis. Section 4 summarizes the main findings and discusses the broader significance and applicability of this work. The last section outlines the conclusions.
2. Materials and Methods
2.1. Data Sources
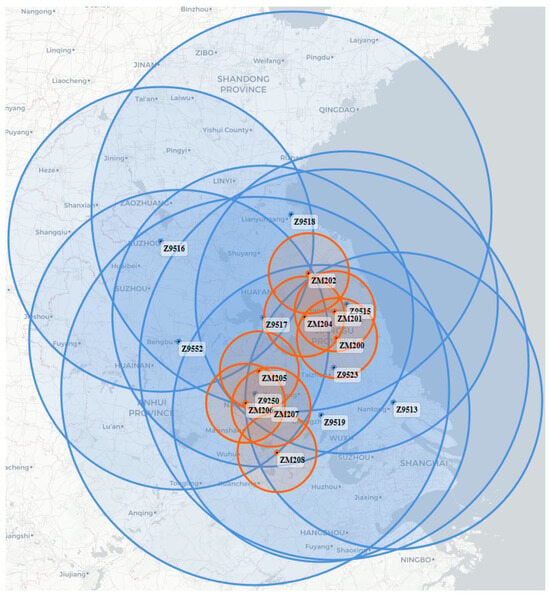
Radar data were collected from June to August 2023. The data were obtained from the S-band radar and the X-band radar in Jiangsu Province. The spatial distribution of the weather radars is shown in Figure 1, and their main technical parameters are listed in Table 1.
Figure 1.
Coverage map of Jiangsu Province. The blue circles represent the detection ranges of all operational weather radars in the region, while the orange circles highlight the selected weather radars used in this study. The overlapping areas indicate regions of shared observation, providing a basis for subsequent data matching and fusion. The radars used in this study are C-band Z9250 and X-band ZM200. (The radius of the radius of the small circle is 61.2 km).
Table 1.
Main operating parameters of S-band and X-band weather radars.
The S-band radar has a maximum detection range of 460 km, a range resolution of 250 m, beamwidth 1° and an azimuth resolution of 1°, with elevation coverage from 0.5° to 19.5°. In contrast, the X-band radar features a maximum detection range of 61.2 km, a range resolution of 60 m, beamwidth 1° and an azimuth resolution of 0.5°, with elevation coverage from 0.3° to 19.5°. The S-band radar is mainly used to observe the structure of large-scale weather systems.
Compared with single-band radar data, multi-band radar network data has obvious complementary advantages. The S-band radar provides long detection range and stable observation of large-scale weather systems, while the X-band radar offers higher spatial resolution for detailed structures. By fusing multi-band data, the radar network can achieve wider coverage, higher resolution, and more reliable observation than a single radar, thus improving the accuracy and robustness of subsequent weather analysis and modeling.
The lowest four elevation angles of the S-band radar were selected to ensure spatial consistency and effective overlap between the observations. These correspond to the lower detection layers. The full elevation scans of the X-band radar were also used. These selected data were then used as input for the fusion process.
2.2. Space–Time Matching
Dual-band radar data fusion requires accurate temporal and spatial alignment. Owing to differences in radar location, elevation, and viewing geometry, simple time synchronization is insufficient to ensure data consistency. Spatial registration is therefore commonly performed using latitude–longitude inversion, geometric projection, range correction, and three-dimensional coordinate mapping, through which S- and X-band radar observations are matched using nearest-neighbor or interpolation techniques. Radar beam geometry and Earth curvature are also considered, particularly in complex terrain where beam blockage and cone-of-silence effects are more pronounced.
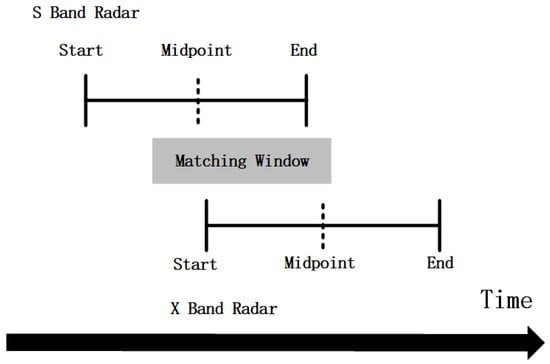
Temporal alignment is completed prior to spatial registration to ensure effective data fusion. An automatic matching algorithm based on minimizing the median time difference is adopted to address temporal inconsistencies between independently operating radar systems. As shown in Figure 2, first, the data from different radars are uniformly converted to Universal Time (UT), the radar scan start and end times are converted into absolute seconds relative to a unified time reference. Candidate data file pairs are then identified within a predefined time window, and the pair with the closest midpoint time is selected as the optimal match. The proposed algorithm is capable of handling hour-boundary crossings and redundant data files, thus achieving second-level temporal alignment between dual-band radars. This effectively matches data from multi-band radars and overcomes temporal errors caused by differences in temporal resolution. This accurate temporal synchronization establishes a reliable foundation for subsequent spatial registration and joint modeling of multi-band radar data.
Figure 2.
Schematic of time consistency matching between S-band and X-band weather radars. The start and end times of each radar scan are parsed and converted into absolute seconds. Candidate pairs are identified within a predefined matching window, and the file pair with the closest midpoint time is selected as the final match, ensuring temporal consistency between the S-band and X-band radar observations.
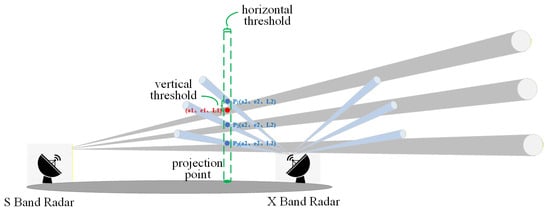
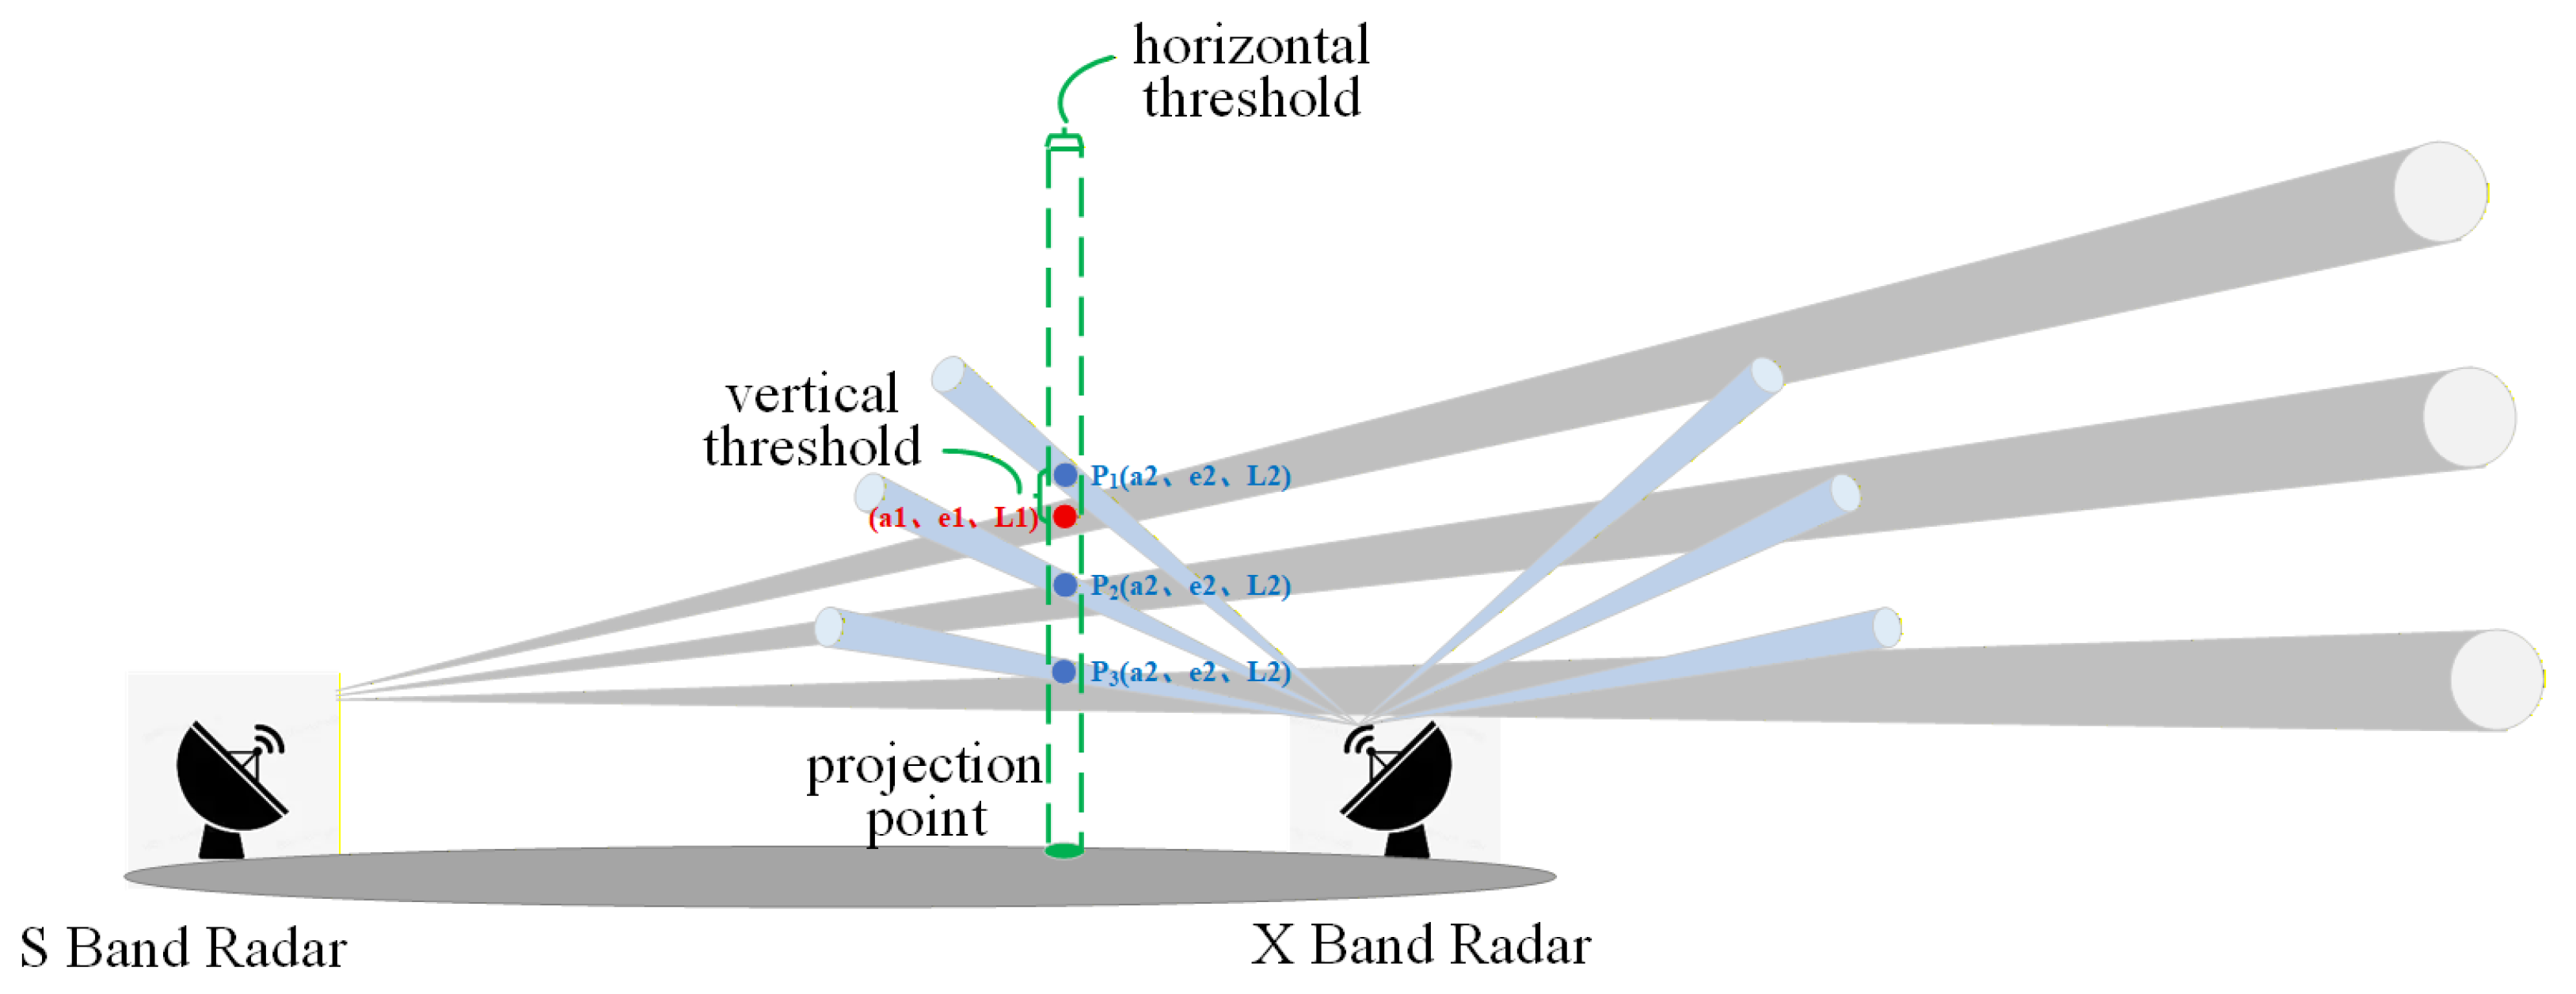
As illustrated in Figure 3, temporal matching of dual-band radar data were first completed, followed by spatial registration to extract the geographically overlapping regions between the S-band and X-band observations. Each temporally synchronized and spatially co-registered S-band/X-band data pair was treated as a basic processing unit, corresponding to a unified Cartesian grid of the overlapping area at a given time.
Figure 3.
Schematic of spatial registration between S-band and X-band weather radars. A projection point is defined to identify the overlapping regions of the two radar beams. Horizontal and vertical thresholds are applied to ensure consistency in both dimensions. Each pair of temporally synchronized and spatially registered radar data covering the same region is then used as the basic processing unit for subsequent data fusion.
Given that the X-band radar coverage is fully contained within that of the S-band radar, a spatial index was constructed only for the X-band data to improve matching efficiency. Three-dimensional coordinates (latitude, longitude, and altitude) from each elevation layer of the X-band radar were stored and indexed using a KD-Tree [32]. KD-tree is a space-partitioning data structure that efficiently organizes points in a k-dimensional space. It enables fast nearest-neighbor search and range queries, making it widely used for fast spatial matching, point cloud registration, and multi-dimensional data retrieval tasks. For each elevation layer of the S-band radar, observation points within the X-band coverage were identified, and nearest-neighbor searches were performed via the KD-Tree to determine corresponding X-band points. Key radar observables, including reflectivity (), differential phase (), and specific differential phase (), were used for spatial matching, with a distance threshold applied to ensure matching accuracy. Through this procedure, spatially consistent S-band and X-band radar data pairs were constructed over the same observation region.
2.3. Dataset
The initial dataset contained approximately 32,000 samples. The data used in this study were obtained from the first five antenna elevation angles. To ensure data quality and physical consistency in dual-band fusion, clear-sky and weak-echo samples were removed, and only weather echoes simultaneously observed by both S-band and X-band radars within their overlapping coverage were retained under a temporal alignment constraint of 2 min. Samples missing observations from either radar were discarded, resulting in 15,431 valid samples that cover a range of representative severe convective events with good spatial diversity. Each data sample consists of 50 azimuth angles × 500 range bins. These valid samples are selected from distinct time instants with no temporal overlap between any two samples.
After temporal and spatial registration, the overlapping radar observations were reconstructed into two-dimensional matrices of size 50 × 500, representing the azimuth–range echo distribution. Quality control was applied to remove samples with excessive missing values, and remaining missing data (e.g., None values of dBZ are set to −33) were filled according to the weather radar data format requirements. All variables were subsequently normalized to reduce scale differences and improve training stability. The dataset was finally divided into training, validation, and test sets using a ratio of 7:1.5:1.5, providing a reliable basis for model training, hyperparameter tuning, and performance evaluation.
The dataset was finally divided into training, validation, and test sets using a ratio of 7:1.5:1.5. This partition ensures the training set contains sufficient diverse samples for robust learning, while the validation and test sets are large enough to provide statistically meaningful evaluations, thus providing a reliable basis for model training, hyperparameter tuning, and performance evaluation.
2.4. Super-Resolution Reconstruction Fusion Network
An enhanced cross-modal super-resolution reconstruction network, termed D-SRFNet (dual-band super-resolution fusion network), is proposed for the joint modeling of low-resolution S- and X-band radar observations and the reconstruction of high-resolution S-band radar reflectivity. Low-resolution reflectivity from S-band radars and multi-parameter data from X-band radars is used as the network input, while the original-resolution S-band field is reconstructed through deep fusion of multi-band observations and associated physical information.
Within the network architecture, a spatially adaptive feature modulation mechanism is incorporated, together with a nonlinear pixel-level mapping strategy, enabling enhanced representation of spatial heterogeneity and the pronounced nonlinear characteristics inherent in radar echoes. The coexistence of large-scale structural patterns and fine-scale local details in weather radar observations is further addressed by introducing attention modeling units with enlarged receptive fields, through which the effective receptive field is expanded and the representation of large-scale weather systems, including strong convective cores and echo band structures, is reinforced.
In addition, structured channel-separable convolutions are employed, by which redundancy among feature channels is compressed and both computational efficiency and training stability are improved, while preserving discriminative feature representation capability. On this basis, adaptive modeling of echo characteristics across different spatial scales is achieved through the synergistic interaction between multi-scale feature fusion and spatial modulation mechanisms, allowing edge details and strong echo structures in the reflectivity field to be progressively recovered.
Through this progressive reconstruction process, high-resolution radar reflectivity fields are generated in a manner that preserves echo continuity and spatial stitching consistency, thereby satisfying the requirements of large-scale radar observation and reconstruction applications.
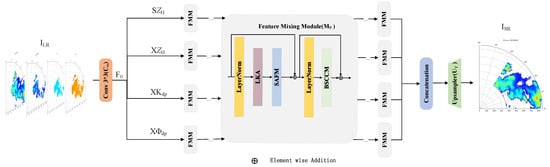
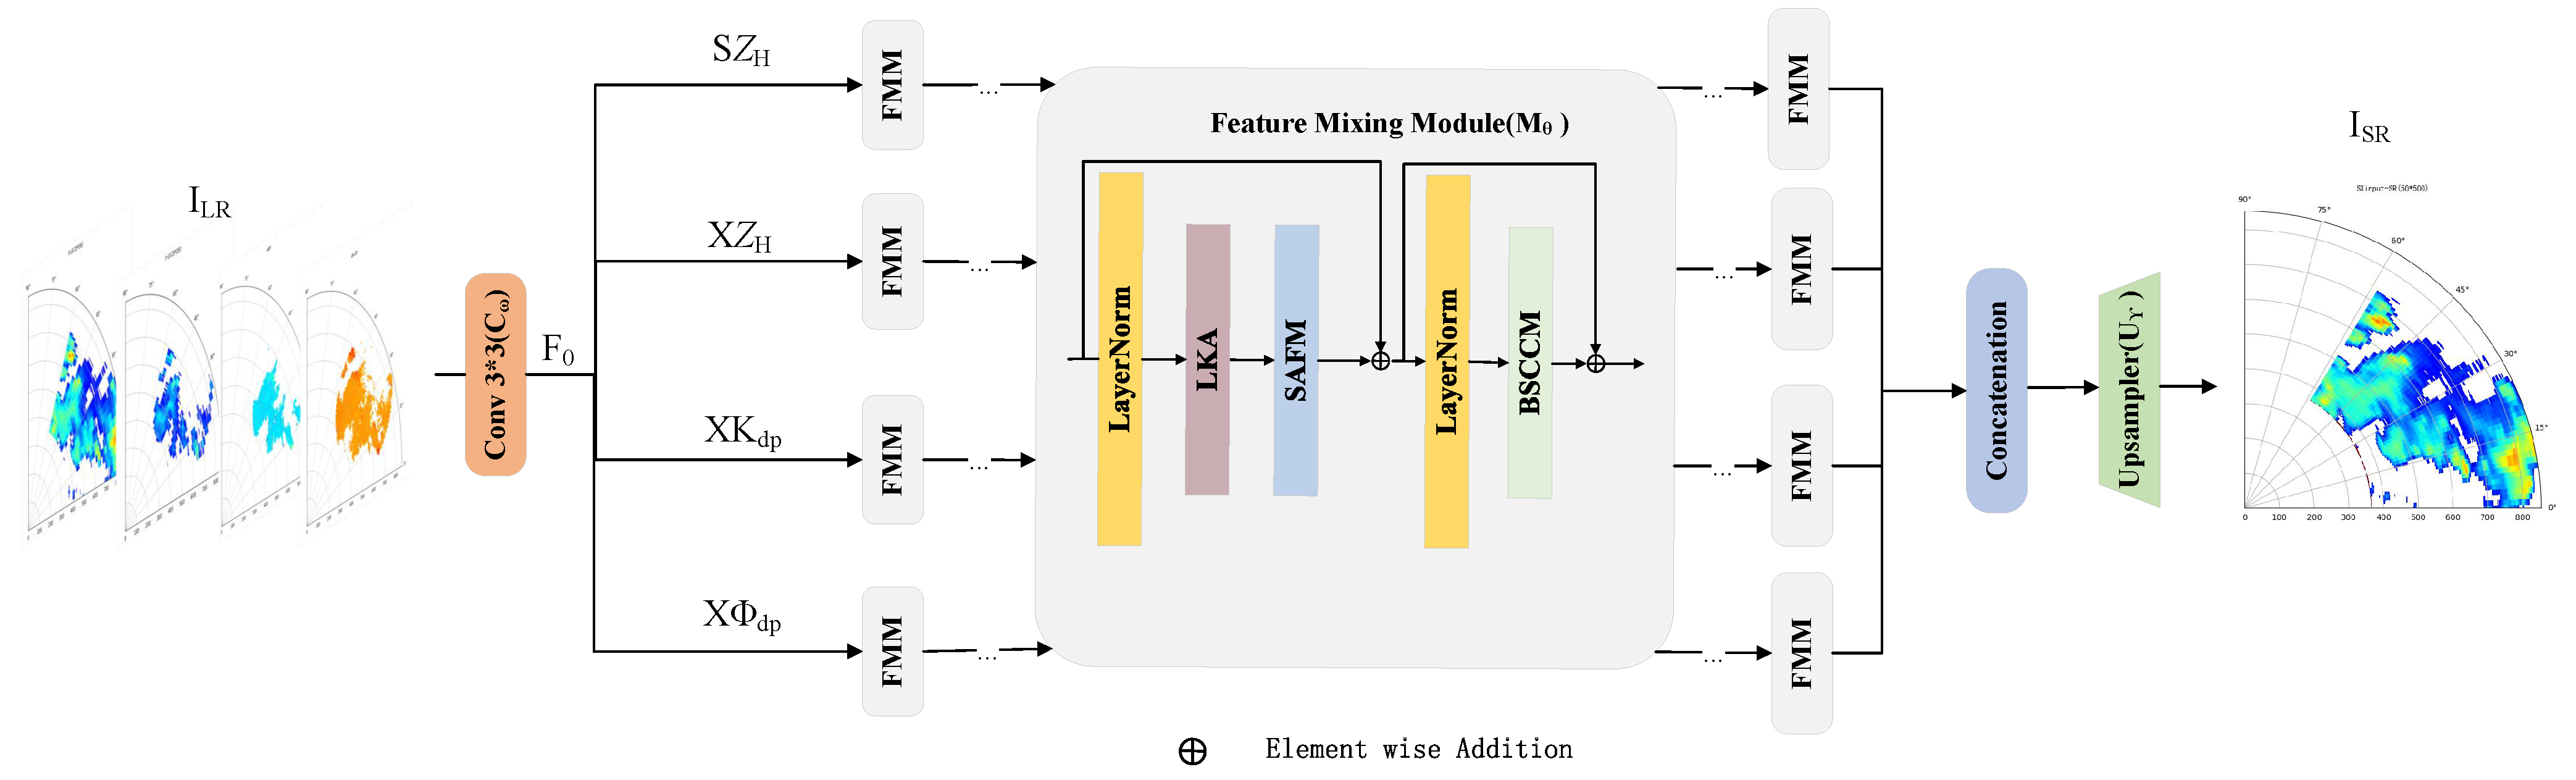
The structure of the network is shown in Figure 4, which mainly includes three parts: input feature extraction layer, feature mixing module (FMM), and upsampling module.
Figure 4.
Architecture of the proposed SRFNet model, consisting of feature extraction, feature mixing (FMM), and upsampling modules. The network fuses dual-band dual-polarization radar observations through a residual-enhanced pipeline and reconstructs high-resolution S-band reflectivity fields. The polarimetric variables are not used simultaneously in all experiments. (: low resolution; : super resolution; : S-band reflectivity; : X-band reflectivity; : X-band-specific differential phase; : X-band differential phase).
First, low-resolution dual-band radar data are fed into a 3 × 3 convolutional layer for initial feature extraction, yielding the shallow feature map as defined in Equation (1). These convolutional (Conv) modules serves to unify the scale and channel characteristics across different frequency bands and physical quantities, while extracting basic spatial features from the input radar data.
Secondly, a global residual connection mechanism is introduced, with the aim of enhancing the model’s capability to recover radar echo details, particularly at strong echo boundaries and in areas exhibiting fine-scale structural variability. The shallow feature is element-wise added to the output of the deep feature extraction layers, which reinforces the retention of critical information during the propagation process. This strategy effectively mitigates information degradation and gradient vanishing issues in feature representation.
Finally, a lightweight upsampling module is implemented, and it is designed for the purpose of reconstructing high-spatial-resolution S-band radar reflectivity fields. This module transforms low-resolution feature maps into high-resolution S-band reflectivity outputs, enabling more accurate restoration of the spatial structures and evolutionary characteristics of weather targets.
The structure of the model can be expressed as follows:
where is the input of low-resolution radar data, is the reconstructed high-resolution S-band radar reflectivity; is the initial convolution operation with parameter ; is the deep feature extractor composed of FMM modules (Feature Mixing Module) with parameter ; and is the upsampling module with parameter .
2.5. Feature Mixing Module
The Feature Modulation Module (FMM) is designed to enhance the structural representation capability of radar reflectivity data across different spatial scales. Its design incorporates the concept of “global context modeling + local structure enhancement,” which is inspired by the Vision Transformer (ViT) architecture. This design is further adapted to account for the physical characteristics of radar data. Each FMM module is composed of three submodules in sequential order: the Large Kernel Attention (LKA) module [33], the Spatially Adaptive Feature Modulation (SAFM) module, and the Blueprint Separable Convolutional Channel Mixer (BSCCM). The calculation process of each FMM is as follows:
where represents the LayerNorm operation, and X, Y, and Z are intermediate features at different stages.
The model can fully integrate local and global information to achieve high-quality reconstruction of the high-resolution S-band radar reflectivity by stacking the above modules.
Next, the structure and function of the LKA module, SAFM module, and BSCCM module will be introduced in detail.
2.5.1. Large Kernel Attention
In radar reflectivity reconstruction, reconstruction quality is strongly influenced by the spatial organization of large-scale weather systems, such as convective regions and strong echo areas. In former approaches, the receptive field is typically expanded through stacked local convolutions or complex multi-branch architectures; however, these methods incur high computational cost and show limited capability in modeling long-range spatial dependencies.
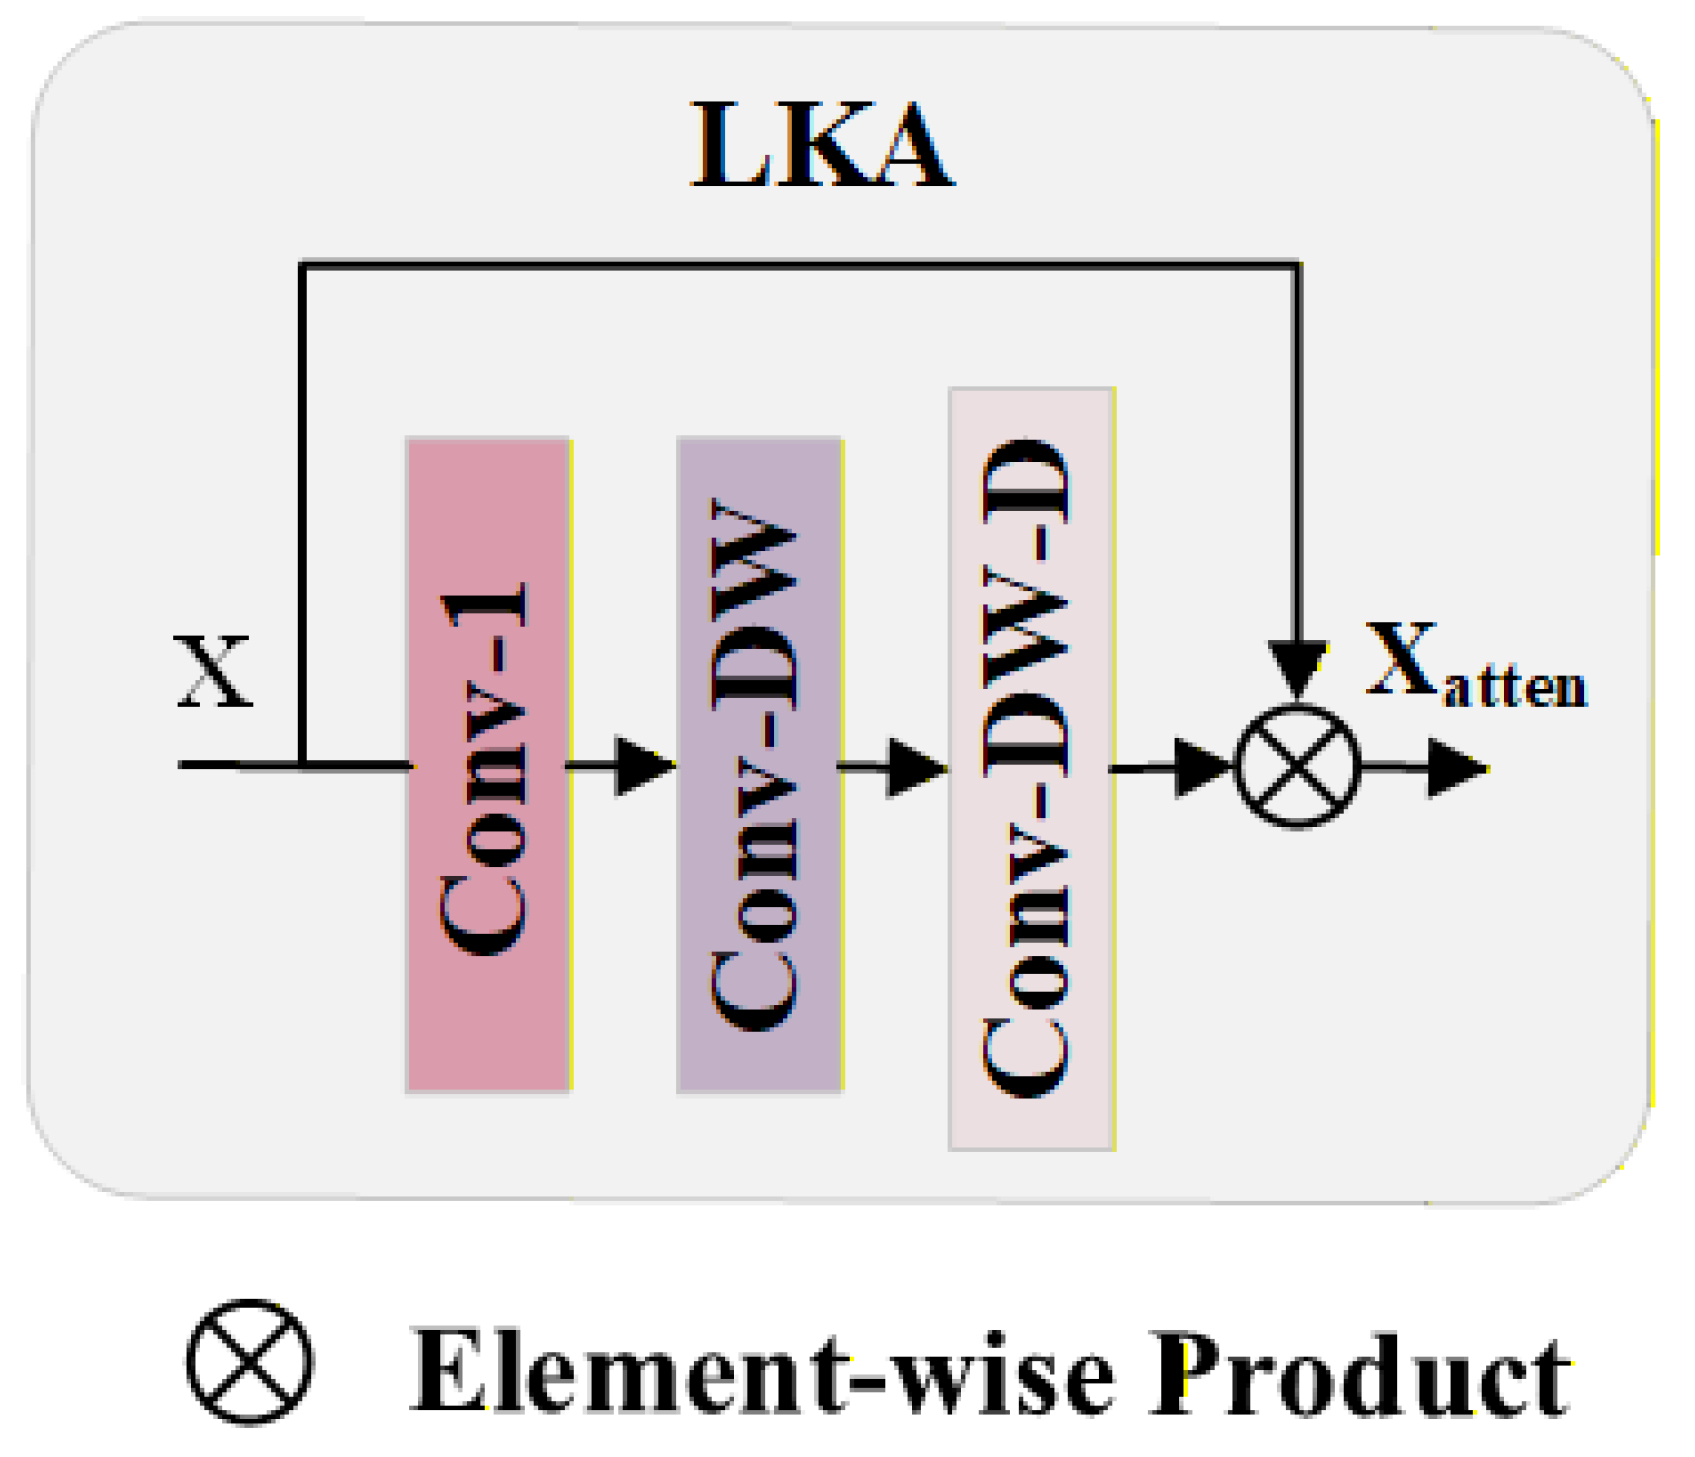
A Large Kernel Attention (LKA) mechanism is introduced at the feature modeling stage [34], through which the effective receptive field is enlarged while computational efficiency is maintained. Long-distance spatial dependencies in the radar reflectivity field are captured with reduced parameter and computational complexity, leading to improved representation of large-scale echo morphology.
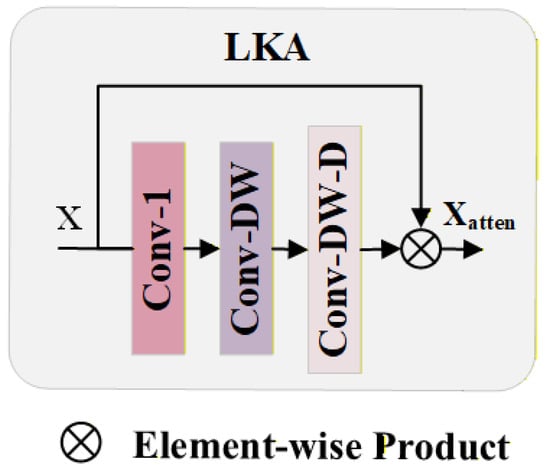
Specifically, a 1 × 1 pointwise convolution is first applied to compress the channel dimension. In contrast to the subsequent spatial convolutions, this step operates exclusively on the channel dimension. Then, a standard 5 × 5 depthwise convolution is used to extract local spatial features. This is followed by a 5 × 5 dilated depthwise convolution with a dilation rate of 3. The key difference between these two depthwise convolutions is the dilation rate: the standard convolution (dilation = 1) focuses on local details, while the dilated version (dilation = 3) expands the receptive field to capture long-range dependencies. The entire module generates a spatial attention map through this convolution sequence, which is then element-wise multiplied with the original input features X to complete the enhancement operation.
Through spatial attention, input features are modulated by LKA, allowing large-scale structural information to be emphasized while local noise and redundant responses are suppressed. As demonstrated by experimental results, echo continuity and structural integrity under strong convective and complex weather conditions are more effectively recovered, indicating the suitability of LKA for high-resolution reconstruction of large-scale radar reflectivity fields. The LKA structure is illustrated in Figure 5.
Figure 5.
LKA network structure. LKA expands the receptive field by combining pointwise, depthwise, and dilated depthwise convolutions. The resulting attention map is applied to the input feature via element-wise multiplication to enhance global spatial perception with low computational cost.
2.5.2. Spatially Adaptive Feature Modulation
In radar reflectivity field reconstruction, echo structures are characterized by pronounced spatial heterogeneity and multi-scale feature distributions, with echo morphology varying markedly across spatial scales under strong convective and complex weather conditions. A lightweight Spatial Adaptive Feature Modulation (SAFM) mechanism is therefore introduced at the feature modeling stage, through which the perception of multi-scale spatial structures and boundary variations is enhanced.
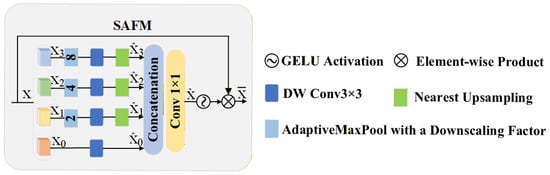
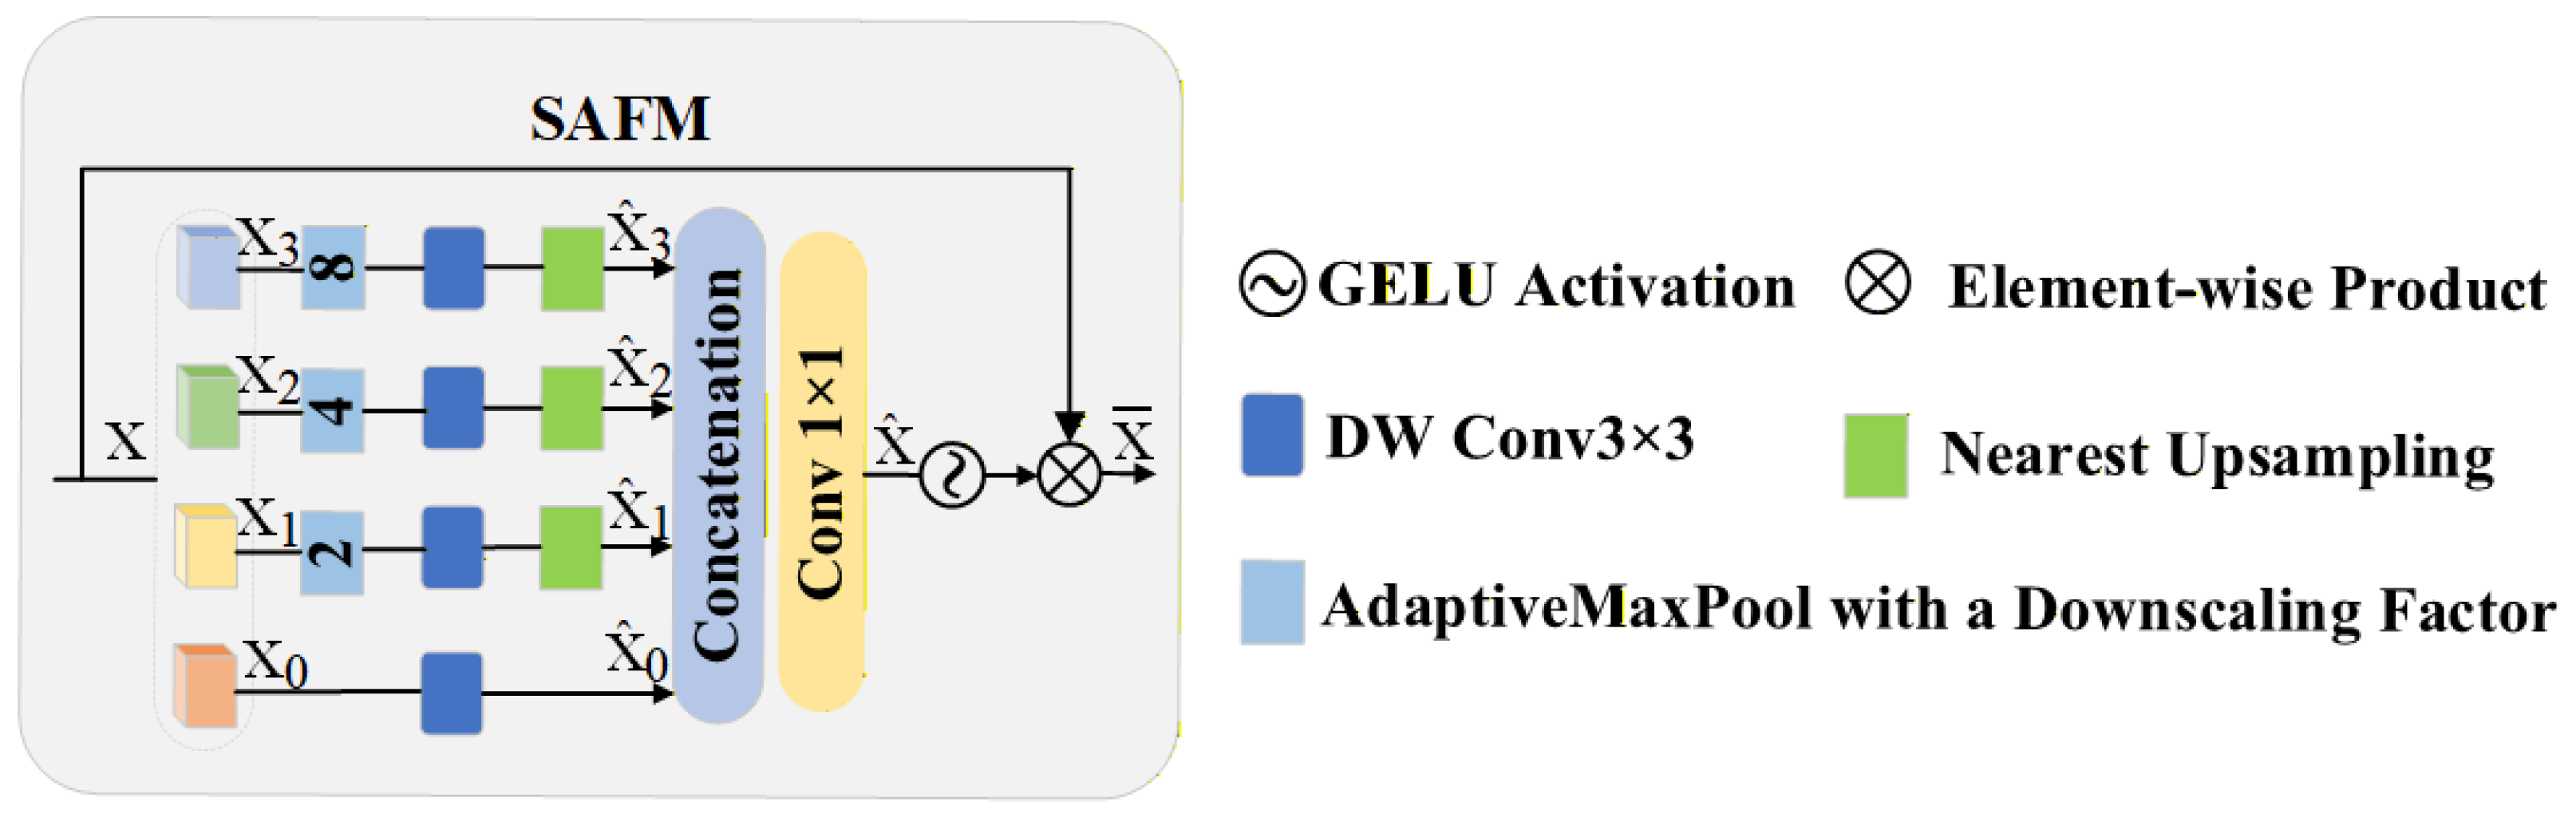
The SAFM module receives intermediate feature maps produced by the feature fusion stage, in which basic spatial information of radar echoes is already embedded but multi-scale structural representation remains insufficient.As shown in Figure 6,the input features are grouped and processed in parallel at multiple spatial scales, allowing both local strong-echo details and broader weather system structures to be effectively modeled within a unified framework.
Figure 6.
SAFM network structure. The SAFM module enhances global spatial dependency modeling through multi-scale feature interaction. Different downscaled feature branches are extracted via depthwise 3 × 3 convolution and Adaptive Max Pool, followed by nearest-neighbor upsampling and concatenation. The fused features are modulated through a 1 × 1 convolution and GELU activation, and then adaptively re-weighted via element-wise multiplication with the original input. This lightweight design enables effective recovery of fine-scale radar structures while maintaining computational efficiency.
Features extracted at different scales are subsequently fused and adaptively weighted via spatial modulation, by which responses from structurally important regions are emphasized while background noise and redundant information are suppressed. As a result, discrimination capability is improved in echo boundary regions and areas with abrupt structural changes.
After normalization, the input features are first divided into four sub-components in the channel dimension. The first group of sub-features is directly processed by a 3 × 3 depthwise convolution to extract local spatial responses. In contrast, the other three groups are first downsampled at different scales, then passed through convolutional operations, and finally upsampled back to the original resolution to form multi-scale spatial responses. Adaptive max pooling operations are introduced in each scale-specific path. These operations allow different branches to exhibit greater response diversity and spatial discriminability to further enhance spatial modulation capability. Subsequently, the feature maps from all scales are concatenated along the channel dimension and fused using a 1 × 1 convolution, thereby completing the integration of cross-scale feature information.
Through multi-scale modeling and spatial modulation, the SAFM module outputs feature representations with enhanced structural expressiveness, leading to improved spatial consistency and continuity in radar reflectivity reconstruction, with limited additional computational and storage overhead. This design is well suited to multi-band joint reconstruction scenarios, in which discrepancies in spatial resolution and structural representation across radar frequency bands need to be mitigated.
2.5.3. Blueprint Separable Convolutional Channel Mixer
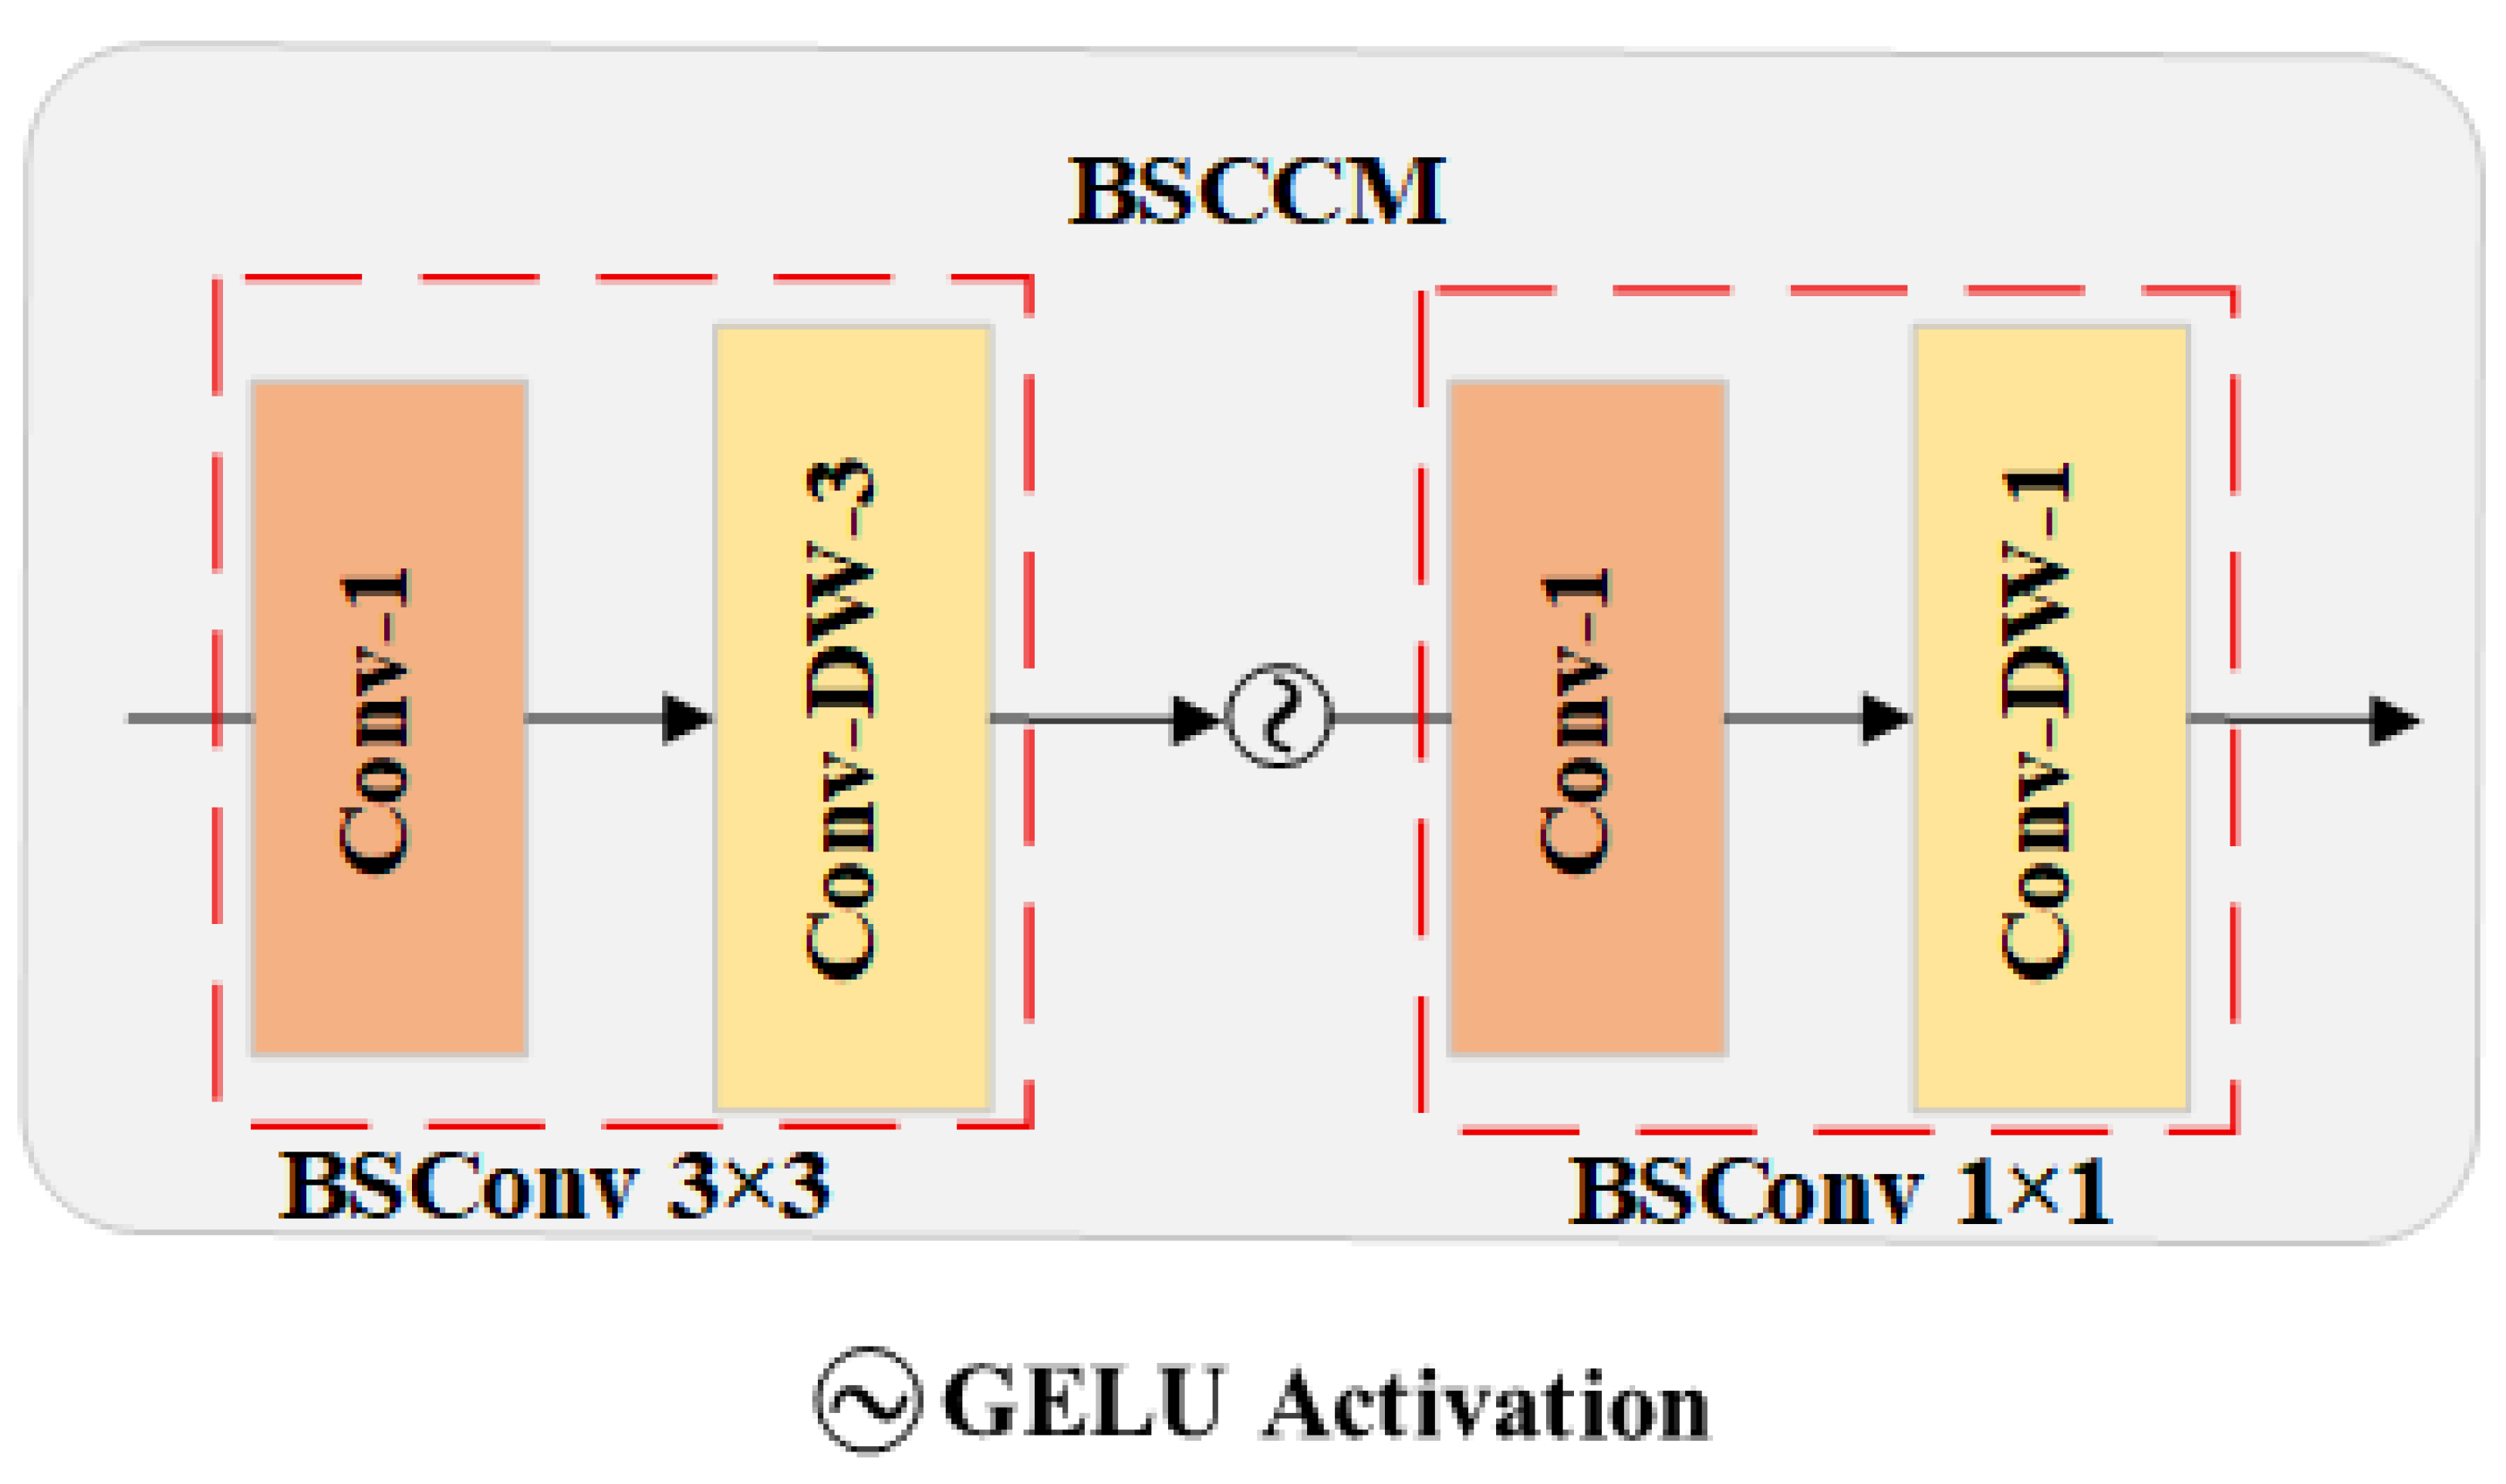
In joint reconstruction of multi-source radar data, substantial differences exist between S-band and X-band observations in spatial resolution and physical characteristics, which are especially evident in the modeling of reflectivity factor . Accurate reconstruction requires not only global representation of large-scale weather systems but also refined characterization of echo boundaries, small-scale targets, and local structural variations. A Structured Channel Hybrid Module (BSCCM) is therefore incorporated alongside the global modeling component, through which local spatial features and inter-channel coupling relationships are more effectively captured.
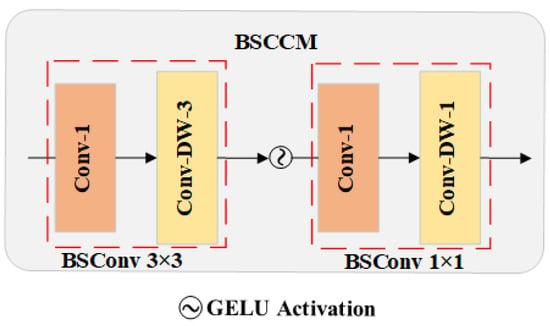
The BSCCM module operates on spatially modulated fused features that already contain global structural information but remain limited in local detail representation. As shown in Figure 7, the input features are progressively processed using structured convolution, where local spatial context is first enhanced, followed by feature compression and fusion along the channel dimension, enabling collaborative modeling of spatial and channel information.
Figure 7.
BSCCM network structure. BSCCM performs channel and spatial feature modeling in a decoupled manner using two sequential Blueprint Separable Convolution () blocks. Each block consists of a pointwise convolution () followed by a depthwise convolution (), accompanied by GELU activation. The first BSConv block adopts a 3 × 3 spatial kernel to refine local structural cues, while the second BSConv block employs a 1 × 1 kernel to enhance channel-wise interactions. This lightweight design improves structural representation of radar reflectivity while reducing computational cost compared with standard convolution-based channel mixing.
Lightweight structured convolutional units are employed during this process, allowing spatial modeling and channel hybridization to be decoupled. As a result, local gradient variations, boundary continuity, and complementary relationships between different frequency-band features in the radar reflectivity field are more efficiently captured. The module outputs structure-aware feature representations, which are subsequently used to refine local structures and edge details in high-resolution reflectivity reconstruction.
Overall, local structural characterization and channel dependency modeling are enhanced by the BSCCM module with limited computational overhead. When combined with spatial modulation mechanisms, reconstruction performance is further improved for small-scale targets, complex echo boundaries, and high-frequency details in multi-band radar joint reconstruction tasks.
3. Results
3.1. Model Performance Analysis
3.1.1. Experimental Setup
For a fair comparison, we selected two representative methods as baselines. The EDSR [35] is a classic deep learning-based super-resolution network, which is widely used for image reconstruction tasks. SAFMNPP [36] is a model designed for spatial resolution enhancement. Both methods were adopted as baseline approaches for a performance comparison in this study.
The performance of the super-resolution models was comprehensively evaluated for radar reflectivity reconstruction using a unified dataset split and a consistent experimental setup. All comparative models were trained and tested under the same protocol, with the Adam optimizer employed during training for every model. Network parameters were updated with an initial learning rate of and a batch size of 32, by which training stability was ensured while a balance between convergence speed and computational efficiency was maintained.
In the design of loss function, the Mean Squared Error (MSE) loss was chosen as the primary training objective, through which the pixel-level discrepancies between reconstructed results and ground-truth high-resolution radar reflectivity were quantitatively characterized. As one of the most widely used loss functions in image reconstruction and super-resolution tasks, MSELoss minimizes the squared difference between predicted values and reference data, effectively reducing overall reconstruction error and improving numerical consistency. Its mathematical formulation is given as follows:
where denotes the ground-truth radar reflectivity value, represents the predicted pixel value, and N denotes the number of samples. This loss function evaluates the model’s performance at the pixel level by summing the squared differences between predictions and ground truth. The objective is to minimize this loss to improve the accuracy and consistency of reconstructed radar reflectivity at the data level.
3.1.2. Comparison of Different Model
Three evaluation metrics were employed to assess model performance: Peak Signal-to-Noise Ratio (), Structural Similarity Index () [37], and Mean Absolute Error (). These metrics were used to measure the effectiveness of the super-resolution reconstruction model.
is used to measure the error between the reconstruction result and the real data. The formula is as follows:
where represents the maximum reflectivity value of the data, MSE is the mean squared error between the reconstructed data and the true high-resolution data , and m and n represent the height and width of the data, respectively. The higher PSNR value indicates better reconstruction performance, whereas a lower value reflects greater reconstruction error. The Peak Signal-to-Noise Ratio (), as it primarily measures pixel-level errors, tends to overlook the structural information present in radar reflectivity data. Therefore, its standalone use may be limited when applied to structurally complex datasets.
The Structural Similarity Index () was introduced to align more closely with human visual perception in evaluating structural fidelity. The calculation formula of is as follows:
where x and y represent the reconstructed data and the real data, respectively, and are their respective means, and are their respective variances, and is the covariance. and are constants used to stabilize the calculation. The value range of is usually between [0, 1]. The closer the value is to 1, the better the structural similarity.
In addition, the Mean Absolute Error () was further introduced as an evaluation metric. MAE is capable of intuitively reflecting the absolute error between the reconstructed results and the ground-truth data at each pixel. The calculation formula is as follows:
where and represent the values of the real data and the reconstructed data at position , respectively. The smaller the MAE value, the lower the reconstruction error and the better the detail recovery ability.
The reconstruction performance under different input configurations is quantitatively compared using these metrics. The experimental results are shown in Table 2, where all metrics are calculated on the validation set, enabling a fair assessment of the contribution of dual-band fusion.
Table 2.
Comparison of quantitative results with different models.
The quantitative performance of EDSR, SAFMNPP, and D-SRFNet in radar echo super-resolution reconstruction is compared in Table 2. Relatively low PSNR and SSIM values are obtained by EDSR, which is commonly regarded as a classical baseline model, indicating limited capability in reconstructing complex radar echo structures. Improvements in both PSNR and SSIM are observed for SAFMNPP, suggesting that reconstruction quality is enhanced through its multi-scale feature extraction mechanism.
The best performance across all three evaluation metrics is achieved by D-SRFNet, with PSNR reaching 30.84 dB, SSIM reaching 0.8755, and the lowest MAE of 0.024178. These results demonstrate significant advantages in reconstruction accuracy, structural consistency, and error control, through which the spatial structure and intensity distribution of high-resolution radar echoes are more effectively recovered.
3.1.3. Different Model Performance Evaluation
Qualitative visual comparisons are conducted using several representative heavy to torrential rainfall cases, in order to intuitively assess the super-resolution reconstruction performance of different models under realistic precipitation conditions. The selected examples cover distinct precipitation structures commonly observed in weather radar data, including organized convective rainbands, broad stratiform precipitation, and complex convective systems with strong spatial heterogeneity. These scenarios pose increasing challenges for super-resolution reconstruction, as they involve sharp intensity gradients, large-scale structural continuity, and fine-scale echo details simultaneously.
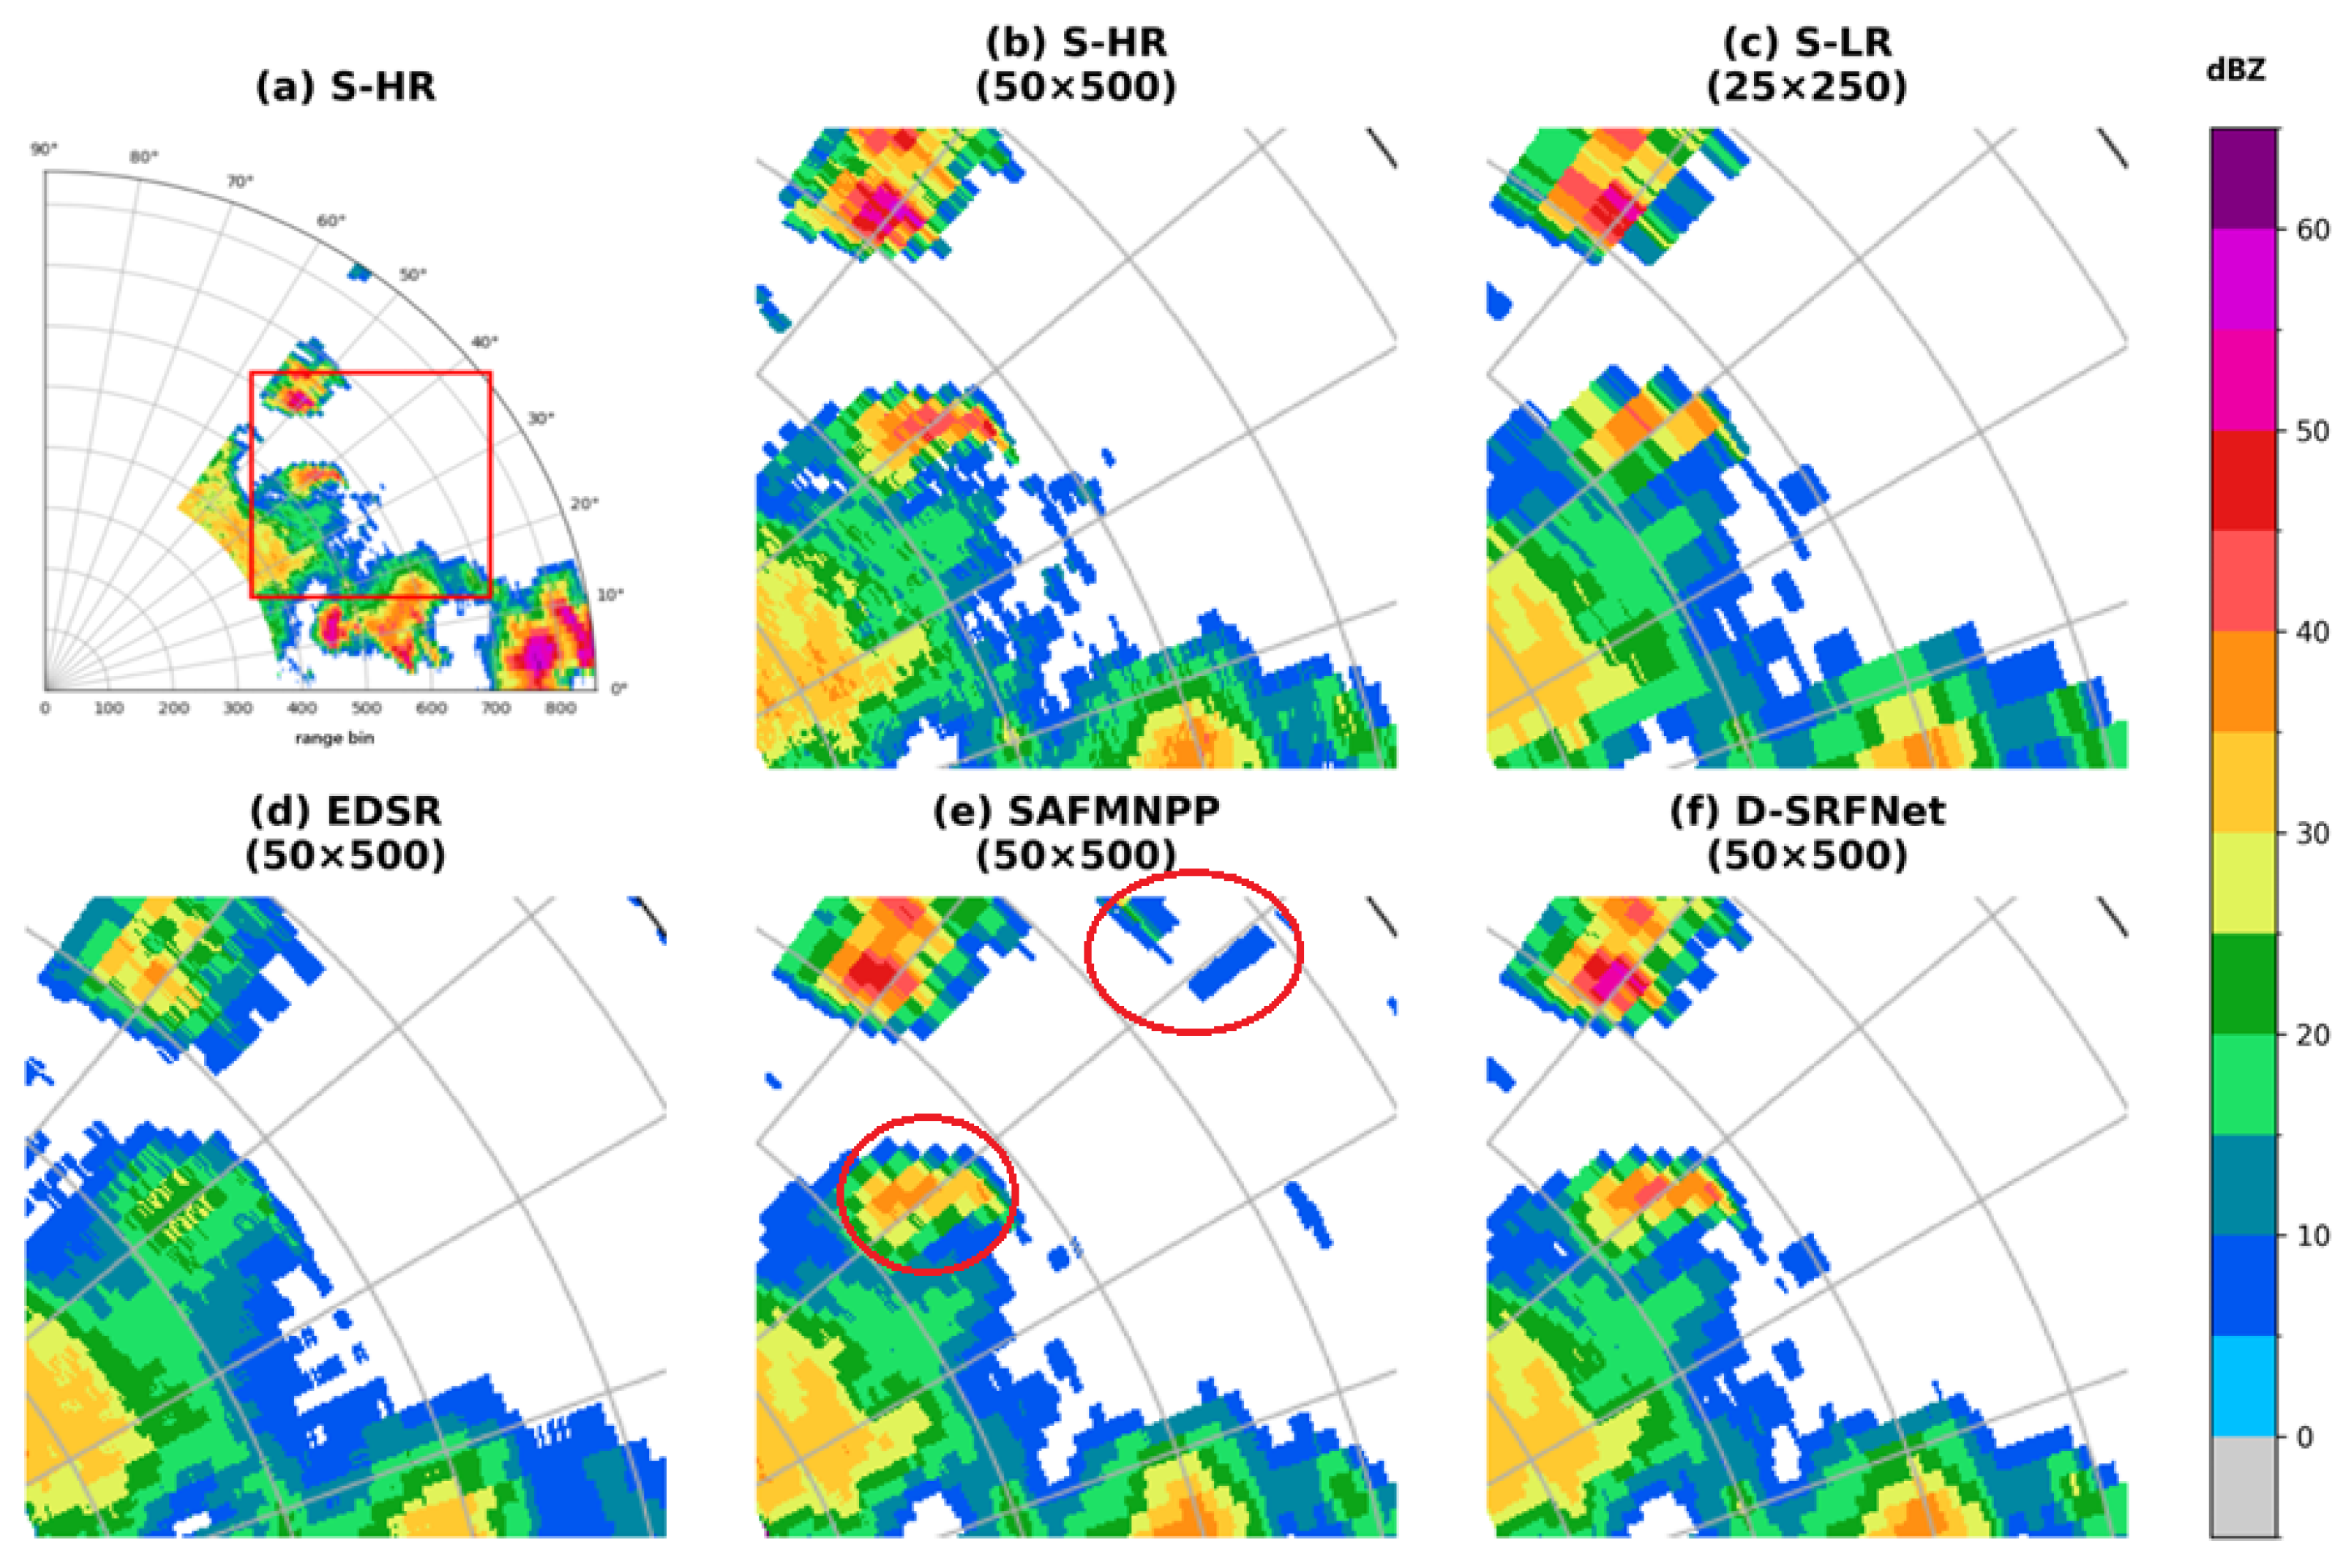
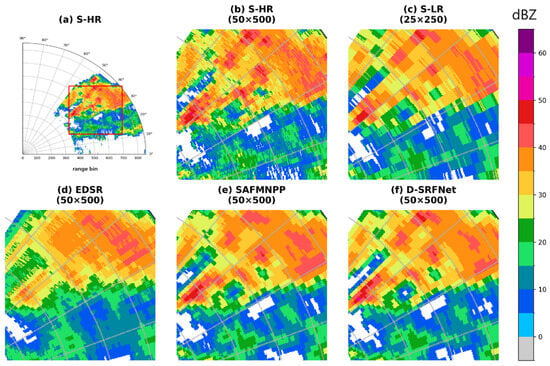
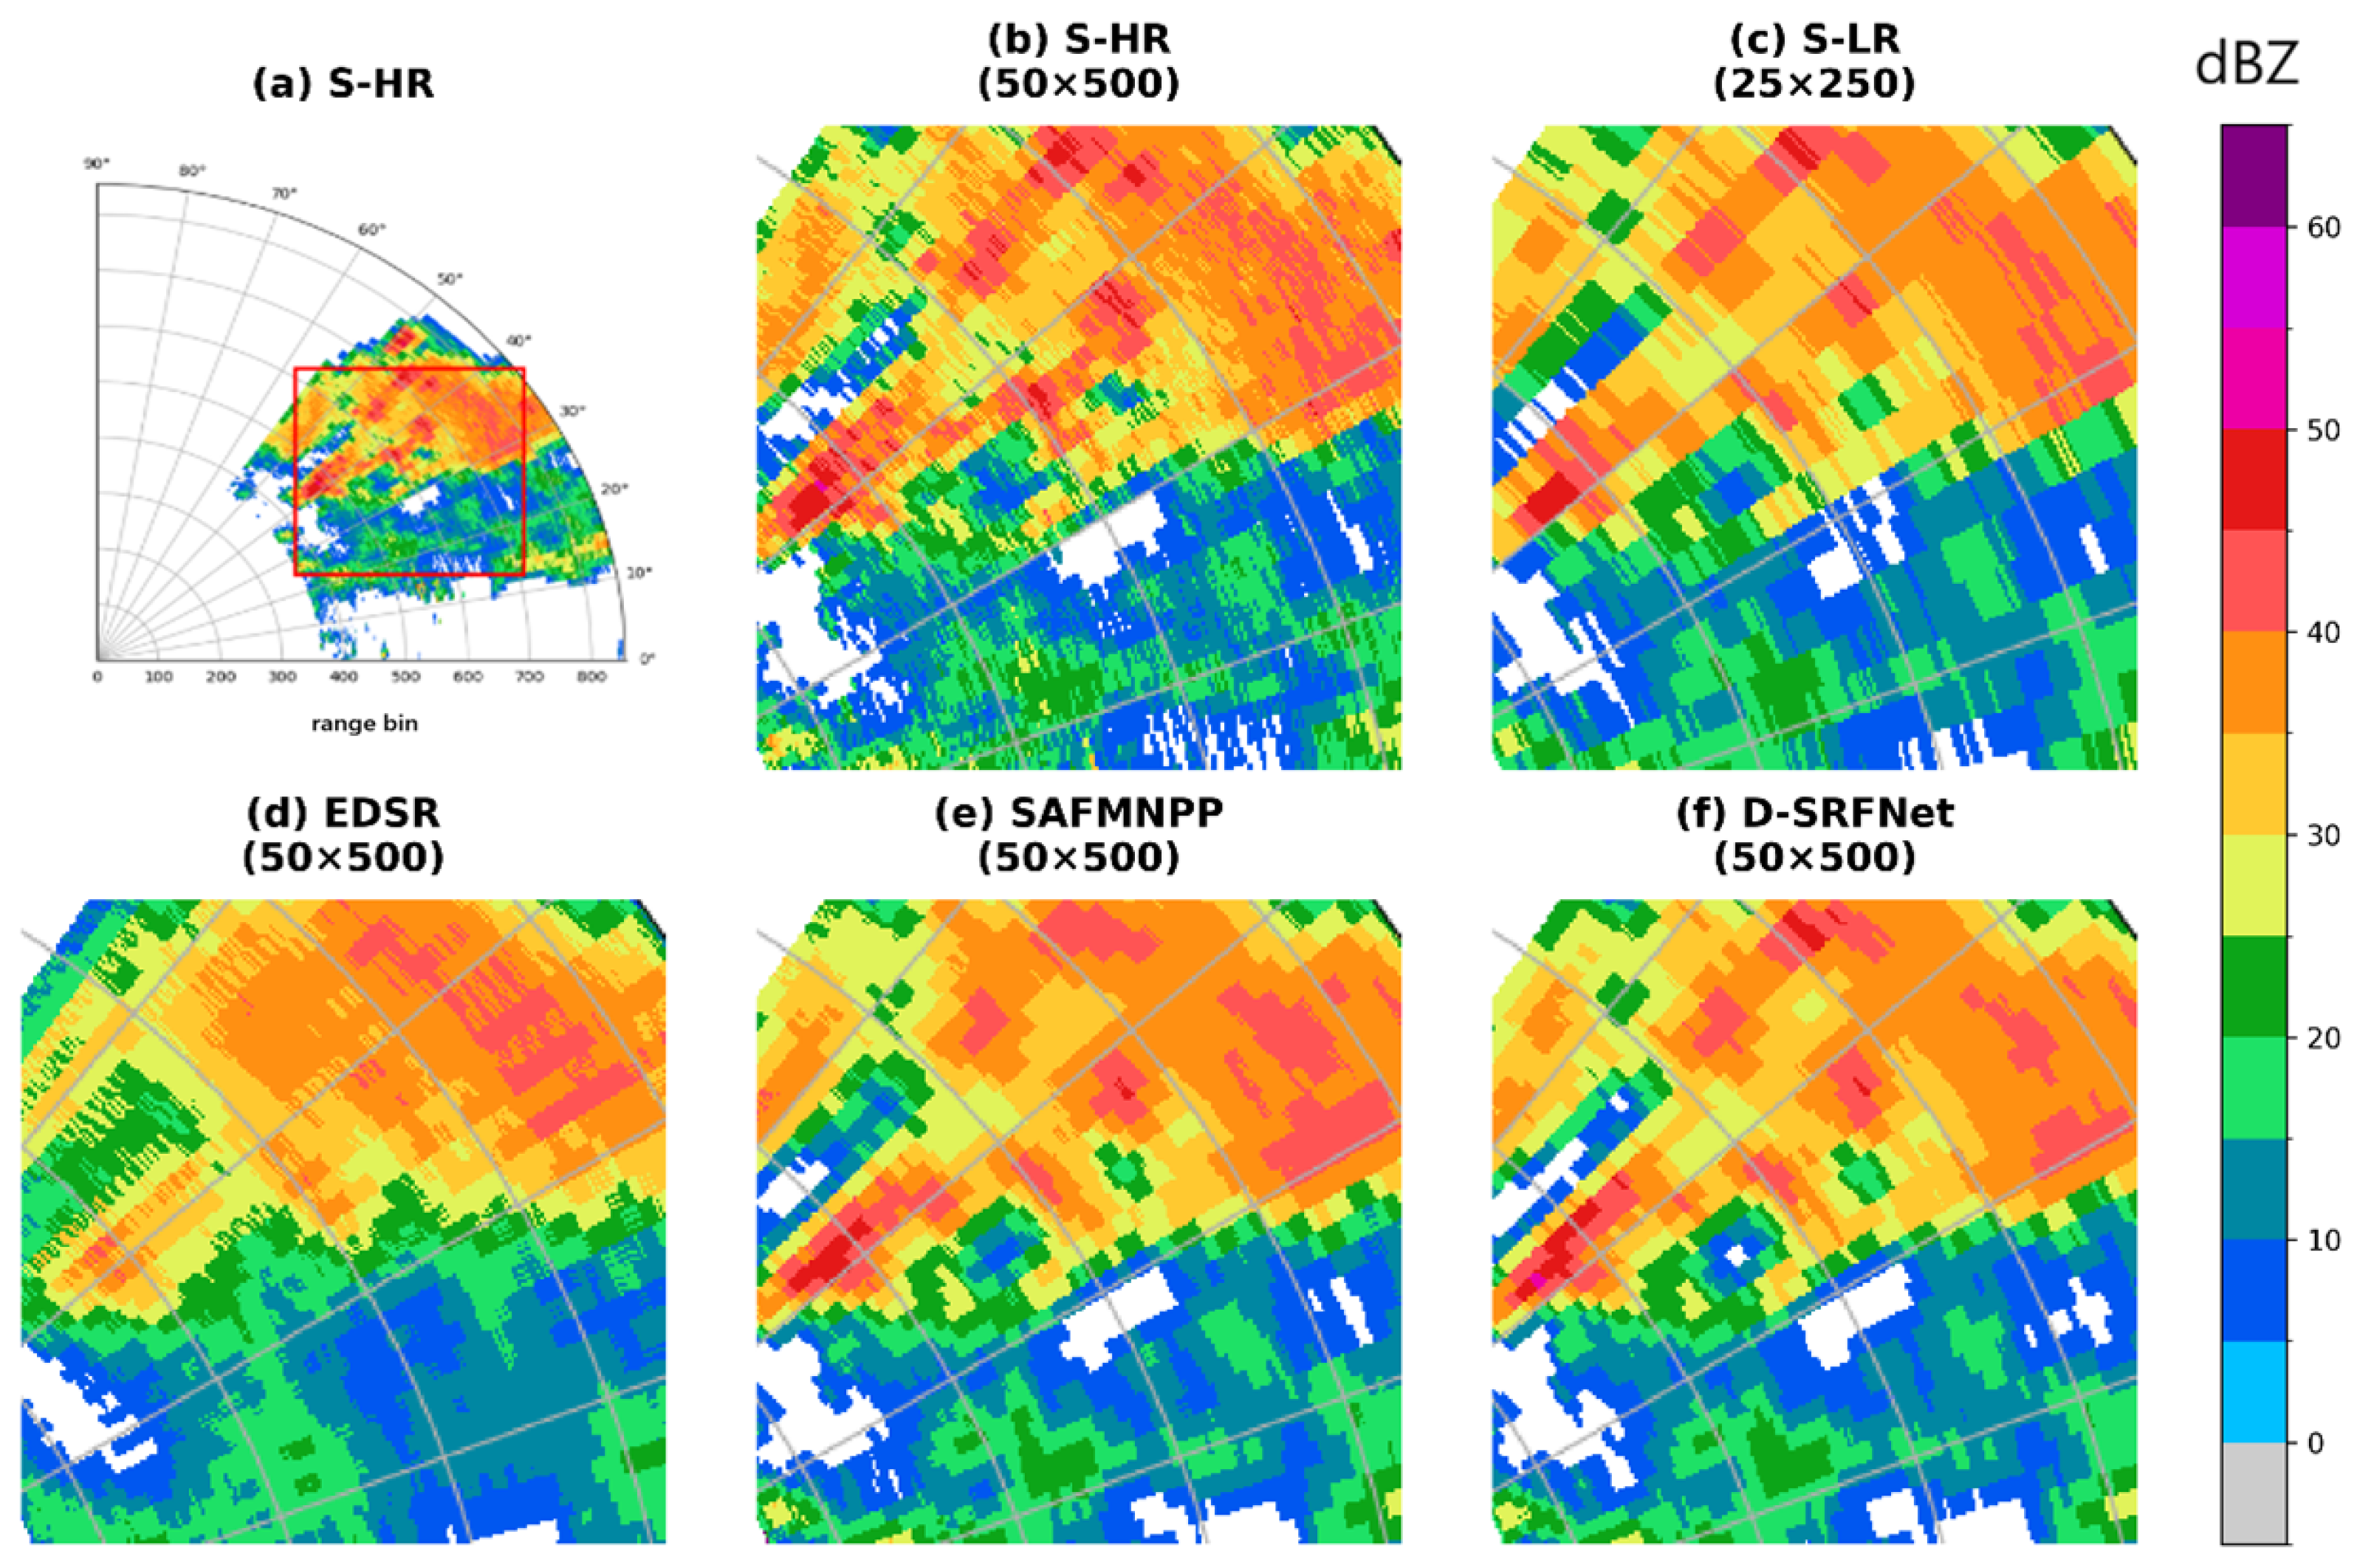
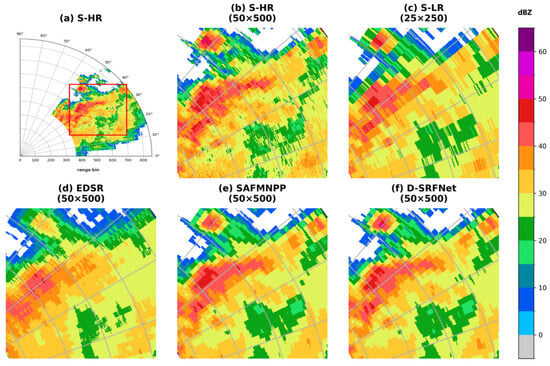
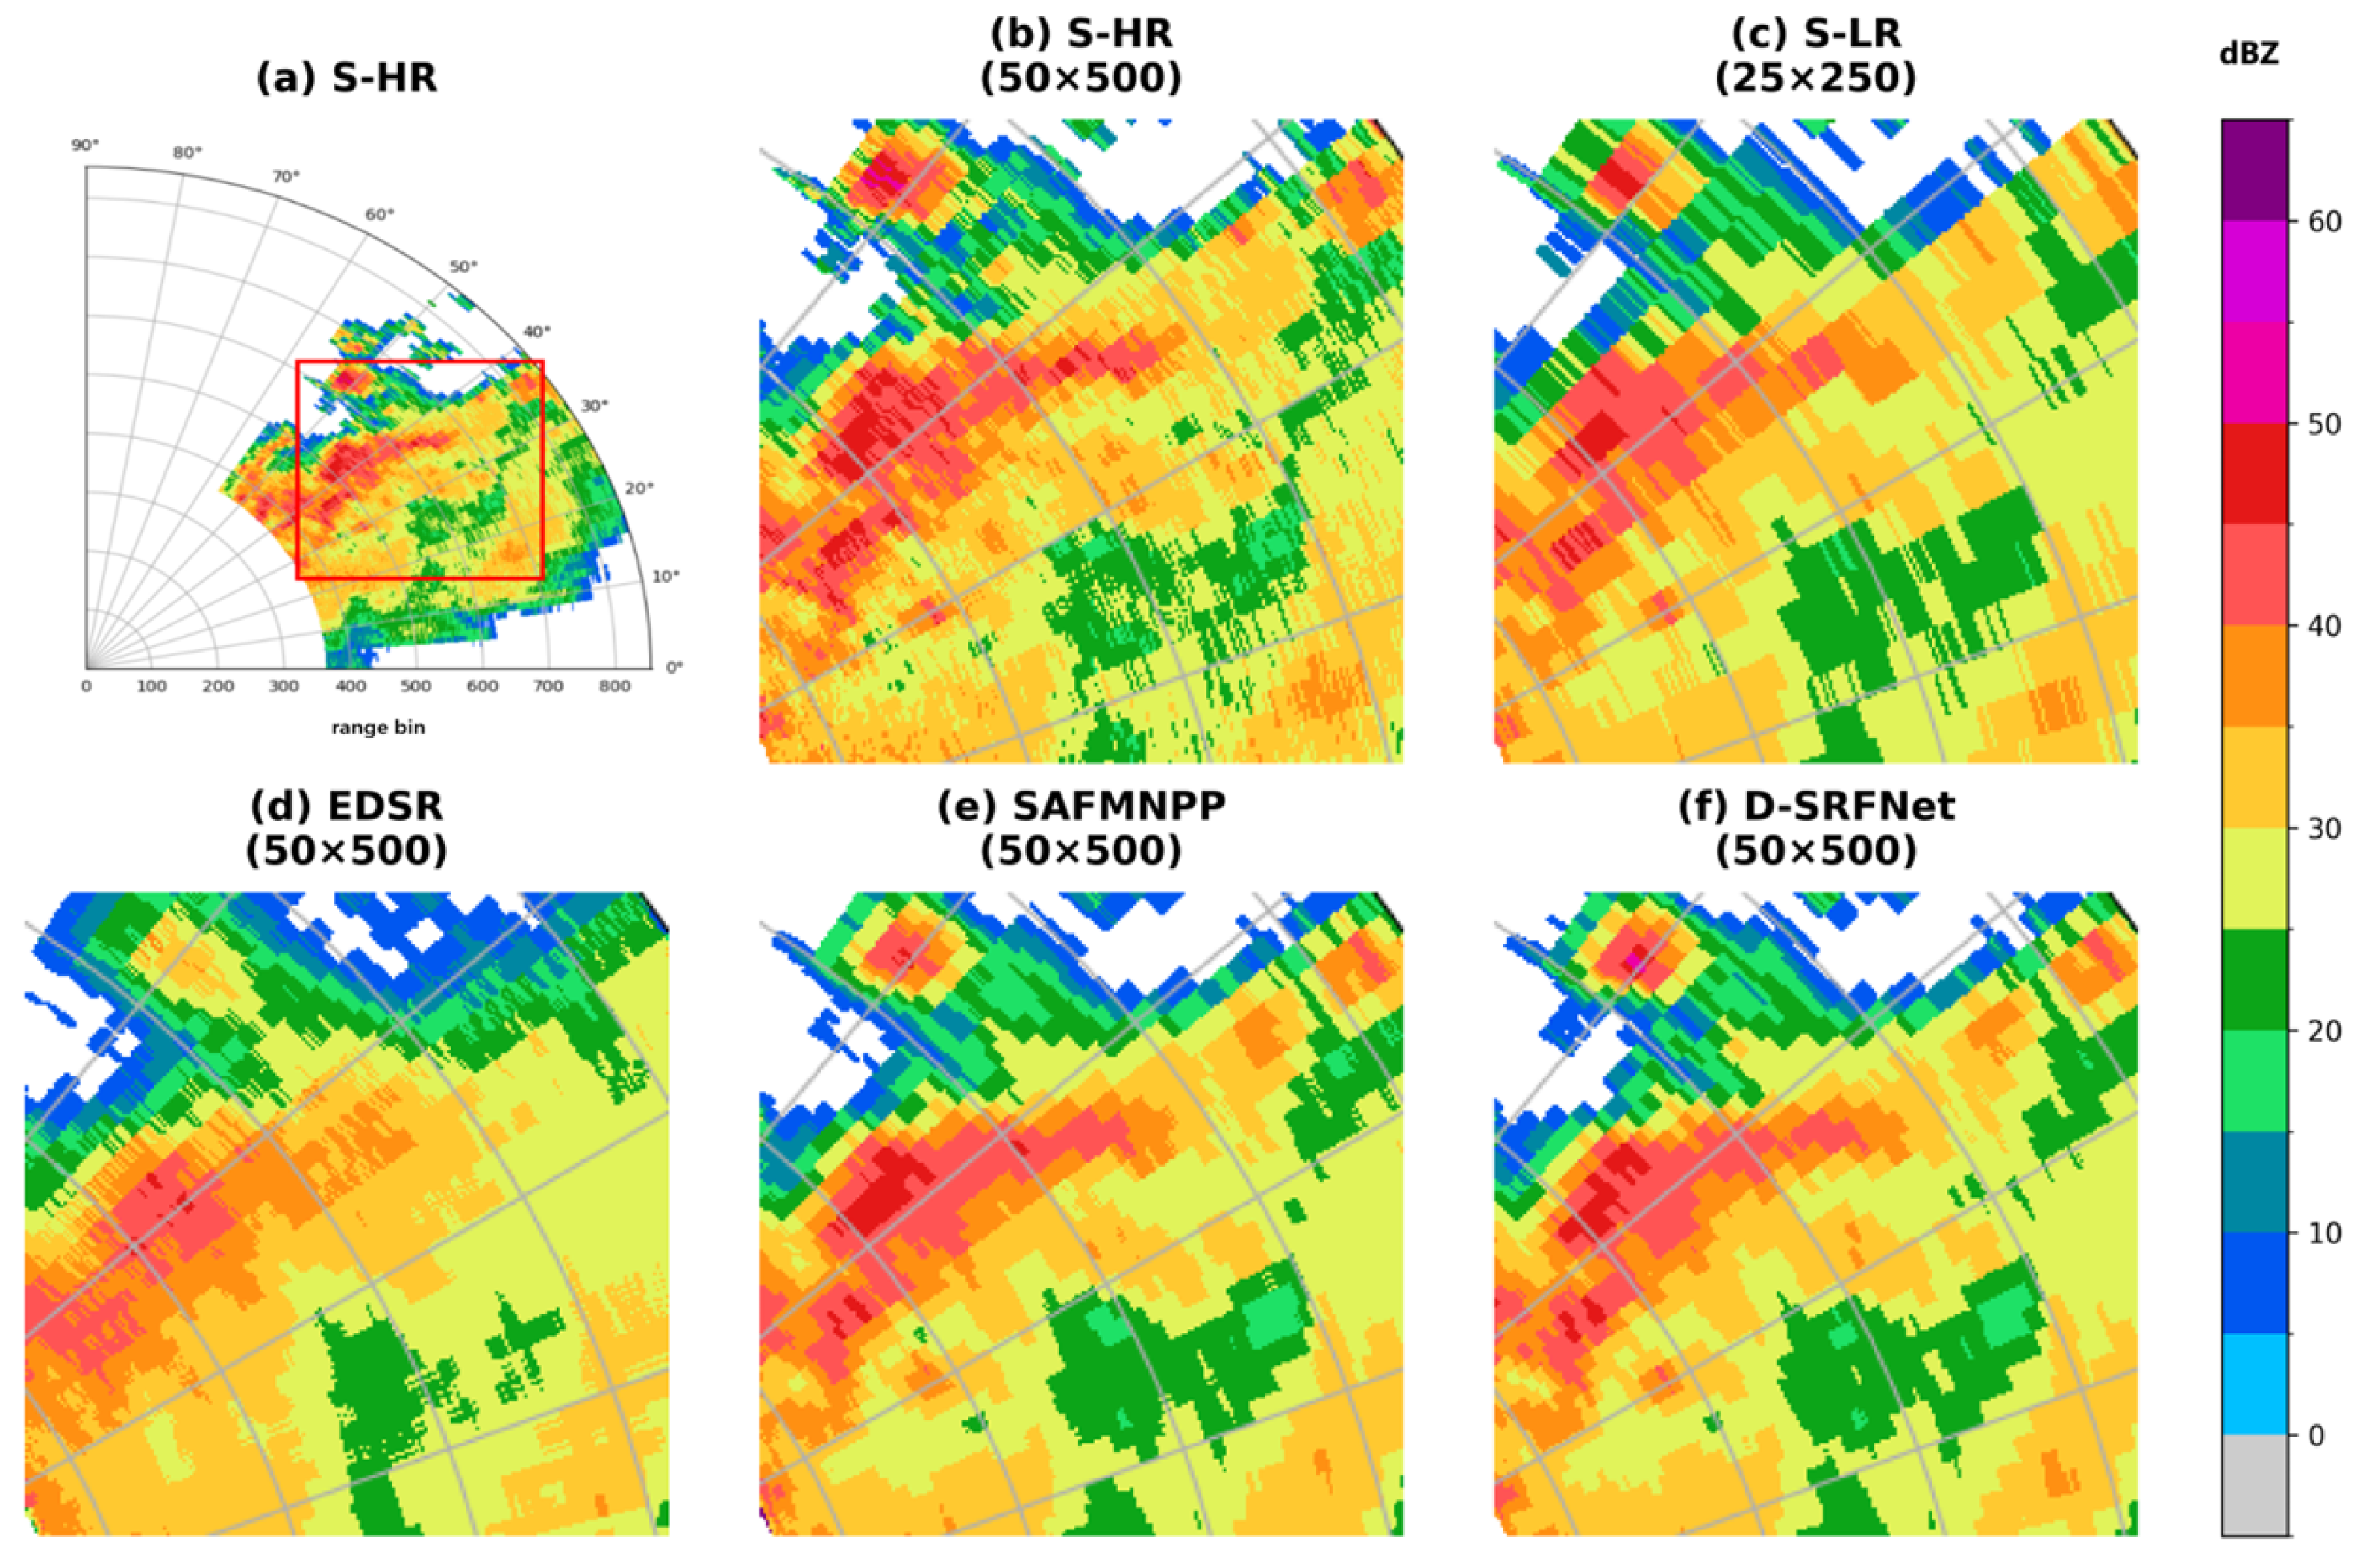
The reconstruction results obtained under different input configurations and super-resolution models are presented in Figure 8, Figure 9 and Figure 10, where the ability of each method to recover echo morphology, boundary continuity, and local structural details is visually compared.
Figure 8.
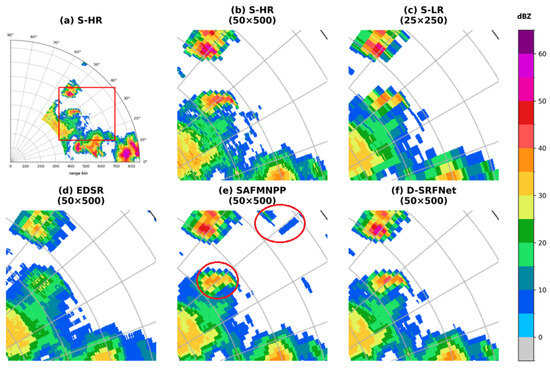
Visual comparison of S-band radar reflectivity reconstruction results (0.5° elevation) for an organized convective rainband with embedded strong echo cores under heavy to torrential rain conditions (2023-06-10T09:21:47); (a) original S-band high-resolution reflectivity (50 × 500); (b) S-HR (local cropped input, 50 × 500); (c) S-LR (downsampled input, 25 × 250); (d) EDSR reconstruction (50 × 500); (e) SAFMNPP reconstruction (50 × 500); (f) D-SRFNet reconstruction (50 × 500).
Figure 9.
Visual comparison of S-band radar reflectivity reconstruction (0.5° elevation) for a stratiform precipitation case dominated by large-scale continuous echoes and gradual intensity variations (2023-07-16T18:19:57); (a) original S-band high-resolution reflectivity (50 × 500); (b) S-HR (local cropped input, 50 × 500); (c) S-LR (downsampled input, 25 × 250); (d) EDSR reconstruction (50 × 500); (e) SAFMNPP reconstruction (50 × 500); (f) D-SRFNet reconstruction (50 × 500).
Figure 10.
Visual comparison of S-band radar reflectivity reconstruction (0.5° elevation) for a complex convective system featuring echo cavities and strong spatial heterogeneity (2023-07-16T22:01:20); (a) original S-band high-resolution reflectivity (50 × 500); (b) S-HR (local cropped input, 50 × 500); (c) S-LR (downsampled input, 25 × 250); (d) EDSR reconstruction (50 × 500); (e) SAFMNPP reconstruction (50 × 500); (f) D-SRFNet reconstruction (50 × 500).
As shown in Figure 8, the precipitation system is characterized by an organized convective rainband with embedded strong reflectivity cores and pronounced intensity gradients. In the downsampled S-LR input, fine-scale structures within the convective cores are severely degraded, and echo boundaries appear blurred. The locally cropped S-HR input preserves part of the high-intensity information but fails to maintain the spatial continuity of the rainband structure.
Among the reconstruction models, EDSR partially restores the overall intensity distribution; however, significant smoothing effects are observed, leading to weakened convective cores and discontinuous echo boundaries. SAFMNPP improves the delineation of the rainband structure and enhances core intensity to some extent, yet local artifacts and residual discontinuities remain (the red-circled region in Figure 8). In contrast, D-SRFNet produces reconstruction results that closely resemble the original high-resolution observations, with compact strong echo cores, sharper boundaries, and improved continuity along the rainband, demonstrating superior capability in recovering organized convective structures.
As shown in Figure 9, this case corresponds to a broad stratiform precipitation system dominated by large-scale continuous echoes and gradual intensity variations. In the S-LR input, spatial smoothing leads to the loss of subtle reflectivity gradients, while the S-HR local input retains limited structural detail but lacks global consistency.
The EDSR reconstruction shows noticeable over-smoothing, particularly in regions with weak-to-moderate reflectivity, resulting in flattened intensity distributions. SAFMNPP better preserves the large-scale stratiform structure and partially restores intensity gradients, although local inconsistencies are still evident. The reconstruction generated by D-SRFNet exhibits the most consistent spatial organization, with smoothly varying reflectivity fields and well-preserved gradient transitions, indicating enhanced performance in modeling large-scale continuous precipitation patterns.
As shown in Figure 10, the third case represents a complex convective system featuring strong spatial heterogeneity, echo cavities, and abrupt structural transitions. Such characteristics pose significant challenges for super-resolution reconstruction, particularly in maintaining boundary integrity and avoiding artificial filling of low-reflectivity regions.
In the EDSR results, echo cavities are partially filled and boundary regions appear fragmented, indicating limited discrimination between strong echoes and surrounding low-reflectivity areas. SAFMNPP improves the representation of non-uniform structures and preserves some cavity features, but residual noise and echo weakening persist. By comparison, D-SRFNet more accurately maintains the shape and location of echo cavities, while preserving sharp transitions between high- and low-reflectivity regions. The reconstructed reflectivity field demonstrates improved structural integrity and spatial realism under complex convective conditions.
Based on the visual comparisons across the three representative precipitation scenarios, consistent performance differences are observed among the evaluated super-resolution models. Conventional reconstruction approaches exhibit limitations in preserving fine-scale structures and maintaining spatial continuity, particularly under strong convective conditions and in regions with complex echo morphology. Improvements are achieved by multi-scale feature-based methods, which better restore large-scale precipitation patterns but still suffer from local smoothing and structural inconsistencies.
In contrast, the proposed D-SRFNet demonstrates superior capability in jointly preserving global echo organization and local structural details across all cases. Strong echo cores, stratiform continuity, and complex structural features such as echo cavities are more faithfully reconstructed, indicating robust performance under diverse and challenging weather conditions.
3.2. Sensitivity Analysis of Multi-Source Input
3.2.1. Dual-Band Radar Data Input Sensitivity Analysis Settings
A series of comparative experiments is conducted in this section to systematically analyze the impact of different X-band radar observation parameters on the super-resolution reconstruction performance of S-band radar. The network architecture, training strategy, and data partitioning scheme are kept identical across all experiments, and variations are introduced only in the combinations of X-band radar parameters used as inputs. By adopting this single-variable controlled experimental design, interference arising from differences in model structure and training configuration is effectively eliminated, allowing for a more objective evaluation to be conducted of the contributions made by individual radar physical parameters to the super-resolution reconstruction task.
The research focuses on investigating the influence of different X-band radar parameters on S-band super-resolution reconstruction, examining potential complementary relationships among these parameters, and evaluating whether reconstruction performance can be further improved through joint multi-parameter inputs. All experiments are performed using the same set of overlapping S- and X-band radar observations after spatiotemporal alignment and spatial gridding, with identical training, validation, and testing splits applied to ensure result comparability. Under the condition that the low-resolution S-band input remains unchanged, different X-band observation parameters are progressively incorporated to construct single-parameter and multi-parameter fusion schemes for a comparative analysis.
Multiple polarimetric variables provided by X-band dual-polarization weather radar are considered, as these parameters describe precipitation characteristics from different physical perspectives. The reflectivity factor () is included as a fundamental parameter characterizing the size distribution and concentration of hydrometeors, serving as the primary descriptor of radar echo intensity and spatial structure. The differential reflectivity () is employed to represent information related to particle shape and orientation, which is informative for distinguishing precipitation types and capturing fine-scale structural variations. In addition to polarimetric variables, Doppler-based parameters are also incorporated to explore their potential contribution to S-band super-resolution reconstruction. The radial velocity (V) is included to provide dynamical information associated with airflow patterns and wind shear, which may indirectly reflect the organization and evolution of precipitation systems. The spectrum width (W) is considered to describe turbulence intensity and velocity dispersion within radar sampling volumes, offering supplementary information on echo variability and internal structural complexity. Furthermore, the differential propagation phase () and the specific differential phase () are incorporated, as these parameters are closely related to liquid water content and exhibit strong sensitivity in regions of intense precipitation.
Owing to the distinct physical meanings and complementary information content of these X-band radar parameters, their joint use is expected to enhance the recovery of fine-scale structures in S-band radar echoes. Therefore, multiple parameter combination schemes are designed, including both single-parameter inputs and multi-parameter fusion inputs, to systematically evaluate their respective contributions to super-resolution reconstruction performance.
Based on the experimental design described above, a set of X-band radar parameter combination schemes is constructed to evaluate their respective impacts on the super-resolution reconstruction of S-band radars. The specific configurations of S-band inputs, X-band parameter combinations, and corresponding experimental objectives are summarized in Table 3.
Table 3.
Experimental Design of X-Band Radar Parameter Combination ( = Reflectivity, = Differential Reflectivity, = Differential Phase, = Specific Differential Phase.)
As shown in the table, a baseline experiment without X-band input was first established as a reference, followed by a series of single-parameter experiments designed to examine independent contributions from different physical perspectives. On this basis, multiple dual-parameter and multi-parameter fusion schemes were further constructed by jointly incorporating complementary X-band variables, allowing us to conduct a systematic assessment of synergistic effects among intensity, phase, and microphysical parameters.
3.2.2. Comparison of Quantitative Results
Quantitative evaluation results are summarized in Table 4, where the super-resolution reconstruction performance under different X-band radar parameter input configurations is objectively compared based on the experimental design. Reconstruction accuracy, structural similarity, and error magnitude are evaluated using PSNR, SSIM, and MAE, through which the effects of single-parameter and multi-parameter inputs on S-band super-resolution reconstruction are systematically examined.
Table 4.
Comparison of quantitative results with different inputs. (Higher PSNR/SSIM and lower MAE indicate better performance).
These quantitative results provide an overall and objective comparison of reconstruction performance across different parameter combinations and serve as a reference for the subsequent qualitative visual analysis.
Quantitative results show that notable performance gains are achieved after X-band information is introduced, as indicated by the substantial increase in PSNR from 30.84 dB in the baseline setting (E0) to values above 34 dB in all configurations with X-band inputs. The highest PSNR is obtained by the multi-parameter configuration that combines and (E7), where PSNR reaches 35.55 dB, suggesting that reconstruction fidelity is further improved when complementary information is provided through joint inputs.
Structural similarity measured by SSIM is also improved in most cases, with the best SSIM achieved by the multi-parameter setting (E7) at 0.9386. Among single-parameter inputs, the highest SSIM is obtained when is used (0.9102 in E5), while SSIM values close to 0.89–0.90 are achieved by (E1), V(E2), and W(E3). A decrease in SSIM is observed when is used as the single X-band input (0.8660 in E4), which indicates that structural consistency is not uniformly improved across all parameter choices even though PSNR is increased.
Error magnitude reflected by MAE exhibits a pronounced split across configurations. Very low MAE values on the order of are obtained in E1 and E7, with the lowest MAE achieved by the multi-parameter configuration (0.000307 in E7), while a similarly low MAE is also obtained by the -based setting (0.000388 in E4). In contrast, MAE values on the order of are produced by the configurations using V, W, , and as single-parameter inputs (E2, E3, E5, and E6), indicating that reconstruction errors are reduced to different extents depending on the parameter being introduced. Overall, the best and most balanced performance across PSNR, SSIM, and MAE is achieved by the joint-input configuration + (E7), where reconstruction fidelity, structural consistency, and error control are improved simultaneously.
3.2.3. Subjective Performance Evaluation
Subjective visual analysis is subsequently conducted using representative precipitation cases, through which intuitive insight into spatial reconstruction characteristics is provided and the quantitative evaluation results are further interpreted. Visual comparisons are performed with emphasis being placed on differences in echo morphology, boundary continuity, and fine-scale structural details under different X-band parameter input configurations.
This qualitative assessment is used to complement the quantitative metrics, as spatial features and reconstruction behaviors that are difficult to be fully captured by numerical indicators alone can thus be revealed. The corresponding reconstruction results are presented in the following figures.
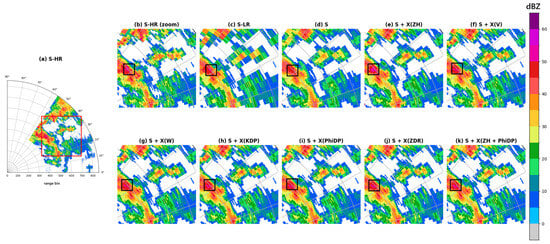
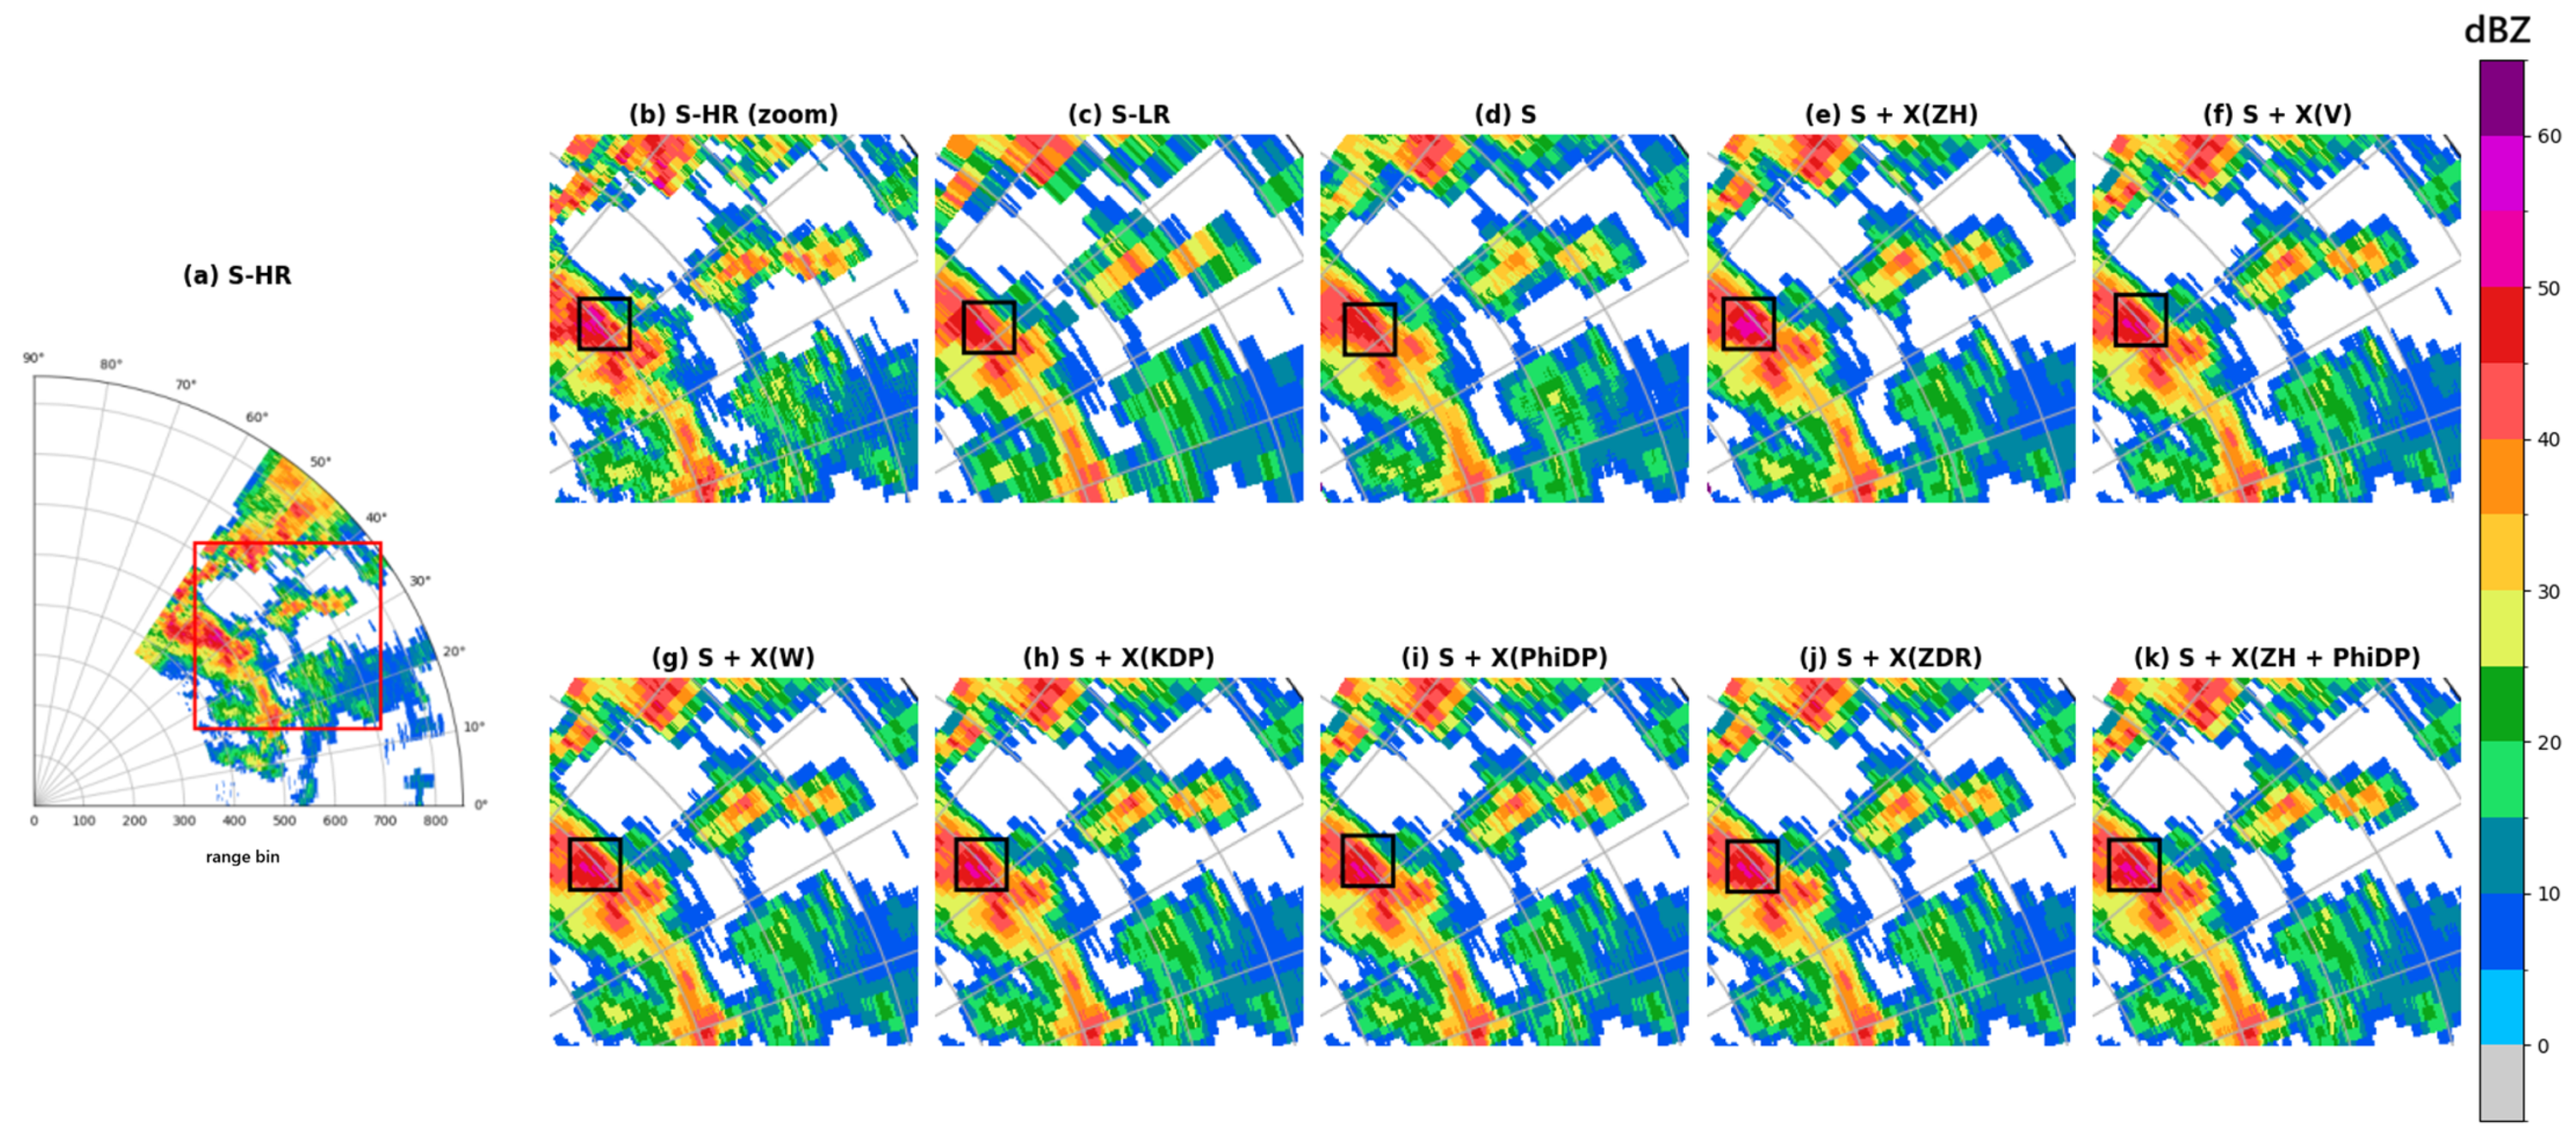
In Figure 11, the original high-resolution S-band reflectivity field is shown in subfigure (b), where the purple region enclosed by the black box corresponds to a strong echo core associated with intense convective precipitation. In subfigure (d), which represents the reconstruction obtained using S-band reflectivity only, the strong echo core is not recovered, indicating limited capability in reconstructing high-intensity echoes when only S-band information is provided.
Figure 11.
Visual comparison of S-band reflectivity super-resolution reconstruction under different X-band parameter inputs for a heterogeneous echo field with cavities. ((a) S-HR: Original high-resolution S-band radar reflectivity used as a reference. (b) S-HR (zoom): Zoomed-in view of the highlighted region, illustrating fine-scale echo structures in the reference field. (c) S-LR: Downsampled S-band reflectivity input, serving as the low-resolution baseline. (d) S: Reconstruction result obtained using S-band information only. (e) S + X(): Reconstruction result obtained using joint S-band and X-band reflectivity input. (f) S + X(V): Reconstruction result obtained using joint S-band reflectivity and X-band radial velocity input. (g) S + X(W): Reconstruction result obtained using joint S-band reflectivity and X-band spectrum width input. (h) S + X(): Reconstruction result obtained using joint S-band reflectivity and X-band specific differential phase input. (i) S + X(): Reconstruction result obtained using joint S-band reflectivity and X-band differential propagation phase input. (j) S + X(): Reconstruction result obtained using joint S-band reflectivity and X-band differential reflectivity input. (k) S + X( + ): Reconstruction result obtained using joint S-band reflectivity and multi-parameter X-band input).
In contrast, subfigure (e), corresponding to the joint input of S-band and X-band reflectivity, successfully restores the intensity of the strong echo core, with the region becoming clearly visible. This result demonstrates that X-band reflectivity provides effective complementary information for the reconstruction of strong echo regions. However, the recovered high-reflectivity area appears slightly larger than that in the reference field, suggesting a certain degree of over-enhancement in echo intensity reconstruction.
For other X-band parameter input configurations (subfigures (f)–(j)), partial recovery of the strong echo core is also observed, while the visual differences among these single-parameter schemes remain relatively small. The reconstruction results exhibit similar spatial patterns and echo morphology, with only limited variation in the extent and intensity of the recovered strong echoes. Among all configurations, the multi-parameter input shown in subfigure (k) provides slightly richer local structural details, although the overall enhancement remains relatively limited.
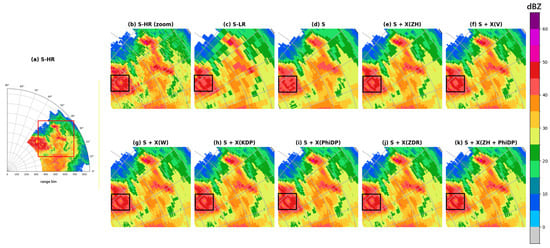
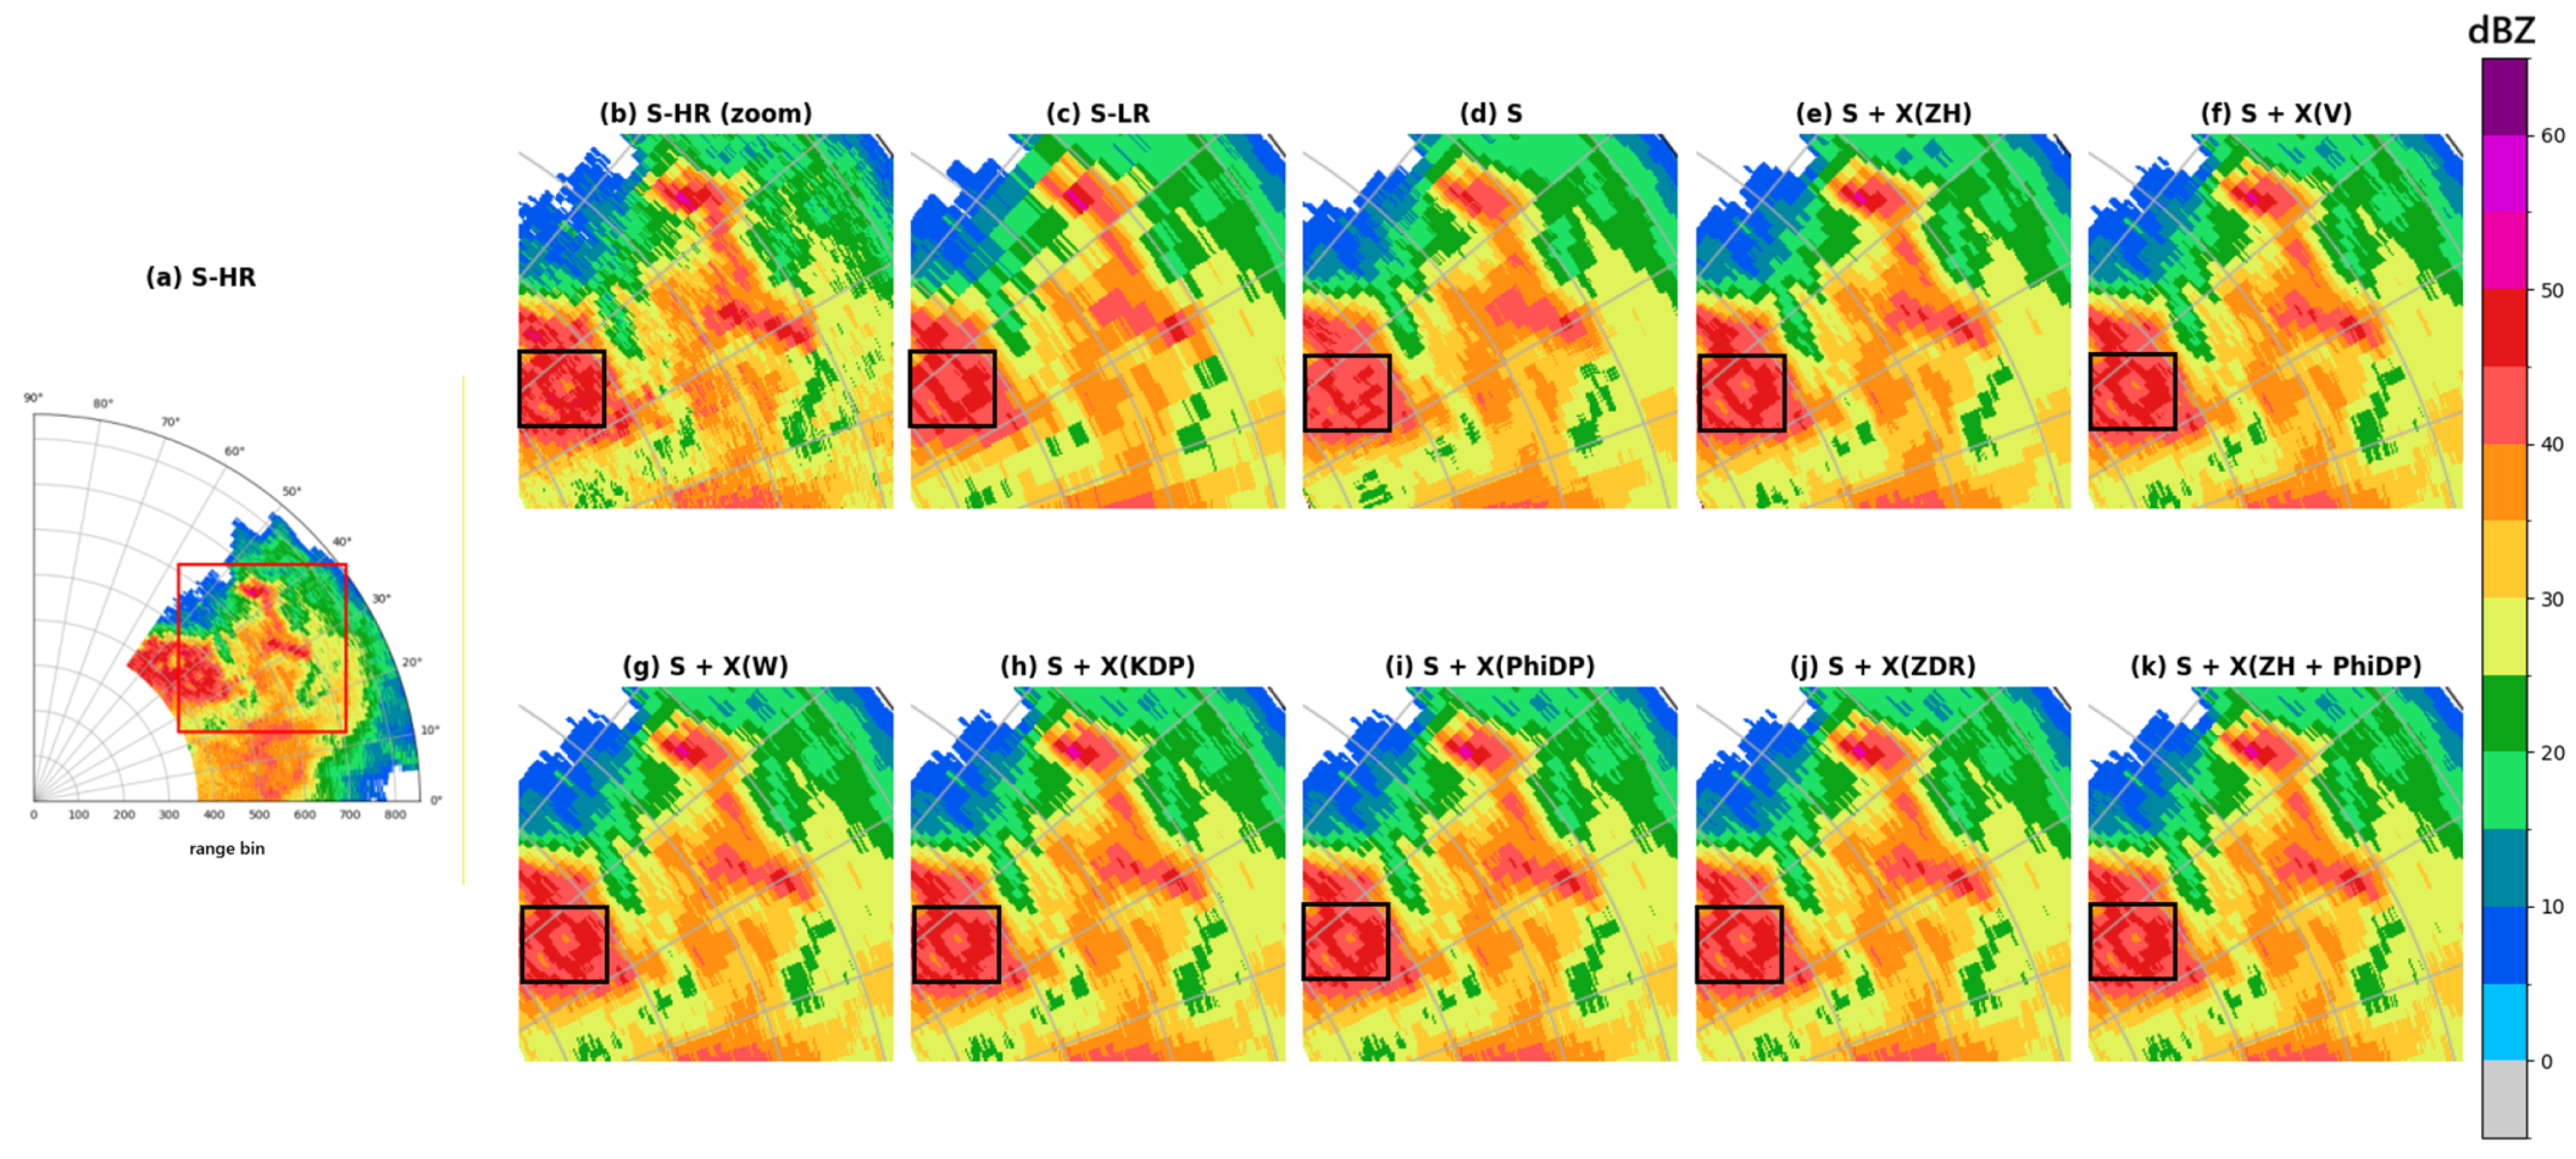
Figure 12 focuses on a large-scale heavy rainfall region characterized by complex echo boundaries. In subfigure (d), where reconstruction is performed using S-band reflectivity only, the recovered echo boundary deviates noticeably from the reference field, with blurred contours and reduced spatial continuity. This result highlights the limitation of single-band input in accurately representing complex boundary structures.
Figure 12.
As Figure 11 but for test set data. A visual comparison of S-band reflectivity super-resolution reconstruction under different X-band parameter inputs for a heavy-rain mixed-structure scene.
After incorporating X-band radar parameters, the reconstruction of echo boundaries is substantially improved. More specifically, in the configuration using the joint input of + , clearer boundary contours and enhanced spatial continuity are observed within the boxed region, indicating that X-band information plays an important role in constraining boundary geometry and improving structural consistency. Although the differences among various X-band input configurations are not pronounced, all of them yield more accurate and stable boundary reconstruction compared with the S-band-only result.
Based on the visual comparisons in Figure 11 and Figure 12, the incorporation of X-band radar parameters is shown to effectively enhance the spatial reconstruction capability of S-band reflectivity super-resolution. In regions dominated by strong echoes, X-band information facilitates the recovery of high-intensity cores; in heavy rainfall scenes with complex boundaries, it contributes to improved contour continuity and structural consistency. Single-parameter X-band input schemes consistently provide visual improvements, although the differences among individual parameters remain limited. Multi-parameter configurations achieve better performance in quantitative evaluations, while their advantages in subjective visual analysis are mainly reflected in subtle improvements in local detail representation and reconstruction stability.
3.2.4. Example
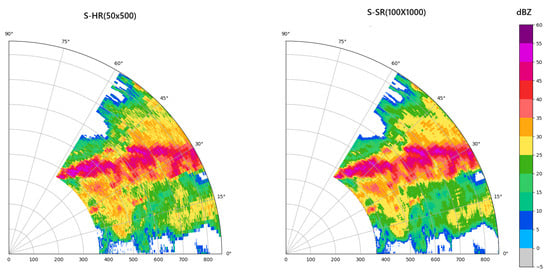
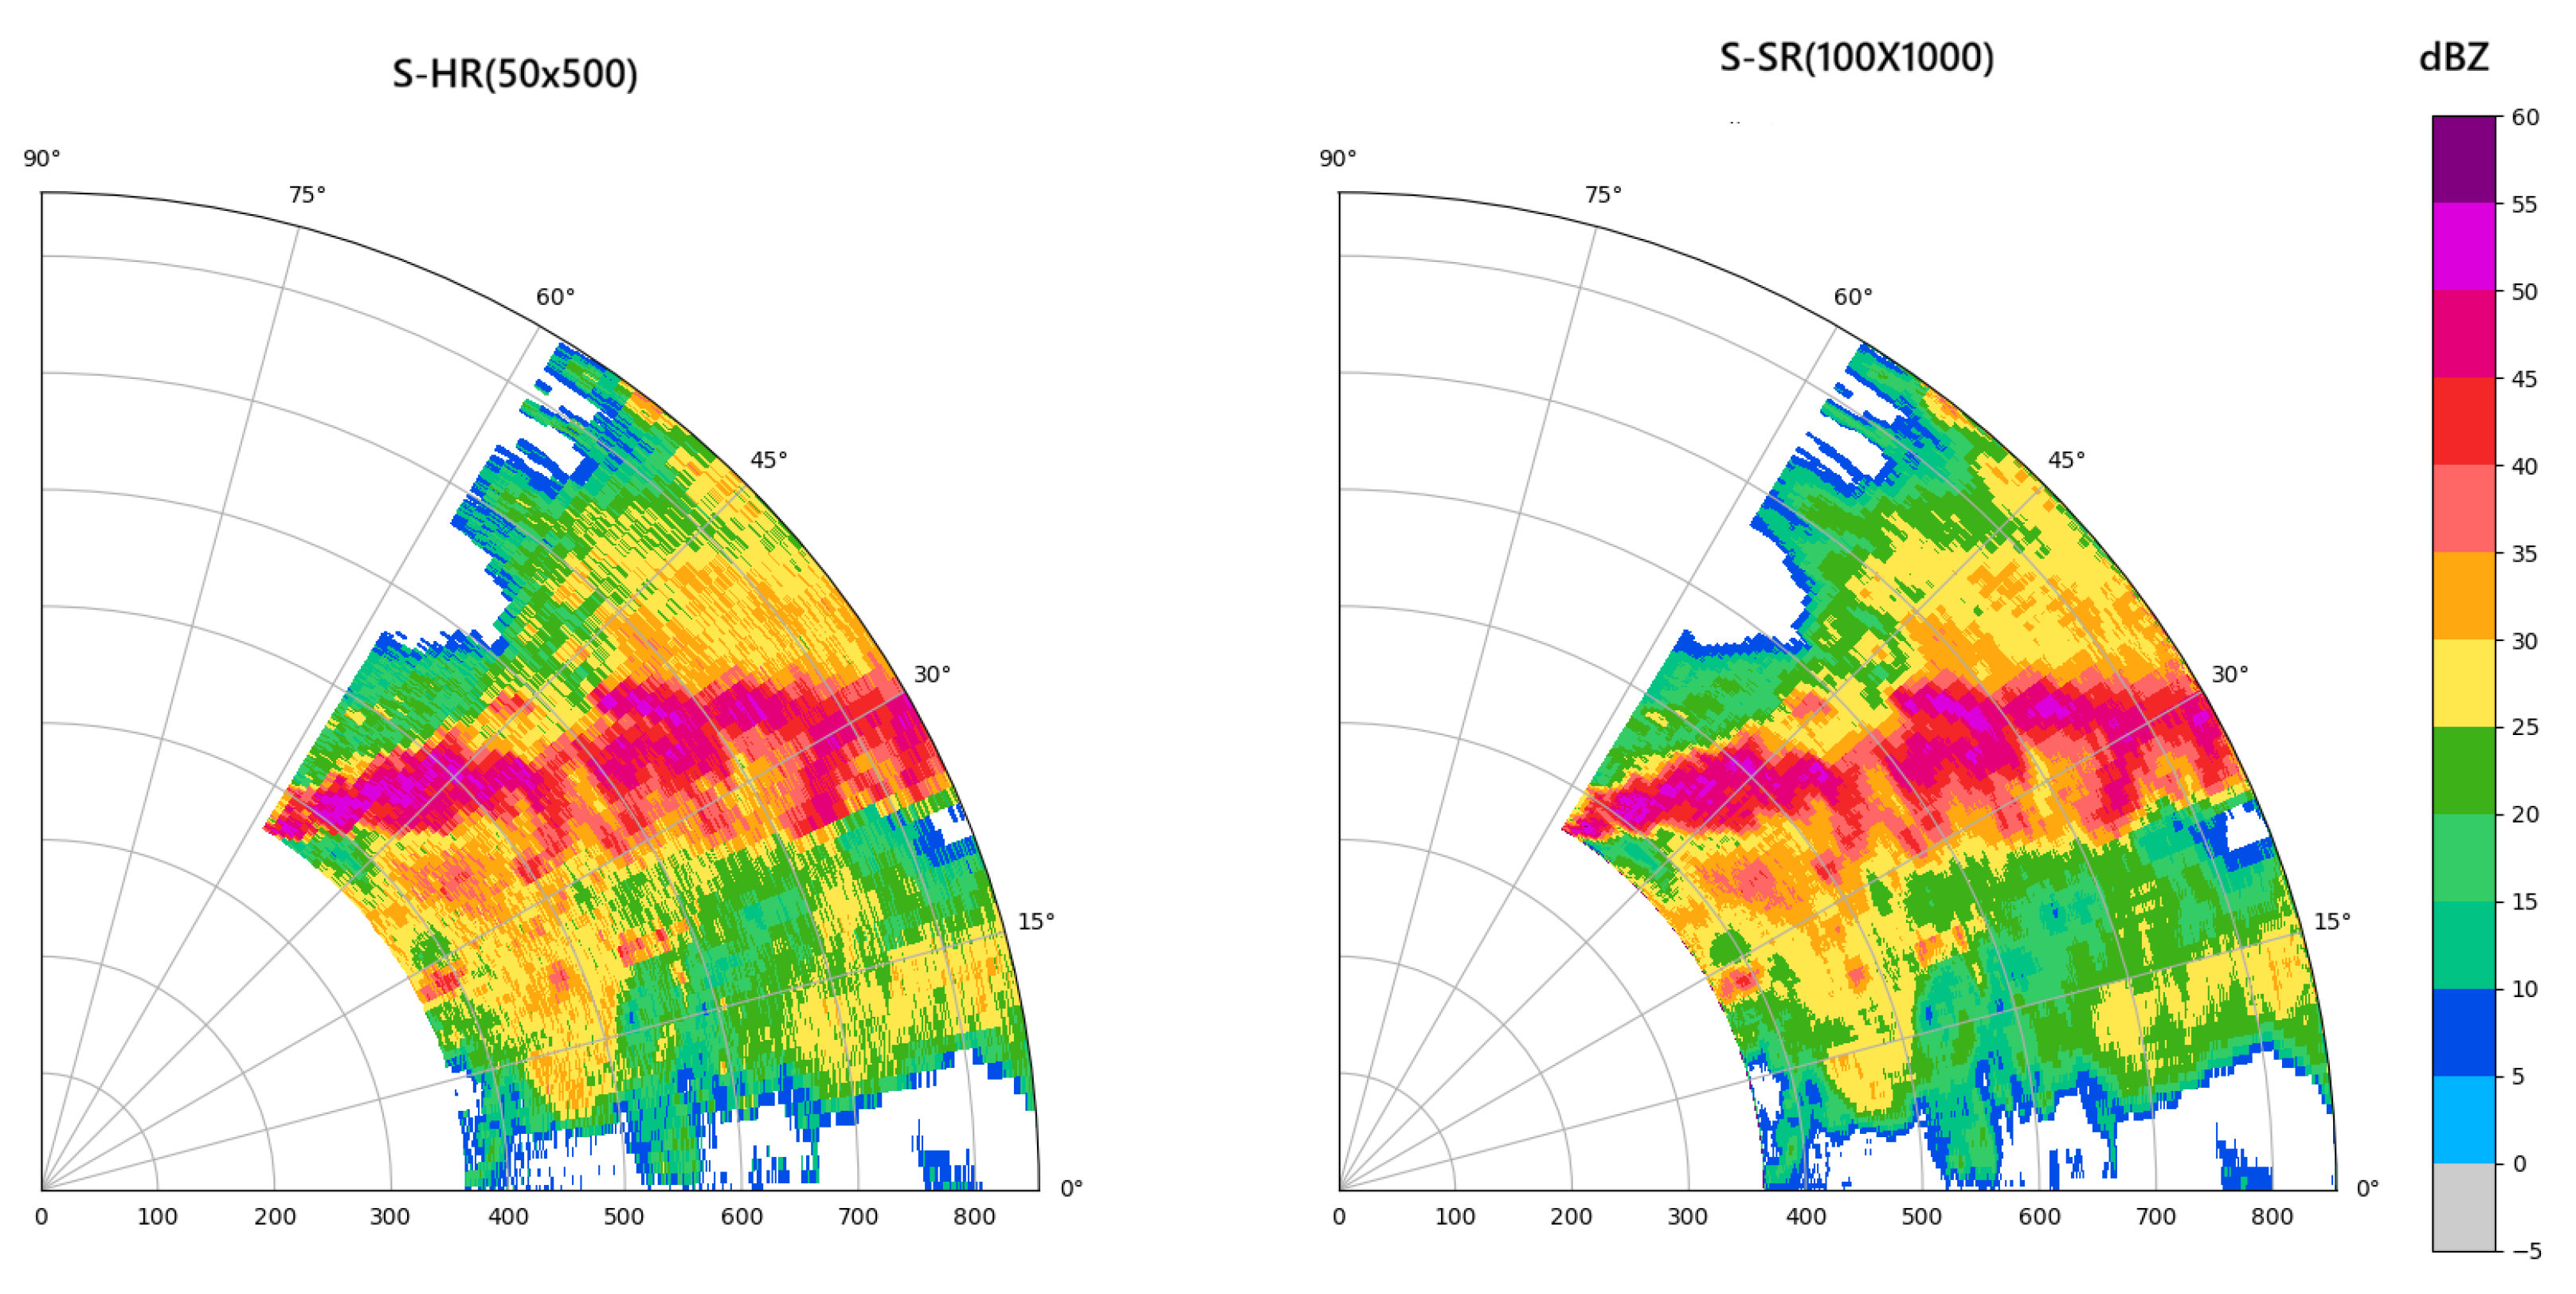
A practical example is shown in Figure 13 using data from a precipitation event in 2023.
Figure 13.
Visual comparison of a practical precipitation case (0.5°elevation). Left: S-HR (50, 500); Right: S-SR (100, 1000).
The left figure shows the original S-band radar data with a size of (50, 500), while the right part presents the result after super-resolution reconstruction with a size of (100, 1000). It can be observed that the spatial resolution of the radar reflectivity map is effectively improved after super-resolution reconstruction. The blurred echo edges in the original low-resolution image become clearer and sharper, and the fine echo structures and texture details are significantly restored. The overall echo morphology is smoother and more natural, which alleviates the over-smoothing and detail loss caused by traditional interpolation methods.
4. Discussion
The improved reconstruction performance arises from the synergy between the proposed architecture and multi-band radar fusion. By combining spatially adaptive modulation, large-receptive-field attention, and structured channel hybridization, the model effectively integrates S- and X-band information across scales, enhancing the recovery of strong echoes and complex spatial structures beyond conventional convolutional approaches. The main conclusions of this work are summarized as follows:
- (1)
- Both single-parameter and multi-parameter X-band inputs lead to measurable improvements in quantitative reconstruction metrics; however, the corresponding visual differences remain relatively limited, indicating that numerical evaluations are more sensitive to performance gains than subjective visual inspection in radar super-resolution tasks.
- (2)
- Different X-band parameters provide partially overlapping yet complementary information for spatial structure recovery, while reflectivity-related features play a dominant role in shaping the reconstructed echo field. This explains why multi-parameter configurations outperform single-parameter inputs in quantitative terms, despite only subtle perceptual differences.
- (3)
- The observed discrepancy between quantitative gains and visual enhancements suggests that further performance improvements may require more explicit modeling of parameter-specific physical relationships or adaptive fusion strategies, rather than simple aggregation of additional input parameters.
5. Conclusions
Finally, this study aims to provide an effective solution for the super-resolution reconstruction of weather radar reflectivity through multi-band radar fusion. Although the proposed model achieves effective performance, several limitations remain. Attenuation correction was not applied to the X-band radar data, which may limit the effective use of high-frequency observations under strong precipitation. In addition, the lack of training samples over complex terrain may constrain the model’s generalization ability. Future work will focus on incorporating data quality control and physical correction, as well as extending the training dataset to include more diverse radar variables and observational scenarios.
Author Contributions
Conceptualization: S.Y., Q.Z., Y.L., F.Y., J.H. and H.W.; Methodology: S.Y., Q.Z., Y.L., F.Y. and J.H.; Software: S.Y., Q.Z., Y.L. and F.Y.; Validation: S.Y., Q.Z., Y.L. and F.Y.; Formal analysis: S.Y., Q.Z., T.Y. and Y.L.; Investigation: Q.Z.; Resources: Q.Z. and H.W.; Data curation: Q.Z. and J.H.; Writing—original draft preparation: S.Y. and Q.Z.; Writing—review and editing: S.Y., Q.Z., Y.L. and H.W.; Visualization: S.Y. and Y.L.; Supervision: Q.Z., H.W., J.H. and T.Y.; Project administration: Q.Z. and T.Y.; Funding acquisition: Q.Z. All authors have read and agreed to the published version of the manuscript.
Funding
This work was funded by the National Natural Science Foundation of China (U2342216 and 42575154), National Natural Science Foundation of Sichuan Province (2026NSFSC0208), China Meteorological Administration Tornado Key Laboratory (TKL202309), Key Laboratory of South China Sea Meteorological Disaster Prevention and Mitigation of Hainan Province (SCSF202503), Key Laboratory of Intelligent Meteorological Observation Technology, CMA (ZNGC2024QN03), and Key Laboratory of Atmosphere Sounding, CMA (2023KLAS09M, 2024KLAS04M).
Data Availability Statement
The original contributions presented in the study are included in this article; further inquiries can be directed to the corresponding author.
Acknowledgments
This research was carried out with support from the National Natural Science Foundation of China Meteorological Joint Fund (U2342216) and the China Meteorological Administration (CMAJBGS202316). The method was integrated into the operational system of the Jiangsu Meteorological Observatory, where it has demonstrated strong performance in practical radar networking applications. The research and testing of the algorithm were assisted by the Jiangsu Meteorological Observatory team, and we would like to express our sincere gratitude to them.
Conflicts of Interest
The authors declare no conflicts of interest.
Abbreviations
The following abbreviations are used in this manuscript:
| MSE | Mean Squared Error |
| CASA | Collaborative Adaptive Sensing of the Atmosphere |
| IP | Integrated Project |
| DWD | Deutscher Wetterdienest |
| POLARA | Polarimetric Radar Algorithm |
| DBF | Digital Beamforming |
| NSSR | Non-Local Self-Similarity Sparse Representation |
| CV-CNN | Complex-Valued Convolutional Neural Network |
| FMM | Feature Mix Module |
| VIT | Vision Transformer |
| LKA | Large Kernel Attention |
| SAFM | Spatially Adaptive Feature Modulation |
| BSCCM | Blueprint Separable Convolutional Channel Mixer |
| PSNR | Peak Signal-to-Noise Ratio |
| SSIM | Structural Similarity Index Measure |
| MAE | Mean Absolute Error |
| SR | Super-Resolution |
References
- Zhou, K.; Zheng, Y.; Li, B.; Dong, W.; Zhang, X. Forecasting different types of convective weather: A deep learning approach. J. Meteorol. Res. 2019, 33, 797–809. [Google Scholar] [CrossRef] [Scilit]
- Ahbar, M.I.; Tahir, W.; Osman, N.S. Performance comparison between S-band and C-band radar in quantitative precipitation estimation. In Proceedings of the 2023 IEEE Symposium on Computers & Informatics (ISCI), Shah Alam, Malaysia, 14–15 October 2023; pp. 70–75. [Google Scholar] [CrossRef] [Scilit]
- Wu, C.; Liu, L. Comparison of the observation capability of an X-band phased-array radar with an X-band Doppler radar and S-band operational radar. Adv. Atmos. Sci. 2014, 31, 814–824. [Google Scholar] [CrossRef] [Scilit]
- Ryzhkov, A.V.; Zrnić, D.S. Radar Polarimetry for Weather Observations; Springer International Publishing: Cham, Switzerland, 2019. [Google Scholar]
- Guida, R.; Fotias, V. Soil moisture retrieval with S-band SAR data. In Proceedings of the 2015 IEEE International Geoscience and Remote Sensing Symposium (IGARSS), Milan, Italy, 26–31 July 2015; pp. 1304–1307. [Google Scholar]
- Su, Y.Y.; Liu, L.P. Comparison of mesocyclone identification results between S-band dual polarization radar and X-band phased array weather radar. Meteor. Mon. 2022, 48, 229–244. (In Chinese) [Google Scholar]
- Wu, C.; Liu, L.P.; Wu, H.T. Measurement bias and mosaics analysis for X-band Doppler radars. Plateau Meteor. 2016, 35, 823–833. [Google Scholar] [CrossRef]
- Diss, S.; Testud, J.; Lavabre, J.; Ribstein, P.; Moreau, E.; du Chatelet, J.P. Ability of a dual polarized X-band radar to estimate rainfall. Adv. Water Resour. 2009, 32, 975–985. [Google Scholar] [CrossRef] [Scilit]
- Delrieu, G.; Serrar, S.; Guardo, E.; Creutin, J.D. Rain measurement in hilly terrain with X-band radar systems: Accuracy of path-integrated attenuation estimates derived from mountain return. J. Atmos. Ocean. Technol. 1998, 16, 405–416. [Google Scholar] [CrossRef] [Scilit]
- Yang, L.; Fu, J.; Li, Z.M.; Ma, S.; Wei, W.; Liu, Y. Analysis of a hail process in Foshan, Guangdong Province using an advanced phased-array radar system and development of a new early warning index. J. Meteorol. Res. 2025, 39, 41–58. [Google Scholar] [CrossRef] [Scilit]
- Liu, Y.X.; Ma, J.L.; Chen, M.X.; Shi, Z. Study on differences and fusion mosaic methods of parameters between S-band and X-band weather radars. Meteor. Mon. 2024, 50, 488–498. (in Chinese). [Google Scholar] [CrossRef]
- Matrosov, S.Y.; Clark, A.K.; Martner, B.E.; Tokay, A. X-band polarimetric radar measurements of rainfall. J. Appl. Meteorol. 2002, 41, 941–952. [Google Scholar] [CrossRef] [Scilit]
- Junyent, F.; Chandrasekar, V.; McLaughlin, D.; Insanic, E.; Bharadwaj, N. The CASA Integrated Project 1 networked radar system. J. Atmos. Ocean. Technol. 2010, 27, 61–78. [Google Scholar] [CrossRef] [Scilit]
- Zink, M.; Lyons, E.; Westbrook, D.; Pepyne, D.; Pilips, B.; Kurose, J.; Chandrasekar, V. Meteorological command & control: Architecture and performance evaluation. In Proceedings of the IGARSS 2008—IEEE International Geoscience and Remote Sensing Symposium, Boston, MA, USA, 7–11 July 2008; pp. V-152–V-155. [Google Scholar] [CrossRef] [Scilit]
- Brotzge, J.A.; Droegemeier, K.; McLaughlin, D.J. Collaborative adaptive sensing of the atmosphere (CASA): New radar system for improving analysis and forecasting of surface weather conditions. Transp. Res. Rec. 2006, 1948, 145–151. [Google Scholar] [CrossRef]
- Rafieeinasab, A.; Norouzi, A.; Mathew, T.; Seo, D.J.; Chen, H.; Chandrasekar, V.; Rees, P.; Nelson, B. Comparative evaluation of multiple radar-based QPEs for North Texas. In Proceedings of the International Symposium on Weather Radar and Hydrology, Reston, VA, USA, 2014. [Google Scholar]
- Wang, H.Y.; Liu, L.P.; Xiao, Y.J.; Zhuang, W.; Wang, G. Design and implementation of the CINRAD 3D digital mosaic system. Meteor. Mon. 2009, 35, 13–18. (In Chinese) [Google Scholar] [CrossRef]
- Ma, J.L.; Su, D.B.; Jin, Y.L.; Li, R.J. The impact of attenuation of X-band dual linear polarimetric radar on hail recognition. Plateau Meteor. 2012, 31, 825–835. (In Chinese) [Google Scholar]
- Wu, C.; Liu, L.P.; Yang, M.L.; Ma, J.; Li, J. Key technologies of hydrometeor classification and mosaic algorithm for X-band polarimetric radar. J. Appl. Meteor. Sci. 2021, 32, 200–216. (In Chinese) [Google Scholar]
- Hengstebeck, T.; Wapler, K.; Heizenreder, D.; Joe, P. Radar network–based detection of mesocyclones at the German Weather Service. J. Atmos. Ocean. Technol. 2018, 35, 299–321. [Google Scholar] [CrossRef] [Scilit]
- Wood, V.T.; Brown, R.A.; Sirmans, D. Technique for improving detection of WSR-88D mesocyclone signatures by increasing angular sampling. Weather Forecast. 2001, 16, 177–184. [Google Scholar] [CrossRef] [Scilit]
- Yang, S.L.; Ke, H.Y.; Ding, Y.M. Initial study on super-resolution direction subdividing algorithm based on DBF. J. Wuhan Univ. Nat. Sci. Ed. 2001, 47, 618–621. [Google Scholar]
- Mizutani, F.; Ushio, T.; Yoshikawa, E.; Shimamura, S.; Kikuchi, H.; Wada, M.; Satoh, S.; Iguchi, T. Fast-scanning phased-array weather radar with angular imaging technique. IEEE Trans. Geosci. Remote Sens. 2018, 56, 2664–2673. [Google Scholar] [CrossRef] [Scilit]
- Zha, Y.; Liu, L.; Yang, J.; Huang, Y. An alternating direction method for angular super-resolution in scanning radar. In Proceedings of the IGARSS 2017—IEEE International Geoscience and Remote Sensing Symposium (IGARSS), Fort Worth, TX, USA, 23–28 July 2017; pp. 1626–1629. [Google Scholar] [CrossRef] [Scilit]
- Gallardo-Hernando, B.; Muñoz-Ferreras, J.M.; Pérez-Martínez, F. Super-resolution techniques for wind turbine clutter spectrum enhancement in meteorological radars. IET Radar Sonar Navig. 2011, 5, 924–933. [Google Scholar] [CrossRef] [Scilit]
- Zhang, Q.; Zhang, Y.; Huang, Y.; Zhang, Y.; Pei, J.; Yi, Q.; Li, W.; Yang, J. TV-sparse super-resolution method for radar forward-looking imaging. IEEE Trans. Geosci. Remote Sens. 2020, 58, 6534–6549. [Google Scholar] [CrossRef] [Scilit]
- Gao, J.; Deng, B.; Qin, Y.; Wang, H.; Li, X. Enhanced radar imaging using a complex-valued convolutional neural network. IEEE Geosci. Remote Sens. Lett. 2018, 16, 35–39. [Google Scholar] [CrossRef] [Scilit]
- Geiss, A.; Hardin, J.C. Radar super resolution using a deep convolutional neural network. J. Atmos. Ocean. Technol. 2020, 37, 2197–2207. [Google Scholar] [CrossRef] [Scilit]
- Cho, H.W.; Kim, W.; Choi, S.; Eo, M.; Khang, S.; Kim, J. Guided generative adversarial network for super resolution of imaging radar. In Proceedings of the 17th European Radar Conference (EuRAD), Utrecht, The Netherlands, 10–15 January 2021; pp. 144–147. [Google Scholar] [CrossRef] [Scilit]
- Chen, H.; Zhang, X.; Liu, Y.; Zeng, Q. Generative adversarial networks capabilities for super-resolution reconstruction of weather radar echo images. Atmosphere 2019, 10, 555. [Google Scholar] [CrossRef] [Scilit]
- Salvetti, F.; Mazzia, V.; Khaliq, A.; Chiaberge, M. Multi-image super resolution of remotely sensed images using residual attention deep neural networks. Remote Sens. 2020, 12, 2207. [Google Scholar] [CrossRef] [Scilit]
- Ram, P.; Sinha, K. Revisiting kd-tree for nearest neighbor search. In Proceedings of the 25th ACM SIGKDD International Conference on Knowledge Discovery & Data Mining, Anchorage, AK, USA, 4–8 August 2019; pp. 1378–1388. [Google Scholar] [CrossRef] [Scilit]
- Xie, C.; Zhang, X.; Li, L.; Meng, H.; Zhang, T.; Li, T.; Zhao, X. Large kernel distillation network for efficient single image super-resolution. In Proceedings of the IEEE/CVF Conference on Computer Vision and Pattern Recognition (CVPR), Vancouver, BC, Canada, 18–22 June 2023; pp. 1283–1292. [Google Scholar]
- Azad, R.; Niggemeier, L.; Hüttemann, M.; Kazerouni, A.; Aghdam, E.K.; Velichko, Y.; Merhof, D. Beyond self-attention: Deformable large kernel attention for medical image segmentation. In Proceedings of the IEEE/CVF Winter Conference on Applications of Computer Vision (WACV), Waikoloa, HI, USA, 4–8 January 2024; pp. 1287–1297. [Google Scholar]
- Cao, H.M.; Li, B. EdSr: A Novel End-to-End Approach for State-Space Sampling in Molecular Dynamics Simulation. J. Chem. Inf. Model. 2024, 66, 2830–2843. [Google Scholar] [CrossRef] [Scilit] [PubMed]
- Sun, L.; Dong, J.; Tang, J.; Pan, J. Spatially-adaptive feature modulation for efficient image super-resolution. In Proceedings of the IEEE/CVF International Conference on Computer Vision, Paris, France, 1–6 October 2023; pp. 13190–13199. [Google Scholar]
- Brunet, D.; Vrscay, E.R.; Wang, Z. On the mathematical properties of the structural similarity index. IEEE Trans. Image Process. 2011, 21, 1488–1499. [Google Scholar] [CrossRef] [Scilit] [PubMed]

Disclaimer/Publisher’s Note: The statements, opinions and data contained in all publications are solely those of the individual author(s) and contributor(s) and not of MDPI and/or the editor(s). MDPI and/or the editor(s) disclaim responsibility for any injury to people or property resulting from any ideas, methods, instructions or products referred to in the content. |
© 2026 by the authors. Licensee MDPI, Basel, Switzerland. This article is an open access article distributed under the terms and conditions of the Creative Commons Attribution (CC BY) license.