


Highlights
What are the main findings?
- A GCTP model is proposed by coupling guided zoning, CNN-Transformer and PLUS.
- The GCTP model achieves high accuracy in urban expansion simulation.
What are the implications of the main findings?
- Guided zoning effectively mitigates spatial non-stationarity in large regions.
- CNN-Transformer captures long-range spatial dependencies to optimize land patterns.
Abstract
Land use changes within urban agglomerations exhibit significant spatiotemporal heterogeneity and regional diversity. In urban agglomeration land simulation, traditional models often struggle to systematically capture these variations. We introduce the GCTP, a novel framework that integrates guided Geographical zoning, Convolutional Neural Networks (CNN)-Transformer, and the Patch-generating Land Use Simulation (PLUS) model. Initially, guided K-means clustering was employed for geographic zoning to characterize regional spatial non-stationarity. Then, a CNN-Transformer network leveraged self-attention mechanisms to capture multi-scale spatial correlations, obtaining pixel-level development probabilities. Finally, these probabilities were fused with PLUS- Land Expansion Analysis Strategy (LEAS) outputs to drive PLUS- Cellular Automata with multi-type Random Seeds (CARS) for patch-level simulation. The results demonstrate the following: (1) The embedding of guided zoning enabled the model to achieve an Overall Accuracy (OA) of 0.941, effectively mitigating global simulation bias. (2) The optimal simulation performance occurred at a fusion weight of 0.81, yielding a Kappa of 0.8917 and an Figure of Merit (FoM) of 0.3830, significantly exceeding a single model. (3) The 2030 simulation indicates that the GCTP model effectively reduces isolated pixels at urban fringes. The GCTP generates neighborhood patterns with high spatial compactness and geographic consistency. This study highlights the significant advantages of integrating long-range spatial perception with geographical heterogeneity constraints in the land expansion simulation of urban agglomerations. The findings support more precise territorial spatial planning practices.
1. Introduction
Urban expansion and Land Use/Cover Change (LUCC) are now central issues in global rapid urbanization and regional sustainability research [1,2]. Especially for large-scale urban agglomerations undergoing rapid urbanization [3,4], the complex and diverse patterns of urban expansion make precise simulation and prediction crucial for formulating effective spatial planning and environmental management strategies [5,6]. As an example megacity cluster, the Yangtze River Delta (YRD) features vast scale and intertwined administrative boundaries. Its intense internal spatial heterogeneity and complex cross-regional interactions pose severe challenges to the local modeling capabilities of traditional simulation methods [7,8].
To simulate spatial dynamics and predict land use patterns, researchers have extensively applied some conventional models based on Markov chains and Cellular Automata (CA) [9,10]. Extensive research identifies models including Conversion of Land Use and its Effects at Small regional extent (CLUE-S), Land Change Modeler (LCM), Slope, Land use, Excluded, Urban, Transportation, Hillshade (SLEUTH) and Future Land Use Simulation model (FLUS) as premier tools for urban simulation [11,12]. Their strength lies in a variety of urban expansion scenarios under different assumptions. However, they still suffer from insufficient modeling of spatial heterogeneity, patch-level evolution processes, and temporal dependencies [13]. CA models, with their bottom-up modeling paradigm and spatial simulation capabilities, have been widely used in urban expansion studies [14,15]. Nevertheless, traditional CA models primarily rely on local neighborhood rules, making it difficult to effectively capture spatial heterogeneity and non-linear dependencies [16,17]. Empirical evaluations indicate that conventional cell-based CA tends to perform poorly when urban regions contain multiple sub-areas with disparate growth characteristics or exhibit strong temporal variation in growth processes [18].
To overcome these limitations, a dual-strategy model is introduced, named the Patch-generating Land Use Simulation (PLUS) [19,20]. In the model, the module driven by Random Forest (RF) is employed for transition rule mining, known as Land Expansion Analysis Strategy (LEAS). Dynamic evolution is carried by a Cellular Automata with multi-type Random Seeds (CARS). These improvements significantly enhance patch generation and spatial pattern simulation, better revealing the driving mechanisms of different land type expansions and improving landscape consistency [13,21]. Application cases in Wuhan, Hangzhou, and Zhejiang province demonstrate that the PLUS-based simulation method achieves higher cell-level agreement than conventional CA and CA–Markov models [19,20,22]. Furthermore, the PLUS model demonstrates much closer landscape metrics than conventional models, and can support multi-scenario planning under ecological and cultivated land protection policies [23]. PLUS has outperformed traditional CA in multi-scenario simulations across various regions like Zhengzhou, Guizhou, and Bortala, becoming a mainstream method in current LUCC modeling [12,22,24].
Meanwhile, the surge in deep learning applications for remote sensing and spatiotemporal data processing has offered fresh perspectives on research [25,26]. Convolutional Neural Networks (CNN) are adept at extracting local spatial textures and patch features [27,28], while Recurrent Neural Networks (e.g., LSTM/ConvLSTM) and temporal attention mechanisms are used to capture complex relationships between pixels and their neighborhoods, achieving high accuracy in several regional experiments [29,30]. Recent hybrid CA and deep learning frameworks have emerged, such as models coupling k-means or SOM-based zoning, CNN/3D-CNN, LSTM and PLUS [31]. Applied to rapidly urbanizing regions like Hangzhou, these approaches have demonstrated clear gains in Figure of Merit, Kappa and pattern similarity by jointly handling spatial heterogeneity and temporal dependence [32].
Despite these advances, current models still struggle to handle the global spatiotemporal dependencies of urban expansion [3]. Urban expansion is not an isolated local process but is influenced by nonlocal factors such as cross-regional policies, macroeconomic activities, and long-distance transportation networks [33]. Existing models, even with expanded receptive fields, have inherent limitations in capturing long-range spatial dependencies and long-term time-series dynamics [34]. Many coupled models of CA and deep learning still adopt fixed neighborhood structures and local spatial assumptions, and rarely consider high-order spatial relationships or the dynamic weighting among distant patches, which are critical in large urban agglomerations [35,36].
Recently, the Transformer architecture, centered around self-attention, has been introduced into remote sensing and change detection tasks [37,38]. Transformer demonstrates outstanding performance in land use and land cover classification and feature fusion due to its long-range dependency modeling capability [39,40]. Multi-head self-attention has also been embedded into graph attention networks and integrated with vector CA and agent-based models [41]. These models are employed to dynamically capture high-order spatial dependencies in scenario-based urban expansion prediction, further confirming the suitability of attention mechanisms for large-scale urban systems [42,43]. Furthermore, existing models often overlook spatial non-stationarity, where the influence of the same driving factor on land conversion varies significantly across different geographical zones. Evidence from geographically weighted regression and spatially partitioned CA models indicates that ignoring such spatial heterogeneity can lead to biased estimates of driving forces and degraded simulation performance in megacity regions [44,45]. In a vast and diverse region like the YRD, applying a single global rule often leads to significant simulation biases.
Therefore, we present a novel land expansion simulation framework for urban agglomerations, integrating guided geographical zoning, CNN-Transformer and PLUS model (GCTP). This framework aims to effectively simulate the expansion process of large-scale and highly heterogeneous urban agglomerations like the YRD.
The innovative aspects and practical value of this study can be stated in the following manner: (1) constructing an integrated framework (GCTP) that couples guided geographical zoning with deep learning to simultaneously resolve spatial non-stationarity and global spatiotemporal dependencies in large-scale urban expansion simulations, (2) introducing a Transformer-based self-attention evolutionary rule mining method into the field of urban expansion CA simulation and validating its applicability and superiority in the complex YRD region, and (3) providing precise data support for cross-administrative coordinated planning in the YRD through urban agglomeration land expansion simulation.
2. Materials and Methodology
2.1. Materials
2.1.1. Study Area
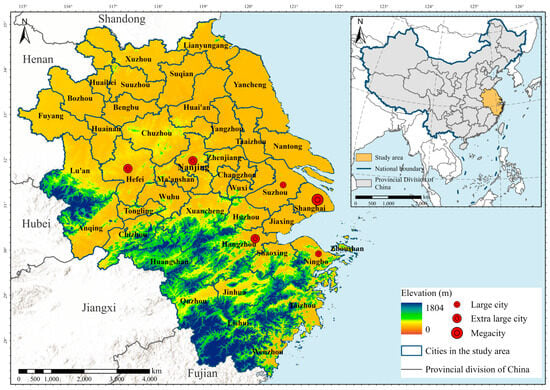
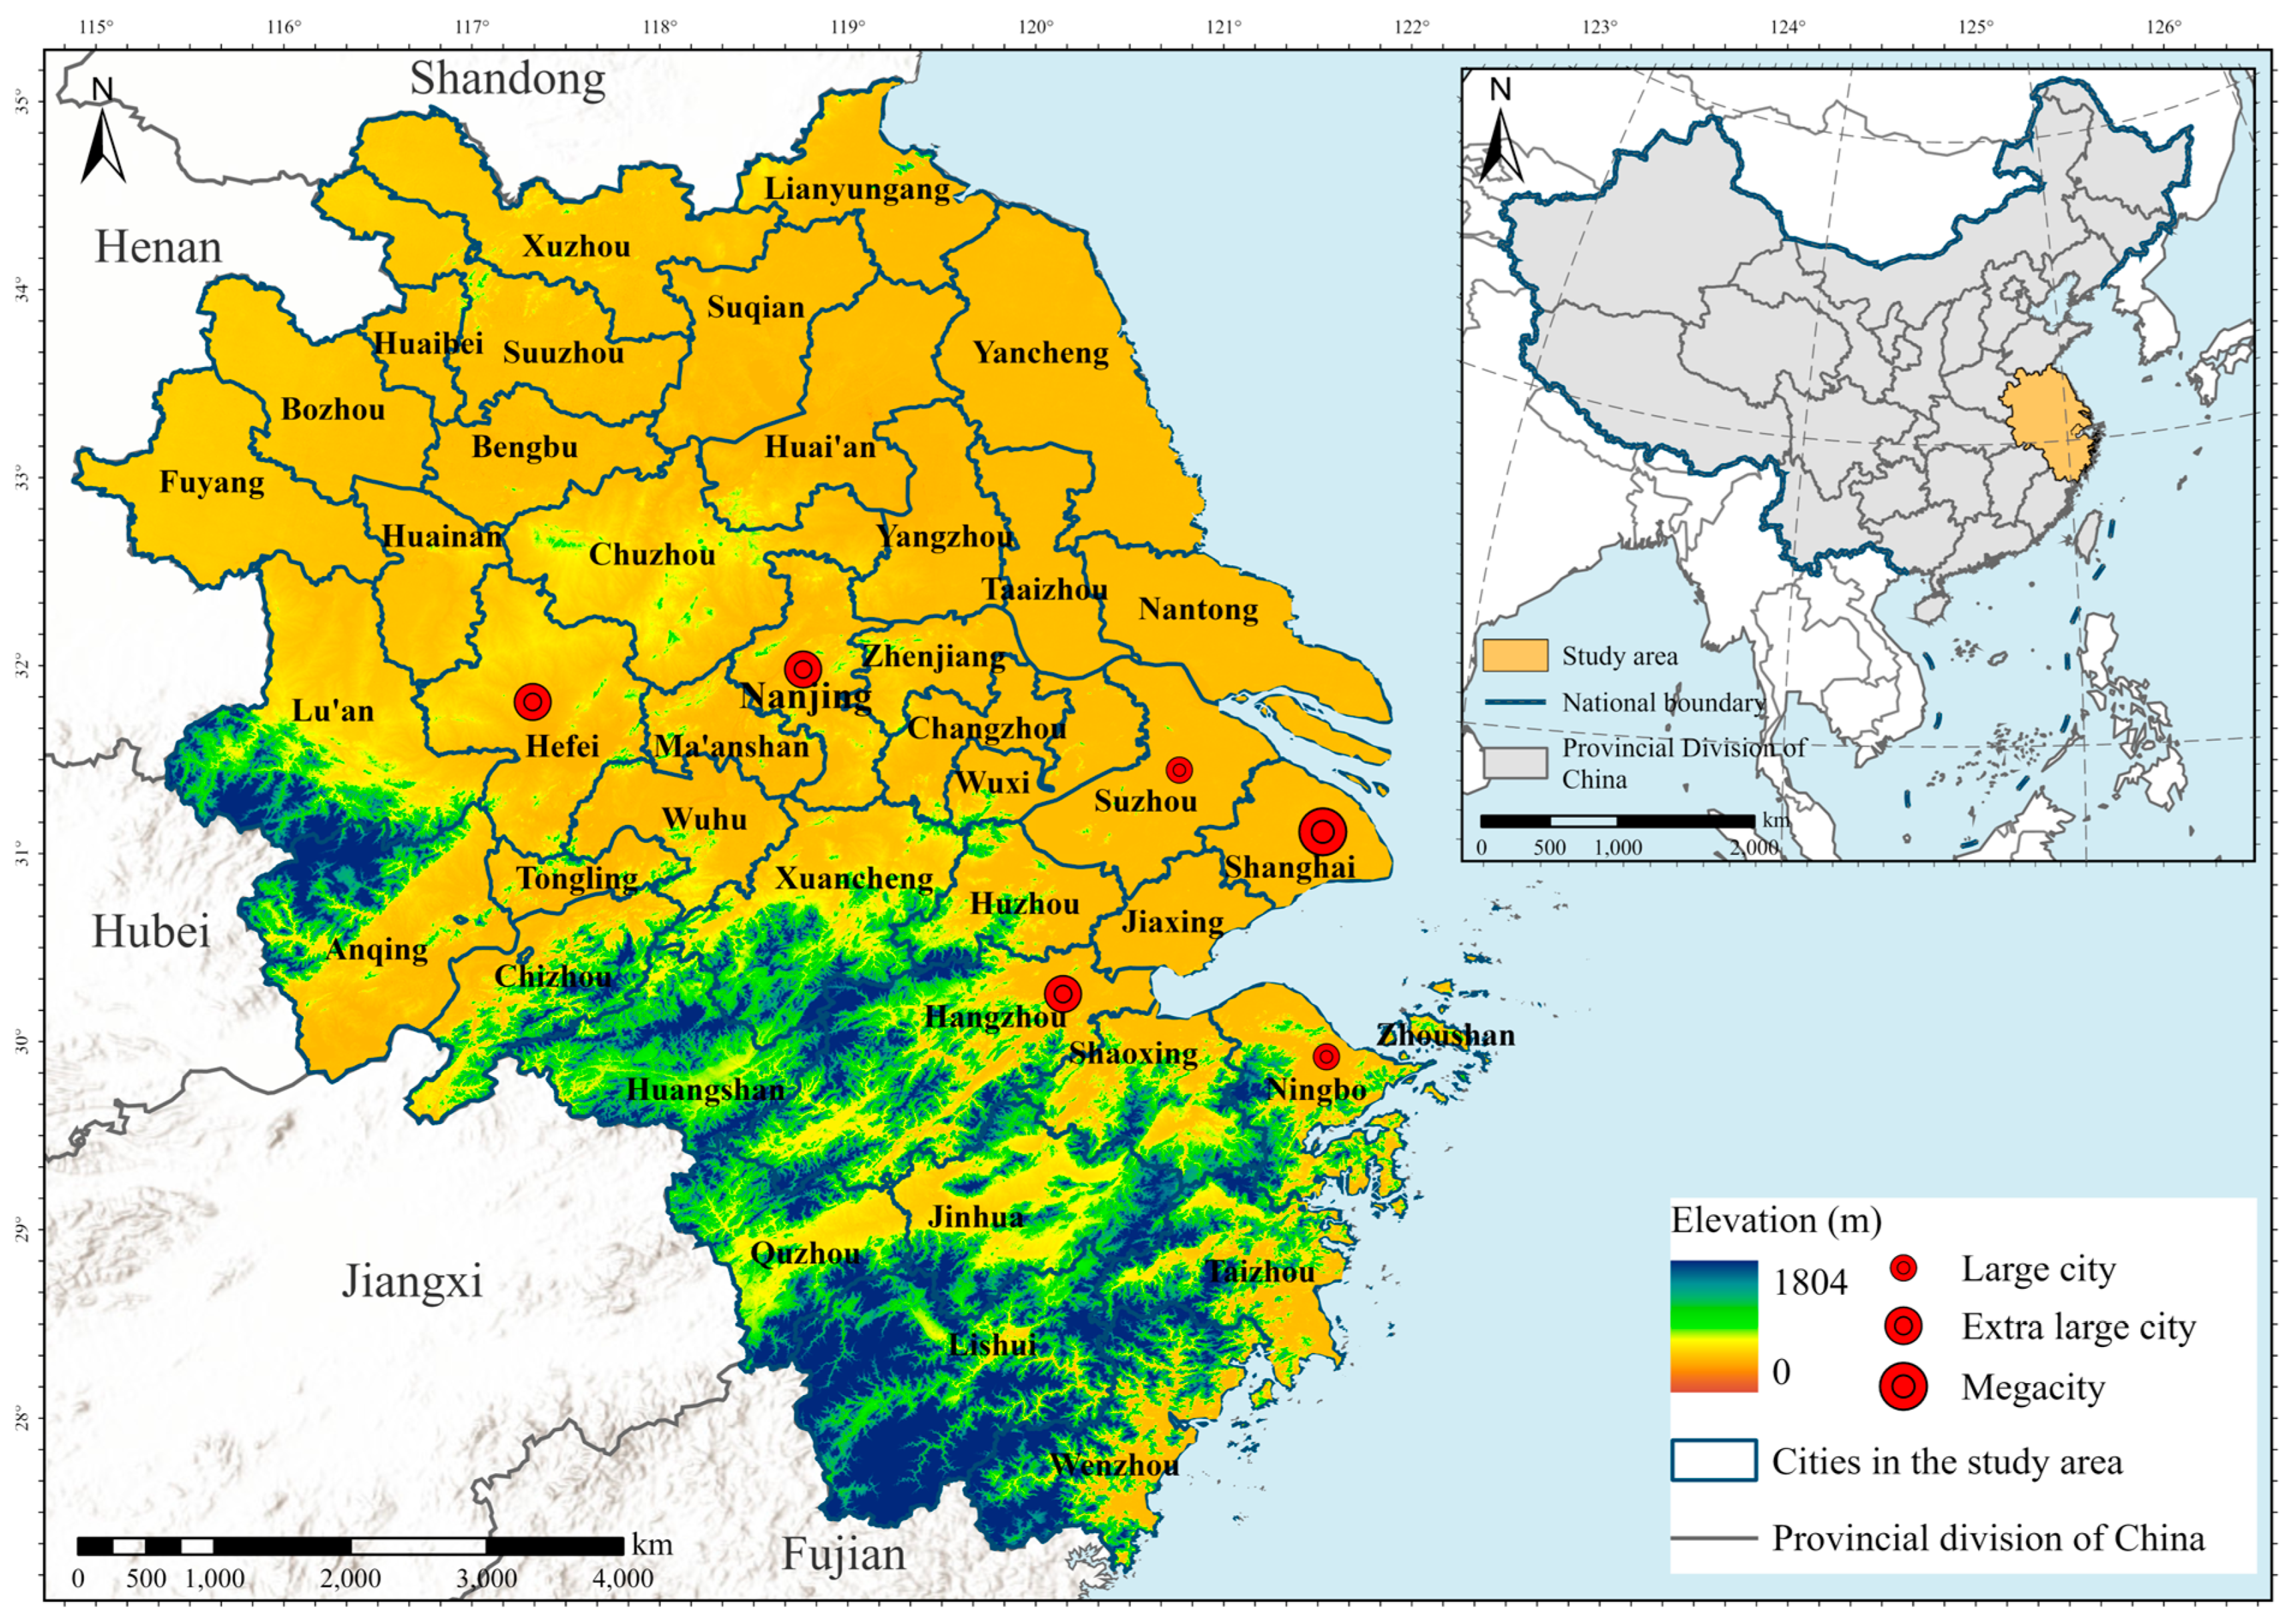
Situated along the eastern coast of mainland China, the YRD (27°12′–35°20′N, 114°54′–123°10′E) serves as the focus of this study, with a total area of approximately 357,282 km2. The selection of this region is necessitated by the highly integrated nature of its urban agglomeration, where urban expansion is no longer an isolated local phenomenon but a regional systemic shift. Driven by superior geographical conditions and policy support, the YRD has witnessed a surge in economic growth, significant population influx, and extensive urban sprawl over recent decades. It has evolved into a prominent megalopolis comprising 41 cities, including Shanghai and all cities across Anhui, Jiangsu and Zhejiang provinces (Figure 1) [46]. As of 2022, the population and Gross Domestic Product (GDP) of the YRD have demonstrated significant agglomeration effects within China, accompanied by intense LUCC [47]. The YRD exhibits strong spatial non-stationarity in terms of natural conditions and socio-economic intensity [5,48]. Diverse natural land covers serve as critical spatial constraints and ecological boundaries that define the potential directions and magnitudes of urban sprawl. These lead to diverse patterns of land development, urban expansion, and ecological constraints.
Figure 1.
The positioning of the YRD.
2.1.2. Data
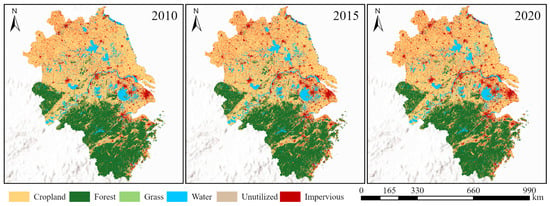
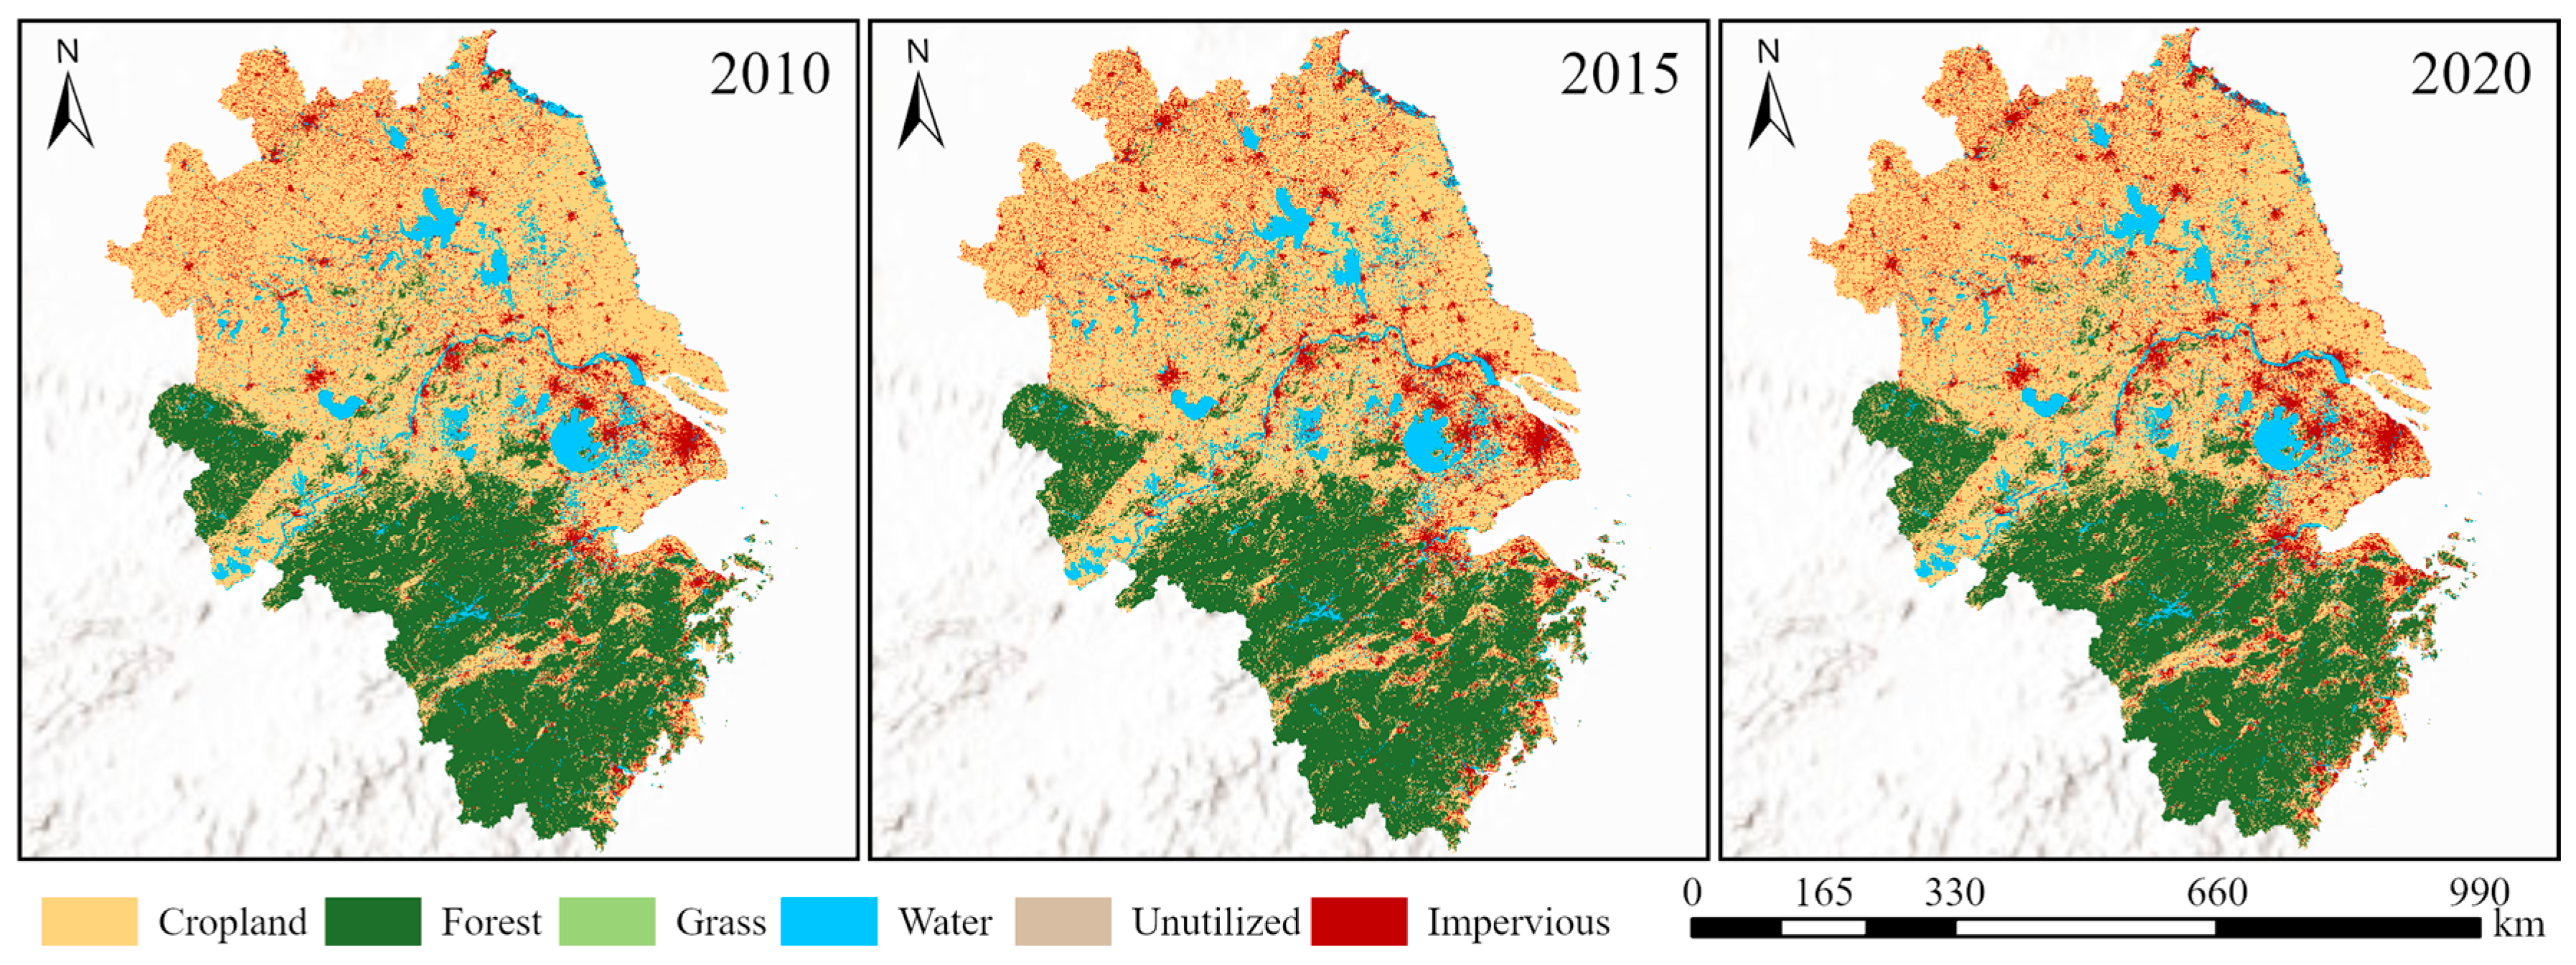
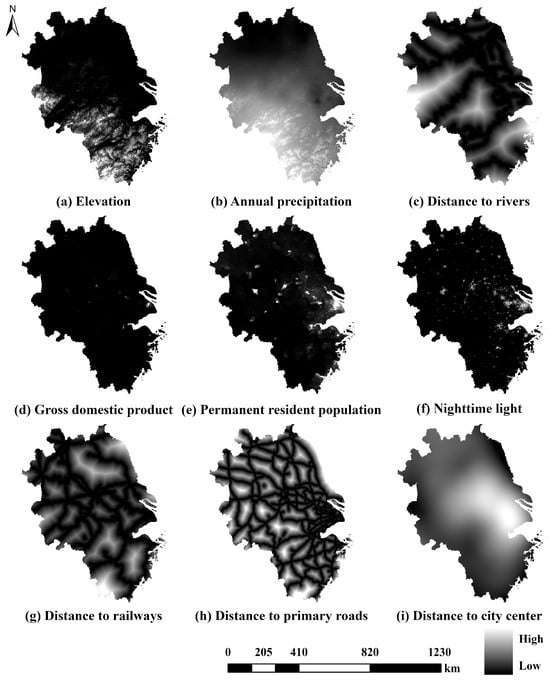
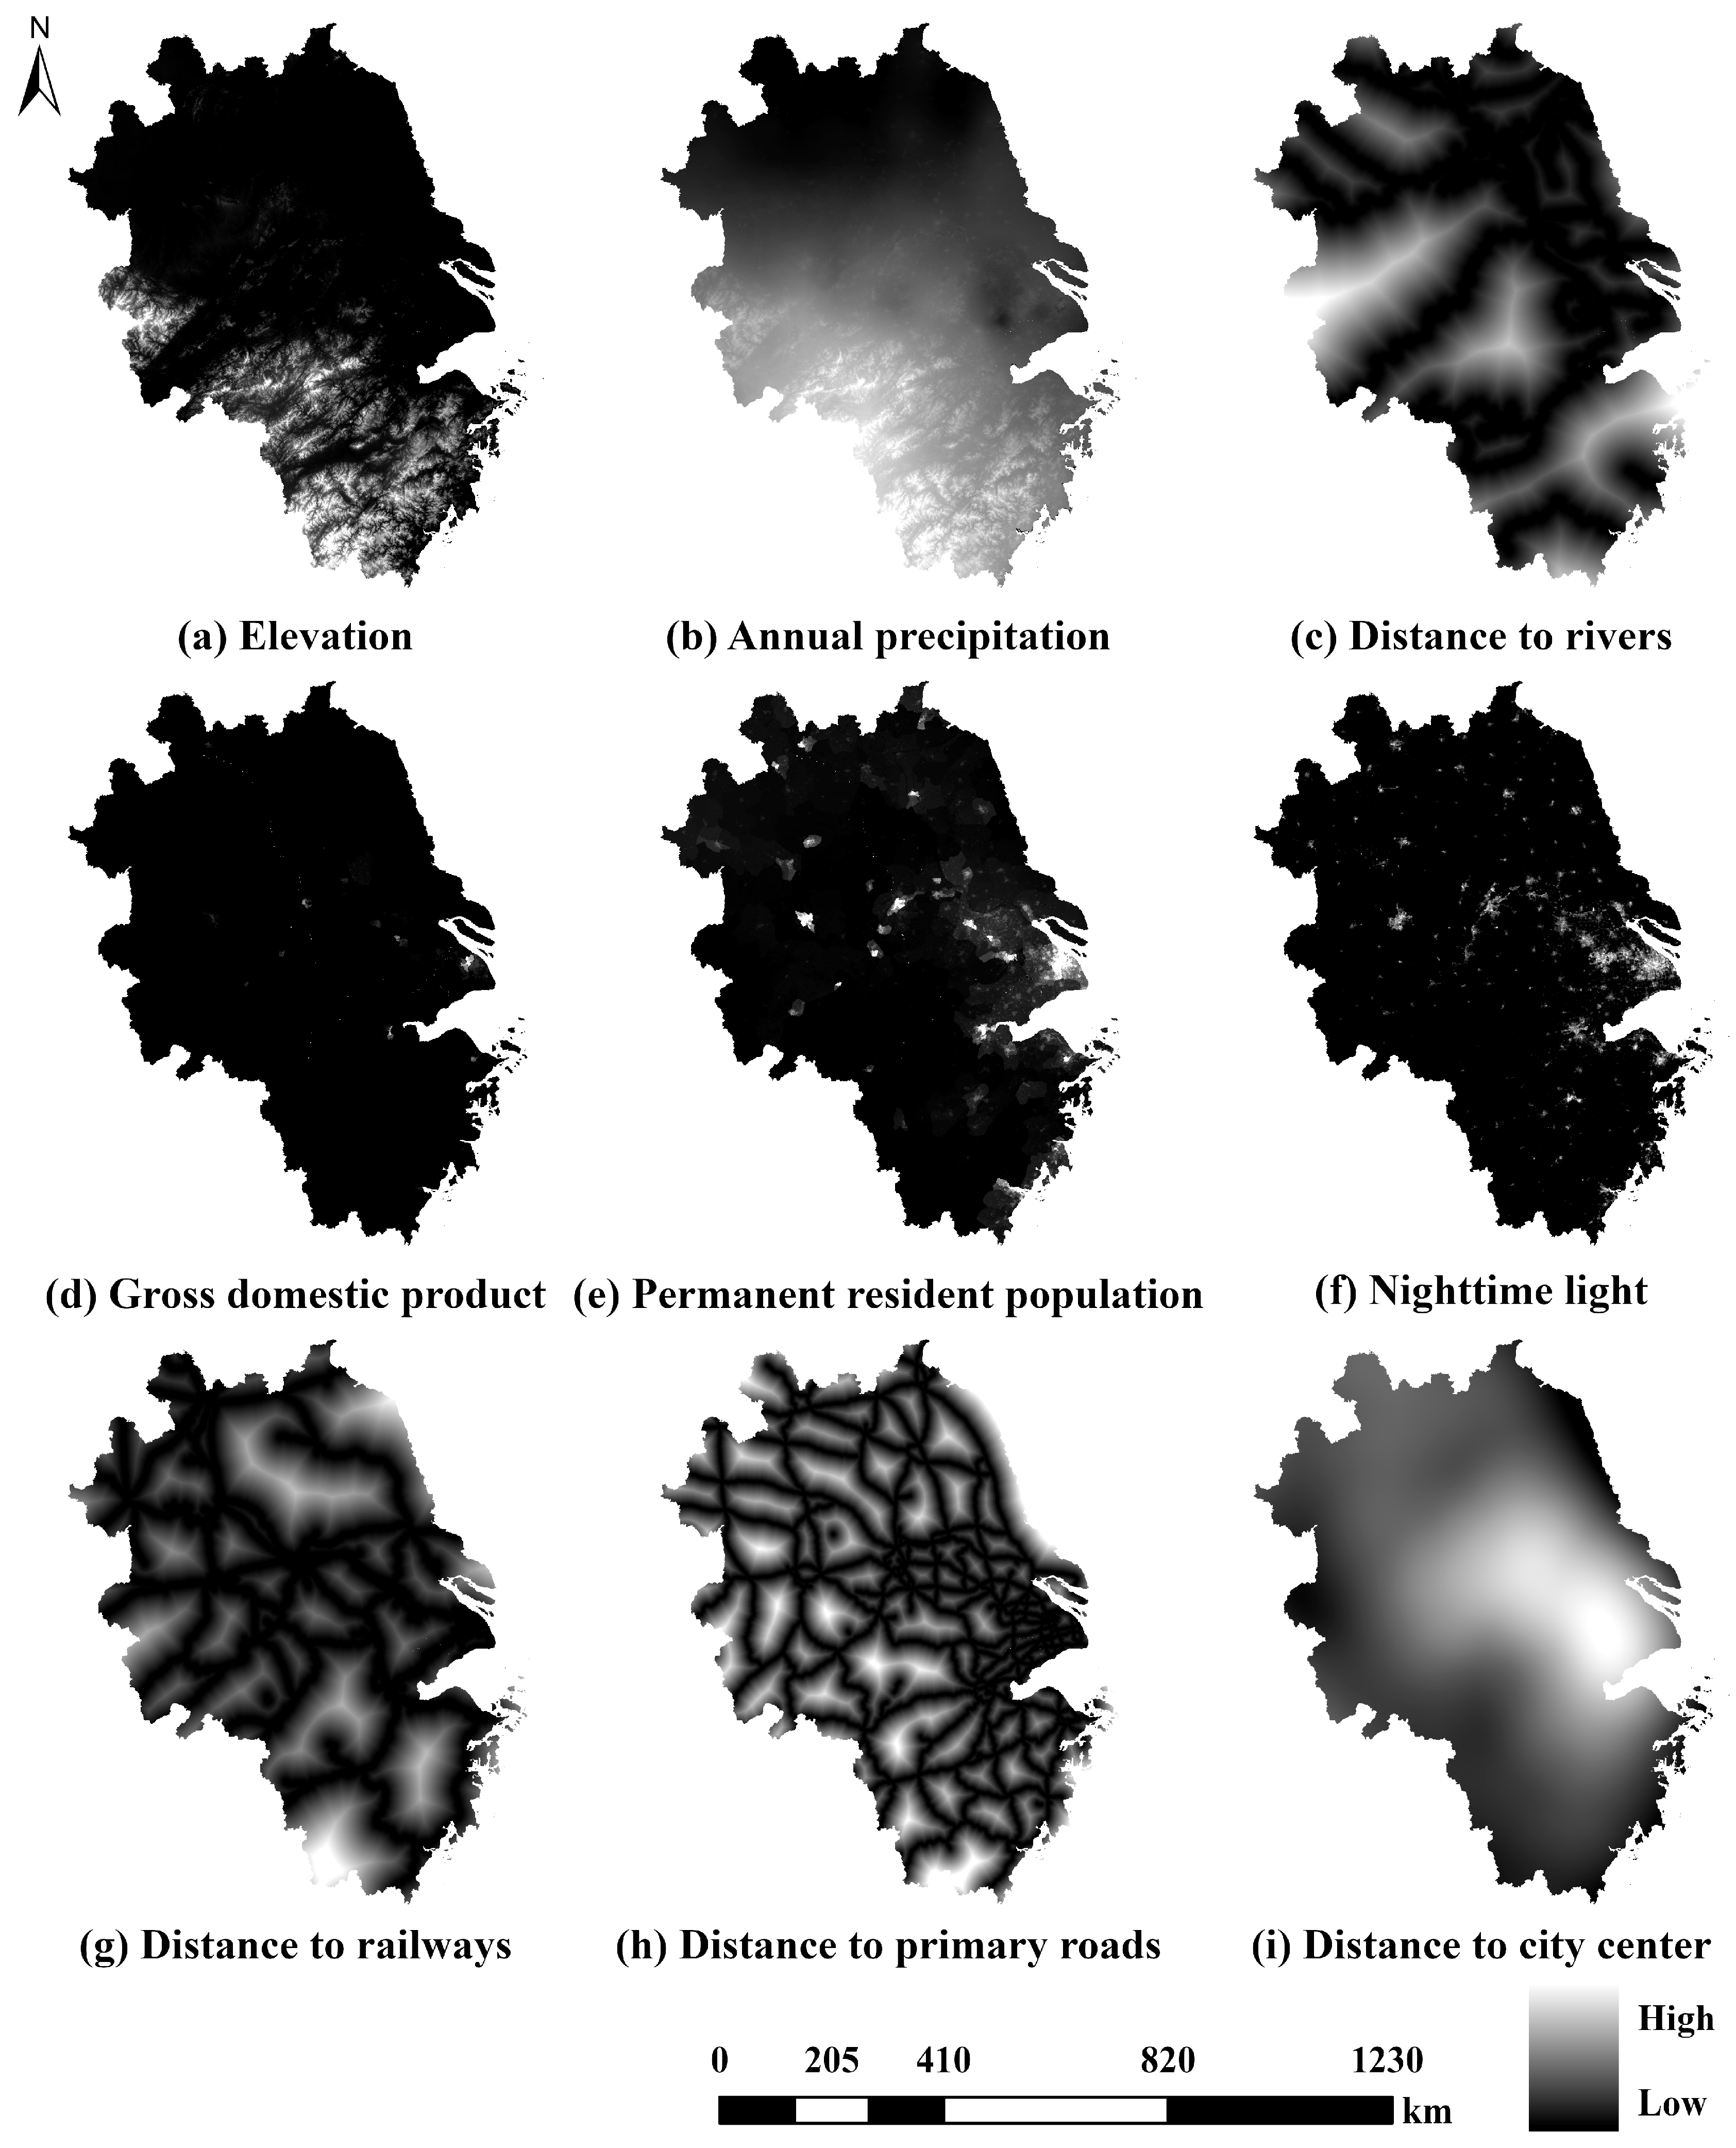
Land use information was taken from a high-quality product named China Land Cover Dataset (CLCD), covering mainland China since 1985 at a 30m spatial scale [49]. The dataset was produced on the Google Earth Engine (GEE) platform by applying RF algorithms to Landsat imagery. The CLCD demonstrates high accuracy in identifying impervious surfaces and cropland expansion, making it highly suitable for refined simulation of the YRD. In this study, we extracted and reclassified the CLCD layers of 2010, 2015 and 2020 into six distinct functional types: cropland, forest, grass, water, unutilized, and impervious (Figure 2). The study area spans a grid of 25,927 × 30,373 cells (including background values). To comprehensively characterize the driving mechanisms of land use evolution, nine driving factors encompassing both physical–geographical and socio-economic dimensions were selected (Figure 3). All spatial datasets were unified to the WGS 84/UTM zone 51N projection and resampled to a 30 m resolution using bilinear interpolation to ensure spatial consistency. Table 1 details the spatial data and their respective sources used in this study.
Figure 2.
Land use map from CLCD.
Figure 3.
Driving factors.
Table 1.
Driving factors and sources.
2.2. Methodology
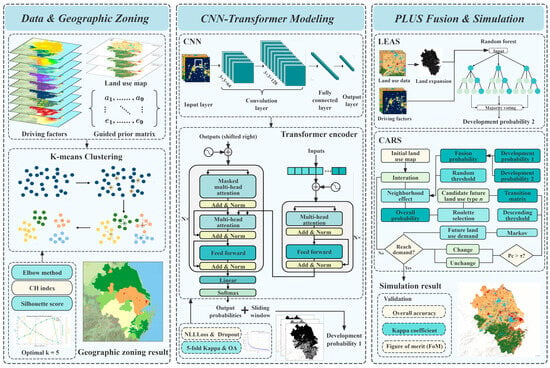
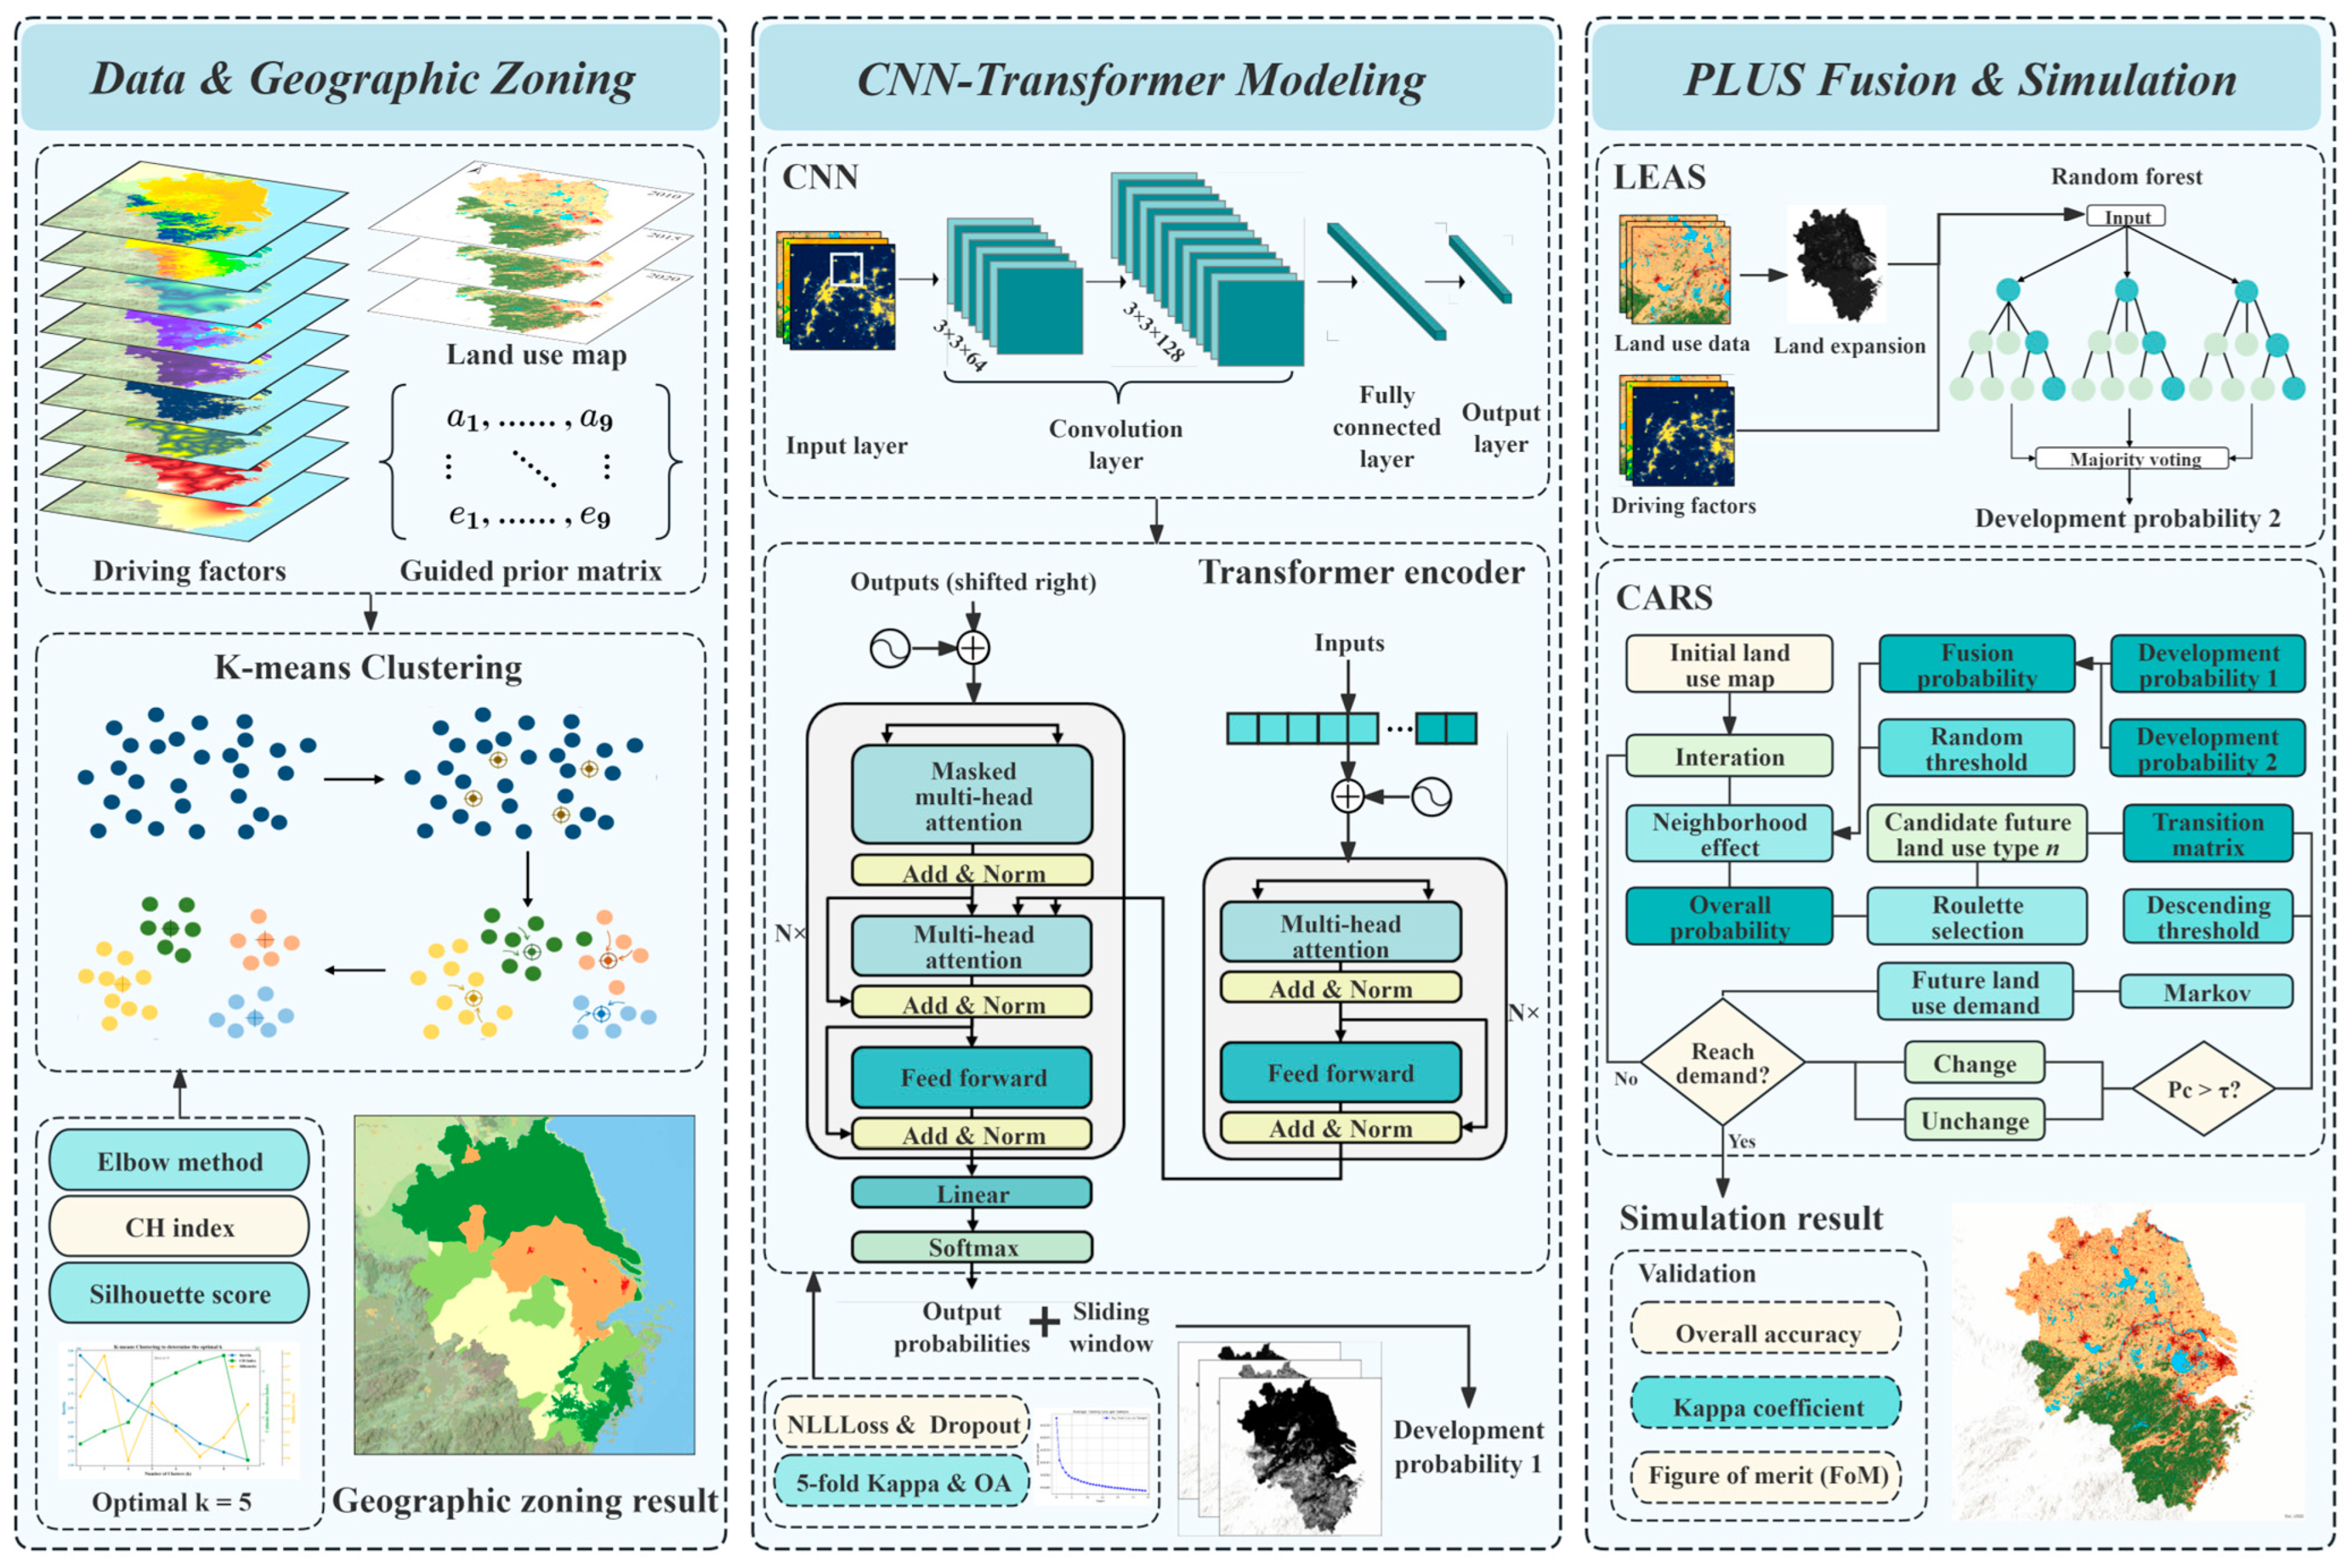
Conventional simulation methods often struggle with spatial non-stationarity, long-range spatiotemporal dependencies, and stochastic patch generation. To overcome these hurdles at the urban agglomeration scale, we developed the GCTP model, a novel urban expansion simulation framework (Figure 4). The model consists of three core modules: (1) a guided geographical zoning module, which utilizes guided K-means clustering to characterize large-scale regional heterogeneity and delineate geographical development zones; (2) a CNN-Transformer module, which leverages the self-attention mechanism to learn complex non-linear driving logics and transition trends; and (3) a Coupled Simulation module, which fuses the development probabilities from the CNN-Transformer and the PLUS models to improve the accuracy of land use pattern simulation in the future. The components of the framework are elaborated in detail below.
Figure 4.
Research framework.
2.2.1. Guided Geographical Zoning
At the urban agglomeration scale, significant internal variations exist in development stages, geographical patterns, transportation conditions, and policy resource allocations. Consequently, spatial non-stationarity has become one of the core challenges in land use simulation. To address this, this study develops a guided K-means (GK-means) geographical zoning method based on prior knowledge. K-means was selected due to its efficiency in handling large spatial datasets and its capability to identify dominant spatial structures in multi-factor environments [50]. Compared with hierarchical clustering or density-based clustering methods, K-means provides stable zoning results suitable for large-scale regional modeling [51,52]. By introducing a regional prior weight matrix into the traditional unsupervised K-means clustering, the spatial rationality, policy consistency, and generalization capability of the subsequent model are enhanced [53].
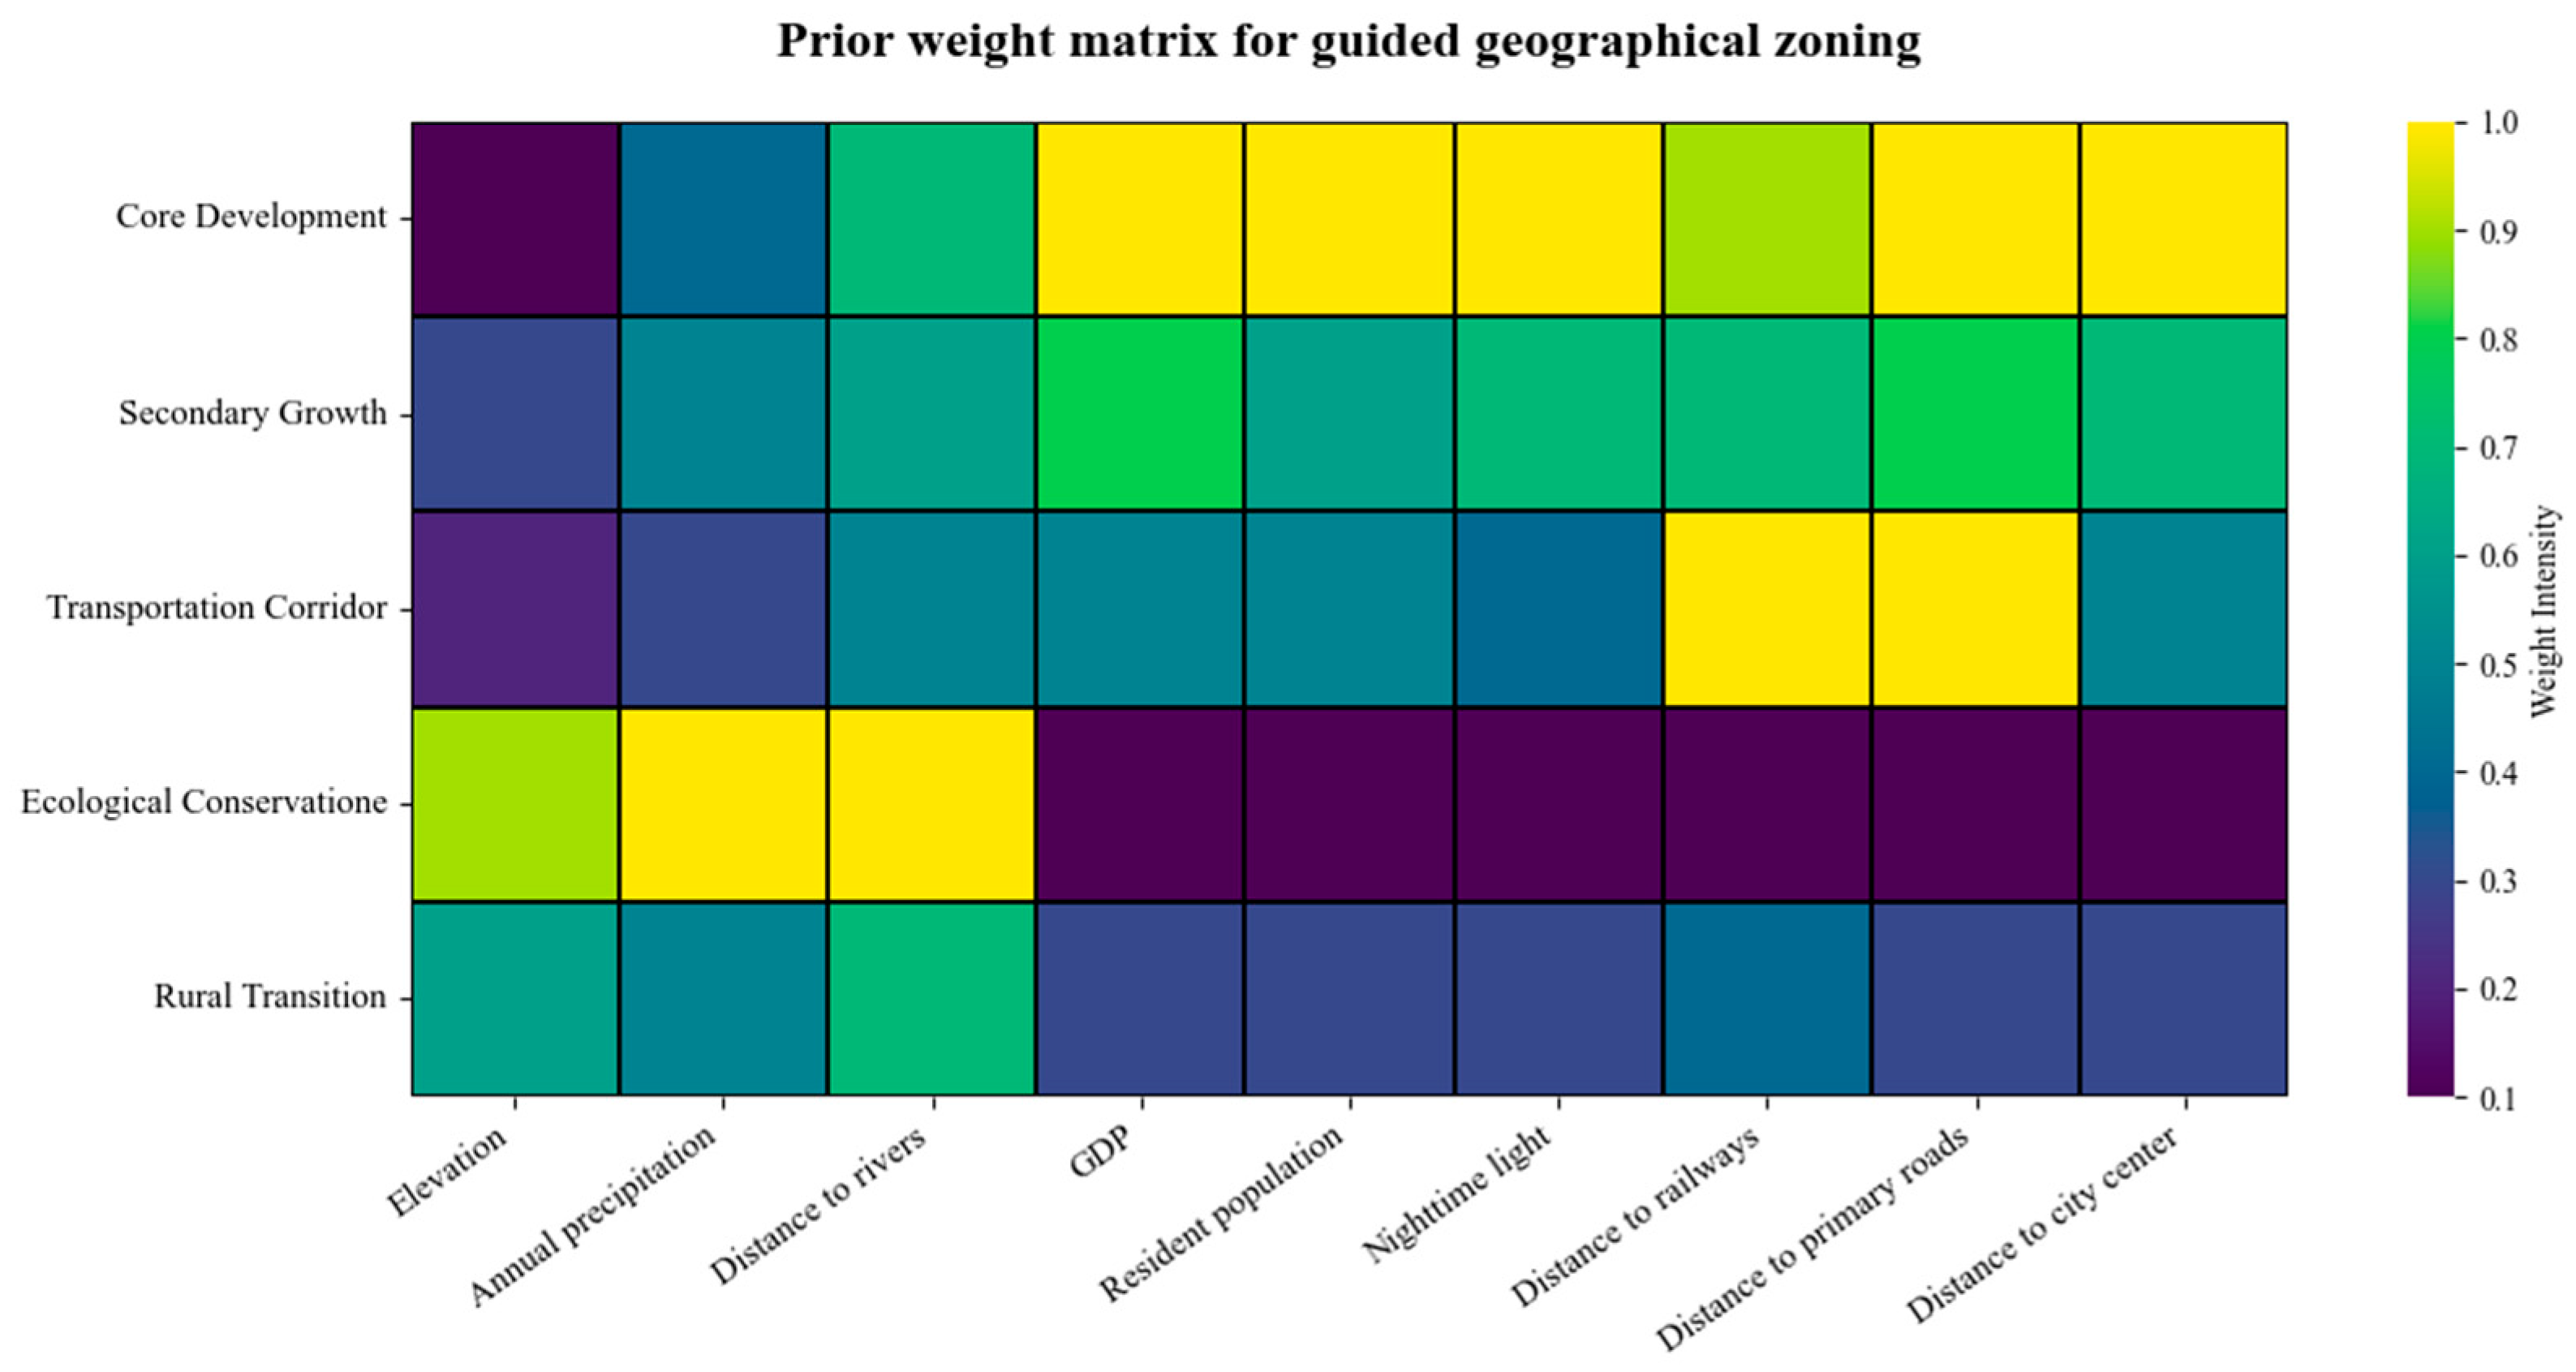
First, driving factors are selected as input vectors for clustering. These factors are processed based on the effective area mask of the LUCC data and standardized using Z-score normalization to remove the impact of differing dimensional units. Unlike the random initialization in traditional K-means, this study adopts a guided clustering strategy by introducing prior knowledge of regional development characteristics. Specifically, typical feature vectors derived from an expert-knowledge-based regional initial weight matrix are used as the initial centroids for the k clusters [5,48,54,55,56,57]. The weight matrix reflects the relative characteristic tendencies of different regional types across key driving factors, providing reasonable initial centers for the clustering process. This strategy helps improve clustering stability and reduces the risk of the algorithm converging to local optima (Figure 5). Each row represents the characteristic vector of a predefined typical region, with values normalized between 0 and 1 to reflect the relative importance or sensitivity of each factor. For instance, the Core Development Zone is assigned maximum weights (1.0) for GDP, population, and nighttime light to reflect its high intensity of human activity and urban development intensity.
Figure 5.
Prior weight matrix.
To avoid the interference of administrative boundaries on natural patterns, a 30 m × 30 m grid is used as the minimum clustering unit. To optimize the clustering process, the value of k is determined through a comprehensive evaluation of Inertia, Silhouette Coefficient and the Calinski–Harabasz (CH) Index. Once the zoning scheme is obtained, the zone codes are embedded into the subsequent neural network model as independent variables using one-hot encoding, allowing the model to incorporate regional heterogeneity information during the deep learning process.
2.2.2. CNN-Transformer Model
To further characterize the spatiotemporal dependencies and regional differentiation of land use patterns, we construct a Convolutional Neural Network (CNN)–Transformer network that integrates geographical zoning information. By fusing geographical zone codes with multi-source driving factors at the input layer, the network can adaptively learn the land use type conversion preferences of different zones. This enables pixel-level land conversion probability prediction, providing the probability maps for the PLUS model.
The model input is a three-dimensional tensor , where H and W represent the dimensions of a local window centered on the target pixel (set to 32 × 32 in this study to maintain consistency with the geographic scope of the driving factors on a pixel level). C denotes the total number of feature channels (C = 20), including nine standardized driving factors, five one-hot-encoded geographical zones, and six one-hot-encoded historical land use types (the baseline year, when simulating 2020, was 2015). One-hot encoding represents the presence (1) or absence (0) of historical land use types at each pixel location. For instance, the presence of cropland at a pixel can be represented as a channel sequence [1, 0, 0, 0, 0, 0]. These channels, alongside driving factors and geographical zoning channels, were concatenated to form a multi-channel input tensor. The model extracts local spatial structural features, such as patch boundaries, morphology, and non-linear combinations of local driving factors, through a two-layer Convolutional Neural Network (CNN). This CNN module utilizes a dual-layer convolutional setup (64 and 128 filters with 3 × 3 kernels) to capture spatial dependencies. These extracted features undergo a pixel-level mapping into the fully connected and output layers. Ultimately, the finalized salient spatial feature set is fed into the Transformer module for further processing. The convolutional operation at layer is expressed as [58]
where is the output feature at location of layer ; is the kernel size; is the number of channels of the previous layer; and denote learnable weights and bias; and is the activation function.
While CNNs excel at capturing local patterns, they often overlook broader spatial contexts. To bridge this gap, we incorporate a Transformer module to identify long-range spatial dependencies inherent in land-use transitions. By leveraging self-attention, the coupling model can account for distant yet influential regions [59], effectively capturing implicit spatial correlations that transcend administrative or natural boundaries. The expression is
where denotes the query matrix; denotes the key matrix; denotes the value matrix; and denotes the scaling factor.
The multi-head self-attention (MHSA) structure introduced by the Transformer can model spatial dependencies at different scales. We set eight attention heads to enable the model to learn regional conversion rules from various latent spatial dimensions, such as the dependence of urban expansion on transportation corridors. The MHSA expression is as follows:
where , is the number of attention heads; represents the linear projection matrices for the i-th head; and is the linear transformation matrix for the multi-head output.
Finally, the features processed by the Transformer are reshaped back into two-dimensional space and mapped to six land use types via a convolutional classifier. To determine the likelihood of land conversion for each pixel, the model utilizes an activation function to generate specific probability maps. Ten-fold cross-validation is employed for training and evaluation to ensure robustness and stability. During each iteration, the architecture undergoes optimization using the training subsets, while its predictive accuracy is simultaneously verified against a separate validation set. The training process spanned 50 epochs with a batch size of 8. We employed the Adam optimizer with a predefined learning rate of 0.002. Furthermore, the Negative Log-Likelihood Loss (NLLLoss) function is used during training, and Dropout is implemented to suppress overfitting. Model training equipment information is provided in Appendix A.1.
2.2.3. Urban Expansion Simulation-Based GCTP Model
To implement future land use spatial simulation, this study couples the development probability output by the CNN-Transformer model () with those from the LEAS module () based on an assigned weight . This coupling strategy aims to synthesize the capability of Transformer in perceiving global spatial dependencies with the capacity of RF to mine local rules. The integrated development probability, which serves as the input for the CARS module, is defined as
The LEAS module learns the correlations between driving factors and historical shifts based on the RF algorithm and outputs land expansion probabilities, as shown in Equation (6):
where denotes either 0 or 1, with 1 representing a shift from other land use types to type and 0 representing other shifts; denotes the vector of all of the driving factors; denotes the total number of decision trees; represents the indicator function of the decision tree set; and represents the projected value of the n-th decision tree for .
To fully exploit the advantages of both models, we test the results of weighted fusion at different ratios. The optimal weight was determined based on the Figure of Merit (FoM) index and Kappa coefficient to generate the final development probability. Once the integrated probability is obtained, it is applied to the CARS module to execute the land expansion. The CARS module combines a random seed generation mechanism with a threshold-decreasing strategy based on a CA model, enabling patch-level growth for multiple land types. Referencing prior research and the characteristics of the study area [60,61,62], the parameters for this module are shown in Appendix A.2. To initiate patch growth, a threshold-decreasing process identifies potential seeds across the transition probability surfaces using Monte Carlo sampling. Considering the neighborhood effect, we calculate the expansion possibility for land type as
where denotes the development potential of land type at unit ; denotes a value that ranges from 0 to 1; is the adaptive drive coefficient; is the threshold for creating fresh patches of land type ; represents the neighborhood effect of unit . A stochastic selection process, specifically the roulette wheel method, dictates the transition of grid cells in the next step. This selection is constrained by seed generation intensity and the decreasing threshold mechanism. This process iterates continuously until the target year is reached.
2.2.4. Accuracy Validation
The GCTP model was validated at two levels to assure its reliability. We tested the internal accuracy of the CNN-Transformer module using overall accuracy (OA) and the Kappa coefficient. Furthermore, the final results of the simulation were evaluated externally using OA, Kappa and the FoM index. These calculation methods are listed below:
where TP represents units correctly predicted as transitioning; FP denotes units that transitioned but were not predicted; TN refers to units that neither transitioned nor were predicted to; and FN represents units that were predicted to transition but failed to do so. The Kappa coefficient is calculated as follows:
where is the number of actual samples for each type; is the number of predicted samples for each type; is the overall number of samples; represents the ratio of correctly identified samples to the overall number of samples.
The FoM index is particularly emphasized to assess the ability of a model to capture land use changes, which is calculated as
denotes the units where actual change occurred, but no change was predicted; denotes the units where both actual and predicted changes occurred correctly; denotes the units where both actual and projected changes occurred, but the predicted category was incorrect; denotes the units where change was predicted, but no actual change occurred. The index operates on a scale of 0 to 1, with a higher value representing superior predictive accuracy regarding the dynamics of land expansion.
3. Results
3.1. Results of Geographical Zoning
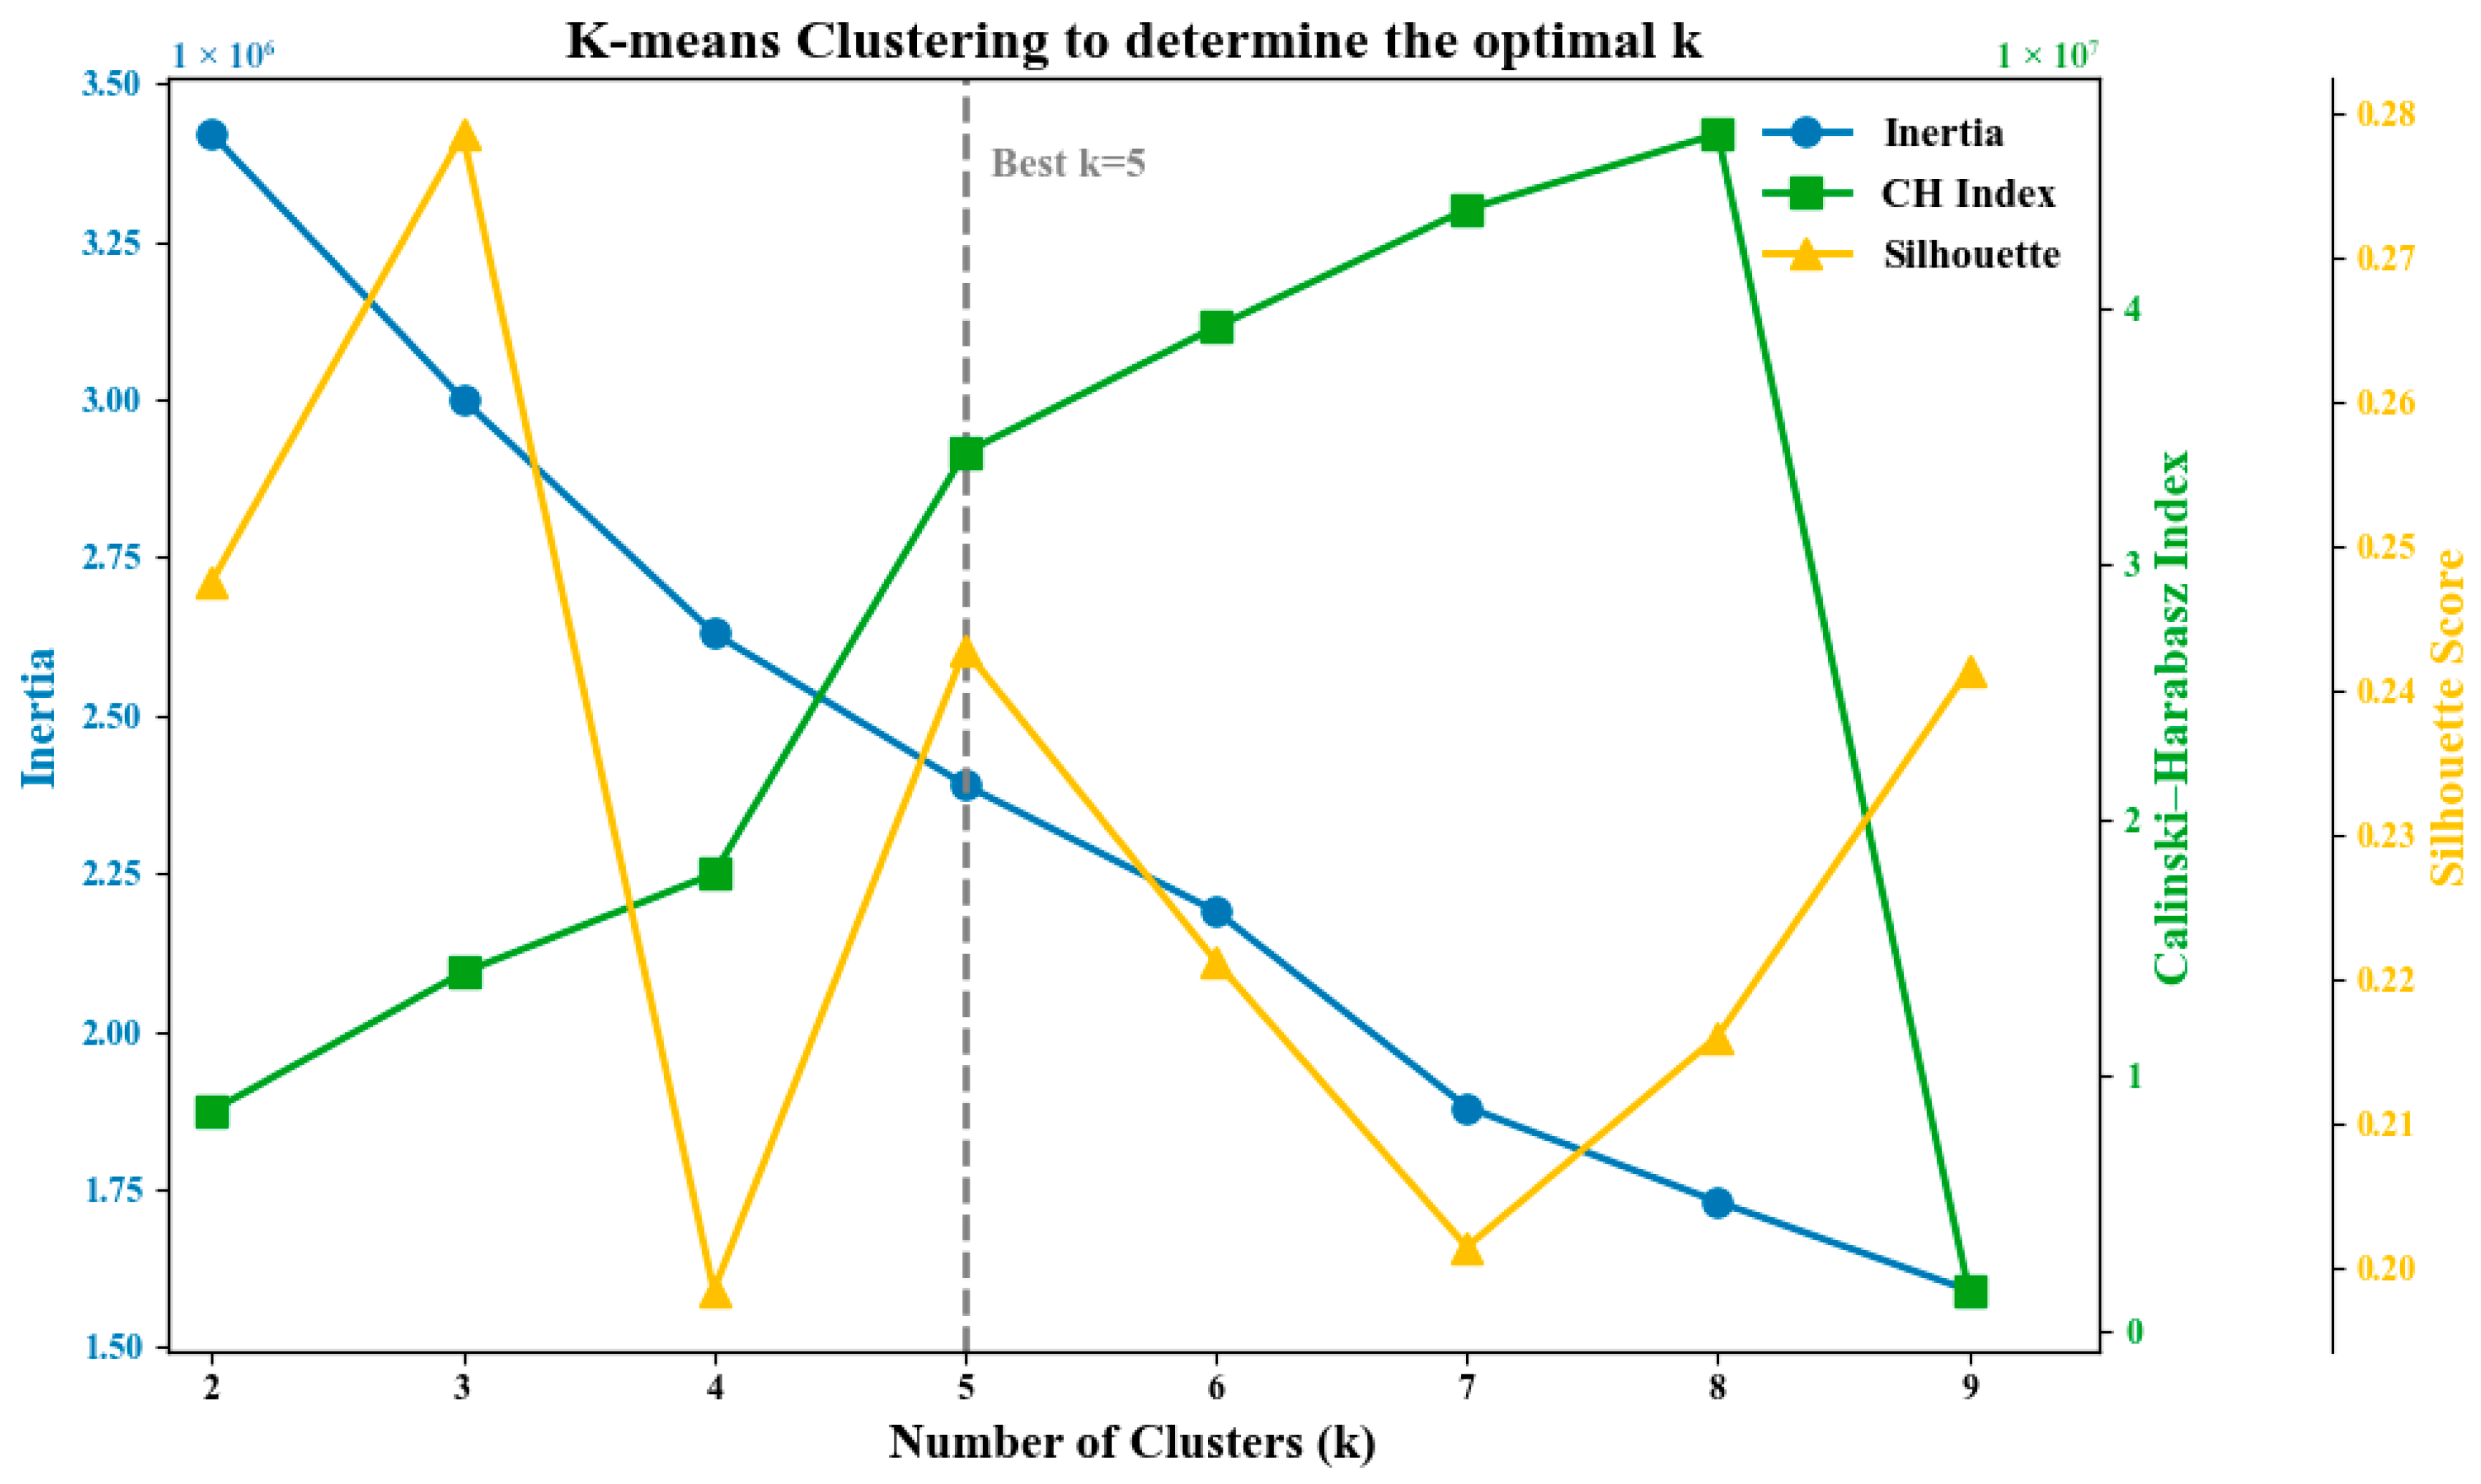
To address the significant spatial non-stationarity within the YRD and provide explicit regional heterogeneity for the deep learning model, a K-means clustering method was employed to partition the study area. Multiple indices were utilized to identify the optimal clustering scale. As shown in Figure 6, the Inertia curve exhibited a significant slowdown in convergence after k = 5, identifying this as the optimal value according to the elbow method. Furthermore, both the CH Index and the Silhouette Coefficient reached local optima at k = 5. Taking into account the consistent results from all three metrics, we confirmed 5 as the ideal cluster value.
Figure 6.
Index for evaluating optimal k.
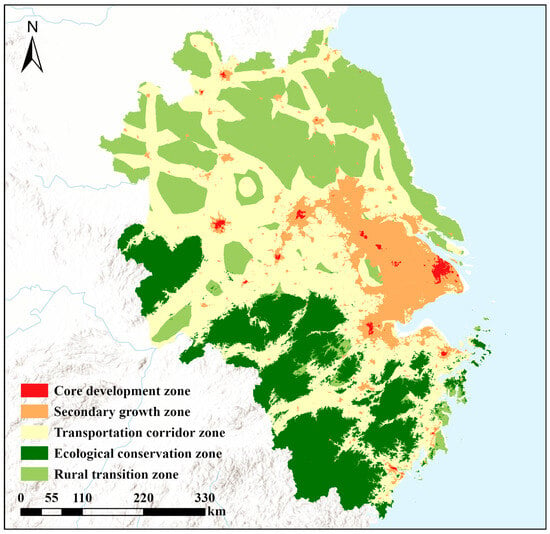
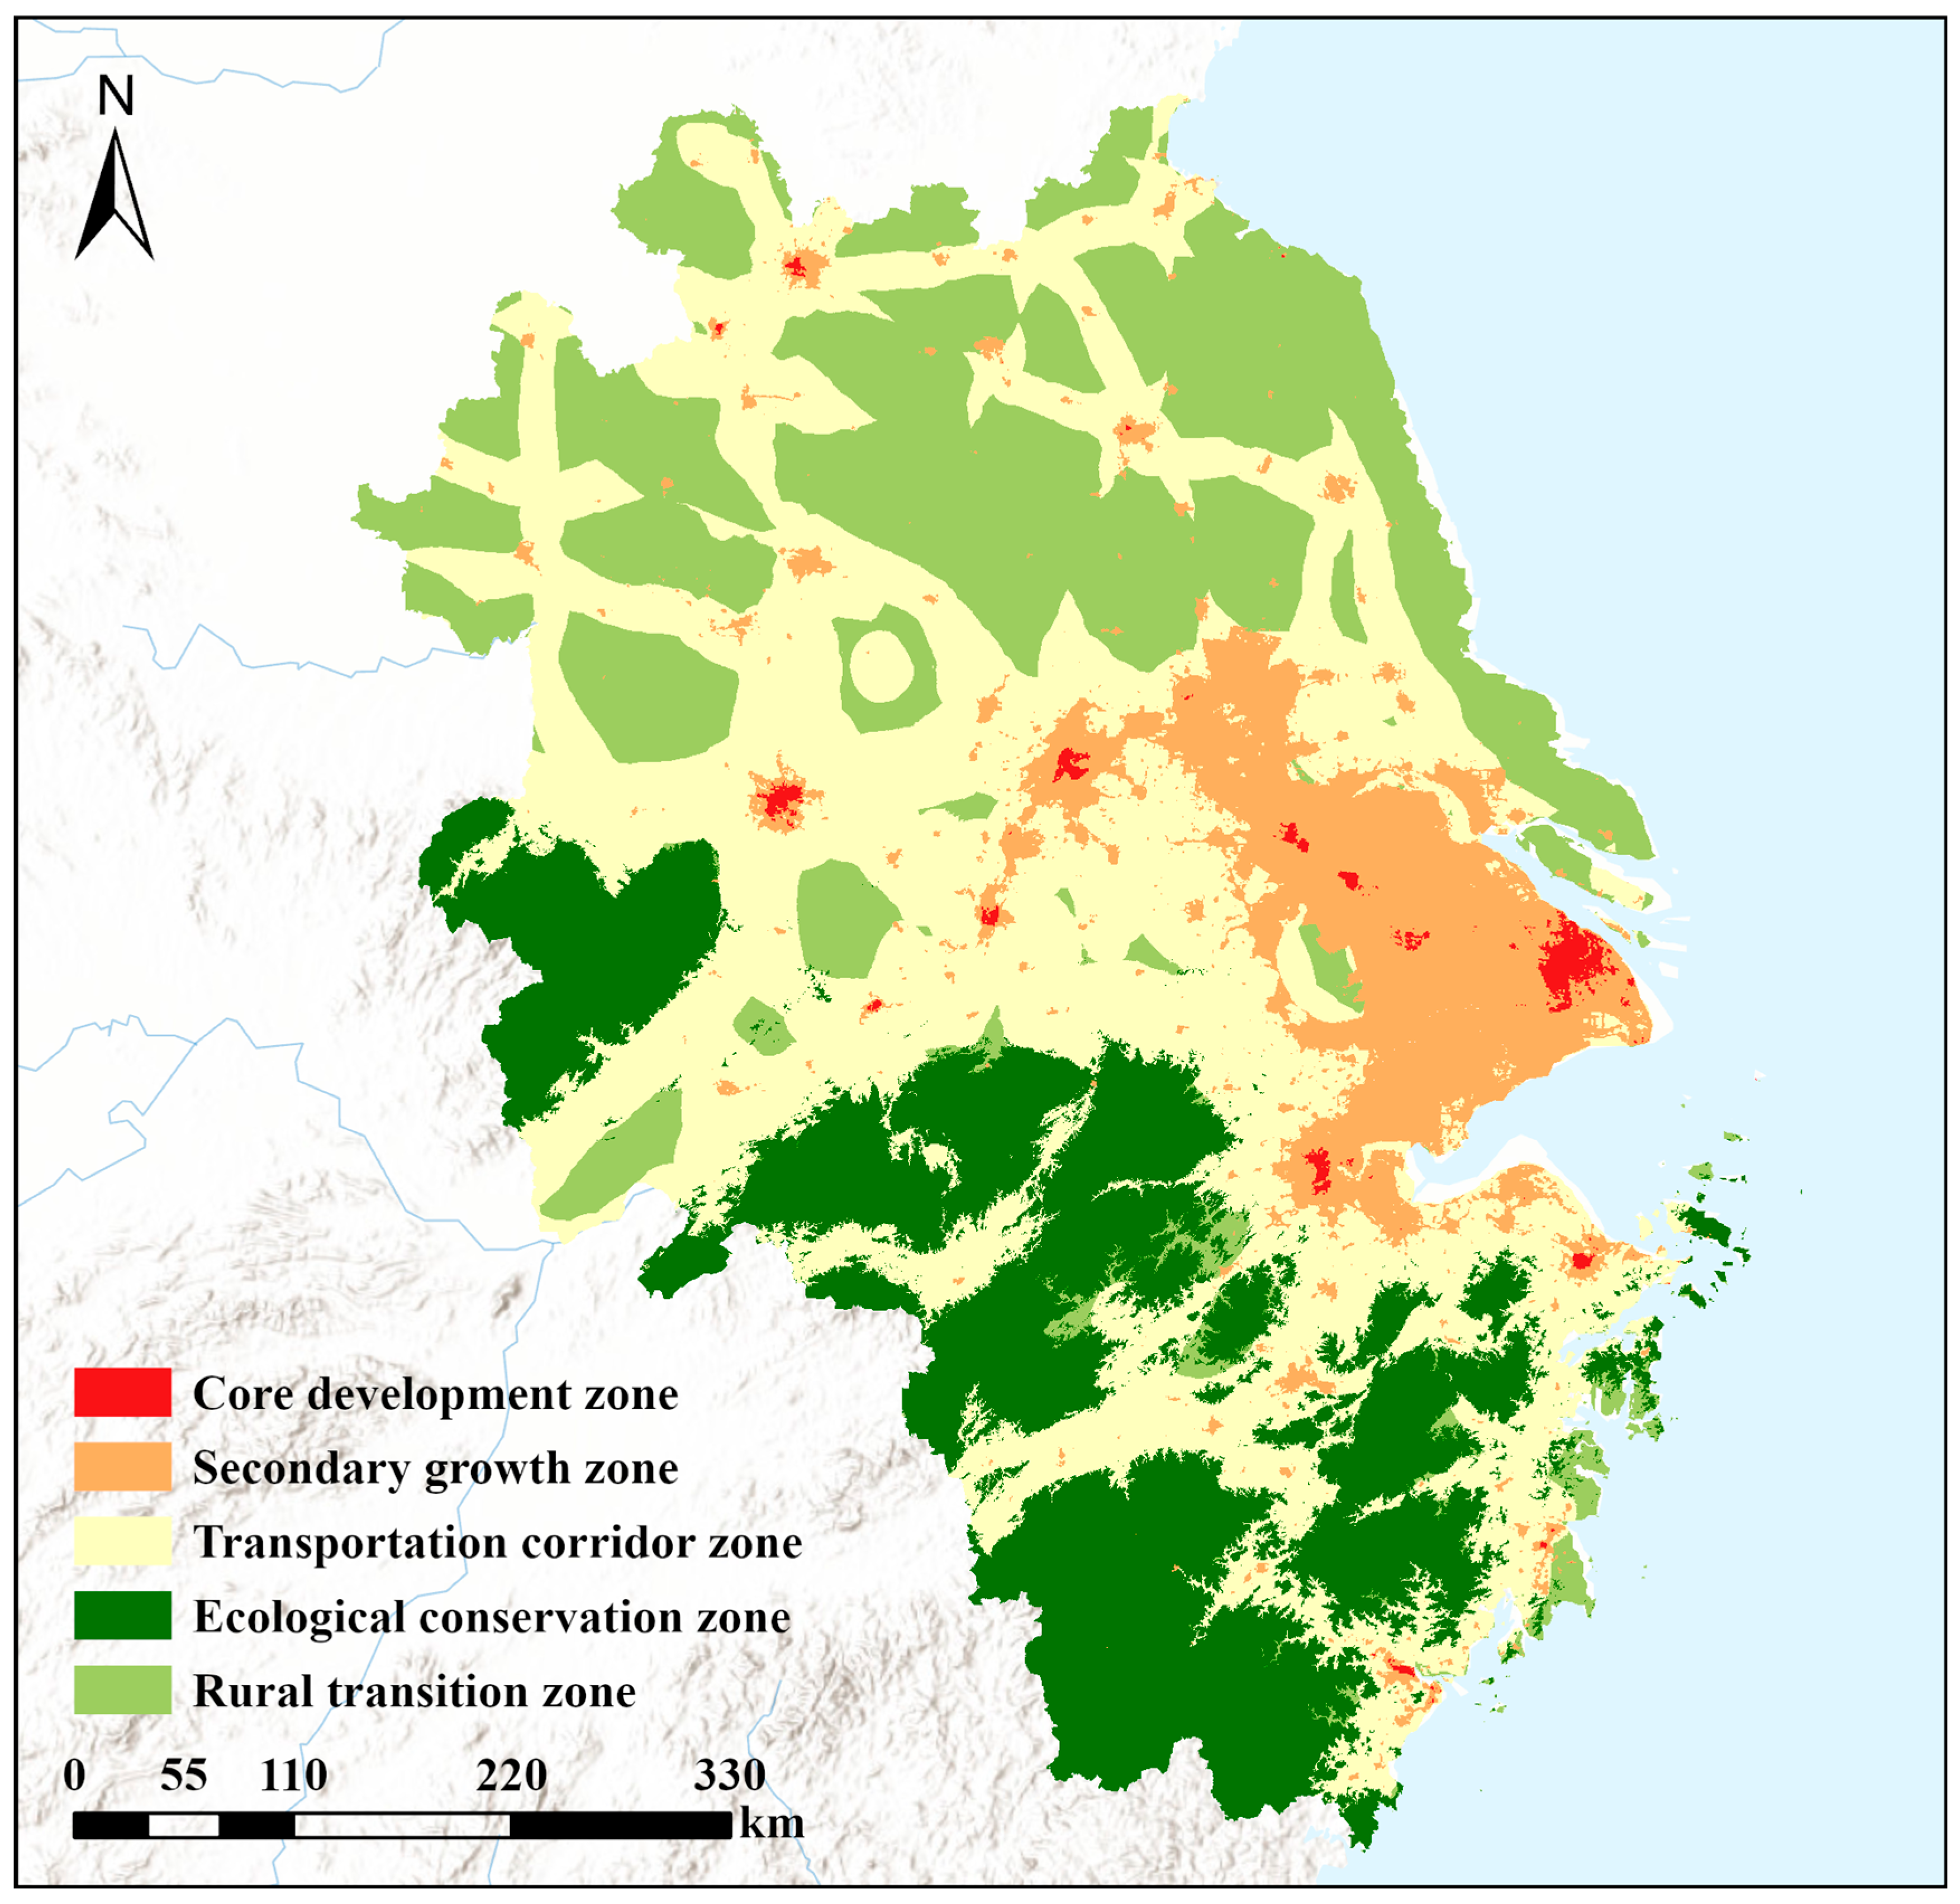
Building upon the optimal k, the resulting five spatial heterogeneity zones (Figure 7) exhibit distinct spatial structures. These zones were interpretively named based on their dominant driving factors and spatial patterns: (1) Core Development Zone: primarily distributed around Shanghai and provincial capitals, characterized by the highest urban construction density and economic intensity; (2) secondary growth zone: located around urban belts such as Nanjing, Hangzhou, and Ningbo, demonstrating a trend of rapid urbanization; (3) Transportation Corridor Zone: distributed in ribbon patterns along high-speed road networks and major transportation axes, significantly influenced by accessibility; (4) ecological conservation zone: mostly encompasses the southwestern hills and the aquatic conservation belts near Taihu Lake and the Yangtze River, where strong ecological sensitivities in these regions necessitate a controlled approach to land-use change; (5) rural transition zone: dominated by extensive agricultural bases with low land development intensity. This result effectively characterizes the significant spatial heterogeneity within the YRD, providing a regional regulatory foundation for the subsequent model and enhancing the spatial adaptability and accuracy of the land expansion simulation.
Figure 7.
Guided K-means clustering for geographical zone.
3.2. Effectiveness and Accuracy of the Coupled Model
3.2.1. Internal Accuracy
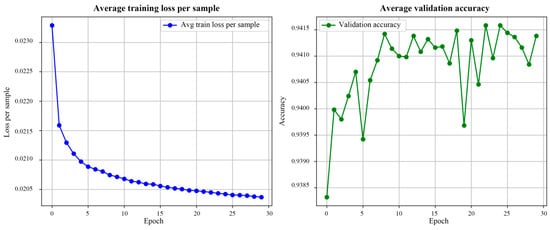
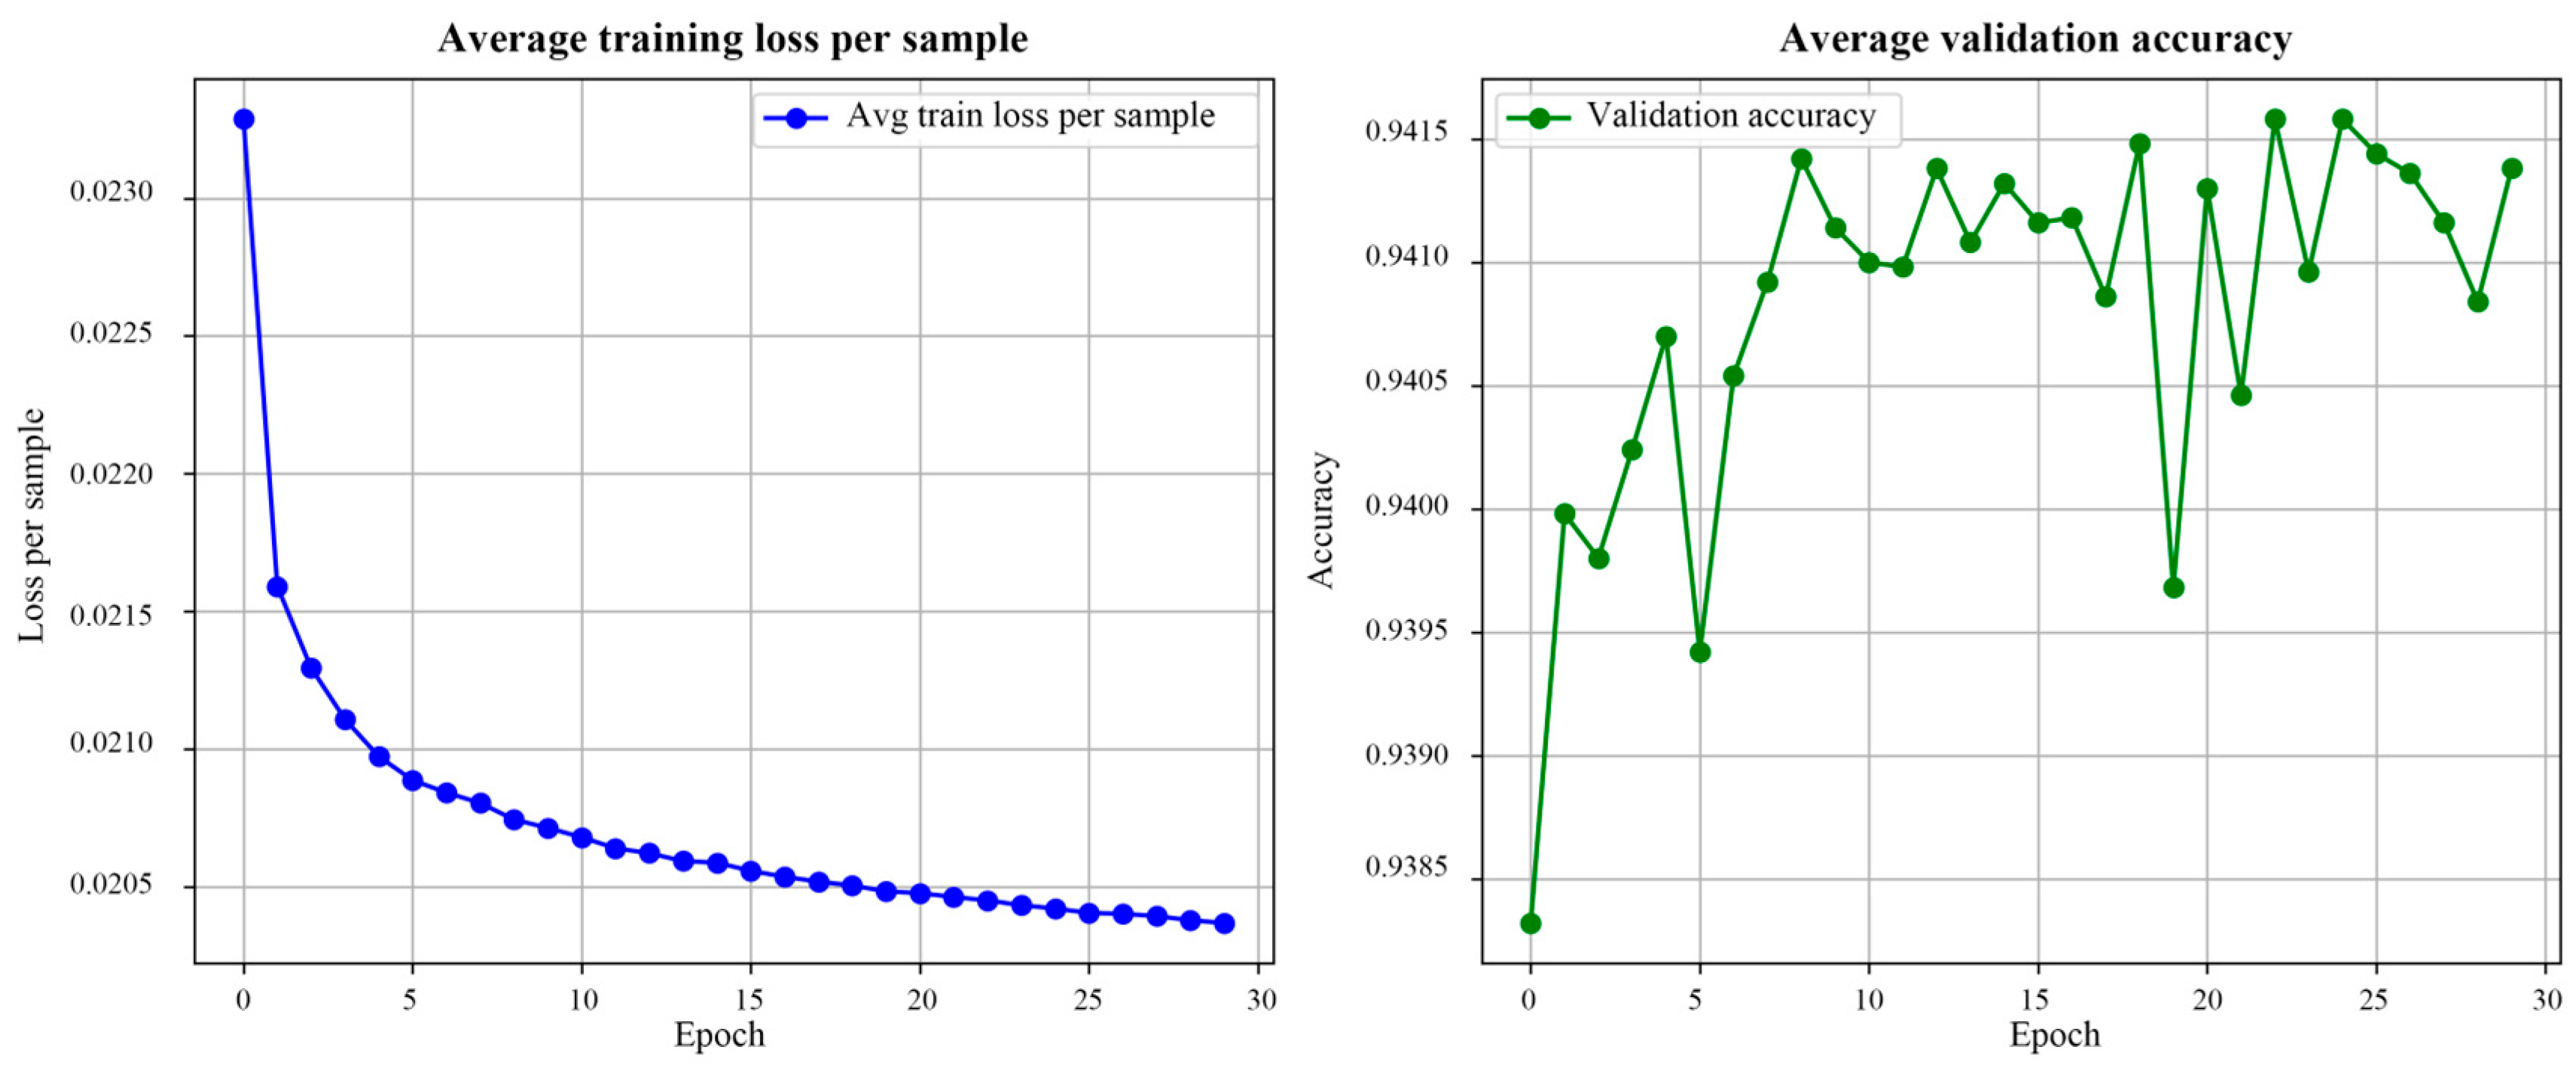
To assess how effectively the CNN-Transformer framework identifies land use transition rules, we introduced a weighted NLLLoss function during the training phase. This approach was designed to constrain the model and address the highly imbalanced distribution of land use types in the YRD. As illustrated in Figure 8, the average loss per sample decreased steadily with the number of iterations and eventually converged smoothly, with no signs of gradient vanishing or significant oscillation. This indicates that the model effectively captured the complex non-linear mapping relationships between driving factors, geographical zones, and historical land use patterns.
Figure 8.
Training parameter curve.
In the 10-fold cross-validation, the OA on the independent validation set remained stable at approximately 0.94, showing a slight upward trend as training progressed. The high degree of stability demonstrates that the explicit embedding of geographical partitioning, combined with the Dropout mechanism, enhanced the generalization capability. Consequently, the model maintained robust feature extraction performance when processing cross-regional and highly heterogeneous geographical samples, avoiding the overfitting risks common in large-scale deep learning simulations. The extreme scarcity of certain land covers, notably unutilized land, causes pixel-wise metrics to fluctuate. These imbalances in the distribution of land use types across space are the primary drivers of the observed instability during the validation phase. To address the potential instability caused by uneven land use distribution, we implemented a sample balancing strategy. Specifically, we assigned higher penalty weights to minority land use types in the loss function, preventing the CNN-Transformer from being biased toward dominant classes like urban built-up areas.
3.2.2. Simulation Accuracy
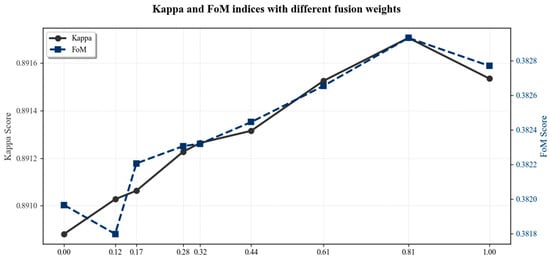
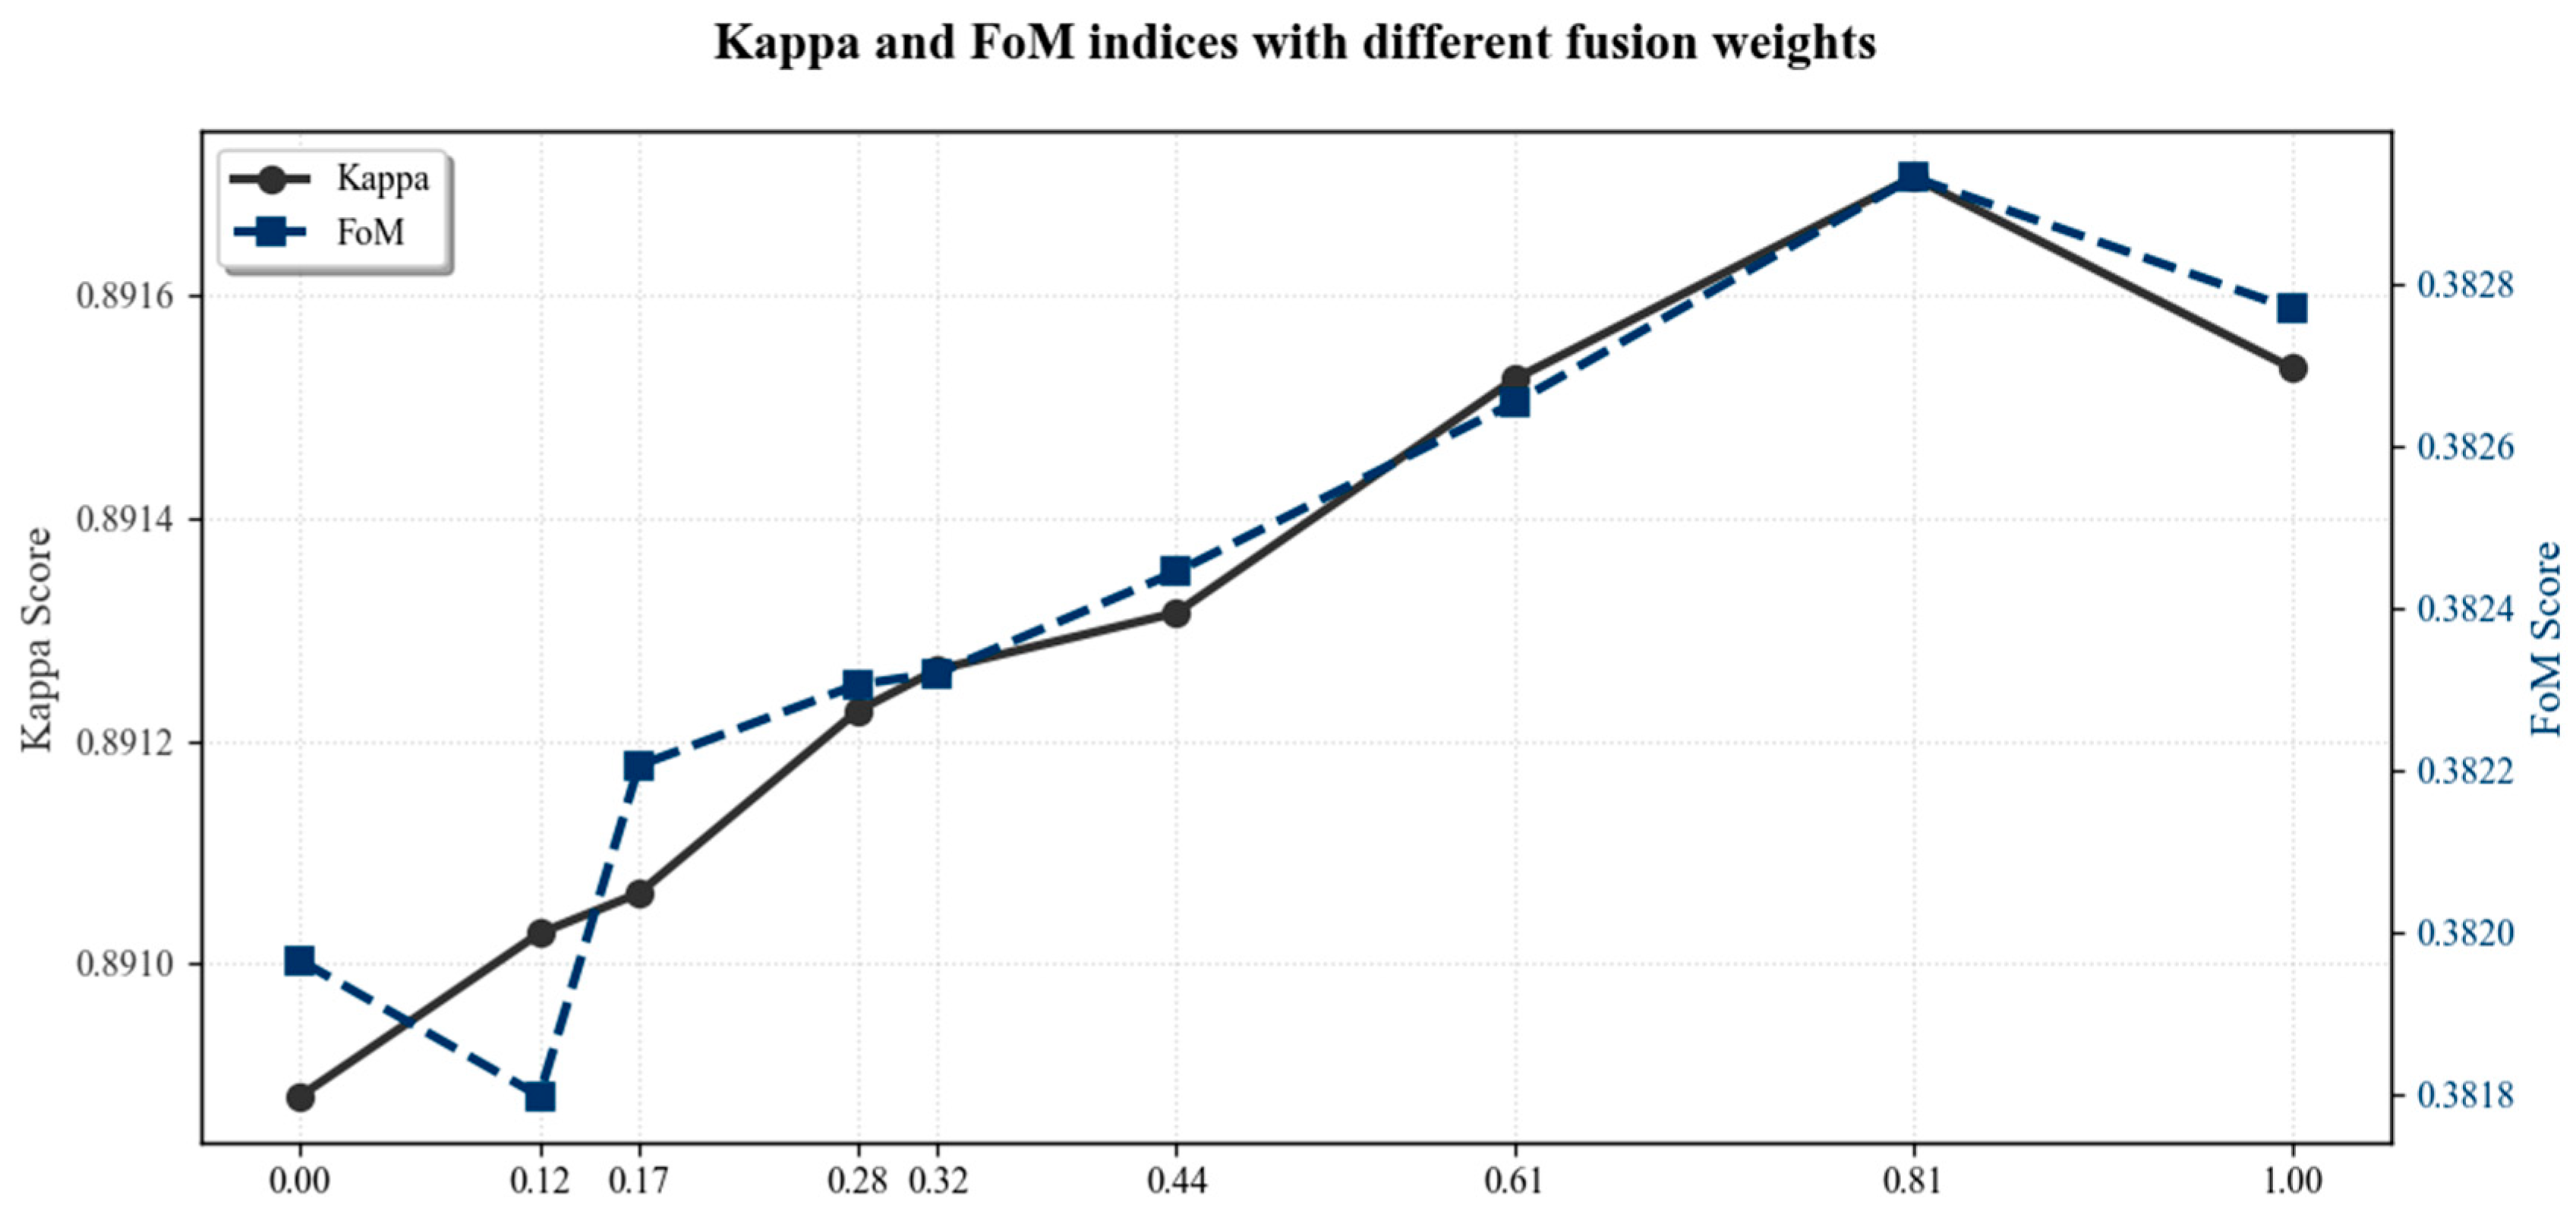
This study integrated the probabilities from the CNN-Transformer with the probabilities from the LEAS module using a weighted fusion approach to construct the final integrated development probabilities. The optimal configuration for the 2020 YRD simulation was identified through weight sensitivity analysis. As illustrated by the accuracy metrics (Kappa and FoM) in Figure 9, the simulation accuracy exhibited a bell-shaped trajectory. Specifically, accuracy continued to improve until a threshold fusion ratio was reached, beyond which the accuracy began to diminish. The model achieved optimal performance when the weight threshold was 0.81, at which point the Kappa coefficient reached a peak of 0.8917 and the FoM score reached 0.3830. This result indicates that at the urban agglomeration scale, the spatial non-linear features captured by deep learning make a dominant contribution to land expansion simulation.
Figure 9.
Accuracy under varying fusion weights.
3.3. Land Use Simulation for 2030 by the GCTP Model
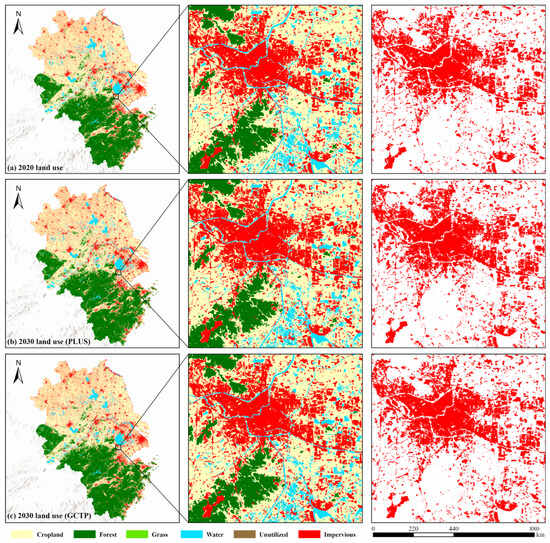
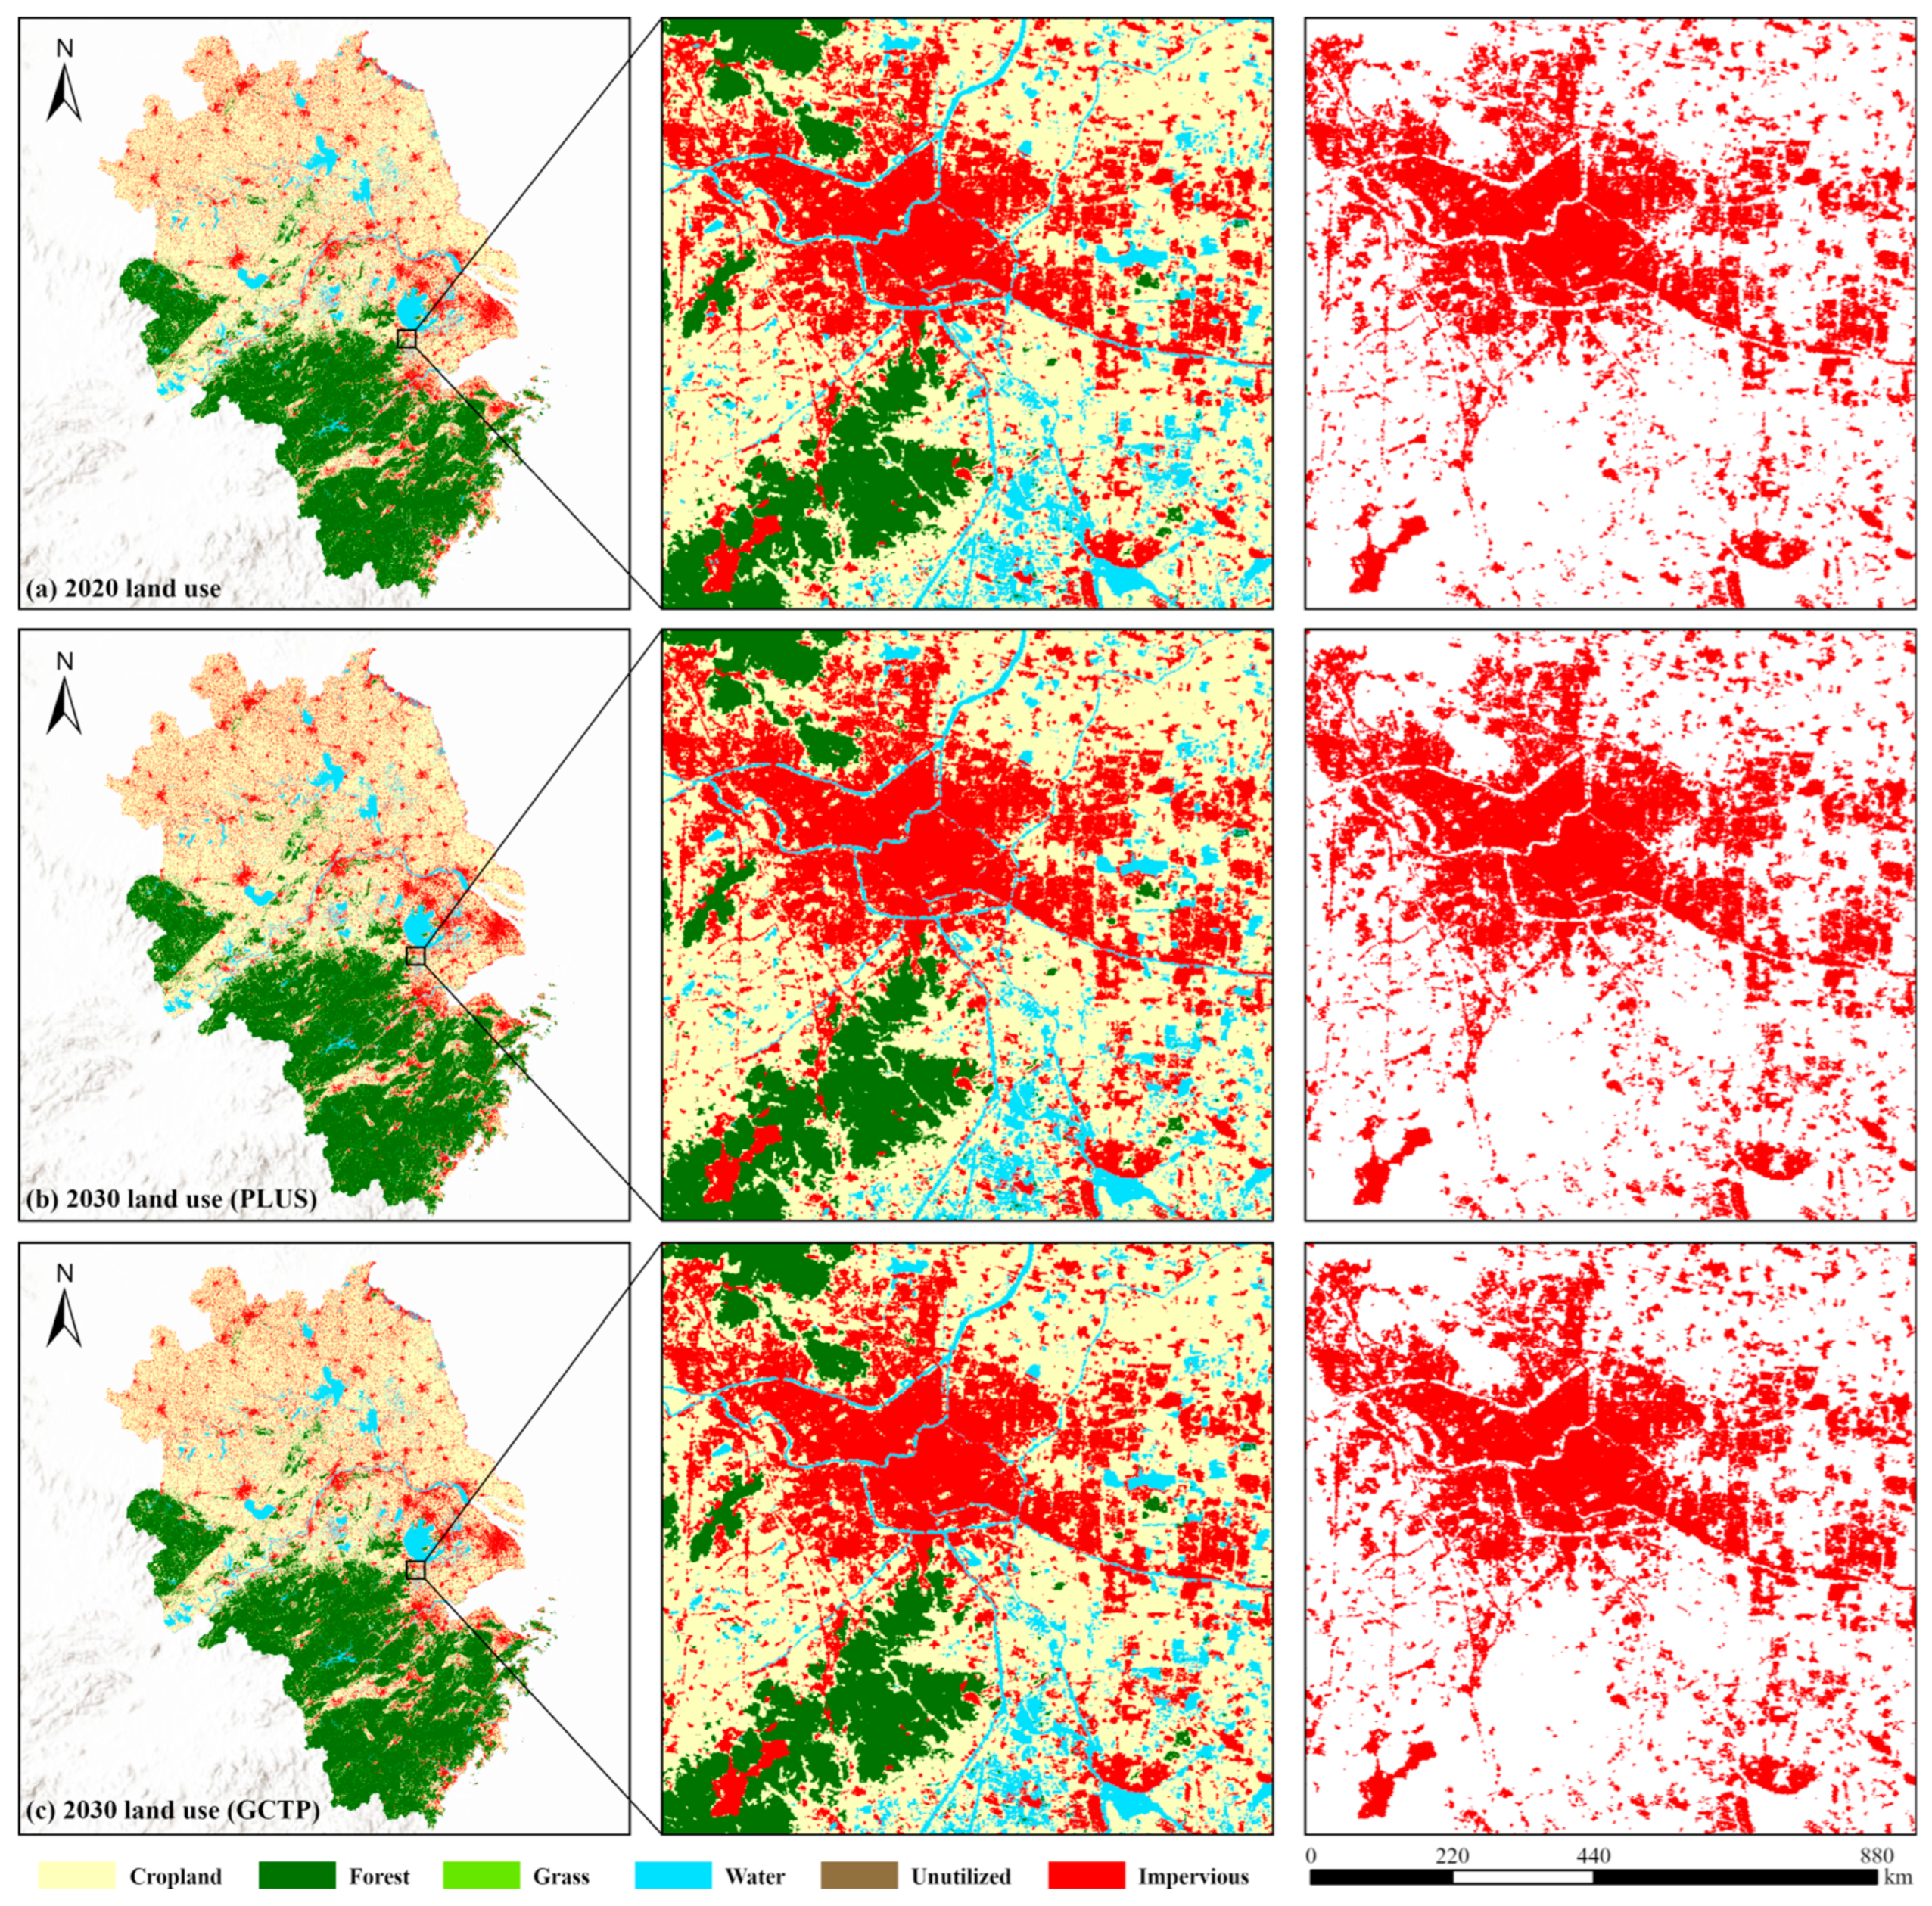
Utilizing the optimal fusion weight (ω = 0.81) determined during the validation phase, the GCTP model was deployed for the 2030 land use pattern in YRD. The high consistency between the simulated and actual 2020 maps provides a robust foundation for the simulation. The validated model was employed to simulate the 2030 land use pattern using the 2010 status as the initial year and 2020 status as the base year. The demand for each land category in 2030 was determined via Markov, while the spatial allocation was executed through the coupled CNN-Transformer and PLUS model. The resulting simulation was compared to the 2020 status and PLUS model outputs (Figure 10) to analyze the shifting dynamics of land expansion over the coming decade.
Figure 10.
Land use map in 2020 and simulations from PLUS and GCTP in 2030.
Simulation results indicate that between 2020 and 2030, the YRD region maintained an evolution trend centered on the expansion of built-up land. The conversion of surrounding cropland is the main source of the extension of built-up land, with expansion activities highly concentrated at existing urban fringes. Benefiting from the constraints imposed by geographical zoning on areas designated as ecological conservation zones, other land use types maintained relative stability in their large-scale spatial distribution. In suburban areas, impervious surfaces exhibit a spatial characteristic of diffusing from the core areas to the periphery. However, differences exist between the models regarding the connectivity and distribution density of expanded patches. Some scattered impervious patches are primarily distributed along transportation networks and around small towns.
Significant variations arise in the local-scale spatial allocation, even though both models exhibit great consistency in the macro-scale modeling of land expansion throughout the YRD region. The standard PLUS model results produced a number of scattered and isolated impervious pixels in rural–urban interfaces and rural hinterlands. In contrast, the growth of impervious surfaces predicted by the GCTP model demonstrates stronger spatial continuity and a clearer tendency toward clustered expansion attached to existing urban patches. This feature suggests that GCTP effectively captures the path-dependent nature of urbanization in the YRD, where growth is increasingly driven by the densification of metropolitan areas and the expansion of transportation corridors. That essentially reflects the model’s capacity to simulate organized, policy-aligned urban growth rather than isolated, spontaneous sprawl. This distinction is crucial for regional planners who focus on integrated urban–rural development and the preservation of large-scale ecological matrices.
4. Discussion
This study proposes a coupled model (GCTP) integrating guided geographical zoning, a CNN-Transformer model, and the PLUS model. Through an empirical study of the YRD, the results confirm the supremacy of the model in capturing spatial heterogeneity and optimizing patch morphology. The subsequent parts provide a detailed discussion of the core mechanisms of the model and their geographical significance.
4.1. Reasonability of Simulation Result from the GCTP Model
Taking the 2020 status as a baseline, this study simulated the 2030 land use pattern in the YRD employing the standard PLUS model and the GCTP model respectively. Overall, both methods maintain the dominant spatial structural features of land use in the YRD, particularly aligning with existing urban development trends in core urban areas where impervious surfaces are highly concentrated. While the simulation results are largely consistent at the macro level, discrepancies emerge in local-scale allocations. For instance, in urban fringes and transition zones, differences appear in the spatial morphology and distribution of impervious patches [63]. These differences suggest that the spatially dependent features derived from the CNN-Transformer help the model identify potential development areas with higher spatial continuity [29]. The resulting simulated landscape aligns with the principles of compact urban development and efficient land management.
Additionally, the simulated expansion patterns are also consistent with the development dynamics of the Yangtze River Delta. Industrial restructuring, population growth, and infrastructure expansion have driven polycentric, corridor-oriented urban growth [54,64], while strict ecological protection policies have effectively constrained development in ecological zones [65]. In particular, large metropolitan areas such as Shanghai, Nanjing, and Hangzhou function as regional growth poles, attracting capital, labor, and technological resources, which in turn stimulates the outward expansion of built-up land along major transportation corridors [66]. These suggest that the coupled framework not only captures spatial statistical relationships but also implicitly reflects the underlying socio-economic mechanisms driving land use evolution in the Yangtze River Delta.
4.2. Guided Geographical Zoning for Mitigating Spatial Non-Stationarity
Traditional simulation models often assume that driving mechanisms are spatially stationary across the entire study area, thereby overlooking the significant regional variations inherent in large-scale urban agglomerations. In this study, guided geographical zoning provides the model with essential regional context. The comparative results indicate that in core urban zones and secondary growth zones, the GCTP model provides a more concentrated characterization of contiguous urban expansion. Conversely, in ecological conservation and rural transition zones, the growth trend of built-up land is relatively limited. This divergence reflects the advantages of partitioned modeling in expressing development constraints and conversion preferences across different regions. As a structural constraint mechanism, guided geographical partitioning assists the model in adhering to differentiated internal development logics while maintaining overall structural stability [67,68,69]. Furthermore, it offers a novel approach for incorporating region-specific policy backgrounds into future simulations. Although the guided zoning strategy effectively mitigates spatial non-stationarity, it may introduce potential edge effects at the boundaries of different sub-regions. While our sliding window mechanism in the CNN-Transformer partially smooths these transitions, future research could explore soft-clustering or Geographically Weighted Neural Networks (GWNN) to achieve more seamless spatial integration. Additionally, further research using geographically weighted regression (GWR) as a baseline for spatial parameterization could provide deeper insights into the performance gains of self-attention mechanisms in urban simulation.
4.3. Advantages of Deep Learning in Capturing Multi-Scale Spatial Dependencies
In this study, the CNN-Transformer network was employed to learn the transition probabilities of land use types, aiming to enhance the comprehensive representation of spatial neighborhood features and temporal evolution characteristics. The findings show that the GCTP model can more meticulously reflect the characteristics of built-up land extending along transportation networks and the patch-like expansion at urban fringes. However, this improvement is primarily manifested in the representation of spatial morphology rather than causing significant shifts in macro-scale expansion trends.
The CNN captures local pixel neighborhood features through convolutional kernels to ensure the smoothness of patch edges, whereas the Transformer architecture utilizes self-attention to bridge the gap between individual pixels and long-distance features. Consequently, the coupled model can identify continuous regions with high development potential, avoiding the generation of random, discrete patches that typically result from relying solely on local rule mining [70]. This further suggests that deep learning models in land use simulation are more suitable as tools for probability modeling and feature extraction rather than as independent spatial evolution models. Compared with traditional machine learning approaches such as logistic regression and RF, deep learning models generally show stronger capability in capturing complex non-linear relationships among multiple driving factors in land-use change processes. Recent studies have also applied CNNs and other deep learning architectures (such as LSTM) to urban growth simulation [29,63]. In this context, the CNN-Transformer framework used in this study further improves spatial representation by integrating local feature extraction with long-range dependency modeling through the self-attention mechanism. This hybrid structure enables the model to better capture both neighborhood-level spatial patterns and broader regional interactions, which is particularly beneficial for large-scale urban agglomerations such as the Yangtze River Delta.
4.4. Uncertainties and Outlook
Although the proposed GCTP framework improves the spatial representation of land expansion, particularly for urban agglomerations with significant spatial heterogeneity and complex development gradients, certain uncertainties and limitations remain. First, the simulation results exhibit high sensitivity to the selection of driving factors and weight settings. Although this study implemented differentiated configurations for driving factors based on geographical partitioning, these parameters are still grounded in historical empirical data and statistical relationships, making it difficult to fully reflect future policy adjustments or sudden scenarios [71]. Regarding the fusion weight between the CNN-Transformer and the LEAS, this empirical value is data-driven and reflects the dominance of long-range spatial dependencies in complex urban agglomerations. But it lacks a generalized theoretical derivation. Consequently, future research should explore adaptive weighting mechanisms that can dynamically adjust based on regional characteristics. Second, the CNN-Transformer model is highly dependent on sample size and spatial resolution. Its predictive stability requires further validation in regions where samples are relatively sparse or where land use type distributions are extremely imbalanced [72]. While the GCTP framework demonstrates excellent performance within the Yangtze River Delta, its applicability across diverse geographical and socio-economic contexts remains to be systematically verified. The current configuration, though tailored to the specific spatial heterogeneity of urban agglomerations, may require recalibration when applied to regions with different urbanization trajectories. Testing the generalizability of the GCTP model across varying spatial configurations and socio-economic settings is essential to validate its versatility and broader utility in land-use science. Furthermore, the results of this study are scenario-based simulations rather than deterministic predictions. The objective is to characterize potential spatial evolution trends rather than provide a precise, definitive depiction of the land use pattern in 2030.
Future research could be expanded in the following directions: (1) dynamic driving factors: incorporating multi-temporal dynamic drivers to further capture the spatiotemporal evolution trends of driving forces; (2) policy-oriented scenarios: integrating differentiated policy backgrounds into the guided zoning to design simulations that provide more precise decision-making support for territorial spatial planning; (3) uncertainty quantification: exploring methods for uncertainty quantification to express the confidence intervals of land use simulation results.
5. Conclusions
This study addresses the challenges of modeling spatial non-stationarity and spatial dependencies in large-scale urban agglomeration land expansion simulations by constructing the GCTP framework. Through an empirical analysis of the YRD, the primary conclusions are as follows:
- The GCTP model incorporating geographical zoning demonstrates improved capability in capturing heterogeneity: Five geographic zones determined through joint analysis of k-means clustering and prior matrices provide the model with critical regional heterogeneity prior information. By introducing this zoning mechanism, the coupled framework maintains more stable pixel-level recognition performance than the standard PLUS model. The coupled model effectively alleviates spatial non-stationarity across the study area, achieving an overall accuracy (OA) of 94.1%.
- Deep learning characterization of spatiotemporal features optimizes simulation precision: The study found that model performance peaked at a fusion weight of 0.81, with a Kappa of 0.8917 and an FoM of 0.3830. This demonstrates the effectiveness of the coupling strategy in simulating complex geographical evolutions.
- CNN-Transformer effectively improves the spatial morphology of simulated patterns: Compared to the single PLUS model, the 2030 land use patterns simulated by the GCTP framework exhibit stronger spatial continuity and intensity. The global self-attention of the Transformer means that the model significantly reduces fragmented patches at urban fringes. Consequently, the simulated urban footprint exhibits a more continuous and integrated structure, which is highly consistent with the strategic logic of intensive regional development.
- The YRD will exhibit distinct non-uniform expansion characteristics by 2030: Simulations indicate that the YRD will continue its radial expansion toward the periphery over the next decade. Urban expansion is primarily concentrated in Core Development Zones and along transportation corridors, posing continuous pressure on surrounding cropland. Simultaneously, geographical zoning constraints maintain the spatial integrity of forest land and water bodies within ecological conservation zones. This stability supplies scientific background information and references for delineating ecological redlines and territorial spatial planning.
In summary, while maintaining high statistical accuracy, the GCTP model demonstrates significant advantages in restoring spatial morphology and expressing regional heterogeneity. It provides robust scientific support for the optimized allocation of land and sustainable development in rapidly urbanizing regions. This study offers a feasible pathway for integrating deep learning methods into CA-based land simulation models and provides novel insights for land use simulation in complex regions. Future research can be further extended by incorporating multi-temporal drivers, manifesting cross-regional policy context. Adding policy factors, such as ecological policies, could provide more specific strategies for ecological protection and regional development planning. These efforts would enhance the practical value of the coupled model for strategic spatial governance and adaptive land-use management.
Author Contributions
Conceptualization, L.M. and J.X.; methodology, L.M. and G.T.; software, L.M.; validation, L.M. and J.X.; formal analysis, J.X.; investigation, L.M.; resources, L.M. and G.T.; data curation, J.X. and T.Z.; writing—original draft preparation, L.M.; writing—review and editing, L.M., G.T., T.Z. and L.C.; visualization, L.M.; supervision, L.C.; project administration, T.Z.; funding acquisition, L.C. All authors have read and agreed to the published version of the manuscript.
Funding
This research was funded by the Graduate Research and Innovation Projects of Jiangsu Province, grant number No. KYCX25_2860 and the Graduate Innovation Program of China University of Mining and Technology, grant number 2025WLKXJ149, supported by “the Fundamental Research Funds for the Central Universities”.
Data Availability Statement
Data will be made available on request.
Acknowledgments
We would like to thank the Geospatial Data Cloud, China’s National Tibetan Plateau Data Center, Open Street Map and Earth Observation Group for access to the data. We gratefully acknowledge the anonymous reviewers and the editors for their comments and suggestions that improved this manuscript.
Conflicts of Interest
The authors declare no conflicts of interest. The funders had no role in the design of the study; in the collection, analyses, or interpretation of data; in the writing of the manuscript; or in the decision to publish the results.
Appendix A
Appendix A.1. Model Training Information
The CNN-Transformer model was implemented using PyTorch 2.5.1 and trained on a computer equipped with an NVIDIA RTX 4060Ti GPU, an Intel i5-12600KF CPU, and 64 GB of memory. Training the model on approximately 780 million pixels within the study area required roughly 6–8 h per fold in a 10-fold cross-validation setup. The research was implemented using Python, version 3.11.13.
Appendix A.2. Parameters of CARS Module in PLUS
Table A1.
Neighborhood weights.
Table A2.
Transition matrix.
References
- Halefom, A.; He, Y.; Nemoto, T.; Feng, L.; Li, R.; Raghavan, V.; Jing, G.; Song, X.; Duan, Z. The Impact of Urbanization-Induced Land Use Change on Land Surface Temperature. Remote Sens. 2024, 16, 4502. [Google Scholar] [CrossRef] [Scilit]
- Li, S.; He, Y.; Xu, H.; Zhu, C.; Dong, B.; Lin, Y.; Si, B.; Deng, J.; Wang, K. Impacts of Urban Expansion Forms on Ecosystem Services in Urban Agglomerations: A Case Study of Shanghai-Hangzhou Bay Urban Agglomeration. Remote Sens. 2021, 13, 1908. [Google Scholar] [CrossRef] [Scilit]
- Zhang, J.; Wu, D.; Zhu, A.-X.; Zhu, Y. Modelling Urban Expansion with Cellular Automata Supported by Urban Growth Intensity over Time. Ann. GIS 2023, 29, 337–353. [Google Scholar] [CrossRef] [Scilit]
- Sun, J.; He, Q.; Wang, H. CA-Based Urban Growth Model Considering the Temporal Dynamic Adjustment of Local Spatial Driving Factors: An Application in Wuhan City. Heliyon 2024, 10, e30678. [Google Scholar] [CrossRef] [Scilit] [PubMed]
- Yu, Z.; Chen, L.; Li, L.; Zhang, T.; Yuan, L.; Liu, R.; Wang, Z.; Zang, J.; Shi, S. Spatiotemporal Characterization of the Urban Expansion Patterns in the Yangtze River Delta Region. Remote Sens. 2021, 13, 4484. [Google Scholar] [CrossRef] [Scilit]
- Liu, M.; Xiong, Y.; Zhang, A. Multi-Scale Telecoupling Effects of Land Use Change on Ecosystem Services in Urban Agglomerations—A Case Study in the Middle Reaches of Yangtze River Urban Agglomerations. J. Clean. Prod. 2023, 415, 137878. [Google Scholar] [CrossRef] [Scilit]
- Wang, X.; Che, L.; Zhou, L.; Xu, J. Spatio-Temporal Dynamic Simulation of Land Use and Ecological Risk in the Yangtze River Delta Urban Agglomeration, China. Chin. Geogr. Sci. 2021, 31, 829–847. [Google Scholar] [CrossRef] [Scilit]
- Chen, G.; Li, X.; Liu, X.; Chen, Y.; Liang, X.; Leng, J.; Xu, X.; Liao, W.; Qiu, Y.; Wu, Q.; et al. Global Projections of Future Urban Land Expansion under Shared Socioeconomic Pathways. Nat. Commun. 2020, 11, 537. [Google Scholar] [CrossRef] [Scilit]
- Zhang, Y.; Kwan, M.-P.; Yang, J. A User-Friendly Assessment of Six Commonly Used Urban Growth Models. Comput. Environ. Urban Syst. 2023, 104, 102004. [Google Scholar] [CrossRef] [Scilit]
- Liu, Y.; Hu, Y.; Long, S.; Liu, L.; Liu, X. Analysis of the Effectiveness of Urban Land-Use-Change Models Based on the Measurement of Spatio-Temporal, Dynamic Urban Growth: A Cellular Automata Case Study. Sustainability 2017, 9, 796. [Google Scholar] [CrossRef] [Scilit]
- Liu, X.; Liang, X.; Li, X.; Xu, X.; Ou, J.; Chen, Y.; Li, S.; Wang, S.; Pei, F. A Future Land Use Simulation Model (FLUS) for Simulating Multiple Land Use Scenarios by Coupling Human and Natural Effects. Landsc. Urban Plan. 2017, 168, 94–116. [Google Scholar] [CrossRef] [Scilit]
- Guo, P.; Wang, H.; Qin, F.; Miao, C.; Zhang, F. Coupled MOP and PLUS-SA Model Research on Land Use Scenario Simulations in Zhengzhou Metropolitan Area, Central China. Remote Sens. 2023, 15, 3762. [Google Scholar] [CrossRef] [Scilit]
- Liu, J.; Liu, B.; Wu, L.; Miao, H.; Liu, J.; Jiang, K.; Ding, H.; Gao, W.; Liu, T. Prediction of Land Use for the next 30 Years Using the PLUS Model’s Multi-Scenario Simulation in Guizhou Province, China. Sci. Rep. 2024, 14, 13143. [Google Scholar] [CrossRef] [Scilit]
- Koko, A.F.; Han, Z.; Wu, Y.; Zhang, S.; Ding, N.; Luo, J. Spatiotemporal Analysis and Prediction of Urban Land Use/Land Cover Changes Using a Cellular Automata and Novel Patch-Generating Land Use Simulation Model: A Study of Zhejiang Province, China. Land 2023, 12, 1525. [Google Scholar] [CrossRef] [Scilit]
- Yang, J.; Gong, J.; Tang, W.; Liu, C. Patch-Based Cellular Automata Model of Urban Growth Simulation: Integrating Feedback between Quantitative Composition and Spatial Configuration. Comput. Environ. Urban Syst. 2020, 79, 101402. [Google Scholar] [CrossRef] [Scilit]
- He, F.; Yang, J.; Zhang, Y.; Yu, W.; Xiao, X.; Xia, J. Does Partition Matter? A New Approach to Modeling Land Use Change. Comput. Environ. Urban Syst. 2023, 106, 102041. [Google Scholar] [CrossRef] [Scilit]
- Tong, X.; Feng, Y. A Review of Assessment Methods for Cellular Automata Models of Land-Use Change and Urban Growth. Int. J. Geogr. Inf. Sci. 2020, 34, 866–898. [Google Scholar] [CrossRef] [Scilit]
- Gao, C.; Feng, Y.; Tong, X.; Lei, Z.; Chen, S.; Zhai, S. Modeling Urban Growth Using Spatially Heterogeneous Cellular Automata Models: Comparison of Spatial Lag, Spatial Error and GWR. Comput. Environ. Urban Syst. 2020, 81, 101459. [Google Scholar] [CrossRef] [Scilit]
- Liang, X.; Guan, Q.; Clarke, K.C.; Liu, S.; Wang, B.; Yao, Y. Understanding the Drivers of Sustainable Land Expansion Using a Patch-Generating Land Use Simulation (PLUS) Model: A Case Study in Wuhan, China. Comput. Environ. Urban Syst. 2021, 85, 101569. [Google Scholar] [CrossRef] [Scilit]
- Xu, L.; Liu, X.; Tong, D.; Liu, Z.; Yin, L.; Zheng, W. Forecasting Urban Land Use Change Based on Cellular Automata and the PLUS Model. Land 2022, 11, 652. [Google Scholar] [CrossRef] [Scilit]
- Thottolil, R.; Kumar, U.; Mundayatt, A. Predicting Urban Expansion Using A Patch-Generating Land Use Simulation (PLUS) Model: A Case Study of Bangalore City, India. In Proceedings of the 2023 IEEE India Geoscience and Remote Sensing Symposium (InGARSS), Bangalore, India, 10–13 December 2023; pp. 1–4. [Google Scholar]
- Zhou, H.; Tang, M.; Huang, J.; Mei, X.; Zhao, H. Driving Mechanisms and Multi-Scenario Simulation of Land Use Change Based on National Land Survey Data: A Case in Jianghan Plain, China. Front. Environ. Sci. 2024, 12, 1422987. [Google Scholar] [CrossRef] [Scilit]
- Mutale, B.; Qiang, F. Modeling Future Land Use and Land Cover under Different Scenarios Using Patch-Generating Land Use Simulation Model. A Case Study of Ndola District. Front. Environ. Sci. 2024, 12, 1362666. [Google Scholar] [CrossRef] [Scilit]
- Wang, Z.; Gao, Y.; Wang, X.; Lin, Q.; Li, L. A New Approach to Land Use Optimization and Simulation Considering Urban Development Sustainability: A Case Study of Bortala, China. Sustain. Cities Soc. 2022, 87, 104135. [Google Scholar] [CrossRef] [Scilit]
- Azizi, P.; Soltani, A.; Bagheri, F.; Sharifi, S.; Mikaeili, M. An Integrated Modelling Approach to Urban Growth and Land Use/Cover Change. Land 2022, 11, 1715. [Google Scholar] [CrossRef] [Scilit]
- Kussul, N.; Lavreniuk, M.; Skakun, S.; Shelestov, A. Deep Learning Classification of Land Cover and Crop Types Using Remote Sensing Data. IEEE Geosci. Remote Sens. Lett. 2017, 14, 778–782. [Google Scholar] [CrossRef] [Scilit]
- Kattenborn, T.; Leitloff, J.; Schiefer, F.; Hinz, S. Review on Convolutional Neural Networks (CNN) in Vegetation Remote Sensing. ISPRS J. Photogramm. Remote Sens. 2021, 173, 24–49. [Google Scholar] [CrossRef] [Scilit]
- Albarakati, H.M.; Khan, M.A.; Hamza, A.; Khan, F.; Kraiem, N.; Jamel, L.; Almuqren, L.; Alroobaea, R. A Novel Deep Learning Architecture for Agriculture Land Cover and Land Use Classification from Remote Sensing Images Based on Network-Level Fusion of Self-Attention Architecture. IEEE J. Sel. Top. Appl. Earth Obs. Remote Sens. 2024, 17, 6338–6353. [Google Scholar] [CrossRef] [Scilit]
- Huang, C.; Zhou, Y.; Wu, T.; Zhang, M.; Qiu, Y. A Cellular Automata Model Coupled with Partitioning CNN-LSTM and PLUS Models for Urban Land Change Simulation. J. Environ. Manag. 2024, 351, 119828. [Google Scholar] [CrossRef] [Scilit]
- Liu, B.; Chen, S.; Gao, L. Combining Residual Convolutional LSTM with Attention Mechanisms for Spatiotemporal Forest Cover Prediction. Environ. Model. Softw. 2025, 183, 106260. [Google Scholar] [CrossRef] [Scilit]
- Chakraborty, A.; Sikder, S.; Omrani, H.; Teller, J. Cellular Automata in Modeling and Predicting Urban Densification: Revisiting the Literature since 1971. Land 2022, 11, 1113. [Google Scholar] [CrossRef] [Scilit]
- Zhou, Y.; Huang, C.; Wu, T.; Zhang, M. A Novel Spatio-Temporal Cellular Automata Model Coupling Partitioning with CNN-LSTM to Urban Land Change Simulation. Ecol. Model. 2023, 482, 110394. [Google Scholar] [CrossRef] [Scilit]
- Jing, S.; Yan, Y.; Niu, F.; Song, W. Urban Expansion in China: Spatiotemporal Dynamics and Determinants. Land 2022, 11, 356. [Google Scholar] [CrossRef] [Scilit]
- Liu, J.; Xiao, B.; Li, Y.; Wang, X.; Bie, Q.; Jiao, J. Simulation of Dynamic Urban Expansion under Ecological Constraints Using a Long Short Term Memory Network Model and Cellular Automata. Remote Sens. 2021, 13, 1499. [Google Scholar] [CrossRef] [Scilit]
- Wang, J.; Zhang, J.; Xiong, N.; Liang, B.; Wang, Z.; Cressey, E.L. Spatial and Temporal Variation, Simulation and Prediction of Land Use in Ecological Conservation Area of Western Beijing. Remote Sens. 2022, 14, 1452. [Google Scholar] [CrossRef] [Scilit]
- Saulawa, U.A.; Ibrahim, Y.; Bello, A. Assessing the Suitability of the SLEUTH Cellular Automata Model for Capturing Heterogeneous Urban Growth in Developing Cities: A Case Study in Northern Nigeria. Heliyon 2024, 10, e36504. [Google Scholar] [CrossRef] [Scilit]
- Li, J.; Zheng, P.; Wang, L. Remote Sensing Image Change Detection Based on Lightweight Transformer and Multiscale Feature Fusion. IEEE J. Sel. Top. Appl. Earth Obs. Remote Sens. 2025, 18, 5460–5473. [Google Scholar] [CrossRef] [Scilit]
- Chen, H.; Qi, Z.; Shi, Z. Remote Sensing Image Change Detection With Transformers. IEEE Trans. Geosci. Remote Sens. 2022, 60, 1–14. [Google Scholar] [CrossRef] [Scilit]
- Rubab, S.; Khan, M.A.; Hamza, A.; Albarakati, H.M.; Saidani, O.; Alshardan, A.; Alasiry, A.; Marzougui, M.; Nam, Y. A Novel Network-Level Fusion Architecture of Proposed Self-Attention and Vision Transformer Models for Land Use and Land Cover Classification From Remote Sensing Images. IEEE J. Sel. Top. Appl. Earth Obs. Remote Sens. 2024, 17, 13135–13148. [Google Scholar] [CrossRef] [Scilit]
- Roy, S.K.; Sukul, A.; Jamali, A.; Haut, J.M.; Ghamisi, P. Cross Hyperspectral and LiDAR Attention Transformer: An Extended Self-Attention for Land Use and Land Cover Classification. IEEE Trans. Geosci. Remote Sens. 2024, 62, 1–15. [Google Scholar] [CrossRef] [Scilit]
- Gao, Y.; Liu, D.; Zheng, X.; Wang, X.; Ai, G. Urban Expansion Scenario Prediction Model: Combining Multi-Source Big Data, a Graph Attention Network, a Vector Cellular Automata, and an Agent-Based Model. Remote Sens. 2025, 17, 2272. [Google Scholar] [CrossRef] [Scilit]
- Wang, F.; Marceau, D.J. A Patch-Based Cellular Automaton for Simulating Land-Use Changes at Fine Spatial Resolution. Trans. GIS 2013, 17, 828–846. [Google Scholar] [CrossRef] [Scilit]
- Guan, X.; Xing, W.; Li, J.; Wu, H. HGAT-VCA: Integrating High-Order Graph Attention Network with Vector Cellular Automata for Urban Growth Simulation. Comput. Environ. Urban. Syst. 2023, 99, 101900. [Google Scholar] [CrossRef] [Scilit]
- Du, Z.; Wang, Z.; Wu, S.; Zhang, F.; Liu, R. Geographically Neural Network Weighted Regression for the Accurate Estimation of Spatial Non-Stationarity. Int. J. Geogr. Inf. Sci. 2020, 34, 1353–1377. [Google Scholar] [CrossRef] [Scilit]
- Feng, Y.; Tong, X. Dynamic Land Use Change Simulation Using Cellular Automata with Spatially Nonstationary Transition Rules. GISci. Remote Sens. 2018, 55, 678–698. [Google Scholar] [CrossRef] [Scilit]
- Zhu, Y.; Yang, S.; Lin, J.; Cai, A. Pattern and Effect of Economic Agglomeration in the Yangtze River Delta Region Based on Population-Land Allometric Growth. Front. Earth Sci. 2023, 11, 1112423. [Google Scholar] [CrossRef] [Scilit]
- Jing, Y.; Yang, Y.; Lang, Y.; Miao, Q. Contradiction or Coordination? Spatial Heterogeneity Between Urbanization and Green Development in the Yangtze River Delta Region, China. Urban Sci. 2025, 9, 89. [Google Scholar] [CrossRef] [Scilit]
- Zhao, B.; Wang, Y.; Geng, H.; Jiang, X.; Li, L. Spatial Expansion Characteristics and Nonlinear Relationships of Driving Factors in Urban Agglomerations: A Case Study of the Yangtze River Delta Urban Agglomeration in China. Land 2024, 13, 1951. [Google Scholar] [CrossRef] [Scilit]
- Yang, J.; Huang, X. The 30 m Annual Land Cover Dataset and Its Dynamics in China from 1990 to 2019. Earth Syst. Sci. Data 2021, 13, 3907–3925. [Google Scholar] [CrossRef] [Scilit]
- Wang, R.; Li, J. Fast Sparse Representative Tree Splitting via Local Density for Large-Scale Clustering. Sci. Rep. 2025, 15, 29398. [Google Scholar] [CrossRef] [Scilit]
- Fränti, P.; Sieranoja, S. K-Means Properties on Six Clustering Benchmark Datasets. Appl. Intell. 2018, 48, 4743–4759. [Google Scholar] [CrossRef] [Scilit]
- Ikotun, A.M.; Habyarimana, F.; Ezugwu, A.E. Benchmarking Validity Indices for Evolutionary K-Means Clustering Performance. Sci. Rep. 2025, 15, 21842. [Google Scholar] [CrossRef] [Scilit]
- Arthur, D.; Vassilvitskii, S. K-Means++: The Advantages of Careful Seeding. In Proceedings of the Eighteenth Annual ACM-SIAM Symposium on Discrete Algorithms, New Orleans, LA, USA, 7 January 2007; Society for Industrial and Applied Mathematics: Philadelphia, PA, USA, 2007; pp. 1027–1035. [Google Scholar]
- Zhai, D.; Zhang, X.; Zhuo, J.; Mao, Y. Driving the Evolution of Land Use Patterns: The Impact of Urban Agglomeration Construction Land in the Yangtze River Delta, China. Land 2024, 13, 1514. [Google Scholar] [CrossRef] [Scilit]
- Wu, Y.; Han, Z.; Koko, A.F.; Zhang, S. Spatio-Temporal Analysis of the Driving Factors of Urban Land Use Expansion in China: A Study of the Yangtze River Delta Region. Open Geosci. 2024, 16, 20220609. [Google Scholar] [CrossRef] [Scilit]
- Zeng, Z.; Wang, J. Research on Land Use Change and the Contribution Degree of Its Driving Force Factors: A Case Study of the Yangtze River Delta, China. J. Innov. Dev. 2025, 11, 244–259. [Google Scholar] [CrossRef] [Scilit]
- Zhang, Z.; Wang, X.; Zhang, Y.; Gao, Y.; Liu, Y.; Sun, X.; Zhi, J.; Yin, S. Simulating Land Use Change for Sustainable Land Management in Rapid Urbanization Regions: A Case Study of the Yangtze River Delta Region. Landsc. Ecol. 2023, 38, 1807–1830. [Google Scholar] [CrossRef] [Scilit]
- Goodfellow, I.; Bengio, Y.; Courville, A. Deep Learning; MIT Press: Cambridge, MA, USA, 2016; ISBN 978-0-262-03561-3. [Google Scholar]
- Vaswani, A.; Shazeer, N.; Parmar, N.; Uszkoreit, J.; Jones, L.; Gomez, A.N.; Kaiser, L.; Polosukhin, I. Attention Is All You Need. Adv. Neural Inf. Process. Syst. 2017, 30. [Google Scholar] [CrossRef] [Scilit]
- Li, C.; Wu, Y.; Gao, B.; Zheng, K.; Wu, Y.; Li, C. Multi-Scenario Simulation of Ecosystem Service Value for Optimization of Land Use in the Sichuan-Yunnan Ecological Barrier, China. Ecol. Indic. 2021, 132, 108328. [Google Scholar] [CrossRef] [Scilit]
- Zhao, X.; Rao, Z.; Lin, J.; Zhang, X. Scenario Forecasting of Carbon Neutrality by Combining the LEAP Model and Future Land-Use Simulation: An Empirical Study of Shenzhen, China. Sustain. Cities Soc. 2025, 125, 106367. [Google Scholar] [CrossRef] [Scilit]
- Han, Y.; Chen, Y. Scenario Simulation and Spatial Management Implications of Water Ecosystem Services in the Guangdong-Hong Kong-Macao Greater Bay Area (2035). Water 2025, 17, 2838. [Google Scholar] [CrossRef] [Scilit]
- Xu, X.; Kong, W.; Wang, L.; Wang, T.; Luo, P.; Cui, J. A Novel and Dynamic Land Use/Cover Change Research Framework Based on an Improved PLUS Model and a Fuzzy Multiobjective Programming Model. Ecol. Inform. 2024, 80, 102460. [Google Scholar] [CrossRef] [Scilit]
- Gao, C.; Feng, Y.; Wang, R.; Lei, Z.; Chen, S.; Tang, X.; Xi, M. 50-Year Urban Expansion Patterns in Shanghai: Analysis Using Impervious Surface Data and Simulation Models. Land 2023, 12, 2065. [Google Scholar] [CrossRef] [Scilit]
- Zhang, F.; Zhang, J.; Wang, X. Evaluation of Multi-Dimensional Coordinated Development in the Yangtze River Delta Urban Agglomeration Under the SDGs Framework. Sustainability 2025, 17, 7663. [Google Scholar] [CrossRef] [Scilit]
- Liu, Y.; Yang, S.; Lin, J.; Cai, A.; Fan, Q. Structure of Polycentric Circles Based on the Urban Radiation Pattern: A Case Study in the Yangtze River Delta Region, China. Sustainability 2023, 15, 2072. [Google Scholar] [CrossRef] [Scilit]
- Luan, C.; Liu, R.; Sun, J.; Su, S.; Shen, Z. An Improved Future Land-Use Simulation Model with Dynamically Nested Ecological Spatial Constraints. Remote Sens. 2023, 15, 2921. [Google Scholar] [CrossRef] [Scilit]
- Li, S.; An, W.; Zhang, J.; Gan, M.; Wang, K.; Ding, L.; Li, W. Optimizing Limit Lines in Urban-Rural Transitional Areas: Unveiling the Spatial Dynamics of Trade-Offs and Synergies among Land Use Functions. Habitat Int. 2023, 140, 102907. [Google Scholar] [CrossRef] [Scilit]
- Jiang, Z.; Wu, H.; Xu, Z.; Shen, F.; Jia, N.; Huang, J.; Lin, A. Optimizing Land Use Spatial Patterns to Balance Urban Development and Resource-Environmental Constraints: A Case Study of China’s Central Plains Urban Agglomeration. J. Environ. Manag. 2025, 380, 125173. [Google Scholar] [CrossRef] [Scilit] [PubMed]
- Li, H.; Liu, Z.; Lin, X.; Qin, M.; Ye, S.; Gao, P. A Novel Spatiotemporal Urban Land Change Simulation Model: Coupling Transformer Encoder, Convolutional Neural Network, and Cellular Automata. J. Geogr. Sci. 2024, 34, 2263–2287. [Google Scholar] [CrossRef] [Scilit]
- Gan, L.; Halik, Ü.; Shi, L.; Ru, J.; Wei, Z.; Li, J.; Welp, M. Integrating Multi-Source Data to Explore Spatiotemporal Dynamics and Future Scenarios of Arid Urban Agglomerations: A Geodetector–PLUS Modelling Framework for Sustainable Land Use Planning. Remote Sens. 2025, 17, 1851. [Google Scholar] [CrossRef] [Scilit]
- Ren, Y.; Lü, Y.; Comber, A.; Fu, B.; Harris, P.; Wu, L. Spatially Explicit Simulation of Land Use/Land Cover Changes: Current Coverage and Future Prospects. Earth-Sci. Rev. 2019, 190, 398–415. [Google Scholar] [CrossRef] [Scilit]

Disclaimer/Publisher’s Note: The statements, opinions and data contained in all publications are solely those of the individual author(s) and contributor(s) and not of MDPI and/or the editor(s). MDPI and/or the editor(s) disclaim responsibility for any injury to people or property resulting from any ideas, methods, instructions or products referred to in the content. |
© 2026 by the authors. Licensee MDPI, Basel, Switzerland. This article is an open access article distributed under the terms and conditions of the Creative Commons Attribution (CC BY) license.