


Highlights
What are the main findings?
- This paper proposes a lightweight and edge-sensitive canopy segmentation network that can more effectively segment canopy edges while maintaining high accuracy.
- The forest canopy cover calculated based on the model segmentation results shows extremely high consistency with ground-based measured data.
What are the implications of the main findings?
- Based on UAV remote sensing imagery, this paper demonstrates how to achieve accurate canopy boundary segmentation and effective background noise filtering under computational constraints, thereby accurately estimating forest canopy closure.
- This method validates its effectiveness in monitoring forest canopy structure, providing technical support for the application of consumer-grade UAVs in refined forestry surveys.
Abstract
Forest canopy cover is a crucial indicator for measuring ecological functions. However, traditional plot-based measurement methods suffer from low efficiency and insufficient spatial continuity. Addressing issues in UAV RGB imagery—such as tree crown boundary adhesion, shadow interference, and texture confusion—this paper proposes a lightweight and edge-sensitive tree crown segmentation network. The model employs MobileNetV3-Large to replace the traditional U-Net encoder, significantly reducing parameter count and computational load while satisfying the potential for edge device deployment. In the decoding phase, a Semantic-guided Channel Compression and Focus (SCCF) module is designed to enhance semantic-guided channel compression and feature focusing. Furthermore, a Gradient-guided Morphological Tree Crown Attention Module (G-MTCAM) is proposed. By utilizing Gradient-Induced Center Difference Convolution (GI-CDC) and a variance-based statistical gating mechanism, this module constructs a dual-stream architecture for morphology and texture interaction, achieving precise cutting of tree crown boundaries and effective filtering of background noise. Additionally, a boundary-enhanced composite loss function is introduced to improve the accuracy of crown edge identification. Experimental results indicate that the proposed model achieves an IoU, Acc, and F1 score of 88.59%, 88.62%, and 93.77%, respectively. Compared to the classic U-Net, these represent improvements of 2.77%, 1.71%, and 1.44%, while the parameter count and computational cost are only 5.98 M and 6.71 GFLOPs. The forest Canopy Cover (CC) estimated based on the segmentation results shows high consistency with ground-based near-zenith canopy hemispherical percentage (, denoted as ), with a correlation coefficient () exceeding 0.90. This verifies the effectiveness of the method in forest canopy structure monitoring and provides technical support for the application of consumer-grade UAVs in forestry surveys.
1. Introduction
Forest canopy cover, as a core structural parameter for measuring the degree of forest canopy coverage [1], is of significant importance in fields such as forest ecosystem monitoring, habitat quality evaluation, and understory resource assessment [2]. Traditional methods for measuring canopy cover mainly rely on plot surveys [3], projection instrument measurements, or hemispherical photography. Although these methods offer high precision, they are constrained by labor costs, data collection efficiency, and spatial coverage, making it difficult to meet the demands of modern forestry surveys for high efficiency, low cost, and high spatial resolution in large-area continuous observations [4]. With the rapid development of consumer-grade UAV technology, lightweight platforms represented by the DJI Mini 4 Pro can acquire RGB images of drones at a ground sampling distance (GSD) of 1.5 cm/pixel from low altitudes of tens of meters [5], providing an economical, efficient, and repeatable data source for surface vegetation monitoring. Consequently, utilizing deep learning technology to accurately extract tree crown regions from UAV RGB imagery and achieve lightweight, automated canopy cover estimation suitable for edge deployment has become an important direction in current forest remote sensing research [6].
Semantic segmentation models, particularly the U-Net architecture, possess inherent advantages in multi-scale feature fusion and have been widely applied in medical imaging and natural scene segmentation [7,8]. However, when directly applied to UAV forest imagery [9], several challenges remain: tree crown edges appear blurred and irregular due to illumination changes, shadows, or canopy overlap [10]; significant texture differences between tree species and backgrounds lead to texture confusion [11,12] during the fusion of deep and shallow features; and the abundance of fine-grained high-frequency structures in imagery makes it difficult for traditional decoders to effectively recover spatial details while ensuring efficiency [13]. Addressing these issues by exploring lightweight, high-precision, and edge-sensitive segmentation networks adapted to the characteristics of UAV scenarios is key to improving the accuracy of canopy cover estimation [14,15].
To resolve these challenges, this paper proposes a precise forest tree crown segmentation method [16] based on an improved U-Net. First, to enhance the efficiency and feature expression capability of the encoder, MobileNetV3-Large [17] is adopted as the backbone network. By introducing depthwise separable convolutions and inverted residual structures, the network maintains good real-time performance (FPS > 30) and deployability even with inputs [18,19]. Second, to strengthen the decoder’s ability to recover high-frequency textures and edge details [20,21], a SCCF module is designed. This module achieves the suppression of redundant features and the reinforcement of key structures through semantic-guided channel compression and focusing mechanisms. More critically, this paper proposes the G-MTCAM. Inspired by Center Difference Convolution, this module utilizes GI-CDC to construct a dual-stream architecture and filters features [22,23] through statistical gating, significantly enhancing the model’s ability to discriminate subtle tree crown textures and edge structures [24,25]. Regarding the loss function, a boundary-enhanced hybrid loss [26] is constructed, incorporating Sobel edge constraints to improve the model’s sensitivity to crown edge details [27].
Experiments demonstrate that the proposed model achieves significant improvements in tree crown recognition accuracy, edge quality, and robustness in shadow regions, while possessing higher parameter efficiency and inference speed [28,29]. Furthermore, through strict geometric field-of-view restrictions, this paper validates the high physical consistency between the forest Canopy Cover calculated from segmentation results and ground-truth measurements [30]. The results indicate that the improved U-Net method proposed herein has broad application potential in the field of forest structural remote sensing [31,32,33,34].
2. Materials and Methods
2.1. Study Area
The research site is located in Hunjiang District, Baishan City, Jilin Province. According to the Geospatial Data Cloud system, the reference coordinate range is 126°45′ to 126°48′E, 42°14′ to 42°17′N. The altitude ranges from 620 to 1200 m. The forest stand types are primarily broadleaf mixed forests and coniferous–broadleaf mixed forests, with complex canopy structures and canopy cover ranging widely from 0.40 to 0.95. It is noteworthy that broadleaf mixed forests and coniferous–broadleaf mixed forests account for more than 75% of the total forest area in the mountainous region of Northeast China. Furthermore, the spatial heterogeneity of the mixed forest ratios provides a typical and highly challenging testing environment for evaluating the segmentation performance of the model against a complex forest background [35,36]. Additionally, parts of the study area contain understory economic crop plots, making the precise assessment of their light environment of significant ecological and economic value [37,38,39].
2.2. Data Acquisition
2.2.1. UAV Data
Data was collected in July 2025, during the peak growth period of the trees, when the canopy leaves were fully expanded, the canopy outline was complete, and the shape was full [40,41]. This was also the main growth period for some understory crops. A DJI Mini 4 Pro (DJI, Shenzhen, China) equipped with a 1/1.3-inch CMOS sensor with 48 million effective pixels and an equivalent focal length of 24 mm was used. The flight altitude was set at 50 m above the ground, and the ground sampling distance (GSD) was approximately 1.3 cm. Data acquisition was conducted under clear weather conditions with light winds to minimize motion blur caused by canopy swaying. The flight plan used parallel flight paths spaced 22 m apart, with the lens set vertically, a forward overlap of ≥80%, and a lateral overlap of ≥70%. Aerial triangulation and stitching of the images were performed using the Structure-from-Motion (SfM) algorithm and Agisoft Metashape software (version 2.0.1) to generate high-resolution orthophotos of the study area. Since the study primarily focused on canopy structure and relevant departments provided plot coordinates [42], the georeferenced data directly used was airborne GNSS data from the UAV. To ensure data processing quality, the image alignment accuracy was set to “High”, resulting in an average reprojection error of 0.5 pixels, indicating high consistency in the geometric stitching within the image. The final generated orthophoto of the study area (DOM) has a resolution better than 1.5 cm, meeting the requirements for refined feature extraction.
2.2.2. Field Measurement and Data Validation
To validate the accuracy of the UAV remote sensing inversion results, a ground plot survey was conducted synchronously with the UAV data collection. Field measurements employed the hemispherical photography method. At the center of each plot and representative locations, a digital camera equipped with a fisheye lens was used to take upward vertical canopy images at a height of 1.5 m above the ground.
Given that traditional hemispherical photography captures Canopy Cover containing a large amount of oblique branch occlusion information, whereas UAV orthophotos reflect purely forest Canopy Cover, there is an inherent difference in observation geometry. To eliminate this definition bias, this study adopted a field-of-view restriction strategy for metric alignment. Specifically, when processing fisheye photos with specialized image analysis software, the calculation field of view was restricted to a central circular region with a zenith angle . Within this region, the image was binarized, and the Near-Zenith Canopy Hemispherical Percentage ) was calculated according to the following Formula (1)
where is the number of vegetation foreground pixels within the limited field of view, and is the total number of pixels in that field. The calculated is geometrically approximate to the vertical projection coverage and serves as the ground truth for evaluating the consistency of the UAV orthophoto estimation results.
To avoid terminology confusion, “Canopy Cover” in the subsequent context of UAV orthophotos uniformly refers to the forest Canopy Cover (CC). The ground-based calculated with the limited zenith angle serves as the validation truth (denoted as ) geometrically consistent with CC, used to evaluate the model’s estimation results ().
2.3. Data Processing
2.3.1. Data Preprocessing and Sample Construction
First, the collected raw aerial images underwent rigorous screening and preprocessing, specifically including deleting blurry images, removing images with large reconstruction errors, and manually correcting abnormal matching points. Using geographic information processing platforms such as ArcMap, orthophotos of the study area were generated based on Structure-from-Motion principles. To ensure the geometric accuracy and spectral quality of the base data, visual interpretation and error analysis were performed to remove invalid images with low orthorectification accuracy or significant motion blur [43], retaining only high-quality data for subsequent processing.
Considering the fixed input tensor size requirements of deep convolutional neural networks and to achieve efficient batch training under limited video memory, a sliding window strategy was adopted to crop the large-format orthophotos. The images were cut into non-overlapping image patches of pixels, constructing a total of 1120 samples. These patches covered rich texture features under different stand types, canopy densities, and lighting conditions, effectively improving the model’s generalization ability for complex forest scenes.
To construct a high-quality dataset, we performed manual pixel-level annotation using LabelMe to formulate a binary classification task. Tree crowns were labeled as the target (1), while shadows, forest gaps, and bare ground were grouped as the background (0). To minimize subjective errors, we applied strict annotation guidelines. Shadow-blurred edges were delineated based on significant vegetation spectral features, and small internal gaps within crowns were strictly excluded from the target class. Finally, multi-person cross-reviews were conducted to ensure accurate ground truth for reliable supervised learning.
2.3.2. Data Augmentation and Standardization
Given the common issues in UAV remote sensing imagery such as variable lighting conditions, uneven shadow distribution, and significant spectral differences in tree species canopies, relying solely on raw data for training can limit model generalization. Therefore, a systematic data augmentation strategy was implemented after dataset construction to enhance robustness in complex scenes.
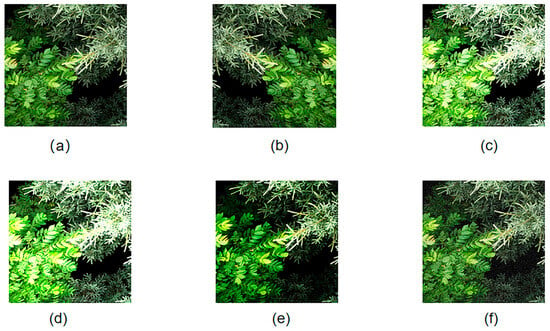
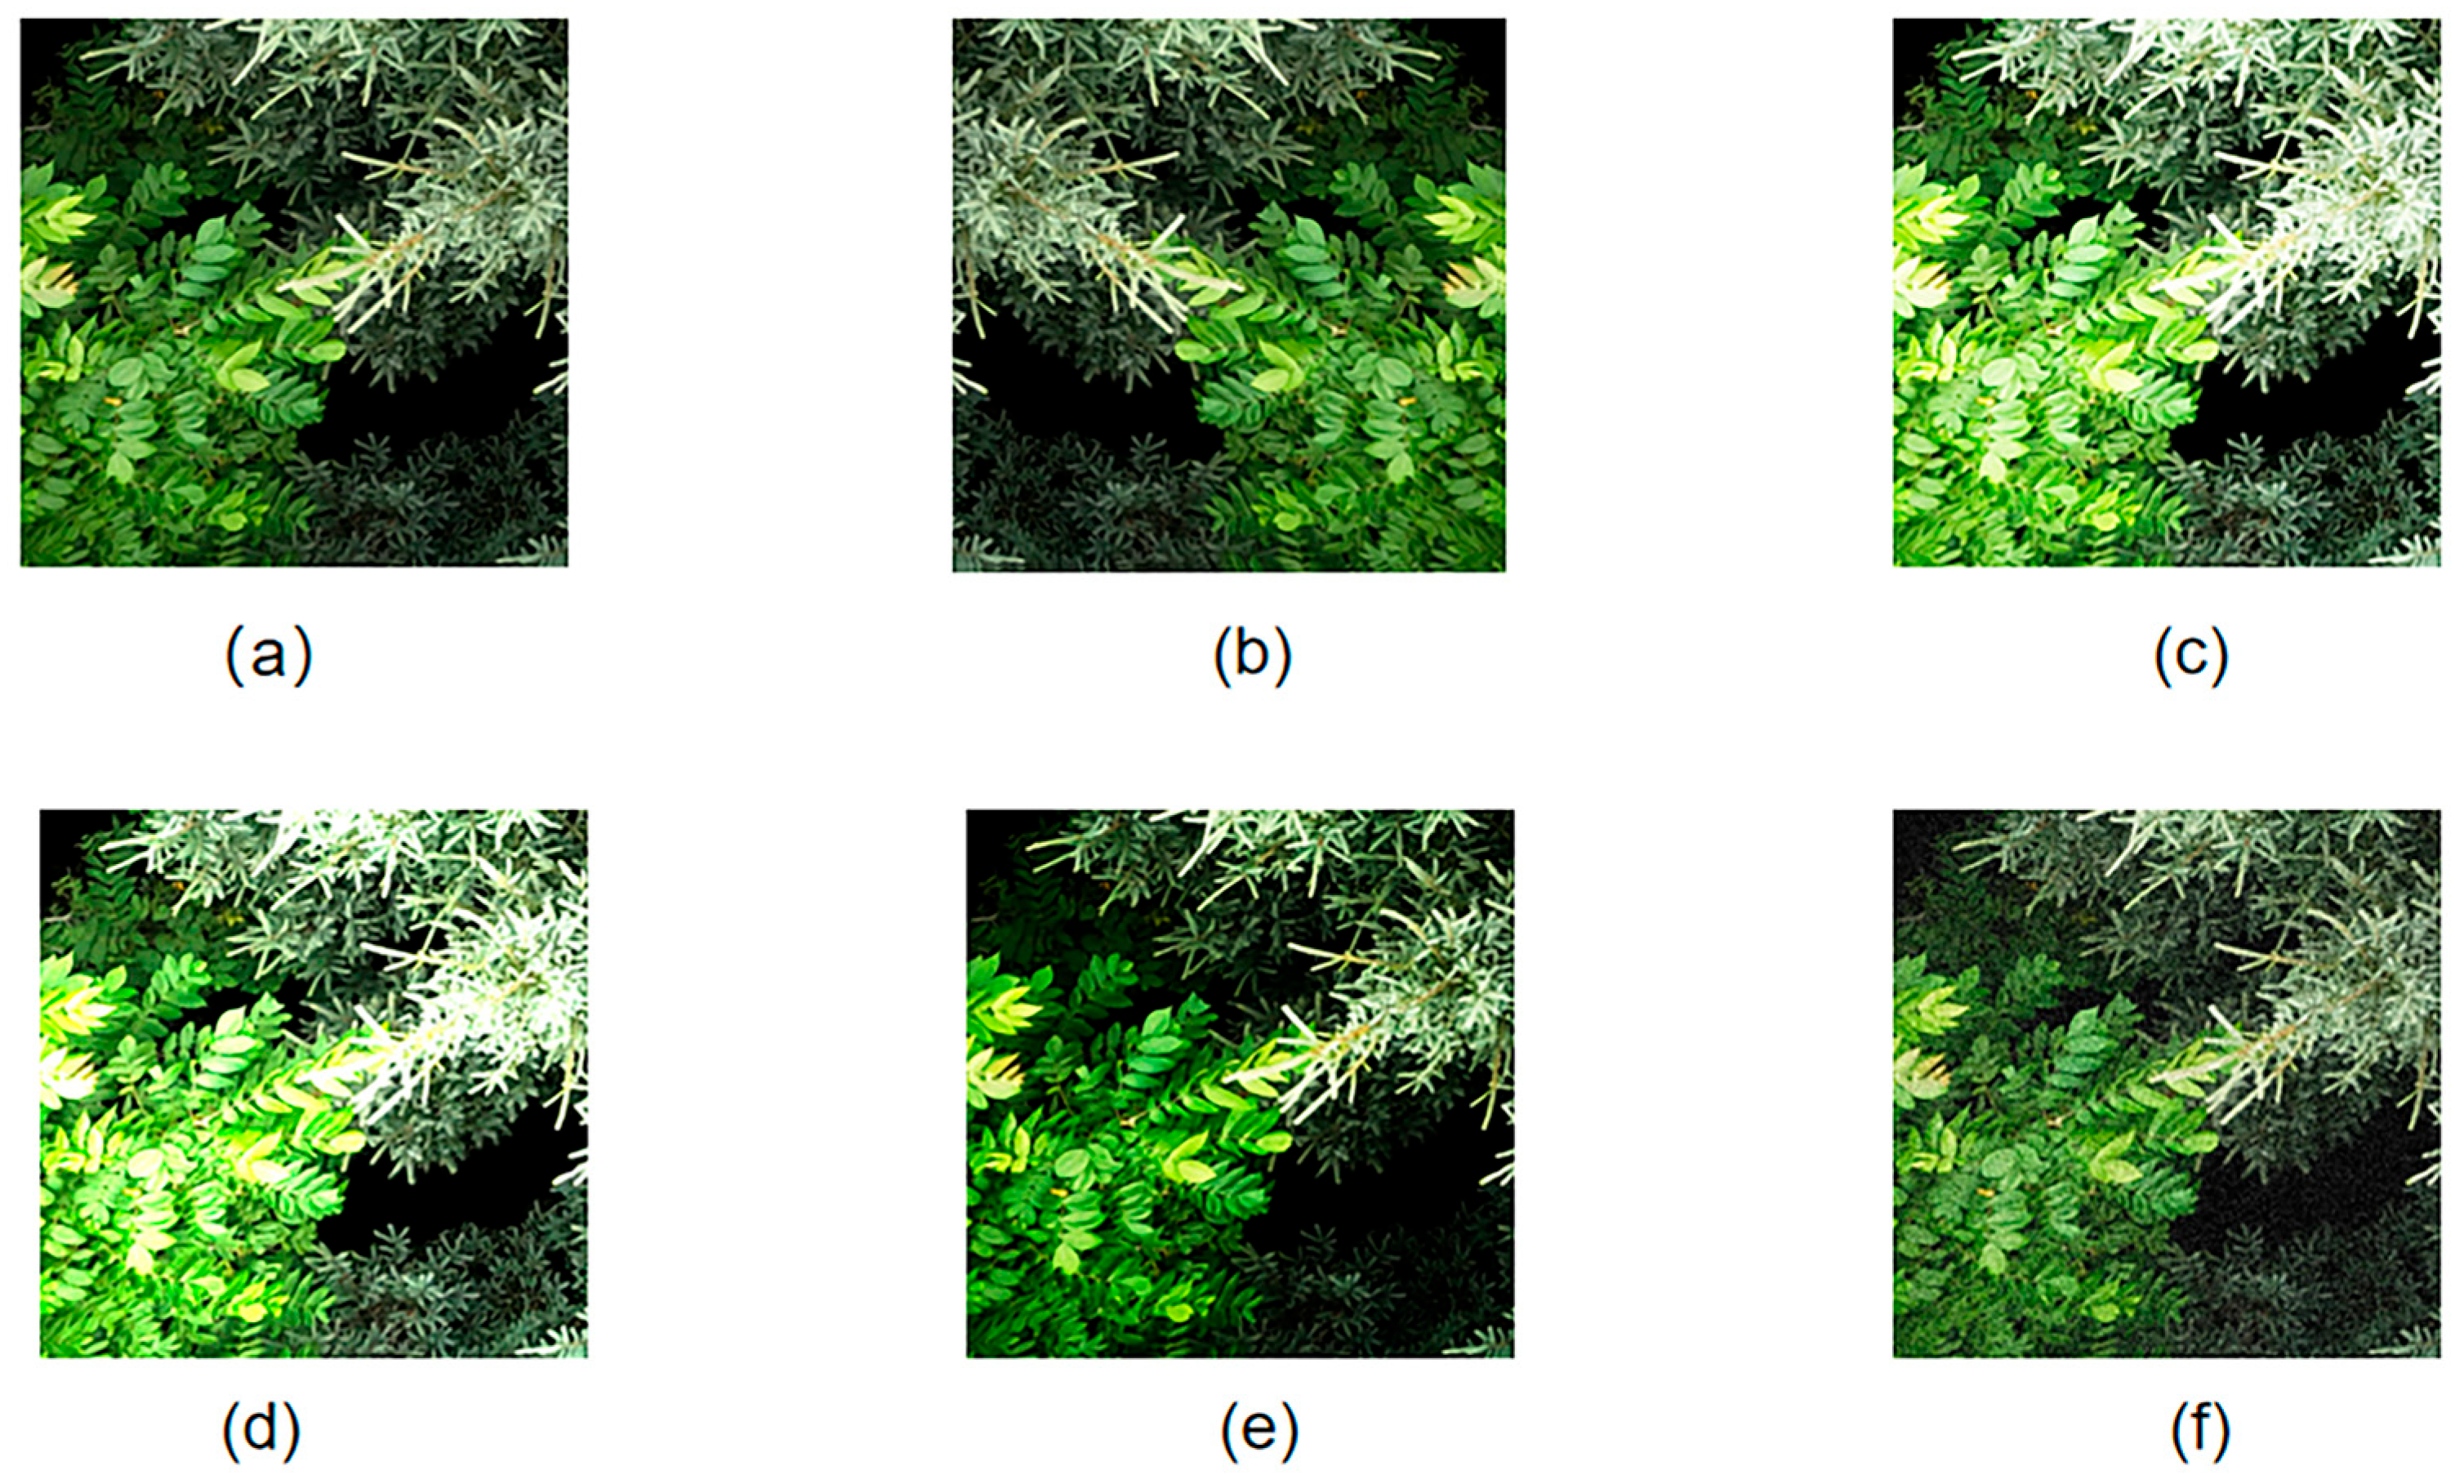
As shown in Figure 1, diverse transformation operations were applied to the original images (a), including horizontal flipping (b) to eliminate orientation sensitivity; brightness adjustment (c), exposure adjustment (d), contrast perturbation (e) to simulate different sunlight conditions; and adding Gaussian noise (f) to simulate sensor thermal noise. Through these augmentation processes, the total sample size of the dataset was expanded to 6720 images. This process effectively simulated imaging conditions in variable environments by significantly increasing the diversity of the sample space, thereby suppressing the risk of model overfitting to specific textures or single scene features.
Figure 1.
Data augmentation operations. (a) Original image (b) Horizontal flip (c) Brightness adjustment (d) Exposure adjustment (e) Contrast perturbation (f) Gaussian noise addition.
Furthermore, to eliminate dimensional differences between data from different flight batches and accelerate network convergence, color normalization and standardization were performed on all input images. This step ensured consistency in spectral feature distribution, further improving the stability of model feature learning.
To avoid sample leakage introduced by data augmentation, this study followed the principle of splitting by spatial blocks first, then augmenting the training set. Specifically, the dataset was first divided into training, validation, and testing sets according to the spatial block strategy in Section 2.3.3; subsequently, data augmentation was performed only on the training set. The “expansion to 6720 images” mentioned refers to the size of the training set after augmentation, while the validation and test sets maintained their original distributions to ensure unbiased and reproducible evaluation results.
2.3.3. Dataset Division
To accurately evaluate the model’s generalization ability and eliminate performance overestimation caused by spatial leakage, this study abandoned the traditional random split mode and adopted a spatial block independent division strategy. First, the study area was divided into several non-overlapping spatial sub-blocks based on the geographic coordinates of the orthophotos. These blocks were used as the minimum unit for allocation to the training, validation, and testing sets, with a ratio set at 7:2:1. This strategy ensured that the test set was completely isolated from the training area in geographic space, thereby simulating the model’s real-world performance in cross-regional applications. As described in Section 2.3.2, data augmentation was performed only on the training set after division, while the validation and test sets strictly maintained their original distributions to ensure unbiased evaluation results. Furthermore, to optimize I/O efficiency, all samples were serialized into .npy format and underwent unified normalization before input.
Through this strict spatial isolation division, the constructed high-quality test set can objectively reflect the model’s ability to parse tree crown boundaries, providing a reliable validation benchmark for the subsequent precise inversion of forest Canopy Cover and understory ecological planning assessment.
2.4. Overall Model Architecture
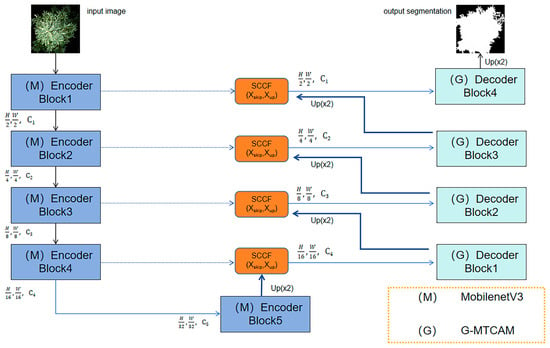
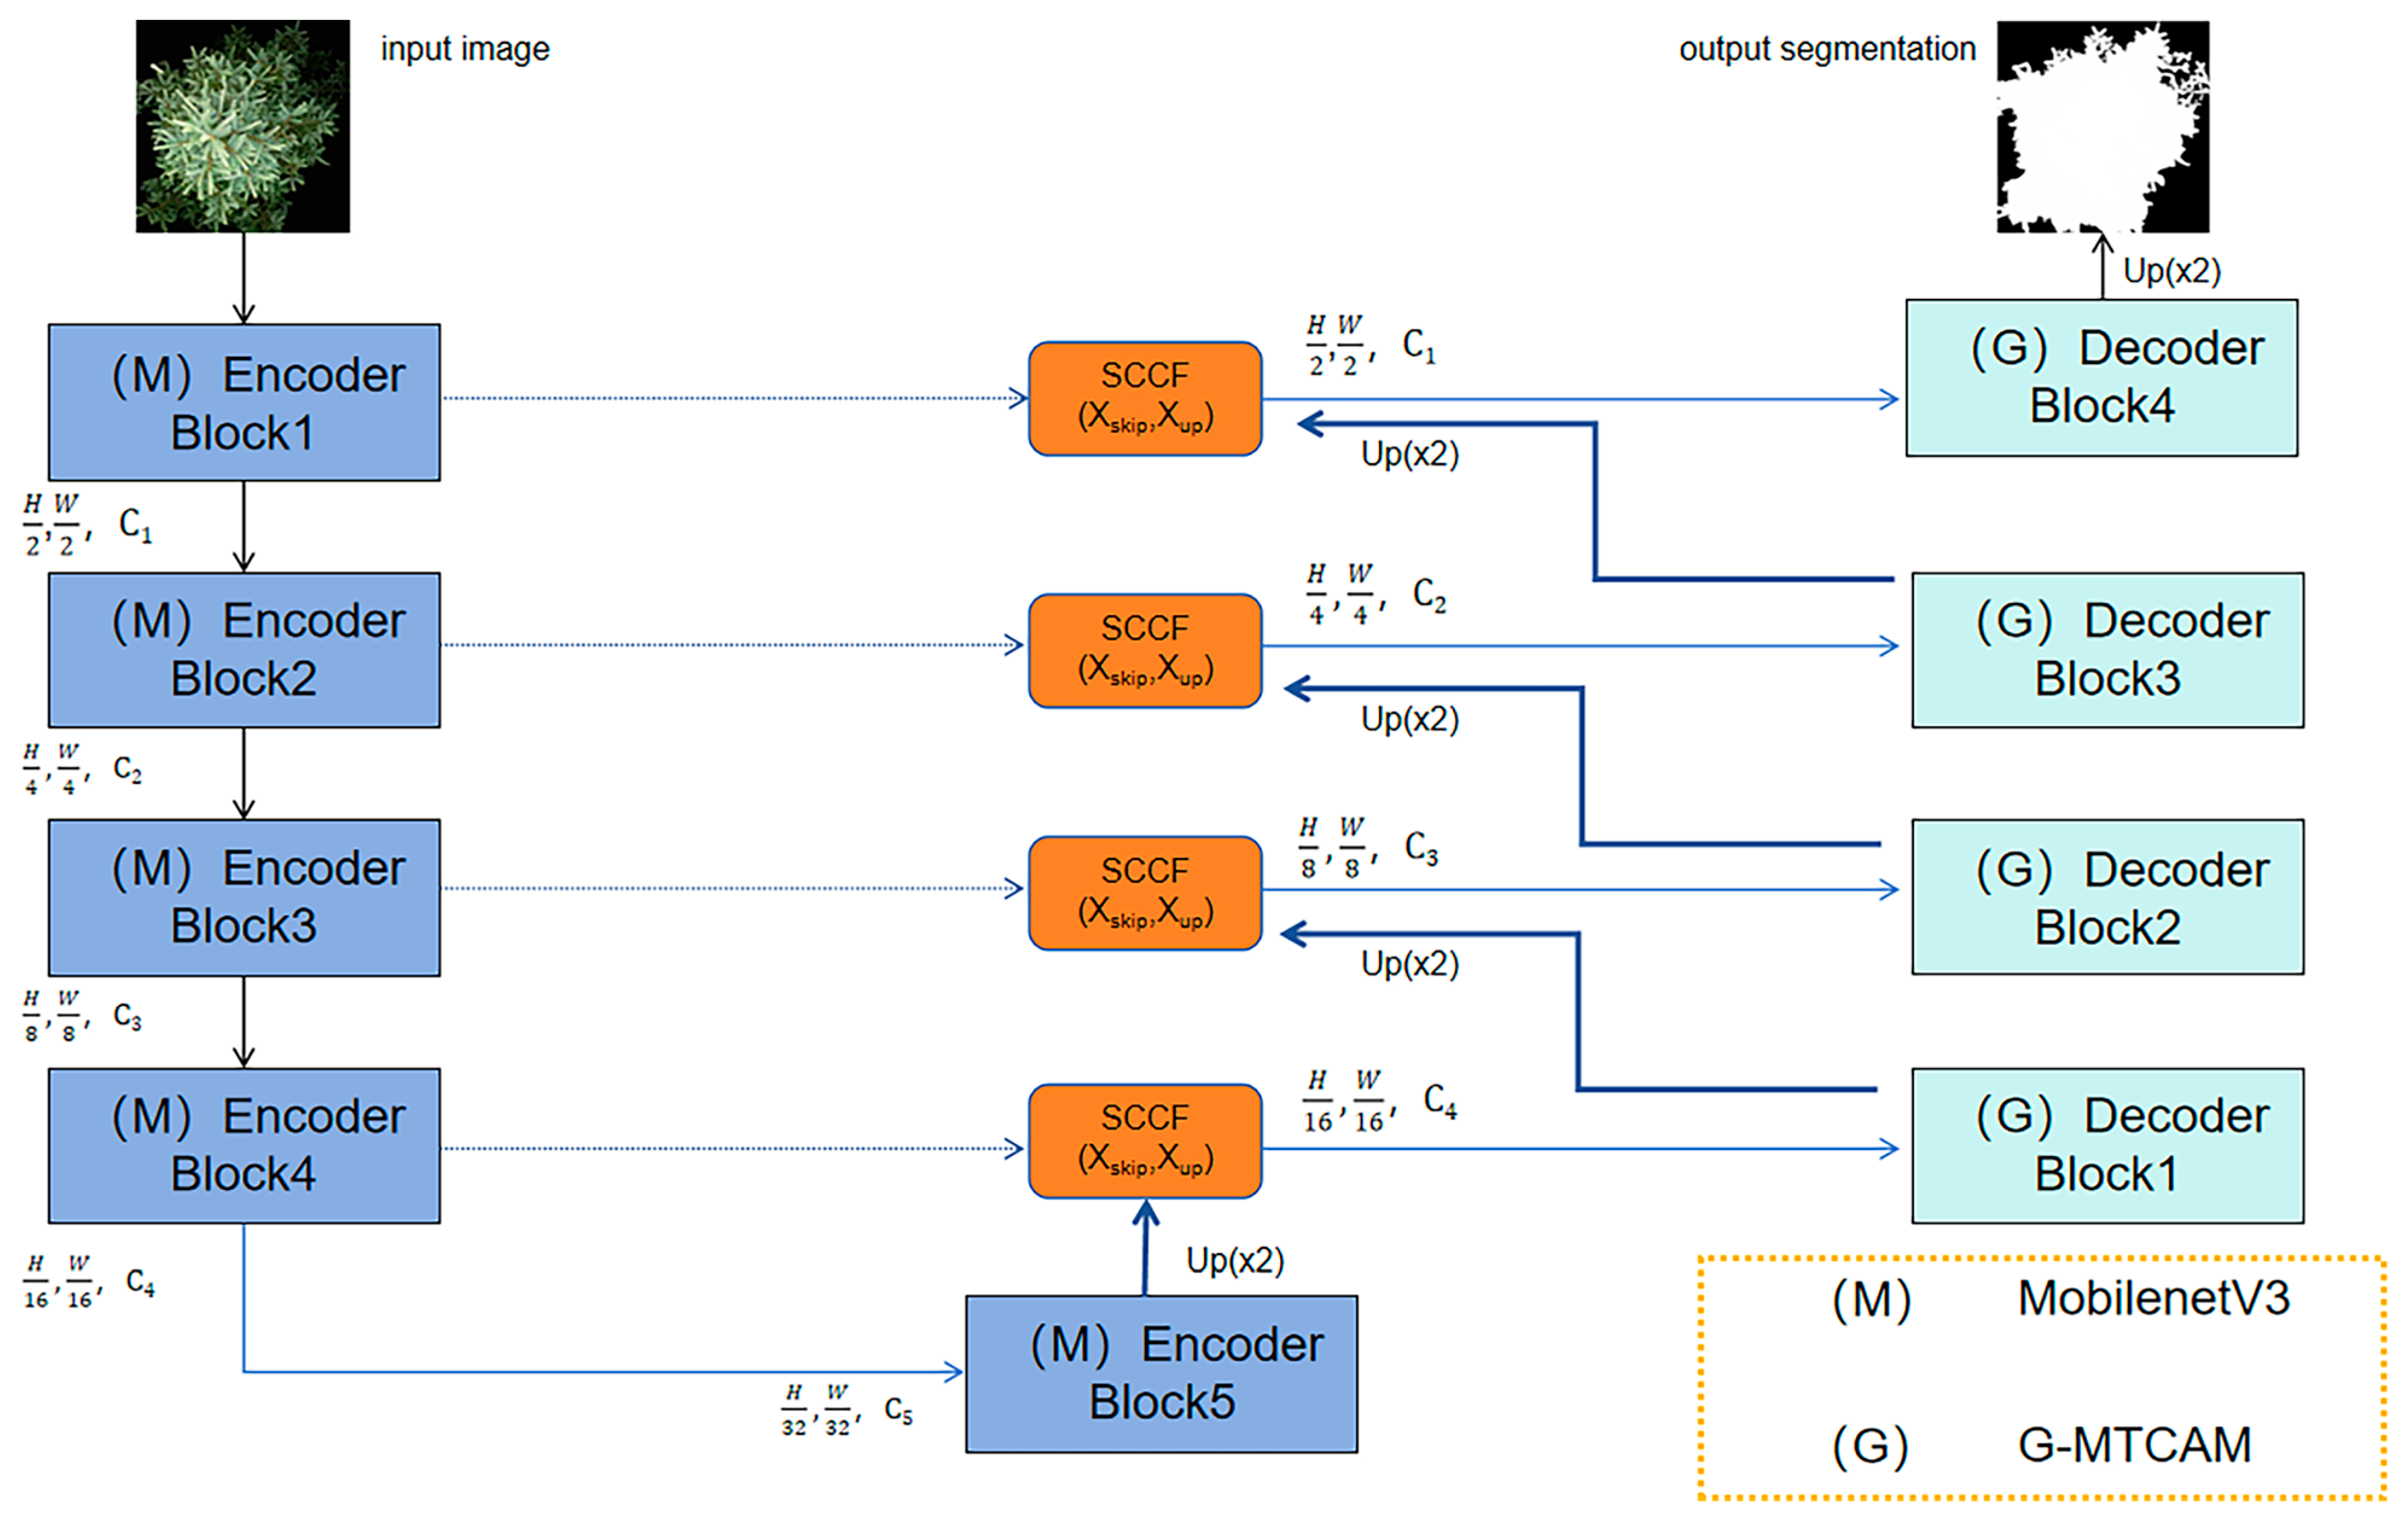
The model in this paper is named MSG-UNet (MobileNetV3 + SCCF + G-MTCAM), an improved version of the U-Net framework. Addressing the practical challenges of tree crown boundary adhesion, complex background textures in UAV forestry remote sensing imagery, and limited onboard computing resources, this paper proposes a lightweight semantic segmentation network capable of balancing inference efficiency and edge segmentation accuracy. The network uses the classic encoder–decoder structure as a topological prototype and follows the design paradigm of lightweight feature extraction—gradient texture enhancement—semantic focused restoration. Its goal is to achieve high-precision canopy cover inversion under limited computational constraints. The overall architecture is shown in Figure 2, mainly consisting of three core parts working synergistically.
Figure 2.
Overall network architecture of the model.
Given that the massive parameter count of traditional U-Net is difficult to meet the needs of rapid UAV deployment, this paper selects MobileNetV3-Large to replace the traditional convolutional layers as the backbone encoder (see Section 2.4.1). By utilizing its depthwise separable convolutions and inverted residual structures, it significantly reduces floating-point operations while obtaining multi-scale hierarchical semantic features through stepwise downsampling, providing an efficient and compact representation basis for subsequent processing.
In the decoding phase, addressing the redundant background noise and feature semantic mismatch introduced by skip connections, this paper designs a SCCF module (see Section 2.4.2) as a pre-filtering unit for feature fusion. Unlike traditional simple concatenation, the SCCF module uses deep semantics to guide the screening of shallow details. Through semantic gating and lightweight channel compression, it suppresses background responses unrelated to tree crowns, thereby improving the purity of skip connection fusion and the ability to recover edge details. The features purified by SCCF are then sent to convolution and G-MTCAM modules, which work together to ensure purity and spatial structural integrity during feature recovery.
To solve the common problems of boundary adhesion and texture confusion in tree crown segmentation, we cascaded the G-MTCAM into the feature reconstruction path of the decoding network (see Section 2.4.3). This module is deployed at the output end of each upsampling unit, breaking the limitation of standard convolution focusing only on absolute pixel intensity. It explicitly captures high-frequency gradient changes in feature maps at various scales during the recovery process by constructing parallel morphology and texture streams. This allows the model to dynamically correct and sharpen fine tree crown edge geometric information while recovering spatial resolution step-by-step, effectively decoupling closely adjacent tree crowns.
In summary, this architecture ensures high inference throughput via MobileNetV3, achieves suppression of redundant background and high-fidelity feature reconstruction via SCCF during the fusion stage, and subsequently utilizes G-MTCAM to enhance the perception of tree crown boundaries and subtle structures under complex textures. The three complement each other, forming a complete loop from lightweight feature extraction to semantic purification fusion and then to fine edge optimization, providing a robust solution for tree crown extraction and canopy cover estimation in complex forestry scenarios.
2.4.1. Backbone Network Optimization
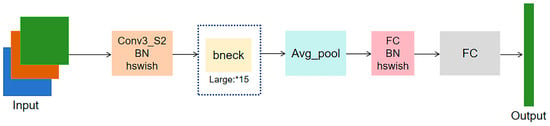
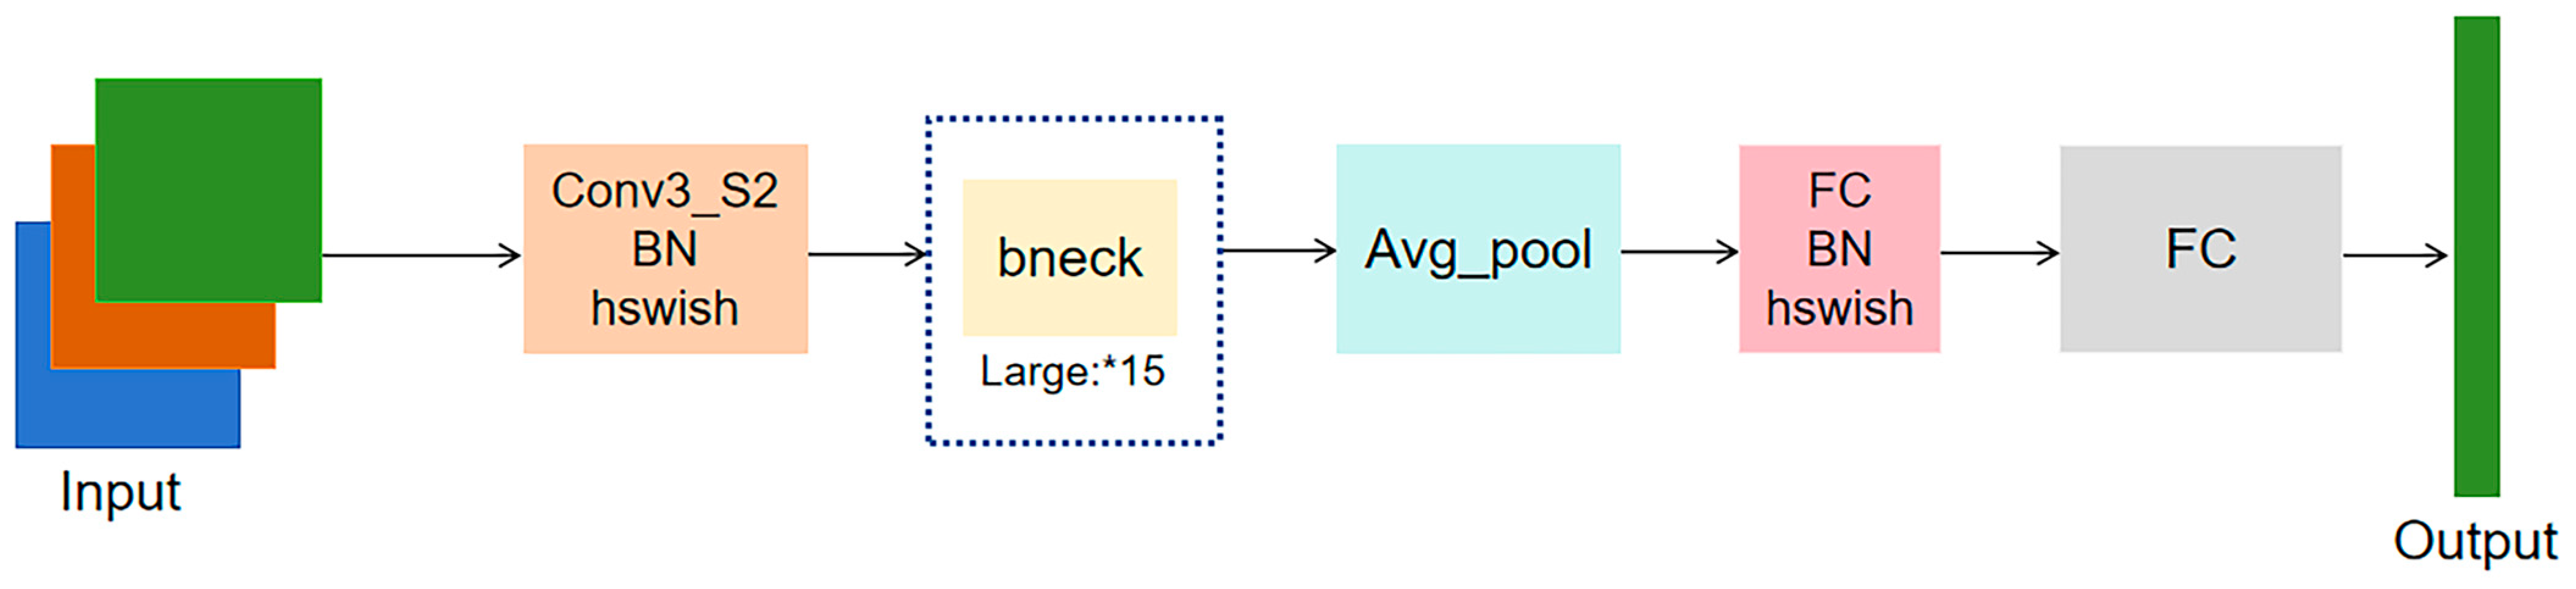
The encoder in the U-Net architecture undertakes the critical task of extracting multi-scale spatial semantic information step-by-step, providing a representation basis for subsequent feature reconstruction. Although the stacked convolutional structure of traditional U-Net performs excellently in medical image segmentation, its massive parameter volume and computational overhead limit model inference efficiency and deployment capability when processing large-format, UAV remote sensing imagery. The core goal of encoder design should be to maximize feature expression richness and discriminability while minimizing computational cost. Based on this design philosophy, this paper selects MobileNetV3-Large to replace the traditional encoder, constructing a lightweight feature extraction backbone, as shown in Figure 3.
Figure 3.
MobileNetV3-Large network architecture diagram.
MobileNetV3 is designed specifically for mobile and embedded vision tasks. Its core advantages are reflected in three aspects.
Depthwise separable convolution decouples standard convolution into depthwise and pointwise convolutions, significantly reducing floating-point operations and model parameters while maintaining the receptive field. Additionally, the inverted residual structure introduces a linear bottleneck mechanism comprising dimension expansion, feature extraction, and dimension reduction. This design effectively prevents the manifold collapse of features during low-dimensional mapping, retaining key semantic information while compressing the model. Finally, neural architecture search utilizes automated strategies to globally optimize the network’s hierarchical structure and kernel sizes, achieving an optimal balance between computational efficiency and segmentation accuracy.
Embedding MobileNetV3 into the U-Net encoding path not only inherits the original architecture’s advantages in multi-scale feature capture but also significantly improves the model’s processing throughput for RGB imagery through lightweight design. This improvement ensures that the model can infer quickly in complex forestry scenarios while providing a solid high-dimensional feature foundation for subsequent tree crown boundary recognition and canopy cover inversion.
2.4.2. Semantic-Guided Channel Compression and Focus Module
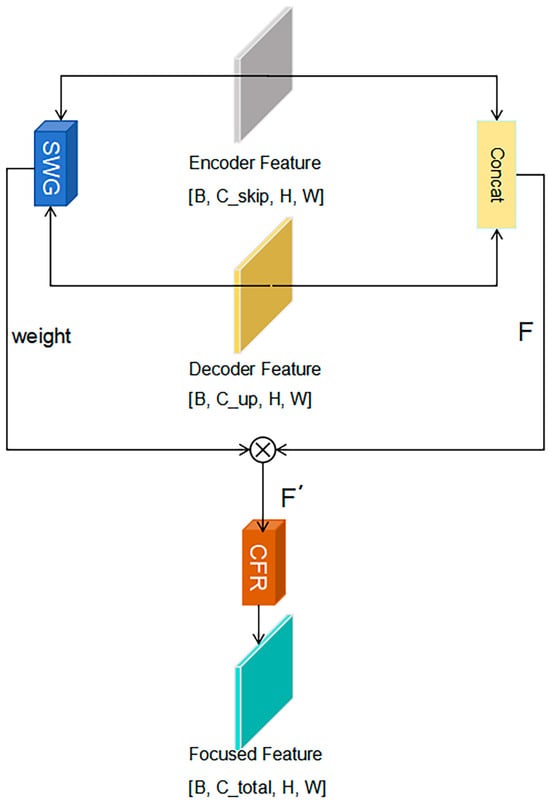
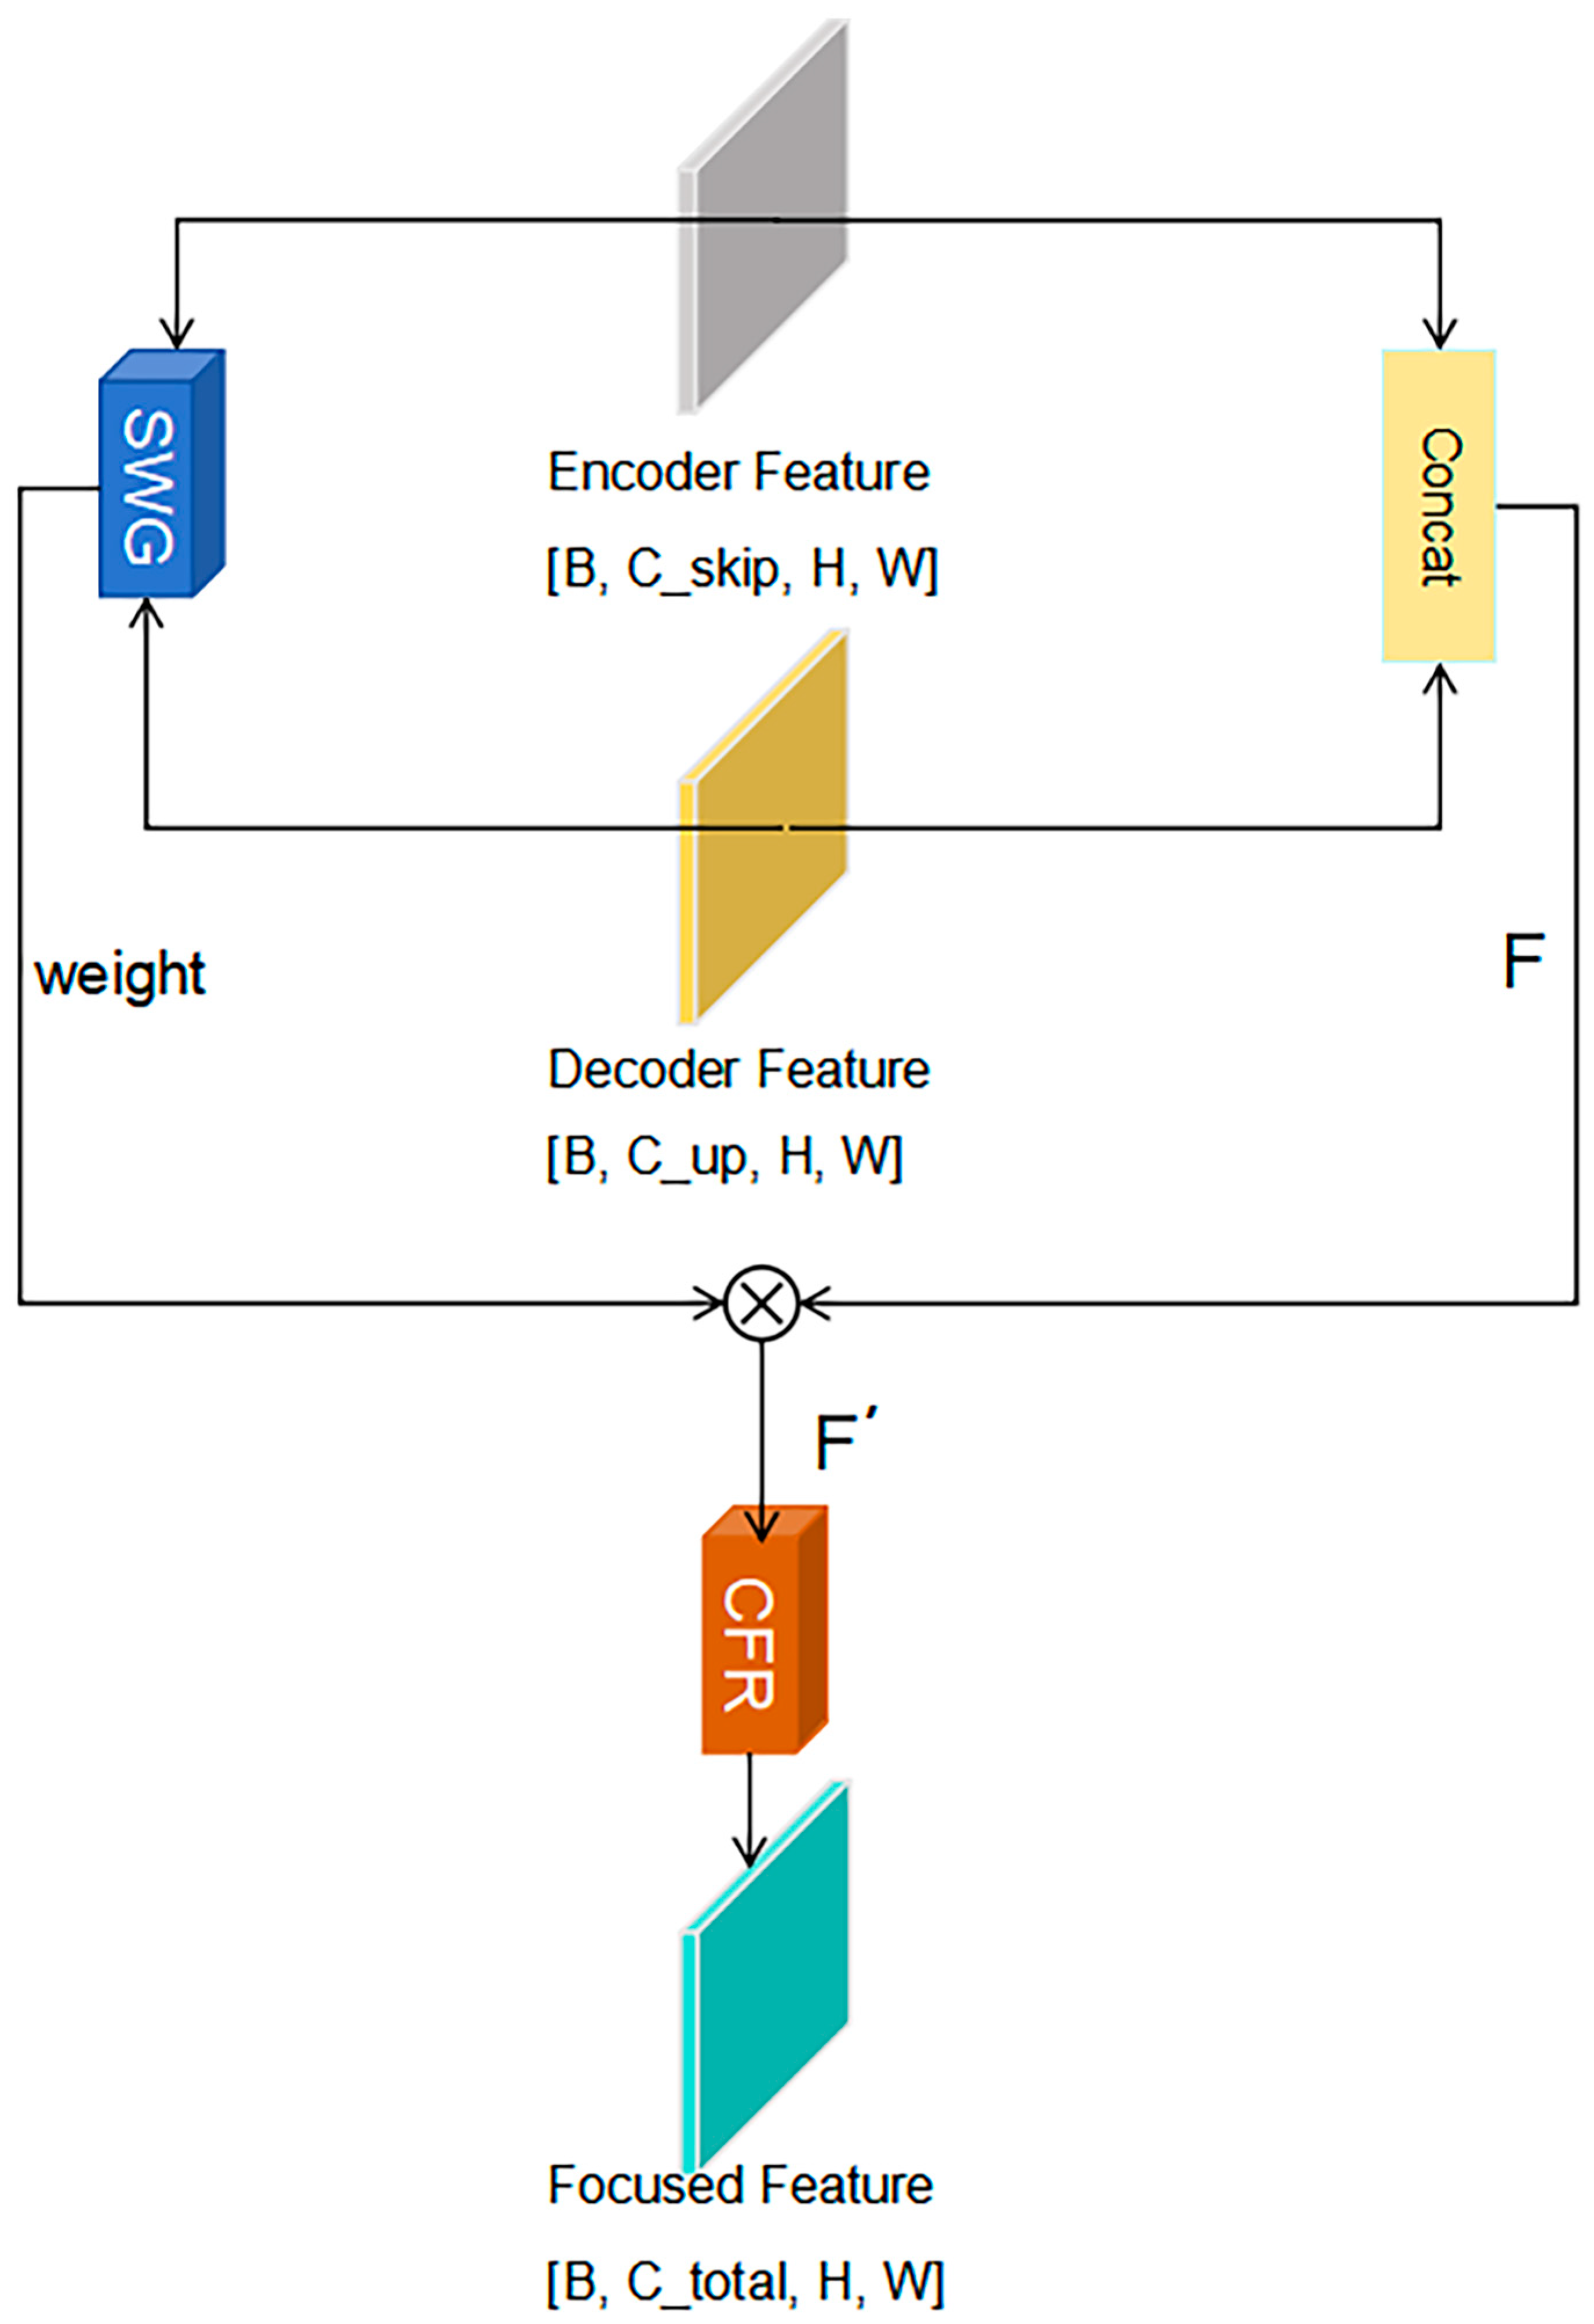
In the decoder part, the accuracy of feature recovery directly determines the quality of tree crown edge segmentation. Traditional U-Net typically concatenates feature maps from the encoder and decoder directly via skip connections, followed by convolution for channel fusion. However, when using the lightweight MobileNetV3 as the backbone, deep features are characterized by a large number of channels and high semantic abstraction. Direct concatenation often leads to the introduction of massive redundant information and diffusion effects during gradient optimization, severely constraining the model’s ability to reconstruct tree crown edge details. To this end, this paper introduces the SCCF module in each upsampling unit of the decoder. This achieves adaptive feature purification through semantic-guided gating and lightweight channel compression mechanisms, as shown in Figure 4. We explicitly state that the SCCF module only operates during the training phase. Once the model is trained and ready for deployment, the entire network structure, channel selection, and parameters are completely fixed. Therefore, during inference, the channel selection will remain unchanged regardless of changes in the input samples. The inference process is a completely static forward propagation, guaranteeing absolute stability and consistency in inference time.
Figure 4.
Overall network structure diagram of semantic guidance channel compression and focusing module.
The SCCF module mainly consists of two sub-modules: the Semantic Weight Generation Unit (SWG) and the Channel Focus Recalibration Unit (CFR).
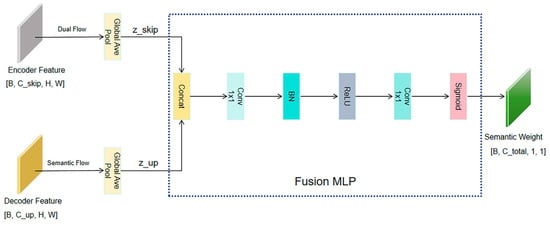
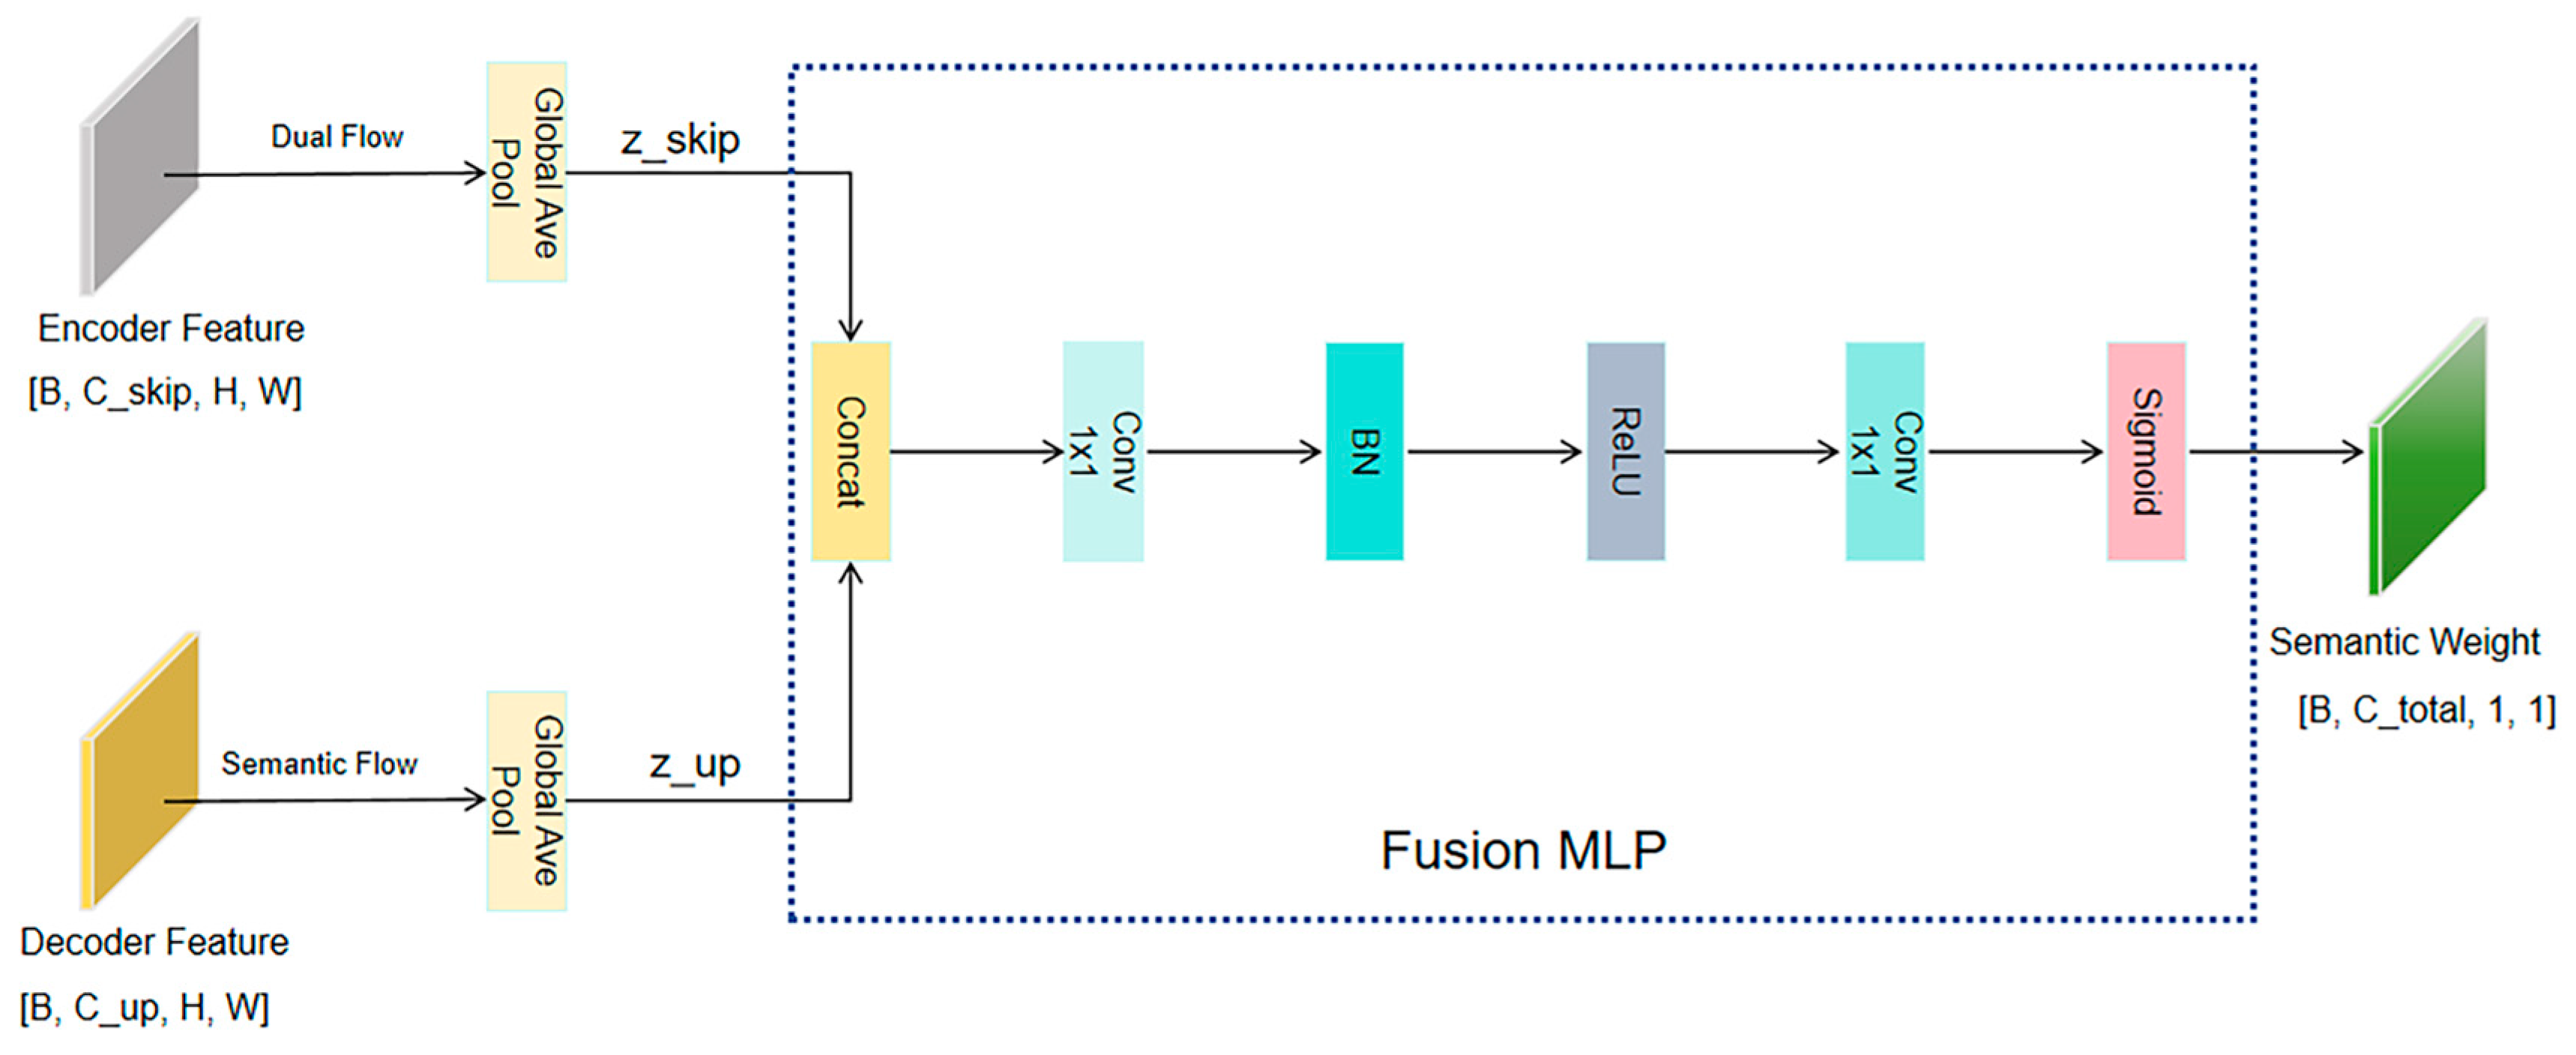
The Semantic Weight Generation (SWG) unit aims to establish long-range dependencies between cross-level channels. To avoid semantic confusion caused by direct concatenation, SWG adopts a dual-stream interaction architecture. Specifically, SWG receives shallow detail features from the encoder and deep semantic features from the previous decoder stage as independent inputs. First, spatial information from both is aggregated via dual-path global average pooling to extract independent detail statistics and semantic statistics . Subsequently, the two are concatenated and fused interactively using two layers of lightweight convolution ( Conv) to generate the final global semantic weight vector , as shown in Figure 5.
Figure 5.
Network structure diagram of semantic weight generation module.
This design explicitly models cross-level context interaction, enabling the generated weights to more keenly capture the differences between tree crown edges and backgrounds in forest imagery, thereby guiding subsequent feature purification.
Channel Focus Recalibration (CFR) serves as the core step for realizing semantic-driven channel sparsification and structural reconstruction. As shown in Figure 6. After obtaining the global semantic weight through the SWG unit, CFR introduces a joint statistical metric mechanism based on feature variance and normalized semantic entropy to dynamically calculate the adaptive compression rate for each instance, thereby determining the target channel count. The specific calculation method is shown in Formula (2)
Figure 6.
Network structure diagram of the channel focusing recalibration module.
To precisely capture the morphological features of tree crown edges and maintain network topology consistency, the CFR unit performs a three-stage operation of pruning–reconstruction–alignment.
The process of dynamic pruning and physical convolution kernel reorganization executes hard physical dimensionality reduction to effectively strip computational resources from redundant background features. For channel importance ranking, all input channels are ranked in descending order of discriminability based on weight , locking the index set of the top high-response channels. The specific calculation method is shown in Formula (3)
These indices precisely point to feature locations rich in tree crown textures and edge abrupt information. For convolution kernel slicing extraction, unlike soft mask strategies that only zero out feature maps, the model performs tensor slicing. Based on the index set , the system addresses the preset convolution weight matrix and physically extracts the corresponding convolution kernels to reorganize a new lightweight weight tensor . Physical dimensionality reduction is then performed using to transform the input features. This process projects the high-dimensional feature space onto a low-dimensional manifold, suppressing low-frequency background noise while focusing subsequent reconstruction calculations on effective features.
The dimension-reduced features are immediately input into a depthwise convolution for processing. Since the preceding convolution only performs linear combinations in the channel dimension and lacks perception of spatial neighborhood information, the model performs convolution on the pruned low-dimensional features. This design enables the network to capture the spatial geometric structure and local texture continuity of tree branches and leaves at an extremely low computational cost (calculation volume decreases linearly with the channel count ), effectively compensating for the spatial information loss potentially caused by channel compression. To address the statistical drift caused by dynamic channel sampling during the training and architecture search phase, Dynamic Batch Normalization (DBN) is introduced. This mechanism performs real-time slice adaptation on pre-trained global BN parameters (mean , variance ) based on the sampled slice index , ensuring feature distribution stability across different sub-networks. For deployment, once the optimal channel configuration is determined, the network architecture () is completely frozen. To ensure smooth export of the model to deployment frameworks such as TensorRT, we perform structural reparameterization before inference. We extract the finalized convolutional kernel weights and their corresponding static slices of the BN layers, and mathematically fold the BN parameters into the preceding convolutional weights. After this offline reparameterization, the complex SCCF module degenerates into standard, purely static convolutional operations. Consequently, when exporting to ONNX or TensorRT, the inference phase contains no unpredictable dynamic operators or conditional branches, fully conforming to industry-standard deployment specifications.
The sparse alignment and topology recovery process restores the original topological structure of the feature tensor to ensure the seamless integration of processed features into subsequent network layers, such as residual connections or the next decoder stage. A full-zero tensor is constructed as a container consistent with the original input dimensions. Using an index scatter mechanism, the activated effective features are filled back into their corresponding original positions. The corresponding positions here strictly point to the original channel indices recorded in step 1. Specifically, for each feature map enhanced by the convolution, it is precisely assigned to the channel with index in . The specific calculation method is shown in Formula (4)
while unselected background channel positions remain zero.
The final output can be expressed as (5)
This strategy allows the model to retain more detail channels and perform spatial enhancement in texture-complex tree crown areas, while executing high-ratio compression in background areas. Simultaneously, by restoring original dimensions through sparse alignment, the physical semantics of channels and network topology consistency are guaranteed, making the module plug-and-play.
The innovation of the SCCF module lies in breaking the limitation of traditional fixed-ratio compression. Through this dynamic weighting-pruning mechanism, the decoder can effectively filter out redundant features irrelevant to the task, concentrating computational resources on the reconstruction of high-frequency spatial structures. Experiments show that embedding the SCCF module significantly improves the model’s ability to parse fine tree crown edges and gap structures, providing pure and highly discriminative feature representations for high-precision canopy cover estimation.
2.4.3. Gradient-Guided Morphological Tree Crown Attention Module
To address the dual challenge of boundary adhesion and texture confusion in UAV-based tree crown segmentation, traditional CNNs often struggle to balance morphological integrity and edge details during decoding. We therefore propose G-MTCAM (Figure 7). Embedded in the decoder, this module constructs a morphology–texture dual-stream interaction architecture, unifying morphological and texture perception within a single mathematical framework.
Figure 7.
Overall network structure of the gradient-guided morphological canopy attention module.
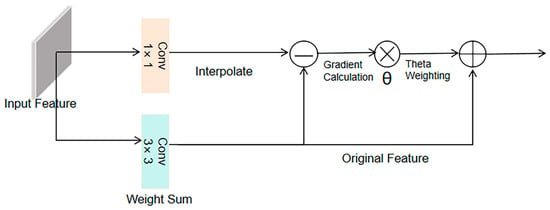
First, to overcome the defect that standard convolution easily loses high-frequency edge information during multi-level upsampling, G-MTCAM introduces GI-CDC, as shown in Figure 8. The proposed GI-CDC is based on the core ideas of existing central difference convolution literature in terms of theory and methodology. It inherits the design logic of CDC by capturing the difference features between the central pixel and its neighboring pixels, and further improves upon it.
Figure 8.
Network structure diagram of gradient-induced central difference convolution module.
The reconstructed output feature is decoupled into complementary morphology and texture streams, calculated as (6)
where is the standard convolution output, aggregating absolute pixel intensity within the local receptive field, responsible for describing the overall geometric morphology and semantic category of the tree crown; is a hyperparameter controlling the contribution ratio of the morphology and texture streams; and explicitly captures high-frequency details through center difference calculation. If this term is large, it indicates edges or strong textures; conversely, it indicates a smooth region. Specifically, the background reference term represents the base intensity when the local area is flat. The subtraction of the two is mathematically equivalent to the weighted gradient calculation . When performing convolution in a flat area, the result of standard convolution becomes, the formula is as follows
meaning in a flat area, equals . This mechanism ensures the model no longer focuses solely on absolute pixel brightness but keenly perceives the rate of change in neighbor pixels relative to the center pixel. Thus, at each stage of multi-scale feature recovery, it produces significant responses to tree crown edges or branch-leaf interfaces, achieving effective cutting of adherent tree crowns.
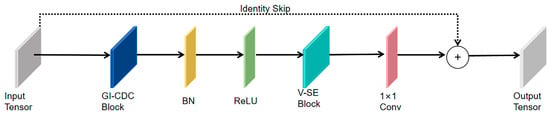
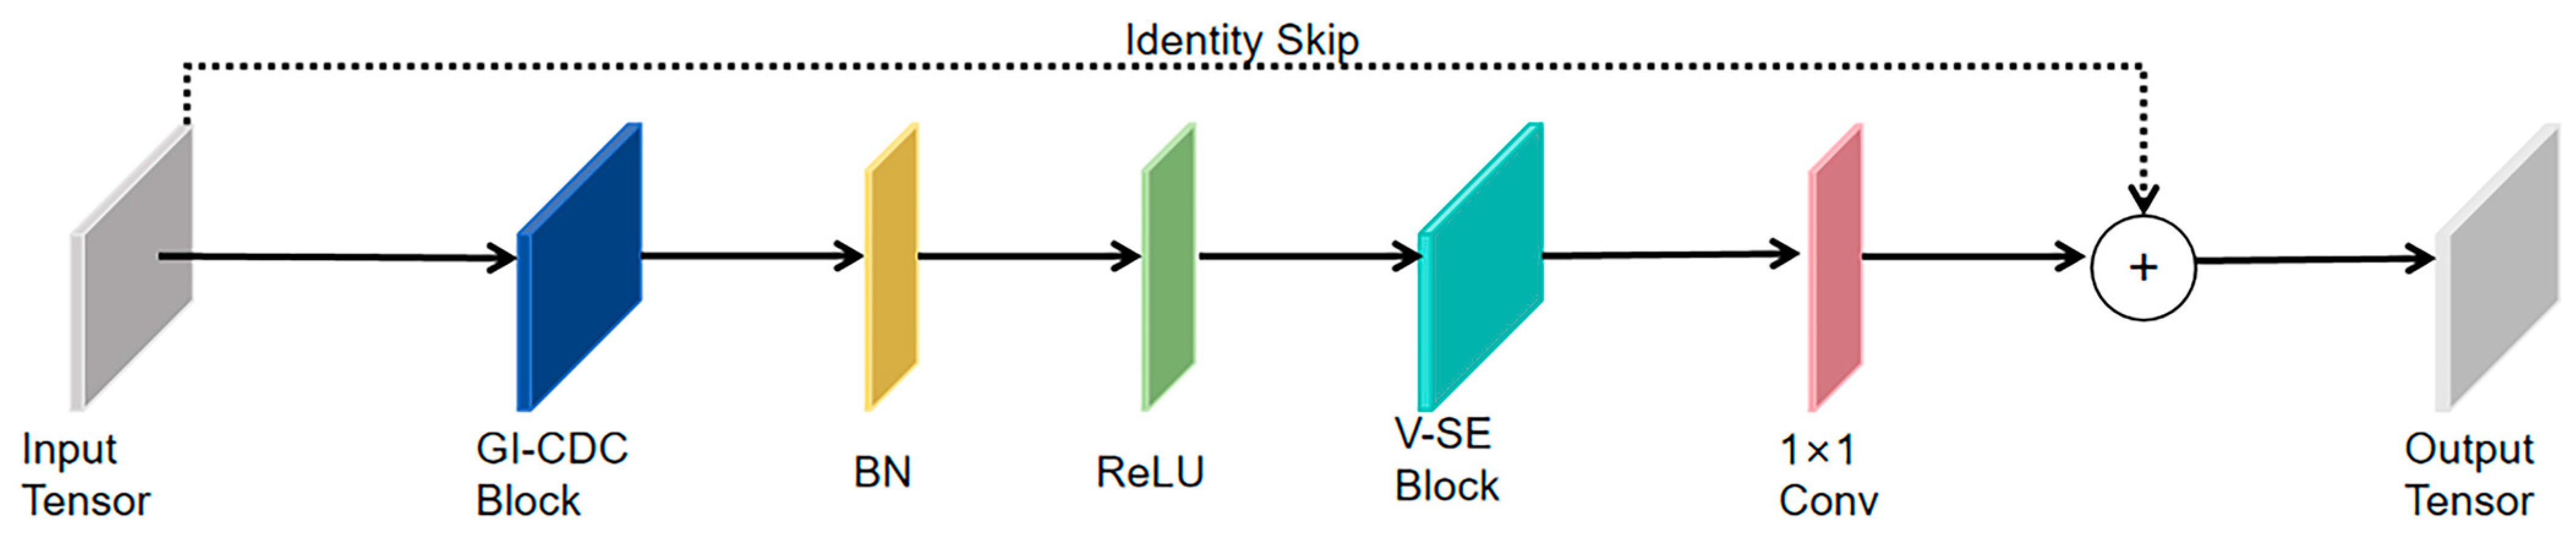
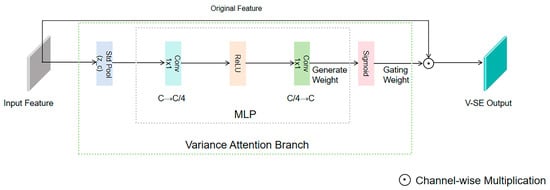
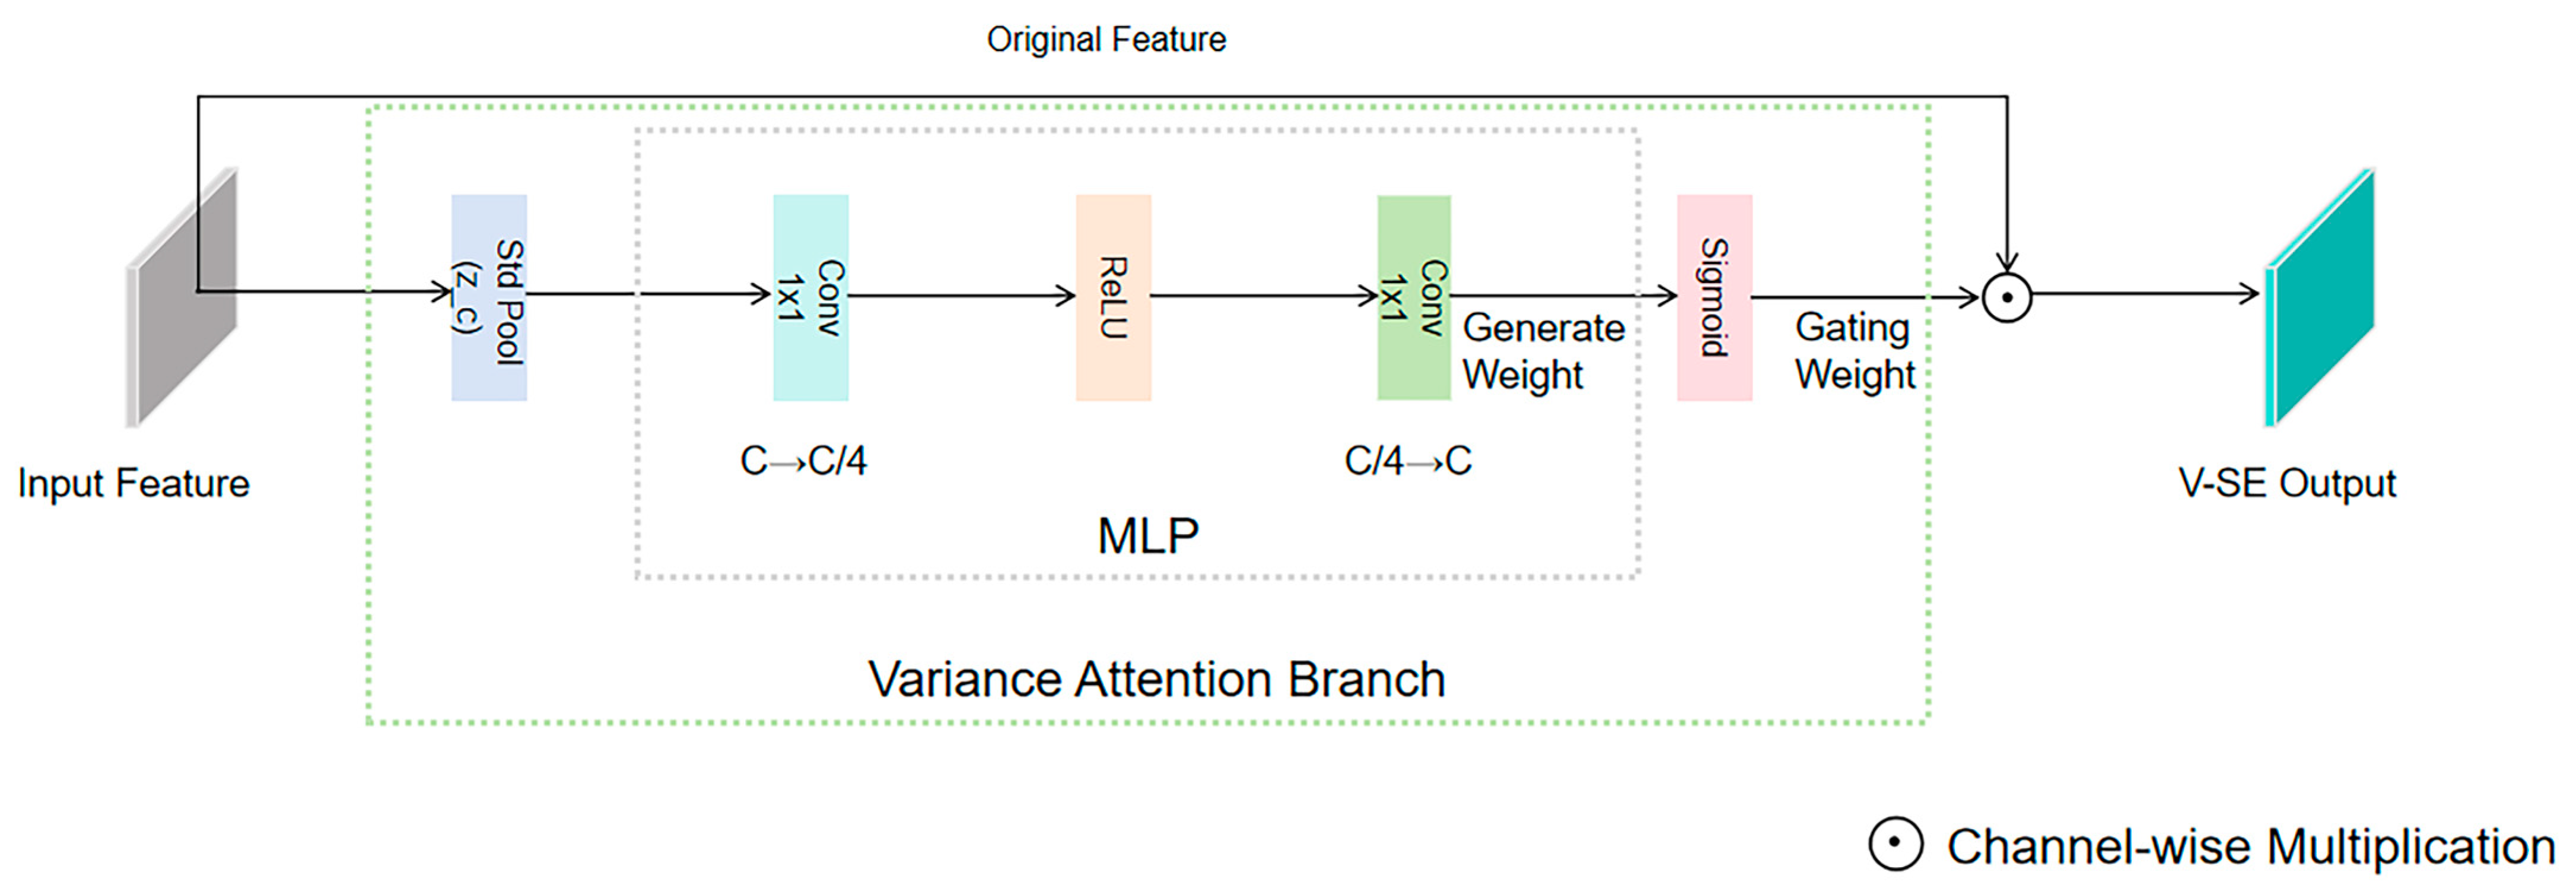
Second, although GI-CDC extracts rich mixed features, to further suppress non-target texture noise such as ground vegetation, this paper designs a Variance-based Statistical Attention mechanism (V-SE), as shown in Figure 9.
Figure 9.
Network structure diagram of the variance-based statistical attention mechanism module.
This mechanism is connected in series after GI-CDC, containing batch normalization and ReLU activation to enhance non-linear expression. Considering that the texture complexity of the tree crown area is significantly higher than that of smooth ground due to leaf stacking, we calculate the spatial standard deviation of the feature map, the formula is as follows
The gating weights generated based on can adaptively screen features. Finally, the weighted texture features are channel-fused through a convolution layer, and a residual connection is introduced to add the input feature to the enhanced feature. This design ensures that the module explicitly injects gradient-guided tree crown boundary details while recovering original semantic information layer by layer, progressively correcting and effectively solving the boundary adhesion problem along the decoding path.
2.5. Boundary-Enhanced Hybrid Loss Function
In the segmentation task of forest canopy remote sensing imagery, tree crown boundaries often appear blurred and discontinuous due to mutual occlusion, uneven lighting, and tree species texture differences. Traditional binary cross-entropy loss functions tend to process each pixel independently during optimization, lacking perception of local spatial structures, which leads the model to over-focus on large main areas while ignoring small-scale crown edge details. For canopy cover estimation, the accuracy of tree crown projection area calculation is crucial; slight deviations in boundary recognition can be significantly amplified in subsequent area integration, severely affecting estimation accuracy.
Addressing these issues, this paper designs a Boundary-Enhanced Hybrid Loss Function. This loss strategy employs a multi-task constraint mechanism aimed at maintaining global semantic consistency while explicitly reinforcing the model’s attention to high-frequency edge information. The function consists of the following three parts.
- Pixel-level Classification Constraint
As the foundational supervision term, Binary Cross-Entropy (BCE) loss provides stable pixel-level classification gradients, ensuring numerical stability and convergence speed during network training. It is defined as (9)
where is the true label of pixel , and is the predicted probability.
- 2.
- Region-level Overlap Constraint
To mitigate potential sample imbalance between foreground (tree crown) and background (forest gap, shadow), Dice loss is introduced to directly optimize the set similarity between the predicted region and the ground truth region. This term constrains the model from the perspective of overall geometric shape, reducing fragmentation. The formula is as follows
where is a smoothing factor to prevent division by zero.
- 3.
- Edge Gradient Distribution Constraint
This is the core term for solving crown edge blurring. We extract edge features by convolving the predicted probability map and the ground truth map with fixed-parameter Sobel operators (along x and y directions, respectively) in the gradient domain. To eliminate dimensional effects, the extracted edge intensity maps are normalized to the interval to possess probability attributes. Subsequently, Binary Cross-Entropy loss is used to minimize the difference between the predicted edge distribution and the true edge distribution. The formula is as follows
This constraint forces the model to keenly capture boundary areas with drastic gray-level changes, achieving edge sharpening through fitting the edge probability distribution.
In summary, the total loss function is defined as the weighted sum of the above three terms. The formula is as follows
In this study, this hybrid loss function achieves multi-level synergistic optimization of pixel fidelity, regional matching, and edge enhancement, forming a complement with the lightweight decoder to significantly improve tree crown segmentation accuracy under complex forest backgrounds.
2.6. Model Evaluation Metrics
To comprehensively and objectively evaluate the overall performance of the improved model in forest tree crown segmentation tasks, this study constructed a multi-dimensional evaluation system covering segmentation accuracy and computational efficiency.
In terms of computational efficiency, Floating Point Operations (FLOPs) are used to measure model complexity and inference load, and Parameters are used to measure computational cost. Regarding segmentation accuracy, Intersection over Union (IoU) is selected as the core metric to quantify the spatial overlap between the predicted tree crown region and the ground truth label; simultaneously, Pixel Accuracy (Acc) and F1 Score are introduced as auxiliary metrics to evaluate global classification correctness and the balance between precision and recall, respectively.
The calculation of each metric is based on confusion matrix statistics. True Positive (TP) refers to pixels correctly identified as tree crowns; False Negative (FN) refers to tree crown pixels misclassified as background; False Positive (FP) refers to background pixels misclassified as tree crowns; and True Negative (TN) refers to background pixels correctly identified. The specific calculation formula is defined as follows.
- Intersection over Union (IoU) measures the set similarity between segmentation results and ground truth, serving as the most critical evaluation standard for semantic segmentation.
- Pixel Accuracy (Acc) measures the overall correctness of pixel classification across the entire image.
- F1 Score is the harmonic mean of Precision and Recall, effectively reflecting the model’s robustness under imbalanced sample conditions.where is a smoothing factor (set to 1 × 10⁻⁵) to prevent numerical instability caused by division by zero. Through the above metric system, a comprehensive evaluation of the model can be completed from the three dimensions of accuracy, efficiency, and stability.
3. Results
3.1. Experimental Environment
The experimental evaluation was carried out on a standalone workstation running the Ubuntu 20.04 operating system. To ensure fair comparison, all competition methods are implemented within the MMSegmentation framework, using a fixed random seed. We implemented the model using the PyTorch 2.0.0 deep learning framework with Python 3.8 and CUDA 11.8 support. The hardware specifications included an Intel Xeon Gold 6330 CPU and a single NVIDIA RTX 3090 GPU (Santa Clara, CA, USA) equipped with 24 GB of video memory. Apart from that, there is no complex parameter tuning. Detailed experimental settings and hyperparameters are listed in Table 1.
Table 1.
Detailed hyperparameters of the experiment.
3.2. Comparative Experiments
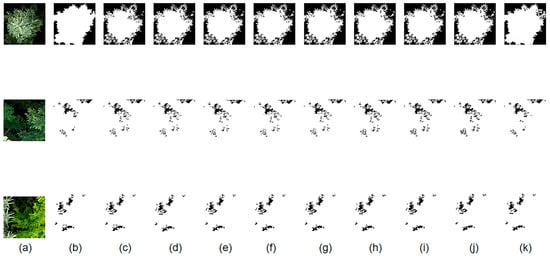
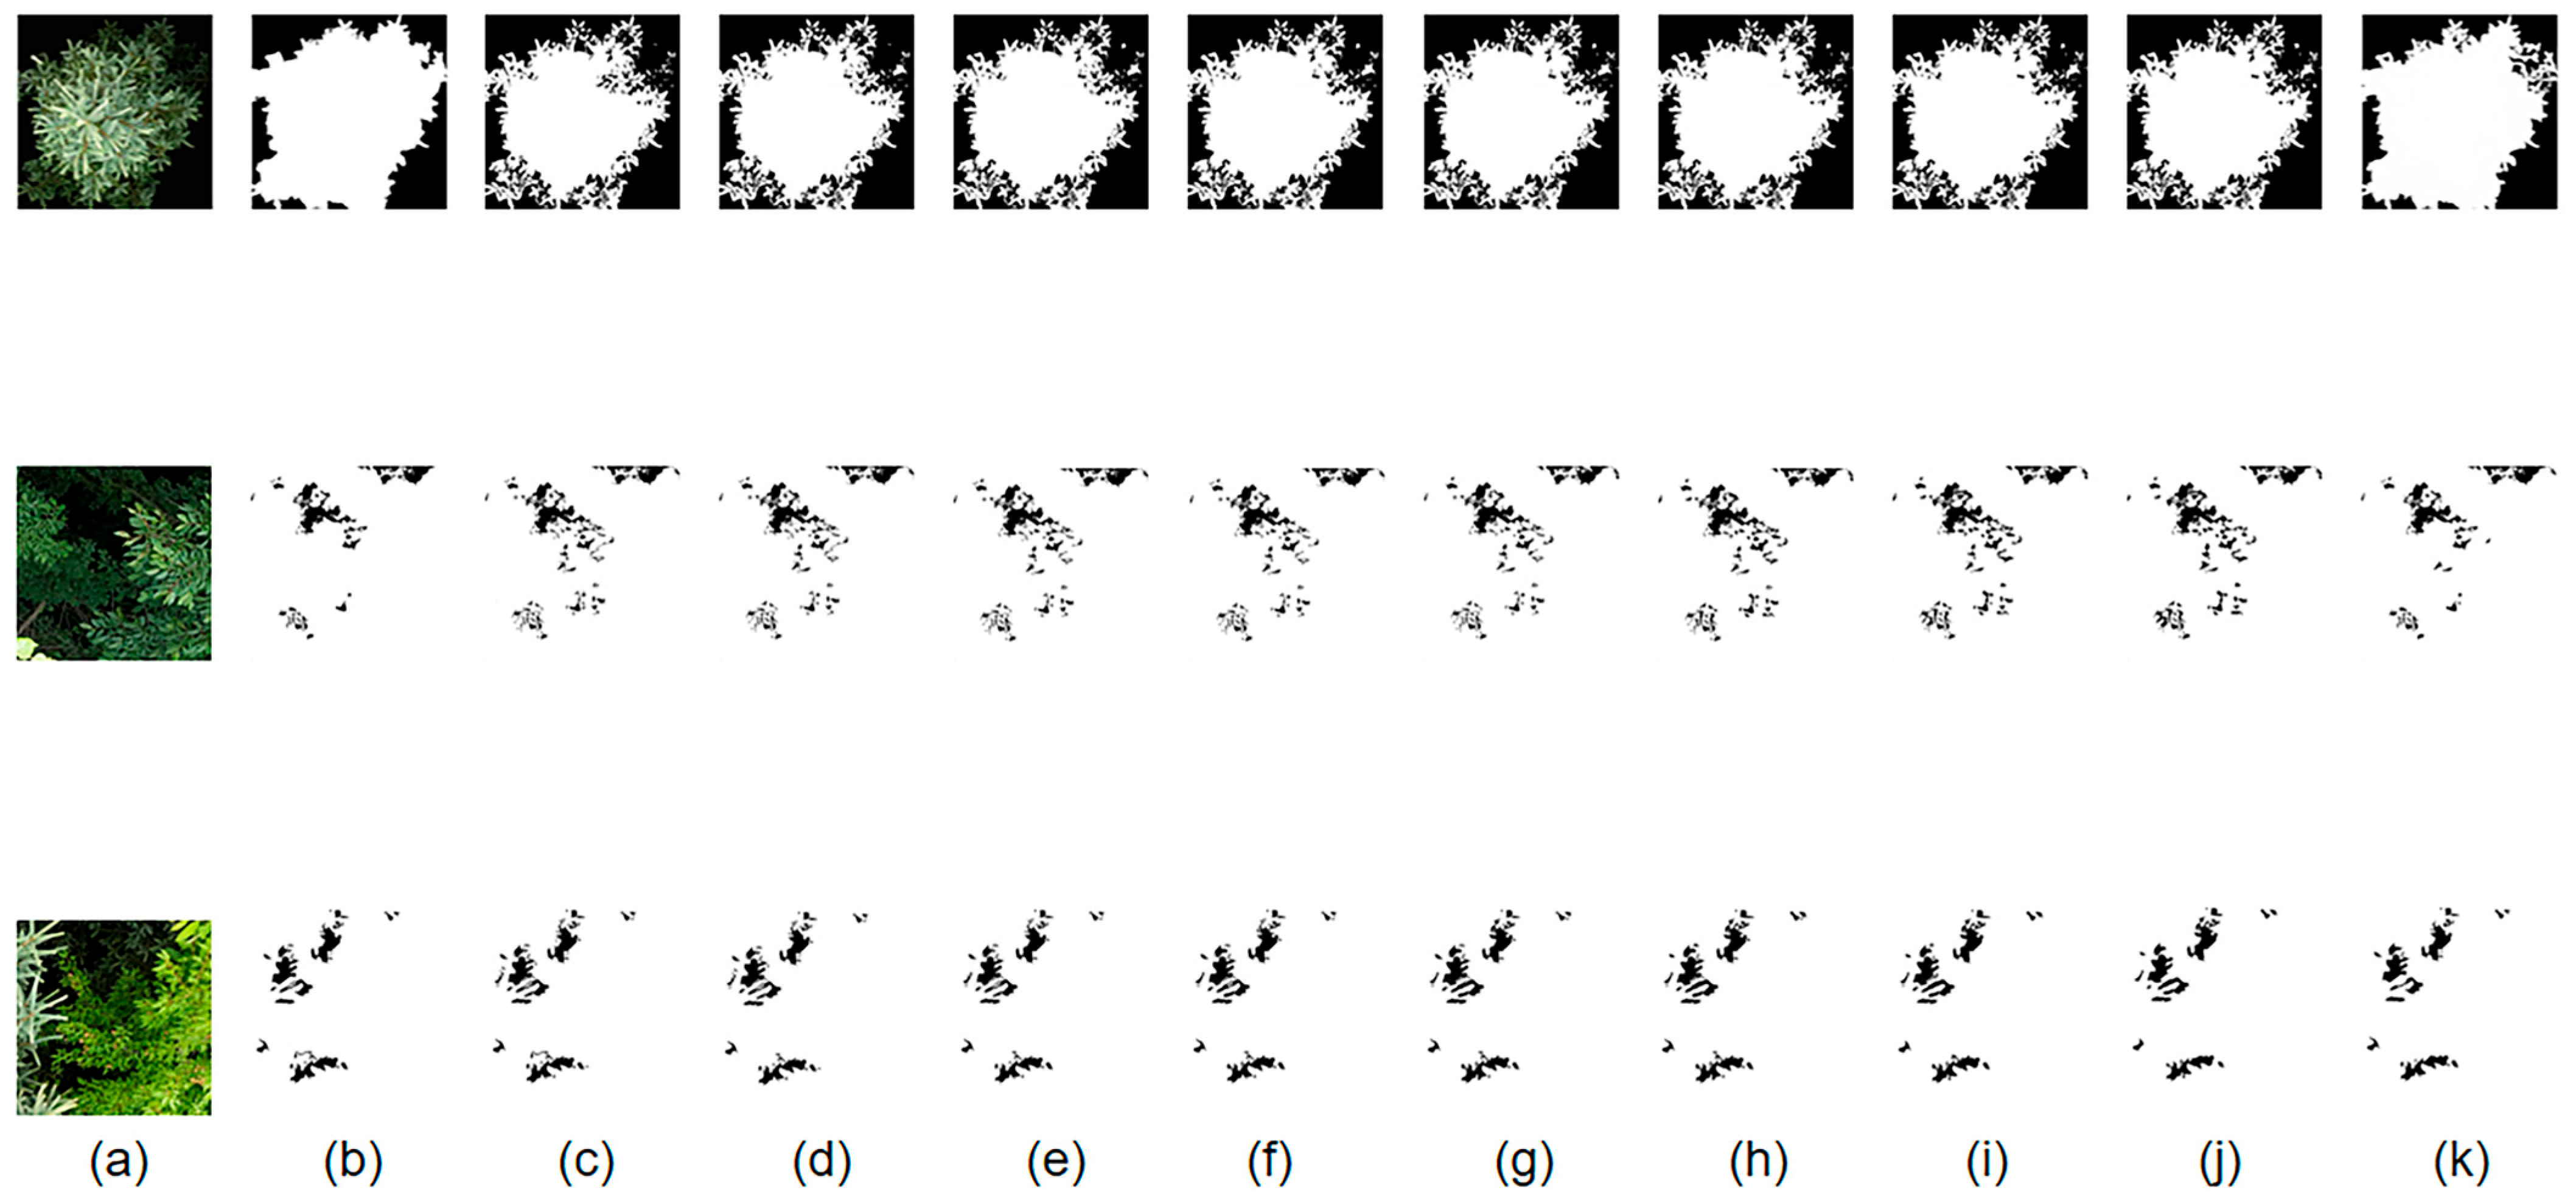
To verify the effectiveness and superiority of the proposed method, we comprehensively compared it with current mainstream semantic segmentation models under the same experimental environment. The comparison models covered classic CNN architectures (FCN-8s, U-Net), high-precision large models (DeepLabV3+, DANet), real-time lightweight models (PSPNet, BiSeNetV2, HRNetV2), and advanced Transformer-based models (SegFormer), as shown in Figure 10.
Figure 10.
Comparison of experiments for each model in the comparative experiment. (a) UAV imagery; (b) corresponding labels; (c) FCN-8s model results; (d) U-Net model results; (e) DeepLabV3+ model results; (f) BiSeNetV2 model results; (g) PSPNet model results; (h) DANet model results; (i) SegFormer model results; (j) HRNetV2 model results; (k) results of this model.
Experimental results are shown in Table 2, where evaluation metrics include Intersection over Union (IoU), Accuracy (Acc), F1 Score, and Floating Point Operations (FLOPs) to measure computational complexity.
Table 2.
Performance Comparison of Different Models.
Table 2 presents the quantitative comparison results on the test set. It should be noted that the backbones of all comparison models (including Transformer-based architectures) were loaded with ImageNet pre-trained weights and fine-tuned; all models were trained under the same data division strategy (spatial block division), same input size (), and same data augmentation principles (training set only), with the optimal weights selected on the validation set for testing to ensure fairness and reproducibility. Under these settings, the proposed method achieved the best IoU (88.59%) and F1 (93.77%) on this dataset, while maintaining low computational complexity (6.71 GFLOPs), demonstrating a good trade-off between accuracy and efficiency. To ensure the reliability of the experimental results, we added a small-scale test experiment (coniferous forest plots) with different canopy structures. The results showed that the model still maintained good performance (IoU = 88.94%, ACC = 88.71%, F1 = 94.02%). We analyzed that the canopy details in coniferous forests are relatively simple and obvious, thus outperforming other datasets. The model in this study achieved a significance level of p < 0.05 for both IoU and F1 scores.
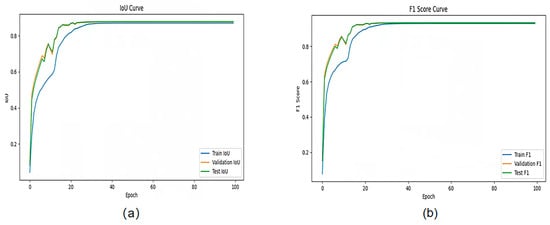
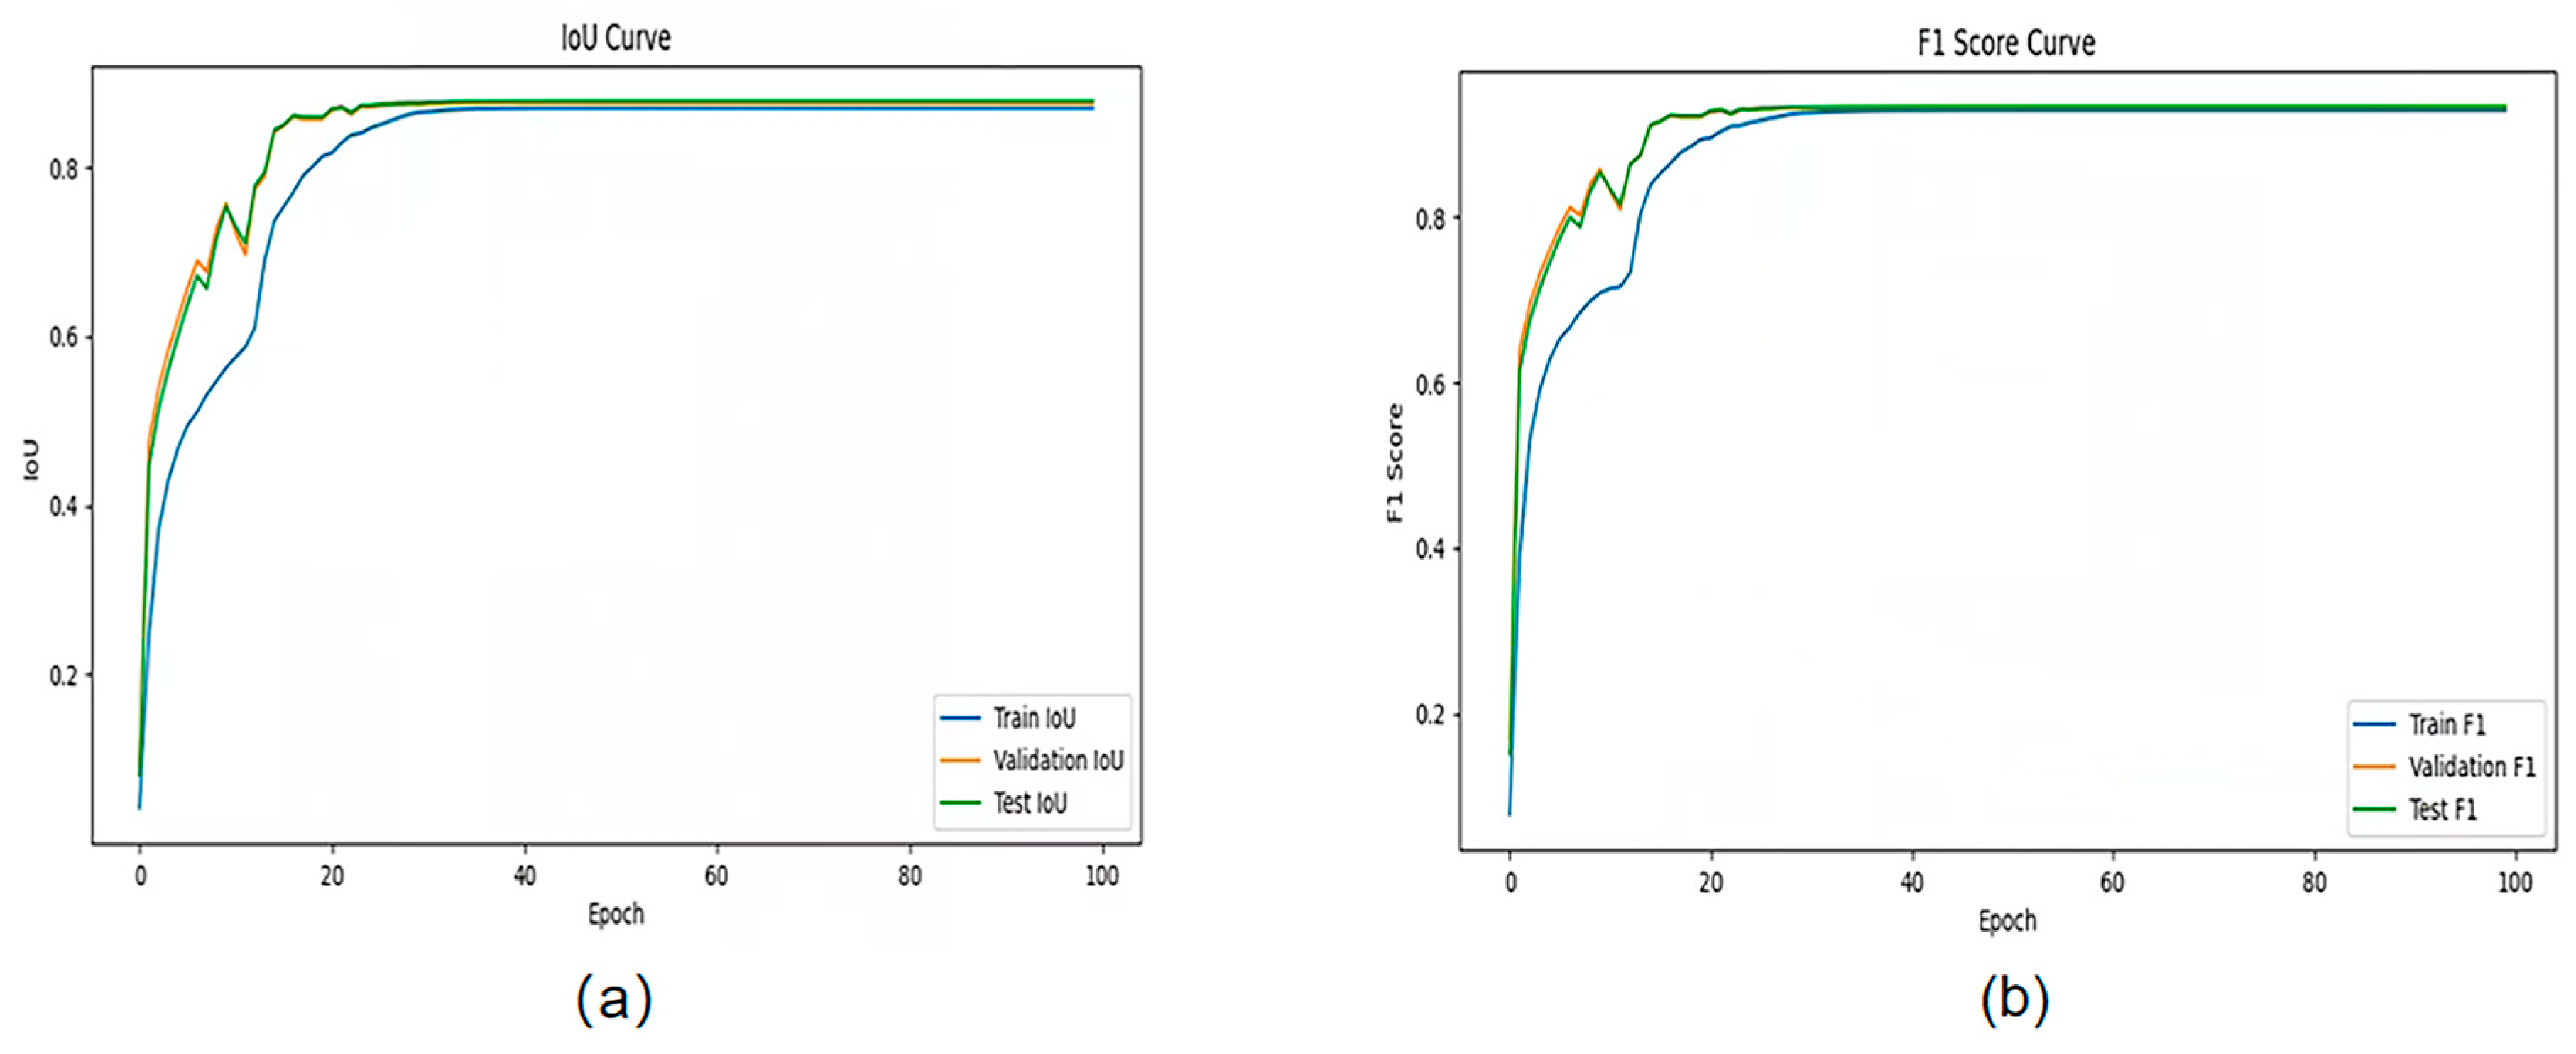
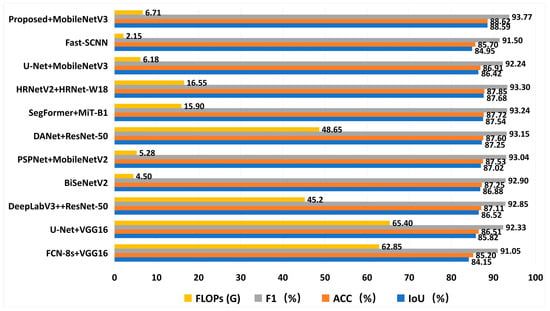
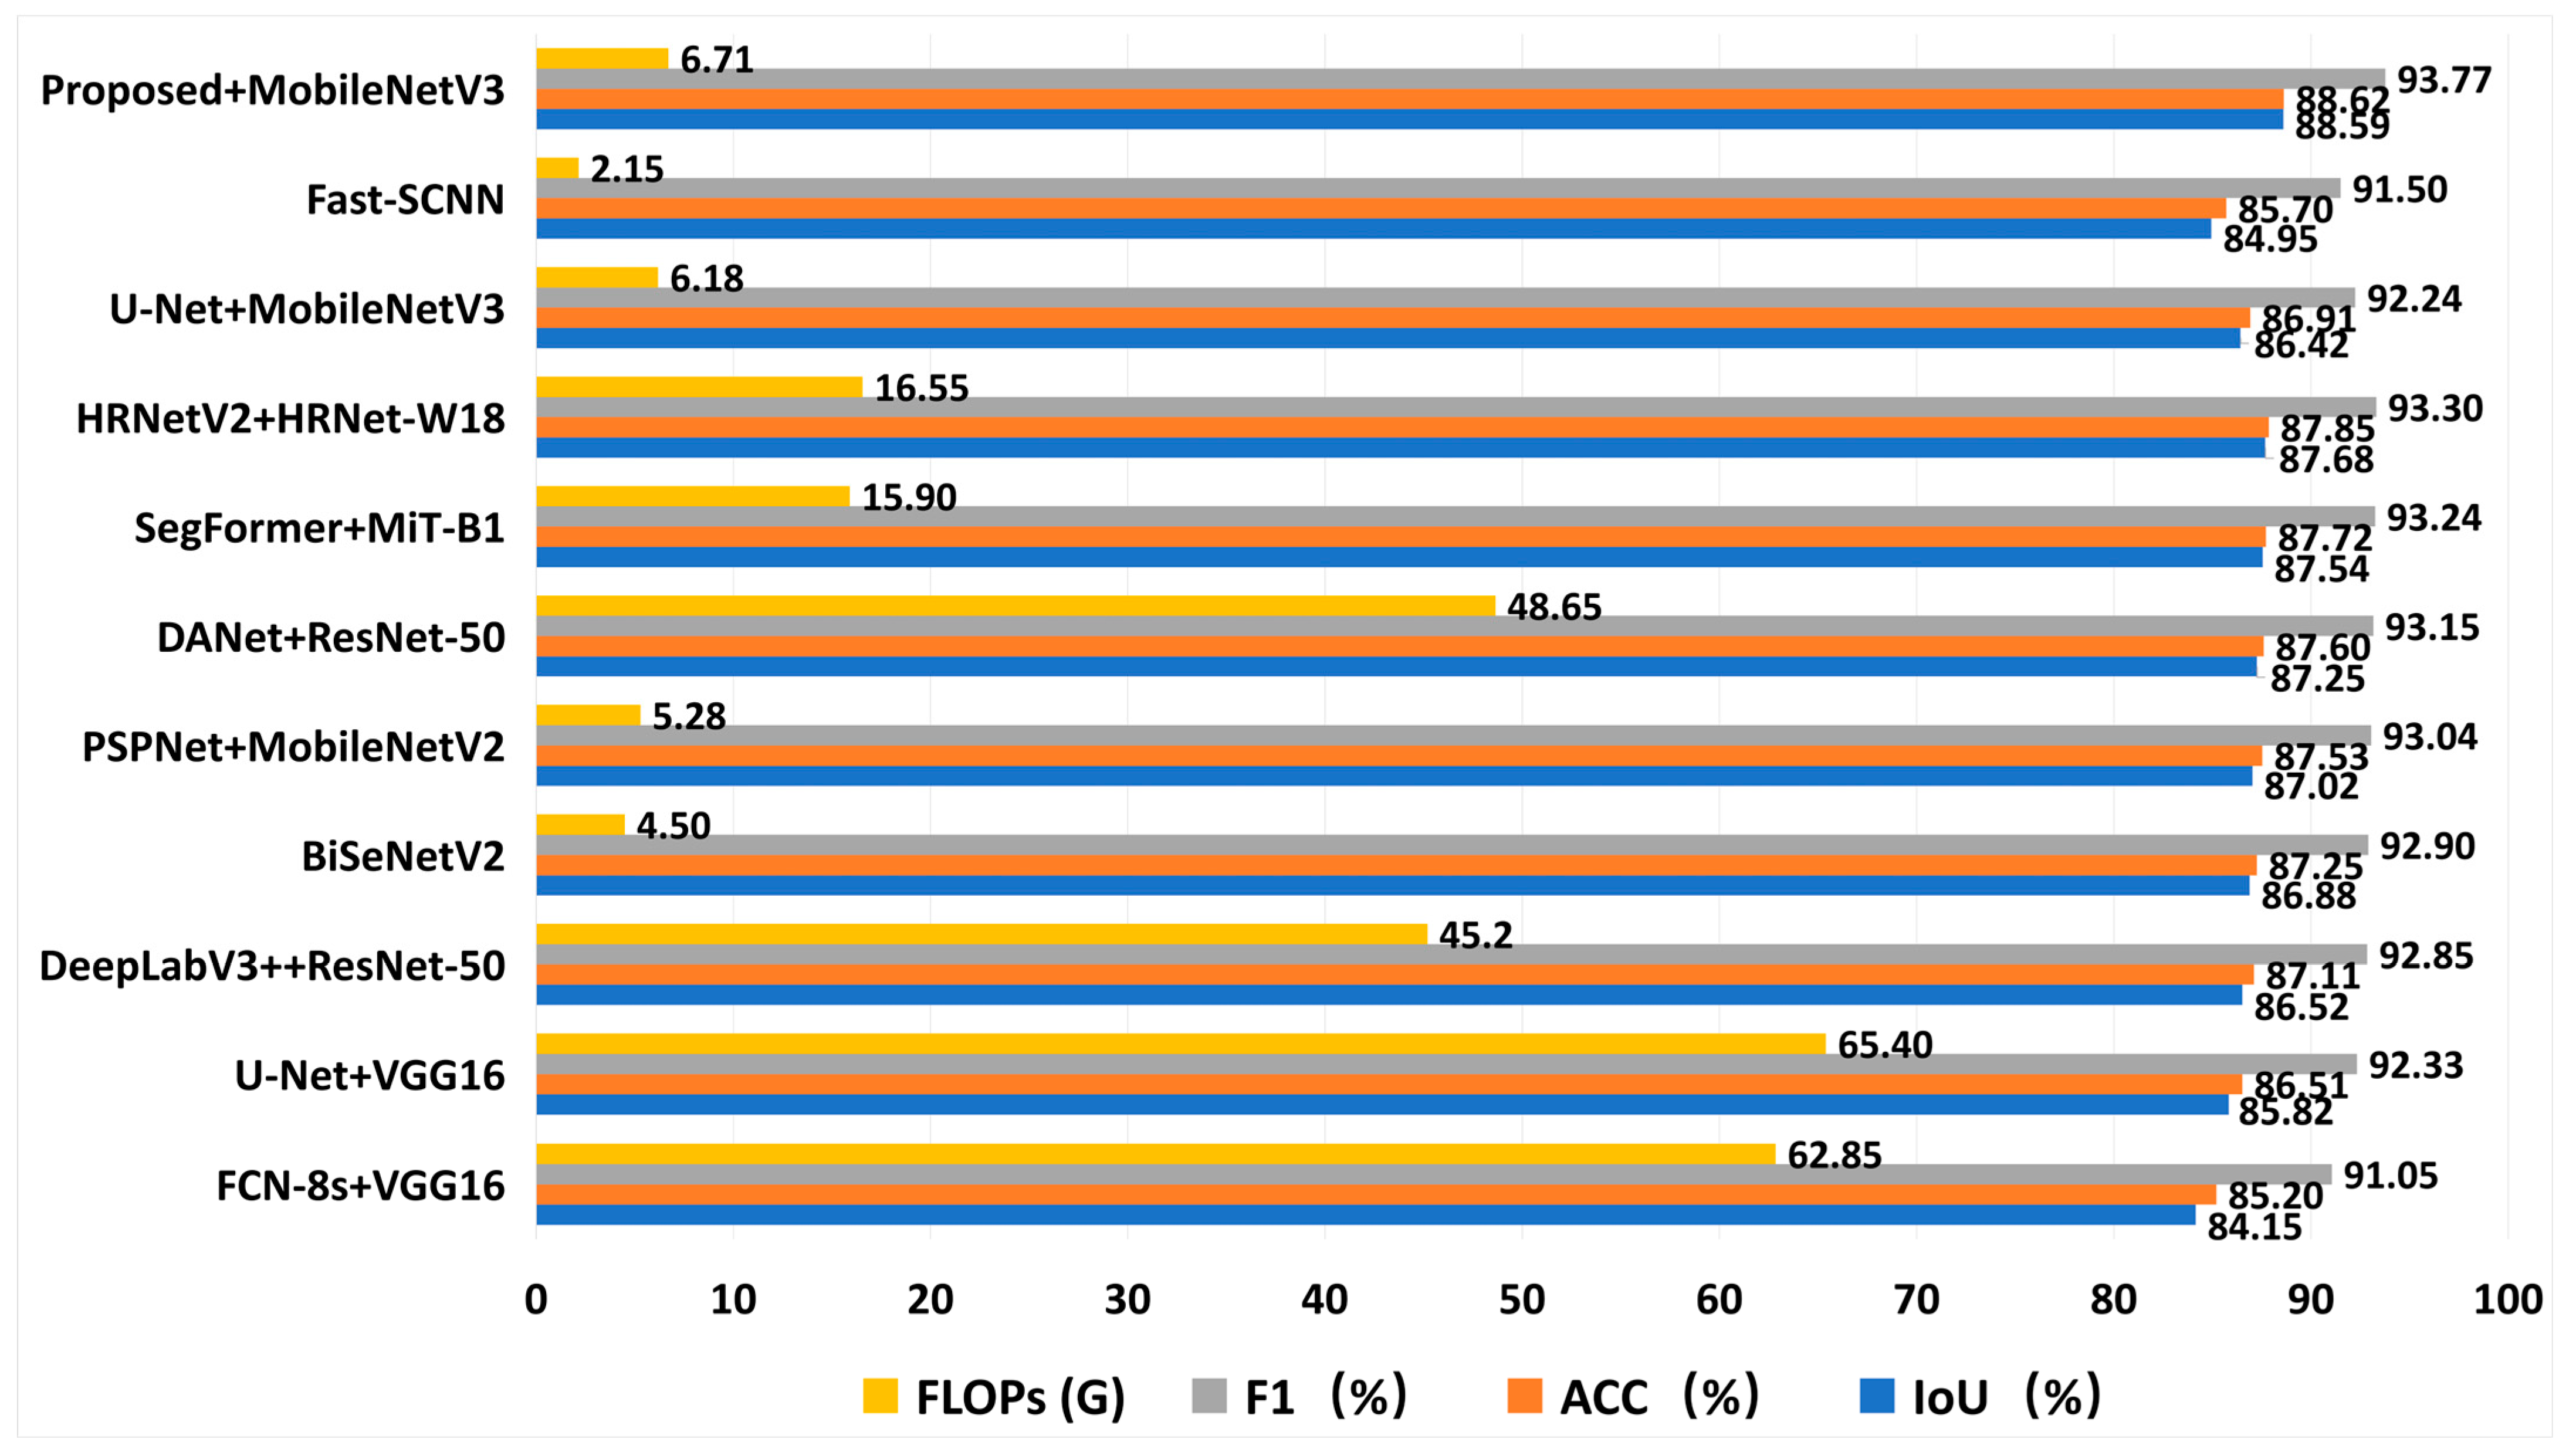
Compared to classic U-Net and DeepLabV3+, the proposed method achieved significant improvements in IoU of 2.77% and 2.07%, respectively. This indicates that simply stacking network layers or using standard dilated convolutions is difficult to fully mine the micro-features of tree crown edges, whereas the proposed strategy handles complex forestry scenes more effectively. More importantly, even compared to the Transformer-based SegFormer and HRNetV2 (which is dedicated to feature maintenance), the proposed method still maintained advantages of 1.05% and 0.91% in IoU, respectively. Meanwhile, models like Fast-SCNN are extremely lightweight with very low floating-point operations (FLOPs) (approximately 2.15G), but they sacrifice high accuracy and low IoU. This confirms that even based on a lightweight MobileNetV3 backbone, the model outperforms complex multi-branch or self-attention architectures in feature expression on this dataset by introducing the designed gradient-guided modules. Figure 11 shows the model’s performance metrics during training.
Figure 11.
Model performance during training. (a) Iou curve (b) F1 curve.
In terms of computational efficiency, the model’s computational complexity is only 6.71 GFLOPs. Compared to heavy networks like DeepLabV3+ (45.20 G) and DANet (48.65 G), the computational cost is reduced by nearly 7 times, greatly lowering the threshold for hardware deployment. Although the calculation volume is slightly increased compared to ultra-lightweight models like BiSeNetV2 (4.50 G) and PSPNet (5.28 G) (e.g., an increase of 1.43 GFLOPs over PSPNet), this minor computational cost yields significant accuracy returns—IoU improved by 1.71% and 1.57%, respectively. This is attributed to the efficiency of the MobileNetV3 backbone and the effective suppression of redundant features by the G-MTCAM module, allowing the model to achieve the best balance between speed and accuracy while maintaining extreme lightweight. Figure 12 shows a bar chart comparison of the data from different models in the comparative experiment.
Figure 12.
Bar chart comparison of data from different models in the comparative experiment.
In summary, the proposed method significantly improves segmentation accuracy while ensuring extremely low computational load, proving its effectiveness as an efficient and high-precision semantic segmentation solution.
3.3. Ablation Experiments
To verify the independent contribution and synergistic enhancement effect of each improved module proposed in this paper on the overall segmentation performance, a series of ablation experiments were designed under the same dataset and training settings. The baseline model in Table 3 refers to the U-Net structure using MobileNetV3-Large as the encoder (MobileNetV3-UNet). Subsequent SCCF, G-MTCAM, and Boundary loss were progressively superimposed on this baseline. The classic U-Net (VGG16 encoder) was used only for the comparative experiments in Section 3.2.
Table 3.
Ablation Experiment Results.
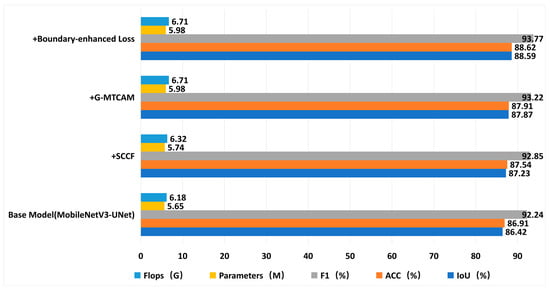
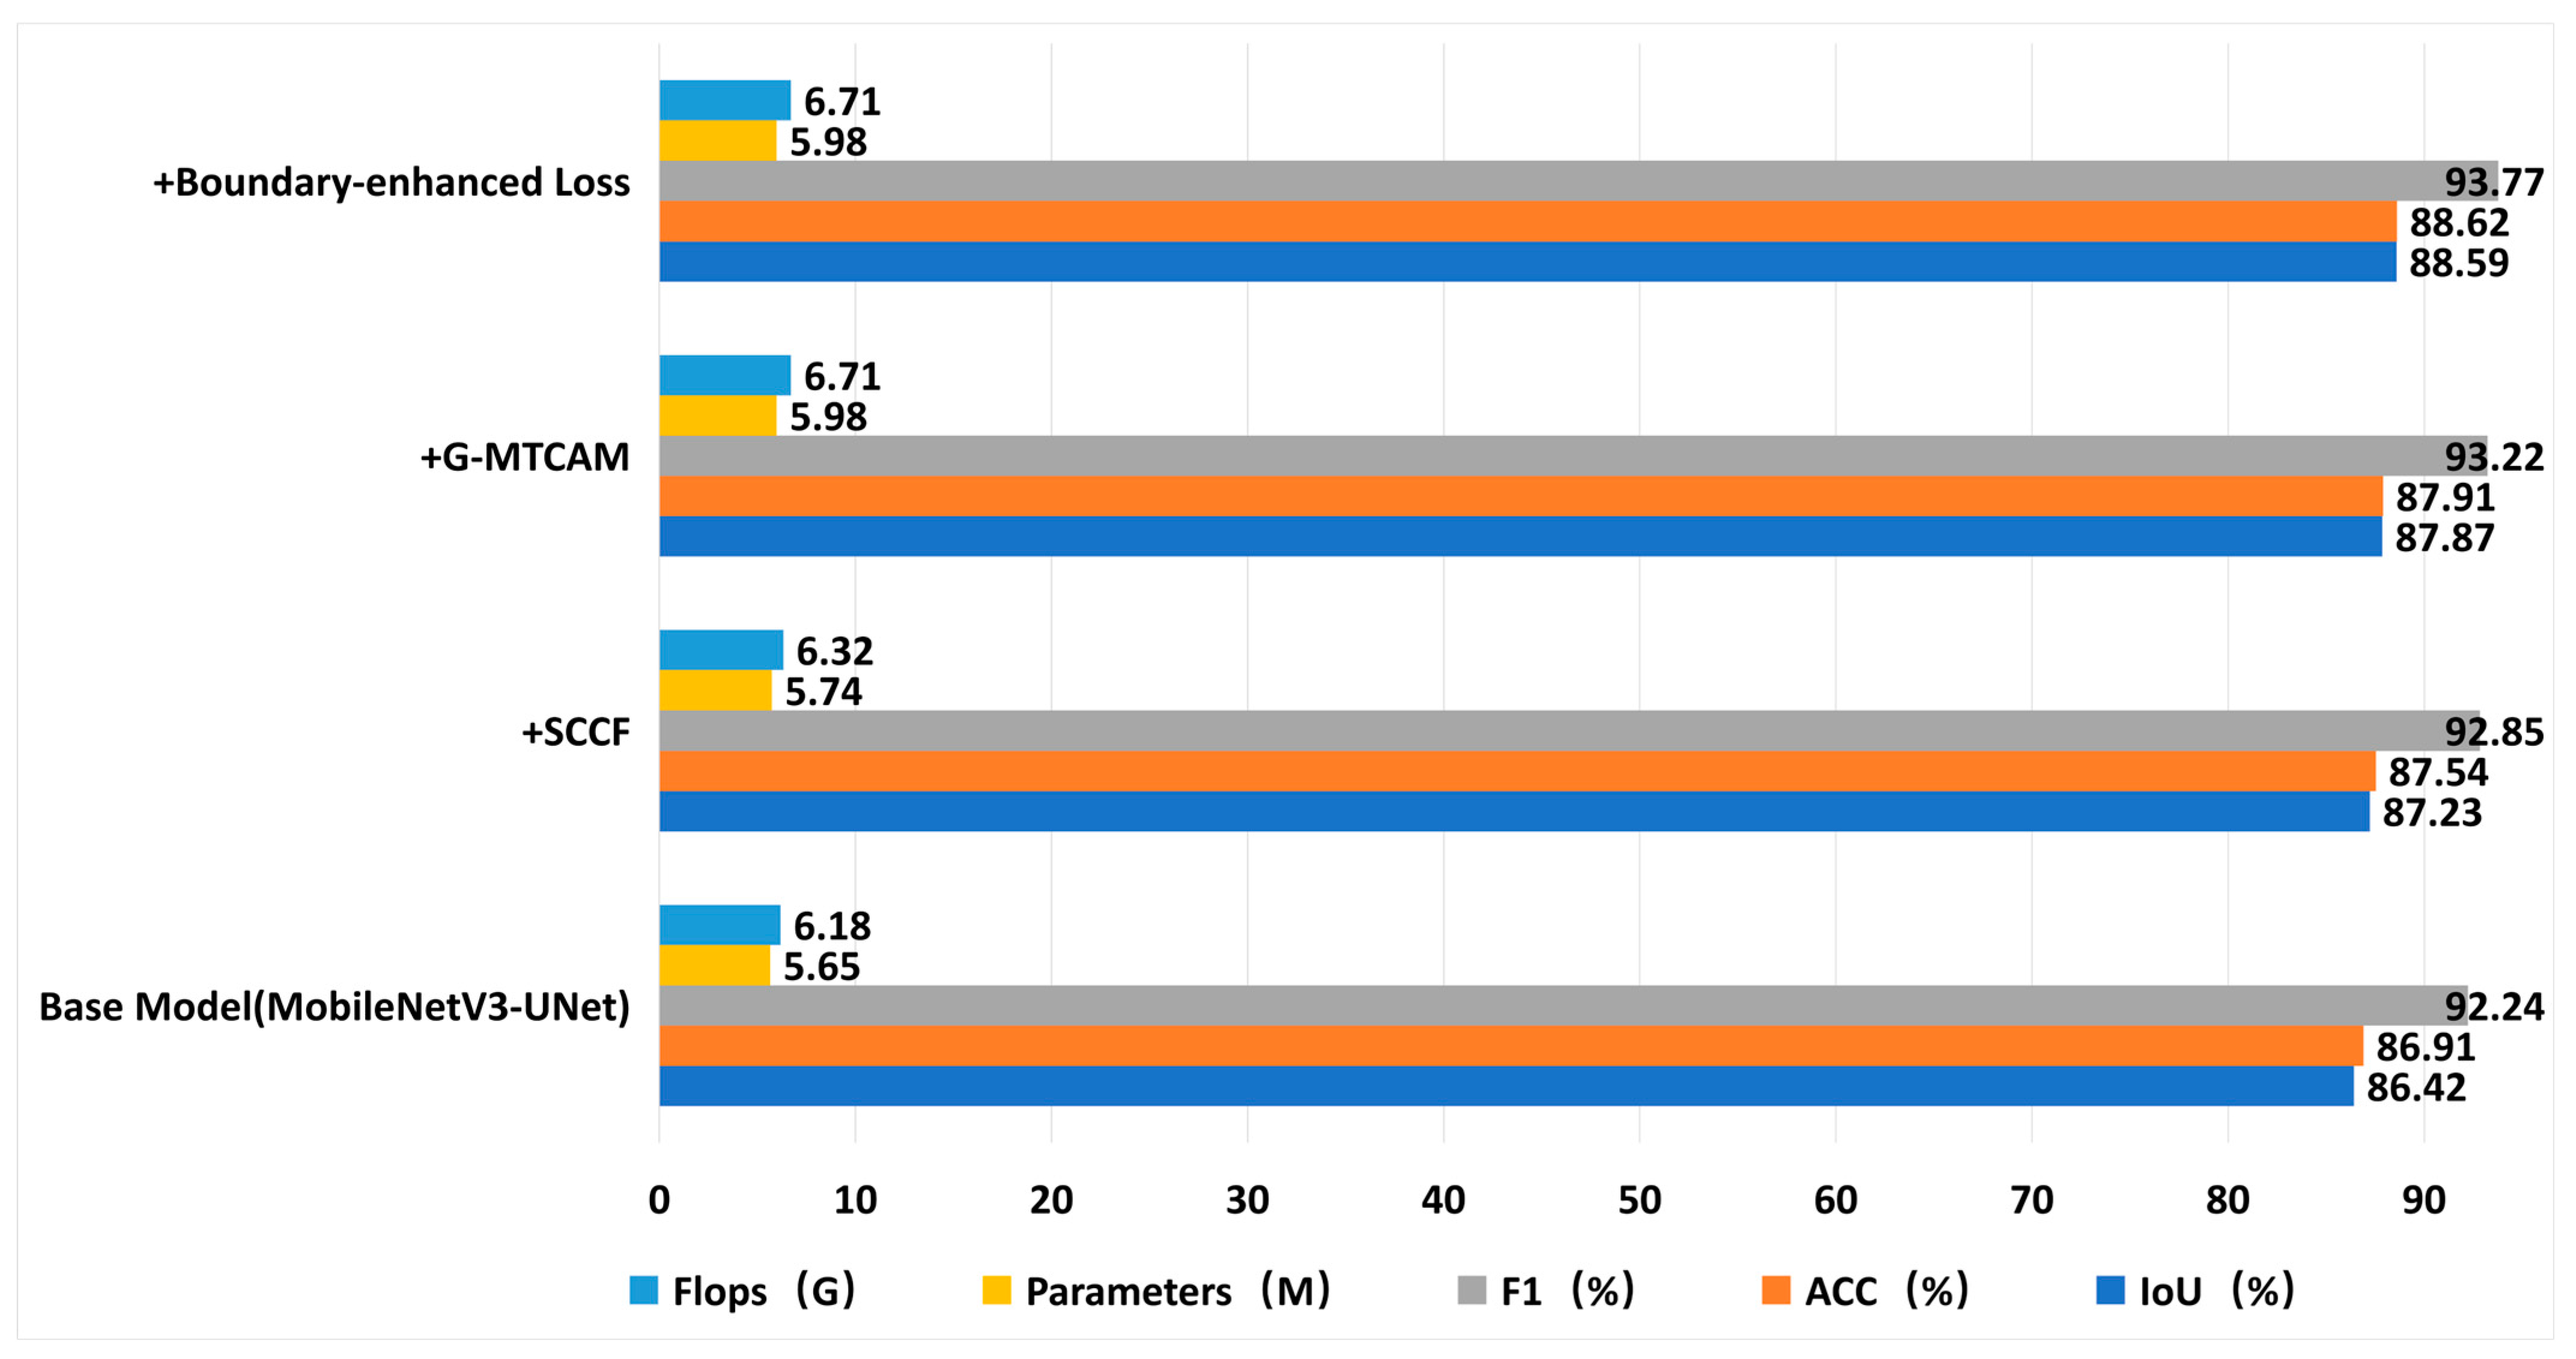
First, as the cornerstone of lightweight transformation, we replaced the original backbone network with MobileNetV3. This improvement established an excellent efficiency foundation for the model, achieving an IoU of 86.42% with extremely low resource consumption of only 5.65 M parameters and 6.18 G FLOPs.
On this basis, we embedded the SCCF module into the decoder stage. Experimental data showed that the introduction of this module increased IoU to 87.23% and the F1 score to 92.85%, while the calculation volume only increased marginally to 6.32 G. This result confirms that SCCF can significantly improve the model’s ability to capture tree crown texture details by suppressing redundant channels and focusing on key semantic features at a very low computational cost.
Subsequently, by integrating the G-MTCAM module, the model’s ability to discriminate complex textures and edges was significantly enhanced. Utilizing gradient convolution and variance gating mechanisms, this module effectively reinforced high-frequency information extraction, raising IoU to 87.87% and Acc to 87.91%. Meanwhile, FLOPs remained stable at 6.71 G, indicating that G-MTCAM improves the recognition accuracy of difficult areas (such as tree crown edges) without imposing an excessive burden on network inference.
Finally, the Boundary-Enhanced Hybrid Loss was introduced to construct the final model. Through strong constraints during training, this optimization strategy enabled the final model to reach an optimal level of 88.59% in IoU and an F1 score as high as 93.77%. This significant improvement effectively solved the problem of insufficient edge recovery capability in the baseline model, giving the segmentation results extremely high crown edge consistency. Figure 13 shows a bar chart comparison of the data in the model ablation experiment.
Figure 13.
Bar chart comparison of data from ablation experiments.
3.4. Qualitative Comparative Result Analysis
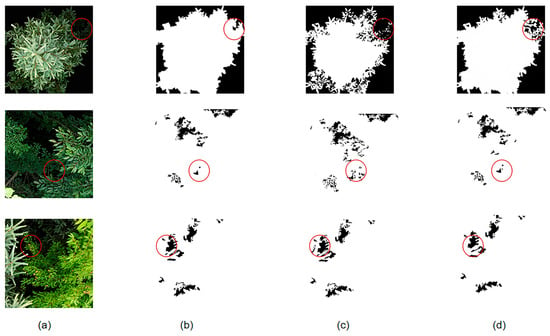
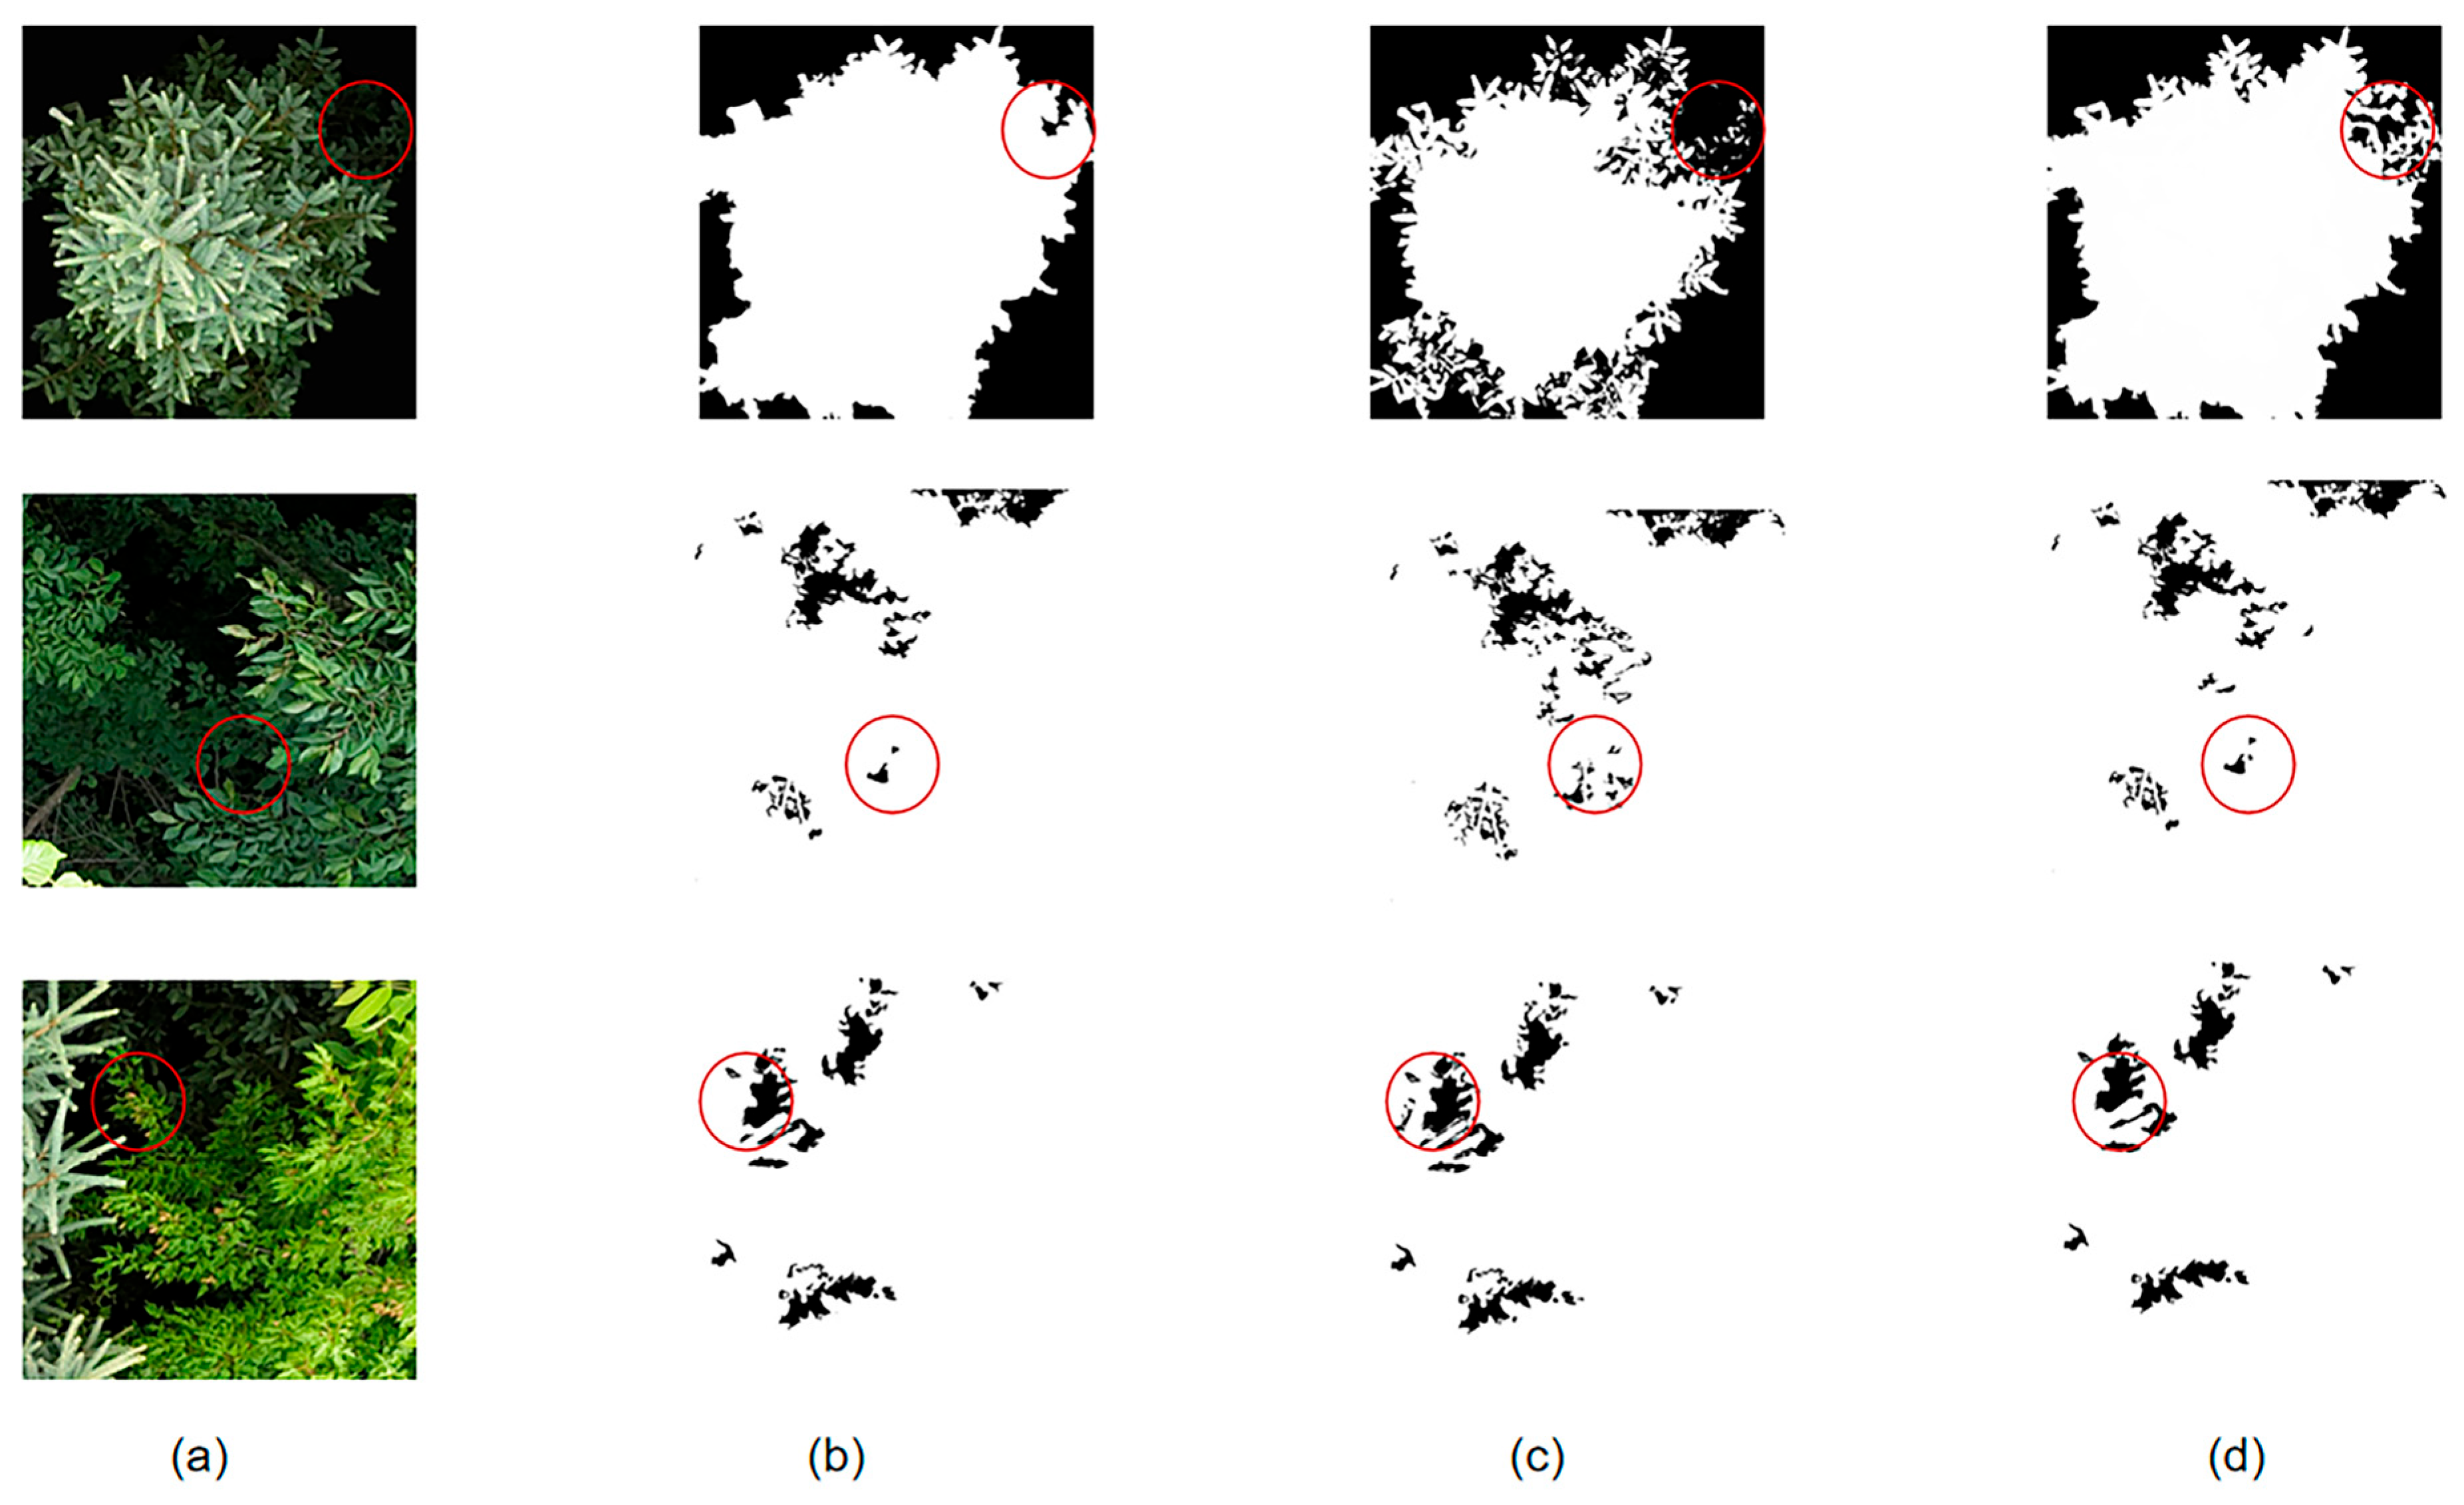
To intuitively evaluate the tree crown segmentation performance of the proposed model in complex forestry scenarios, Figure 14 displays the visual comparison results between the proposed method and the baseline model on typical test samples.
Figure 14.
Comparison and analysis of segmentation results (a) original UAV RGB image, (b) manually annotated ground truth, (c) segmentation result of the basic model, and (d) segmentation result of the method proposed in this paper. The red circles indicate the significant processing effects at the same locations.
From the qualitative results, it can be seen that while the baseline model can locate the main areas of tree crowns, it shows obvious limitations when dealing with samples featuring complex canopy structures and strong lighting interference. First, regarding boundary response, affected by irregular geometric shapes of tree crown edges and shadow occlusion, the baseline model exhibits severe contour over-smoothing. This leads to blurred tree crown edges, and in local areas, even boundary adhesion or significant deviation occurs, making it difficult to precisely define the interface between tree crowns and the background. Second, regarding internal consistency, faced with areas of drastic texture change or dense leaf gaps, the baseline model is prone to semantic ambiguity, causing obvious fragmentation and “hollow effects” inside the tree crown, destroying the integrity of the tree crown entity.
In contrast, the improved model proposed in this paper performs better in both edge fineness and regional integrity, especially in the red circle area (as shown in Figure 14d). Thanks to the self-purification processing of SCCF, the gradient-induced center difference mechanism introduced in G-MTCAM, and the constraints of the boundary-enhanced loss function, the model can keenly capture high-frequency gradient information, thereby more accurately depicting the outer contour of the tree crown. Visualization results show that the model effectively suppresses boundary adhesion, achieving pixel-level fitting of fine branch and leaf edges, closer to the ground truth. Addressing texture differences within the tree crown, the semantic focusing mechanism of the SCCF module effectively suppresses background noise interference. The model reduces internal hollow phenomena, maintaining good spatial coherence in segmentation results.
In summary, qualitative analysis indicates that the proposed method not only effectively overcomes interference from uneven lighting and complex textures but also achieves an excellent balance between retaining tree crown geometric details and maintaining semantic integrity. This ability to restore tree crown morphology lays a reliable geometric foundation for subsequent high-precision canopy cover estimation.
3.5. Canopy Cover Estimation Based on Segmentation Results
To achieve automated quantitative estimation of forest canopy cover, this study utilizes the binary semantic segmentation mask generated by the deep learning model and employs the pixel ratio method to extract canopy coverage features. Since UAV orthophotos possess vertical projection characteristics, this study strictly defines this indicator as Forest Canopy Cover (CC), i.e., the ratio of the projected area of tree crowns within a specific spatial range to the total area.
Before calculation, to further improve estimation accuracy, morphological opening and closing operations are performed on the original segmentation results to remove tiny misclassified noise points and smooth boundaries, eliminating sawtooth effects at the junction of shadows and ground features. Subsequently, the calculation formula for forest Canopy Cover (CC) is defined as
where represents the total number of pixels predicted by the model as the tree crown/vegetation category (i.e., foreground pixels) within the region of interest; represents the total number of effective pixels within that region of interest.
Based on the geometric alignment strategy in Section 2.2.2, this CC value is directly comparable in a physical sense to the ground-measured Near-Zenith Canopy Hemispherical Percentage (), serving as an effective estimated value for forest canopy cover. This calculation framework is highly flexible. It can perform precise calculations for specific ROIs corresponding to ground plots for accuracy validation; it can also use multi-scale sliding window technology to scan the entire orthophoto to generate continuous canopy cover distribution maps, intuitively reflecting the heterogeneity of the forest stand spatial structure.
In summary, the pixel ratio method based on high-precision segmentation masks overcomes the shortcomings of low efficiency and strong subjectivity in traditional manual measurements, providing a simple, reproducible means of canopy cover quantification. This method can provide refined data support for the suitability assessment of some understory economic crops and has significant ecological application value.
3.6. Canopy Cover Estimation Accuracy Validation and Error Analysis
Based on the aforementioned high-precision tree crown semantic segmentation results, this study further quantitatively estimated plot canopy cover and validated the practical application value of the model in forest structural parameter extraction through comparative analysis with ground measurement data.
Representative plots (size ) within the experimental area were selected. Regression analysis was performed between the predicted canopy cover (, calculation method see Section 3.5) based on model segmentation results and the measured canopy cover () obtained via hemispherical photography, and the analysis results are shown in Table 4.
Table 4.
Analysis of Model-Inverted Canopy Cover and Field-Measured Canopy Cover in Representative Sample Areas.
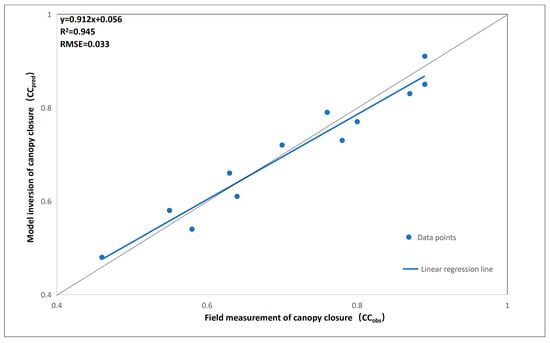
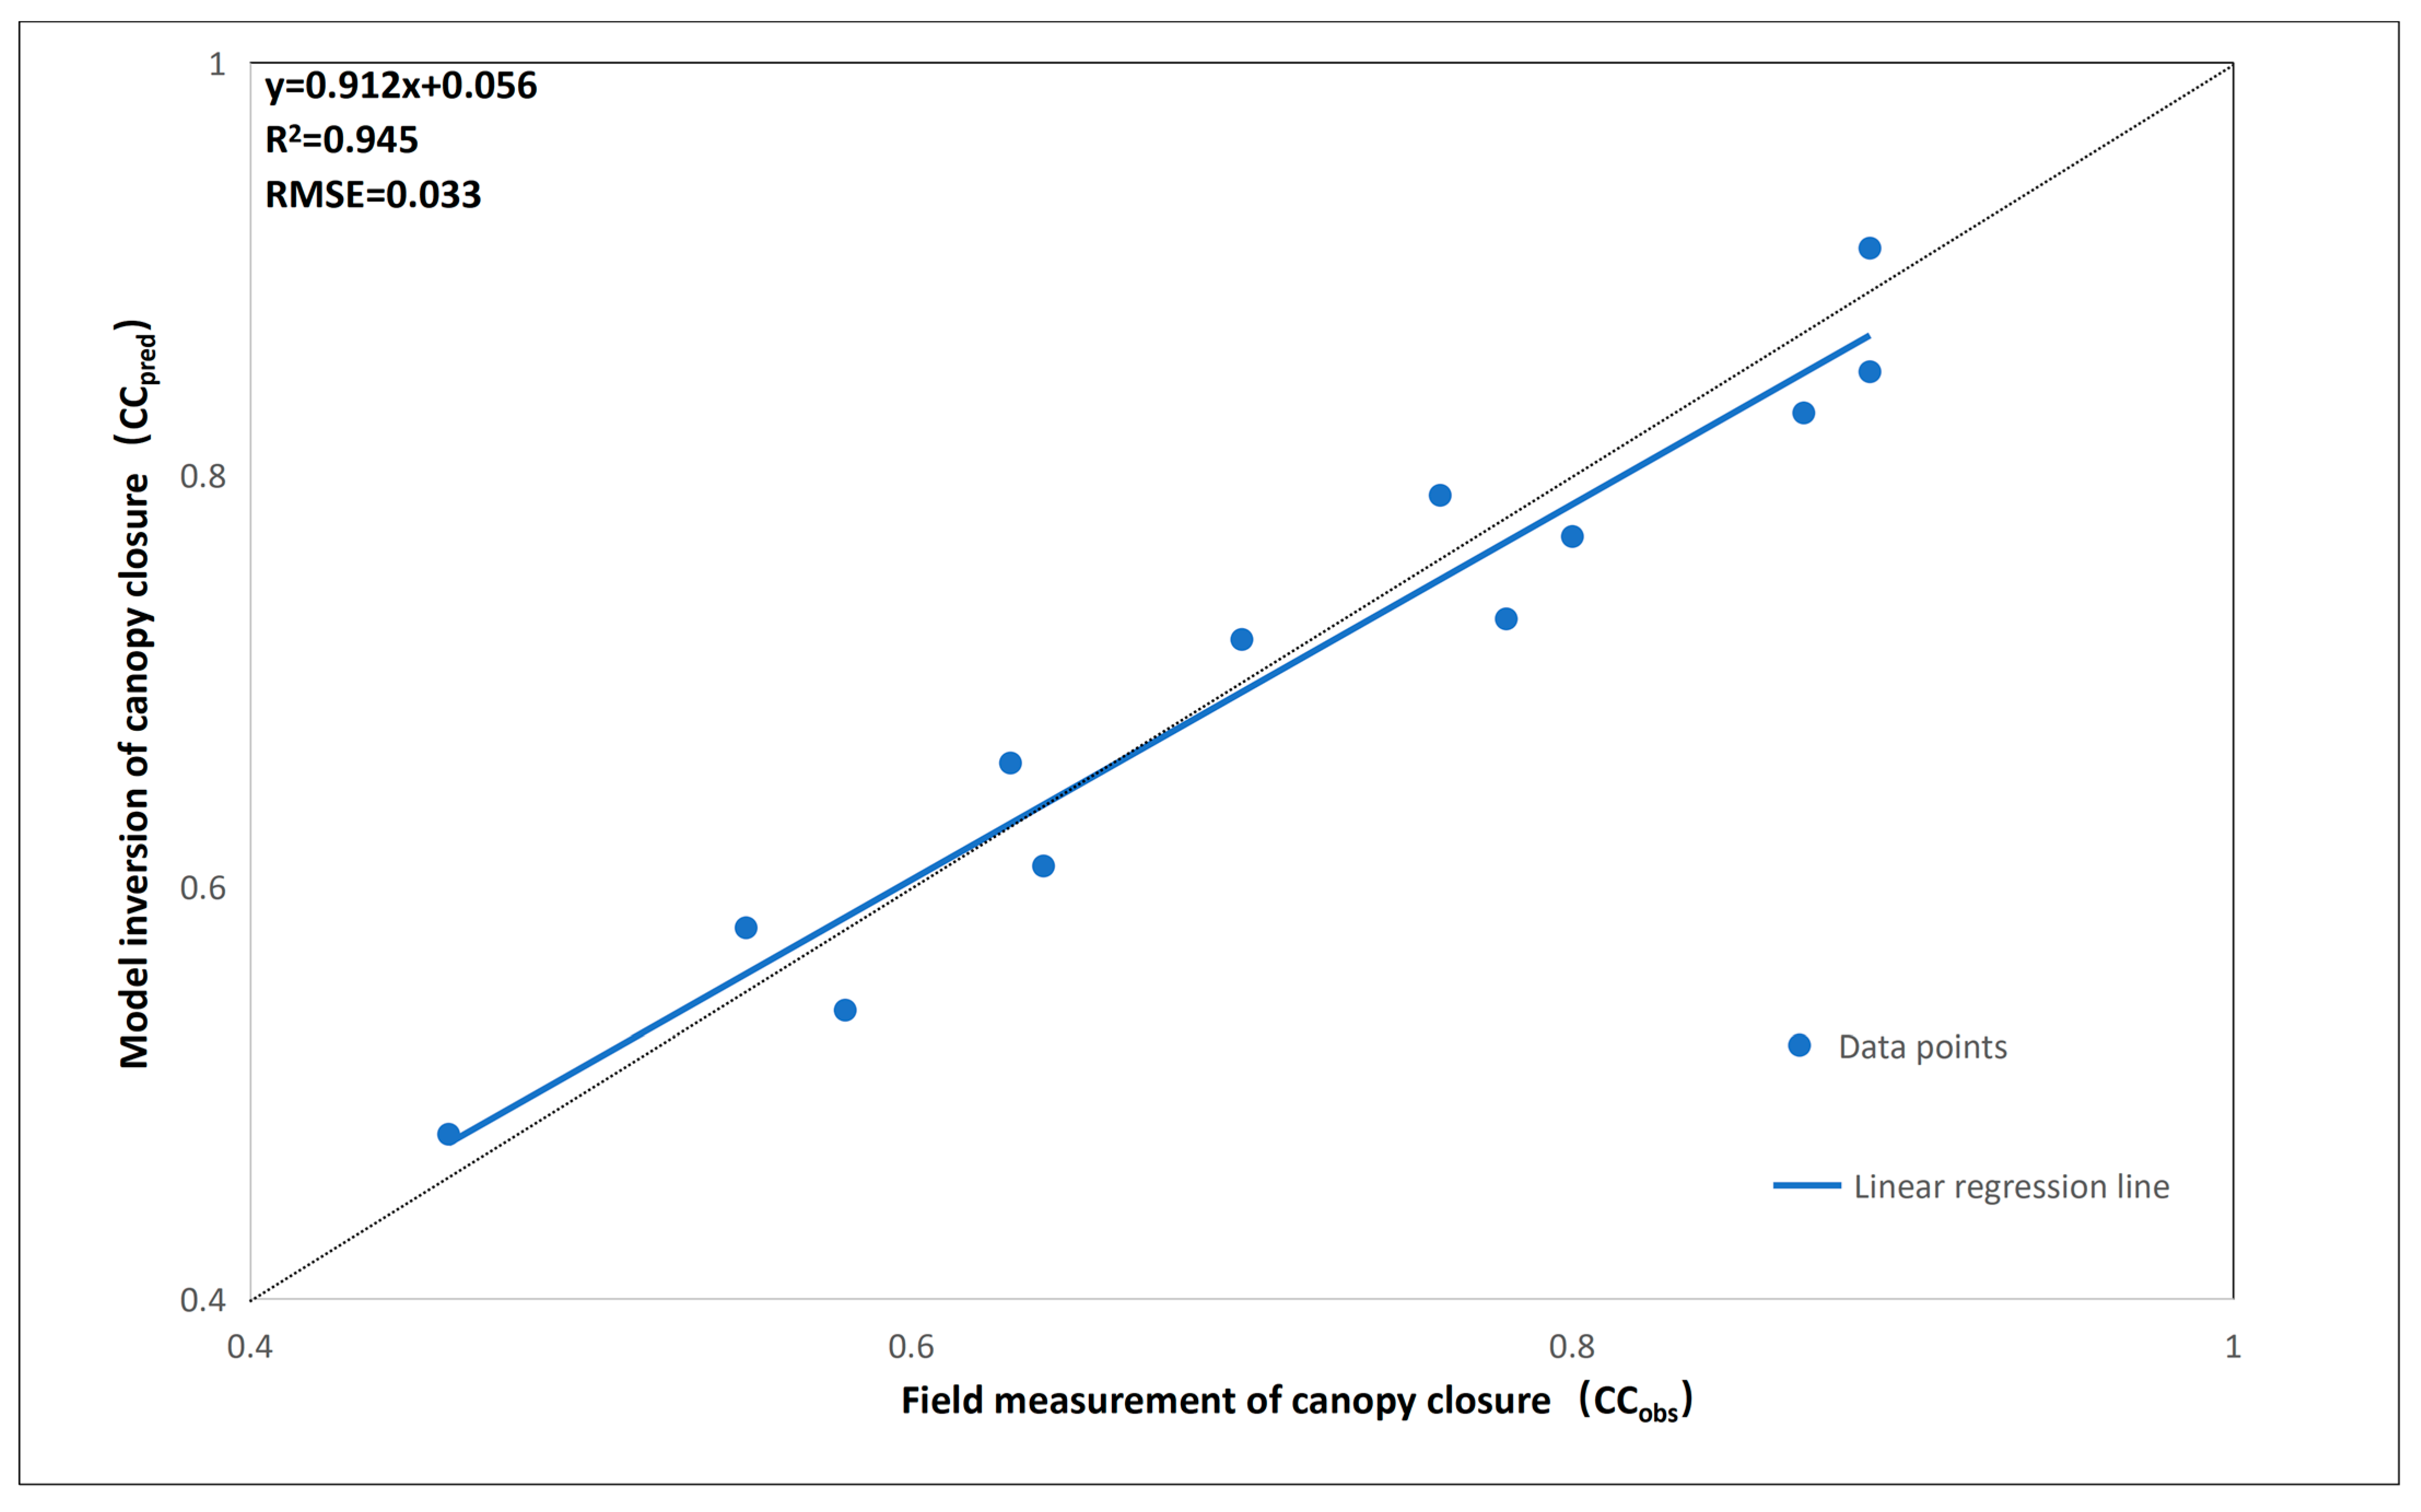
As shown in Figure 15, linear fitting results indicate a significant positive correlation between the two (). This high correlation confirms that by restricting the hemispherical photography field of view angle to , systematic errors caused by lateral branch occlusion in traditional ground measurements were effectively eliminated, achieving precise matching between ground truth and UAV vertical observation data in geometric space. The fitting equation is
Figure 15.
Linear regression fitting plot of canopy cover obtained from model inversion and canopy cover measured in the field. The dashed line is a reference line.
Table 4 presents the analysis of representative sample plots. To further evaluate the robustness of the model under different complex scenarios, Table 5 shows the stratification error statistics for 112 independent validation plots. The results indicate that the model’s estimation accuracy is closely related to the actual canopy density. In the low-density (40–60%) and medium-density (60–80%) regions, the model exhibits high stability, with the root mean square error (RMSE) controlled within 4.5% and a small bias error.
Table 5.
Stratified validation statistics for canopy cover estimation across different density levels.
Statistical analysis shows that the coefficient of determination exceeds 0.90, indicating that the model can explain the vast majority of canopy cover variations. In terms of error metrics, the Mean Absolute Error (MAE) is 0.032 (≈3.2 percentage points), and the Mean Relative Error (MRE) is only 4.53%. This confirms that the segmentation network proposed in this study can provide a high-fidelity geometric basis for canopy cover estimation.
Further analysis of performance across different canopy cover levels (Low: 0.4–0.6; Medium: 0.6–0.8; High: >0.8) reveals that the model exhibits extremely high stability in low and medium canopy cover regions. However, in high canopy cover regions (>0.8), the scatter plot shows a slight underestimation trend. This phenomenon is mainly attributed to the saturation effect in dense stands: due to severe canopy overlap and deep shadow occlusion, gradient features of some tree crown edges are weakened, making it difficult for the segmentation algorithm to fully resolve extremely fine canopy gaps. Nevertheless, overall quantitative consistency still meets the accuracy requirements of forestry surveys.
In summary, the canopy cover estimation results generated based on the improved network in this paper are highly consistent with measured data. This method not only validates its reliability in forest canopy structure monitoring but also provides strong technical support for the suitability screening and planting planning of understory economic crops.
4. Discussion
This study aims to address the trade-off between accuracy and efficiency faced by UAV imagery in forest canopy segmentation tasks. Experimental results show that the proposed improved model achieves an IoU accuracy of 88.59% while significantly reducing parameter count and computational complexity (FLOPs only 6.71 G). Compared to mainstream lightweight U-Nets and advanced architectures based on Transformers like SegFormer, this model performs better on this dataset. Although BiSeNetV2 is faster, it suffers severe losses in high-frequency edge details like tree crowns (low IoU). This study achieves accuracy close to heavy models within a computational range acceptable for edge devices.
This performance advantage validates our core hypothesis that targeted structural optimization can effectively compensate for the feature dilution caused by lightweight encoders. The performance gain is primarily attributed to the synergy between the SCCF module and G-MTCAM. During the decoding phase, the semantic focusing of SCCF utilizes semantic-guided channel compression to suppress non-target backgrounds while retaining key texture information. Furthermore, distinct from traditional approaches emphasizing pure multi-scale feature aggregation, the gradient decoupling mechanism in G-MTCAM introduces explicit gradient guidance. This explicit guidance proves crucial for effectively resolving boundary adhesion issues in complex forest scenes. G-MTCAM utilizes the GI-CDC operator to construct a morphology–texture dual-stream architecture, keenly capturing minute gradient changes in tree crown edges via center difference convolution and filtering noise through statistical gating. This mechanism allows the model to precisely cut adherent tree crowns in feature space, thereby achieving segmentation effects superior to traditional spatial attention mechanisms in dense stands.
Although this method excels in balancing real-time performance and accuracy, it still has certain limitations when dealing with multi-layered forest scenes with extremely heavy local shadows and complex vertical structures. Misclassification phenomena are mainly attributed to the inherent spectral information limitations and lack of depth information in RGB imagery. The study found that when facing severe canopy overlap projection, single-modal 2D imagery struggles to provide sufficient geometric cues to distinguish foreground tree crowns from deep shadow backgrounds. This finding is consistent with conclusions from several recent studies, namely that the lack of elevation information often leads to blurring of canopy boundaries and loss of 3D structural information, constituting a natural bottleneck for monocular vision tasks. Despite low FLOPs, processing high-resolution images on edge devices often causes memory-bound issues due to frequent memory access. Additionally, strict power and thermal constraints on drones can trigger thermal throttling, leading to unstable inference speeds. Finally, specific activation functions like h-swish may lack hardware acceleration on some edge chips, forcing a fallback to slower CPU execution.
Given this, the architecture proposed in this study, with its efficient inference capability, has significant practical value for deployment on resource-constrained UAV edge ends, providing a feasible technical path for real-time monitoring of forest resources. In light of the current limitations and analysis of the model’s generalization ability, future research should focus on improving the model’s global dependency modeling ability, multimodal perception ability, and extending it to multi-forest data for cross-regional validation. On one hand, introducing advanced architectures with long-range context perception capabilities, such as Vision Transformers or Mamba, could be explored to further improve understanding of large-scale textures and complex semantics. On the other hand, constructing multi-modal networks by fusing auxiliary data such as DSM, CHM, or LiDAR point clouds will be a key direction for solving canopy overlap and projection blurring problems, thereby further improving the model’s generalization robustness in multi-terrain and multi-seasonal cross-domain scenarios.
5. Conclusions
Addressing the challenges of blurred tree crown edges, strong shadow interference, and severe texture confusion in RGB imagery acquired by consumer-grade UAVs (DJI Mini 4 Pro), this paper proposes a forest canopy cover estimation method based on an improved U-Net. By introducing the MobileNetV3 lightweight encoder and proposing the SCCF semantic compression and focus module, the G-MTCAM module, and a boundary-enhanced composite loss, a tree crown segmentation network combining computational efficiency and fine-grained expression capability was constructed.
Experimental results indicate that the proposed model achieved the best performance on key metrics such as IoU, Acc, and F1 on this dataset and under these experimental settings (IoU 88.59%, F1 93.77%). Compared to the classic U-Net, the proposed method achieved a significant 2.77% improvement in IoU, with FLOPs of only 6.71 G, making it more suitable for lightweight deployment and rapid field inference on UAV embedded devices. The tree crown segmentation results obtained based on this model were further used for canopy cover estimation, achieving a correlation coefficient () exceeding 0.90 with field measurement data, demonstrating extremely high area consistency and structural reliability.
In summary, the improved method proposed in this paper successfully breaks the opposition between lightweight design and high precision, proving the effectiveness of gradient-guided mechanisms in complex forestry scenarios. This research not only provides a precise quantitative basis for the suitability assessment of some understory economic crops but also offers a new technical paradigm for the widespread application of UAV imagery in forest ecological monitoring, resource assessment, and management. Future research will further expand to multi-modal data fusion to meet the needs of more complex 3D forest stand structure analysis.
Author Contributions
Conceptualization, H.C. and Z.L.; methodology, Z.L.; validation, M.L. and Y.S.; formal analysis, H.Z.; investigation, J.L. and H.W.; resources, M.L.; data curation, Y.Z.; writing—original draft preparation, Z.L.; writing—review and editing, H.C.; supervision, C.W.; project administration, Y.Z.; funding acquisition, H.C. All authors have read and agreed to the published version of the manuscript.
Funding
This research was funded by the Science and Technology Basic Resources Investigation Program of China (2022FY101901-2) and the Industrial Technology and Development Project of the Development and Reform Commission of Jilin Province (2023C030-3).
Data Availability Statement
The original contributions presented in this study are included in the article. Further inquiries can be directed to the corresponding author.
Acknowledgments
The author thanks the relevant forestry departments for providing the data.
Conflicts of Interest
The authors declare no conflicts of interest.
References
- Wang, Q.; Bi, W.; Xu, W.; Huang, W.; Yin, X. A voxel-based canopy closure estimation method considering LiDAR scanning density. Eng. Res. Express 2025, 7, 025275. [Google Scholar] [CrossRef] [Scilit]
- Luo, H.; Ou, G.; Yue, C.; Zhu, B.; Wu, Y.; Zhang, X.; Lu, C.; Tang, J. A framework for montane forest canopy height estimation via integrating deep learning and multi-source remote sensing data. Int. J. Appl. Earth Obs. Geoinf. 2025, 138, 104474. [Google Scholar] [CrossRef] [Scilit]
- Xiao, Y.; Wang, Q.; Xi, H.; Tong, X. A 30 m canopy height map in China created by fusion of multiple relative height metrics. IEEE Trans. Geosci. Remote Sens. 2025, 63, 4411116. [Google Scholar] [CrossRef] [Scilit]
- Abolt, C.J.; Santos, J.E.; Atchley, A.L.; Wells, L.; Martin, D.; Parsons, R.A.; Linn, R.R. Deep-learning-based canopy height model generation from sub-meter resolution panchromatic satellite imagery. Mach. Learn. Sci. Technol. 2025, 6, 015013. [Google Scholar] [CrossRef] [Scilit]
- Zhang, B.; Wang, Z.; Ma, T.; Wang, Z.; Li, H.; Ji, W.; He, M.; Jiao, A.; Feng, Z. Correcting forest aboveground biomass biases by incorporating independent canopy height retrieval with conventional machine learning models using GEDI and ICESat-2 data. Ecol. Inform. 2025, 86, 103045. [Google Scholar] [CrossRef] [Scilit]
- Beloiu, M.; Heinzmann, L.; Rehush, N.; Gessler, A.; Griess, V.C. Individual tree-crown detection and species identification in heterogeneous forests using aerial RGB imagery and deep learning. Remote Sens. 2023, 15, 1463. [Google Scholar] [CrossRef] [Scilit]
- Asadpour, V.; Xie, F. Artificial intelligence for medical imaging: A review of U-Net technology for anatomical feature analysis. Intell. Med. 2025, 6, 24–39. [Google Scholar] [CrossRef] [Scilit]
- Ronneberger, O.; Fischer, P.; Brox, T. U-net: Convolutional networks for biomedical image segmentation. In Proceedings of the International Conference on Medical Image Computing and Computer-Assisted Intervention; Springer: Berlin/Heidelberg, Germany, 2015; pp. 234–241. [Google Scholar]
- Yao, Z.; Chai, G.; Lei, L.; Jia, X.; Zhang, X. Individual tree species identification and crown parameters extraction based on mask R-CNN: Assessing the applicability of unmanned aerial vehicle optical images. Remote Sens. 2023, 15, 5164. [Google Scholar] [CrossRef] [Scilit]
- Syazwani, R.W.N.; Asraf, H.M.; Amin, M.M.S.; Dalila, K.N. Automated image identification, detection and fruit counting of top-view pineapple crown using machine learning. Alex. Eng. J. 2022, 61, 1265–1276. [Google Scholar] [CrossRef] [Scilit]
- Santini, F.; Kefauver, S.C.; Araus, J.L.; Resco de Dios, V.; Martin Garcia, S.; Grivet, D.; Voltas, J. Bridging the genotype—phenotype gap for a Mediterranean pine by semi-automatic crown identification and multispectral imagery. New Phytol. 2021, 229, 245–258. [Google Scholar] [CrossRef] [Scilit]
- Ecke, S.; Stehr, F.; Frey, J.; Tiede, D.; Dempewolf, J.; Klemmt, H.J.; Endres, E.; Seifert, T. Towards operational UAV-based forest health monitoring: Species identification and crown condition assessment by means of deep learning. Comput. Electron. Agric. 2024, 219, 108785. [Google Scholar] [CrossRef] [Scilit]
- Ball, J.G.; Hickman, S.H.; Jackson, T.D.; Koay, X.J.; Hirst, J.; Jay, W.; Archer, M.; Aubry-Kientz, M.; Vincent, G.; Coomes, D.A. Accurate delineation of individual tree crowns in tropical forests from aerial RGB imagery using Mask R-CNN. Remote Sens. Ecol. Conserv. 2023, 9, 641–655. [Google Scholar] [CrossRef] [Scilit]
- Huo, L.; Lindberg, E.; Holmgren, J. Towards low vegetation identification: A new method for tree crown segmentation from LiDAR data based on a symmetrical structure detection algorithm (SSD). Remote Sens. Environ. 2022, 270, 112857. [Google Scholar] [CrossRef] [Scilit]
- Hao, Z.; Lin, L.; Post, C.J.; Mikhailova, E.A.; Li, M.; Chen, Y.; Yu, K.; Liu, J. Automated tree-crown and height detection in a young forest plantation using mask region-based convolutional neural network (Mask R-CNN). ISPRS J. Photogramm. Remote Sens. 2021, 178, 112–123. [Google Scholar] [CrossRef] [Scilit]
- Bahadir, M.; Karsli, F.; Yildirim, F.S.; Misir, M. Tree crown segmentation and estimation of metrics from point clouds with improved local maximum method. Photogramm. Rec. 2025, 40, e70015. [Google Scholar] [CrossRef] [Scilit]
- Howard, A.; Sandler, M.; Chu, G.; Chen, L.C.; Chen, B.; Tan, M.; Wang, W.; Zhu, Y.; Pang, R.; Vasudevan, V.; et al. Searching for mobilenetv3. In Proceedings of the IEEE/CVF International Conference on Computer Vision, Seoul, Republic of Korea, 27 October–2 November 2019; pp. 1314–1324. [Google Scholar]
- Hosingholizade, A.; Erfanifard, Y.; Alavipanah, S.K.; Millan, V.E.G.; Mielcarek, M.; Pirasteh, S.; Stereńczak, K. Assessment of Pine Tree Crown Delineation Algorithms on UAV Data: From K-Means Clustering to CNN Segmentation. Forests 2025, 16, 228. [Google Scholar] [CrossRef] [Scilit]
- Lei, L.; Chai, G.; Yao, Z.; Li, Y.; Jia, X.; Zhang, X. A novel self-similarity cluster grouping approach for individual tree crown segmentation using multi-features from UAV-based LiDAR and multi-angle photogrammetry data. Remote Sens. Environ. 2025, 318, 114588. [Google Scholar] [CrossRef] [Scilit]
- Ma, G.; Yang, G.; Lu, H.; Zhang, X. Forest Three-Dimensional Reconstruction Method Based on High-Resolution Remote Sensing Image Using Tree Crown Segmentation and Individual Tree Parameter Extraction Model. Remote Sens. 2025, 17, 2179. [Google Scholar] [CrossRef] [Scilit]
- Tong, F.; Zhang, Y. Individual tree crown delineation in high resolution aerial RGB imagery using StarDist-based model. Remote Sens. Environ. 2025, 319, 114618. [Google Scholar] [CrossRef] [Scilit]
- Lungo Vaschetti, J.; Arnaudo, E.; Rossi, C. TreePseCo: Scaling Individual Tree Crown Segmentation using Large Vision Models. Int. Arch. Photogramm. Remote Sens. Spat. Inf. Sci. 2025, 48, 275–282. [Google Scholar] [CrossRef] [Scilit]
- Ma, J.; Yan, L.; Chen, B.; Zhang, L. A Tree Crown Segmentation Approach for Unmanned Aerial Vehicle Remote Sensing Images on Field Programmable Gate Array (FPGA) Neural Network Accelerator. Sensors 2025, 25, 2729. [Google Scholar] [CrossRef] [Scilit] [PubMed]
- Ding, J.; You, L.; Liang, Y.; Huang, J.; Wu, Z.; Huang, R.; Chen, J.; You, H. Research on eucalyptus individual tree segmentation and age estimation utilizing improved Mask R-CNN algorithm based on UAV stereo images. Ind. Crops Prod. 2025, 230, 121073. [Google Scholar] [CrossRef] [Scilit]
- Sun, Z.; Xue, B.; Zhang, M.; Schindler, J. Feature Fusion to Improve YOLOv8 for Segmenting and Classifying Aerial Images of Tree Crowns. IEEE J. Sel. Top. Appl. Earth Obs. Remote Sens. 2025, 18, 14752–14765. [Google Scholar] [CrossRef] [Scilit]
- Park, G.; Song, B.; Park, K. Mapping individual tree crowns to extract morphological attributes in urban areas using unmanned aerial vehicle-based LiDAR and RGB data. Ecol. Inform. 2025, 88, 103165. [Google Scholar] [CrossRef] [Scilit]
- Rodrıguez-Malpica, A.E.L.; Zouaghi, H.; Moshkenani, M.M.; Peng, W. Tree crown prediction of spruce tree using a machine- learning-based hybrid image processing method. Urban For. Urban Green. 2025, 107, 128815. [Google Scholar] [CrossRef] [Scilit]
- Wang, R.; Hu, C.; Han, J.; Hu, X.; Zhao, Y.; Wang, Q.; Sun, H.; Xie, Y. A hierarchic method of individual tree canopy segmentation combing UAV image and LiDAR. Arab. J. Sci. Eng. 2025, 50, 7567–7585. [Google Scholar] [CrossRef] [Scilit]
- Zhou, Y.; Wang, J.; Song, Z.; Zhou, M.; Lv, M.; Han, X. Estimation of Tree Canopy Closure Based on U-Net Image Segmentation and Machine Learning Algorithms. Remote Sens. 2025, 17, 1828. [Google Scholar] [CrossRef] [Scilit]
- Liu, Y.; Chen, D.; Na, J.; Peethambaran, J.; Pfeifer, N.; Zhang, L. Segmentation of Individual Trees in TLS Point Clouds via Graph Optimization. IEEE Trans. Geosci. Remote Sens. 2025, 63, 5702821. [Google Scholar] [CrossRef] [Scilit]
- Ning, X.; Ma, Y.; Jin, H.; Wu, Z.; Zhou, W.; Zhang, X.; Guo, J. Tree and shrub instance segmentation by boundary-aware ecological structural probability analysis. Urban For. Urban Green. 2025, 114, 129123. [Google Scholar] [CrossRef] [Scilit]
- Liu, X.; Li, F.; Hao, Y.; Zou, X.; Cheng, S.; Dong, L. Modeling tree radial growth with competition and crown characteristics from an aerial perspective. For. Ecol. Manag. 2025, 576, 122387. [Google Scholar] [CrossRef] [Scilit]
- Xiu, T.; Qi, H.; Xu, J.; Liang, X. Individual tree extraction through 3D promptable segmentation networks. Methods Ecol. Evol. 2025, 16, 1749–1762. [Google Scholar] [CrossRef] [Scilit]
- Li, L.; Fu, W.; Zhang, B.; Yang, Y.; Ge, Y.; Shen, C. Branch segmentation and phenotype extraction of apple trees based on improved Laplace algorithm. Comput. Electron. Agric. 2025, 232, 109998. [Google Scholar] [CrossRef] [Scilit]
- Bakas, K.; Saddik, A.; Dliou, A.; Hssaisoune, M.; El Hachemy, S.; Ait-Ichou, H.; El Hafyani, M.; Labbaci, A.; Bouchaou, L. UAV-Based Citrus Tree Segmentation, Counting and Yield Estimation Using Lightweight Deep Learning Approaches. Smart Agric. Technol. 2025, 232, 101618. [Google Scholar] [CrossRef] [Scilit]
- Li, J.; Zhang, H.; Barnard, D. Transfer Learning-Based Accurate Detection of Shrub Crown Boundaries Using UAS Imagery. Remote Sens. 2025, 17, 2275. [Google Scholar] [CrossRef] [Scilit]
- Li, N.; Jiang, S.; Zhou, Y.; He, W.; Jia, S. Fuzzy Boundary-Aware Network for Hyperspectral Individual Tree Fine Recognition. IEEE Trans. Geosci. Remote Sens. 2025, 63, 5541016. [Google Scholar] [CrossRef] [Scilit]
- Shaheen, L.; Rasheed, B.; Mazzara, M. Self-Supervised Learning for Precise Individual Tree Segmentation in Airborne LiDAR Point Clouds. IEEE Access 2025, 13, 70895–70908. [Google Scholar] [CrossRef] [Scilit]
- Ma, H.; Zhang, F.; Chen, S.; Yu, J. Individual Tree Segmentation Using Deep Learning and Climbing Algorithm: A Method for Achieving High-precision Single-tree Segmentation in High-density Forests under Complex Environments. Photogramm. Eng. Remote Sens. 2025, 91, 101–110. [Google Scholar] [CrossRef] [Scilit]
- Barber, C.; Cruz, J.; Graves, S.J.; Bohlman, S.A.; Zuidema, P.A.; Asner, G.P.; Carignan, A.; Vasquez, V.; Brandt, J.; Caughlin, T.T. Large, isolated trees have higher mortality than smaller trees in forest fragments across a tropical pastoral landscape. Ecol. Appl. 2025, 35, e70046. [Google Scholar] [CrossRef] [Scilit] [PubMed]
- Kefalas, A.; Kalampokas, T.; Vrochidou, E.; Papakostas, G.A. A vision-based pruning algorithm for cherry tree structure elements segmentation and exact pruning points determination. Comput. Electron. Agric. 2025, 237, 110735. [Google Scholar] [CrossRef] [Scilit]
- Wołk, K.; Niklewski, J.; Kopczyński, M.; Tatara, M.S.; Zero, O. Enhancing semantic forestry segmentation through advanced preprocessing with ML models. IEEE Access 2025, 13, 98602–98621. [Google Scholar] [CrossRef] [Scilit]
- Zhong, Y.; Qin, J.; Liu, S.; Ma, Z.; Liu, E.; Fan, H. An unsupervised semantic segmentation network for wood-leaf separation from 3D point clouds. Plant Phenomics 2025, 7, 100064. [Google Scholar] [CrossRef] [Scilit] [PubMed]



Disclaimer/Publisher’s Note: The statements, opinions and data contained in all publications are solely those of the individual author(s) and contributor(s) and not of MDPI and/or the editor(s). MDPI and/or the editor(s) disclaim responsibility for any injury to people or property resulting from any ideas, methods, instructions or products referred to in the content. |
© 2026 by the authors. Licensee MDPI, Basel, Switzerland. This article is an open access article distributed under the terms and conditions of the Creative Commons Attribution (CC BY) license.