


Highlights
What are the main findings?
- This study develops a novel two-stage adaptive indicator reduction model that integrates TOPSIS and objective optimization theory, enabling automatic, objective selection of key ecological health indicators tailored to 11 distinct ecoregions across China, significantly reducing subjectivity and redundancy in index construction.
- National ecological health from 2001 to 2021 exhibits strong spatial heterogeneity, following a “higher in the southeast, lower in the northwest” pattern, with overall stability (93.53% unchanged), improvement in areas (~4.21%), and a doubling of degradation zones, largely due to effective implementation of national ecological restoration projects.
What are the implications of the main findings?
- The proposed framework provides a scalable, objective methodology for large-scale ecological health assessments, offering a unified yet adaptable index system that can support national ecological monitoring, zoning, and policy evaluation across diverse regions.
- The identification of the primary obstacle factors (e.g., organization, vigor, and resilience) and their spatial–temporal dynamics offers actionable insights for targeted ecosystem management and policy adjustment, aiding in the enhancement of regional ecological functions and sustainable development.
Abstract
Assessing terrestrial ecosystem health in China is crucial for guiding national economic strategies and ecological conservation. To address the lack of a unified national evaluation system, this study integrates the Pressure–State–Response (PSR) and Ecological Hierarchy frameworks to construct a five-layer network index system. A novel two-stage adaptive indicator reduction model is proposed, one which combines the TOPSIS method with an objective optimization model to select key indicators tailored to different ecoregions. Using this model, we evaluated the spatiotemporal dynamics of ecosystem health across China from 2001 to 2021. The results demonstrate the following: (1) The selected indicators effectively reflect regional ecological characteristics, with higher-weighted indicators aligning widely with the existing literature, demonstrating the system’s scientific validity and rationality. (2) Ecosystem health exhibits significant spatial variability, generally higher in the southeast and lower in the northwest. Over 21 years, health status remained relatively stable, with the improved areas (4.21%) primarily being located west of the Heihe–Tengchong line and north of the Qinling–Huaihe line, and exceeding the degraded areas.
1. Introduction
The ecological environment is the foundation for the existence and development of human civilization and is a crucial guarantee for human survival and development. However, with the rapid development of human society, the interrelated problems and challenges of the ecological environment have become increasingly severe, resulting in significant damage to the health of the ecological environment [1]. This situation impacts human development and becomes an issue for the survival of humanity [2], making it urgent to address the health of the ecological environment. As a developing country with rapid economic growth, China also faces a series of serious ecological health issues; integrated multi-source remote sensing approaches have been extensively employed to reveal the coupling mechanisms operating between urbanization and ecological quality across China [3,4]. Furthermore, regional assessments, particularly in critical basins like the Middle Yellow River, have identified diverse environmental and anthropogenic factors that significantly influence ecosystem health [5]. In response to the increasing attention on ecological problems, China has vigorously promoted and implemented a series of policies related to ecological protection and development in recent years, leading to significant improvements in ecological issues [6]. Ecological health research may help policymakers understand and identify the current status, changes, and persistent ecological problems nationwide [7,8], which is crucial for promoting high-quality development and building a modern society where humans and nature coexist harmoniously.
Scholars and experts have conducted ecological health assessment studies on different types of ecosystems and at various regional scales; the current research has expanded from urban-scale health assessments using comprehensive evaluation models [9] to high-resolution pixel-scale simulations that capture the intricate impacts of climate change and human activities [10,11]. These methodological advancements facilitate a deeper understanding of ecological carrying capacity and its driving factors, elements which are essential for regional high-quality development [12]. A comprehensive indicator model can select appropriate indicators from multiple perspectives based on research needs to construct an indicator system for evaluating ecological health over long time series and large areas [9]. Among these, the Pressure–State–Response (PSR) model and its extended and modified versions are the most commonly used indicator systems [13]. The convenient acquisition of geospatial big data facilitates the construction of indicator systems and ecological assessment research. However, developing a universal evaluation indicator system and adaptively selecting key indicators that reflect regional characteristics remain significant challenges for current ecological health assessments.
In terms of constructing indicator systems, numerous domestic and international scholars have developed various evaluation indicator systems based on diverse frameworks from their own research perspectives. To ensure the scientific rigor of indicator selection, standardized criteria—such as the eight essential principles proposed in the literature [14]—have been widely adopted. Recent frameworks have evolved from traditional Pressure–State–Response (PSR) models incorporating multi-dimensional socioeconomic indicators [13] to more holistic Vigor–Organization–Resilience–Services (VORS) models, which better integrate ecosystem service functions into health assessments [15]. However, due to China’s vast territory, complex and diverse topography and land cover types, and climate spanning multiple temperature zones with significant north–south differences and uneven seasonal distribution, the background ecological environment and human activities vary greatly across different regions. Consequently, the internal and external factors influencing regional ecological environments are not identical, leading to varied ecological evaluation standards. When conducting ecological health assessments in different regions, scholars generally cannot directly apply pre-constructed indicator system models, and often need to develop new indicator models [16], a process which is highly subjective and results in poor horizontal comparability of evaluation results. Additionally, constrained by complex natural ecological characteristics and the large national scale, the current ecological environment-related research in China primarily focuses on specific provinces or local areas, with relatively few studies conducted at the national scale. There is also a lack of pixel-level ecological health assessment and diagnosis that considers multiple aspects of the ecosystem. Therefore, to achieve a nationwide assessment, constructing a universally applicable indicator system suitable for the entire country is crucial.
Common indicator selection methods include Analytic Hierarchy Process (AHP) [13], correlation analysis [17], Principal Component Analysis (PCA) [18], and a combination of multiple methods for indicator selection. Although these methods use the relationships between indicators as the basis for selection, they lack consideration of the hierarchical and relational characteristics of ecosystems. In recent years, quantitative indicator selection models have emerged. Lin et al. [19] proposed an indicator selection method using the EHN framework, combining network analysis with the quantitative indicator selection process to establish a quantitative selection model, providing a new approach for indicator selection. However, these studies assign equal weights to indicators, which affects the objectivity of the results to some extent. Wang et al. [20] and Chen et al. [21] developed a more comprehensive indicator system network by utilizing the PSR and EHN models and incorporating objective weight calculation methods. This approach enhances the scientific and objective nature of the selection process while ensuring the completeness and simplicity of the evaluation indicator system, providing a new direction for indicator selection research. However, the effectiveness of this approach in the complex scenarios across the country remains to be further examined.
Given the current issues involving the difficulty of reusing comprehensive indicator models, the lack of consideration for multiple aspects of ecosystems, and the lack of objective and reasonable criteria for indicator selection, it is necessary to conduct research on ecological health assessment methods that are universally applicable to large regions. Utilizing big geodata, this paper aims to construct a highly universal ecological health evaluation index system and an objective, effective automatic indicator selection model to conduct national ecological health evaluations and related diagnostic studies. This effort will support the establishment of an efficient national ecological zoning control system by 2035, and it will provide strong scientific and data support for formulating ecological policies and assessing the effectiveness of existing policies.
2. Materials and Methods
2.1. Study Area and Ecoregions
Located in the southeast of Eurasia, China is the third-largest country in the world in terms of land area. It covers a wide range of latitudes, from 4°15′N to 53°31′N and 73°34′E to 135°5′E. With high terrain in the west and low-lying lands in the east, China presents three distinct terraces from west to east (Figure 1). The changes in terraces have created China’s rich and diverse types of terrain and landforms, among which mountains, plateaus, and hills account for approximately 67% of the land area, while basins and plains account for about 33%. Furthermore, most of the mountain ranges extend in the east–west and northeast–southwest directions. In terms of climate, China mainly exhibits strong zonality, significant north–south differences, apparent vertical changes, uneven seasonal distribution, large inter-annual variations, and simultaneous rainy and hot seasons. Due to its unique and complex topography and climate characteristics, China has acquired various ecological land cover types, including forests, shrubs, grasslands, wetlands, deserts, farmlands, and cities. In recent decades, extreme climate change and increasingly frequent human activities have seriously affected China’s ecological environment, resulting in ecological issues such as soil erosion, desertification, rocky desertification, and degradation of forests and grasslands [1]. In order to deal with the degradation of ecosystems, since 2000, China has implemented nine major ecological engineering projects involving 31 provinces nationwide, including autonomous regions and municipalities directly under the central government, with a total coverage area of approximately 924.8 × 10⁴ [22]. Meanwhile, China has adopted measures such as regional ecological compensation and transfer payments in key ecological function areas to restore and improve regional ecological services such as water source conservation, soil and water conservation, windbreak and sand fixation, and biodiversity maintenance [23]. Since that time, China’s ecological environment has undergone a transition from severe degradation to gradual recovery.
Figure 1.
Terrain and ecoregions of China (ecoregions were adjusted according to the “China Ecological Zoning Scheme for Maintaining County Boundary Integrity” [24]). HB includes Beijing, Tianjin, Hebei, Henan, and Shandong; DB includes Liaoning, Jilin, Heilongjiang, and the vast majority of the Hulunbeir Grassland in the northeast of Inner Mongolia Autonomous Region and the Inner Mongolia section of the Greater Khingan Mountains; NM represents most of Inner Mongolia, excluding the areas occupied by DB; HT includes Shanxi, Shaanxi, and Ningxia; CJ includes Jiangsu, Shanghai, Zhejiang, Anhui, and Hubei; XJ represents the entire Xinjiang Uygur Autonomous Region; QG includes Gansu and Qinghai; CY includes Sichuan and Chongqing; YG includes Yunnan and Guizhou; HN includes Fujian, Taiwan, Jiangxi, Hunan, Guangxi, Macau, Hong Kong, Guangdong, and Hainan; and XZ refers to the whole Xizang Autonomous Region.
Due to China’s vast territory, rich topography and climate types, and diverse ecosystem types, the natural ecological conditions of regions far apart differ significantly, and thus the indicators they focus on also vary. It is necessary to implement ecological zoning in China to obtain ecological zones with small intra-zone differences and large inter-zone differences, using ecological zoning as the scale for index selection and subsequent analysis of ecological health results.
The evolution, organizational structure, functions, and services provided by regional ecosystems are highly complex and influenced by multiple factors. In the current research on ecological zoning in China, the mainstream method is to select the dominant factors based on the purpose of the ecological zoning [25]. Among the current investigations, Xie et al. [24] proposed 11 ecoregions and 63 ecodistricts for China in a plan that preserves the integrity of county borders, considering factors such as ecosystem type, temperature, precipitation, vegetation, and topography as the dominant factors for ecological zoning. Many of the index data used for ecological zoning are the same as those in the current ecological health evaluation index, indicating that the indicators considered for ecological zoning are relatively comprehensive and consistent with the ecological health evaluation index system constructed in this paper. Based on the 11 ecoregions identified by Xie et al. [24], and in order to better coordinate the use of relevant ecological and environmental data with human activities and socio-economic data based on administrative regions in subsequent calculations and analyses, the 11 ecoregions were adjusted to preserve the integrity of provincial borders as much as possible (Figure 1).
2.2. Datasets
This study considers the entire terrestrial ecosystem of China as its research domain. To construct a universally applicable network-based index system for ecological health assessment, extensive multi-source indicator data representing diverse ecosystem attributes across the country are required. Geodata are used as the primary data sources, including remote sensing data, meteorological data, land cover data, population spatial distribution data, DEM data, soil texture data, and administrative boundary data. To unify the resolution, all raster data are resampled to 500 m × 500 m.
2.2.1. Remote Sensing Data and Products
The remote sensing data were derived primarily from MODIS products, including MOD11A2, MOD13Q1, MOD15A2H, etc. The Google Earth Engine (GEE) platform was employed for data preprocessing, including index computation, projection transformation, resampling, magnitude conversion, and Savitzky–Golay filtering.
The land cover data utilized a 30 m resolution remote sensing product developed by the research team of Huang Xin and Li Jiayi at the School of Remote Sensing and Information Engineering, Wuhan University [26]. This dataset provides annual land cover classification across China for the period 2001–2021, encompassing nine distinct land cover types: cropland, shrubland, forest, grassland, water, ice/snow, bare land, impervious surface, and wetland. Batch calculations of relevant landscape ecological indices are calculated with a 500 m pixel size using set formulas (Table A1 in Appendix A).
2.2.2. Meteorological Data
The meteorological data include meteorological station data and the China Meteorological Background Dataset. Meteorological station data were obtained from the National Oceanic and Atmospheric Administration (NOAA) [27]. We conducted statistical analysis on the annual meteorological data using NOAA’s daily meteorological dataset. Subsequently, surface-fitting interpolation of the meteorological data was performed using the professional software Anusplin v4.36 to derive annual parameters including mean temperature, mean minimum temperature, percentage of precipitation anomaly, wind speed, etc. The China Meteorological Background Dataset [28] includes parameters such as accumulated temperature ≥ 0 °C (AT0), accumulated temperature ≥ 10 °C (AT10), humidity index (HI), and aridity (Ar).
2.2.3. Other Data
DEM data uses the ASTGTM2 global digital elevation data with a spatial resolution of 30 m provided by the United States Geological Survey website [29] to calculate topographic indicators such as surface relief, slope, and topographic position (TP). Soil texture and population density data are obtained from the Resource and Environment Data Cloud Platform of the Chinese Academy of Sciences (http://www.resdc.cn).
2.3. Methods
The construction of an adaptive indicator reduction model for ecological health assessment involves the establishment of a structured index system and a two-stage adaptive reduction framework.
2.3.1. Index System Construction
Ecosystem health, as an integrated system property, is governed by a complex interplay of intrinsic and extrinsic factors. These influencing factors, encapsulating both the inherent attributes of the ecosystem and anthropogenic stresses, form the basis for ecological health assessments. However, the substantial heterogeneity in ecological backgrounds and anthropogenic activities across regions results in distinct regional ecological characteristics. Consequently, regional ecological health is shaped by both internal and external drivers, yet their relative significance shifts in response to the specific ecosystems present within a given area. To ensure the evaluation index system is applicable to ecological health assessments across diverse national landscapes, this study integrates the Pressure–State–Response (PSR) model and the Ecological Health Network (EHN) model to establish the overarching framework of the index system. Capitalizing on the PSR model’s strength in comprehensively accounting for the causal relationships within and between the ecosystem and human socio-economic activities, ecological and environmental health factors are encapsulated through the three core constructs of pressure, state, and response. The EHN model enhances this alignment through two key features: (1) its representation of ecosystem hierarchies, which organizes components into tiered functional levels; and (2) its mapping of multi-correspondence relationships between indicators, revealing their dynamic interdependencies. These structural clarifications enable systematic theme categorization and precise scope definition for ecosystem analysis. This refinement facilitates a more objective, comprehensive, and representative selection of subsequent sub-indicators, ensuring that the constructed system reflects the holistic network structure of the ecosystem while encompassing the objectives of diverse ecosystems. Given that current research, when selecting similar indicators, either retains all indicators or subjectively selects some to include in the indicator system, leading to overlapping indicator information, which may seriously affect the objectivity of the establishment of the indicator system and the evaluation results, we propose an innovation. Building upon the conventional four-tiered index system, an additional layer dedicated to similar indicators is introduced, thereby creating a five-level network index system framework: Target Layer–Criterion Layer–Element Layer–Indicator Layer–Similar Indicator Layer (as depicted in Figure 2).
Figure 2.
The five-level hierarchical framework for national ecological health assessment. This framework integrates the Pressure–State–Response (PSR) model with the Ecological Health Network (EHN) model. The logical flow proceeds from macro-constraints (Target and Criterion Layers) to specific metric selection (Indicator and Similar Indicator Layers). Arrows indicate the hierarchical dependencies and the complex multi-correspondence relationships between ecological elements and monitoring indicators.
The ecological health evaluation is set as the target layer and is summarized through the PSR model into three major concepts reflecting ecological environment health (pressure, state, and response) as the criterion layer, providing downward constraints. The pressure layer represents the internal and external stresses faced by the ecosystem, mainly including the extent of natural resource exploitation and the impact of human activities. The most direct manifestation of natural resource exploitation is the comprehensive land use and type changes. Therefore, land pressure and human activity pressure are selected as the sub-elements in this layer. The state layer represents the condition of the ecosystem. It is subdivided into vigor, organization, and resilience, which reflect the physical and functional aspects of the ecosystem [30], as well as hydrothermal conditions and topography, which determine the chemical status of the ecosystem [31]. This subdivision allows for a comprehensive assessment of the ecosystem from different perspectives. The response layer represents the ecosystem’s capacity to withstand pressure and state changes. Ecological sensitivity effectively reflects the difficulty and likelihood of ecological problems arising when the regional ecosystem encounters disturbances [32]. Therefore, this paper characterizes the response through four main national sensitivities: land desertification sensitivity, soil erosion sensitivity, salinization sensitivity, and landscape disturbance sensitivity [33,34].
Under the constraints of the first three layers, aiming to cover different ecosystems while considering scientific validity, data accessibility, and quantifiability, the selection of the indicator layer was completed by referring to relevant research results and policy documents [12,20,32] (a specific introduction of the indicator data can be found in Appendix A). The selected indicator layer and element layer were organized to form a one-to-many and many-to-many network overlapping relationship. The indicator layer for similar indicators was derived from the most frequently used homogeneous indicators, including vegetation indices, terrain factors, temperature indicators, and precipitation indicators (Figure 2). Each vegetation index also includes its annual mean, annual range, annual maximum, annual minimum, growing season mean, growing season range, growing season maximum, and growing season minimum.
The complex “many-to-many” links in the center of the diagram represent the inherent functional overlaps in ecosystems—for instance, precipitation (Indicator) simultaneously affects both “Vigor” and “Resilience” (Elements). Our adaptive reduction method, described in Section 3, specifically operates on the bottom-most layers to distill this complexity into a robust health index.
2.3.2. Two-Stage Adaptive Indicator Reduction Model
The two-stage adaptive indicator reduction model proposed in this paper includes the reduction of similar indicator layers based on the Technique for Order Preference by Similarity to Ideal Solution (TOPSIS) method and the reduction of indicator layers based on goal optimization theory. Since single-year images of indicators only reflect the ecological conditions at that time, this paper uses the multi-year average values for each indicator as representatives for indicator selection, which may more objectively and stably reflect the ecological conditions over multiple years.
Furthermore, due to the significant differences in the dimensions and physical meanings represented by evaluation indicators, the evaluation indicator data are standardized to [0, 1] before further processing.
Similar Indicator Layer Reduction Method
In the embryonic stage of index system formulation, the selection among numerous analogous indicators is frequently arbitrary and subjective, due to the absence of a quantitative and systematic evaluation framework and a comprehensive evaluation framework for the indicators. The indiscriminate selection of one or several indicators from among many similar ones for use in a study not only undermines the objectivity of the development of the index system, but also results in inconsistent evaluation outcomes, potentially impacting the interpretation of the results. To avoid the information redundancy stemming from an excess of similar indicators within the index system, this paper employs the indicators’ sensitivity, representation, and significance as selection benchmarks. Leveraging the TOPSIS method, which exploits the information contained in the original data and avoids information loss, the outcomes accurately delineate the differences among various evaluative indicators. The study integrates the computational results from these three dimensions into a holistic assessment, and identifies the representative indicators based on the cumulative scores.
Sensitivity is computed utilizing the coefficient of variation [35], which quantifies the selected indicators’ capacity to promptly and accurately reflect changes in the ecosystem’s state, thereby illustrating the sensitivity and discriminatory power of the evaluative metrics. Representativeness is established through correlation analysis [36], demonstrating that the selected indicators exhibit traits shared by other indicators within the same class, enabling them to serve as a proxy for conveying the information typically represented by this class of indicators. Importance is assessed by employing the variance contribution ratio derived from global principal component analysis [37] and the factor detector from Geographic Detector [38], underscoring that the chosen indicators furnish a more comprehensive, precise, and objective information base than alternative indicators.
The TOPSIS method [39] evaluates alternatives by measuring their proximity to the positive ideal solution (PIS) and distance from the negative ideal solution (NIS). The process is as follows:
- (1)
- Standardization: Construct a normalized matrix ( × ) from scores of evaluation methods across indicators.
- (2)
- Distance Calculation:
- (i)
- Identify the positive ideal solution (PIS, column maxima) and negative ideal solution (NIS, column minima).
- (ii)
- Compute distances (from PIS) and (from NIS) for each indicator using
- (iii)
- Derive the composite score for each indicator:
- (iv)
- Indicator Selection:
Single representative: Choose the indicator with the highest . Multiple representatives: Calculate contribution rates (/total ), rank in descending order, and select the top indicators until cumulative contribution ≥ 50%.
Index Layer Reduction and Weight Calculation
Using the results of the selected similar indicators, the index layer reduction is performed using goal optimization theory and a maximum deviation model. This process mainly includes two parts: weight calculation and indicator selection. First, the weights of the factor layer and index layer are calculated. Under the constraints of the factor layer, the weight results are combined according to the affiliations between different factor layers and index layers to obtain the combined weights. Next, based on the affiliations and combined weights, constraint conditions are set to construct the optimal model for goal optimization. The genetic algorithm is used to solve this optimal model, thereby completing the indicator selection. Finally, to ensure that the weight of each indicator in the final index layer is unique, the weights of the selected indicators are recalculated. Under the constraints of the factor layer indicator weights, it is ensured that the sum of all indicator weights in the index layer is 1. The combined weights are obtained, and the weights of the same indicators under different factor layers are merged to obtain the final weights of the indicators.
- (1)
- Indicator weight calculation
The reliability and objectivity of the calculated indicator weights are fundamental to ensuring the validity of subsequent indicator selection and the accuracy of the final outcomes. Furthermore, the importance attributed to indicators naturally varies across different ecological zones, necessitating distinct weight assignments for indicators in each specific zone. To minimize the impacts of subjective biases on the ultimate evaluation results, the determination of indicator weights—as a critical component—requires strategies to mitigate the influence of personal judgment. Thus, objective weight calculation methods, PCA and the Maximization of Deviation Model, are utilized to derive weights grounded in the intrinsic attributes of the indicators themselves. The element layer serves as a conceptual summary of the indicator layer; initially, PCA is employed to condense and synthesize the data from the indicator layer, extracting the representative values that encapsulate the essence of the element layer. Following this abstraction, the weights of the element layer indicators are quantified based on the variance contribution rates obtained through PCA, reflecting their effectiveness in capturing the overall variation within the dataset.
The weights for the indicator layer are determined through the integration of the CRITIC method and the entropy weight method via the Maximization of Deviation Model. The CRITIC method [40] operates on the premise that the greater the variability among data points, the higher the conflict between indicators, leading to increased weight assignment. Conversely, the entropy weight method [41] employs information entropy to calculate indicator weights; an indicator with less variation has a higher information entropy, implying a diminished role in the evaluation and a reduced weight. By merging these two objective weighting techniques through the Maximization of Deviation Model, we mitigate biases introduced by subjective factors and, in contrast to relying on a singular weighting approach, offer a comprehensive consideration of indicator variability, change extent, and mutual conflicts. This holistic strategy diminishes the bias inherent in employing a single weight method, rendering the resultant weights more balanced and reasonable.
The Maximization of Deviation Model [42] aims to determine optimal weights for objective weighting methods by maximizing the total deviation between evaluation results across methods. Let denote the number of weighting methods, the number of evaluation objects, and the evaluation result of the -th object using the -th method. The optimization model is formulated as
Here, represents the weight of the -th method, and D quantifies the total deviation. Solving Equation (4) via the Lagrange multiplier method yields the normalized weight vector:
The final combined weight , integrating the optimized weights and the individual weights from each objective technique, is computed as
In (6), is the raw weight from method kk, while adjusts its contribution based on discriminative power, ensuring balanced aggregation.
- (2)
- Index reduction model construction
Based on the inter-layer relationships within the mesh-like structure of the candidate indicator system, a relational matrix is established [43]. The optimization framework integrates a relational matrix (Equation (7)) to formalize dependencies between element-layer indicators (rows) and indicator-layer criteria (columns). The matrix is structured as
Here, each entry {0,1} denotes the relationship between the -th element-layer indicator and the -th indicator-layer criterion, where = 1 indicates a connection and = 0 its absence.
The objective function (Equation (8)) minimizes the total number of selected indicators:
The optimization is governed by three constraints (Equation (9)):
where represents the total count of selected indicators, and is a binary variable ( {0,1}) indicating the inclusion ( = 1) or exclusion ( = 0) of the -th indicator, is the solution vector, and denotes its transpose. is the weight vector of indicators, and its transpose. Constraint (1) guarantees ecological continuity by mandating at least one linked indicator per element layer. Constraint (2) enforces that the combined weight of selected indicators retains 85% of the original system’s explanatory power, aligning with PCA principles. Constraint (3) restricts to binary values, streamlining the selection process. This model ensures minimal redundancy while maintaining ecological representativeness and systemic coherence.
2.3.3. EHCI Calculation
To enhance the comparability of ecological health status outcomes across various years and regions, a standardized procedure is uniformly applied to each indicator for different periods and regions. By integrating the selected indicators with their determined final weights, the comprehensive index method is employed to normalize the values of the chosen ecological assessment indicators—regardless of whether they are positive or negative—and these are amalgamated with their corresponding definitive weight values. Subsequently, the Ecological Environment Health Comprehensive Index (EHCI) is calculated through a weighted aggregation of these normalized values.
where EHCI signifies the Ecological Environment Health Comprehensive Index, a metric that mirrors the degree of ecological health within the study region, spanning a scale from 0 to 1, where a greater value denotes superior ecological health; is the total count of selected evaluation indicators; denotes the standardized value of the i-th indicator; is the conclusive weight of the i-th indicator; and the sum of all weights equals 1 ( = 1).
2.3.4. Calculation of Obstacle Factors
The obstacle degree model is used to measure the gap between the current state of an ecosystem and the ideal healthy state. Through this model, researchers may determine the extent to which selected driving factors influence the overall status of the Ecological Health Composite Index (EHCI) and identify the primary obstacles affecting ecosystem health [44], specifically, the types of obstacles that most significantly impact regional ecological health. This paper utilizes the obstacle degree model to explore the obstacle factors at the criterion layer and element layer that influence national ecological health. The obstacle degree model consists of three indicators: factor contribution (), indicator deviation () and obstacle degree (). Factor Contribution is the degree to which the jth indicator influences the overall evaluation goal (i.e., weight). Indicator Deviation reflects the gap between the state of the jth indicator in the year t and the ideal state (i.e., 1). Obstacle Degree is the extent of the negative impact on ecological health status in year t, derived from the obstacle diagnosis. The specific calculation formulas for each indicator are as follows.
Indicator deviation:
In the formula, represents the normalized standardized value of the indicator.
Obstacle degree:
After calculating the obstacle degree for each factor, the factor with the highest obstacle degree percentage is identified as the primary obstacle factor.
3. Results
3.1. Selection Results of Indicators
The final indicator selection results are shown in Appendix B. The results indicate that FVC, ecological land area ratio, water source conservation, mean patch size, composite land-use degree, human activity intensity, biological abundance, and ecological resilience were selected across all 11 ecoregions. This suggests that these indicators are common indicators and are universally applicable in the ecological health assessment of various ecological divisions. Among them, composite land-use degree, water source conservation, human activity intensity, biological abundance, and ecological resilience are indicators proposed in the “Regional Ecological Quality Evaluation Method (Trial)” [32] promulgated by the Ministry of Ecology and Environment, PRC, and are inherently suitable for relevant ecological evaluations in China.
3.2. Temporal and Spatial Analysis of National EHCI
Using the selected indicators and corresponding weights in each ecoregion, we calculated the spatial distribution of the Ecological and Environmental Health Comprehensive Index (EHCI) for the entire country from 2001 to 2021. Over the past 21 years, the overall spatial distribution pattern of the EHCI across the nation’s land has remained largely consistent.
3.2.1. Results of Indicator Selection and Weight Determination
From 2001 to 2021, the overall spatial distribution characteristics of the national EHCI remained largely unchanged, displaying strong spatial heterogeneity. The average EHCI for the entire country over the past 21 years and their averages by latitude and longitude are shown in Figure 3. Since the islands in the South China Sea are relatively small, the EHCI averages of latitude start from Hainan Island. The overall ecological health status exhibits a spatial pattern of “high in the southeast and low in the northwest”. Delineated by the Qinling–Huaihe line which is widely recognized as China’s traditional north–south divide, there is a “low in the north, high in the south” spatial pattern. Delineated by the Heihe–Tengchong line which is widely recognized as China’s traditional east–west divide, it presents a spatial distribution pattern with “low in the west and high in the east”. From the perspective of latitudinal and longitudinal axes changes, the national EHCI average shows a general trend of “high in the east and west, low in the middle” in terms of spatial distribution. In terms of longitudinal zones, the EHCI exhibits a fluctuating growth pattern from west to east, with an overall mean value of 0.469. As longitude increases, the mean EHCI gradually rises from its lowest value of approximately 0.3 at 73.5°E, showing an overall fluctuating upward trend, and reaches its peak value of around 0.648 near 130°E. In terms of latitudinal zones, the overall mean EHCI is 0.529, with the highest value reaching approximately 0.736 at around 18°N and the lowest value dropping to about 0.321 near 40°N. Compared to the longitudinal variation, the latitudinal change from low to high latitudes is relatively simpler, exhibiting an arc-shaped trend. Specifically, the mean EHCI generally shows a pattern of initial decrease followed by an increase. Specifically, in terms of the relative regional distribution of ecological health status, the spatial distribution of the national land ecological environment health generally aligns with the actual situation. This indirectly validates the scientific rationality of the methodology proposed in this study.
Figure 3.
Spatial distribution of mean EHCI (the Ecological Environment Health Comprehensive Index) in China from 2001 to 2021 and its variation with latitude and longitude.
Regions with relatively good ecological health (high EHCI values) are concentrated in central and eastern China. Notably, areas such as the Greater and Lesser Khingan Mountains and the Changbai Mountains in the northeast, the Qinling–Daba Mountains region, the middle and lower Yangtze River Plain, and the southeastern coastal areas possess superior natural endowments. These regions either feature flat terrain, low elevation, favorable water and heat conditions, and suitable temperatures with abundant rainfall, or are mountainous areas with dense vegetation cover, high biodiversity, and rich forest resources. Their ecosystems are predominantly characterized by grassland or forest ecosystems with excellent environmental conditions. Consequently, these regions’ ecosystems exhibit high vitality, organization and resilience, experiencing minimal disturbance from human activities and low land stress. Ample green resources also contribute to the regions’ strong soil and water conservation capabilities, water source maintenance, and resistance to desertification, salinization, and human activity pressures.
Regions with relatively moderate to low ecological health (medium to low EHCI values) are primarily distributed in areas with urban, cropland and grassland surface cover types, such as the Northeast Plain, North China Plain, Guanzhong Plain, the Guangdong–Hong Kong–Macao Greater Bay Area, and most parts of Tibet. The Northeast Plain, North China Plain, Guanzhong Plain, and the Greater Bay Area are all ecosystems vulnerable to external (human) activities. Despite generally high vegetation cover, these regions exhibit low biodiversity, intense human activity and significant land stress, due to either high proportions of cropland or high levels of urbanization and industrialization. These factors result in a substantial proportion of construction land and significant pollution load; thus, many environmental constraints lead to poor overall ecosystem conditions. Similarly, most parts of Tibet, with moderate to low ecological health, are restricted by poor natural environmental conditions and dominated by low-coverage grasslands with low biodiversity and vegetation cover, resulting in moderate to low levels of ecological health.
Regions with relatively poor ecological health (low EHCI values) are primarily located in the western part of Inner Mongolia, the western part of Qinghai Province, and arid and high-altitude inland areas such as the Tarim Basin, Junggar Basin, and the eastern regions of the Xinjiang Uygur Autonomous Region. Compared to other regions, these areas, despite low human activity intensity or even no human influence, suffer from arid and low rainfall conditions. The surface cover types are mainly deserts, Gobi and sparse shrubs, with extremely low biodiversity and vegetation cover. Almost no vegetation grows across these regions, the soil moisture is low, surface temperatures are high, and ecosystem conditions are harsh, resulting in poor ecological health.
3.2.2. Temporal Characteristics of EHCI
Using the Sen + Mann–Kendall method, we conducted a time series trend analysis of the EHCI for various regions from 2001 to 2021. Since no regions exhibited a strict Sen trend slope β of 0, we classified regions with |β| ≤ 0.003 as no significant change (Unchanged). The threshold of |β| ≤ 0.003 was determined based on the normalized scale of the EHCI (ranging from 0 to 1) and the 21-year study period. Specifically, a Sen’s slope of 0.003 corresponds to an average annual change rate of approximately 0.3%, which represents a weak fluctuation relative to the overall index range and can reasonably be interpreted as quasi-stability rather than substantive ecological change. This threshold helps distinguish background variability from systematic long-term trends and reduces the likelihood of misclassifying minor oscillations as meaningful transitions. Additionally, the test statistic Z is used to test the significance of the trend. At a significance level of α = 0.05, the critical value . The criteria for determining trends are as follows: when β > 0.003 and |Z| > 1.96, the series shows a significant upward trend (Significant Improvement); when β > 0.003 and |Z| ≤ 1.96, the series shows a non-significant upward trend (Slight Improvement); when β < −0.003 and |Z| > 1.96, the series shows a significant downward trend (Severe Degradation); and when β < −0.003 and |Z| ≤ 1.96, the series shows a non-significant downward trend (Slight Degradation). The results are shown in Figure 4, and the area proportions of each trend in different regions are statistically summarized in Table 1.
Figure 4.
Trend of national EHCI changes from 2001 to 2021.
Table 1.
Area proportions for EHCI change trends by region (%).
From Figure 4 and Table 1, it can be seen that over the past 21 years, the overall ecological health status across the country has generally been stable, with 93.53% of the area showing no significant change. Regions exhibiting ecological improvement generally form a “Y-shaped” distribution, primarily located west of the Heihe–Tengchong Line and north of the Qinling–Huaihe Line. Regions showing a degradation trend are mostly scattered and fragmented. The by-area proportion of regions with improvement is 4.21%, which is about two times the area of the degradation areas, indicating that the ecological health status across the country has been improving over the past 21 years.
3.3. Primary Obstacle Diagnosis Analysis
The purpose of diagnosing ecosystem health is not only to evaluate the national ecological health status, but more importantly, to identify the factors hindering the ecosystem health. This allows for targeted environmental remediation and adjustments in ecological management policies. Therefore, a further diagnosis of obstacles to the national ecosystem is necessary. Understanding the types and spatial distribution of the primary obstacles, those which account for the largest proportion of hindrance, is crucial for assessing ecological health and providing targeted decisionmaking support to local governments. Using the obstacle degree model, we calculated the primary obstacle degree for each city (district) at the prefectural level. We present the results for the years 2001, 2011, and 2021 (Figure 5) and analyze the changes in primary obstacle types and degrees by comparing these years (Figure 6).
Figure 5.
Primary obstacle factors and obstacle severity at the prefectural city level (a) 2001. (b) 2011. (c) 2021. (d) The proportion of cities (districts) with each obstacle type in each year.
Figure 6.
Primary obstacle types and changes in obstacle degree.
From the spatial distribution and proportional quantity of primary obstacle factors at the prefectural level cities across the three periods, we observe that the overall type changes are minimal and show a diverse, patchy distribution. As shown in Figure 5d, approximately 60% of the prefecture-level cities have their primary ecological health barrier factors closely related to the VOR, which reflects the physical and functional aspects of the ecosystem. The regions where the primary obstacle factor is organization constitute the largest proportion in all three periods. These regions are mainly concentrated in the southern part of China, extending from Tibet to the southeastern coastal areas. In these areas, ecosystems are often homogeneous, predominantly forest or grassland ecosystems, leading to weak ecosystem diversity. Consequently, organizational capacity becomes the limiting factor for ecological health. Regions where the primary obstacle factor is vigor are mainly distributed in the northern part of the North China Plain. This is possibly due to the dominance of cropland vegetation, which results in low ecosystem metabolism and primary productivity. Regions where the primary obstacle factor is resilience are primarily located in the northwestern part of China, including western Inner Mongolia, western Gansu, northern Xinjiang, northern Qinghai, and the southern part of the North China Plain. The harsh environment and intense human exploitation in these areas lead to fragile ecosystems with poor ability to recover their original structure and function after external disturbances, thus hindering ecological health development. More than 20% of prefecture-level cities have ecological sensitivity factors as their primary obstacle to ecological health, with land desertification sensitivity being the most widely distributed. This issue is particularly prevalent in regions such as Northeast China, the Loess Plateau, and southern Qinghai, where severe desertification and erosion are prominent. Approximately 10% of prefecture-level cities have hydrothermal conditions as their primary obstacle to ecological health, primarily distributed in regions such as Sichuan, Chongqing, central Shaanxi, Henan, Shanxi, and central Taiwan. The primary obstacle factor for land pressure is distributed in the south-central part of Xinjiang. Other types of obstacles are more scattered in their distribution.
From the perspective of primary obstacle types and changes in obstacle degree, the comparisons at the three time points shown in Figure 6 indicate that the reduction in obstacle degree is the most prevalent type. This shows that, regarding primary obstacle factors, the nation’s overall propensity to hinder ecological health development has been gradually weakening.
From 2001 to 2011, regions where the obstacle degree increased and obstacle factors changed were mainly located near and to the east of the Heihe–Tengchong line. In this period, certain cities (districts) in east of Northeast China, coastal region of southeast China, and central Taiwan experienced increases in obstacle degree, indicating that the constraints of obstacle factors in these regions had intensified. From 2011 to 2021, compared to the previous period, the proportion of areas where the obstacle degree increased had grown, primarily concentrated to the west of the Heihe–Tengchong line and adjacent areas. The regions most significantly affected by this change included Xinjiang, Guizhou, Yunnan, Shaanxi, Qinghai, Macau, Taiwan, and Shanxi, where over half of the cities (districts) showed rising obstacle degrees.
In the overall time series from 2001 to 2021, the regions where the two non-decreasing types (increased and unchanged obstacle degrees) were concentrated were near the Heihe–Tengchong line. Despite some regions showing an increase in obstacle degree during the intermediate period comparisons, the overall trend across most cities (districts) over these 21 years was a decrease in obstacle degree. This trend overlaps significantly with the regions of ecological health improvement, indicating that targeted implementation of ecological management projects has simultaneously improved ecological health and weakened the restrictive capacities of various obstacle factors.
This analysis underscores the importance of continuous and focused ecological management practices. By understanding and mitigating primary obstacle factors, local governments can further enhance the regional ecological health, leading to sustainable environmental improvements.
4. Discussion
4.1. Analysis of Indicator Reduction Method and Rationality of Selected Indicators
Regarding indicator screening methods, the goal is to reduce information redundancy caused by an excessive number of similar indicators while automatically and objectively selecting reasonable indicators that are suitable for different regions, this paper proposes a two-stage automatic indicator screening method based on the TOPSIS method and objective optimization theory. Compared to traditional indicator screening methods such as correlation analysis, principal component analysis, and subjective selection, the proposed method can comprehensively consider and utilize multiple aspects of the indicator data itself during the screening of similar indicators and indicator layer indicators. It quantitatively, rather than qualitatively, completes the indicator screening process. This is a highly objective screening method based on the calculation of scores for similar indicators, the calculation of indicator-layer weights, and the final indicator selection. It improves the scientific validity and objectivity of the indicator screening process, especially as the calculation of indicator weights employs an objective combination weighting strategy, which is more scientific and reasonable than equal weighting methods, entropy weight methods, and Analytic Hierarchy Process. This minimizes the subjective cognitive impact on the final evaluation results and can reflect the regional ecological and environmental health status in an appropriate and reasonable multi-dimensional data pattern.
From the perspective of the rationality of the selected indicators, the top-ranked indicators in each ecoregion correspond well to the ecosystem characteristics and conditions of each zone. The HB ecoregion has a large area of plains with low levels of vegetation coverage, and mainly consists of cultivated land and construction land. Human activities have exerted significant pressure on the ecology, resulting in severe ecological vulnerability, defining a major ecological difference with the mountainous forest areas with less human interference and good ecological and environmental health [45]. The main ecological differences faced by CJ and DB are similar to those of HB, and the top-ranked indicators in all three ecoregions are the water source conservation index and ecological land area ratio. However, there are significant differences in the ecological benefits of forestland, cultivated land, and construction land in terms of water source conservation capacity and ecological land attributes. Therefore, the selected indicators can reflect the main ecological differences in these three regions. Other indicators represent the different ecological background conditions in the three regions. The HB ecoregion has intense human activities, a high level of urbanization, and strong land pressure. Therefore, indicators such as the composite land-use degree, ecological resilience, and human activity intensity, which characterize the strength of land use, also merit a significant weight. The mean fractal dimension, ecological resilience, and biological abundance correspond to the impacts of industrial areas and ecological restoration in DB on the landscape, as well as the excellent ecological health status of the Hulunbeir Grassland, the Daxing’anling and Changbai Mountains. In the CJ ecoregion, the high weights of soil texture and topographic position indicators reflect the complex soil types and topographic features, such as paddy soil, red soil, and Shajiang Black Soil in the Middle–Lower Yangtze Plain; moisture soil and purple soil in Huaibei Plain, the lower part of low hills and coastal island areas; and yellow-brown soil, brown soil, and cinnamon soil in the middle and upper parts of hills and mountains, as well as coastal areas [9].
The NM ecoregion is dominated by grassland and desert landscape ecosystems. The eastern grassland region is located in the eastern part of the Eurasian Steppe, the largest temperate grassland in the world, and is the largest, most complete in series, and the most diverse, in its types of temperate natural grasslands, in China. The western region is located in arid and extremely arid areas, with four major deserts: Badanjilin, Tengger, Ulan Buh, and Kubuqi. It spans three climatic zones from east to west: temperate semi-humid, semi-arid, and arid regions. Along the gradient of decreasing water content, land cover types vary from grassy marshland grassland and typical grassland to deserted grassland and desert, resulting in differences in vegetation coverage from east to west. Coupled with changes in water content, there are also significant differences in the dry and wet states of the climate. The top-ranked indicators such as ecological land area ratio, humidity index, and FVC can well reflect these differences. The mean fractal dimension partly reflects the impact of human activities on the landscape pattern [46], effectively demonstrating the impact of ecological restoration measures such as the Three-North Shelterbelt on the grassland and desert landscapes in the MN ecological zone.
The HT ecoregion spans four climatic zones, including humid, semi-humid, semi-arid and arid, and is a sensitive area for climate change in dryness and wetness as well as an ecologically fragile region [47]. There are significant differences in vegetation coverage and climate dryness and wetness in the hilly and gully areas of the Loess Plateau, the Maowusu Desert, the fertile farmland of the northern Shaanxi Plateau and the Guanzhong Plain, which have relatively poor ecological health among the ecological areas, and the Yinchuan Plain in northern Ningxia, the Qinling and Bashan Mountains in central and southern Shaanxi, as well as the high-altitude areas in Shanxi with good ecological health. The leading indicators in the HT results, such as moisture index, water source conservation index, FVC, and ecological land area ratio, can well reflect the differences in climate dryness and wetness and vegetation coverage within the HT ecoregion.
Due to the significant differences in altitude and slope between the northern Tibetan Plateau and the southern Tibetan Plateau–lake–basin–valley, the XZ ecoregion has a complex geomorphic structure [48]. Along with unreasonable human development activities such as urban expansion, land reclamation, and deforestation, the ecosystem has become increasingly fragile. The largest patch can describe the direction and intensity of human activities, while the topographic position reflects the combined differences in altitude and slope. Additionally, ecological land area ratio, the annual maximum OSAVI, and FVC can demonstrate the differences between the severely desertified areas in the northwest and the eastern Himalayan forest zone in the southeast.
The XJ ecoregion belongs to an arid climate with low levels of vegetation coverage. The ecosystem is dominated by desert ecosystems, followed by grassland ecosystems. The rapid development of XJ along with the scarcity of water resources and vegetation is the main cause of ecological problems [49]. Therefore, it is reasonable that the top-ranked indicators include the proportion of ecological land area, representing changes in ecological land area, as well as the water source conservation index, FVC, and the annual difference in OSAVI, which reflect water source conservation capacity and vegetation coverage status. The QG ecoregion is similar, with ecological land area ratio, FVC, and mean fractal dimension ranking highly.
The CY, HN and YG ecoregions have over half of their area covered by forests [50]. The leading indicators, such as water source conservation, FVC, and ecological land area ratio, well express their excellent forest resources and ecological land resources. The topographic position index also describes the terrain pattern well. Therefore, the selected indicators effectively characterize the natural background characteristics of CY, HN and YG.
Furthermore, among the selected indicators in various ecological zones, there is a significant overlap with regionally chosen indicators in the existing ecological evaluation literature. For example: in HN, SHDI, SHEI, vegetation coverage [51]; in HB, evapotranspiration, human activity intensity, annual average temperature, biological abundance, mean patch size, and FVC [45,52]; in DB and FVC, biological abundance; in SHDI and SHEI, composite land-use degree, and human activity intensity [13,53]; in XJ, FVC, and DEM, biological abundance, annual precipitation, composite land-use degree, NPP, and mean fractal dimension [54,55]; and in NM, human activity intensity, FVC, Lai, mean fractal dimension, SHDI, and ecological resilience [11].
The above analysis indicates that the two-stage adaptive index reduction model can automatically, objectively, and reasonably select key indicators that can represent the differences in ecological environments or natural background characteristics of various regions based on their specific characteristics. This approach significantly reduces the subjectivity of indicator selection and weight calculation while minimizing information redundancy.
4.2. Comparative Analysis of Ecological Health
The ecological health evaluation system developed herein, which evaluates ecosystem health from a multifaceted perspective, effectively mirrors the integrity of ecological network structures and spans a variety of ecosystem types. Regarding spatial distribution, it demonstrates strong alignment with the widely utilized Remote Sensing Ecological Index (RSEI) (Figure 7a) and the standard Ecological Quality Index (EQI) (Figure 7b). The traditional RSEI index, which exclusively draws upon remote sensing data and employs the first principal component (PC1) from principal component analysis as an ecological assessment metric, may fall short in providing a holistic reflection of regional environmental conditions if the cumulative variance explained by PC1 is less than 80%. This deficiency is exacerbated when applied across vast expanses where imagery is captured during varying seasonal periods, resulting in inconsistencies in spatial distribution. Moreover, owing to the intrinsic characteristics of PCA computations, the RSEI overlooks the condition of aquatic environments during ecological evaluations. While the EQI (Figure 7b) provides a standardized baseline, it often relies on aggregated land cover data, which can obscure pixel-level variations within the same ecosystem type.
Figure 7.
Comparison of EHCI spatial distribution with results from the existing literature. The ecological environment quality results for China in 2020, based on RSEI and EQI, are depicted in the following figure: (a) represents RSEI, and (b) represents EQI. (c) The spatial distribution map of the Ecosystem Health Condition Index (EHCI) for the year 2020.
The methodology proposed in this study is applicable to various types of ecosystems, with the sum of the initial weights of the selected indicators exceeding 85%. This ensures a comprehensive and representative evaluation of ecological health across different ecosystems. Additionally, the ecological health results in this paper are based on the comprehensive description of multiple indicators, and the expression of results is not limited to a few indicators. For example, in the grassland areas of Tibet, Qinghai, and Inner Mongolia to the west of the Heihe–Tengchong line, the results indicate lands that are relatively healthier, with the support of various indicators compared to RSEI. Moreover, the results in this paper can significantly express the differences in ecological health status between regions. Compared to RSEI, this makes the transition of ecological health status more natural and realistic. This is especially evident in transition zones extending from northwestern China to central China, and urban areas and their surrounding areas.
4.3. Analysis of the Causes of National Ecological Health Changes
As depicted in Figure 5, the improvement in ecological health conditions can be primarily attributed to the implementation of national ecological management measures that correspond well to the regions where they were applied.
However, it is crucial to acknowledge that these improvements are the result of a synergistic interplay between anthropogenic interventions and natural factors. Specifically, favorable climatic variations (such as increased precipitation and temperature rise in certain arid regions) over the past two decades have provided a beneficial hydrothermal background for vegetation recovery. Furthermore, the natural resilience of ecosystems and the cessation of high-intensity disturbances have allowed for spontaneous succession, with engineering measures acting as a catalyst rather than the sole driver.
Since 2000, China has undertaken nine major ecological restoration projects—including Phases IV and V of the Three-North Shelterbelt Development Program, the Grain for Green Program, Phases II and III of the Yangtze River Shelterbelt Program, Phases II and III of the Pearl River Shelterbelt Program, the Returning Grazing Land to Grassland Program, the Three-River Headwaters Ecological Conservation Project, and the Southwest Karst Rocky Desertification Control Program—spanning all 31 provincial-level regions (provinces, autonomous regions, and municipalities) and covering approximately 9.248 million km2, achieving remarkable ecological benefits over this 21-year restoration effort [6]. The areas of ecological improvement are broadly distributed in a “Y-shaped” pattern (Figure 5a), primarily to the west of the Heihe–Tengchong Line and north of the Qinling–Huaihe Line. The improved areas in these regions account for 3.03% of the national area, surpassing their degraded counterparts. Notably improved areas include the pastoral–agricultural transitional zone from northeast to southwest, such as the Maowusu Desert in Inner Mongolia and the Shaanxi Loess Gully region, central and southern Ningxia, and eastern Gansu. Additionally, the northern part of Qinghai Province, the periphery of the Tarim Basin and the Junggar Basin in Xinjiang, the economic belt north of the Tianshan Mountains, and the Tibetan western region are also included. These areas are involved in the Three-North Shelterbelt Program, the Conversion of Cropland to Forest and Grassland Program, and the Grazing Land Restoration Project [56]. Although the improved area to the east of the Heihe–Tengchong Line only accounts for 1.04% of the national total, there are still some areas of improvement, mainly concentrated in the Qinling area of Shaanxi, the Sichuan Basin, and the southern part of Guangxi. These areas correspond to the Yangtze River Basin Shelter Forest Program and the Pearl River Basin Shelter Forest Program. Moreover, these areas are similar to the regions with increased FVC calculated by Shao Quanqin et al. [6], indicating that the main reasons for the improvements in key areas of the country, especially to the west of the Heihe–Tengchong Line and north of the Qinling–Huaihe Line, lie in the effective implementation of ecological management projects [57,58]. These projects have significantly enhanced the water and soil conservation capacity, water conservation capacity, and vegetation coverage in these originally ecologically fragile and sensitive areas. The ecological landscape configuration has gradually become more rational, reducing soil erosion in pastoral areas and land desertification in arid regions. These areas have played a positive role in climate, biodiversity, and ecological land use, thereby enhancing the overall health of the ecosystem.
The areas showing a trend of ecological health degradation, as depicted in Figure 4, are mostly fragmented patches with scattered distributions. Moreover, as shown in Table 1, the proportion of degraded areas is strikingly similar, whether divided by the Qinling–Huaihe line into northern and southern parts or by the Heihe–Tengchong line into eastern and western parts. However, the causes of degradation differ. Regions to the east of the Heihe–Tengchong line that exhibit degradation trends are concentrated mainly in the eastern coastal areas. The favorable geographical conditions often ensure that these areas include the central cities or administrative centers of administrative regions, with abundant resource elements that attract population aggregation and create a siphon effect, leading to a generally high level of urbanization in these areas [59]. Particularly, the three major urban agglomerations of the Beijing–Tianjin–Hebei, Yangtze River Delta, and Pearl River Delta regions have seen rapid economic development and urban expansion. The proliferation of impervious surfaces in urban areas encroaches upon ecological land and continues to expand outward, causing a rapid decline in vegetation coverage [3,60], thereby negatively impacting ecological health and showing a trend of degradation. In contrast, the distribution of degraded areas in the western regions is more dispersed, mainly located in the central Tibetan Plateau, central and western Inner Mongolia, and central Xinjiang. Apart from urban expansion, the landscape is predominantly deserts, sandy lands, and grasslands, coupled with extreme temperature, altitude, and precipitation conditions, making the ecological environment inherently fragile with weak self-repair capabilities. Therefore, special climatic, topographical conditions, and overgrazing-induced grassland degradation have led to the ecological health degradation [4]. It is also noteworthy that in the context of global warming, increased evapotranspiration in arid and semi-arid regions may have offset the benefits of precipitation, exacerbating the degradation in these climate-sensitive zones.
The alignment of ecological health trends with actual conditions also demonstrates the effectiveness of the methods proposed in this study. Furthermore, as can be seen from Figure 3, while ecological improvement areas are mostly located in regions with poorer ecological health, areas of ecological health degradation are often found in regions with relatively better ecological health, including the southeast coastal areas of China, the Yunnan–Guizhou Plateau, the Sichuan–Chongqing region, and the Lesser Khingan and Changbai mountain ranges. These results are consistent with the findings of Li et al. [59] and Xu et al. [4], and these areas are within the scope of ecological management projects. This phenomenon not only reflects the fact that China has indeed achieved significant results in the field of ecological environment management, but also highlights the complexity of ecosystem dynamics: even in regions with high ecological baselines, intense anthropogenic disturbances (such as high-density urbanization and intensive agriculture) can exceed the ecosystem’s resilience threshold, leading to localized degradation despite restoration efforts. However, within some ecological restoration project areas, there remain areas with a limited degree of ecological restoration, ineffective protection, and even degradation, indicating that the suitability of the current ecological measures may be suboptimal and should be adjusted and improved appropriately to better align with local hydrothermal conditions and socio-economic realities.
4.4. Ecological Health Issues and Recommendations
Over the past 20 years, China has emphasized ecological environment construction alongside economic development, leading to significant improvements in the ecological environment. According to the results in the preceding sections, the area of regions showing improvement constitutes 4.21%, exceeding that of the degraded regions, indicating that the national ecological health status has been trending towards improvement over the past 21 years. Moreover, the main areas of improvement correspond to various major ecological projects, demonstrating that the amelioration of the ecological environment is primarily attributed to the effective implementation of ecological governance measures such as the Three-North Shelter Forest Program, the Conversion of Cropland to Forest and Grassland Program, and the Returning Grazing Lands to Grasslands Program. However, there are still some issues. The current national ecological health status mainly faces obstacles brought by organization, vitality, resilience, hydrothermal conditions, and desertification sensitivity, while the main reasons for the degradation areas are urban expansion and poor natural ecological conditions. These diagnostic results provide a scientific basis for differentiated ecological restoration.
Guided by the obstacle factor analysis, in areas where organization and vigor are the primary constraints, the issues include a lack of diversity due to singular ecosystems or monoculture crop vegetation, leading to weak risk resistance, poor ecological stability, and potentially low metabolic rates and primary productivity. To address these specific obstacles, it is necessary to increase the diversity of ecosystems or land cover types by adopting locally adapted methods, such as controlling urban development boundaries, converting farmland back to forests or grasslands, and restoring the natural connectivity of rivers and lakes, thereby enhancing risk resistance and stability. In regions where resilience, hydrothermal conditions, and desertification sensitivity are the primary obstacles, the harsh environmental conditions—such as extreme hydrothermal conditions, desertification, and high altitudes—have created a poor ecological foundation, making the ecosystem fragile and susceptible to damage. By improving the ecological environment restoration system and implementing region-specific protection and restoration of ecosystems including mountains, water, forests, farmland, lakes, grasslands, sands, ice, and other components, the overall ecological function of the area can be maintained, thereby enhancing the ecosystem’s resistance to disturbances and resilience.
Reflecting the quantitative findings on urban-induced degradation, high-intensity development and utilization, especially urbanization and industrialization, requires a balance between development and environmental considerations. It is essential to harmonize human activities with ecological health during the development process, ensuring sustainable development that aligns with the national call for the principles of “reduction, reuse, and recycling”, characterized by “low consumption, low emission, and high efficiency”. An economic development model embodying the concept of sustainable development should be formed by continuously improving resource utilization efficiency and meeting the growing material and cultural needs of people with minimal resource consumption and environmental cost, achieving efficient coordination between ecology and economy.
5. Conclusions
This study focused on terrestrial ecosystems in China as the research area and constructed a five-tier evaluation index system suitable for various regional conditions across the country, based on geographical big data. Additionally, a two-stage self-adaptive index simplification model was developed that can automatically select key evaluation indicators according to the ecological characteristics of different regions. A national ecological health condition analysis and diagnostic study were conducted. The main research conclusions are as follows:
- (1)
- Compared to traditional indicator systems, the constructed framework expands the scope of the system and enhances its ability to characterize ecosystem features. It not only effectively reflects the integrity of the ecosystem’s network structure and encompasses different ecosystems, but also ensures that the indicators are easily obtainable and calculable.
- (2)
- The two-stage adaptive reduction method, integrating the TOPSIS method for similar indicator reduction and target optimization theory for indicator layer reduction, has achieved automatic indicator selection and weight calculation. It has been successfully applied in different ecoregions, offering a standardized yet flexible tool for dynamic ecological monitoring and objective policy evaluation.
- (3)
- Utilizing the selected indicators and weights, the Ecosystem Health Condition Index (EHCI) for China’s terrestrial ecosystems from 2001 to 2021 was calculated over 21 years. The national ecological health condition exhibits strong spatial heterogeneity, with an overall “high in the southeast, low in the northwest” spatial pattern. The ecological health condition has generally maintained stability over the past 21 years, with 93.53% of the area showing little change. The area showing improvement is approximately twice that of the lands experiencing degradation, a result of the implementation of national ecological management measures over the past two decades. The primary obstructive factors across the country are vitality, organization, resilience, hydrothermal conditions, and desertification sensitivity. The long-term stability in the types of national ecological projects has created a patchy distribution across the landscape. Nevertheless, their negative effect on ecological health is showing a gradual decline.This underscores that future management should transition from general greening to structural optimization based on specific obstacle factors.
Author Contributions
Conceptualization, X.W.; Methodology, X.W. and J.C.; Software, J.C.; Validation, D.W.; Formal analysis, D.W.; Data curation, D.W.; Writing—original draft, J.C.; Writing—review & editing, X.W.; Visualization, D.W.; Supervision, X.W. and M.L.; Project administration, X.W. All authors have read and agreed to the published version of the manuscript.
Funding
This research was funded by the Strategic Pilot Science and Technology Project of the Chinese Academy of Sciences, grant number XDA23100500; and the Fujian Provincial Scientific Research Project for Middle-aged and Young Teachers (Science and Technology Category), grant number JZ240005. The APC was funded by the same funders.
Data Availability Statement
The raw data supporting the conclusions of this article will be made available by the authors on request.
Conflicts of Interest
The authors declare no conflict of interest.
Appendix A
Table A1.
Description of the Evaluation Index database.
Appendix B
Table A2.
Selected indicators and their weights for each ecoregion (HB, DB, NM).
Table A3.
Selected indicators and their weights for each ecoregion (HT, CJ, XJ).
Table A4.
Selected indicators and their weights for each ecoregion (QG, CY, YG).
Table A5.
Selected indicators and their weights for each ecoregion (HN, XZ).
References
- Li, Y.; Tian, H.; Zhang, J.; Lu, S.; Xie, Z.; Shen, W.; Zheng, Z.; Li, M.; Rong, P.; Qin, Y. Detection of spatiotemporal changes in ecological quality in the Chinese mainland: Trends and attributes. Sci. Total Environ. 2023, 884, 163791. [Google Scholar] [CrossRef] [Scilit]
- Cai, J.; Li, X.; Liu, L.; Chen, Y.; Wang, X.; Lu, S. Coupling and coordinated development of new urbanization and agro-ecological environment in China. Sci. Total Environ. 2021, 776, 145837. [Google Scholar] [CrossRef] [Scilit]
- Xu, D.; Yang, F.; Yu, L.; Zhou, Y.; Li, H.; Ma, J.; Huang, J.; Wei, J.; Xu, Y.; Zhang, C.; et al. Quantization of the coupling mechanism between eco-environmental quality and urbanization from multisource remote sensing data. J. Clean. Prod. 2021, 321, 128948. [Google Scholar] [CrossRef] [Scilit]
- Xu, D.; Cheng, J.; Xu, S.; Geng, J.; Yang, F.; Fang, H.; Xu, J.; Wang, S.; Wang, Y.; Huang, J.; et al. Understanding the Relationship between China’s Eco-Environmental Quality and Urbanization Using Multisource Remote Sensing Data. Remote Sens. 2022, 14, 198. [Google Scholar] [CrossRef] [Scilit]
- Shen, W.; Li, Y.; Qin, Y. Research on the influencing factors and multi-scale regulatory pathway of ecosystem health: A case study in the Middle Reaches of the Yellow River, China. J. Clean. Prod. 2023, 406, 137038. [Google Scholar] [CrossRef] [Scilit]
- Shao, Q.; Liu, S.; Ning, J.; Liu, G.; Yang, F.; Zhang, X.; Niu, L.; Huang, H.; Fan, J.; Liu, J. Assessment of ecological benefits of key national ecological projects in China in 2000-2019 using remote sensing. Acta Geogr. Sin. 2022, 77, 2133–2153. [Google Scholar] [CrossRef]
- Shan, W.; Jin, X.; Ren, J.; Wang, Y.; Xu, Z.; Fan, Y.; Gu, Z.; Hong, C.; Lin, J.; Zhou, Y. Ecological environment quality assessment based on remote sensing data for land consolidation. J. Clean. Prod. 2019, 239, 118126. [Google Scholar] [CrossRef] [Scilit]
- Xiao, R.; Hao, H.; Zhang, H.; Liu, Y.; Liu, M. The development of ecological civilization in China based on the economic–social–natural complex system. Ambio 2023, 52, 1910–1927. [Google Scholar] [CrossRef] [Scilit]
- Xie, X.; Fang, B.; Li, X.; He, S. Urban ecosystem health assessment and obstacle factor diagnosis using a comprehensive assessment model for Nanjing, China. Growth Change 2021, 52, 1938–1954. [Google Scholar] [CrossRef] [Scilit]
- Wang, Z.; Chen, T.; Zhu, D.; Jia, K.; Plaza, A. RSEIFE: A new remote sensing ecological index for simulating the land surface eco-environment. J. Environ. Manag. 2023, 326, 116851. [Google Scholar] [CrossRef] [Scilit]
- Wang, J.; Ding, Y.; Wang, S.; Watson, A.E.; He, H.; Ye, H.; Ouyang, X.; Li, Y. Pixel-scale historical-baseline-based ecological quality: Measuring impacts from climate change and human activities from 2000 to 2018 in China. J. Environ. Manag. 2022, 313, 114944. [Google Scholar] [CrossRef] [Scilit] [PubMed]
- Chen, Y.; Tian, W.; Zhou, Q.; Shi, T. Spatiotemporal and driving forces of Ecological Carrying Capacity for high-quality development of 286 cities in China. J. Clean. Prod. 2021, 293, 126186. [Google Scholar] [CrossRef] [Scilit]
- Sun, B.; Tang, J.; Yu, D.; Song, Z.; Wang, P. Ecosystem health assessment: A PSR analysis combining AHP and FCE methods for Jiaozhou Bay, China1. Ocean. Coast. Manag. 2019, 168, 41–50. [Google Scholar] [CrossRef] [Scilit]
- Dale, V.H.; Beyeler, S.C. Challenges in the development and use of ecological indicators. Ecol. Indic. 2001, 1, 3–10. [Google Scholar] [CrossRef] [Scilit]
- Shen, W.; Li, Y.; Qin, Y.; Cheng, J. Influencing mechanism of climate and human activities on ecosystem health in the middle reaches of the Yellow River of China. Ecol. Indic. 2023, 150, 110191. [Google Scholar] [CrossRef] [Scilit]
- Ashraf, A.; Haroon, M.A.; Ahmad, S.; Abowarda, A.S.; Wei, C.; Liu, X. Use of remote sensing-based pressure-state-response framework for the spatial ecosystem health assessment in Langfang, China. Environ. Sci. Pollut. Res. 2023, 30, 89395–89414. [Google Scholar] [CrossRef] [Scilit]
- Li, J.; Pei, Y.; Zhao, S.; Xiao, R.; Sang, X.; Zhang, C. A review of remote sensing for environmental monitoring in China. Remote Sens. 2020, 12, 1130. [Google Scholar] [CrossRef] [Scilit]
- Gu, X.; Xu, Z.; Liu, L.; Yin, X.; Wang, M. Assessment of the Ecological Health of the Beijing Northern Canal River Ecosystem. Environ. Sci. 2018, 39, 2576–2587. [Google Scholar] [CrossRef]
- Lin, T.; Lin, J.; Cui, S.; Cameron, S. Using a network framework to quantitatively select ecological indicators. Ecol. Indic. 2009, 9, 1114–1120. [Google Scholar] [CrossRef] [Scilit]
- Wang, X.; Lin, M.; Ding, Z.; Zhou, J.; Wang, C.; Chen, J. Ecological health assessment of Kaikong River Basin based on automatic screening of indicators in Xinjiang. Acta Ecol. Sin. 2020, 40, 4302–4315. [Google Scholar] [CrossRef]
- Chen, J.H.; Wang, X.Q.; Kong, L.F. Construction of adaptive indicator reduction model for ecological environment health assessment. J. Geo-Inf. Sci. 2024, 26, 1193–1211. [Google Scholar] [CrossRef]
- Jun, C.; Ban, Y.; Li, S. Open access to Earth land-cover map. Nature 2014, 514, 434. [Google Scholar] [CrossRef] [Scilit] [PubMed]
- Wan, Q.; Luo, X.; Pan, F.; Jin, G. Spatiotemporal evolution and convergence trends of air quality in Chinese urban agglomerations. Sci. Geogr. Sin. 2022, 42, 1943–1953. [Google Scholar] [CrossRef]
- Xie, G.; Zhang, C.; Zhang, L.; Su, D.; Cao, S.; Leng, Y.; Xiao, Y. China’s county-scale ecological regionalization. J. Nat. Resour. 2012, 27, 154–162. [Google Scholar] [CrossRef]
- Sun, R.H.; Li, Z.; Chen, L.D. Review of ecological regionalization and classification in China: Ecological patterns, functions, and ecosystem services. Acta Ecol. Sin. 2018, 38, 5271–5278. [Google Scholar] [CrossRef] [Scilit]
- Yang, J.; Huang, X. The 30 m annual land cover dataset and its dynamics in China from 1990 to 2019. Earth Syst. Sci. Data 2021, 13, 3907–3925. [Google Scholar] [CrossRef] [Scilit]
- NOAA (National Oceanic and Atmospheric Administration). National Oceanic and Atmospheric Administration Website. Climate Data from NOAA National Centers for Environmental Information (NCEI). Available online: https://www.noaa.gov/ (accessed on 12 July 2021).
- Resource and Environment Science and Data Center (RESDC); Chinese Academy of Sciences. China Meteorological Background Dataset. National Scientific Data Center for Resource and Environment, China. Available online: http://www.resdc.cn (accessed on 19 July 2021).
- U.S. Geological Survey (USGS). ASTER Global Digital Elevation Model Version 2 (ASTGTM2), 30 m Resolution. U.S. Geological Survey Earth Resources Observation and Science (EROS) Center. Available online: https://www.usgs.gov/ (accessed on 26 July 2021).
- Chen, W. A multi-scale assessment of ecosystem health based on the Pressure-State-Response framework: A case in the Middle Reaches of the Yangtze River Urban Agglomerations, China. Environ. Sci. Pollut. Res. 2022, 29, 29202–29219. [Google Scholar] [CrossRef] [Scilit]
- Zhao, J.; Ji, G.; Tian, Y.; Chen, Y.; Wang, Z. Environmental vulnerability assessment for mainland China based on entropy method. Ecol. Indic. 2018, 91, 410–422. [Google Scholar] [CrossRef] [Scilit]
- Ministry of Ecology and Environment. National Ecological Function Zoning of China. 26 November 2015. Available online: https://www.mee.gov.cn/xxgk2018/xxgk/xzgfxwj/202301/W020151126550511267548.pdf (accessed on 26 February 2026).
- Fu, B.J. Ecological Regionalization Research in China; Science Press: Beijing, China, 2013. [Google Scholar]
- Sun, Y.; Lu, M.; Wang, Y.; Yang, Z. Evaluation of ecosystem health in the Fen River Basin based on landscape pattern evolution. China Rural. Water Hydropower 2023, 23–32. [Google Scholar] [CrossRef]
- Ren, J.; Fang, Y.; Jian, J.; Yang, X.; Ouyang, Y. Urban ecological environment assessment based on subjective and objective weighting method. Yangtze River 2019, 50, 80–85. [Google Scholar] [CrossRef]
- Xu, H. Remote sensing assessment of ecological changes in soil erosion areas. Trans. Chin. Soc. Agric. Eng. 2013, 29, 91–97+294. [Google Scholar] [CrossRef]
- Zhou, L. Research on eco-economy in western rural areas based on temporal global principal component analysis. Chin. J. Agric. Resour. Reg. Plan. 2017, 38, 192–196+234. [Google Scholar] [CrossRef]
- Song, Y.Z.; Wang, J.F.; Ge, Y.; Xu, C. An optimal parameters-based geographical detector model enhances geographic characteristics of explanatory variables for spatial heterogeneity analysis: Cases with different types of spatial data. GISci. Remote Sens. 2020, 57, 593–610. [Google Scholar] [CrossRef] [Scilit]
- Li, D.; Yang, J.; Hu, T.; Wang, G.; Cushman, S.A.; Wang, X.; László, K.; Su, R.; Yuan, L.; Li, B.; et al. The seeds of ecological recovery in urbanization–Spatiotemporal evolution of ecological resiliency of Dianchi Lake Basin, China. Ecol. Indic. 2023, 153, 110431. [Google Scholar] [CrossRef] [Scilit]
- Li, G.; Wang, Q.; Gao, J.; Liu, L.; Lao, T.; Ning, Z. Scenario analysis of the applicability of different weighting methods for watershed ecological restoration potential assessment. Chin. J. Environ. Eng. 2023, 17, 3159–3168. [Google Scholar] [CrossRef]
- Cheng, W.; Xi, H.; Sindikubwabo, C.; Si, J.; Zhao, C.; Yu, T.; Li, A.; Wu, T. Ecosystem health assessment of desert nature reserve with entropy weight and fuzzy mathematics methods: A case study of Badain Jaran Desert. Ecol. Indic. 2020, 119, 106843. [Google Scholar] [CrossRef] [Scilit]
- Meng, Y.; Wang, M.; Xu, W.; Guan, X.; Yan, D. Structure construction, evolution analysis and sustainability evaluation of Water-Ecological-Economic system. Sustain. Cities Soc. 2022, 83, 103966. [Google Scholar] [CrossRef] [Scilit]
- Huang, J.; Lin, T.; Hu, D.J. Quantitative selection of ecological construction evaluation indicator system based on network analysis: A case study of Fujian Province. Acta Ecol. Sin. 2015, 35, 686–695. [Google Scholar] [CrossRef] [Scilit]
- Lu, T.; Li, C.; Zhou, W.; Liu, Y. Fuzzy Assessment of Ecological Security on the Qinghai–Tibet Plateau Based on Pressure–State–Response Framework. Remote Sens. 2023, 15, 1293. [Google Scholar] [CrossRef] [Scilit]
- Wu, S.; Tian, B.; Gu, S.; Hu, Y. Spatial-temporal evolution of ecological vulnerability in Beijing-Tianjin-Hebei region based on PSRM model. Environ. Sci. 2023, 44, 5630–5640. [Google Scholar] [CrossRef] [Scilit]
- Xu, M.; Li, J.; Peng, J.; Niu, J.; Cao, L. Ecosystem health assessment based on RS and GIS. Ecol. Environ. Sci. 2010, 19, 1809–1814. [Google Scholar] [CrossRef]
- Yue, M.; Geng, G.; Wang, T.; Yang, R.; Gu, Q. Spatiotemporal variation of vegetation NDVI and its driving factors in the Shaanxi section of the Yellow River Basin from 2000 to 2019. Res. Soil Water Conserv. 2023, 30, 238–246+255. [Google Scholar] [CrossRef]
- Shi, R.; Jia, Q.; Wei, F.; Du, G. Comprehensive evaluation of ecosystem health in pastoral areas of Qinghai–Tibet Plateau based on multi model. Environ. Technol. Innov. 2021, 23, 101552. [Google Scholar] [CrossRef] [Scilit]
- Zhou, Z.; Wang, X.; Ding, Z.; Chen, Y.; Wang, C. Remote sensing analysis of ecological quality change in Xinjiang. Acta Ecol. Sin. 2020, 40, 2907–2919. [Google Scholar] [CrossRef] [Scilit]
- Chen, J.; Wang, X.; Lin, M.; Sun, W. Analysis and assessment of changes in ecological health status in Fujian Province from 2001 to 2021. Chin. J. Ecol. 2024, 43, 3443–3455. [Google Scholar] [CrossRef]
- Wang, Z.; Tang, L.; Qiu, Q.; Chen, H.; Wu, T.; Shao, G. Assessment of regional ecosystem health—A case study of the Golden Triangle of Southern Fujian Province, China. Int. J. Environ. Res. Public Health 2018, 15, 802. [Google Scholar] [CrossRef] [Scilit]
- Wang, J.; Zhou, W.; Xu, K.; Yan, J.; Li, W.; Han, L. Quantitative assessment of ecological quality in Beijing-Tianjin-Hebei urban megaregion, China. Chin. J. Appl. Ecol. 2017, 28, 2667–2676. [Google Scholar] [CrossRef]
- Luo, L.; Wang, L.; Liu, P.; Li, X.; Gao, Y. Ecosystem health evaluation for Shawan forest in middle part of Tianshan Mountain in Xinjiang. Xinjiang Agric. Sci. 2018, 55, 1505–1515. [Google Scholar]
- Liu, S.; Ding, J.; Zhang, J.; Zhang, Z.; Chen, X.; Raxidin, M. Remote sensing diagnosis of grassland ecosystem environmental health in the Ebinur Lake Basin. Acta Prataculturae Sin. 2020, 29, 1–13. [Google Scholar] [CrossRef]
- Huang, Y.; Zhou, W.; Ma, M. Characterize the spatial heterogeneity of fragmented land-surface and its relationship with spatial scale in southwest China. Natl. Remote Sens. Bull. 2023, 27, 802–809. [Google Scholar] [CrossRef] [Scilit]
- Liu, X.; Zha, N.Y.; Wang, X.Y.; Wang, W.Q.; Wang, K.P.; Zhang, Y.L. Effects of the Grain for Green Project on the ecosystem health of the agro-pastoral ecotone in northern China. Acta Ecol. Sin. 2023, 43, 6392–6405. [Google Scholar]
- Jiang, L.; Liu, Y.; Wu, S.; Yang, C. Analyzing ecological environment change and associated driving factors in China based on NDVI time series data. Ecol. Indic. 2021, 129, 107933. [Google Scholar] [CrossRef] [Scilit]
- Liao, W.; Jiang, W. Evaluation of the spatiotemporal variations in the eco-environmental quality in China based on the remote sensing ecological index. Remote Sens. 2020, 12, 2462. [Google Scholar] [CrossRef] [Scilit]
- Li, W.; An, M.; Wu, H.; An, H.; Huang, J.; Khanal, R. The local coupling and telecoupling of urbanization and ecological environment quality based on multisource remote sensing data. Environ. Manag. 2023, 327, 116921. [Google Scholar]
- Li, C.; Li, X.M. Spatiotemporal variation characteristics of vegetation ecological quality in China from 2000 to 2018. Resour. Environ. Yangtze Basin 2021, 30, 2154–2165. [Google Scholar]
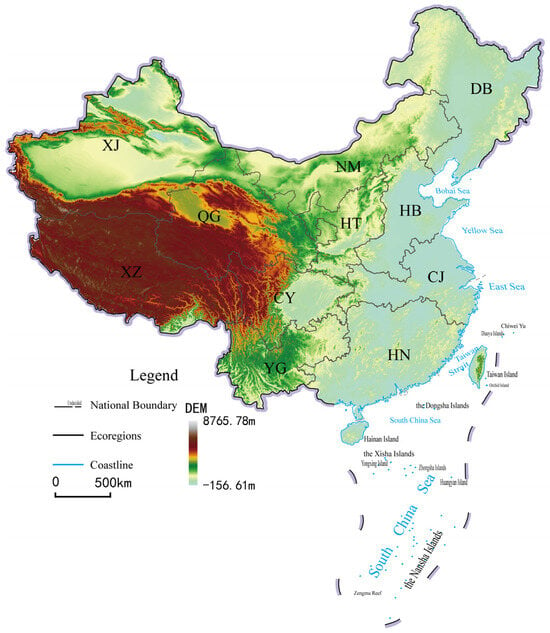
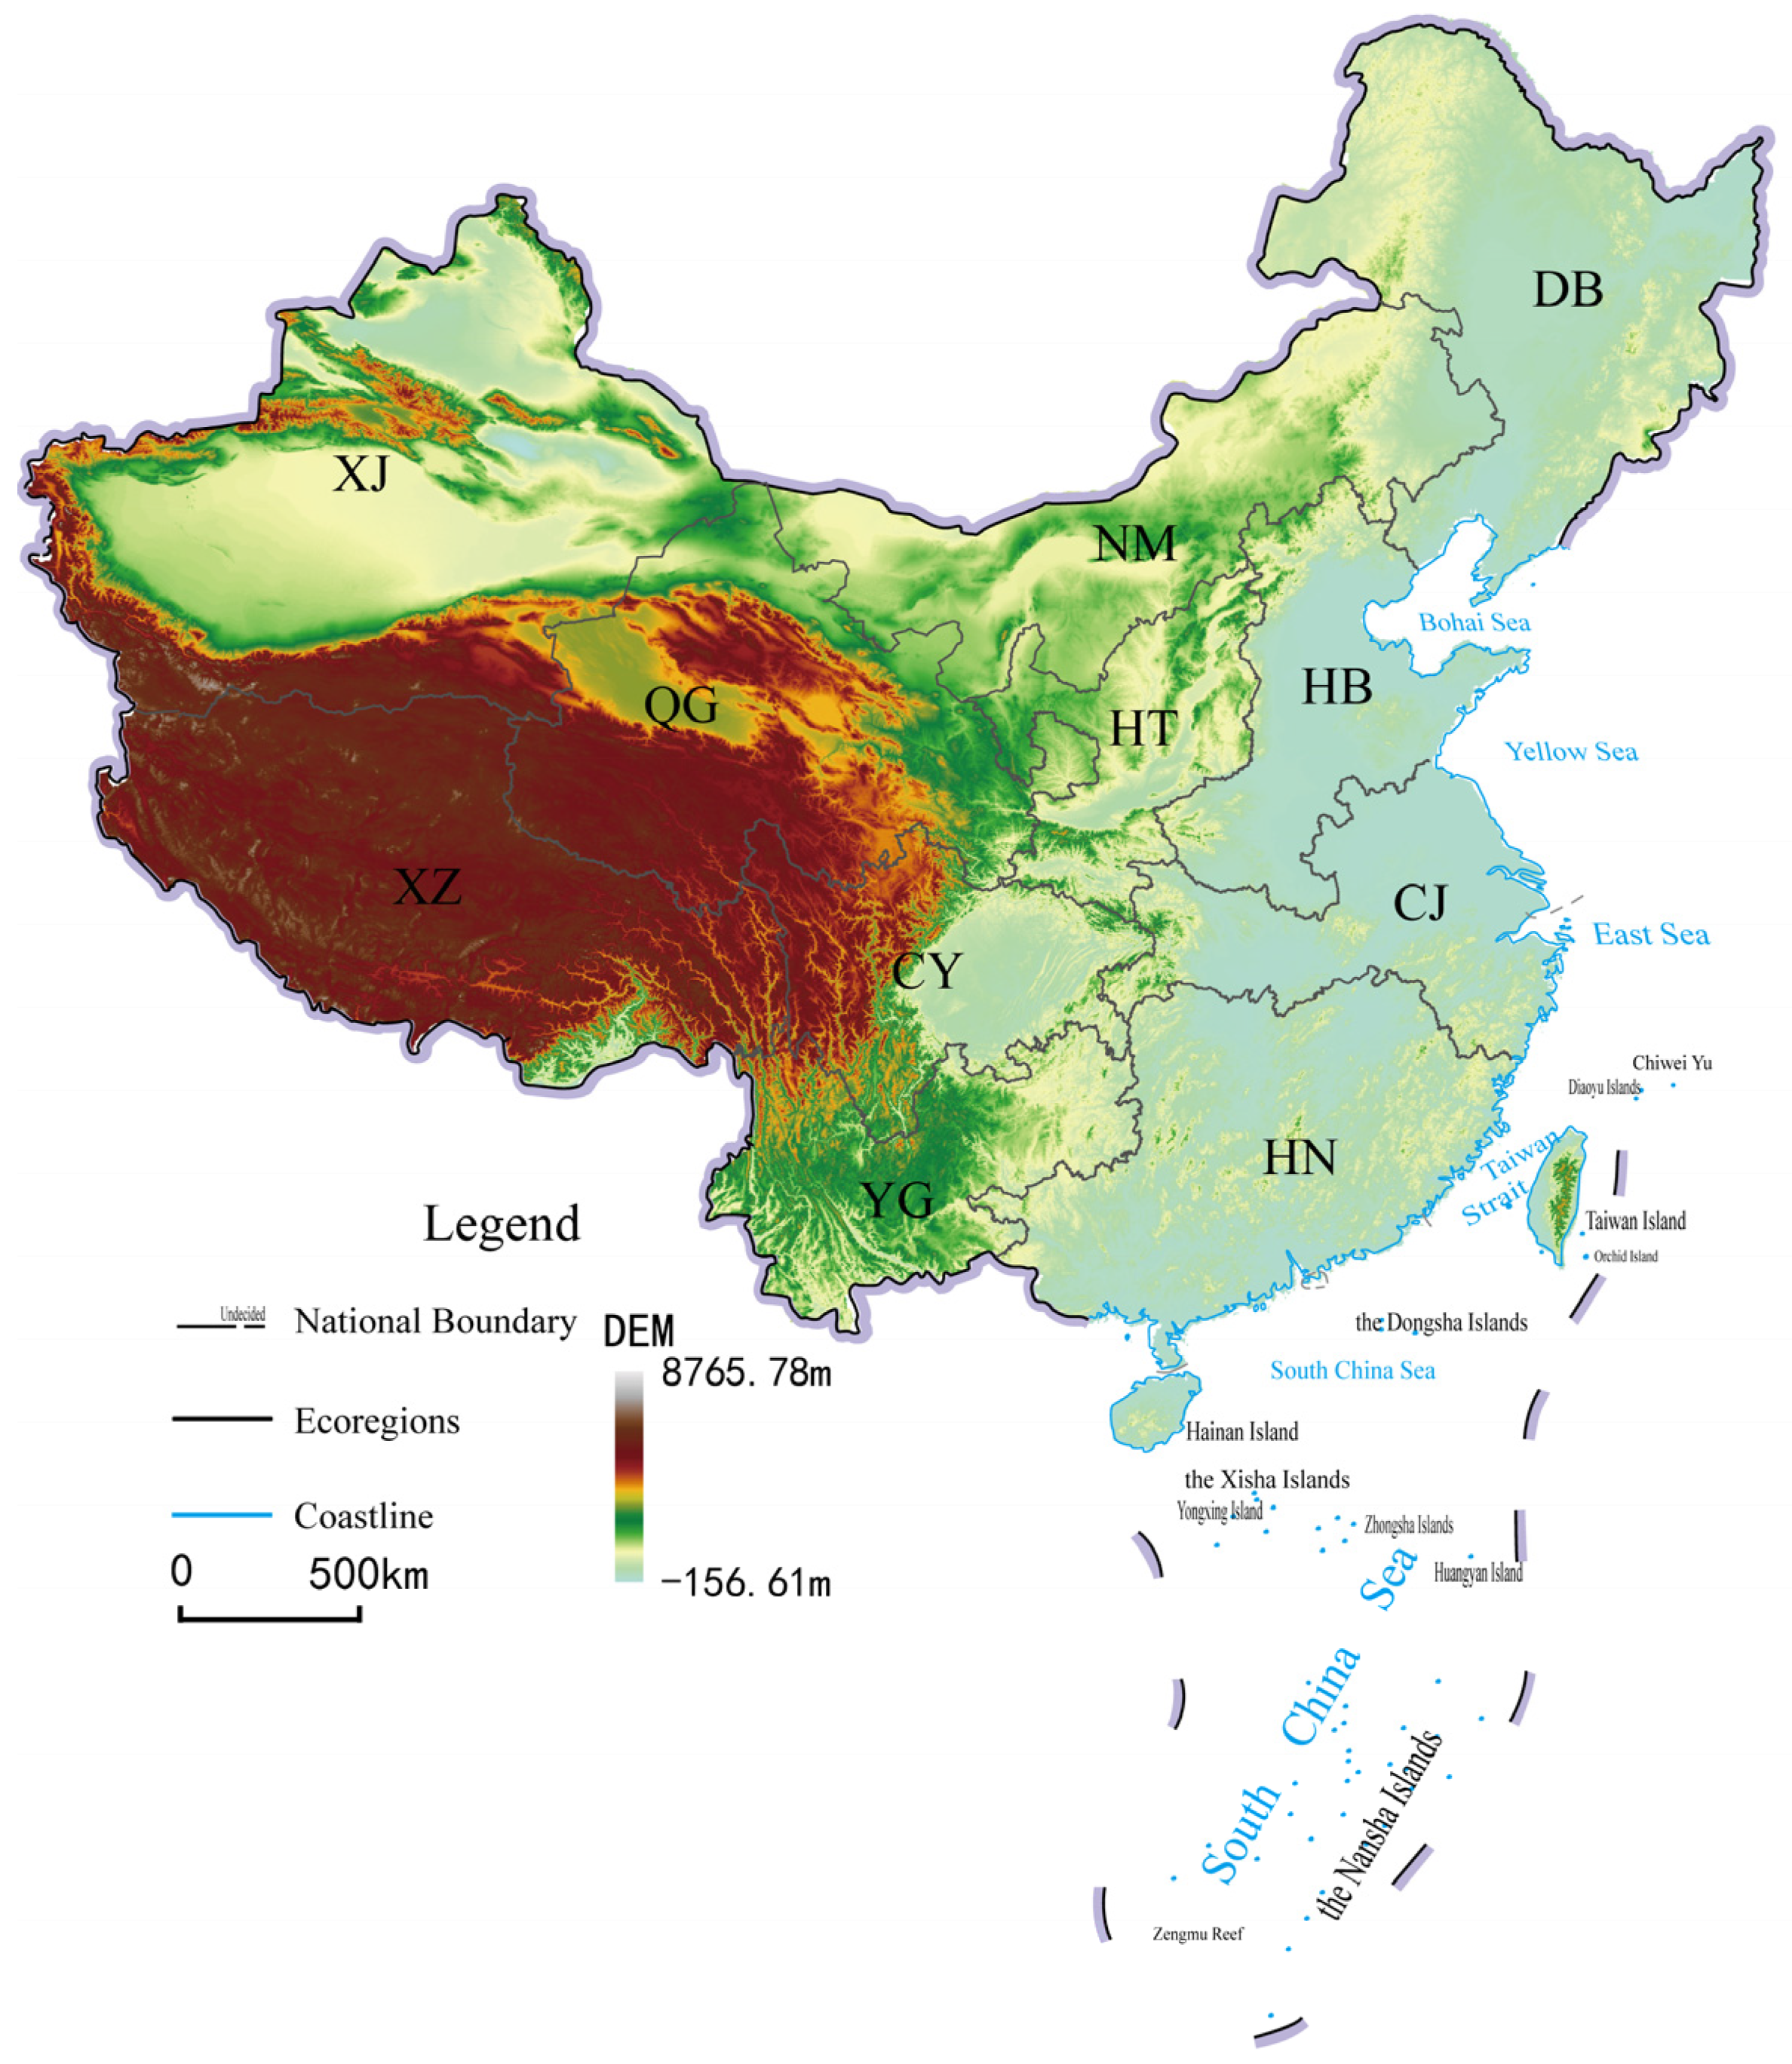
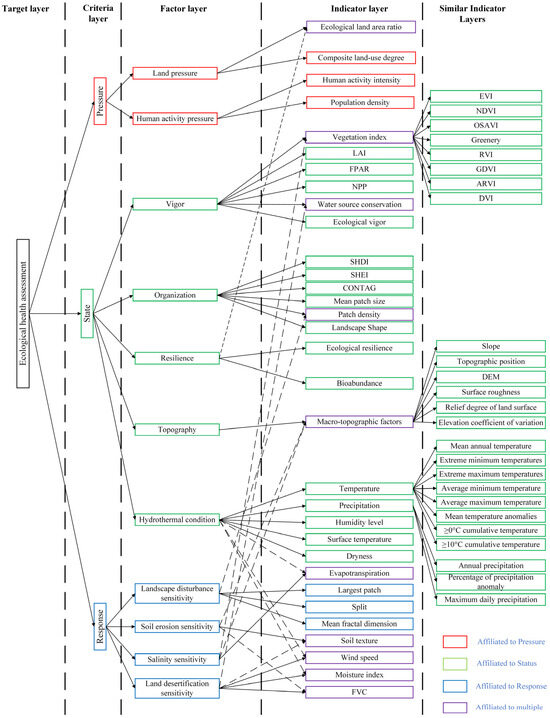
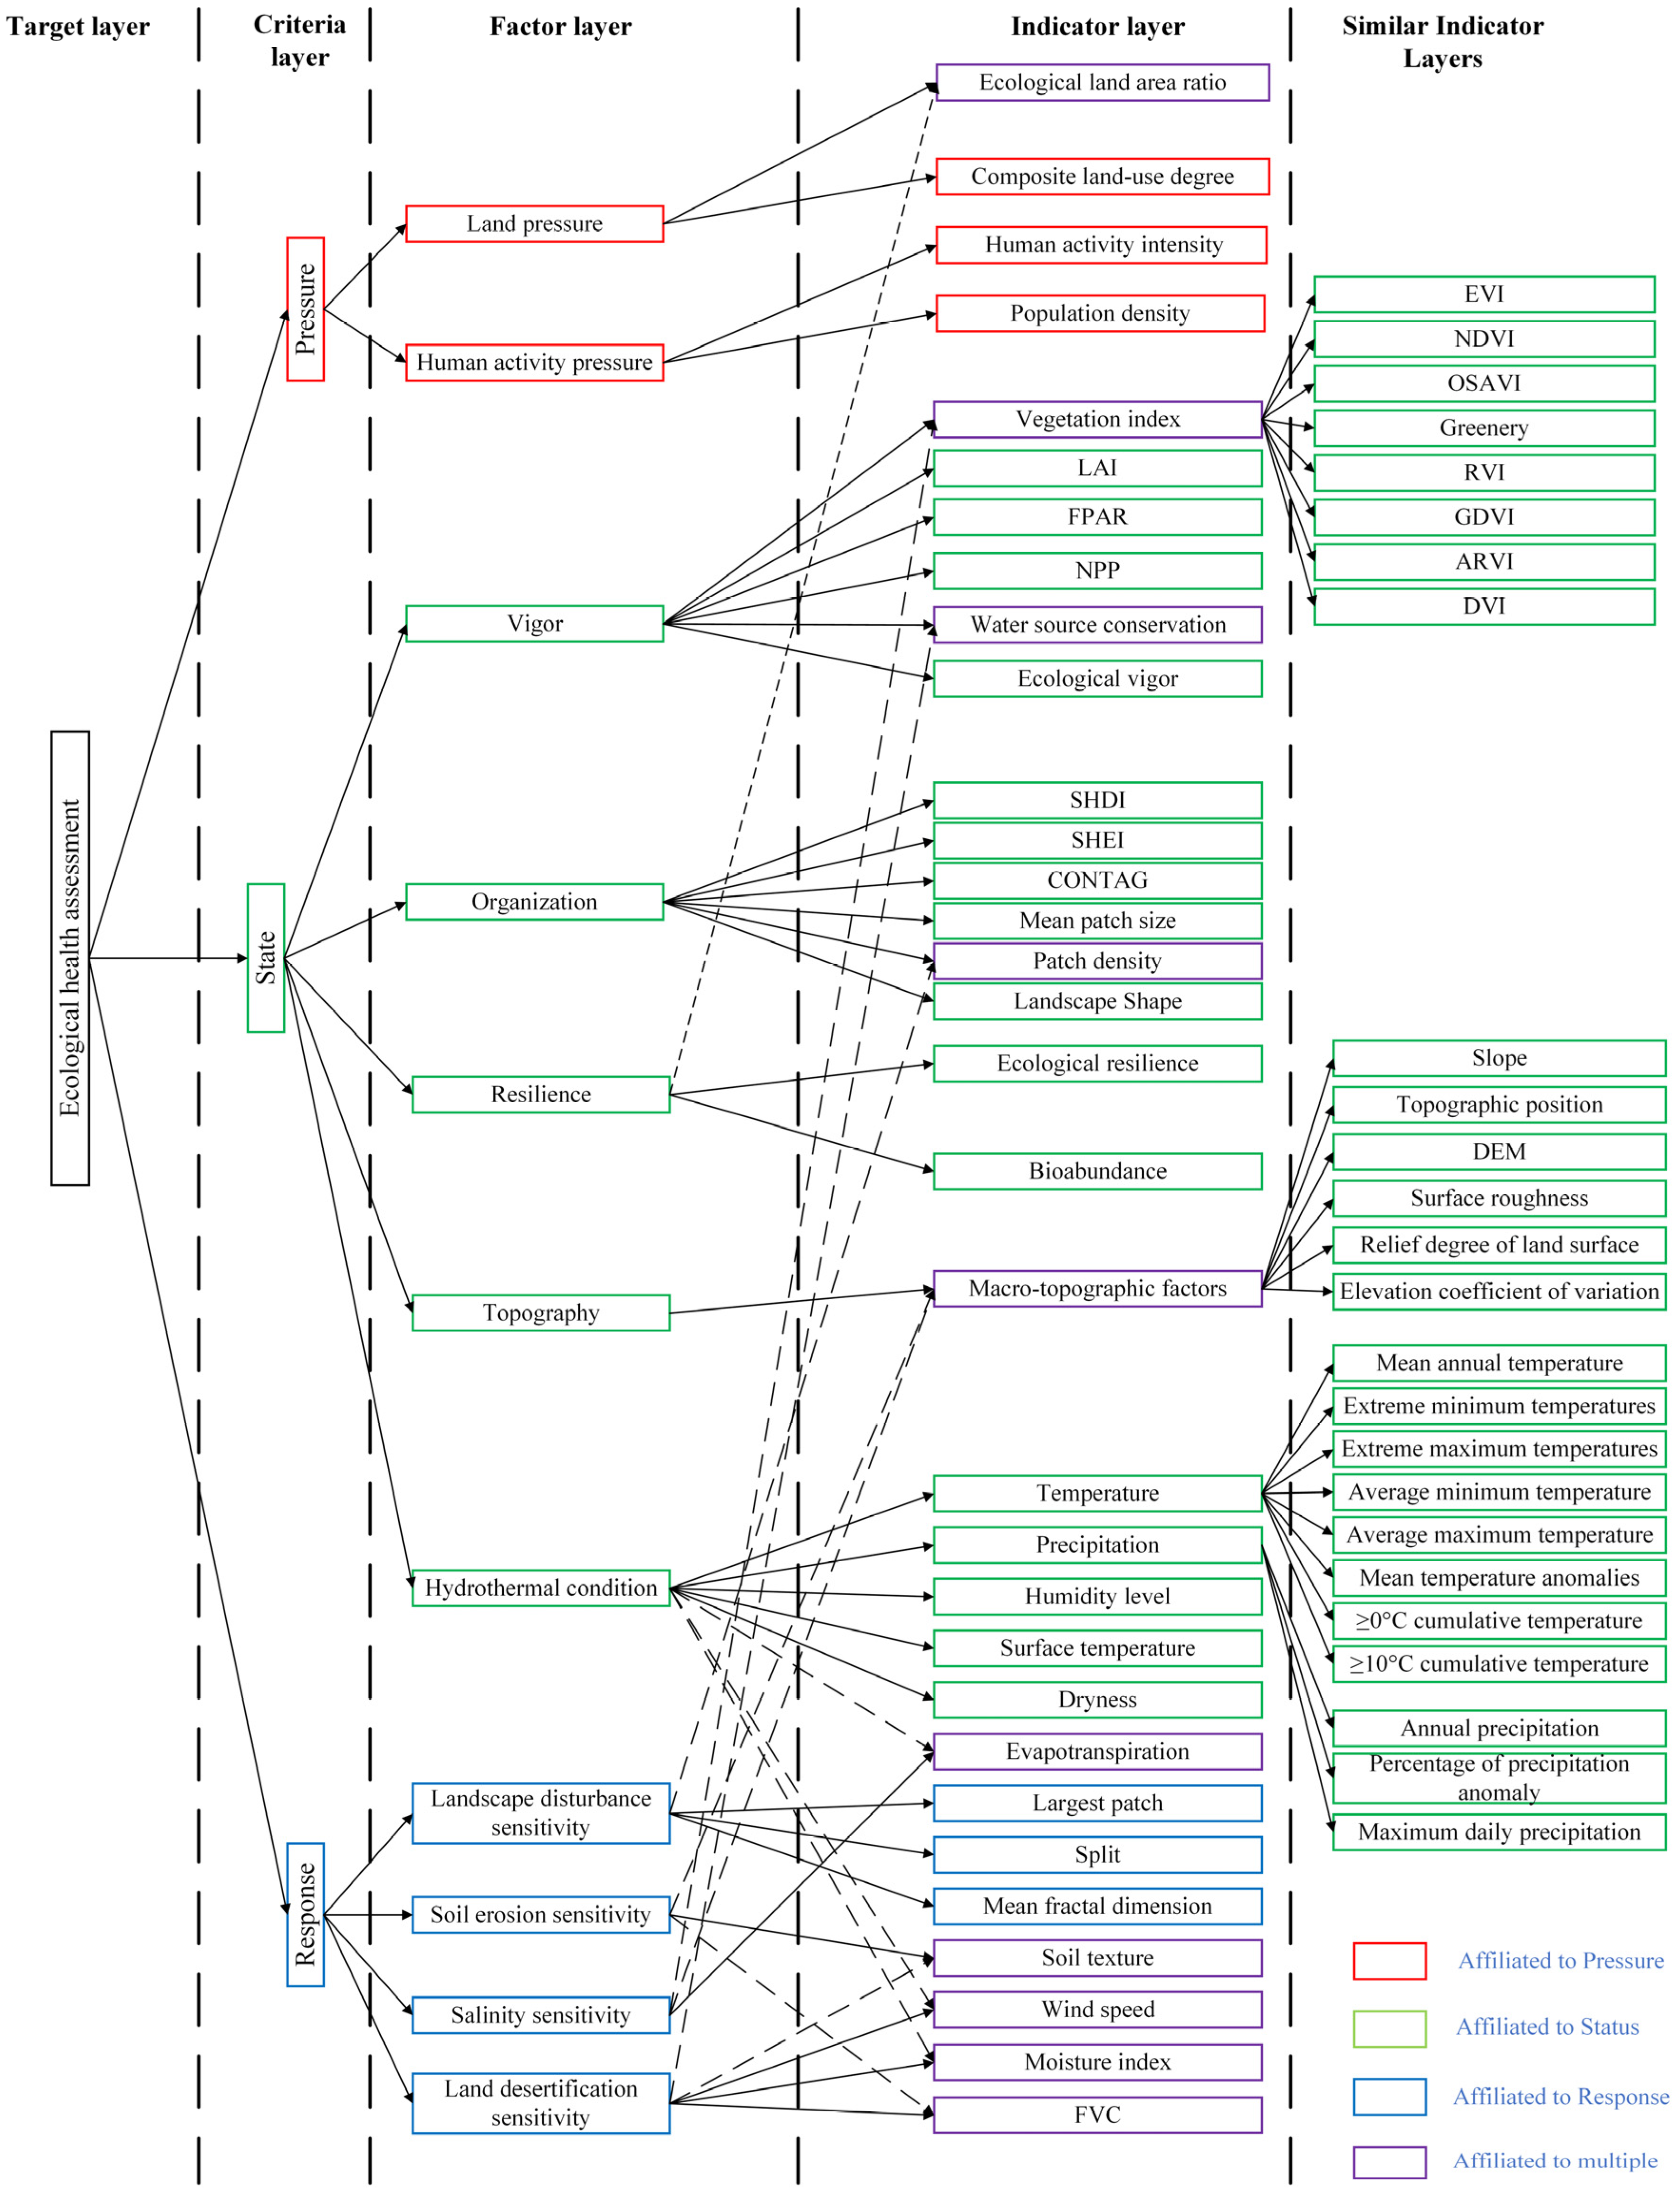
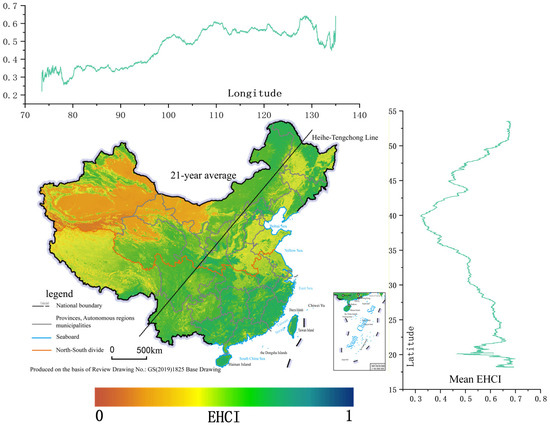
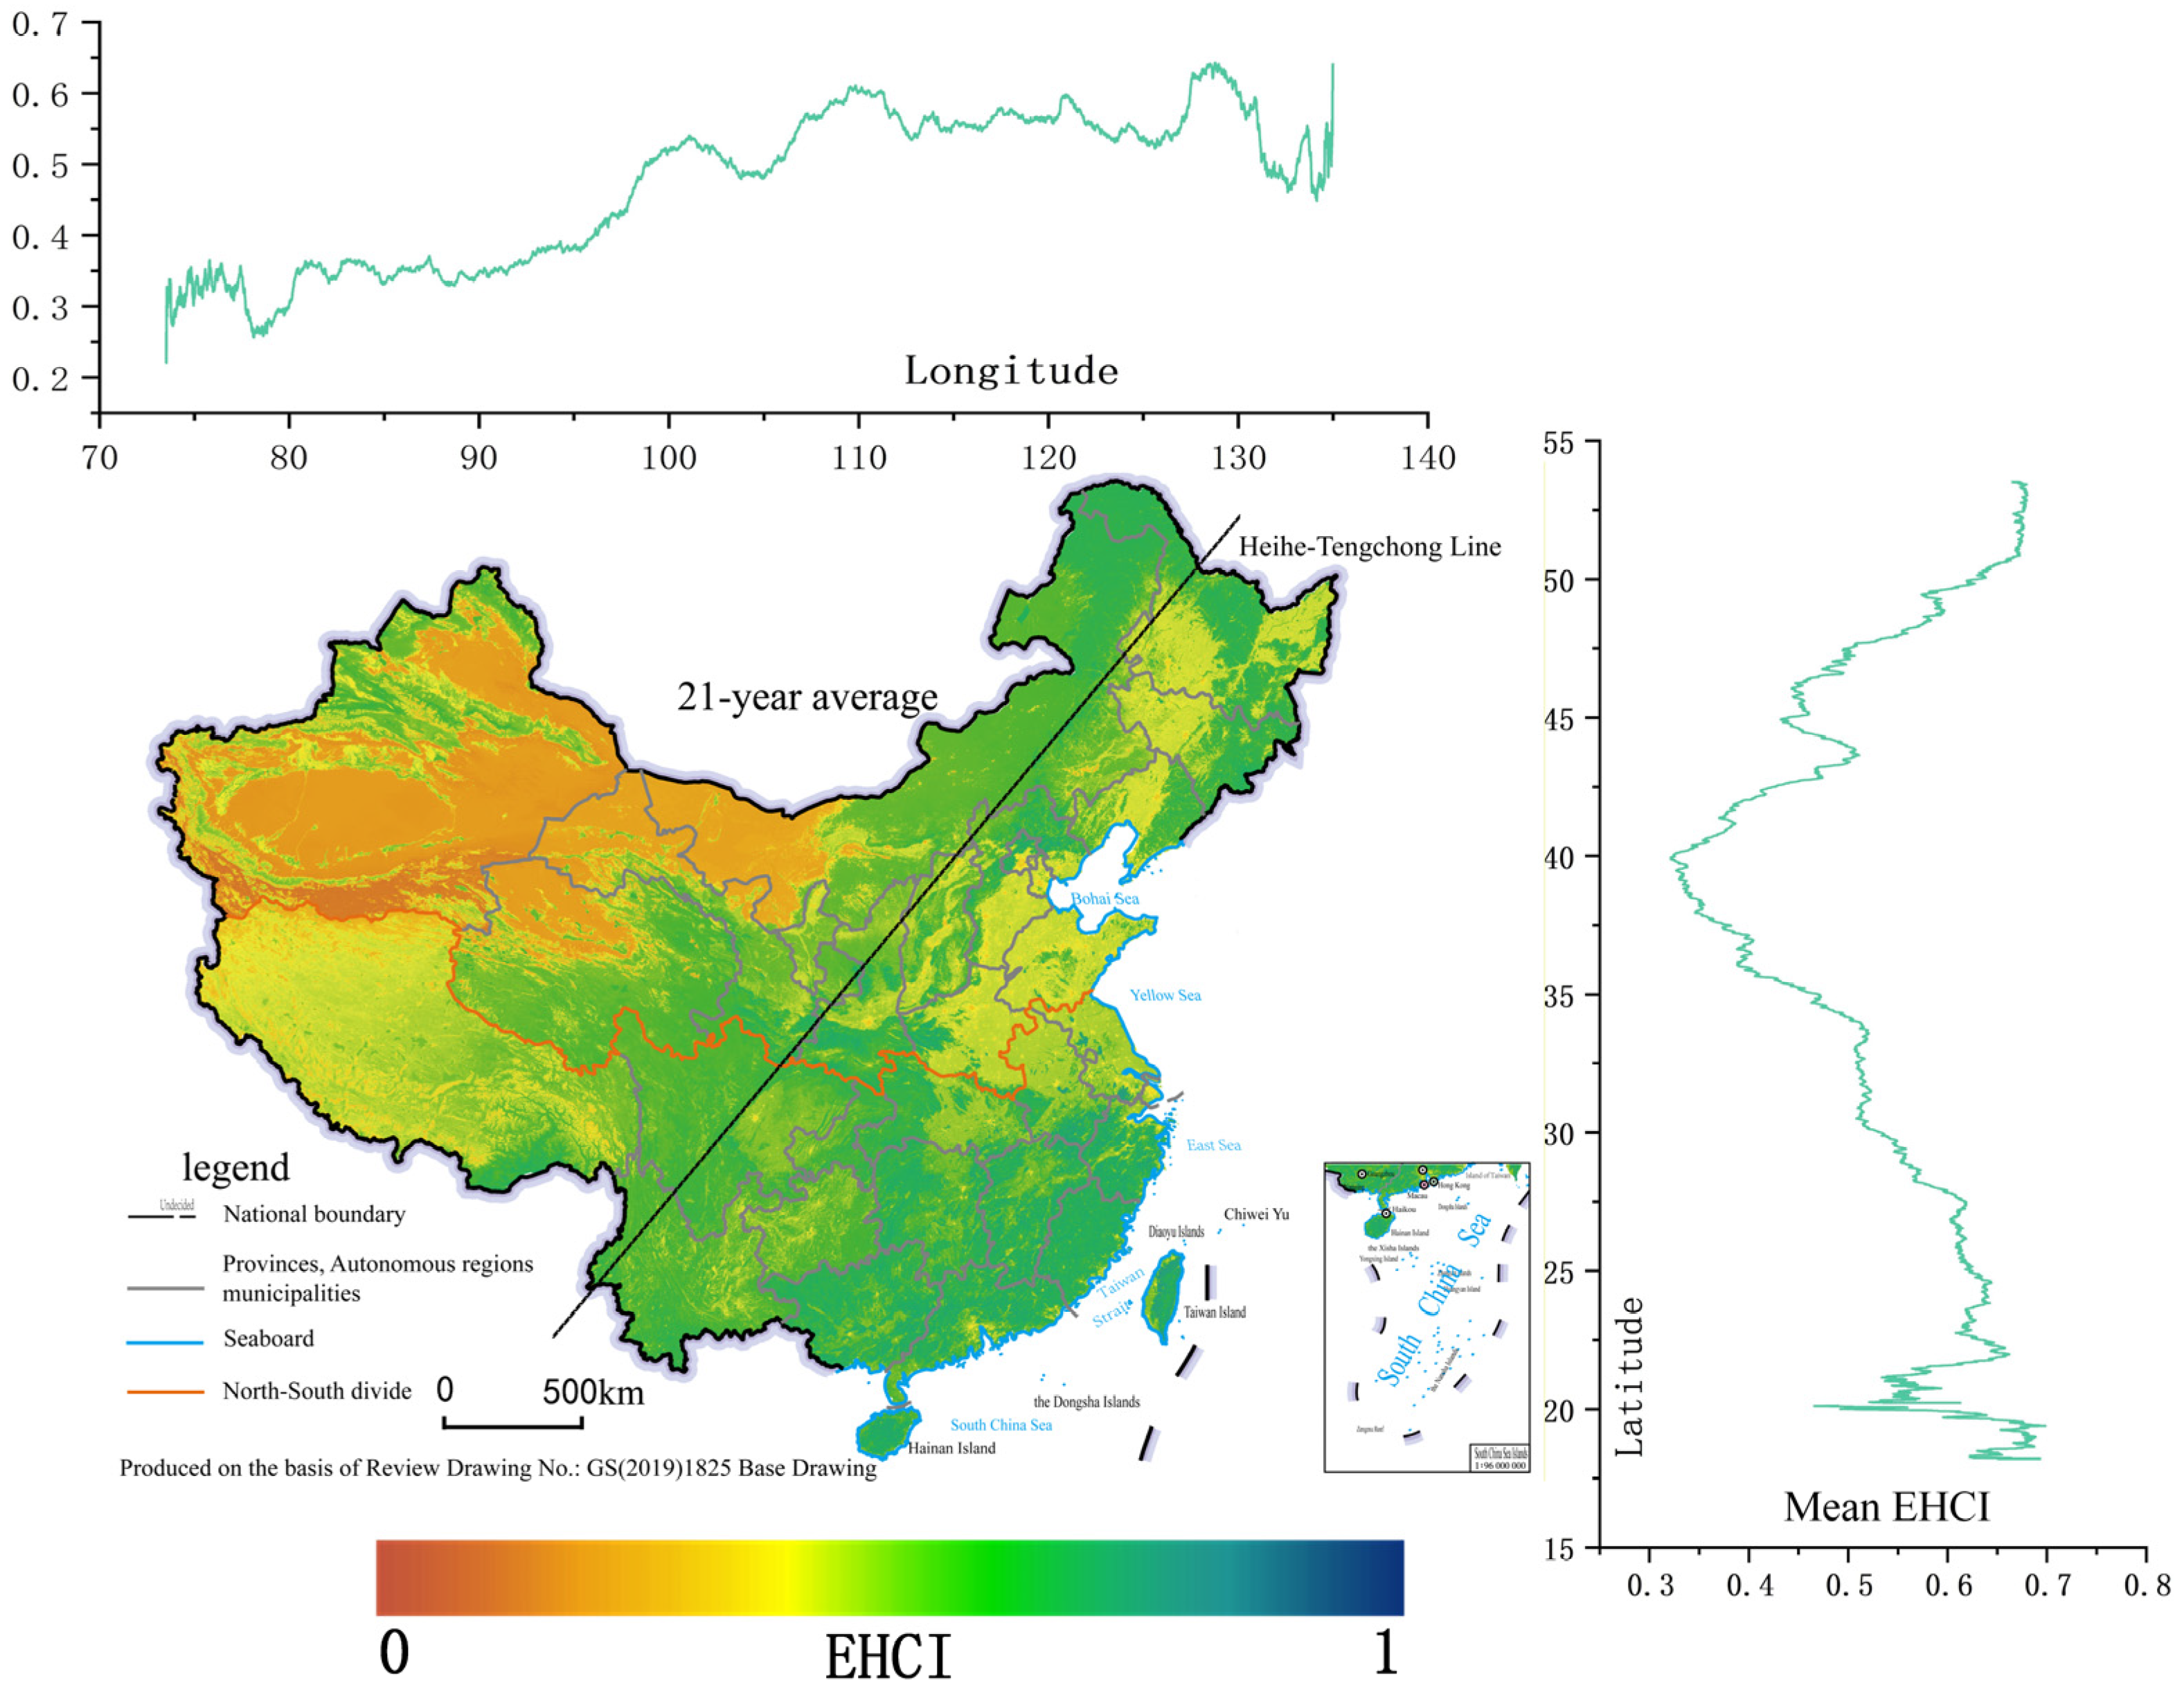
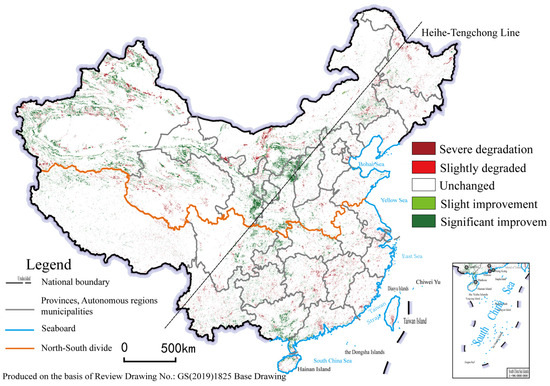
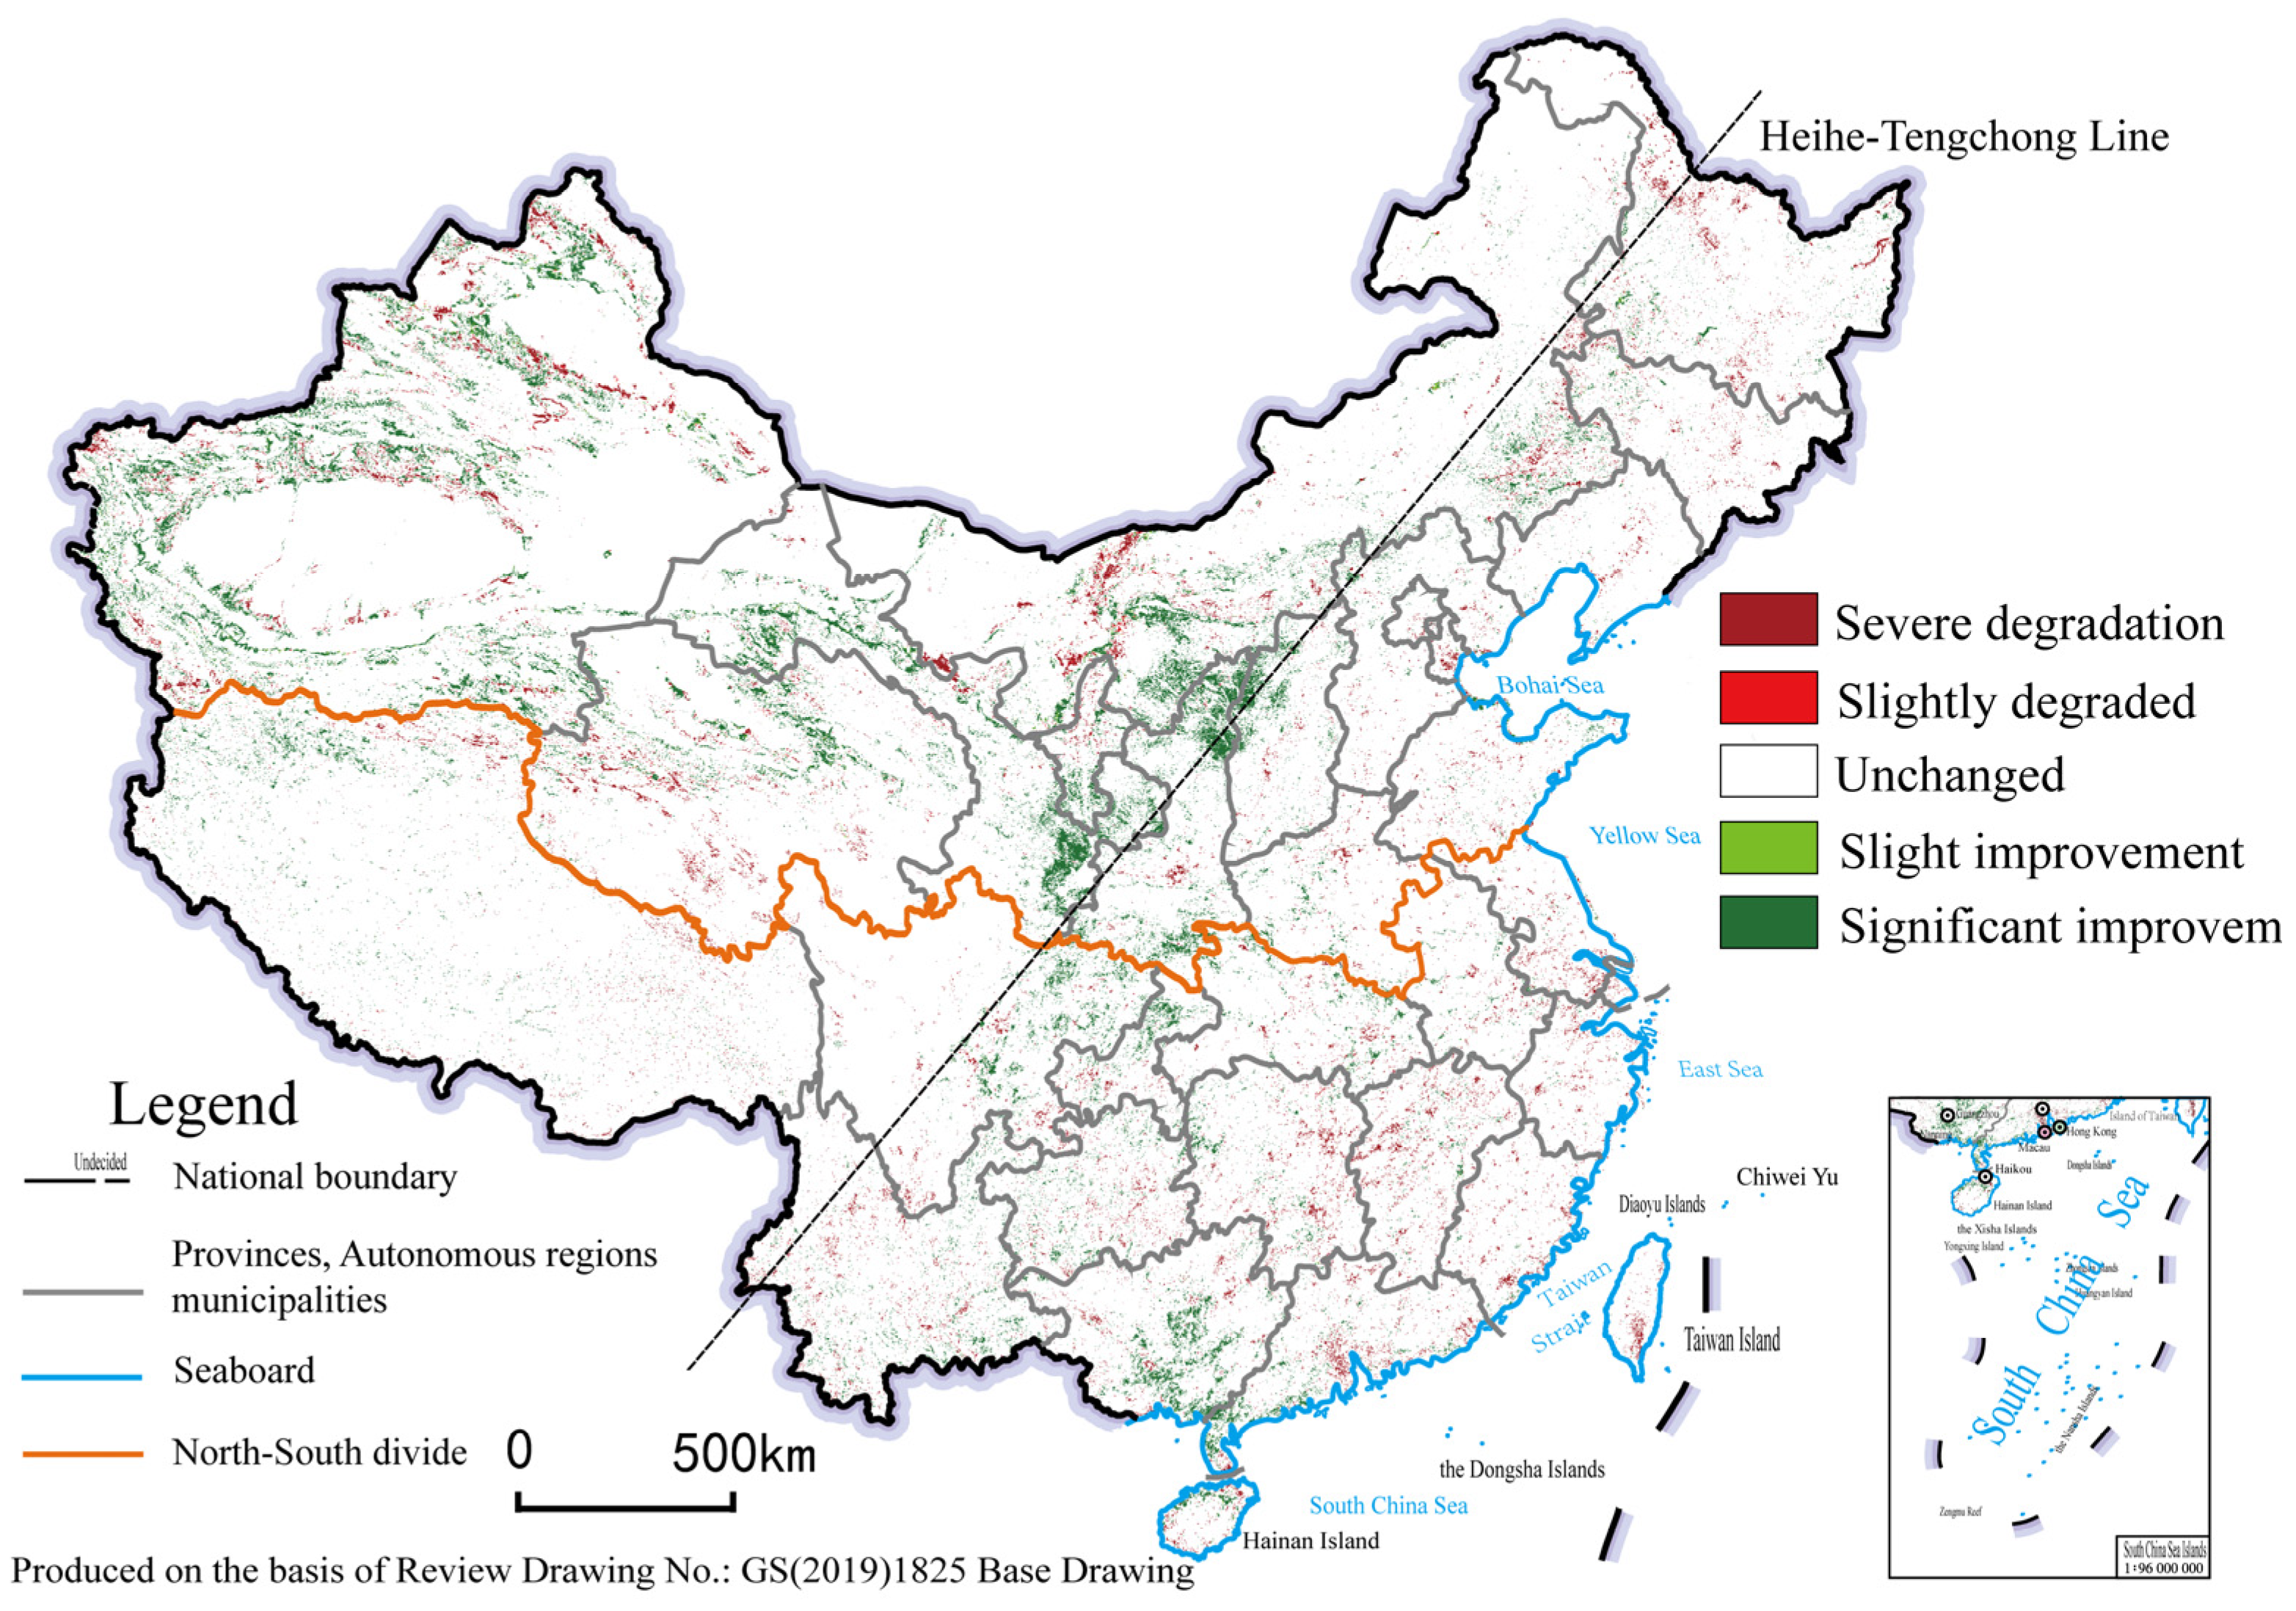
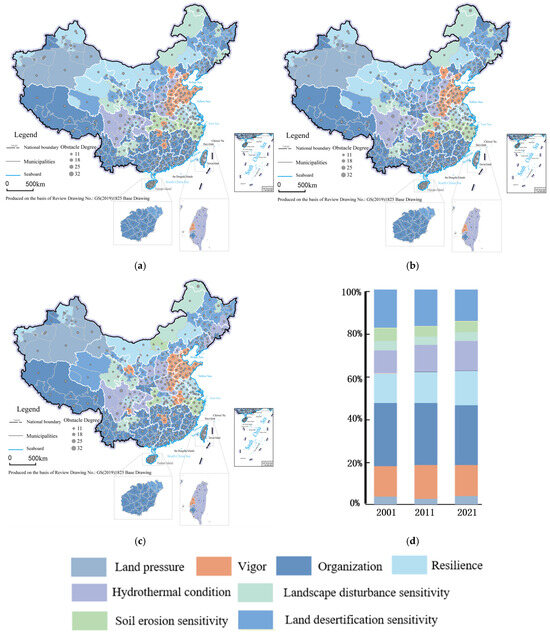
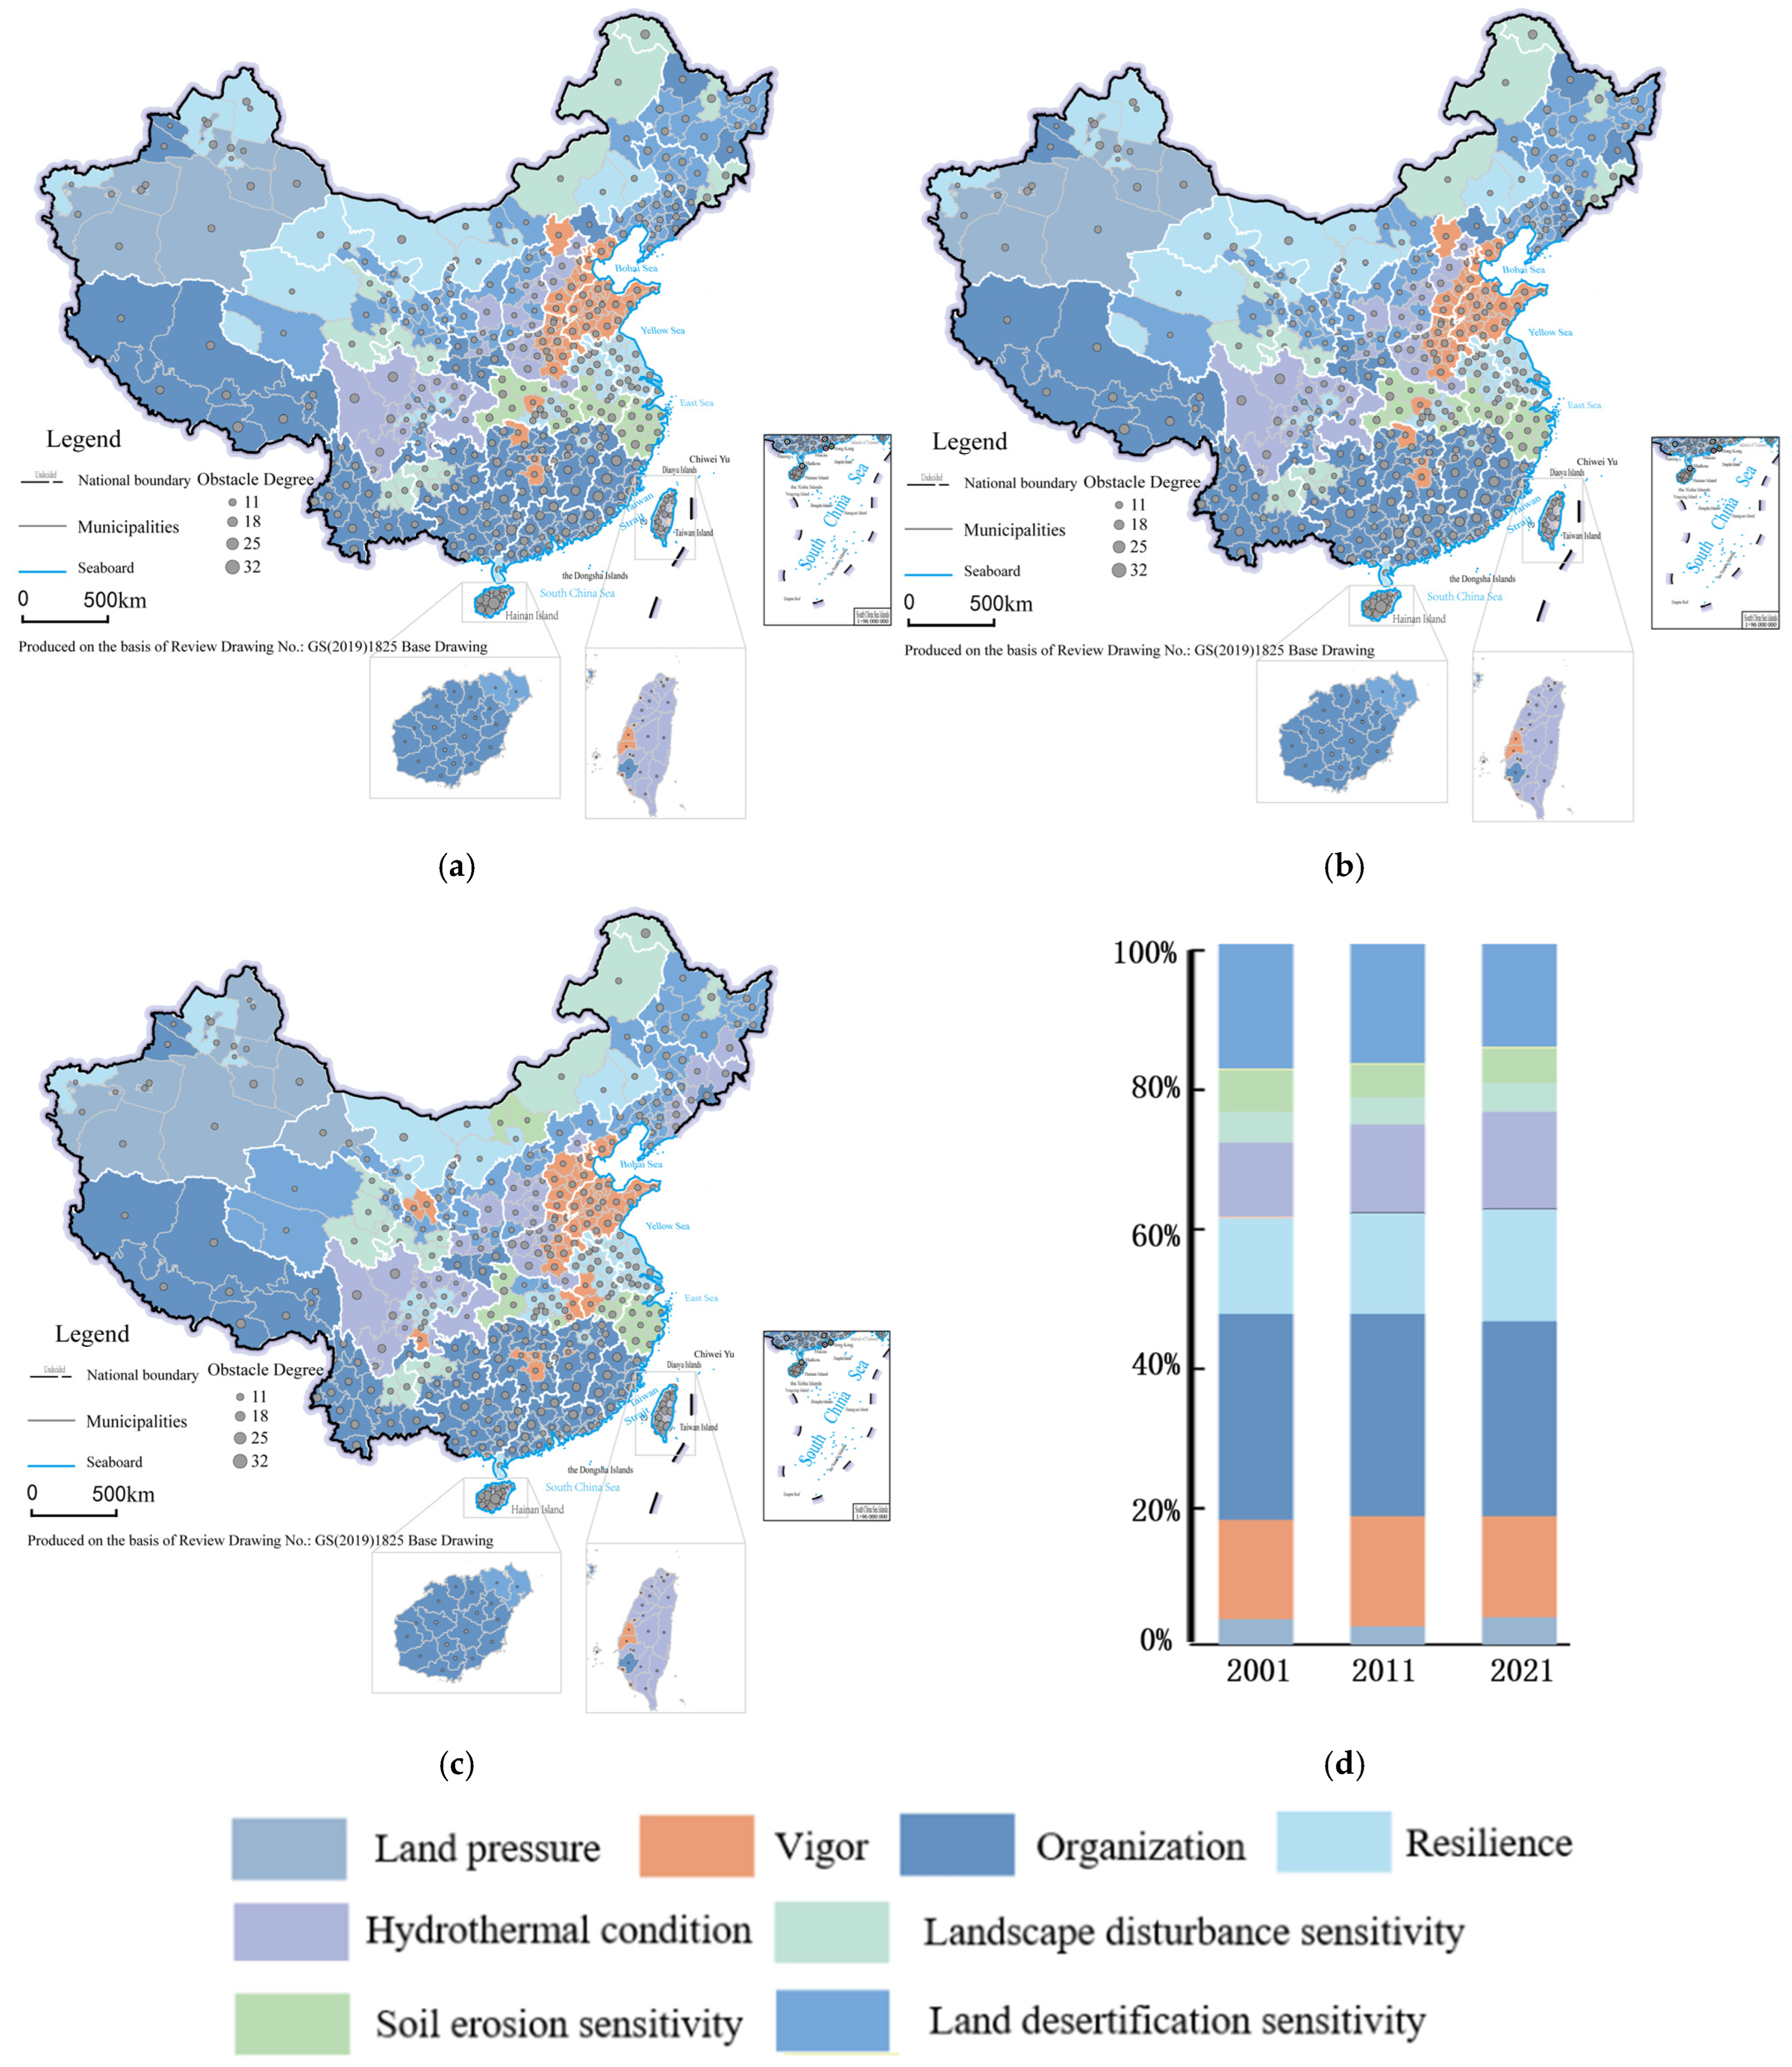
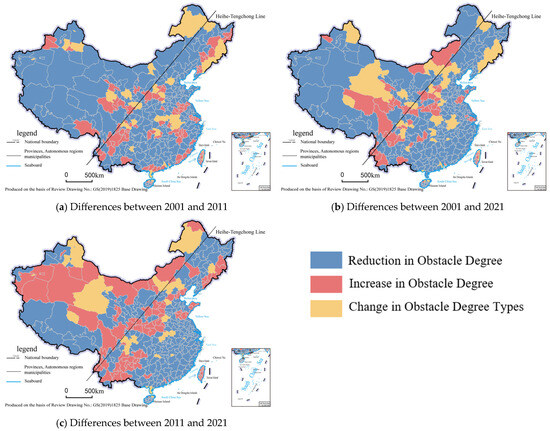
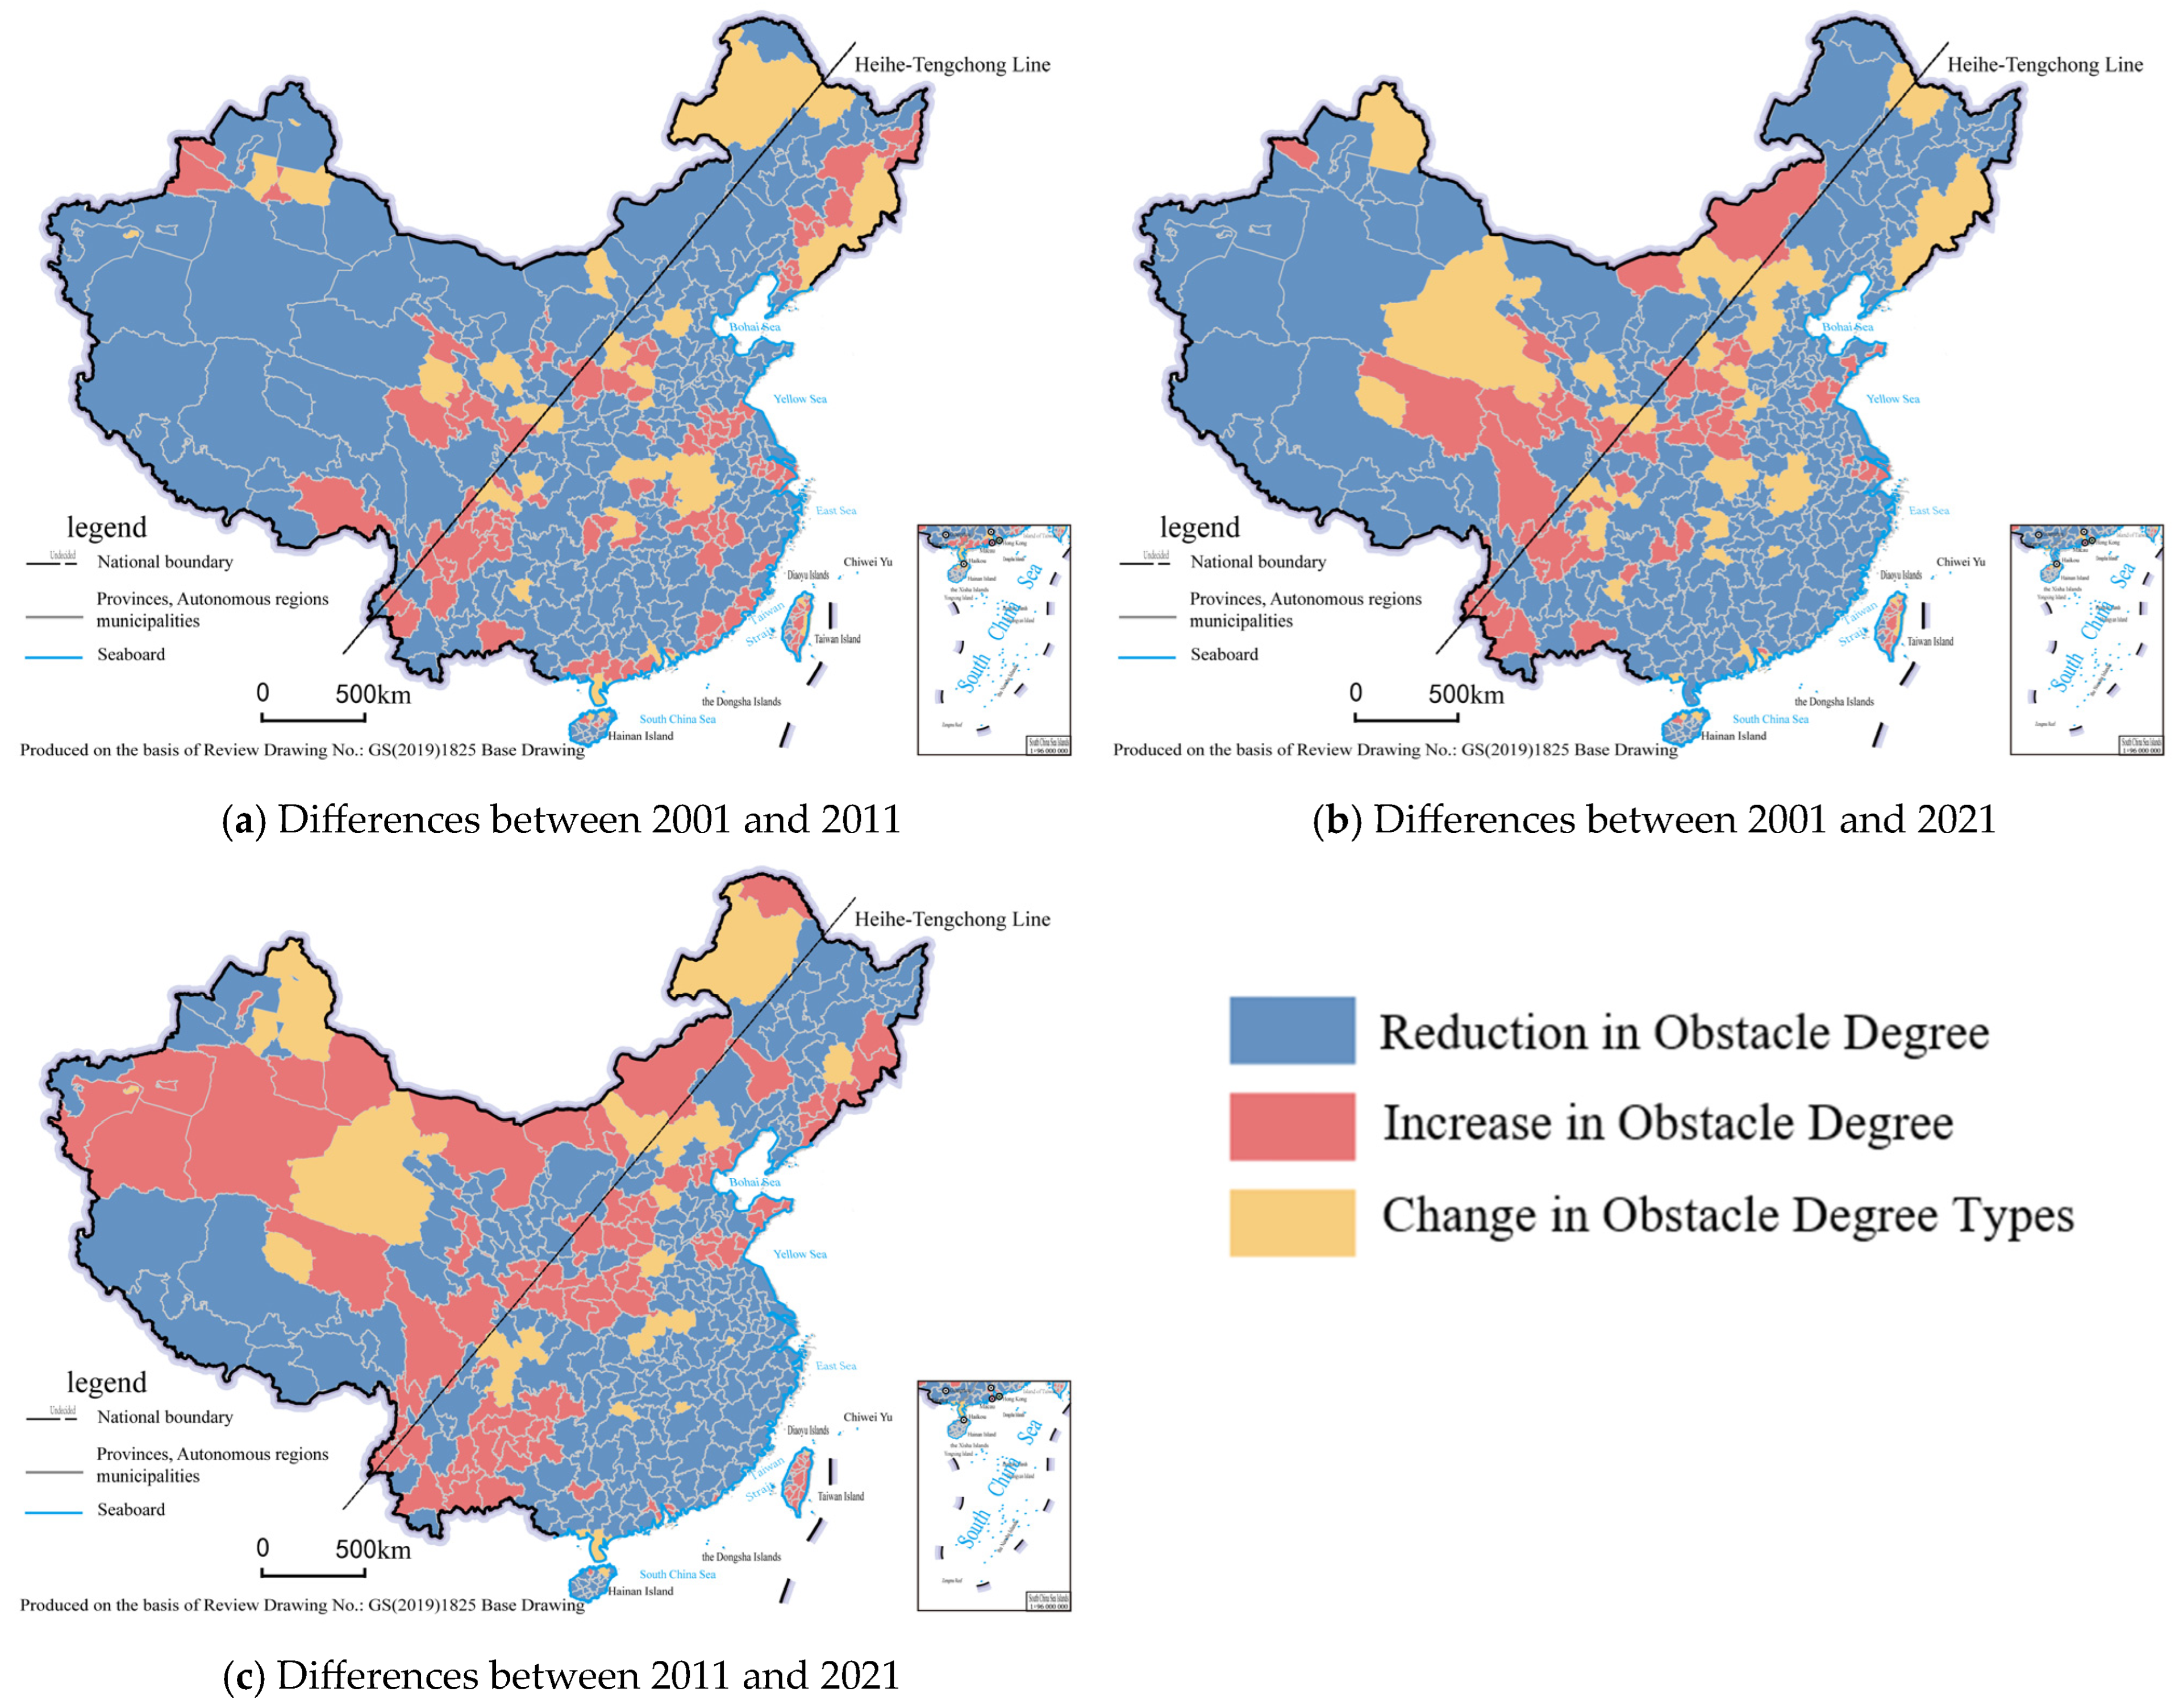
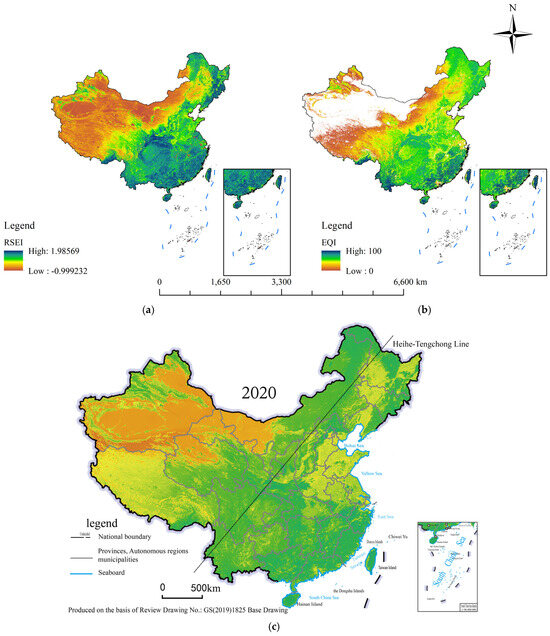
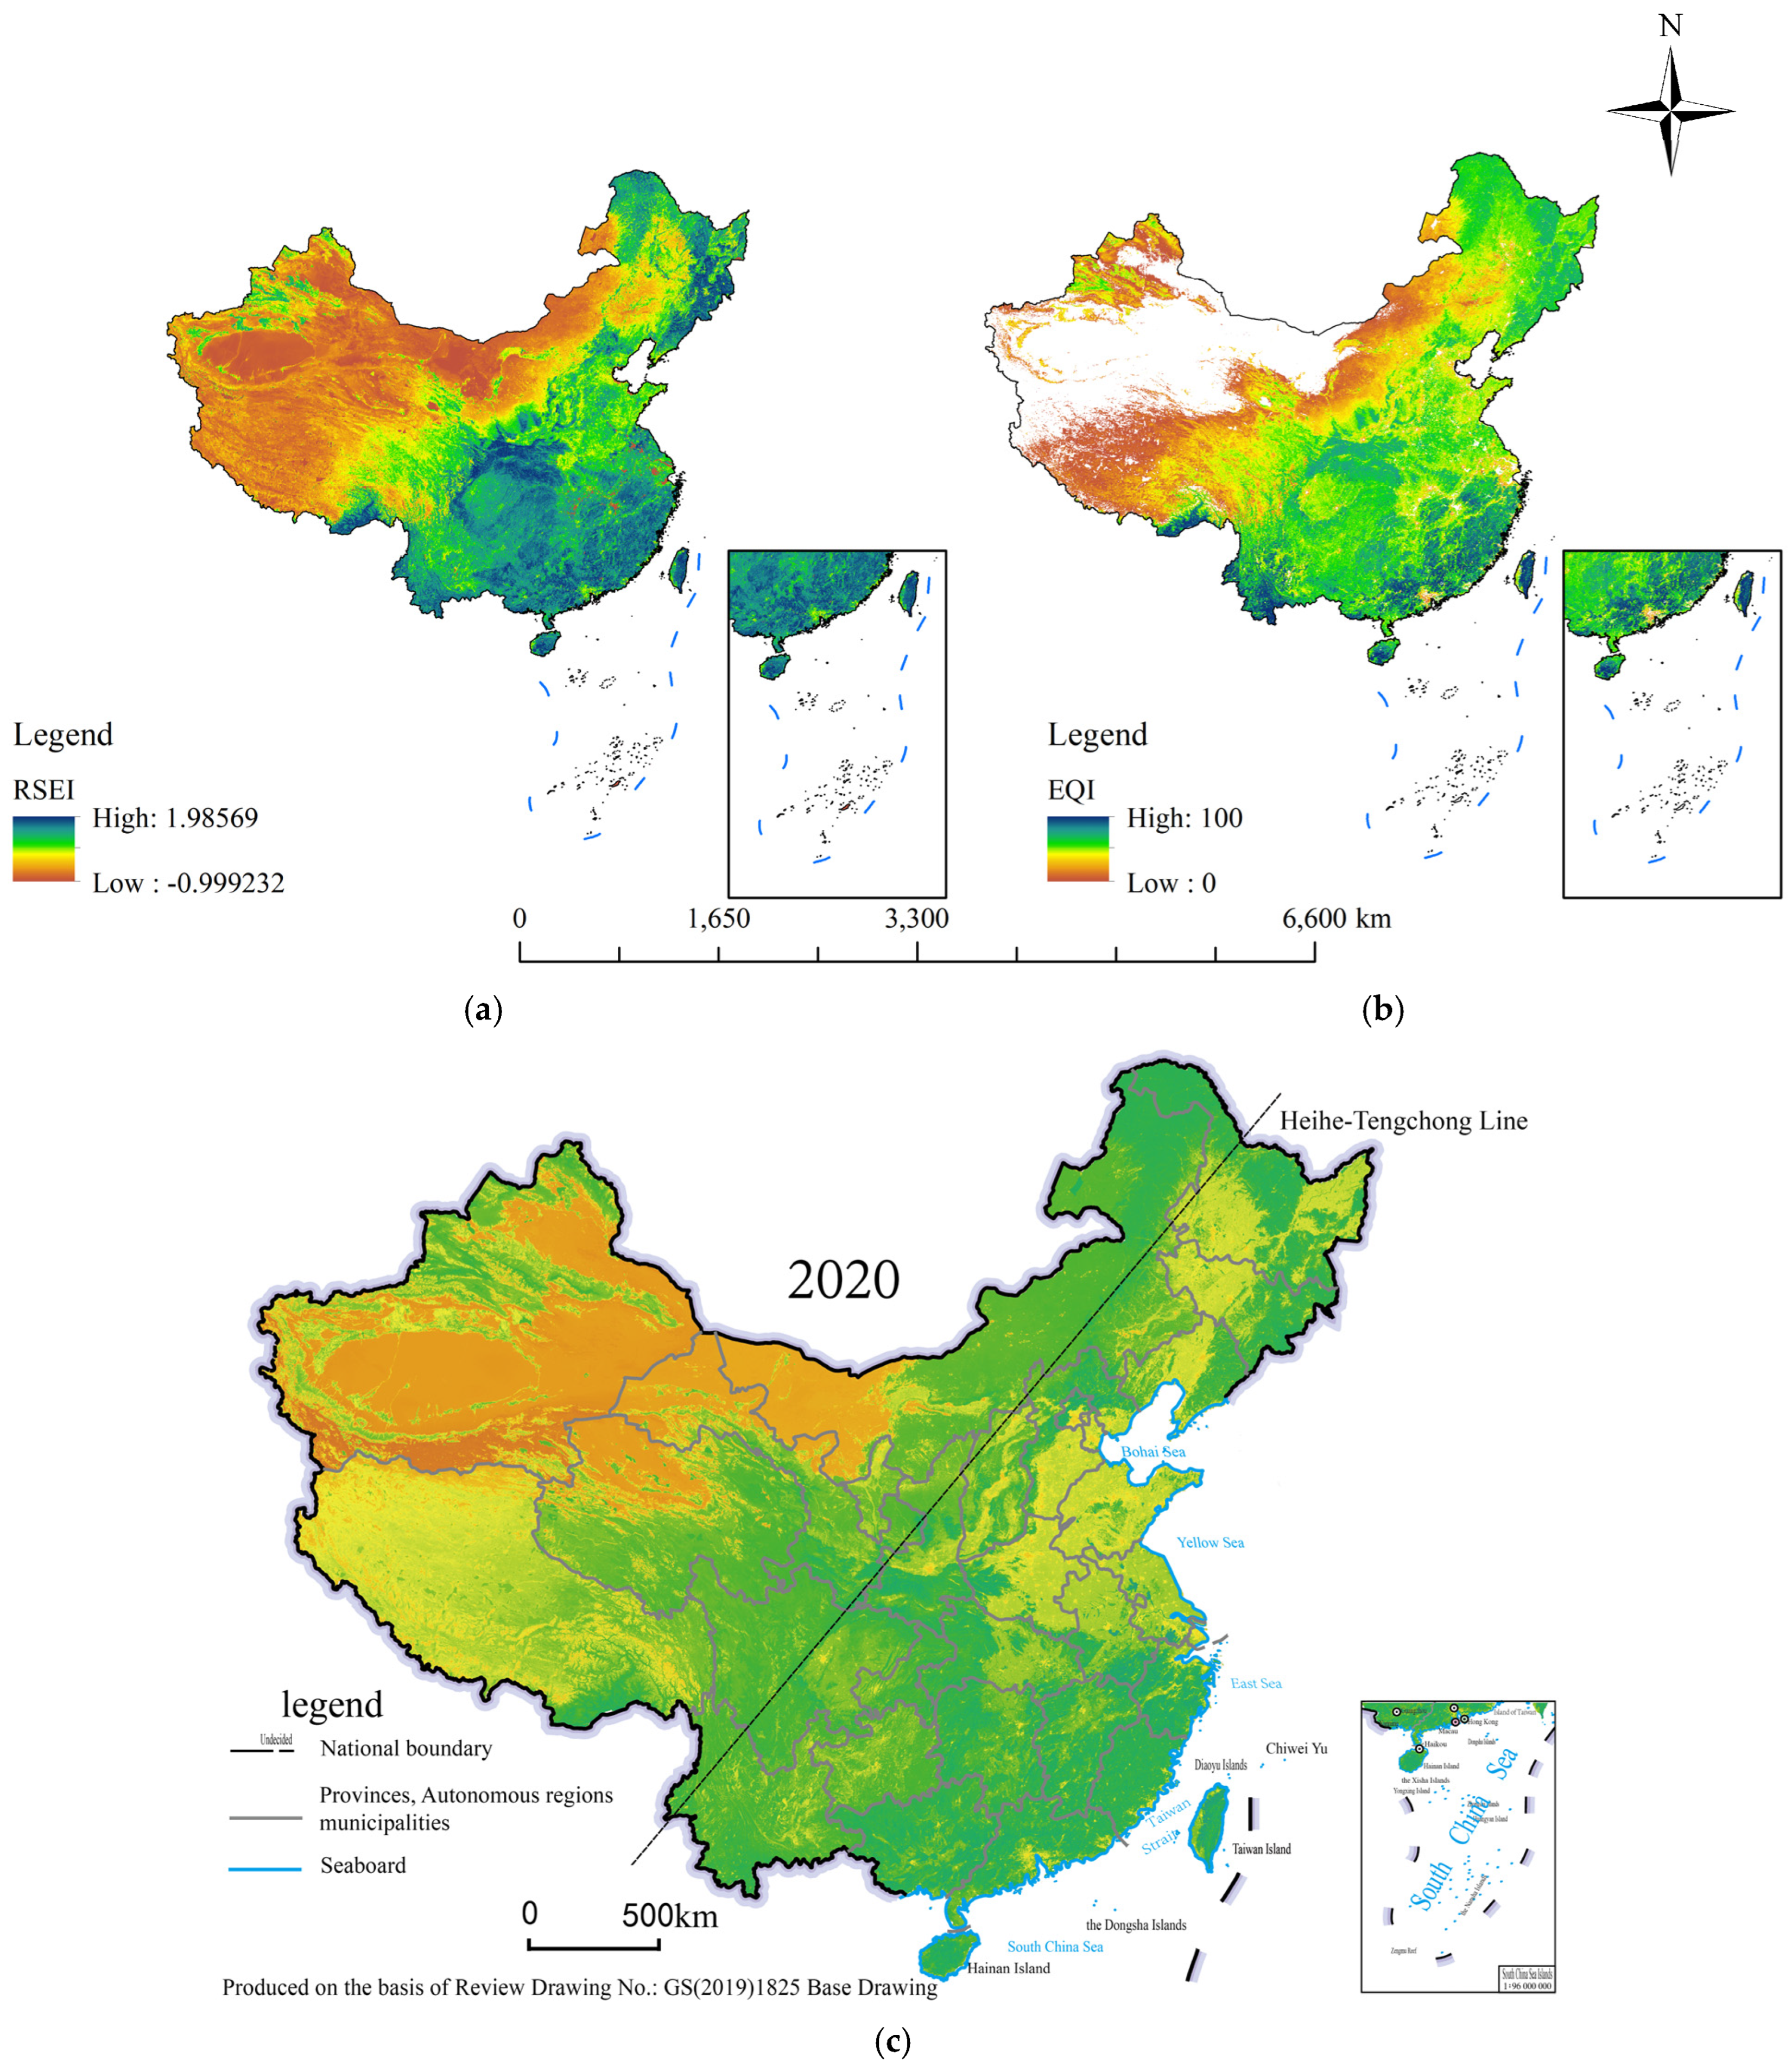

Disclaimer/Publisher’s Note: The statements, opinions and data contained in all publications are solely those of the individual author(s) and contributor(s) and not of MDPI and/or the editor(s). MDPI and/or the editor(s) disclaim responsibility for any injury to people or property resulting from any ideas, methods, instructions or products referred to in the content. |
© 2026 by the authors. Licensee MDPI, Basel, Switzerland. This article is an open access article distributed under the terms and conditions of the Creative Commons Attribution (CC BY) license.