Article

Local Climate Zone-Based Analysis of Urban Heat Island Influencing Factors in Coastal Cities Across Multiple Climate Zones

Information Science and Technology College, Dalian Maritime University, Dalian 116026, China
*
Author to whom correspondence should be addressed.
Remote Sens. 2026, 18(5), 762; https://doi.org/10.3390/rs18050762
Submission received: 3 January 2026 / Revised: 12 February 2026 / Accepted: 26 February 2026 / Published: 3 March 2026

Highlights

What are the main findings?
  • The spatial distribution of SUHII and the role of influencing factors in urban heat islands.
  • Coastal SUHII is regulated by land–sea interactions and nearshore marine cooling, with thermal responses varying by climate zone.
What are the implications of the main findings?
  • The findings advance the understanding of multi-scale drivers of coastal SUHI and provide a scientific basis for climate-adaptive urban planning strategies that optimize coastal morphology.
  • The results offer theoretical support for developing differentiated planning strategies in coastal cities and guiding the optimization of urban spatial elements to maximize the use of marine cooling effects.

Abstract

Rapid urbanization has intensified the Surface Urban Heat Island (SUHI) effect, which poses particular challenges for coastal cities where marine environments, climatic regulation, and distinctive urban morphology interact in complex ways. Current research on coastal SUHI remains limited, especially in terms of systematic analyses using the Local Climate Zone (LCZ) framework. Key gaps include insufficient cross-climate comparisons and limited understanding of spatial differentiation patterns linked to LCZ-based SUHI dynamics. This study employs LCZ classification to analyze coastal cities across diverse climatic backgrounds, integrating Pearson’s correlation analysis and coastal distance gradient zoning to investigate the spatio-temporal distribution and influencing factors of Surface Urban Heat Island Intensity (SUHII). The findings reveal that: (1) SUHII exhibits a distinct spatial pattern, with elevated intensities in built-up areas and reduced values in natural zones, alongside seasonally differentiated variations across climate zones. (2) The normalized difference built-up index (NDBI) and normalized difference vegetation index (NDVI) emerge as dominant drivers, exerting heating and cooling effects, respectively. Elevation alleviates SUHII, whereas anthropogenic factors dominate during summer. (3) Coastal SUHII is governed by dual regulatory mechanisms: land–sea interactions modulate spatial patterns, with NDVI cooling and NDBI heating effects amplifying with distance from the coastline, while nearshore marine regulation suppresses heat accumulation. Additionally, cities across different climatic zones exhibit distinct thermal responses, with vegetation cooling efficiency and building-induced heating intensity showing clear latitudinal gradients. These findings advance understanding of multi-scale drivers of coastal SUHI and provide a scientific basis for climate-adaptive urban planning strategies that optimize coastal morphology.

1. Introduction

With the rapid development of the global economy, the world has undergone accelerated urbanization [1]. According to UN-Habitat statistics, the proportion of the global population residing in urban areas increased from 30% in 1950 to 55% in 2018, and it is projected to reach 68% by 2050 [2]. Coastal areas, identified as regions experiencing swift urbanization, have exhibited dramatic urban expansion [3]. This growth has led to significant alterations in urban surface morphology and local climatic characteristics, thereby exacerbating the deterioration of urban thermal environments [4]. The urban heat island (UHI) effect, a complex phenomenon in urban climates, extends its impacts beyond mere meteorological concerns. It gives rise to various issues such as increased energy consumption and exacerbated air pollution [5,6]. Furthermore, the UHI-induced warming of the urban core increases turbulence and accelerates pollutant dispersion, while this effect also amplifies extreme heat events [7] with prolonged thermal stress conditions substantially heightening the risk of heat-related illnesses among residents. Such developments pose serious adverse effects on human health [8]. Therefore, acquiring a comprehensive understanding of the influencing factors behind UHI and mitigating their impacts through urban planning is crucial.
In urban thermal environment research, there is a consensus on the definition of the surface urban heat island (SUHI) effect as the significant temperature disparity in land surface temperature (LST) between urban and suburban areas [9]. In practical research applications, LST data retrieved from thermal infrared remote sensing imagery have emerged as a crucial data source. Surface Urban Heat Island Intensity (SUHII) has been established as the principal metric for quantifying the heat island effect [10]. Although the traditional urban–rural dichotomy has been extensively utilized in SUHII calculations [11], this approach often treats urban areas as homogeneous entities, which inadequately delineates urban–rural boundaries and overlooks the spatial heterogeneity present within intra-urban thermal environments. This limitation becomes increasingly pronounced in contexts characterized by rapid urbanization, where factors such as varying intensities of urban expansion and morphological differences complicate spatial differentiation within the thermal environment. Furthermore, existing restrictions related to spatio-temporal resolution significantly hinder comprehensive research efforts [12]. To address these challenges, Stewart and Oke proposed the Local Climate Zone (LCZ) classification system [13]. This system systematically integrates multidimensional elements, including surface cover characteristics, three-dimensional building morphology, and human activity intensity. It categorizes urban areas into 10 built types and seven natural types, thereby providing a standardized classification framework for urban climate research [14]. Within this framework, LCZ-B/D (sparsely built/low plant areas), due to their inherent natural attributes, are often selected as reference zones. The LCZ framework has been widely applied in heat island studies, for instance, in analyzing multi-scale relationships between land surface temperature and heat island intensity, quantifying the nonlinear thermal effects of urban characteristics, assessing the spatiotemporal differentiation of thermal comfort, and facilitating the simulation and validation of urban climate models [15,16,17,18,19,20,21]. The temporal dimensions of related research have also been extended to multiple scales, such as inter-annual, seasonal, monthly, and diurnal variations [22,23,24,25].
Current studies have systematically elucidated the multidimensional influencing factors underlying urban heat island effects. Concerning the surface characteristics, studies consistently demonstrate that vegetation cover, characterized by the Normalized Difference Vegetation Index (NDVI), exerts significant cooling effects [26], whereas impervious surfaces, indicated by the Normalized Difference Built-up Index (NDBI), are key factors contributing to elevated land surface temperature (LST) [27]. The role of topographic factors in influencing heat island effects has also garnered empirical support; notably, Steeneveld et al. find that low-altitude areas were more prone to exhibit pronounced heat island phenomena [28]. In terms of human activities, analyses conducted on 419 major Chinese cities and urban agglomerations have established a significant positive correlation between nighttime light intensity (NL) and SUHII [29,30]. This finding aligns with conclusions drawn by Sun et al. [31] and Qiao et al. [32], which similarly highlight a positive relationship between human activities and SUHII. Collectively, these findings construct a comprehensive cognitive framework regarding SUHI mechanisms that encompasses “surface characteristics-topographic environment-human activities”.
According to statistics, over 40% of the global population resides in coastal cities [3,33], with more than 65% of urban areas exceeding 2.5 million inhabitants situated in these areas. As the most densely populated and economically active locales, coastal cities encounter distinct and pressing challenges associated with UHI effects. In addressing this threat, coastal cities benefit from several unique mitigation advantages. On one hand, oceans provide natural cooling potential through mechanisms such as sea breezes [34,35]. The seawater exhibits substantial cooling effects attributed to its high evapotranspiration capacity and thermal mass [36,37,38]. On the other hand, urban morphological characteristics significantly influence the efficiency of marine influence penetration [39]. Current research has revealed the status and mechanisms of the urban heat island effect in coastal areas. Fu et al. employed high-resolution numerical simulations and observational analyses to reveal the interaction mechanisms between the urban heat island effect and sea breeze front weather systems in Shanghai [40]. Luis Díaz-Chávez et al. utilized a multi-method approach combining remote sensing observations and numerical simulations (WRF/UCM models) to systematically elucidate the spatio-temporal evolution of UHI in coastal cities of northern Colombia from 2016 to 2021. Their findings indicated that the expansion and intensification of built-up areas exacerbated differences in surface and near-ground air temperatures [41]. Rajeswari et al., based on high-resolution land use data and multi-city parameterization schemes (WRF model), revealed significant urban heat island and daytime cool island effects in the Doha region during both winter and summer amidst rapid urbanization. Their study also validated the superiority of building energy models in simulating urban thermal environments [42].
Current studies on urban heat islands in coastal cities based on the LCZ framework still have some limitations. Most existing studies have been confined to coastal cities within a single climate zone, lacking systematic comparative analyses of heat island effects across different climate zones. Martinelli et al., through multi-site observational data analysis in Bari, quantified the influence of LCZ characteristics on the heat island effect in a Mediterranean coastal city [43]. Sheng et al. integrated multi-source remote sensing with field observations to reveal the seasonal differences and spatial heterogeneity of outdoor thermal comfort across various LCZs in the cold coastal city of Dalian [44]. A study on the temperate coastal city of Cardiff, by analyzing the relationship between LCZs and surface thermal environment indicators, found that compact and high-density built-up areas exhibit significantly stronger heat island effects than open areas, demonstrating that increasing greenery and open spaces is an effective morphological strategy to mitigate thermal risks in temperate cities [45]. Additionally, Yang et al., taking Shanghai as a case study, revealed the differential impacts of urban ventilation conditions and sea breezes on the synergistic effects of the urban heat island and heatwaves across different LCZs, highlighting the significant mitigating effect of sea breezes on heatwaves in coastal areas [46]. To address these issues, this study selects Dalian, Xiamen, Miami, Rio de Janeiro, and Singapore–representative cities of the temperate zone, subtropical zone, sub-equatorial zone, tropical zone, and equatorial zone, respectively–as research subjects for a comprehensive analysis of the spatio-temporal differentiation patterns of their heat island effects. By establishing a coastal gradient analysis framework, this research investigates how the impacts of key influencing factors on SUHII change with the distance from the coast.
The findings will provide theoretical foundations for developing differentiated planning strategies in coastal cities and guide optimization efforts regarding urban spatial elements to maximize the utilization of marine cooling effects.

2. Study Area and Methods

2.1. Study Area

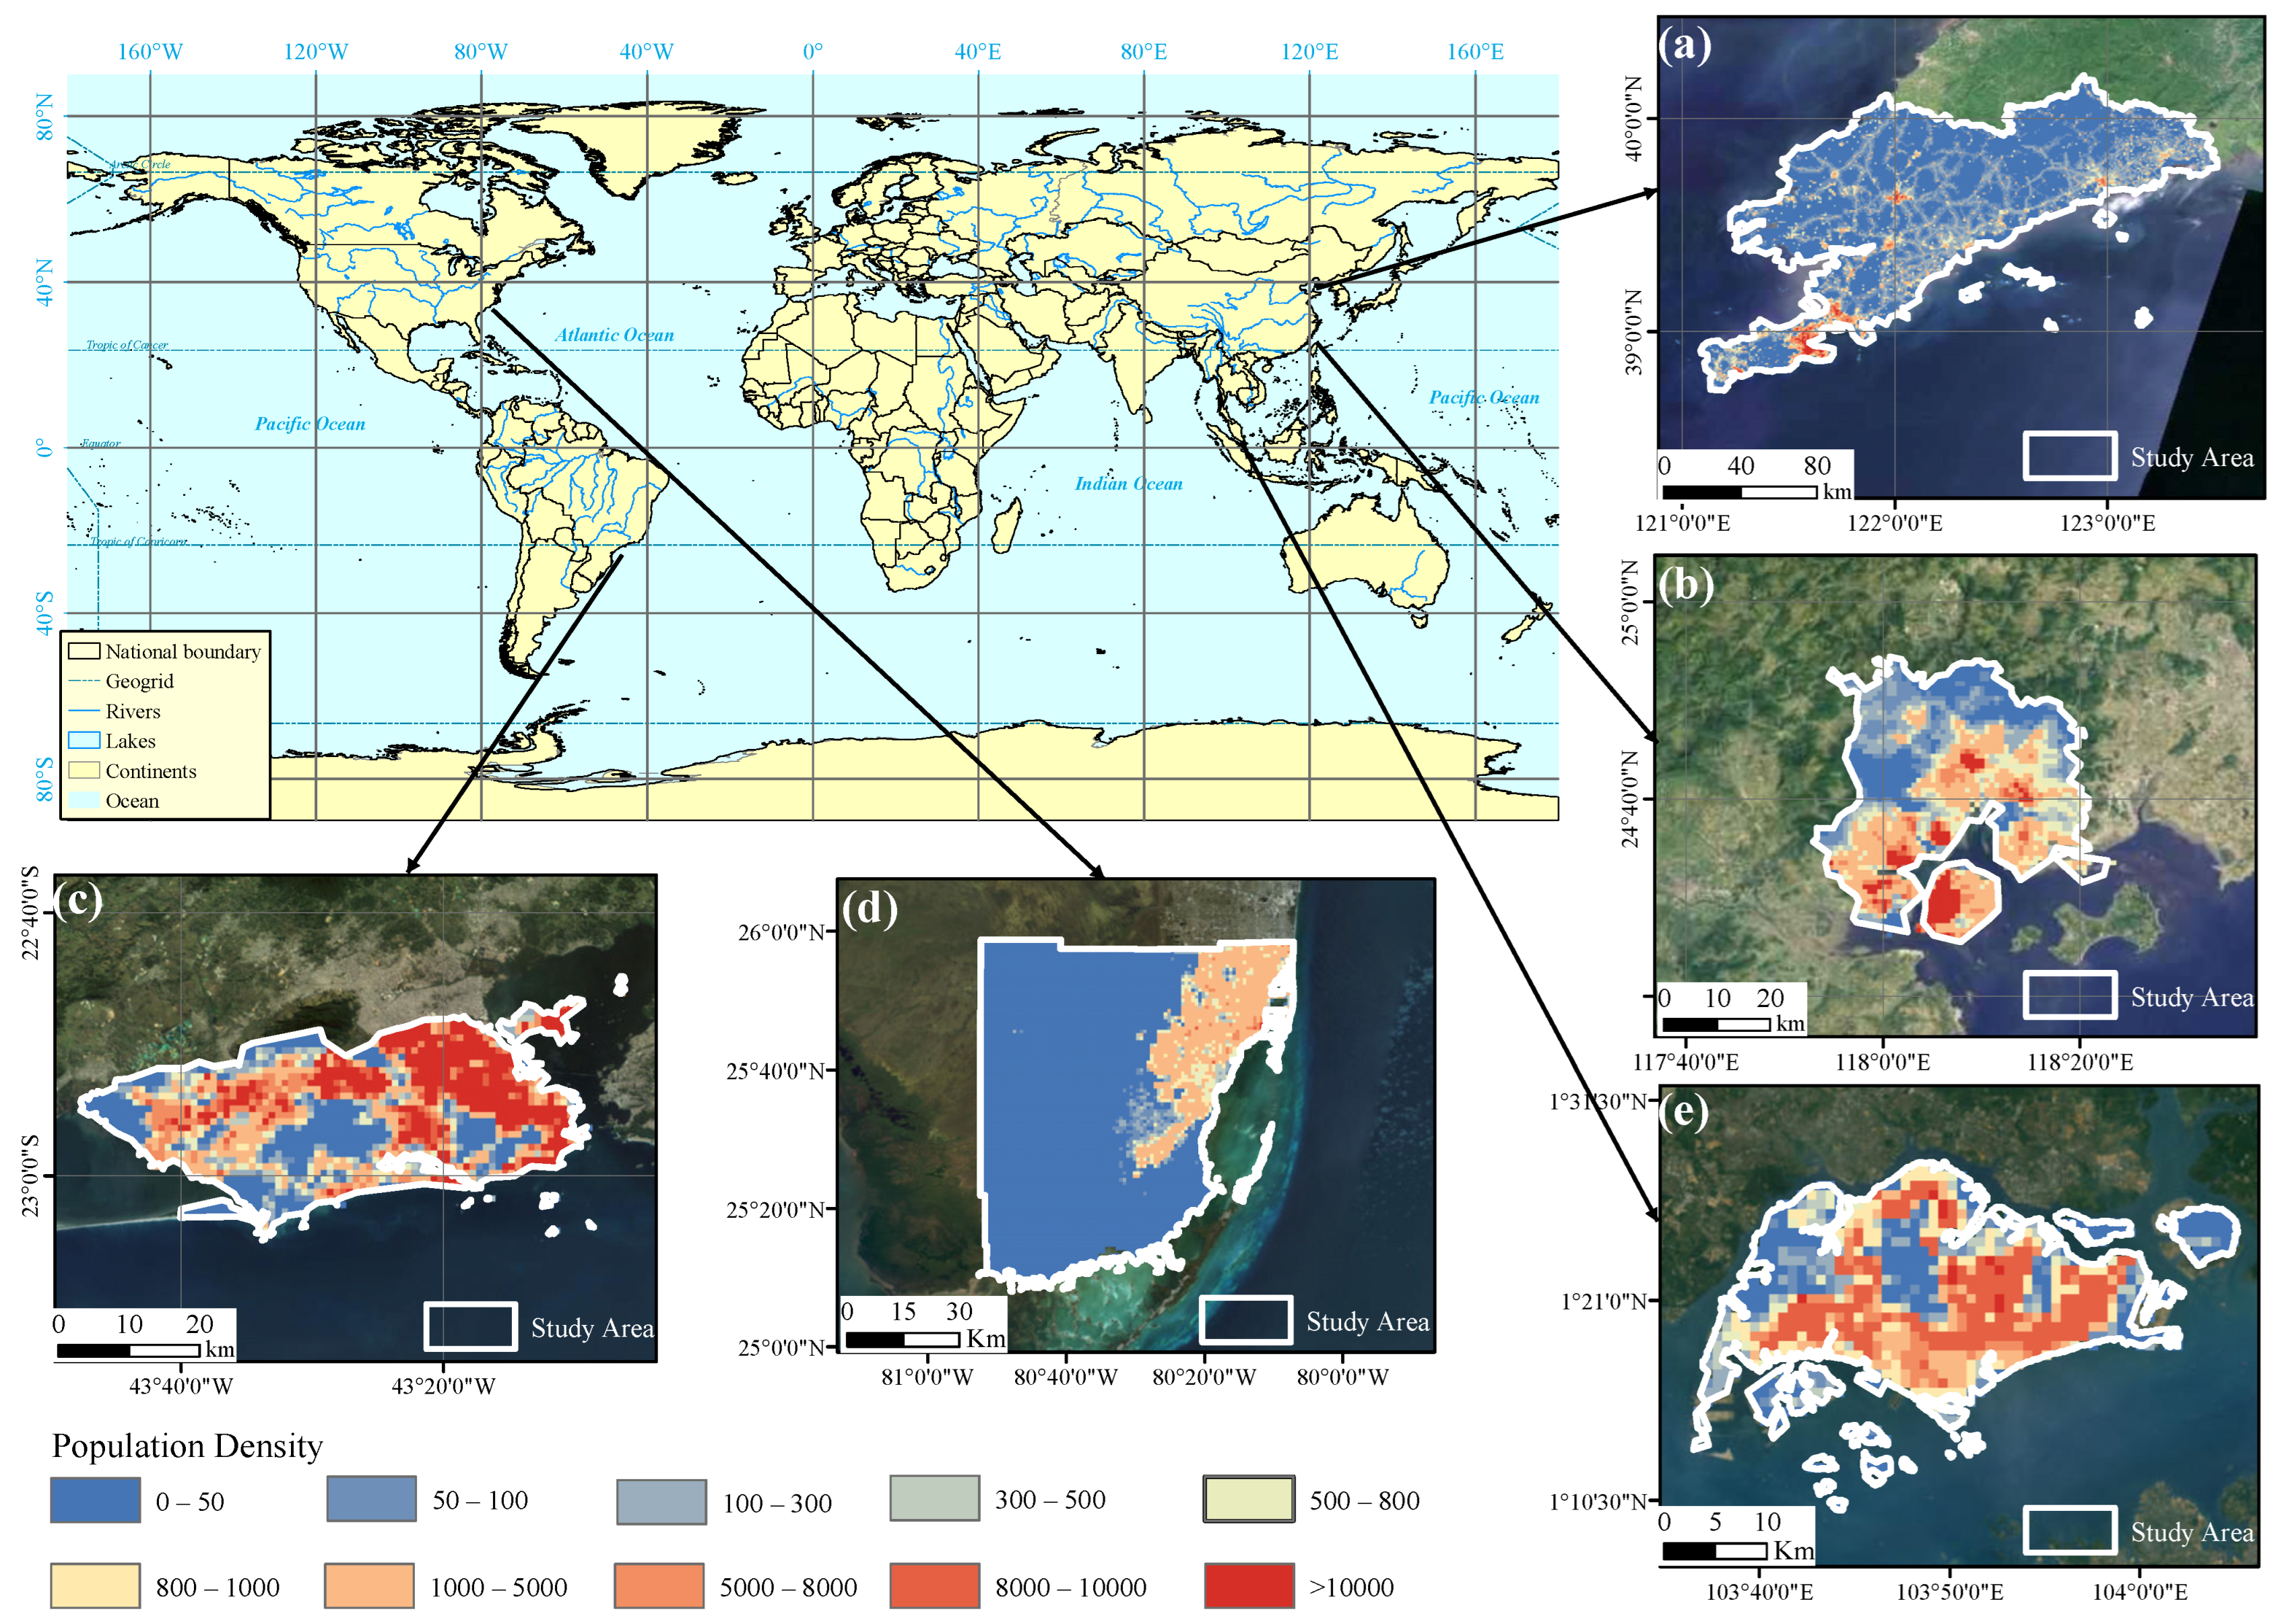
This study selects three representative coastal areas—Dalian (China), Xiamen (China), Rio de Janeiro (Brazil), Miami (USA), and Singapore (Singapore) as research subjects to systematically investigate the SUHII in coastal environments (as shown in Figure 1). These cities share typical coastal characteristics while exhibiting distinct geographical locations, climate types, and urban morphologies: Dalian is located at the southern tip of the Liaodong Peninsula (38°43′–40°10′N, 120°58′–123°31′E), surrounded on three sides by the Yellow Sea and Bohai Sea. It experiences a temperate monsoon climate with four distinct seasons. Xiamen lies along the southeastern coast of Fujian Province (24°23′–24°54′N, 118–118°2′E) and comprises Xiamen Island along with surrounding islets, exhibiting characteristics of a subtropical marine monsoon climate. Rio is situated on the southeastern coast of Brazil (22°8′–23°S, 43°2′–43°4′W), nestled between mountains and the ocean, featuring a composite climate of tropical monsoon and tropical savanna. Miami is situated in the southeastern part of Florida, USA (approximately 25°45′N, 80°11′W), at the southern end of the Florida Peninsula, adjacent to Biscayne Bay and the Atlantic Ocean. It experiences a transitional climate from tropical monsoon to tropical rainforest, characterized by warm and humid conditions year-round with relatively distinct wet and dry seasons. Miami is a highly internationalized coastal metropolis. Singapore is located at the southern tip of the Malay Peninsula (1°09′–1°29′N, 103°36′–104°E), consisting of the main island of Singapore and approximately 63 smaller islands. It has a typical tropical rainforest climate with year-round high temperatures and abundant rainfall, coupled with highly dense urbanization. Despite their differing climate types, all five areas display notable land–sea interaction patterns: Dalian exhibits a peninsula morphology surrounded by water on three sides; Xiamen is a typical archipelago city; Rio combines complex mountainous and coastal terrain; Miami reflects a composite peninsula-bay geographical structure; and Singapore is a highly developed tropical island city-state. As these areas undergo rapid urbanization, their coastal areas are facing increasingly prominent thermal environmental challenges. This provides valuable comparative cases for investigating the formation mechanisms and spatial characteristics of SUHII under different climatic contexts.

2.2. Data Source

As shown in Table 1, the LCZ data employed in this study are obtained from the World Urban Database and Access Portal Tools (WUDAPT) official repository (https://www.wudapt.org/, accessed on 10 May 2024). This repository provides a globally consistent, 100 m-resolution LCZ dataset alongside continental-scale LCZ thematic maps, all generated using a standardized classification system for characterizing urban form and surface cover. Landsat 8 satellite imageries–comprising multispectral reflectance bands essential for land surface feature extraction and analysis–are acquired from the Earth Resources Observation and Science (EROS) Center of the U.S. Geological Survey (USGS), the official distribution platform for Landsat series data, where all imagery undergoes rigorous geometric and radiometric calibration. Road network data–including detailed attributes on road class, spatial distribution, and topological connectivity–is sourced from OpenStreetMap (OSM), a collaborative, open-access geospatial platform renowned for its high spatial resolution and timely updates of urban transportation infrastructure. Nighttime light imagery–employed to quantify spatiotemporal patterns of urban human activity intensity and built-up area expansion–is obtained from the Earth Observation Group (EOG) at the Payne Institute, Colorado School of Mines (https://payneinstitute.mines.edu/eog/, accessed on 2 June 2024). The EOG specializes in producing high-precision nighttime light and thermal anomaly products derived from Visible Infrared Imaging Radiometer Suite (VIIRS) and Defense Meteorological Satellite Program (DMSP) sensor data. The Digital Elevation Model (DEM) data–providing topographic elevation information for the study areas at a consistent spatial resolution and with standardized georeferencing–are obtained from the NASA Earthdata platform (https://www.earthdata.nasa.gov/, accessed on 10 May 2024), the official gateway to NASA’s comprehensive archive of Earth observation geospatial data, including topographic, atmospheric, and land surface remote sensing products. Global population data–including high-resolution gridded population count and population density datasets that capture fine-scale spatial demographic distributions–are acquired from the WorldPop project (https://hub.worldpop.org/, accessed on 10 May 2024), a leading open-access spatial demographic data platform. WorldPop develops peer-reviewed, high-resolution geospatial population estimates through integrated approaches combining national census data, microcensus surveys, and spatiotemporal modeling techniques.

3. Methodology

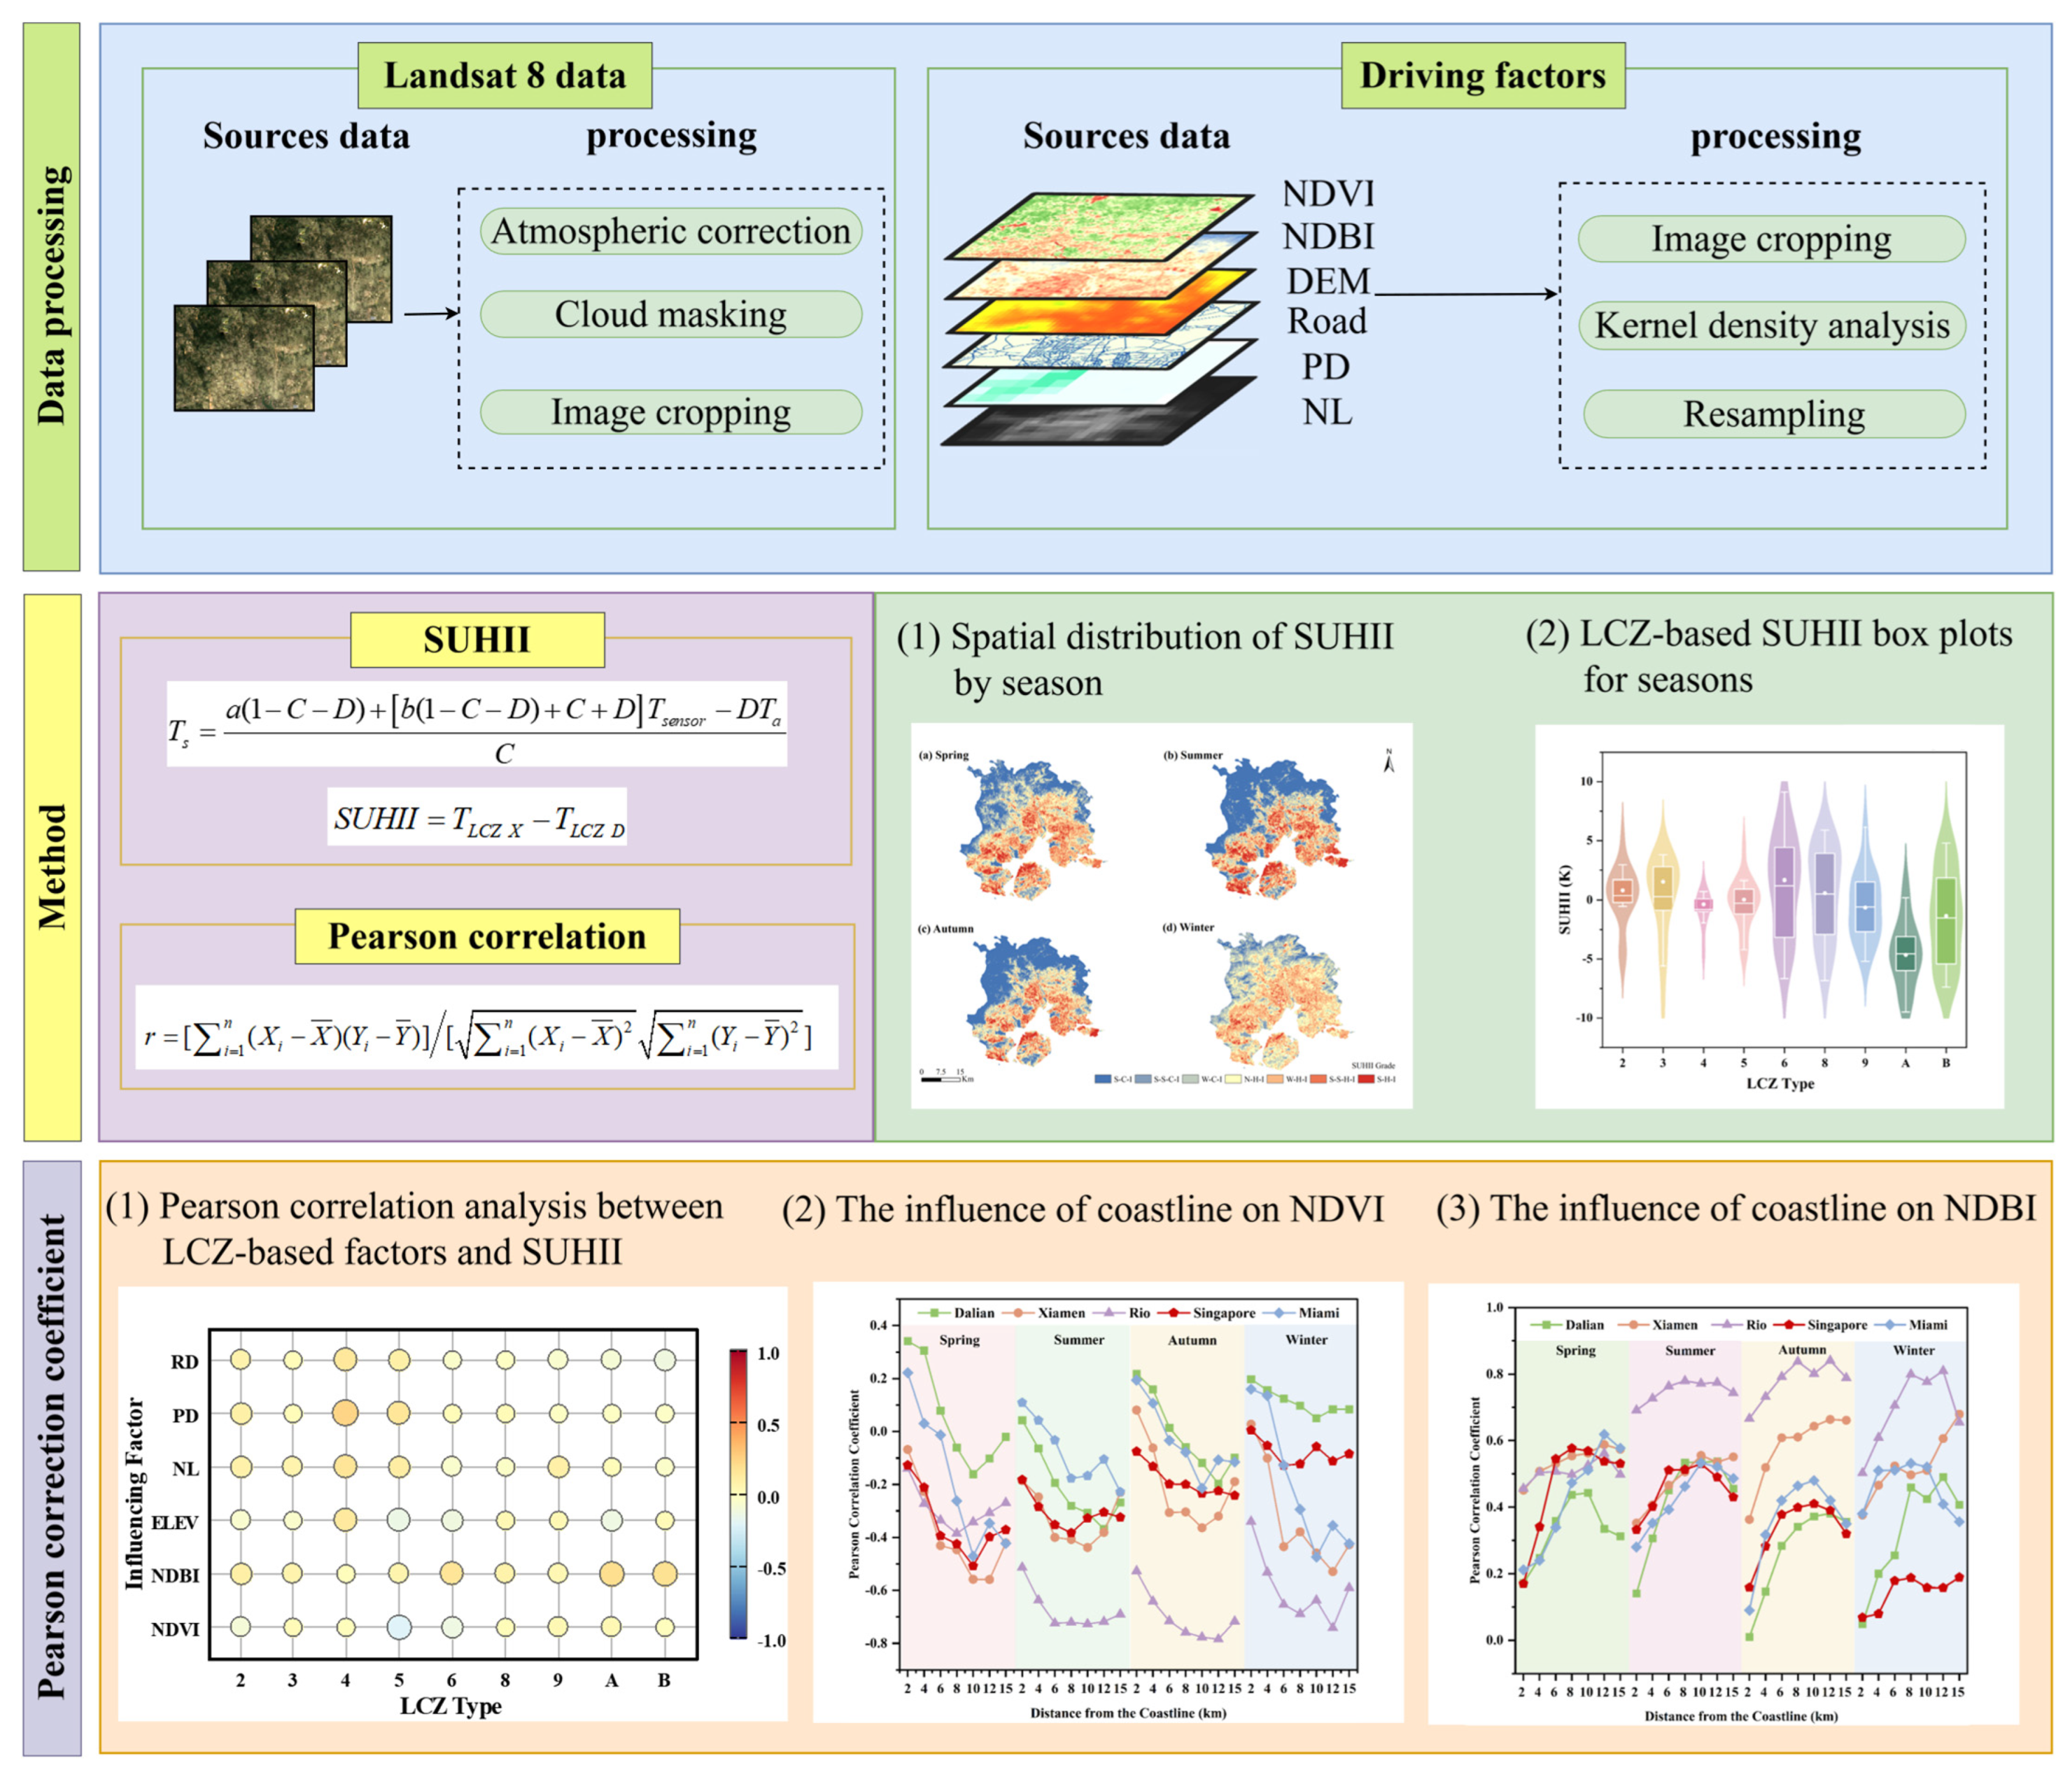
The specific research workflow consists of four steps (as illustrated in Figure 2): (1) Acquiring visible and thermal infrared images from Landsat 8 from 2018 to 2022, utilizing the single channel method to retrieve LST, and calculating the five-year average SUHII based on the LCZ classification system. (2) Preprocessing of influencing factor data involves spatial resampling and grid processing of various datasets, including digital elevation model, road network vector data, population data, and nighttime light data, to produce datasets with a resolution of 100 m. (3) A quantitative assessment is conducted to examine the relationship between influencing factors and SUHII through Pearson correlation coefficients. (4) The study area is divided into multiple gradient zones according to their distance from the coastline. This segment includes calculating variation patterns in the correlations between key influencing factors and SUHII within each gradient zone in order to analyze spatial differentiation characteristics related to coastal UHI effects.

3.1. Calculation of SUHII

The mono-window algorithm is a surface temperature inversion algorithm for TM data with only one thermal infrared band. After improvement, the algorithm applies to OLI/TIRS data [47]. In this paper, LST is calculated with the following equations:
T s = a ( 1 C D ) + b ( 1 C D ) + C + D T s e n s o r D T a C
C = ε τ
D = ( 1 τ ) 1 + ( 1 ε ) τ
where Ts is the land surface temperature; Tsensor indicates the brightness temperature on the sensor; Ta represents the effective mean atmospheric temperature; a and b are linear regression coefficients; τ is the atmospheric transmittance, and ε represents the land surface emissivity.
Based on the LCZ system, this study categorizes urban surface morphology into 17 distinct types (as presented in Table 2), comprising both built forms and natural cover types.
SUHII is defined as the land surface temperature difference between LCZ X and LCZ D according to the LCZ classification framework [48,49]. The calculation formula can be expressed as follows:
SUHII = TLCZ X − TLCZ D
where TLCZ X denotes the LST of LCZ X, and TLCZ D represents the LST of LCZ D.
Depending on the aforementioned formula, SUHII values can be quantitatively derived. In accordance with the SUHII classification criteria put forth by Ye et al. [50], this study categorizes SUHII into seven distinct grades (see Table 3), specifically including: strong cold island (S-C-I), sub-strong cold island (S-S-C-I), weak cold island (W-C-I), no heat island (N-H-I), weak heat island (W-H-I), sub-strong heat island (S-S-H-I), and strong heat island (S-H-I). This multi-level classification system enhances a more precise interpretation of the spatial distribution characteristics and intensity variation patterns associated with UHI effects.

3.2. Correlation Analysis Between Influencing Factors and SUHII

SUHII is influenced by a multitude of factors. This study categorizes these influencing factors into two groups: natural factors and socioeconomic factors. Natural factors include NDVI, NDBI, and elevation (ELEV). Socioeconomic factors include Nighttime Light (NL), Road Density (RD), and Population Density (PD). The NDVI was calculated using the formula NDVI = (NIR − R)/(NIR + R), and the NDBI was calculated using the formula NDBI = (MIR − NIR)/(MIR + NIR); meanwhile, the RD was obtained by performing kernel density analysis on preprocessed and corrected road data.

3.3. Coastal Gradient Analysis

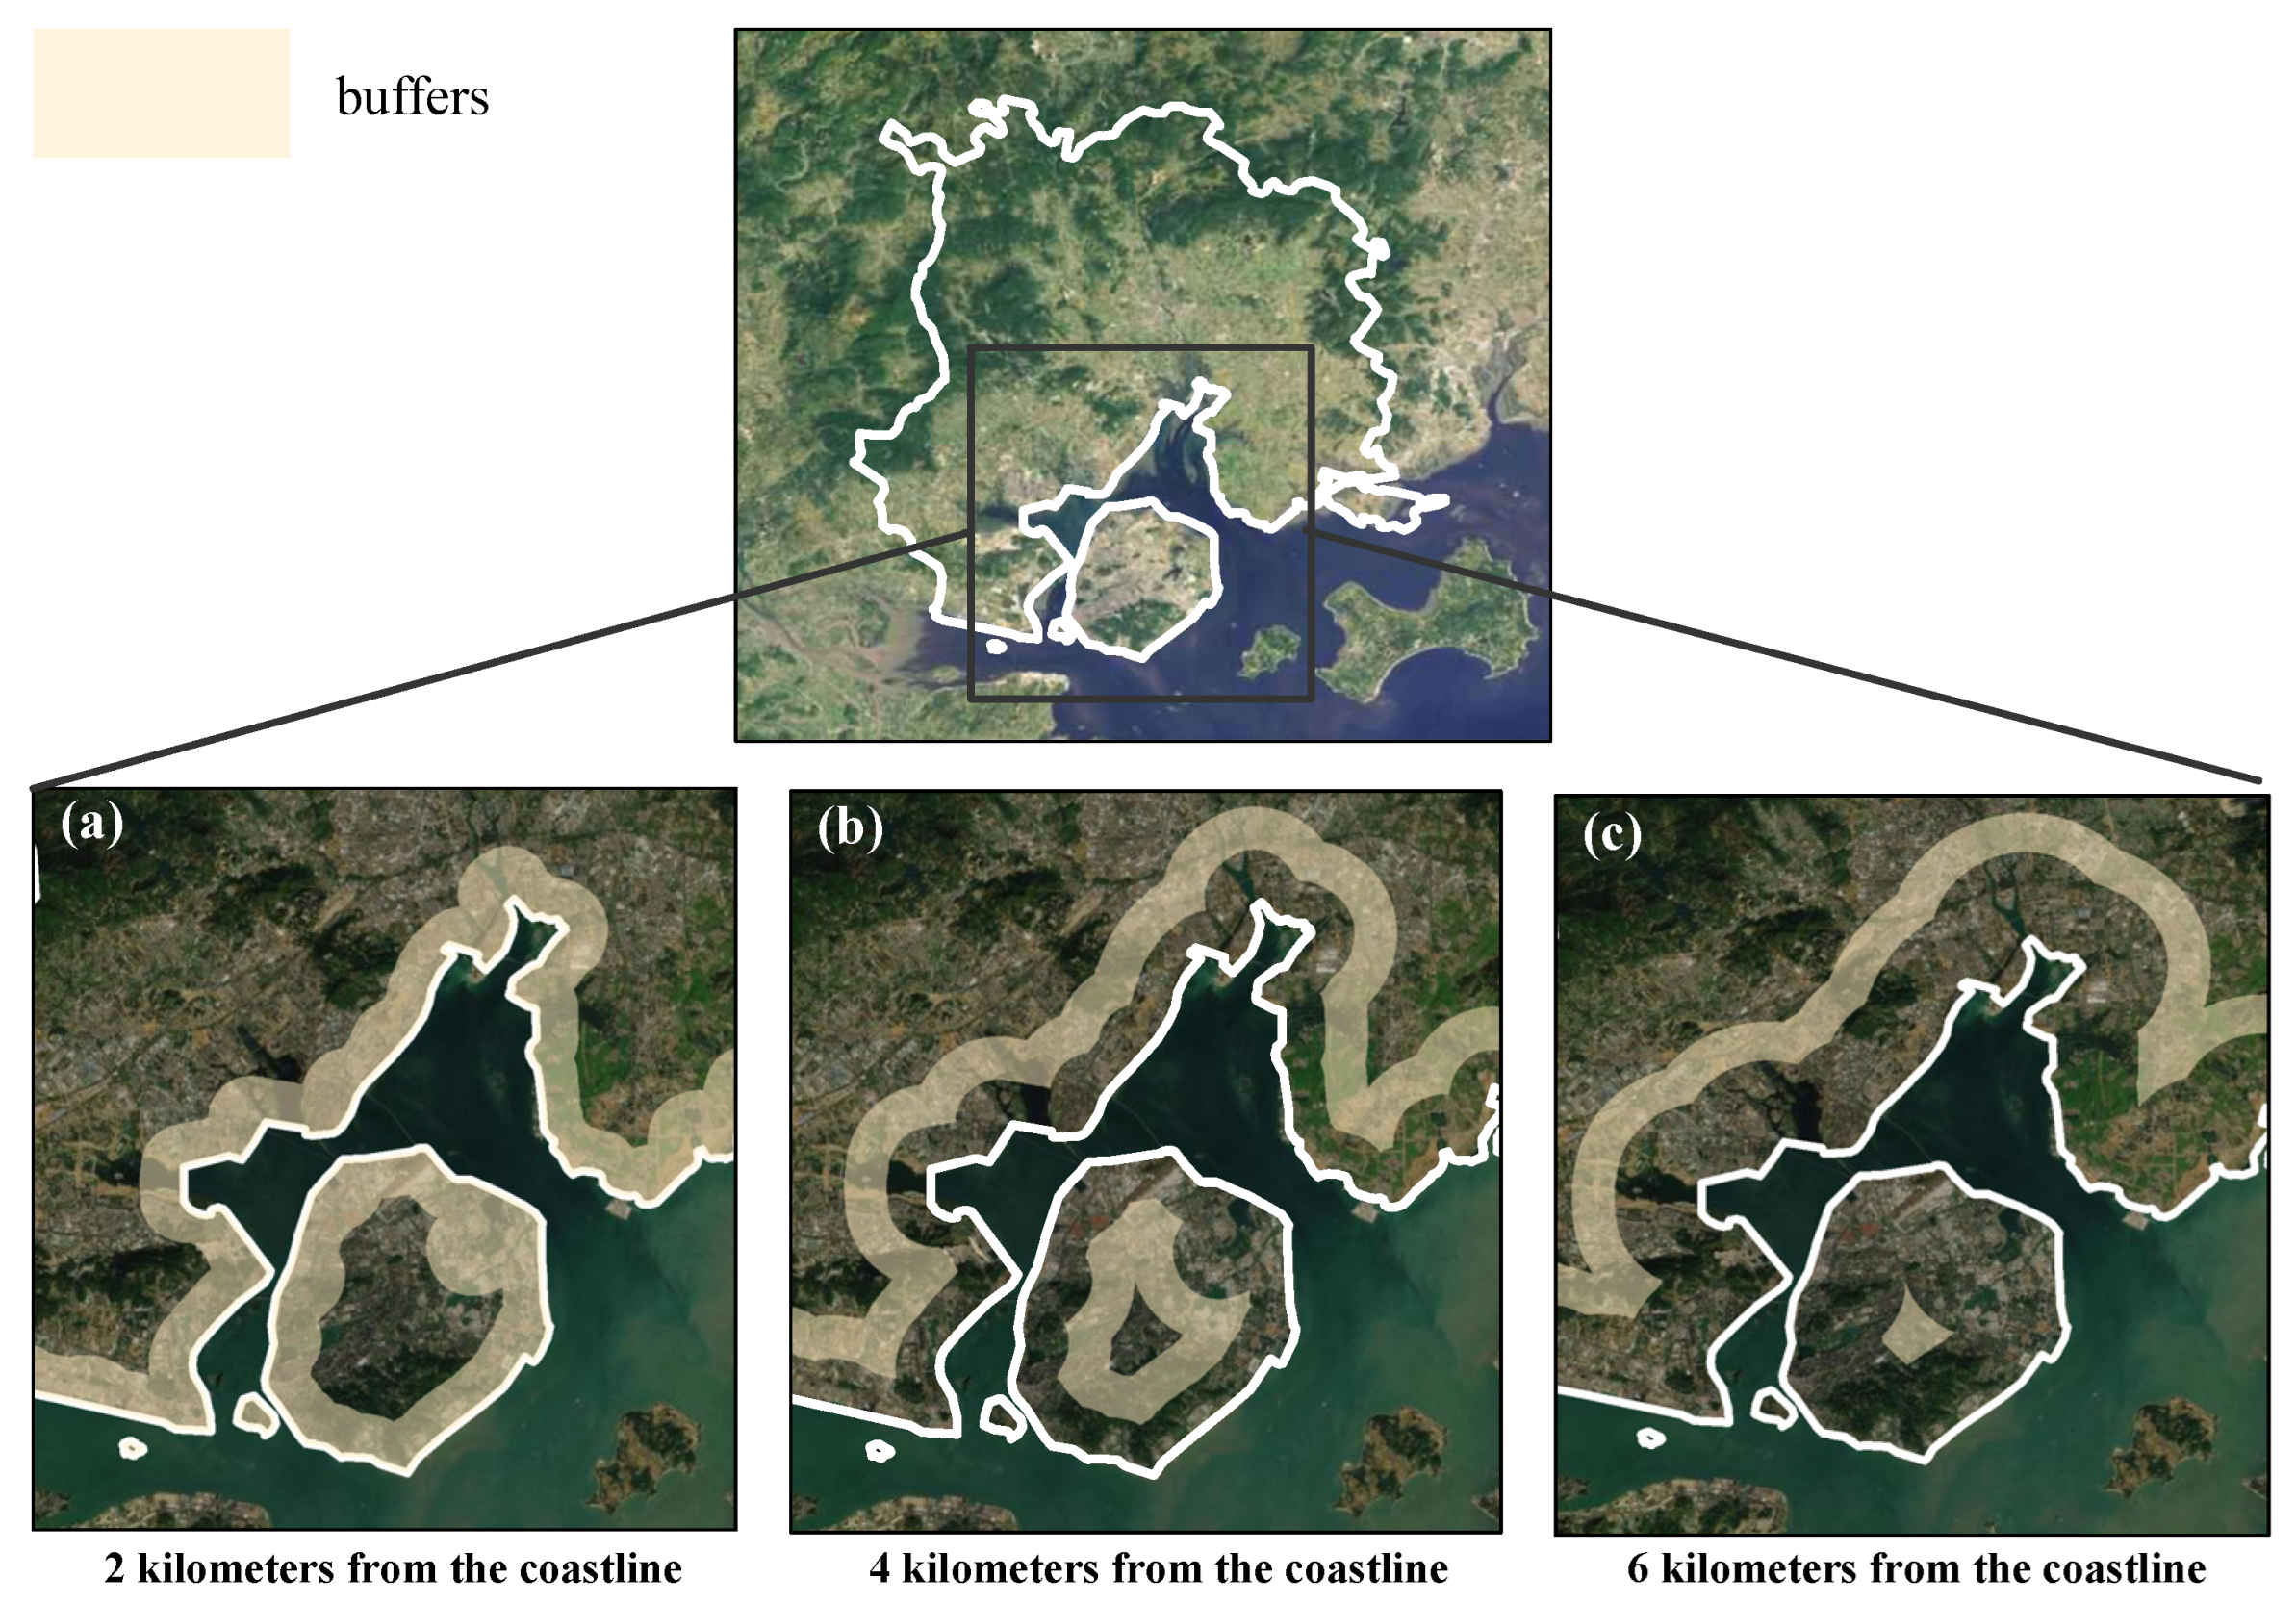
This study employs a coastal gradient analysis framework to systematically investigate the spatial characteristics of the urban heat island effect in coastal cities. Initially, the coastline was preprocessed by clipping it to align with the study area within the ArcGIS 10.8 platform. Using this coastline as a baseline, single buffer zones with widths of 2, 4, 6, 8, 10, 12, and 15 km were sequentially created extending landward (as displayed in Figure 3). These continuous buffer zones were then converted into seven non-overlapping concentric belts (0–2 km, 2–4 km, …, 12–15 km), forming the final coastal distance gradient analysis units. Subsequently, Pearson correlation coefficients between NDVI and SUHII, as well as between NDBI and SUHII, were calculated within each buffer zone. The research focuses on analyzing the trends of these correlation coefficients with increasing coastal distance, particularly examining how the strength of the relationships between NDVI and SUHII, and NDBI and SUHII, varies along the coastal gradient. This methodological approach aims to elucidate the formation mechanisms of urban thermal environments influenced by land–sea interactions.

4. Results

4.1. Spatial Distribution of SUHII Across Seasons

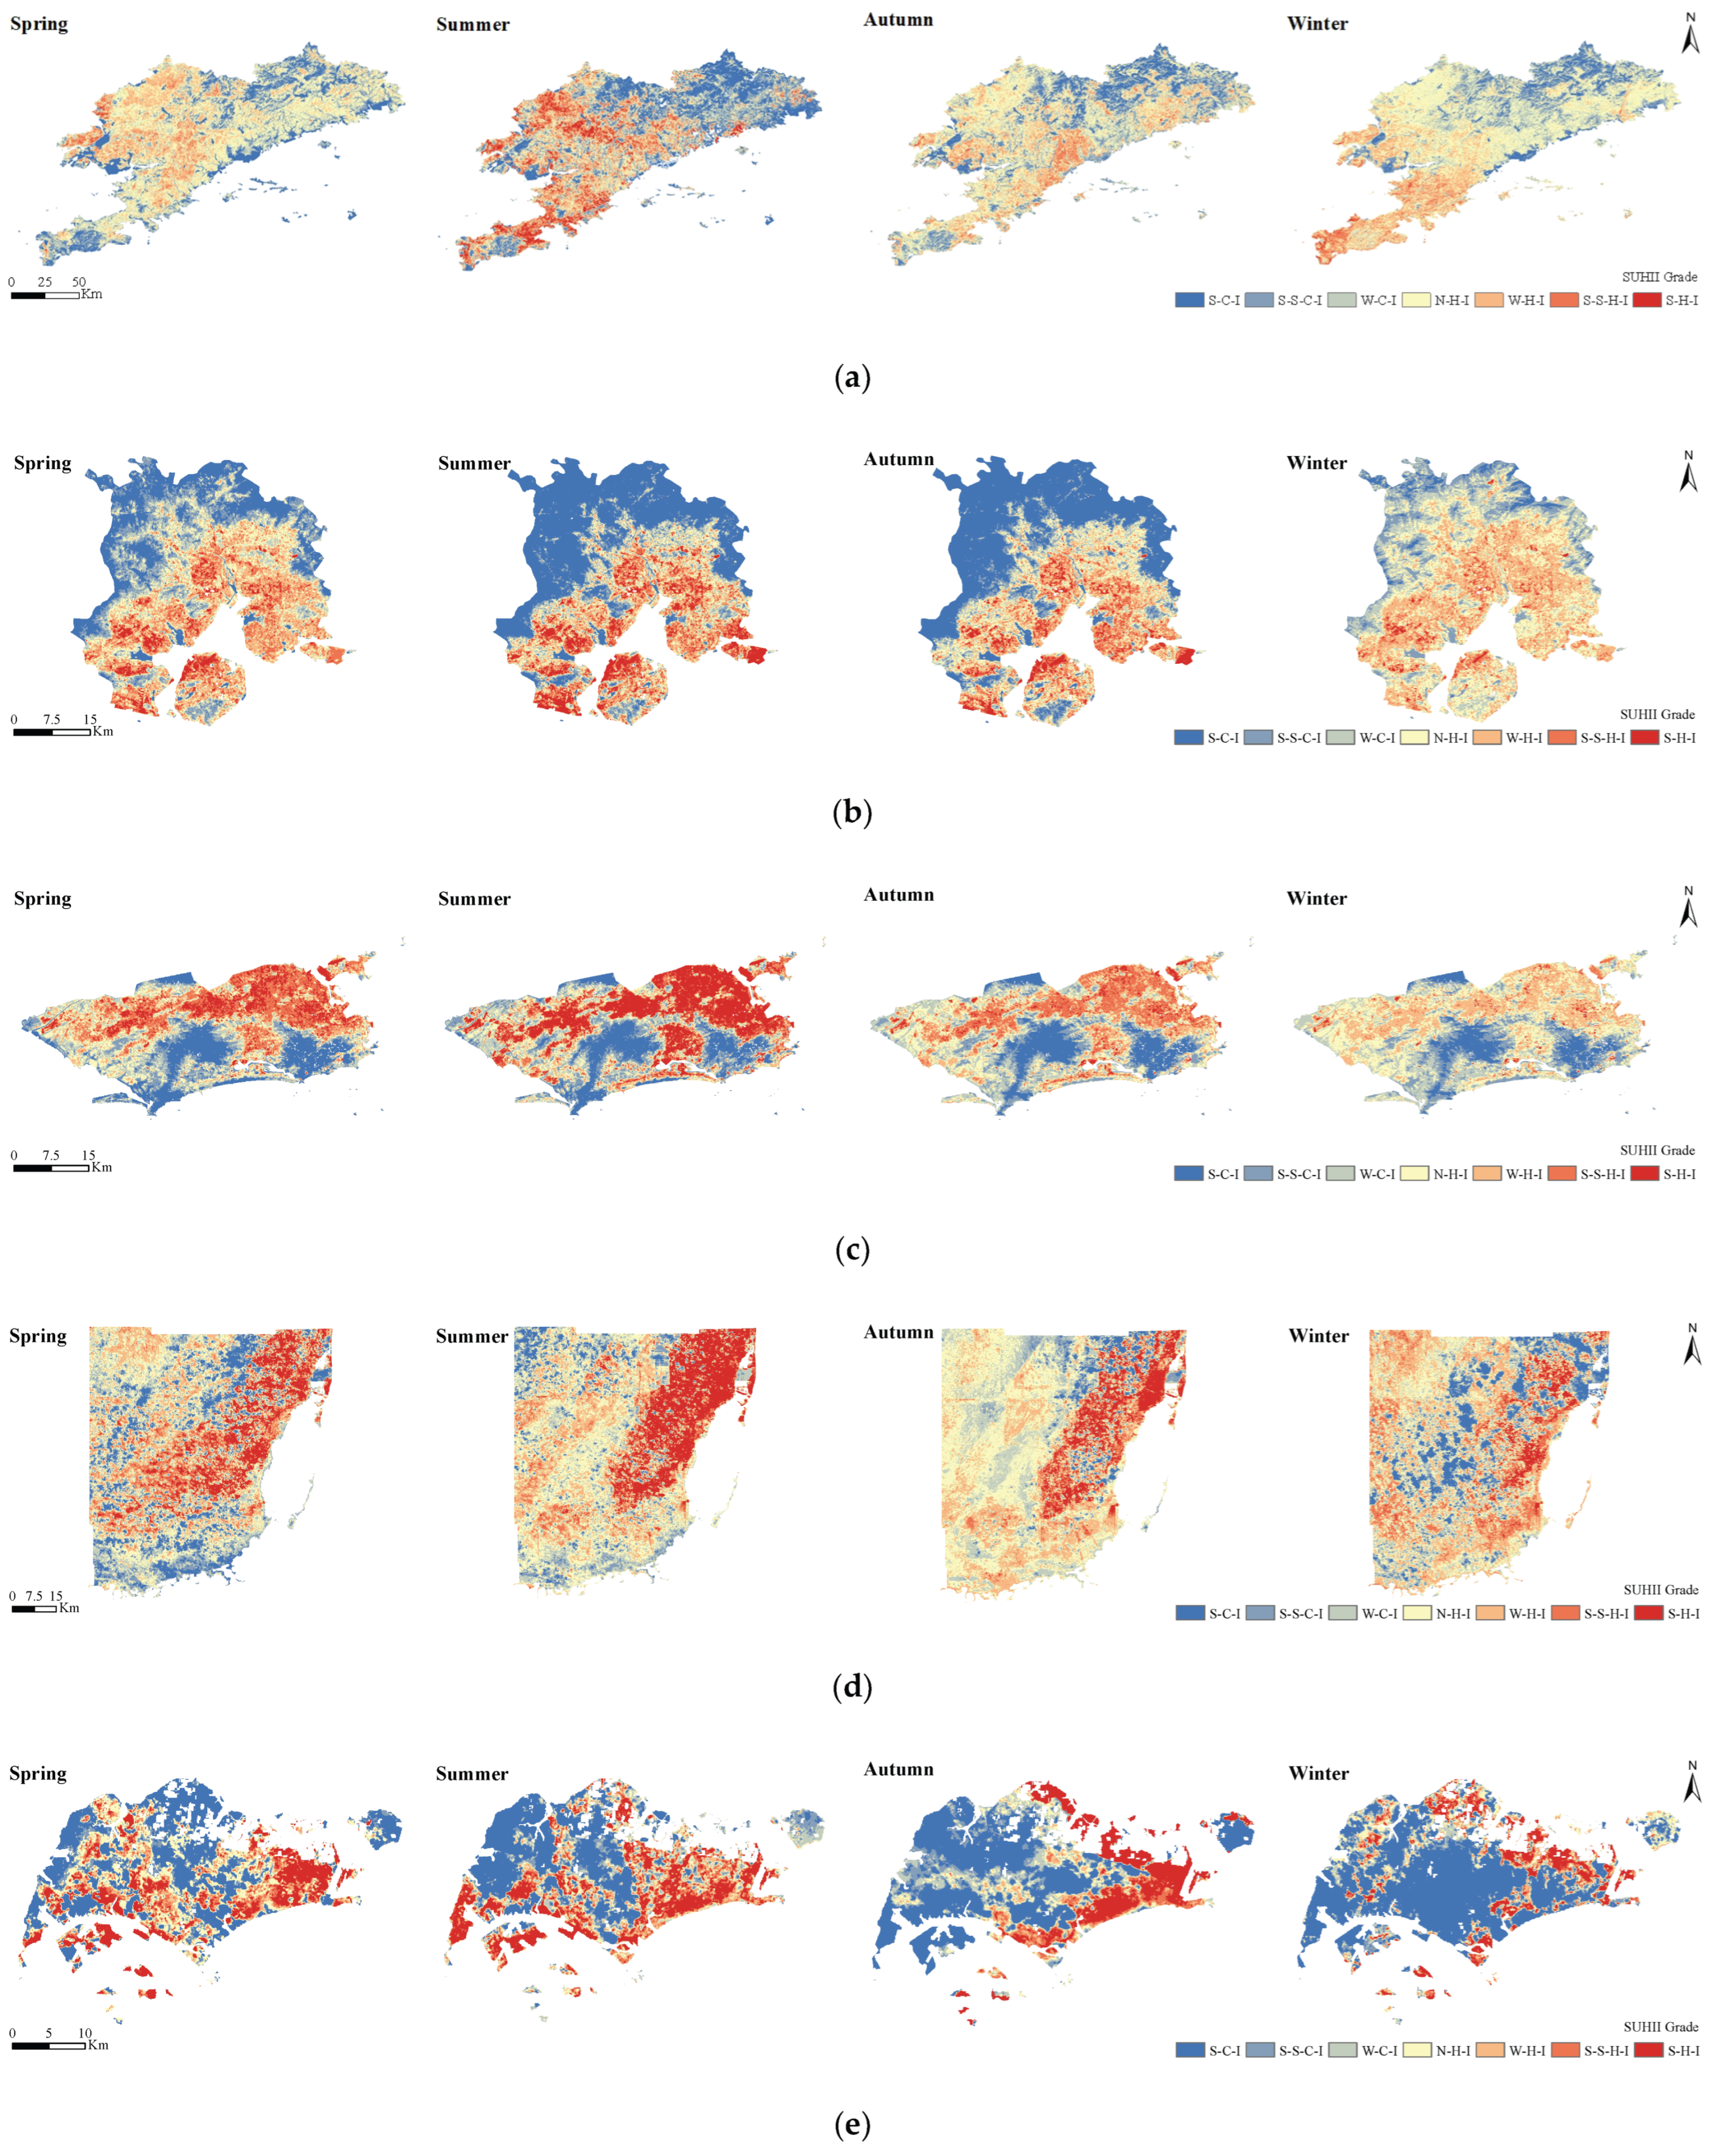
The analysis of the spatio-temporal distribution characteristics of SUHII in Dalian reveals marked spatial and seasonal variations, as illustrated in Figure 4a. Spatially, regions exhibiting high SUHII values are predominantly located in the southern urban district of Dalian, which is characterized by elevated population density and extensive building coverage, thereby forming a distinct heat island core. In contrast, low SUHII values are primarily distributed in the northeastern mountainous areas that are rich in vegetation, demonstrating a cooling effect. Moreover, the spatial pattern of the heat island presents notable seasonal differences: during summer, autumn, and winter, heat islands tend to be concentrated within the southern urban area; however, in springtime their distribution becomes relatively dispersed with a pronounced focus on the central region. It is particularly noteworthy that Dalian exhibits significantly clustered and intense heat island areas during summer–a phenomenon not observed across other seasons. In terms of seasonal variation, the annual average SUHII in Dalian shows a clear trend indicating “high values in summer and low values in winter”. The average SUHII recorded for summer reaches 2.52 K–a figure that is significantly higher than that observed during other seasons–while negative averages are recorded for both spring (−1.99 K) and winter (−0.19 K).
Analysis of the spatio-temporal distribution characteristics of SUHII in Xiamen reveals distinct seasonal patterns and spatial heterogeneity (as shown in Figure 4b). In terms of seasonal averages, SUHII displays a notable trend: spring (0.82 K) > summer (0.77 K) > winter (0.54 K) > autumn (0.05 K). Spatially, a pronounced “southeast-northwest” differentiation pattern is evident: the southeastern urban area, characterized by high population density and concentrated building coverage, serves as a stable heat island core. Conversely, the northwestern mountainous vegetated region consistently maintains a significant cooling effect. Furthermore, the spatial distribution of heat islands in Xiamen remains relatively stable across all four seasons, with consistent concentration in the southeastern area and no significant seasonal shifts observed. Regarding intensity classification, both summer and autumn exhibit coexisting strong heat islands alongside strong cold islands; whereas winter typically presents a diminished pattern dominated by weak heat islands and weak cold islands.
As illustrated in Figure 4c, the SUHII in Rio is predominantly located in the northern sections of the city, whereas the southern region displays a distinct cooling effect. Additionally, the spatial distribution of heat islands in Rio remains relatively stable throughout all four seasons, consistently aggregating in the northern urban zone without exhibiting significant seasonal fluctuations. In terms of intensity classification, summer and spring show a coexistence of strong heat islands alongside strong cold islands; autumn is mainly characterized by sub-strong heat islands and sub-strong cold islands; while winter presents a generally moderated pattern, primarily consisting of weak heat islands and weak cold islands. Regarding seasonal averages, SUHII demonstrates the following trend: summer (2.84 K) > spring (1.14 K) > autumn (1.09 K) > winter (0.34 K).
As illustrated in Figure 4d, the heat islands in Miami exhibit a clear spatial pattern, predominantly concentrated in the eastern coastal and inland core built-up areas, while the western and southern wetland and coastal zones display a distinct cooling effect, characterized by extensive cold island distribution. Additionally, the spatial distribution of heat islands in Miami shows noticeable seasonal fluctuations: in summer, strong heat islands expand significantly, covering large swathes of the eastern coast and inland regions; whereas in winter, the heat island footprint contracts, with weak heat islands becoming more prevalent, and cold islands dominate the landscape. In terms of intensity classification, summer and spring are marked by a coexistence of strong heat islands and moderate cold islands, with the highest heat island intensity observed in the eastern coastal and inland core zones; autumn is mainly characterized by sub-strong heat islands and sub-strong cold islands, with a more balanced distribution of heat and cold effects across the city; while winter presents a generally moderated pattern, primarily consisting of weak heat islands and strong cold islands, reflecting the reduced thermal impact of urban surfaces during the cooler season.
As illustrated in Figure 4e, the SUHII in Singapore exhibits a clear spatial pattern, predominantly concentrated in the central and western urban zones, while the eastern coastal and northern island areas display a distinct cooling effect, characterized by extensive cold island distribution. Additionally, the spatial distribution of heat islands in Singapore shows noticeable seasonal fluctuations: in summer, strong heat islands expand significantly, covering large swathes of the central and western regions, whereas in winter, the heat island footprint contracts, with weak heat islands becoming more prevalent, and cold islands dominate the landscape. In terms of intensity classification, summer and spring are marked by a coexistence of strong heat islands and moderate cold islands, with the central and western zones experiencing the highest heat island intensity; autumn is mainly characterized by sub-strong heat islands and sub-strong cold islands, with a more balanced distribution of heat and cold effects across the city; while winter presents a generally moderated pattern, primarily consisting of weak heat islands and strong cold islands, reflecting the reduced thermal impact of urban surfaces during the cooler season.

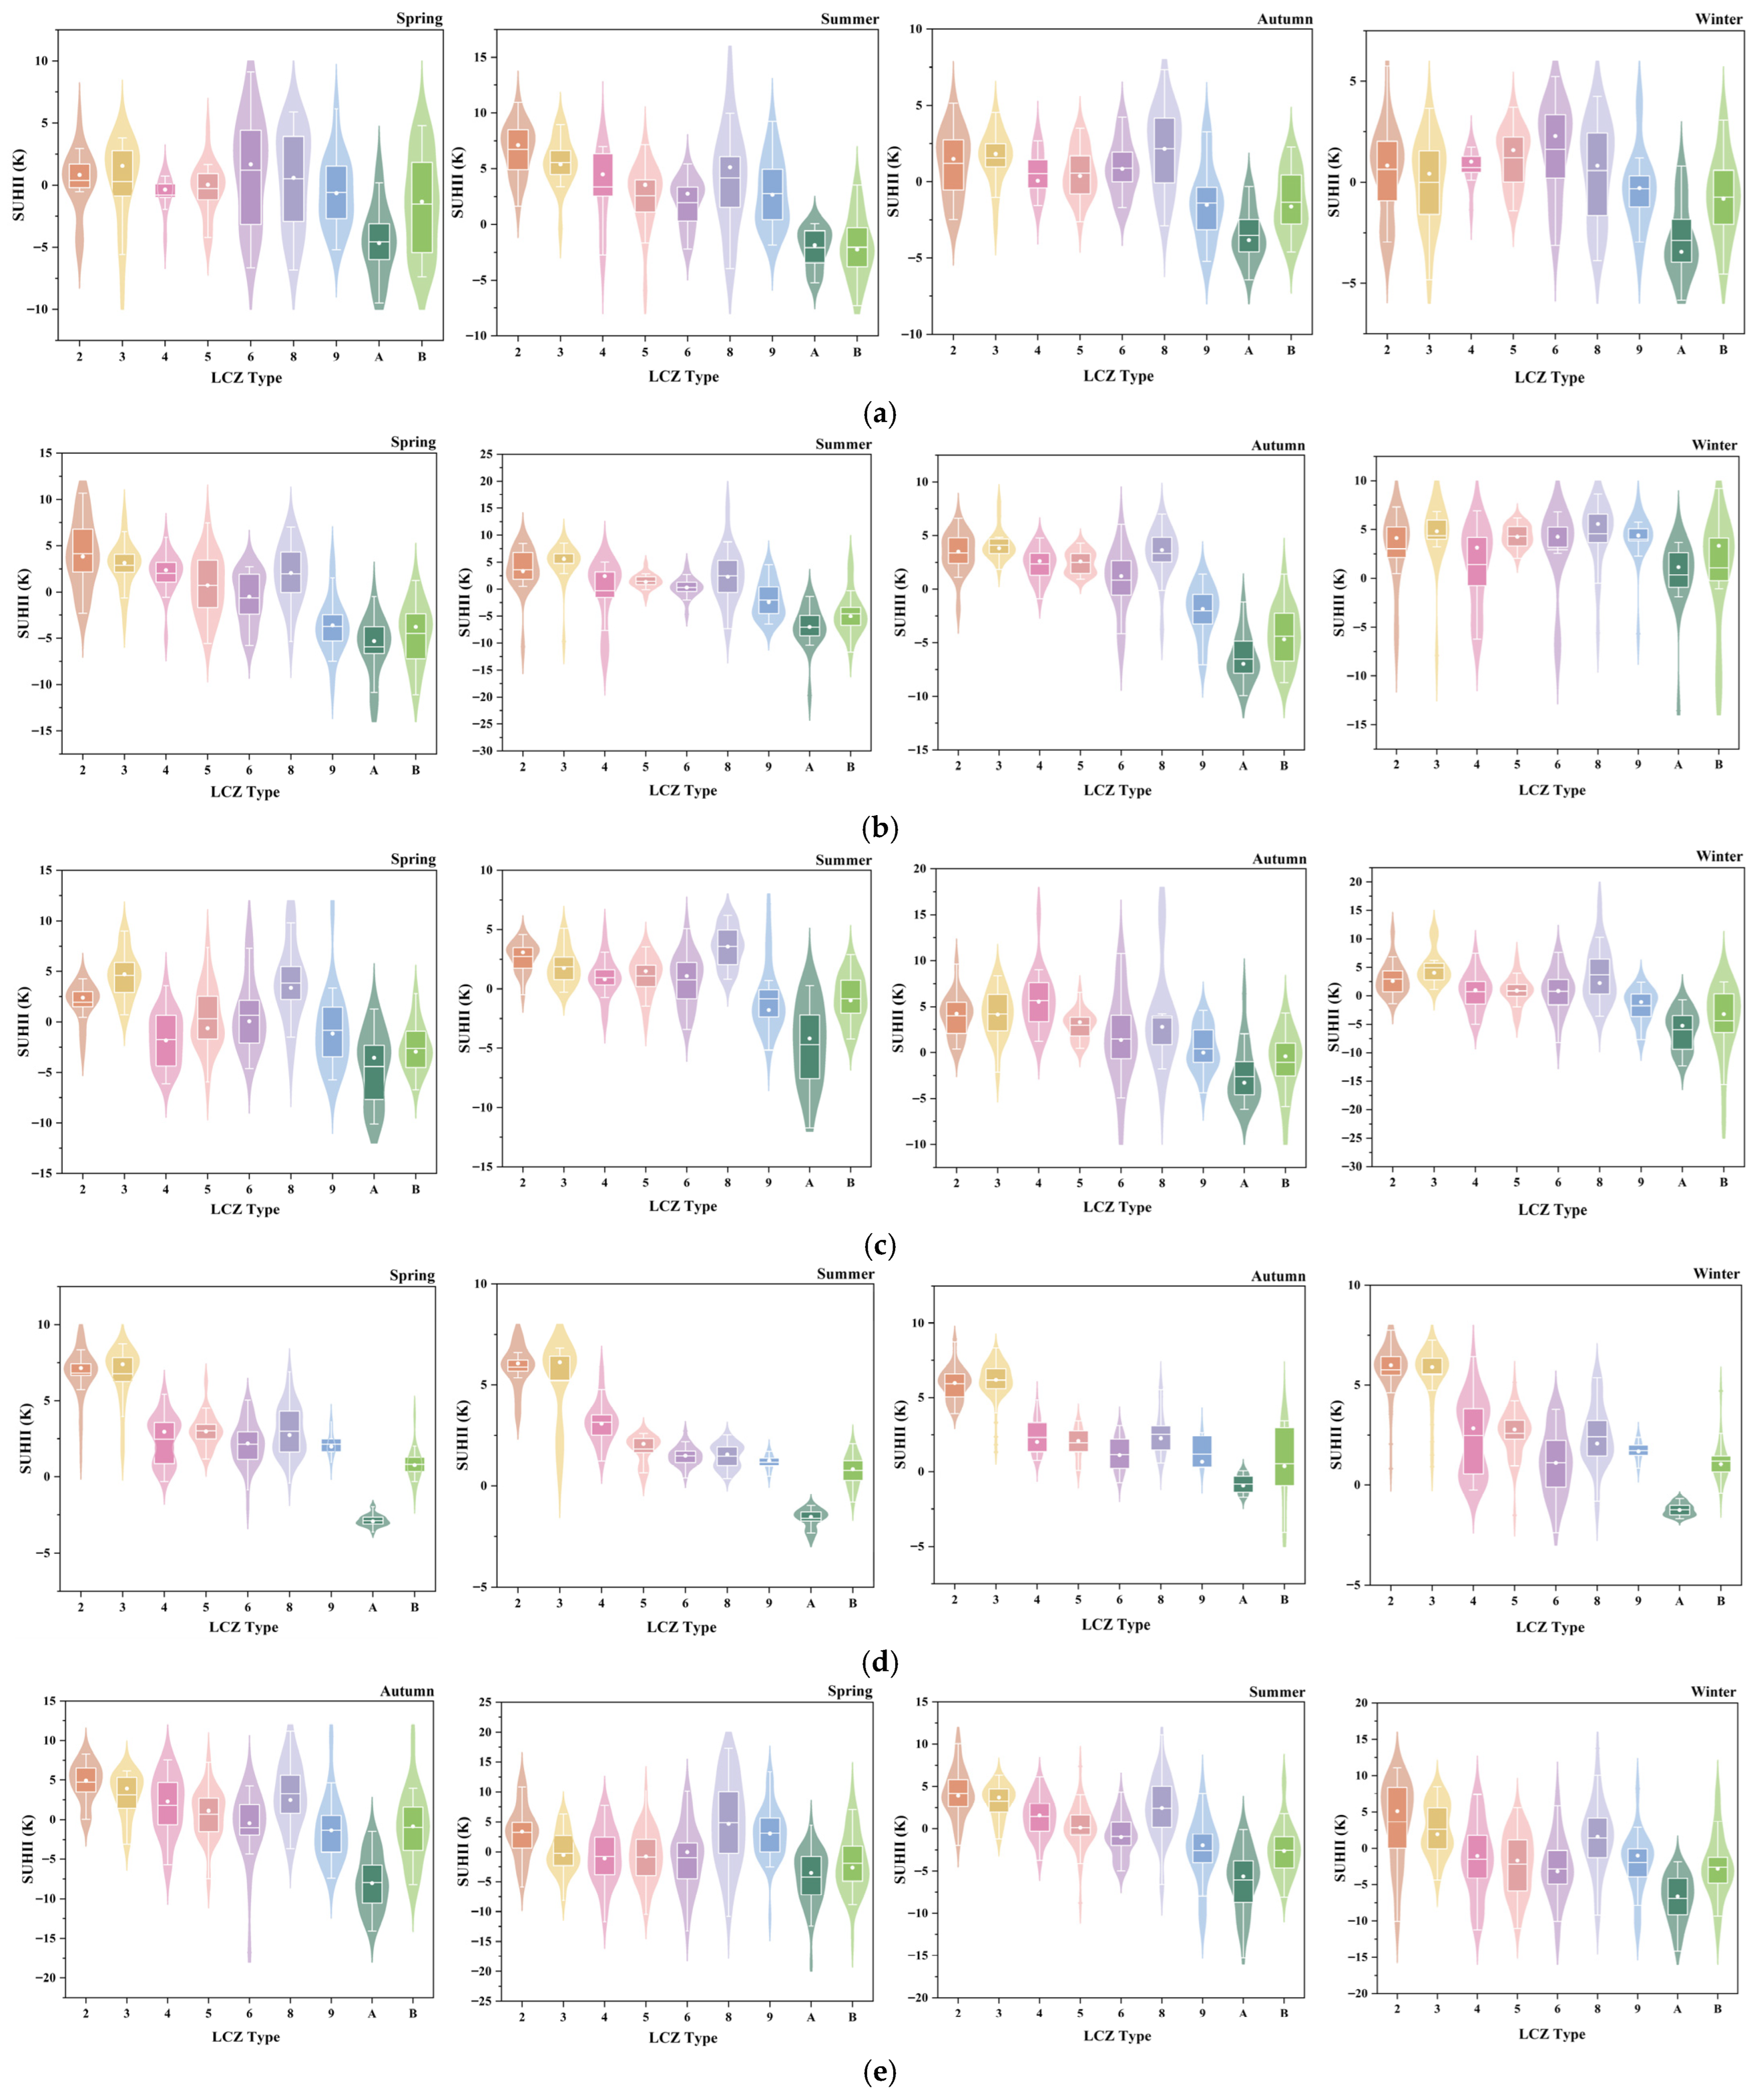
4.2. Investigation of Urban Heat Island Intensity Variations Across LCZ Types

Figure 5a illustrates the variations in SUHII across different LCZs in Dalian throughout the seasons. As depicted, built-up areas generally exhibit a higher intensity of UHI effects, while natural cover types demonstrate comparatively lower values. This discrepancy can be attributed to two primary factors: first, intensive human activities and increased energy consumption within built-up areas that generate substantial anthropogenic heat emissions, which exacerbate the UHI effect; second, natural zones effectively alleviate thermal stress through ecological processes such as vegetation transpiration and canopy shading. Among the various built-up LCZ types (LCZ 1–10), notable differences in UHI persist: LCZ 2 and LCZ 8 consistently present elevated SUHII values across all four seasons, whereas LCZ 4 and LCZ 9 maintain relatively lower SUHII levels throughout the year.
The differences in SUHII among various LCZ types in Xiamen across seasons are illustrated in Figure 5b. The findings indicate that the distribution pattern of SUHII in Xiamen exhibits both similarities and differences when compared to Dalian: a notable similarity is that urbanized areas generally present higher UHI intensity, whereas natural cover areas exhibit lower heat island intensity. Within the urbanized areas, LCZ 2, LCZ 3, and LCZ 8 consistently record higher SUHII values throughout all four seasons, while LCZ 9 remains characterized by relatively lower SUHII values.
Figure 5c shows the seasonal variations in SUHII across different LCZ types in Rio. As depicted, the distribution pattern of SUHII in Rio aligns with that observed in Xiamen: urbanized areas exhibit higher intensities of UHI, while regions covered by natural vegetation display comparatively lower values. Among the built-up LCZ types, LCZ 2, LCZ 3, and LCZ 8 consistently demonstrate elevated SUHII values across all four seasons; LCZ 9 maintains relatively lower SUHII levels year-round.
Figure 5d presents the results for Miami. LCZ 2, LCZ 3, and LCZ 8 also form a persistent high-heat island core, with their mean seasonal SUHII values generally the highest. In contrast, LCZ A consistently serves as the most prominent “cold island,” maintaining an average value that is always negative. Miami exhibits a more pronounced seasonal fluctuation signal, with the mean SUHII values of multiple LCZ types decreasing in winter compared to other seasons.
As shown in Figure 5e, the UHI pattern in Singapore exhibits spatial heterogeneity. There are significant differences in the UHI intensity within the built-up areas. LCZ 2, LCZ 3, and LCZ 8 form a continuous high-intensity UHI core, with their average SUHII significantly higher than that of other types. In contrast, LCZ A serves as a stable ecological cold island, maintaining the lowest average intensity consistently. From a seasonal perspective, although the mean SUHII values for all LCZ types show annual variations, the intensity differences between these types remain stable throughout the year.

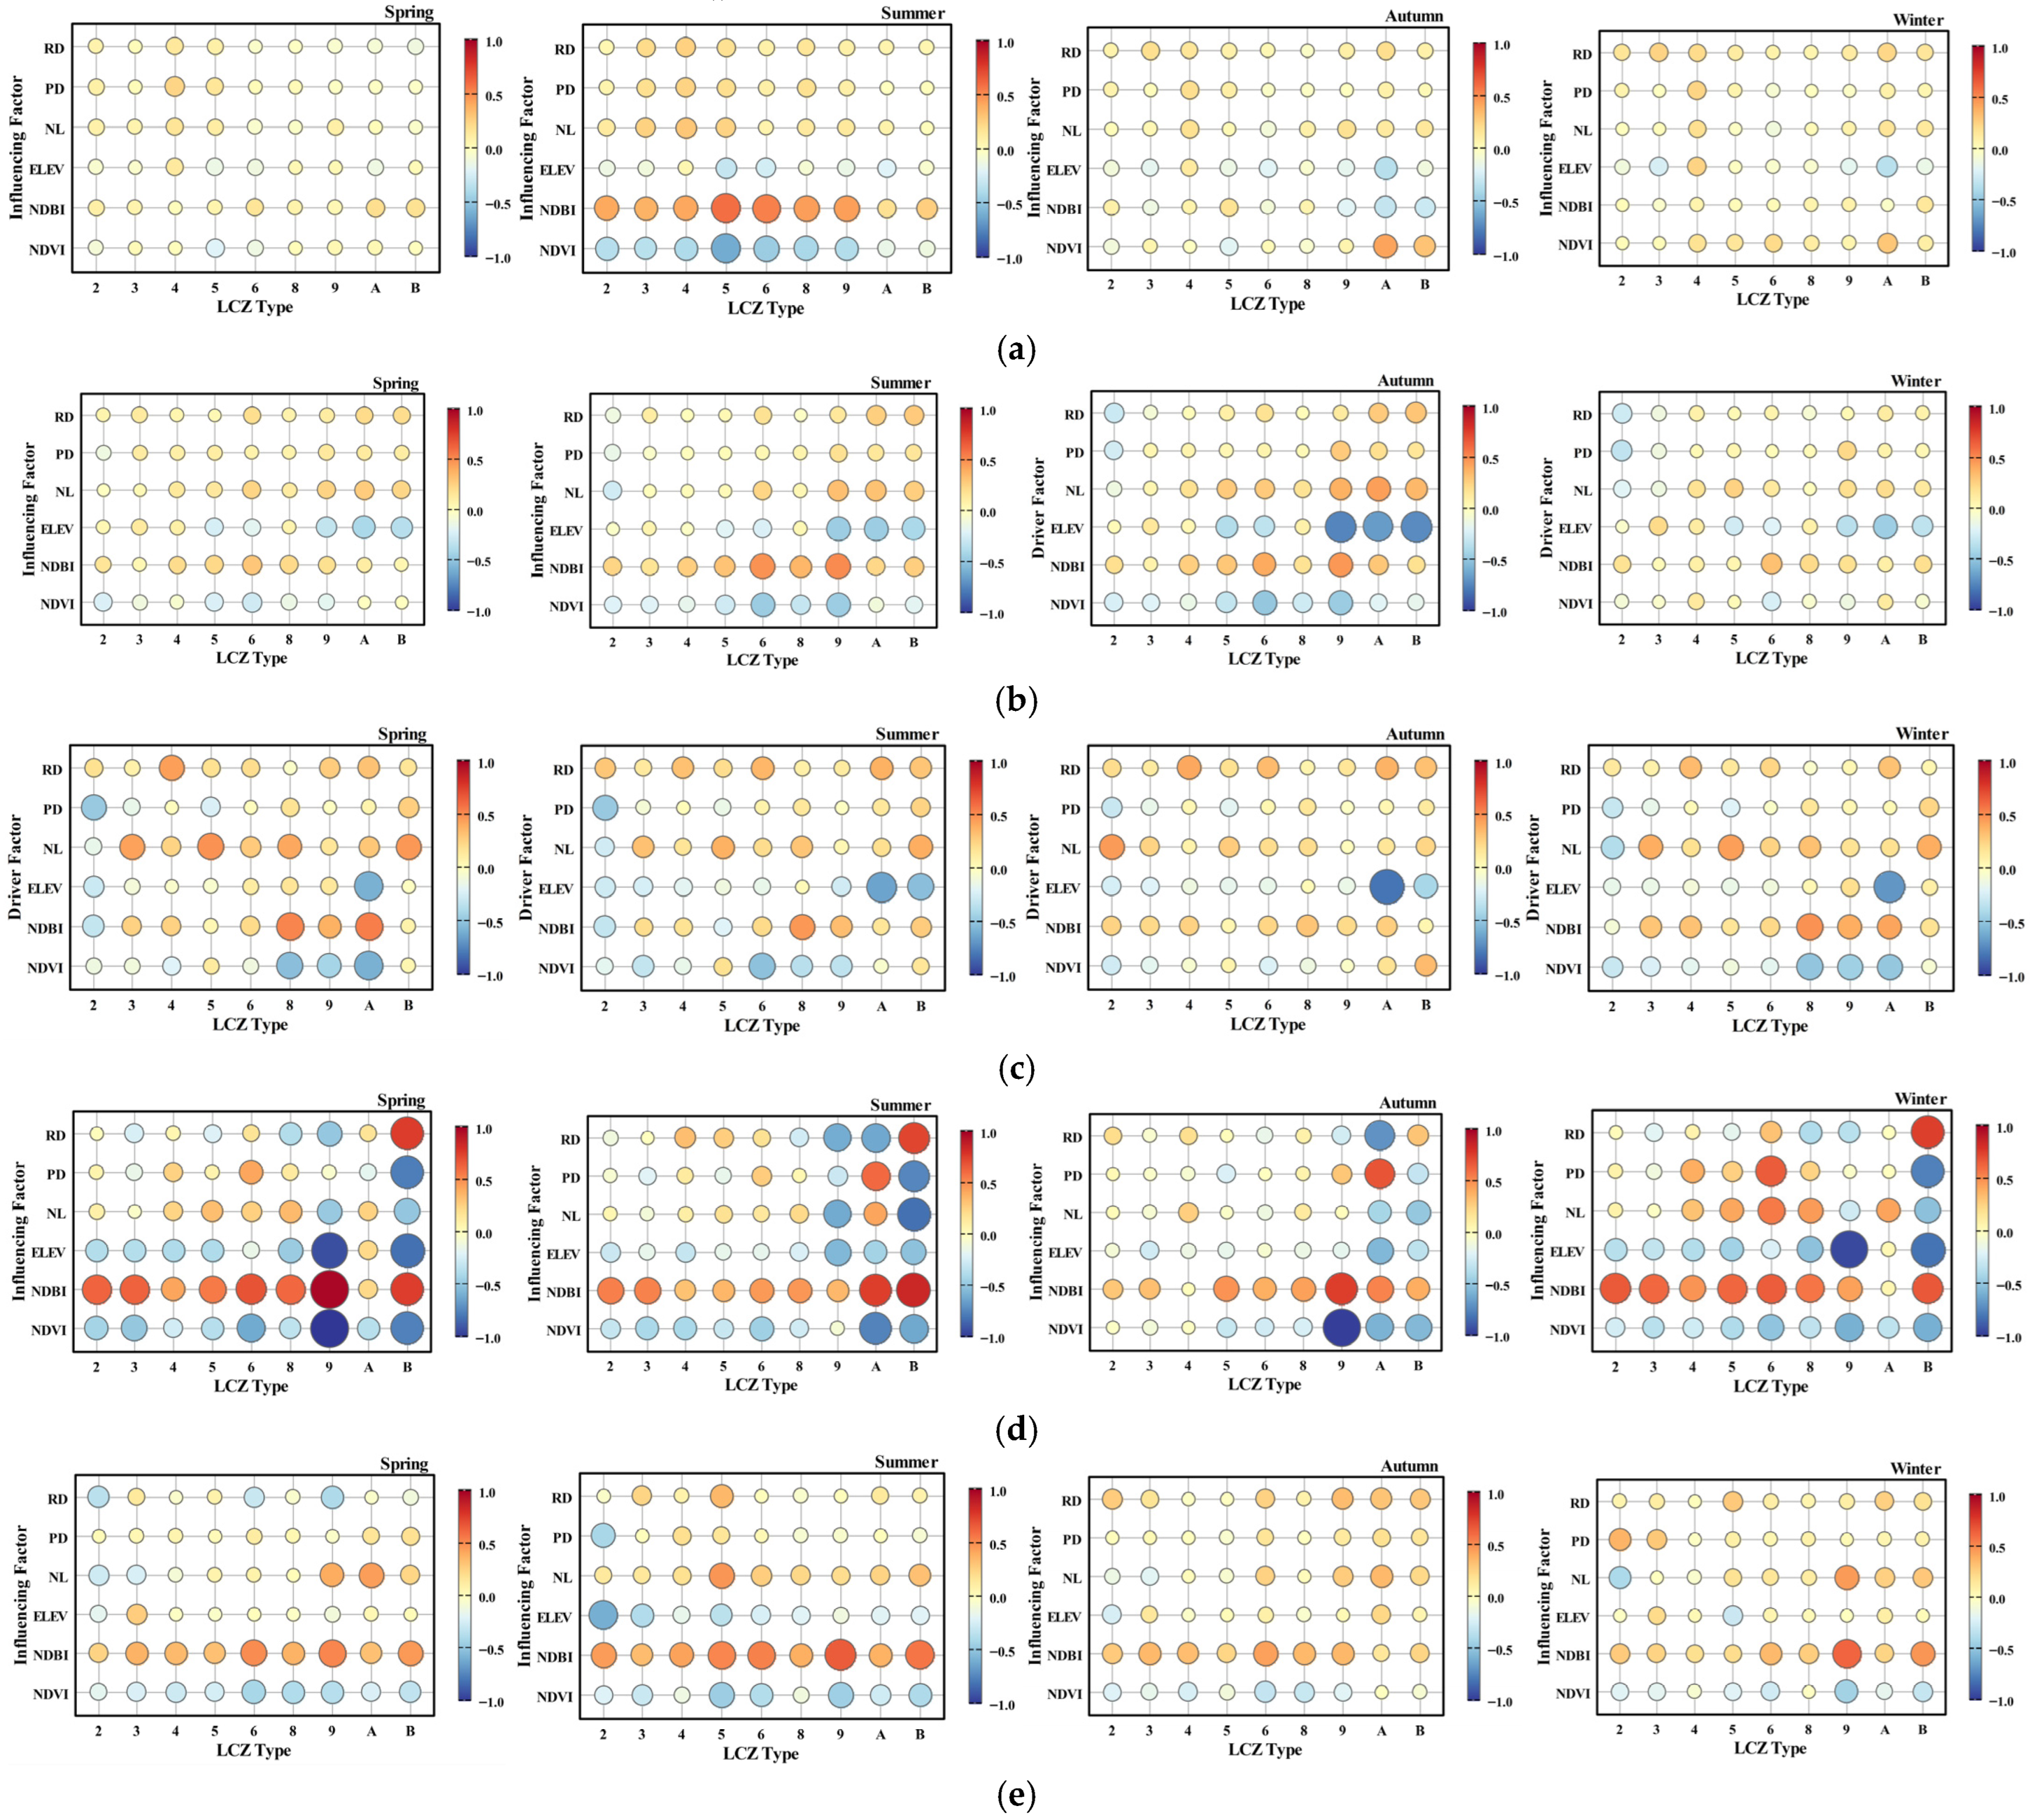
4.3. Influence of Influencing Factors on Seasonal SUHII Variations

This section begins by presenting the results through visual charts (Figure 6), while comprehensive statistical analysis data tables have been provided in Appendix A (Table A1, Table A2, Table A3, Table A4 and Table A5). The subsequent analysis will be conducted based on these charts. The PCC analysis between SUHII and its influencing factors in Dalian is presented in Figure 6a. The study reveals that the effects of these influencing factors on SUHII exhibit both seasonal and spatial variations. The results indicate that NDVI has a significant cooling effect on SUHII during the summer, while it shows dynamic variations across other seasons. The NDBI consistently enhances SUHII during both spring and summer, emphasizing the influence of urban construction density on the heat island effect in warm seasons. Topographic analysis indicates that the ELEV exhibits a positive correlation with SUHII in LCZ 4, whereas negative correlations are observed in other functional zones. With regard to anthropogenic factors, NL, RD, and PD maintain significant positive correlations with SUHII during summer; however, they exhibit dynamic characteristics across other seasons.
As shown in Figure 6b, the UHI effect in Xiamen is influenced by the synergistic interactions of multiple factors. NDVI exerts a significant inhibitory effect on the SUHII during summer and autumn seasons, while exhibiting dynamic relationships during other periods. In contrast, the NDBI consistently enhances SUHII across all four seasons, demonstrating a stable promoting effect. The influence of the ELEV reveals considerable spatial heterogeneity: in zones such as LCZ 5, LCZ 6, and LCZ 9, the ELEV mitigates the UHI phenomenon during spring, summer, and autumn; conversely, it demonstrates an opposite enhancing effect in other regions. Anthropogenic factors–including NL, PD, and RD–despite seasonal fluctuations, generally exert a positive promoting influence on the UHI effect.
The findings for Rio, presented in Figure 6c, demonstrate that NDVI exerts a significant inhibitory effect on SUHII during the summer months, while exhibiting dynamic patterns across other seasons. In contrast, the NDBI consistently enhances SUHII throughout all seasons. With respect to topographic factors, the ELEV reveals notable spatial variations during the summer and autumn: with the exception of LCZ 8, which shows a positive correlation with SUHII, all other regions display negative correlations. Concerning anthropogenic factors, both RD and PD show significant positive correlations with SUHII in summer; however, these relationships exhibit dynamic changes across different seasons. Specifically, during spring, autumn, and winter, PD exhibits negative correlations with SUHII in LCZ 2, LCZ 4, and LCZ 8 areas while maintaining positive correlations in other regions.
Figure 6d shows the results for Miami. NDBI exhibits a positive correlation throughout the year. LCZ 9 demonstrates an extremely strong positive correlation between NDBI and the heat island effect in summer, along with a negative correlation for NDVI. The relationship between ELEV and human activity factors further reveals spatial differentiation: in areas with high vegetation cover, such as LCZ A and LCZ B, NL often shows a negative correlation with the heat island effect; whereas in high-density residential areas like LCZ 5 and LCZ 6, PD exhibits a positive correlation with the heat island effect in winter. In low-rise residential areas such as LCZ B, PD shows a consistently negative correlation with the heat island effect. The influence of RD and PD is minimal in industrial zones.
The results for Singapore are shown in Figure 6e. NDBI serves as a warming factor, maintaining a strong and stable positive correlation across all seasons and in most LCZs. The cooling effect of NDVI is also widespread. The influence of topographic factors is complex and highly dependent on the urban spatial structure, with the correlation between ELEV and SUHII varying across different LCZs. In regions such as LCZ A and LCZ B, NL exhibits a consistently positive correlation with SUHII throughout the year, whereas in building-intensive areas like LCZ2 to LCZ6, this correlation weakens in spring and autumn. The relationships of RD and PD with the surface urban heat island intensity show significant spatial functional differentiation and seasonal variation.
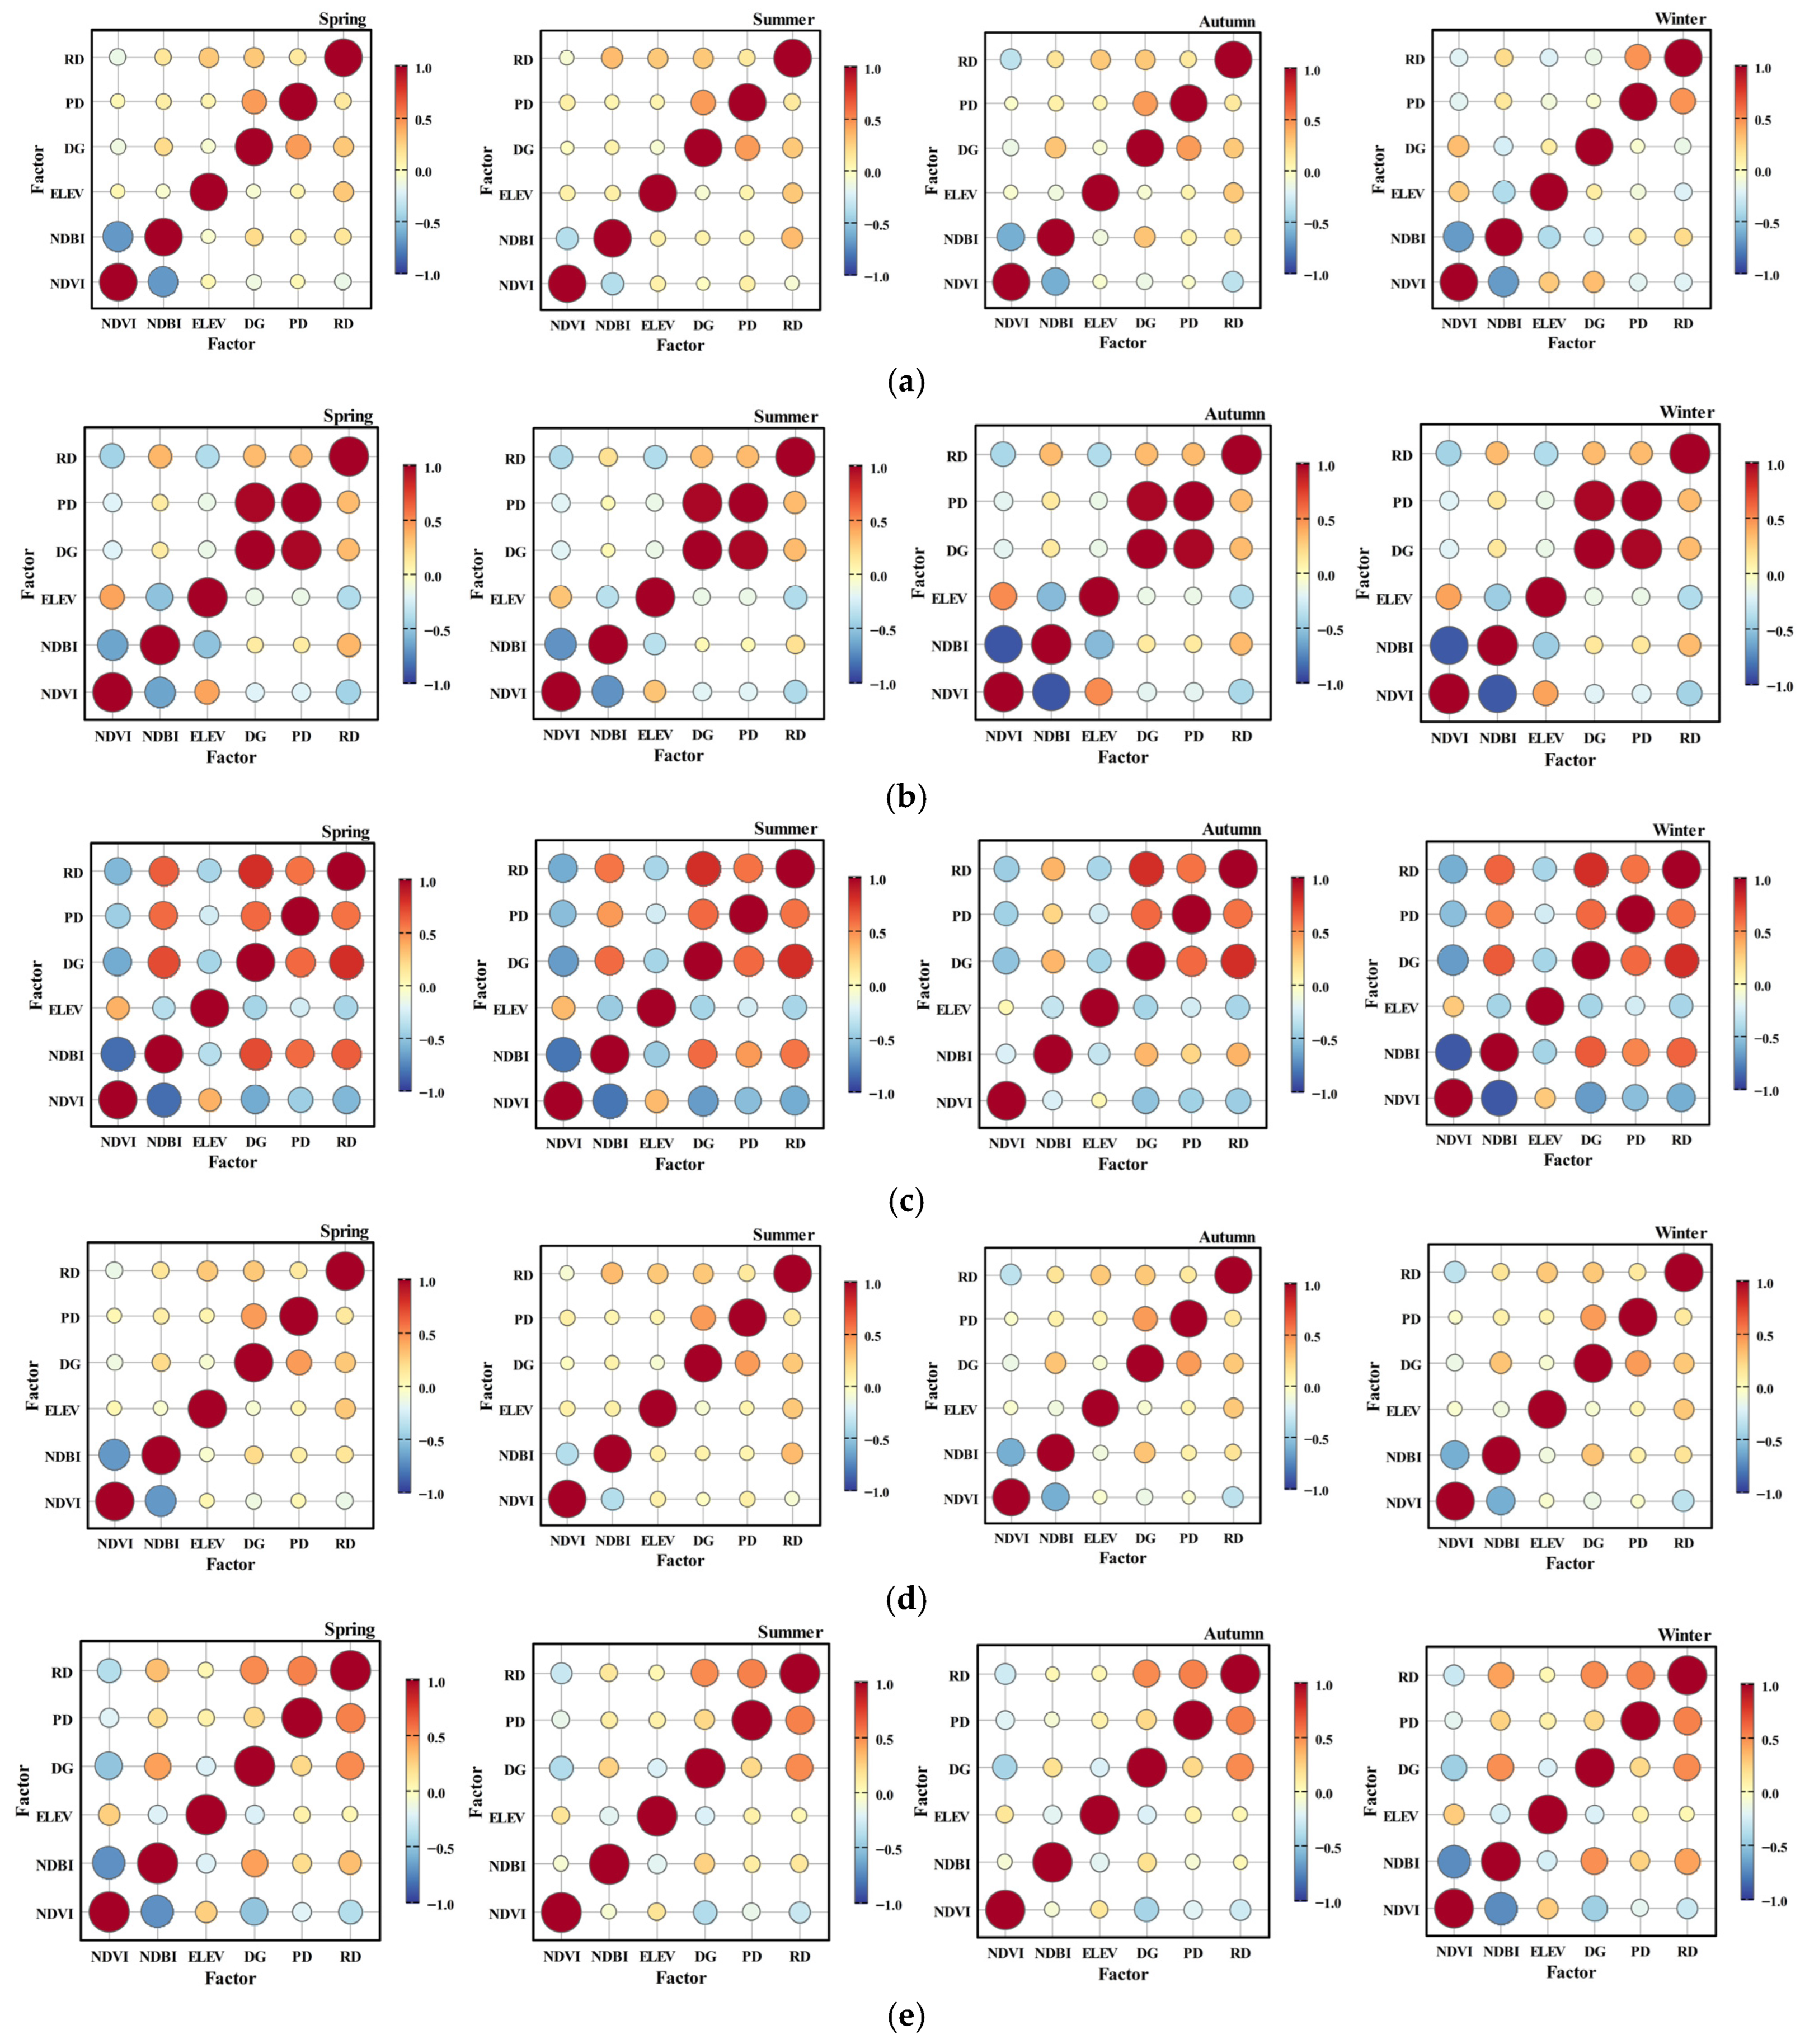
Figure 7 uncovers both universal patterns and locally heterogeneous characteristics in the interactions among factors shaping urban thermal environments. By analyzing correlation matrices of surface parameters across five globally representative coastal cities–Singapore, Miami, Dalian, Xiamen, and Rio–the research identifies three fundamental spatial relationships that consistently emerge across these diverse urban contexts. At the general level, the analysis confirms the ubiquitous presence of the following three spatial relationships in coastal cities: (1) NDVI and NDBI exhibit a stable negative correlation across all five cities, reflecting an inherent competitive and substitutive spatial relationship between vegetation coverage and impervious built-up surfaces–thereby constituting a foundational spatial pattern of urban surface composition; (2) urban structural indicators–including building density, population density, and road network density–consistently show moderate to strong positive intercorrelations, revealing a universal tendency toward synergistic spatial agglomeration of high-intensity urban development elements; and (3) topographic elevation demonstrates weak correlations with most other surface parameters, suggesting that, under conditions of intense coastal urbanization, anthropocentric modifications to the land surface may substantially override the natural constraints imposed by terrain. At the differential level, factor correlation patterns across cities exhibit marked uniqueness, reflecting the distinct stages of urban development, planning paradigms, and environmental contexts characteristic of each locality. First, directional specificity is evident: unlike most cities, where vegetation indices (e.g., NDVI) and development intensity (e.g., building density) display a negative correlation, Dalian exhibits a robust positive association between NDVI and building density. This pattern may signal deliberate planning practices–such as widespread implementation of three-dimensional greening or strategic preservation of large ecological patches within densely built environments–thereby pointing to a viable model for reconciling “high density” with “high greening.” Second, correlation intensity displays notable extremity: Xiamen demonstrates near-perfect collinearity between building density and population density–a feature absent in other cities–implying that its urban governance frameworks or land development models have engendered exceptional spatial congruence between these two density metrics. Moreover, the strength of association between the built-up area index (e.g., NDBI) and urban morphological factors varies substantially across cities; specifically, the positive correlation between NDBI and building density follows the descending order: Rio > Singapore > Miami > Xiamen > Dalian. There are notable differences in seasonal dynamics: Dalian exhibits an atypical pattern wherein the correlation between NDVI and NDBI shifts from negative to positive during specific phenological stages–a phenomenon most likely attributable to local idiosyncratic vegetation phenology or periodic agricultural activities that alter surface spectral characteristics. This underscores the critical influence of seasonal factors when analyzing urban–ecological interactions within distinct climatic zones. In contrast, Miami and Singapore display markedly stable seasonal correlation coefficients between NDVI and NDBI. Moreover, the negative correlation between NDVI and urban morphological indicators is comparatively weaker in Xiamen and Miami than in Singapore and Rio. In summary, this study reveals that although coastal cities generally conform to the fundamental principles of spatial antagonism between vegetation and built-up land, as well as the synergistic agglomeration of urban development elements, the magnitude, direction, and even temporal (particularly seasonal) dynamics of these correlations are profoundly shaped by local planning policies, stages of urban development, and regional natural conditions–including climate, topography, and land-use history. Consequently, thermal environment research and ecological planning for coastal cities must not only account for universal biophysical laws but also rigorously incorporate localized contextual knowledge to accurately disentangle the drivers of urban heat island effects and to formulate contextually appropriate, adaptive mitigation strategies.

4.4. Influence of Coastline on KEY Influencing Factors

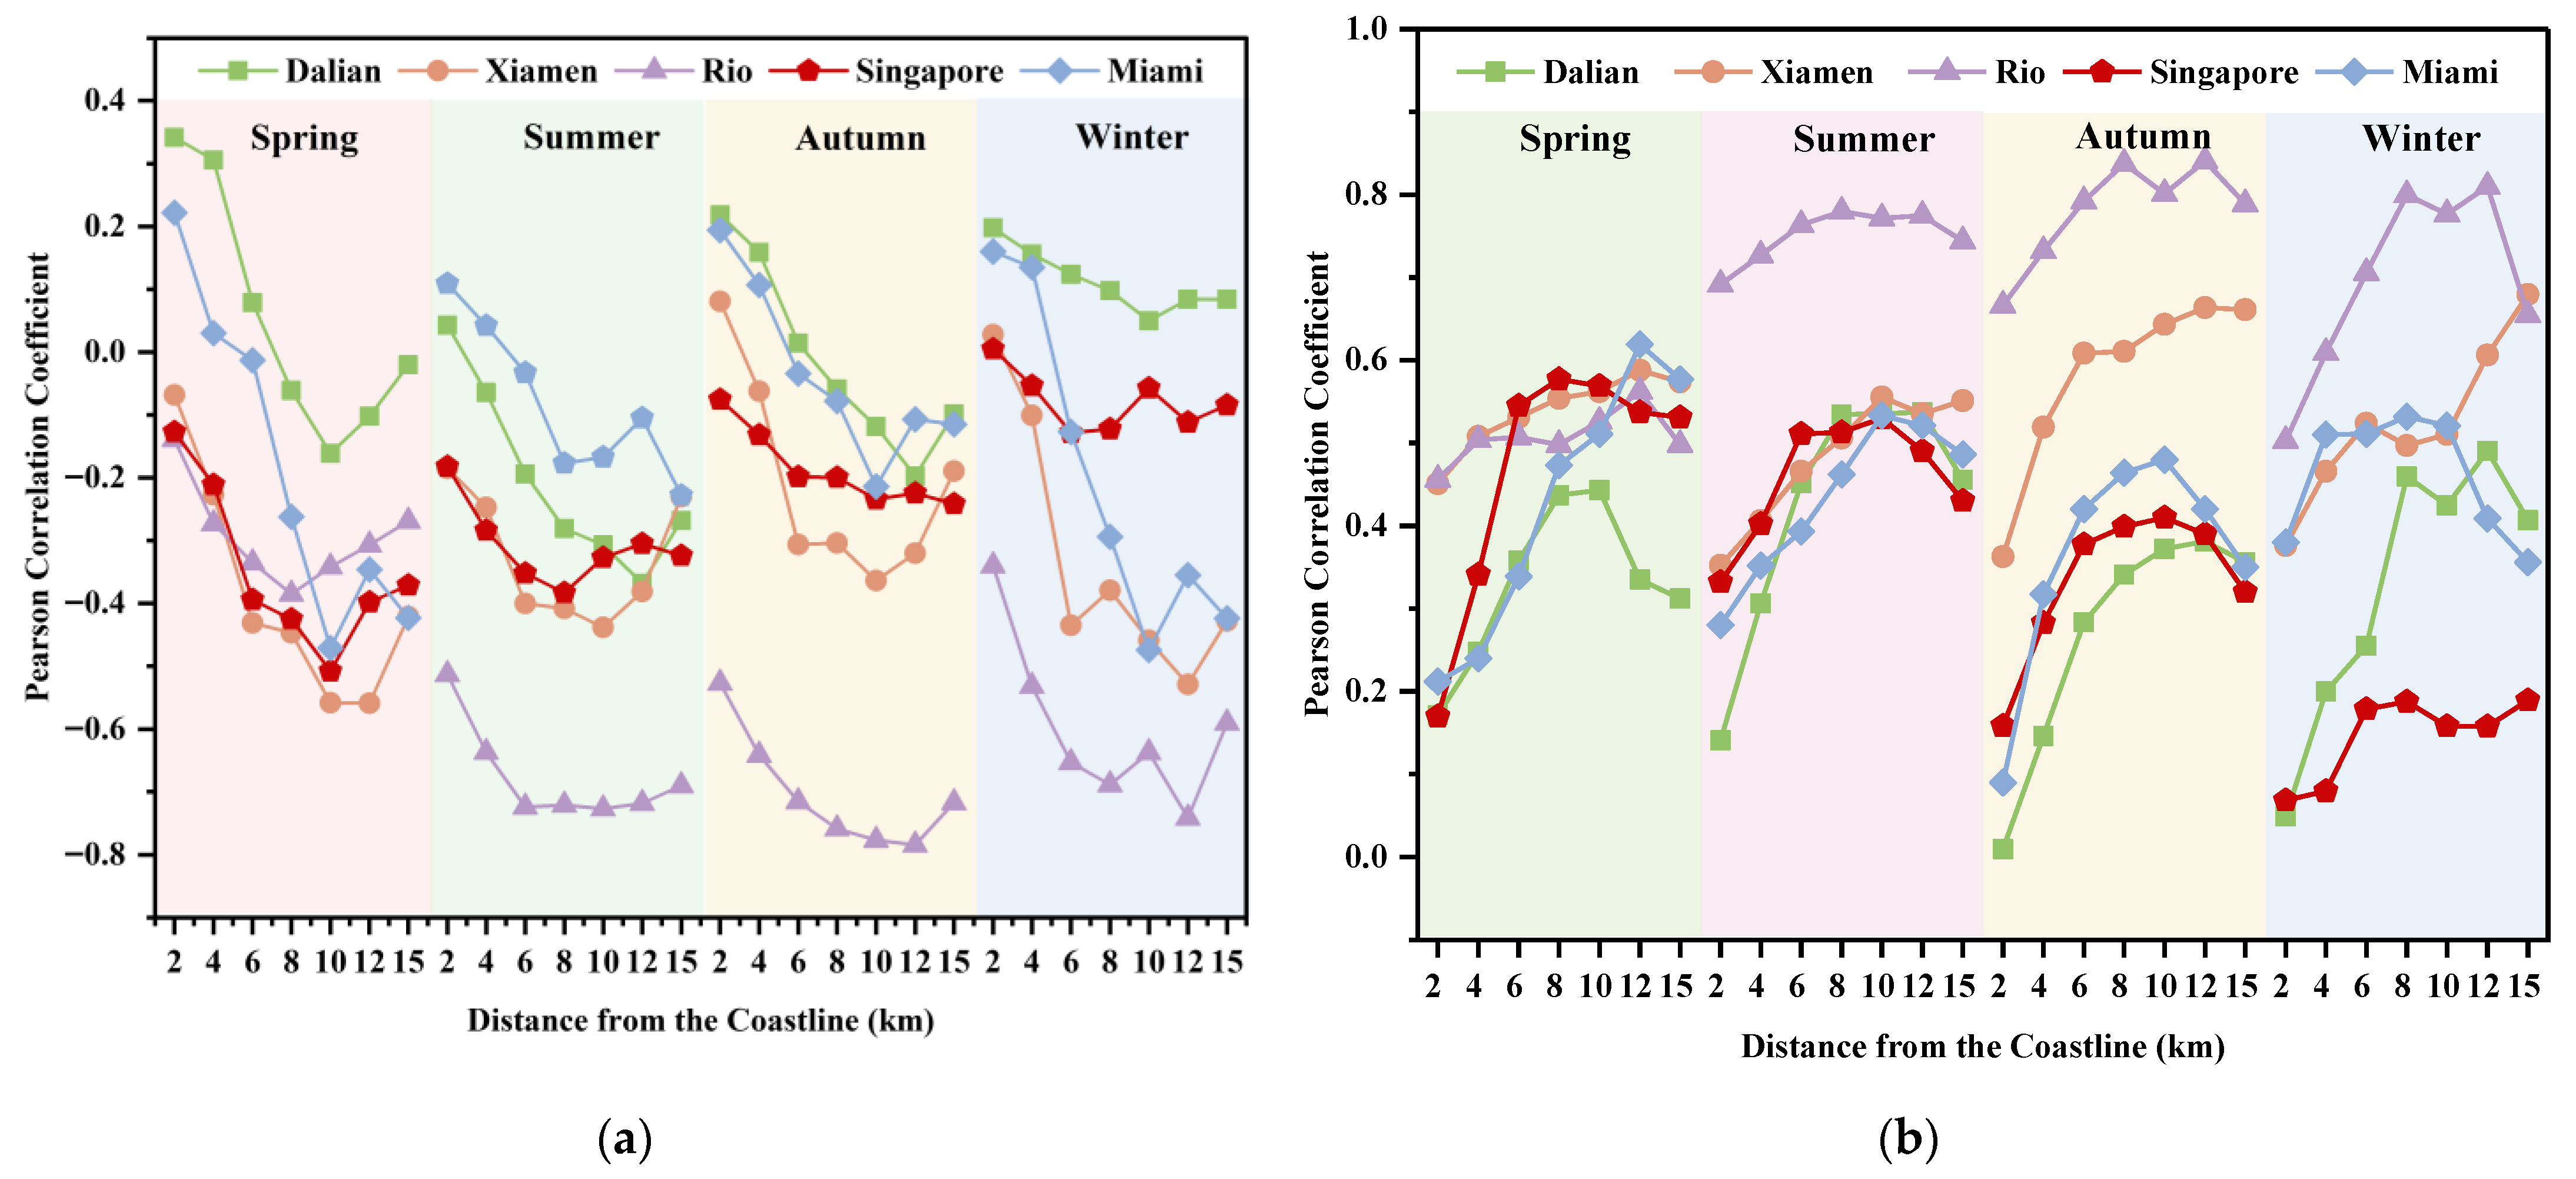
As illustrated in Figure 8a, regarding the correlation between NDVI and SUHII, all five areas exhibit a stable negative correlation, with a consistent core trend: in nearshore areas (2–4 km), the cooling effects of vegetation, such as transpiration and shading, are suppressed by the buffering effect of oceanic cooling. As a result, the negative correlation between NDVI and SUHII is weaker in these areas, and some cities even show a weak positive correlation nearshore. As the distance from the shore increases (4–8 km), the cooling influence of the ocean gradually diminishes, while the cooling mechanisms of vegetation become more pronounced, leading to continuously improving cooling efficiency. Consequently, the negative correlation between NDVI and SUHII strengthens. When the distance from the shore exceeds 8 km, the influence of the ocean becomes negligible, and vegetation becomes the dominant regulating factor for land surface temperature in inland areas. The negative correlation remains at a high level until beyond 12 km, where it slightly declines but still maintains a strong association. Additionally, the cooling effect of NDVI exhibits a critical saturation threshold. Within the range of 8–12 km, the cooling effect of NDVI reaches a critical state. When NDVI exceeds this threshold, the cooling effect tends to plateau. Seasonal variations alter the strength of the correlation without changing the overall trend, with stronger correlations generally observed in summer/autumn compared to winter/spring. Moreover, the seasonal differences become more pronounced at higher latitudes.
Figure 8b illustrates the variation in the relationship between NDBI and the SUHII as a function of increasing distance from the coastline across the five areas and different seasons. Regarding the correlation between NDBI and SUHII, all five areas exhibit a spatial evolution pattern opposite to that of NDVI. In coastal nearshore areas, the cooling buffering effect of the ocean effectively limits the heating impact of building density. As a result, the positive correlation between NDBI and SUHII is relatively weak, and NDBI values are generally low. As the distance from the shore increases, the buffering effect of the ocean continues to diminish, while the heat absorption and release characteristics of urban underlying surfaces, such as concrete and asphalt, become more pronounced. The heat island effect in densely built areas is further intensified, leading to a gradual rise in NDBI values with increasing distance from the shore and a strengthening positive correlation with SUHII. When the distance from the shore reaches a critical peak range, NDBI values show a slight decline, and the strength of the positive correlation with SUHII also weakens, reflecting the saturation characteristic of built-up area aggregation. In terms of seasonal patterns, the variation in NDBI across the four seasons aligns with the spatial gradient. Seasons primarily influence the absolute magnitude of NDBI without altering the core trend. Overall, NDBI values are slightly higher in summer/autumn compared to winter/spring, which is related to the intensity of urban construction activities and the indirect impact of seasonal vegetation changes on built-up area identification. Further exploration of potential threshold effects reveals that NDBI exhibits a clear critical peak threshold. In most cities, NDBI reaches its peak within the 8–12 km range. Beyond this distance, NDBI values show a slight decline as the distance continues to increase.

5. Discussion

5.1. Spatial Heterogeneity and Seasonal Dynamics of SUHII

Based on the detection of SUHII in five areas across different climate zones and in conjunction with existing relevant research findings, this study focuses on a comparative analysis of the common characteristics, regional differences, and formation mechanisms of heat island distribution. It clarifies the connections and innovations of this research in relation to previous studies, providing theoretical support for urban heat island mitigation. The common characteristics of heat island distribution in the five areas are highly consistent with the conclusions of existing research. Previous studies have indicated significant thermal differences between built-up and natural areas [51,52], and the results of this study further verify this conclusion—regardless of the climate zone, high-density built-up areas in all five areas consistently form heat island cores, while vegetated areas exhibit stable cooling effects, forming cold island regions.
The regional differences in heat island distribution among cities in different climate zones are a key focus of this study, complementing and extending previous research. Dalian exhibits a typical “summer-high and winter-low” seasonal pattern, which aligns with the findings of Wang et al. [53,54] on heat islands in temperate cities. The core reason lies in the significant seasonality of vegetation physiological activity under temperate climates: vegetation sheds leaves in winter, reducing the cooling effect, while in summer, lush vegetation combined with high temperatures and human activities leads to peak heat island intensity. In contrast, Xiamen and Rio show relatively flat seasonal fluctuations in heat island intensity, with stable spatial distribution across all four seasons. This is consistent with the findings of Jia et al. [55] on heat islands in subtropical cities, primarily due to the mild and humid climate year-round in subtropical and tropical regions, where vegetation remains active and continuously exerts cooling effects, thereby mitigating seasonal fluctuations in heat islands. Additionally, Singapore and Miami both exhibit significant seasonal fluctuations in heat islands, which aligns with the findings of Chiluwal et al. [56], showing notable differences between winter and summer.

5.2. Analysis of Factors Influencing SUHII

This study systematically examines the SUHII and its influencing factors in five cities across different climate zones—Dalian, Xiamen, Rio, Miami, and Singapore—and compares the common characteristics, regional differences, and formation mechanisms of the effects of these factors, building upon existing relevant research findings.
The influence of various factors on SUHII exhibits significant seasonal dynamics and spatial heterogeneity, a core characteristic that aligns closely with conclusions from prior studies. At the same time, the findings of this study further enrich the research cases across different climate zones. Previous research has indicated that NDVI, as a key indicator of vegetation coverage, plays a critical role in mitigating urban heat islands through its cooling effect. The results of this study fully validate this conclusion: NDVI consistently demonstrates an inhibitory effect on SUHII across all five cities, primarily through two pathways: first, vegetation transpiration converts solar energy into latent heat, lowering air and surface temperatures; second, vegetation shading reduces the direct absorption of solar radiation by the surface. Consistent with the studies by Bai et al. [57] and Yang et al. [58], this study finds that the cooling effect of NDVI is most pronounced in summer, primarily due to vigorous vegetation growth and enhanced transpiration during this season, which maximizes cooling efficiency. Additionally, this study complements the findings by highlighting differences across climate zones: the inhibitory effect of NDVI on SUHII in the tropical city of Rio de Janeiro is significantly stronger than in the temperate city of Dalian and the subtropical city of Xiamen. This difference underscores the regulatory role of climatic background on vegetation cooling efficiency, as the warm and humid climate in tropical regions supports more stable vegetation growth and more prominent cooling effects year-round.
Regarding the influence of NDBI, the results of this study align with the conclusions of Ali et al. [59] and Geng et al. [60]. NDBI consistently enhances SUHII across all seasons in the five cities, demonstrating a stable warming effect that is particularly prominent in industrial zones and high-density built-up areas. The primary reason lies in the characteristics of urban building materials, which have high thermal capacity and low albedo, facilitating the conversion of solar radiation into sensible heat. Additionally, impermeable surfaces hinder soil moisture evaporation. Together, these factors exacerbate surface heating and intensify the heat island effect. This further supports the dominant influence of urban morphology—such as building density and the proportion of impermeable surfaces—on heat island intensity, echoing the earlier conclusion about the impact of land use types on heat island distribution. It also complements the spatial differences across various LCZs: the warming effect of NDBI is more significant in densely built areas and relatively milder in open built-up areas.
The influence of ELEV on SUHII exhibits clear spatial differentiation, a characteristic consistent with the findings of Chen et al. [61]. The results of this study show that in built-up areas, ELEV generally correlates negatively with SUHII, indicating that higher terrain elevation can partially alleviate the heat island effect. However, this correlation varies significantly across different LCZs, likely due to the need to consider regional terrain fluctuations, building distribution, and ventilation conditions when assessing the impact of elevation.
The influence of anthropogenic factors (NL, RD, PD) on SUHII shows significant spatiotemporal variations, consistent with the conclusions of prior studies [62,63,64]. All three factors demonstrate a significant enhancing effect on the heat island effect in summer. The primary reason is the increased frequency of human activities in summer—such as industrial production, transportation, and residential energy use—which elevates anthropogenic heat emissions. Additionally, high temperatures exacerbate heat accumulation, further intensifying the heat island effect. Furthermore, this study reveals differences in anthropogenic factors across climate zones and LCZs: in areas with high vegetation coverage, NL correlates negatively with SUHII, likely because the cooling effect of vegetation offsets part of the impact of anthropogenic heat emissions. In high-density residential areas, the warming effect of PD is more pronounced in winter, while in low-rise residential areas, it shows a sustained negative correlation. In industrial zones, the influence of RD and PD is minimal, possibly because heat island effects are already high in these densely built, vegetation-sparse areas, reducing the marginal impact of anthropogenic factors.

5.3. Analysis of Influencing Factors of UHI Based on Coastal Distance Gradients

Based on a multi-scale analysis of five coastal cities—Dalian, Xiamen, Rio, Miami, and Singapore—this study reveals the dynamic patterns by which the NDVI and NDBI influence the SUHII with increasing distance from the coastline, thereby deepening the understanding of the intrinsic mechanisms of land–sea interactions in urban thermal environments. The formation of these impact characteristics is the result of the combined coupling effect of natural factors such as the natural climate background and land–sea geographical characteristics, as well as anthropogenic factors such as urban construction patterns and human activity intensity [65,66]. The specific phenomena and core causes are integrated as follows: In terms of correlation strength, cities in different climate zones show a differentiated characteristic of “tropical and subtropical cities > temperate cities”. For NDVI, Rio and Xiamen have the highest absolute peak values of negative correlation, indicating the most significant cooling effect of vegetation, followed by Singapore, and Dalian has the lowest. The core reason is that tropical and subtropical cities have uniform hydrothermal conditions, with vegetation remaining evergreen throughout the year and stable coverage; the NDVI values are relatively high with small fluctuations, and the cooling effect plays a continuous role. In contrast, temperate cities have distinct four seasons; vegetation sheds leave in winter, leading to a sharp drop in NDVI and the loss of the cooling effect. For NDBI, Singapore has the highest overall correlation strength, followed by Rio, Xiamen is at a medium level, and Miami and Dalian are relatively low. The reason lies in the high thermal background in tropical and subtropical regions, where the thermal effect of the hardened underlying surface of buildings is more significant, which also enhances the correlation between NDBI and SUHII.
In terms of seasonal variation characteristics, the degree of seasonal differentiation among various cities presents a pattern of “temperate cities > subtropical cities > tropical cities”, which is closely related to the thermal environment differences in different climate zones. Dalian has the most significant seasonal differentiation, Xiamen is at a medium level, and Rio, Miami, and Singapore have minimal seasonal variations and remain stable throughout the year. The core reason is that as a temperate city, Dalian has significant seasonal differences in hydrothermal conditions, obvious seasonal changes in vegetation phenology, significant seasonal differences in human activities, and large fluctuations in anthropogenic heat emissions, which further strengthen seasonal differentiation. Tropical and subtropical cities have stable hydrothermal conditions throughout the year, no obvious seasonal changes in vegetation phenology, and uniform human activity intensity and anthropogenic heat emissions throughout the year, which weaken seasonal fluctuations.
In summary, the urban heat island effects in the five coastal areas result from the combined influence of land–sea interactions and underlying surface characteristics. The common patterns reflect a unified evolutionary logic of the thermal environment in coastal cities [67], while differences in correlation strength and seasonal fluctuations due to temperature zone variations highlight the regulatory role of climatic conditions on thermal environment evolution. Therefore, in planning practices, nearshore areas should prioritize the synergistic development of sea breeze corridors and green space networks, while inland areas need to focus on increasing green space coverage and reasonably controlling building density. Additionally, adaptive strategies should be tailored to temperature zone differences. Tropical cities should mitigate heat accumulation by optimizing building layouts, adopting high-albedo materials, and implementing vertical greening. Temperate cities need to select localized deciduous vegetation to balance seasonal demands for summer shading, winter windbreak, and insulation. Subtropical cities can integrate evergreen and deciduous vegetation types, paired with adjustable shading and ventilation designs. All urban areas should establish climate-adaptive planning systems that thoroughly integrate vegetation configurations with building designs according to local climatic characteristics. Such systems will facilitate effective mitigation of heat island through a systematic optimization of interactions among “vegetation-building-climate”.

5.4. Limitations and Future Work

Nevertheless, this study acknowledges several limitations. While the fixed-distance zoning method employed offers operational convenience, it inadequately captures the actual influences of topographic relief and urban morphology on sea breeze penetration. Within the study area, topographic features such as mountains and valleys can significantly alter sea breeze pathways, whereas clusters of buildings affect infiltration dynamics through variations in building height and street orientation. These intricate spatial variations pose challenges for the fixed-distance approach to accurately delineate the true boundaries of marine regulation. Consequently, future research should integrate topographic analysis to dynamically ascertain the actual extent of sea breeze influence while also considering the guiding effects of urban ventilation corridors on sea breeze trajectories. Such improvements would facilitate a more precise identification of land–sea interaction interfaces, thereby providing a more robust scientific foundation for regulating thermal environments in coastal cities.

6. Conclusions

This study elucidates the dynamic variations and influencing factors associated with the SUHII in coastal cities in middle and low latitudes, highlighting the integrated effects of climatic conditions, land–sea interactions, urban morphology, and human activities. The investigation reveals significant spatio-temporal heterogeneity in SUHII across the five representative coastal areas—Dalian, Xiamen, Rio, Singapore, and Miami—situated in distinct climatic zones. While the SUHII in the five study areas generally exhibits significant spatial heterogeneity and seasonal dynamics, the magnitude and influencing factors of seasonal variations in SUHII differ substantially among distinct climatic zones. Consistent with the basic spatial pattern of urban thermal environments (i.e., “heat islands in built-up areas” and “cold islands in natural areas”), this study further supplements and deepens this understanding: it is found that such seasonal SUHII variations are not merely a reflection of a single factor, but the result of the synergistic coupling effect of the local climatic background and urban morphological characteristics. This specific finding fills the research gap in current studies regarding the differential responses of SUHII seasonal dynamics to climate-urban morphology interactions across different climatic zones.
The analysis of determinants underscores a multifaceted interplay between natural and anthropogenic factors. The NDBI and the NDVI emerge as the primary determinants, exerting warming and cooling effects on SUHII, respectively. Elevation further alleviates thermal intensity, whereas anthropogenic factors such as NL, RD, and PD intensify thermal effects, particularly during summer. These findings emphasize the necessity for targeted, context-specific regulatory strategies.
Coastal distance gradient analysis further reveals the critical moderating role of marine environments. The correlation between NDVI and SUHII strengthens with increasing distance from the coast, indicating vegetation’s predominant cooling role in inland areas. Conversely, the heating impact associated with NDBI intensifies farther from shorelines. Nearshore regions benefit from marine regulation, resulting in moderated heat island intensity, while inland areas rely more heavily on surface cover characteristics for thermal regulation. Moreover, both the cooling efficiency of vegetation and the heating effect of built-up areas exhibit significant differentiation across climatic zones—jointly influenced by regional climate conditions and surface cover properties. Specifically, vegetation cooling efficacy tends to be more effective at lower latitudes, while the thermal burden imposed by built-up areas intensifies correspondingly.
In summary, the findings provide a scientific foundation for developing multidimensional regulatory frameworks that integrate climate-space-season perspectives. This offers practical guidance for climate-adaptive urban planning and sustainable development in coastal cities in middle and low latitudes.

Author Contributions

E.Z.: Writing—original draft, Visualization, Validation, Data curation, Methodology, Funding acquisition, Conceptualization. X.L.: Writing—review and editing, Supervision, Methodology. Y.W.: Writing—review and editing, Methodology, Supervision. All authors have read and agreed to the published version of the manuscript.

Funding

This study was supported by the National Natural Science Foundation of China (grant 42271355).

Data Availability Statement

The data supporting the reported results are available on reasonable request to the first author.

Conflicts of Interest

The authors declare that they have no known competing financial interests or personal relationships that could have appeared to influence the work reported in this paper.

Appendix A

Table A1, Table A2, Table A3, Table A4 and Table A5 provide complete data support for the correlation conclusions presented in Section 4.3 of the main text.
Table A1. The influence of different influencing factors on SUHII across the four seasons in Dalian. *: p < 0.05, **: p < 0.01.
SeasonLCZ TypeNDVINDBIELEVNLPDRD
SpringLCZ 2−0.08 **0.11 **−0.05 **−0.020.18 **0.05 **
LCZ 3−0.05 **0.09 **−0.05 **0.04 *0.02 **−0.03 *
LCZ 40.01 **−0.020.16 **0.19 **0.28 *0.14 **
LCZ 5−0.24 **0.08 **−0.10 *0.14 **0.17 **0.10 **
LCZ 6−0.13 *0.17 **−0.14 **−0.15 **0.02−0.03 *
LCZ 80.040.10 *0.03 **−0.03 *−0.02−0.03 **
LCZ 90.03 *−0.04 *0.08 *0.12 **0.01−0.12 **
LCZ A0.02 **0.22 **0.010.06 **−0.03 *−0.09 **
LCZ B0.010.12 **−0.010.03 **−0.04 *−0.16 **
SummerLCZ 2−0.35 **0.40 **−0.130.09 **0.07 **0.02 *
LCZ 3−0.38 **0.38 **−0.070.28 **0.18 **0.21 **
LCZ 4−0.40 **0.38 **0.06 **0.30 **0.27 **0.27 **
LCZ 5−0.56 **0.55 **−0.31 **0.25 **0.21 **0.21 **
LCZ 6−0.40 **0.50 **−0.23 **0.060.10 **0.11
LCZ 8−0.40 **0.45 **−0.06 **0.16 **0.200.16 **
LCZ 9−0.37 **0.44 **−0.10 *0.15 *0.11 **0.11 *
LCZ A−0.14 **0.17 **−0.17 **0.14 **−0.010.06 **
LCZ B−0.070.26 **−0.11 **0.010.010.02 **
AutumnLCZ 2−0.08 **0.10 **−0.10 **0.03 **0.05 **0.11 **
LCZ 30.13 **−0.10 **−0.13 **0.02 **0.01 **0.18 **
LCZ 4−0.05 *0.13 **0.17 **0.24 **0.17 **0.17 **
LCZ 5−0.14 **0.17 **−0.14 **0.1 **0.06 **0.12 **
LCZ 60.04 **−0.07 **−0.20 **−0.07 **−0.01 **0.04 **
LCZ 8−0.08 **0.05 **−0.06 **0.08 **−0.01 **−0.03 **
LCZ 90.19 **−0.31 **−0.16 **0.14 **−0.01 **0.12 **
LCZ A0.57 **−0.32 **−0.41 **0.19 **0.090.20 **
LCZ B0.18 **−0.34 **−0.10 **0.16 **0.030.10 **
WinterLCZ 2−0.06 **0.01−0.11 **0.02 **0.110.14 **
LCZ 30.01−0.14 **−0.23 **0.09 **0.020.25 **
LCZ 40.19 **0.07 **0.27 **0.26 **0.26 **0.21 **
LCZ 50.16 **0.07 **−0.02 **0.03 **0.040.13 **
LCZ 60.23 **0.06 **−0.04 **−0.08 **−0.06 **0.08 **
LCZ 80.11 **0.04 **−0.06 **0.03 **0.050.07 **
LCZ 90.12 **0.07 **−0.12 **0.07 **−0.03 **0.13 **
LCZ A0.27 **0.02 **−0.36 **0.21 **0.09 **0.23 **
LCZ B0.14 **0.17 **−0.15 **0.17 **0.06 **0.15 **
Table A2. The influence of different influencing factors on SUHII across the four seasons in Xiamen. *: p < 0.05, **: p < 0.01.
SeasonLCZ TypeNDVINDBIELEVNLPDRD
SpringLCZ 2−0.15 ** 0.15 **0.06 ** −0.05 −0.13 ** 0.01 **
LCZ 3−0.11 0.02 **0.16 ** 0.01 ** 0.11 ** 0.10 **
LCZ 4−0.05 0.21 **0.10 0.12 ** 0.08 0.07 **
LCZ 5−0.30 **0.25 **−0.37 ** 0.12 ** 0.09 ** 0.04 **
LCZ 6−0.35 ** 0.36 **−0.16 ** 0.26 ** 0.10 ** 0.20 **
LCZ 8−0.13 **0.20 ** 0.12 ** 0.14 ** 0.05 ** 0.08 **
LCZ 9−0.29 ** 0.17 ** −0.34 ** 0.28 ** 0.21 ** 0.12 **
LCZ A−0.13 **0.26 ** −0.40 ** 0.27 ** 0.12 ** 0.22 **
LCZ B−0.06 **0.08 ** −0.35 ** 0.23 ** 0.10 ** 0.21 **
SummerLCZ 2−0.19 ** 0.31 ** −0.09 ** −0.28 ** −0.21 ** −0.11 *
LCZ 3−0.21 ** 0.16 ** 0.06 ** 0.05 −0.04 0.11 **
LCZ 4−0.10 0.31 ** −0.03 ** 0.01 0.01 0.01 **
LCZ 5−0.38 0.26 ** −0.20 ** 0.05 ** 0.04 ** 0.04
LCZ 6−0.49 ** 0.49 ** −0.22 ** 0.27 ** 0.06 ** 0.18 **
LCZ 8−0.26 ** 0.37 ** 0.07 0.09 0.06 ** −0.02 **
LCZ 9−0.49 ** 0.53 ** −0.56 ** 0.34 ** 0.23 ** 0.15 **
LCZ A−0.10 ** 0.23 ** −0.43 V 0.28 **0.18 ** 0.27 **
LCZ B−0.16 ** 0.22 ** −0.51 ** 0.23 ** 0.16 ** 0.29 **
AutumnLCZ 2−0.23 ** 0.20 ** 0.03 ** −0.12 ** −0.25 ** −0.28 **
LCZ 3−0.20 ** 0.08 ** 0.15 ** 0.06 0.06 −0.08 **
LCZ 4−0.14 ** 0.27 ** 0.05 ** 0.19 ** 0.07 0.02 **
LCZ 5−0.31 ** 0.30 ** −0.37 ** 0.29 ** 0.05 ** 0.10 *
LCZ 6−0.48 ** 0.41 ** −0.33 ** 0.29 ** 0.07 ** 0.18 **
LCZ 8−0.27 ** 0.18 ** 0.09 0.18 ** 0.04 0.02 **
LCZ 9−0.46 ** 0.47 ** −0.74 ** 0.39 ** 0.29 ** 0.13 **
LCZ A−0.19 ** 0.30 ** −0.66 ** 0.45 ** 0.20 ** 0.29 **
LCZ B−0.16 ** 0.19 ** −0.72 ** 0.36 ** 0.16 ** 0.31 **
WinterLCZ 2−0.08 0.18 ** −0.04 ** −0.19 ** −0.32 ** −0.27 **
LCZ 3−0.04 0.03 * 0.22 ** −0.12 * −0.11 −0.11
LCZ 40.14 ** 0.10 ** 0.12 ** 0.18 ** 0.04 0.09 **
LCZ 50.03 * 0.06 ** −0.26 ** 0.26 ** 0.06 0.04
LCZ 6−0.23 ** 0.33 ** −0.20 ** 0.14 ** 0.02 0.07 **
LCZ 8−0.05 0.22 ** 0.09 ** 0.01 0.03 −0.07 **
LCZ 9−0.12 ** 0.19 ** −0.35 ** 0.20 ** 0.23 ** 0.04 **
LCZ A0.13 ** 0.10 ** −0.45 ** 0.21 ** 0.08 ** 0.12 **
LCZ B−0.06 * 0.20 ** −0.33 ** 0.14 ** 0.05 ** 0.08 **
Table A3. The influence of different influencing factors on SUHII across the four seasons in Rio. *: p < 0.05, **: p < 0.01.
SeasonLCZ TypeNDVINDBIELEVNLPDRD
SpringLCZ 2−0.12 ** −0.31 ** −0.28 **−0.15 ** −0.47 ** 0.19 **
LCZ 3−0.10 ** 0.26 ** −0.09 **0.44 ** −0.15 ** 0.09 **
LCZ 4−0.20 0.26 ** −0.040.25 ** 0.01 0.45 **
LCZ 50.13 ** 0.05 ** −0.050.49 ** −0.22 ** 0.19 **
LCZ 6−0.11 ** 0.22 ** 0.12 **0.29 ** 0.01 ** 0.21 **
LCZ 8−0.52 ** 0.53 ** 0.17 **0.42 ** 0.18 ** −0.03 *
LCZ 9−0.42 ** 0.39 ** 0.15 **0.16 ** −0.01 0.28 **
LCZ A−0.58 ** 0.55 ** −0.58 **0.30 ** 0.07 ** 0.32 **
LCZ B0.06 ** 0.08 ** −0.010.47 ** 0.27 ** 0.17 **
SummerLCZ 2−0.17 ** −0.31 ** −0.27 **−0.26 ** −0.47 ** 0.30 **
LCZ 3−0.31 ** 0.21 ** −0.24 **0.33 ** −0.08 ** 0.14
LCZ 4−0.15 ** 0.18 ** −0.18 **0.17 ** 0.02 ** 0.33 **
LCZ 50.19 ** −0.20 ** −0.11 **0.39 ** −0.14 ** 0.21 **
LCZ 6−0.51 ** 0.22 ** −0.15 **0.21 ** 0.08 ** 0.37 **
LCZ 8−0.35 ** 0.47 ** 0.03 **0.31 ** 0.15 ** 0.10 **
LCZ 9−0.33 ** 0.34 ** −0.260.05 −0.01 ** 0.13 *
LCZ A−0.045 0.16 ** −0.63 **0.20 ** 0.15 ** 0.39 **
LCZ B0.16 ** 0.28 ** −0.52 **0.40 ** 0.25 ** 0.31 **
AutumnLCZ 2−0.26 ** 0.25 −0.24 **0.46 ** −0.29 ** 0.21 **
LCZ 3−0.17 ** 0.23 ** −0.20 **0.25 ** −0.15 ** 0.13 **
LCZ 4−0.06 0.26 ** −0.12 **0.08 ** 0.05 0.42 **
LCZ 50.07 ** 0.06 ** −0.16 **0.28 ** −0.18 ** 0.19 **
LCZ 6−0.21 ** 0.24 ** −0.15 **0.21 ** 0.06 0.35 **
LCZ 8−0.12 ** 0.31 ** 0.03 *0.21 ** 0.16 ** 0.07 **
LCZ 9−0.03 0.22 ** −0.14 **0.01 −0.02 0.16
LCZ A0.18 ** 0.27 ** −0.80 **0.16 ** 0.05 ** 0.38 **
LCZ B0.35 ** 0.06 ** −0.41 **0.24 ** 0.13 ** 0.33 **
WinterLCZ 2−0.29 ** −0.08 ** −0.15 **−0.37 ** −0.30 ** 0.14 **
LCZ 3−0.22 ** 0.31 ** −0.14 **0.40 ** −0.15 0.09 **
LCZ 4−0.17 ** 0.32 ** −0.09 **0.19 ** 0.03 ** 0.35 **
LCZ 5−0.10 * 0.17 ** −0.14 **0.45 ** −0.20 ** 0.15 *
LCZ 6−0.17 ** 0.23 ** −0.1 **0.25 ** −0.03 ** 0.24 **
LCZ 8−0.49 ** 0.49 ** 0.05 **0.33 ** 0.16 ** −0.04 **
LCZ 9−0.44 ** 0.40 ** 0.20 **0.18 ** 0.05 ** 0.05
LCZ A−0.48 ** 0.43 ** −0.68 **0.19 ** 0.04 ** 0.32 **
LCZ B−0.07 0.18 ** 0.1 **0.40 ** 0.24 ** 0.06
Table A4. The influence of different influencing factors on SUHII across the four seasons in Singapore. *: p < 0.05, **: p < 0.01.
SeasonLCZ TypeNDVINDBIELEVNLPDRD
SpringLCZ 2−0.27 **0.35 **−0.02 *−0.08 **0.07 **−0.04 **
LCZ 3−0.24 **0.32 **−0.03 *0.07 **0.03 *0.08 **
LCZ 4−0.41 **0.51 **0.01 *0.08 **0.12 **−0.29 **
LCZ 5−0.38 **0.38 **−0.02 **0.02 **0.05 **−0.05 **
LCZ 6−0.36 **0.53 **−0.1 **0.40 **−0.03 *−0.39 **
LCZ 8−0.22 **0.32 **0.04 **0.45 **0.17 **−0.04 **
LCZ 9−0.32 **0.47 **0.03 *0.24 **0.19 **−0.1 **
LCZ A−0.27 **0.35 **−0.02 *−0.08 **0.07 **−0.04 **
LCZ B−0.24 **0.32 **−0.03 *0.07 **0.023 *0.08 **
SummerLCZ 2−0.21 **0.46 **−0.59 **0.141 **−0.41 **−0.03 *
LCZ 3−0.29 **0.34 **−0.38 **0.149 **0.01 *0.25 **
LCZ 4−0.12 **0.43 **−0.15 **0.19 **0.20 **0.09 **
LCZ 5−0.45 **0.52 **−0.34 **0.47 **0.16 **0.36 **
LCZ 6−0.37 **0.54 **−0.23 **0.27 **0.04 **0.01 *
LCZ 8−0.11 **0.39 **−0.19 **0.23 **−0.07 **−0.05 **
LCZ 9−0.44 **0.66 **−0.11 *0.21 **−0.05 *0.01 *
LCZ A−0.26 **0.38 **−0.19 **0.25 **0.02 *0.14 **
LCZ B−0.39 **0.57 **−0.19 **0.32 **−0.07 **0.08 **
AutumnLCZ 2−0.21 **0.28 **−0.23 **−0.12 **0.01 *0.28 **
LCZ 3−0.15 **0.35 **0.14 **−0.18 **0.04 *0.18 **
LCZ 4−0.23 **0.34 **−0.02 **0.020.01 **−0.02 *
LCZ 5−0.09 **0.24 **0.03 *−0.06 **−0.05 **−0.01 *
LCZ 6−0.31 **0.44 **0.09 **0.26 **0.17 **0.26 **
LCZ 8−0.30 **0.36 **−0.04 **0.02 **0.01 **0.08 **
LCZ 9−0.19 **0.36 **0.03 *0.28 **0.13 **0.35 **
LCZ A0.01 *0.15 **0.23 **0.35 **0.20 **0.31 **
LCZ B−0.07 **0.24 **0.06 **0.22 **0.17 **0.30 **
WinterLCZ 2−0.19 **0.29 **−0.01 *−0.39 **0.38 **0.07 *
LCZ 3−0.17 **0.25 **0.22 **−0.01 *0.30 **0.12 **
LCZ 4−0.06 **0.19 **0.04 **−0.04 **−0.02 *0.01 *
LCZ 5−0.19 **0.21 **−0.28 **0.18 **0.09 **0.29 **
LCZ 6−0.26 **0.35 **0.06 **0.16 **0.06 **0.11 **
LCZ 8−0.01 *0.27 **0.04 **0.12 **0.08 **0.07 **
LCZ 9−0.43 **0.63 **−0.1 *0.46 **0.04 *0.11 **
LCZ A−0.16 **0.24 **0.11 **0.26 **0.06 **0.26 **
LCZ B−0.30 **0.47 **0.03 *0.30 **0.08 **0.18 **
Table A5. The influence of different influencing factors on SUHII across the four seasons in Miami. *: p < 0.05, **: p < 0.01.
SeasonLCZ TypeNDVINDBIELEVNLPDRD
SpringLCZ 2−0.42 **0.63 **−0.37 **0.09 **0.07 **0.01 *
LCZ 3−0.48 **0.64 **−0.36 **−0.03 *−0.14 **−0.23 **
LCZ 4−0.26 **0.42 **−0.38 **0.24 **0.25 **0.06 *
LCZ 5−0.36 **0.56 **−0.38 **0.33 **0.07 *−0.21 **
LCZ 6−0.61 **0.69 **−0.14 **0.26 **0.42 **0.17 **
LCZ 8−0.33 **0.62 **−0.46 **0.35 **0.13 **−0.37 **
LCZ 9−0.98 **0.98 **−0.92 *−0.47 **−0.04 *−0.48 **
LCZ A−0.36 *0.22 *0.22 *0.25 **−0.17 *0.17 *
LCZ B−0.756 **0.76 *−0.81−0.48 *−0.76 *0.77 *
SummerLCZ 2−0.30 **0.54 **−0.28 **0.05 *−0.06−0.11 **
LCZ 3−0.40 **0.53 **−0.15 **−0.08 **−0.19 **−0.01 *
LCZ 4−0.40 **0.32 **−0.30 **0.10 *0.13 *0.34 **
LCZ 5−0.29 **0.36 **−0.15 **0.185 **−0.154 **0.276 **
LCZ 6−0.44 **0.46 **−0.16 **0.1450.281 **0.188 **
LCZ 8−0.26 **0.47 **−0.22 **0.224 **0.054 *−0.256 **
LCZ 9−0.07 *0.35 **−0.55 **−0.609 **−0.281 **−0.601 **
LCZ A−0.75 **0.76 **−0.43 *0.429 *0.616 **−0.616 **
LCZ B−0.61 *0.85−0.51 *−0.812 **−0.737 *0.738 *
AutumnLCZ 2−0.02 *0.30 **−0.08 **0.02 *0.04 **0.212 **
LCZ 3−0.09 **0.33 **−0.25 **−0.06 **−0.03 **−0.050
LCZ 4−0.01 **0.01 *−0.12 **0.27 **−0.06 **0.201 **
LCZ 5−0.29 **0.48 **−0.15 **−0.03 *−0.22 **0.015 **
LCZ 6−0.25 **0.39 **−0.05 *−0.11 **−0.01 *−0.146 **
LCZ 8−0.23 **0.44 **−0.13 **0.13 **0.08 **0.088 **
LCZ 9−0.97 *0.76 **−0.16 **0.01 **0.30 **−0.254 **
LCZ A−0.57 **0.53 **−0.55 *−0.41 **0.69 **−0.691
LCZ B−0.54 **0.40 **−0.33 **−0.48 **−0.31 **0.312 *
WinterLCZ 2−0.24 **0.67 **−0.35 **0.08 **0.08 **0.02 *
LCZ 3−0.34 **0.62 **−0.31 **−0.01 *−0.11 **−0.18 **
LCZ 4−0.26 **0.48 **−0.36 **0.32 **0.40 **0.08 *
LCZ 5−0.38 **0.62 **−0.43 **0.42 **0.26 **−0.16 **
LCZ 6−0.49 **0.67 **−0.22 **0.56 **0.66 **0.32 **
LCZ 8−0.32 **0.57 **−0.51 **0.46 **0.25 **−0.37 **
LCZ 9−0.58 *0.44 *−0.94 *−0.26 **−0.03 **−0.34 **
LCZ A−0.32 *0.05 *0.04 *0.43 *−0.01 *0.01 *
LCZ B−0.58 *0.67 *−0.80 **−0.51 *−0.75 *0.76 *

References

  1. Yao, X.; Zhu, Z.; Zeng, X.; Huang, S.; Liu, Q.; Yu, K.; Zhou, X.; Chen, Z.; Liu, J. Linking maximum-impact and cumulative-impact indices to quantify the cooling effect of waterbodies in a subtropical city: A seasonal perspective. Sustain. Cities Soc. 2022, 82, 103902. [Google Scholar] [CrossRef] [Scilit]
  2. United Nations; Department of Economic and Social Affairs; Population Division. World Urbanization Prospects: The 2018 Revision; United Nations: New York, NY, USA, 2019. [Google Scholar]
  3. Neumann, B.; Vafeidis, A.T.; Zimmermann, J.; Nicholls, R.J. Future coastal population growth and exposure to sea-level rise and coastal flooding—A global assessment. PLoS ONE 2015, 10, e0131375. [Google Scholar] [CrossRef] [Scilit]
  4. Deng, X.; Gao, F.; Liao, S.; Liu, Y.; Chen, W. Spatiotemporal evolution patterns of urban heat island and its relationship with urbanization in Guangdong-Hong Kong-Macao greater bay area of China from 2000 to 2020. Ecol. Indic. 2023, 146, 109817. [Google Scholar] [CrossRef] [Scilit]
  5. He, B.; Wang, J.; Zhu, J.; Qi, J. Beating the urban heat: Situation, background, impacts and the way forward in China. Renew. Sustain. Energy Rev. 2022, 161, 112350. [Google Scholar] [CrossRef] [Scilit]
  6. Liu, Y.; Zhang, W.; Liu, W.; Tan, Z.; Hu, S.; Ao, Z.; Li, J.; Xing, H. Exploring the seasonal effects of urban morphology on land surface temperature in urban functional zones. Sustain. Cities Soc. 2024, 103, 105268. [Google Scholar] [CrossRef] [Scilit]
  7. Hao, M.; Liu, X.; Li, X. Quantifying heat-related risks from urban heat island effects: A global urban expansion perspective. Int. J. Appl. Earth Obs. Geoinf. 2025, 136, 104344. [Google Scholar] [CrossRef] [Scilit]
  8. Deng, X.; Yu, W.; Liu, X.; Zhou, W. Surface urban heat island effect intensifies heat stress in residents. In IGARSS 2024-2024 IEEE International Geoscience and Remote Sensing Symposium; IEEE: New York, NY, USA, 2024; pp. 5382–5385. [Google Scholar] [CrossRef] [Scilit]
  9. Ren, Y.; Lafortezza, R.; Giannico, V.; Sanesi, G.; Zhang, X.; Xu, C. The unrelenting global expansion of the urban heat island over the last century. Sci. Total Environ. 2023, 880, 163276. [Google Scholar] [CrossRef] [Scilit]
  10. Richard, Y.; Pohl, B.; Rega, M.; Pergaud, J.; Thevenin, T.; Emery, J.; Dudek, J.; Vairet, T.; Zito, S.; Chateau-Smith, C. Is urban heat island intensity higher during hot spells and heat waves (Dijon, France, 2014–2019). Urban Clim. 2021, 35, 100747. [Google Scholar] [CrossRef] [Scilit]
  11. Moffett, K.B.; Makido, Y.; Shandas, V. Urban-rural surface temperature deviation and intra-urban variations contained by an urban growth boundary. Remote Sens. 2019, 11, 2683. [Google Scholar] [CrossRef] [Scilit]
  12. Chang, Y.; Xiao, J.; Li, X.; Weng, Q. Monitoring diurnal dynamics of surface urban heat island for urban agglomerations using ECOSTRESS land surface temperature observations. Sustain. Cities Soc. 2023, 92, 104833. [Google Scholar] [CrossRef] [Scilit]
  13. Stewart, I.D.; Oke, T.R. Local climate zones for urban temperature studies. Bull. Amer. Meteor. Soc. 2012, 93, 1879–1900. [Google Scholar] [CrossRef] [Scilit]
  14. Demuzere, M.; Kittner, J.; Martilli, A.; Mills, G.; Moede, C.; Stewart, I.D.; van Vliet, J.; Bechtel, B. A global map of local climate zones to support earth system modelling and urban-scale environmental science. Earth Syst. Sci. Data 2022, 14, 3835–3873. [Google Scholar] [CrossRef] [Scilit]
  15. Wang, R.; Wang, M. Multi-scale analysis of surface thermal environment in relation to urban form: A case study of the Guangdong-Hong Kong-Macao Greater Bay Area. Sustain. Cities Soc. 2023, 99, 104953. [Google Scholar] [CrossRef] [Scilit]
  16. Liu, W.; Zhang, L.; Hu, X.; Meng, Q.; Qian, J.; Gao, J.; Li, T. Nonlinear effects of urban multidimensional characteristics on daytime and nighttime land surface temperature in highly urbanized regions: A case study in Beijing, China. Int. J. Appl. Earth Obs. Geoinf. 2024, 132, 104067. [Google Scholar] [CrossRef] [Scilit]
  17. Huang, J.; Huang, Z.; Liu, W. Combining the WRF model and LCZ scheme to assess spatiotemporal variations of thermal comfort in Shenzhen’s built-up areas. Sustain. Cities Soc. 2025, 122, 106252. [Google Scholar] [CrossRef] [Scilit]
  18. Yu, H.; Zhang, C.; Yu, L. Exploration of improvement schemes for simulating LST in Beijing, China over multiple years based on LCZ. Urban Clim. 2025, 59, 102275. [Google Scholar] [CrossRef] [Scilit]
  19. Xi, Y.; Wang, S.; Zou, Y.; Zhou, X.; Zhang, Y. Seasonal surface urban heat island analysis based on local climate zones. Ecol. Indic. 2024, 159, 111669. [Google Scholar] [CrossRef] [Scilit]
  20. Abougendia, S.M. Investigating surface UHI using local climate zones (LCZs), the case study of Cairo’s River Islands. Alex. Eng. J. 2023, 77, 293–307. [Google Scholar] [CrossRef] [Scilit]
  21. Akbari, F.A.; Sharifi, A. Examining the suitability of the local climate zones (LCZ) framework in informal urban settlements: Insights from Kabul, Afghanistan. Sustain. Cities Soc. 2024, 114, 105797. [Google Scholar] [CrossRef] [Scilit]
  22. Fenner, D.; Meier, F.; Bechtel, B.; Otto, M.; Scherer, D. Intra and inter local climate zone variability of air temperature as observed by crowdsourced citizen weather stations in Berlin, Germany. Meteorol. Z. 2017, 26, 525–547. [Google Scholar] [CrossRef] [Scilit]
  23. Arnds, D.; Böhner, J.; Bechtel, B. Spatio-temporal variance and meteorological drivers of the urban heat island in a European city. Theor. Appl. Climatol. 2017, 128, 43–61. [Google Scholar] [CrossRef] [Scilit]
  24. Zhao, Z.; Sharifi, A.; Dong, X.; Shen, L.; He, B. Spatial variability and temporal heterogeneity of surface urban heat island patterns and the suitability of local climate zones for land surface temperature characterization. Remote Sens. 2021, 13, 4338. [Google Scholar] [CrossRef] [Scilit]
  25. Wiesner, S.; Bechtel, B.; Fischereit, J.; Gruetzun, V.; Hoffmann, P.; Leitl, B.; Rechid, D.; Schlünzen, K.H.; Thomsen, S. Is it possible to distinguish global and regional climate change from urban land cover induced signals? A mid-latitude city example. Urban Sci. 2018, 2, 12. [Google Scholar] [CrossRef] [Scilit]
  26. Wu, Z.; Xu, Y.; Cao, Z.; Yang, J.; Zhu, H. Impact of urban agglomeration and physical and socioeconomic factors on surface urban heat islands in the Pearl River Delta Region, China. IEEE J. Sel. Top. Appl. Earth Observ. Remote Sens. 2021, 14, 8815–8822. [Google Scholar] [CrossRef] [Scilit]
  27. Sun, Q.; Wu, Z.; Tan, J. The relationship between land surface temperature and land use/land cover in Guangzhou, China. Environ. Earth Sci. 2012, 65, 1687–1694. [Google Scholar] [CrossRef] [Scilit]
  28. Steeneveld, G.J.; Koopmans, S.; Heusinkveld, B.G.; Theeuwes, N.E. Refreshing the role of open water surfaces on mitigating the maximum urban heat island effect. Landsc. Urban Plan. 2014, 121, 92–96. [Google Scholar] [CrossRef] [Scilit]
  29. Feng, R.; Wang, F.; Wang, K.; Wang, H. Urban ecological land and natural-anthropogenic environment interactively drive surface urban heat island: An urban agglomeration-level study in China. Environ. Int. 2021, 157, 106857. [Google Scholar] [CrossRef] [Scilit] [PubMed]
  30. Peng, S.; Piao, S.; Ciais, P.; Friedlingstein, P.; Ottle, C. Surface urban heat island across 419 global big cities. Environ. Sci. Technol. 2012, 46, 696–703. [Google Scholar] [CrossRef] [Scilit]
  31. Sun, D.; Hu, C.; Wang, Y.; Wang, Z.; Zhang, J. Examining spatio-temporal characteristics of urban heat islands and factors driving them in Hangzhou, China. IEEE J. Sel. Top. Appl. Earth Observ. Remote Sens. 2021, 14, 8316–8325. [Google Scholar] [CrossRef] [Scilit]
  32. Qiao, Z.; Jia, R.; Liu, J.; Gao, H.; Wei, Q. Remote sensing-based analysis of urban heat island driving factors: A local climate zone perspective. IEEE J. Sel. Top. Appl. Earth Observ. Remote Sens. 2024, 17, 17337–17348. [Google Scholar] [CrossRef] [Scilit]
  33. Chan, F.K.S.; Chen, W.Y.; Sang, Y.; Chen, Y.D.; Huang, W.; Chen, W.-Q.; Griffiths, J.; Li, J.; Peng, Y.; Cai, X.; et al. Build in prevention and preparedness to improve climate resilience in coastal cities: Lessons from China’s GBA. One Earth 2021, 4, 1356–1360. [Google Scholar] [CrossRef] [Scilit]
  34. Kim, Y.H.; Baik, J.J. Daily maximum urban heat island intensity in large cities of Korea. Theor. Appl. Climatol. 2004, 79, 151–164. [Google Scholar] [CrossRef] [Scilit]
  35. Kolokotsa, D.; Psomas, A.; Karapidakis, E. Urban heat island in southern Europe: The case study of Hania Crete. Sol. Energy 2009, 83, 1871–1883. [Google Scholar] [CrossRef] [Scilit]
  36. Cai, Y.; Wu, Z.; Chen, Y.; Wu, L.; Pan, W. Investigate the difference of cooling effect between water bodies and green spaces: The study of Fuzhou, China. Water 2022, 14, 1471. [Google Scholar] [CrossRef] [Scilit]
  37. Firozjaei, M.K.; Sedighi, A.; Mijani, N.; Kazemi, Y.; Amiraslani, F. Seasonal and daily effects of the sea on the surface urban heat island intensity: A case study of cities in the Caspian Sea Plain. Urban Clim. 2023, 51, 101603. [Google Scholar] [CrossRef] [Scilit]
  38. Guo, F.; Zhao, J.; Zhang, H.; Dong, J.; Zhu, P.; Lau, S.S.Y. Effects of urban form on sea cooling capacity under the heatwave. Sustain. Cities Soc. 2023, 88, 104271. [Google Scholar] [CrossRef] [Scilit]
  39. Wu, J.; Li, C.; Zhang, X.; Zhao, Y.; Liang, J.; Wang, Z. Seasonal variations and main influencing factors of the water cooling islands effect in Shenzhen. Ecol. Indic. 2020, 117, 106699. [Google Scholar] [CrossRef] [Scilit]
  40. Fu, X.; Gao, Y.; Peng, J.; Guo, W.; Lu, Y.; Wang, X.; Chu, H.; Zhang, Y.; Wang, H. Impacts of the urban heat island on the convective initiation and propagation of an extreme precipitation event in the coastal megacity of Shanghai. Atmos. Res. 2026, 330, 108595. [Google Scholar] [CrossRef] [Scilit]
  41. Díaz-Chávez, L.; Melendez-Surmay, R.; Arregocés, H.A. Urban heat island intensity in coastal cities of northern Colombia using Landsat data and WRF/UCM model. Case Stud. Chem. Environ. Eng. 2024, 9, 100617. [Google Scholar] [CrossRef] [Scilit]
  42. Rajeswari, J.R.; Fountoukis, C.; Siddique, A.; Moosakutty, S.; Mohieldeen, Y.; Ayoub, M.A.; Alfarra, M.R. Urban heat island phenomenon in a desert, coastal city: The impact of urbanization. Urban Clim. 2024, 56, 102016. [Google Scholar] [CrossRef] [Scilit]
  43. Martinelli, A.; Kolokotsa, D.-D.; Fiorito, F. Urban heat island in mediterranean coastal cities: The case of Bari (Italy). Climate 2020, 8, 79. [Google Scholar] [CrossRef] [Scilit]
  44. Sheng, X.L.; Guo, F.; Zhu, P.S.; Zhang, H.C.; Li, W.S.; Miao, S.Y.; Zhao, J.; Dong, J. Winter–summer trade-offs and spatial heterogeneity of the urban thermal environment in a cold coastal city: A Local Climate Zone–based investigation. Build. Environ. 2026, 290, 114130. [Google Scholar] [CrossRef] [Scilit]
  45. Sharmin, T.; Chappell, A.; Lannon, S. Spatio-temporal analysis of LST, NDVI and SUHI in a coastal temperate city using local climate zone. Energy Built Environ. 2025, 6, 1142–1155. [Google Scholar] [CrossRef] [Scilit]
  46. Yang, J.J.; Guo, M.; Wang, L.L.; Zong, L.; Liu, D.Y.; Zhang, W.J.; Wang, M.Y.; Wan, B.C.; Guo, Y.D. Unevenly spatiotemporal distribution of urban excess warming in coastal Shanghai megacity, China: Roles of geophysical environment, ventilation and sea breezes. Build. Environ. 2023, 235, 110180. [Google Scholar] [CrossRef] [Scilit]
  47. Qin, Z.; Karnieli, A.; Berliner, P. A mono-window algorithm for retrieving land surface temperature from Landsat TM data and its application to the Israel-Egypt border region. Int. J. Remote Sens. 2001, 22, 3719–3746. [Google Scholar] [CrossRef] [Scilit]
  48. Bechtel, B.; Demuzere, M.; Mills, G.; Zhan, W.; Sismanidis, P.; Small, C.; Voogt, J. SUHI analysis using local climate zones-a comparison of 50 cities. Urban Clim. 2019, 28, 100451. [Google Scholar] [CrossRef] [Scilit]
  49. Xia, H.; Chen, Y.; Song, C.; Li, J.; Quan, J.; Zhou, G. Analysis of surface urban heat islands based on local climate zones via spatiotemporally enhanced land surface temperature. Remote Sens. Environ. 2022, 273, 112972. [Google Scholar] [CrossRef] [Scilit]
  50. Ye, C.; Liu, Y.; Quan, W.; Liu, W.; Liu, C. Application of urban thermal environment monitoring based on remote sensing in Beijing. Procedia Environ. Sci. 2011, 11, 1424–1433. [Google Scholar] [CrossRef] [Scilit]
  51. Ma, L.; Yang, Z.; Zhou, L.; Lu, H.; Yin, G. Local climate zones mapping using object-based image analysis and validation of its effectiveness through urban surface temperature analysis in China. Build. Environ. 2021, 206, 108348. [Google Scholar] [CrossRef] [Scilit]
  52. Alghamdi, A.S.; Alzhrani, A.I.; Alanazi, H.H. Local climate zones and thermal characteristics in Riyadh city, Saudi Arabia. Remote Sens. 2021, 13, 4526. [Google Scholar] [CrossRef] [Scilit]
  53. Wang, R.; Lu, T.; He, B.; Wang, F.; Huang, Q.; Qian, Z.; Min, J.; Li, Y. Seasonal urban surface thermal environment analysis based on local climate zones: A case study of Chongqing. Sci. Total Environ. 2024, 954, 176577. [Google Scholar] [CrossRef] [Scilit]
  54. Wang, J.; Huang, B.; Fu, D.; Atkinson, P.M. Spatiotemporal variation in surface urban heat island intensity and associated determinants across major Chinese cities. Remote Sens. 2015, 7, 3670–3689. [Google Scholar] [CrossRef] [Scilit]
  55. Jia, W.; Ren, G.; Jin, F.; He, J.; Zhang, P. Spatial-temporal characteristics of the urban heat island effect in Xiamen, China. Urban Clim. 2023, 52, 101725. [Google Scholar] [CrossRef] [Scilit]
  56. K C, S.; Chiluwal, A.; Magar, L.P.; Paudel, K. Investigating Urban Heat Islands in Miami, Florida, Utilizing Planet and Landsat Satellite Data. Atmosphere 2025, 16, 880. [Google Scholar] [CrossRef] [Scilit]
  57. Bai, Y.; Liu, L.; Yang, J.; Wang, J.; Zou, Q. Drivers of land surface temperatures from the perspective of urban functional zones. IEEE J. Sel. Top. Appl. Earth Observ. Remote Sens. 2024, 17, 12274–12285. [Google Scholar] [CrossRef] [Scilit]
  58. Yang, K.; Zhang, J.; Cui, D.; Ma, Y.; Ye, Y.; He, X.; Yang, Z.; Cheng, M.; Zhang, Y. Multi-scale study of the synergy between human activities and climate change on urban heat islands in China. Sustain. Cities Soc. 2025, 125, 106341. [Google Scholar] [CrossRef] [Scilit]
  59. Aslani, A.; Sereshti, M.; Sharifi, A. Urban heat island mitigation in Tehran: District-based mapping and analysis of key drivers. Sustain. Cities Soc. 2025, 125, 106338. [Google Scholar] [CrossRef] [Scilit]
  60. Wu, H.; Ye, L.; Shi, W.; Clarke, K.C. Assessing the effects of land use spatial structure on urban heat islands using HJ-1B remote sensing imagery in Wuhan, China. Int. J. Appl. Earth Obs. Geoinf. 2014, 32, 67–78. [Google Scholar] [CrossRef] [Scilit]
  61. Chen, Y.; Shan, B.; Yu, X. Study on the spatial heterogeneity of urban heat islands and influencing factors. Build. Environ. 2022, 208, 108604. [Google Scholar] [CrossRef] [Scilit]
  62. Shi, S.; Ji, S.; Luo, Z. Spatial heterogeneity, interaction and multi-scale effects of driving factors of heat island intensity in different urban agglomerations. Sustain. Cities Soc. 2025, 126, 106401. [Google Scholar] [CrossRef] [Scilit]
  63. Du, H.; Wang, D.; Wang, Y. Influences of land cover types, meteorological conditions, anthropogenic heat and urban area on surface urban heat island in the Yangtze River Delta Urban Agglomeration. Sci. Total Environ. 2016, 571, 461–470. [Google Scholar] [CrossRef] [Scilit] [PubMed]
  64. Deng, X.; Yu, W.; Shi, J.; Huang, Y.; Li, D.; He, X.; Zhou, W.; Xie, Z. Characteristics of surface urban heat islands in global cities of different scales: Trends and drivers. Sustain. Cities Soc. 2024, 107, 105483. [Google Scholar] [CrossRef] [Scilit]
  65. He, M.; Yuan, C.; Zhang, X. Impacts of green-blue-grey infrastructures on high-density urban thermal environment at multiple spatial scales: A case study in Wuhan. Urban Clim. 2023, 52, 101714. [Google Scholar] [CrossRef] [Scilit]
  66. Gong, X.; Liu, Q.; Lv, Y.; Chen, S.; Wu, S.; Ying, H. A systematic review on the strategies of reducing asphalt pavement temperature. Case Stud. Constr. Mat. 2023, 18, e01852. [Google Scholar] [CrossRef] [Scilit]
  67. Li, K.; Wang, H. Spatial and data-driven approaches for mitigating urban heat in coastal cities. Buildings 2025, 15, 3544. [Google Scholar] [CrossRef] [Scilit]
Figure 1. Study Areas. (a) Dalian (b) Xiamen (c) Rio (d) Miami (e) Singapore. The built-up ratios for Dalian, Xiamen, Rio, Miami, and Singapore are 7.7%, 24.1%, 36.0%, 10.9%, and 42.4%, respectively.
Remotesensing 18 00762 g001
Figure 2. The workflow of the study methodology.
Remotesensing 18 00762 g002
Figure 3. Buffer zone schematic diagram of Xiamen as an example. (a) 2 km buffer from the coastline; (b) 4 km buffer from the coastline; (c) 6 km buffer from the coastline.
Remotesensing 18 00762 g003
Figure 4. Spatial distribution of SUHII (a) is the spatial distribution of SUHII in Dalian across four seasons. (b) is the spatial distribution of SUHII in Xiamen across four seasons. (c) is the spatial distribution of SUHII in Rio across four seasons. (d) is the spatial distribution of SUHII in Miami across four seasons. (e) is the spatial distribution of SUHII in Singapore across four seasons.
Remotesensing 18 00762 g004
Figure 5. Boxplot of SUHII for different LCZ types. (a) Boxplot of SUHII for different LCZ types in Dalian. (b) Boxplot of SUHII for different LCZ types in Xiamen. (c) Boxplot of SUHII for different LCZ types in Rio. (d) Boxplot of SUHII for different LCZ types in Miami. (e) Boxplot of SUHII for different LCZ types in Singapore.
Remotesensing 18 00762 g005
Figure 6. The influence of different influencing factors on SUHII across the four seasons. (a) The influence of different influencing factors on SUHII across the four seasons in Dalian. (b) The influence of different influencing factors on SUHII across the four seasons in Xiamen. (c) The influence of different influencing factors on SUHII across the four seasons in Rio. (d) The influence of different influencing factors on SUHII across the four seasons in Miami. (e) The influence of different influencing factors on SUHII across the four seasons in Singapore.
Remotesensing 18 00762 g006
Figure 7. Correlation matrix of influencing factors across different seasons in different cities (a) Dalian. (b) Xiamen. (c) Rio. (d) Miami. (e) Singapore.
Remotesensing 18 00762 g007
Figure 8. The variation in the relationship between key influencing factors and the SUHII. (a) Variation in the correlation between NDVI and the urban heat island effect with distance from the coastline. (b) Variation in the correlation between NDBI and the urban heat island effect with distance from the coastline.
Remotesensing 18 00762 g008
Table 1. Datasets.
Table 1. Datasets.
DataOriginal FormatSpatial ResolutionSource
LCZ mapRaster
(Geo Tiff)
100 mWUDAPT
Landsat8 OLIRaster
(Geo Tiff)
30 mUSGS
Landsat8 TIRSRaster
(Geo Tiff)
30 mUSGS
Digital elevation modelRaster
(Geo Tiff)
30 mNASADEM
Nighttime light imageRaster
(Geo Tiff)
500 mEOG
PopulationRaster
(Geo Tiff)
100 mWorldPop
RoadVector
(Shape file)
OpenStreetMap
Table 2. LCZ classification types.
Build TypesLand Cover Types
LCZ 1Compact high-riseLCZ ADense trees
LCZ 2Compact mid-riseLCZ BScattered trees
LCZ 3Compact low-riseLCZ CBush, scrub
LCZ 4Open high-riseLCZ DLow plants
LCZ 5Open mid-riseLCZ EBare rock or paved
LCZ 6Open low-riseLCZ FBare soil or sand
LCZ 7Lightweight low-riseLCZ GWater or wetland
LCZ 8Large low-rise
LCZ 9Sparsely built
LCZ 10Heavy industry
Table 3. SUHII classification [50].
LevelSUHII Range (K)GradeAbbreviation
1SUHII ≤ −5 Kstrong cold islandS-C-I
2−5 K < SUHII ≤ −3 Ksub-strong cold islandS-S-C-I
3−5 K < SUHII ≤ −3 Kweak cold islandW-C-I
4−1 K < SUHII ≤ 1 Kno heat islandN-H-I
51 K < SUHII ≤ 3 Kweak heat islandW-H-I
63 K < SUHII ≤ 5 Ksub-strong heat islandS-S-H-I
7SUHII > 5 Kstrong heat islandS-H-I
Disclaimer/Publisher’s Note: The statements, opinions and data contained in all publications are solely those of the individual author(s) and contributor(s) and not of MDPI and/or the editor(s). MDPI and/or the editor(s) disclaim responsibility for any injury to people or property resulting from any ideas, methods, instructions or products referred to in the content.