


Highlights
What are the main findings?
- Extensive analyses are conducted on time series VIIRS flood data to identify paddy rice fields based on the duration of water presence, and combined with rice calendar data.
- For the first time, the Mann–Kendall analysis is applied to the VIIRS flood product time series to identify paddy rice fields and is compared with methods based on water presence and regression analysis.
What is the implication of the main finding?
- It is expected that this study can help reduce the false positives in optical sensor-based flood products to improve real hazardous flood detection.
Abstract
Operational satellite-based flood products are generated by comparing water classification maps from satellite imagery with permanent or normal water masks. This approach may misclassify some water bodies—such as irrigated paddy rice fields—as floodwaters because they are not masked as permanent or normal water sources. Due to the importance of paddy fields for food security, in this study, methodologies based on the long-time duration of water presence combined with paddy rice phenological algorithms and change detection analysis are developed to extract paddy rice fields from the operational VIIRS (Visible Infrared Imaging Radiometer Suite) flood products. This method is also compared with the regression analysis and the Mann–Kendall analysis. Evaluations are performed through confusion matrix analysis by comparing with the USDA rice data. The three paddy rice extraction algorithms show good agreement and can achieve an accuracy of 93% with an F1-score exceeding 80%.
1. Introduction
Satellite-based flood products provide important information for flood monitoring. The VIIRS flood detection algorithms separate water from land by assessing the spectral differences between water bodies and other land cover types in visible, near-infrared, and shortwave infrared channels, and the derived NDVI (Normalized Difference Vegetation Index), NDWI (Normalized Difference Water Index), and NDSI (Normalized Difference Snow Index), then comparing the classified water map with permanent water from global water masks to identify floodwaters [1,2,3,4,5]. In the VIIRS flood products, some water bodies, such as paddy rice fields, often display as floodwaters for months and even longer, even without actual flood events. Since paddy rice fields are typically flooded with water during the growing season—although this water is not permanent—they may be misclassified as floodwaters in VIIRS flood products.
In the U.S., Arkansas and California are the major rice-producing regions, where many flooded paddy rice fields can be found. In California, rice is grown especially in the Sacramento Valley. Although many rice crops worldwide are grown in flooded paddies, American rice farmers typically use controlled irrigation systems [6,7].
Many studies have been conducted for paddy rice mapping directly from remote sensing observations by using supervised and unsupervised classification methods, phenological algorithms, and object-oriented image classification [8]. Machine learning is a rapidly evolving technique used for mapping paddy rice. A significant amount of research utilizes traditional machine learning, which encompasses both supervised and unsupervised classification [8,9,10,11]. Okamoto and Kawashima [12] used Landsat Thematic Mapper (TM) and Enhanced Thematic Mapper Plus (ETM+) data to evaluate paddy rice fields in Heilongjiang, China, employing the unsupervised clustering method—Iterative Self-Organizing Data Analysis Technique (ISODATA). For the research of Yin et al. [13], a fusion and phenology-based paddy rice mapping methodology was used to detect paddy rice fields. By utilizing distinct phenological characteristics, Yin et al. [13] created a paddy rice map that provided more spatial detail and lower error compared to Landsat and MODIS-based maps. Gumma et al. [14] presented a suite of methods to identify and classify paddy rice fields in South Asia, which included a spectral matching technique (SMT), decision-tree algorithms, and the paddy rice temporal profile and characteristics. Manjunath et al. [15] also used the ISODATA classification algorithm to map paddy rice fields. Manjunath et al. [15] used Satellite Pour l’Observation de la Terre (SPOT) NDVI data to set thresholds to distinguish between paddy rice fields, other crops, and permanent water bodies. Likewise, Gumma et al. [16] used unsupervised ISOCLASS cluster K-means classification to capture the range of phenological changes to discover the change analysis of rice environments in Odisha, India. Different from the above study, Clauss et al. [17] classified and mapped Paddy rice areas in Mainland China by one-class Support Vector Machine (OCSVM). In this study, a rice field reference dataset was created by EVI (Enhanced Vegetation Index) and LSWI (Land Surface Water Index) Time Series. In the study of Zhang and Lin [18], a high-resolution paddy rice map was developed to identify paddy rice in the Dong Ting Lake area of China by using Landsat-8 data and a deep learning convolutional neural network (CNN) algorithm. The authors used the STARFM model to fuse the Landsat NDVI data and the MODIS NDVI data and employed threshold methods to extract phenological variables. In another study, Zhao et al. [19] also combined a CNN algorithm with a phenological metric to map paddy rice fields in Zhuzhou city, Hunan province, China. The advantage of deep learning is that it can automatically learn effective knowledge of classified objects, but it needs a large amount of annotated data for training [20].
In recent years, Chen et al. [21] developed a new classification system to classify the double-cropped irrigated rice in Taiwan based on a correlation analysis method by using high-resolution time-series SPOT satellite data. The temporal variance analysis method was used to develop a new algorithm for paddy rice field classification [22]. This study uses three Vegetation Indices: NDVI, Ratio Vegetation Index (RVI), and Soil-Adjusted Vegetation Index (SAVI). Wang et al. [23] proposed a classification method based on the assumption that the probability distribution function of land cover type obeyed a normal distribution. EVI data were generated from time-series HJ-1A/B images to detect single-cropped rice growth regions using this method in the Eastern Plain region of China. Liu et al. [24] proposed a sub-pixel method to evaluate the planting fraction of paddy rice and quantified the area and spatial distribution of paddy rice in Northeast China. Because the water of paddy rice fields persists during the growing period—and the higher the planting rate of rice, the less the water content changes—LSWI is used to represent land surface moisture status and the coefficient of variation.
Xiao et al. [25] explored an algorithm to identify paddy rice and inundation area in Southern China, which combined NDVI, LSWI, and EVI with a temporal dynamic characteristic of paddy rice. Whereafter, Xiao et al. [26] also used the same algorithm to identify paddy rice fields in 13 countries of South and Southeast Asia. Like Xiao’s research, Qin et al. [27] also used LSWI, NDVI, and EVI for the physical characteristics of paddy rice fields. There were four phases in the canopy development of paddy rice: the flooding phase, the flooded/open-canopy phase, the closed canopy phase, and the post-harvest phase. In the flooded/open-canopy phase, the value of LSWI was larger than that of NDVI or EVI, and LSWI decreased gradually, while NDVI and EVI increased. For other land cover types, the LSWI value was always lower than NDVI and EVI. Son et al. [28] used time-series Sentinel-2 data to explore the feasibility of rice mapping in Taiwan. They calculated LSWI and EVI time-series data and classified the rice based on a phenology algorithm.
In recent years, a new object-based image analysis (OBIA) method has been proposed and applied to extract paddy rice fields from satellite imagery. Su [29] improved the fractal net evolution approach (FNEA) method to create a new segmentation algorithm consisting of three merging stages, which is used to establish the OBIA framework for rice field mapping. Different from Su’s study, Singha et al. [30] combined the OBIA method with a phenology algorithm to explore the feasibility of this new method that extracted phenological variables from fused time series high-resolution NDVI data to classify paddy rice by OBIA. Similar to Singha’s study, Zhang and Lin [18] also used the OBIA classification method combined with a phenology algorithm to map the paddy rice in Hunan, China. Compared with optical remote sensing, microwave remote sensing is not affected by clouds. Bouvet and Toan [31] developed a method for early assessment of rice planting areas using medium-resolution wide-band single-polarization Synthetic Aperture Radar (SAR) images.
The water in flooded paddy rice fields may be misclassified as floodwaters by operational VIIRS flood products, which may interfere with the assessment of real-hazardous flood. Misra et al. [32] investigated false positives due to cropland in SAR-based flood mapping. Sianturi et al. [33] published a case study that separated irrigated paddy rice fields from hazardous floods in West Java by analyzing the differences in MODIS EVI and NDWI values between them through field surveys.
This study aims to develop a framework to extract paddy rice fields in operational VIIRS flood products, using paddy rice fields in the less studied U.S.A. as an example for demonstration. Since the VIIRS flood algorithm classified water and land using VIS, NIR, and SWIR reflectance, NDWI, and Vegetation indices [1,2,3,4,5], which are similar variables to the studies about paddy rice mapping directly from remote sensing observations introduced above [8,9,10,11,12,13,14,15,16,17,18,19,20,21,22,23,24,25,26,27,28,29,30], it is possible to extract paddy rice fields from the operational VIIRS flood products. The hypothesis is that non-hazard floodwaters in operational optical sensor-based flood products, like paddy rice fields, usually last much longer than hazardous floods caused by heavy rainfall, storm surges, snow melt, and ice jams. Based on this hypothesis, this study proposes multiple complementary methods to identify paddy rice fields using temporal characteristics derived from VIIRS flood time series. It is expected that the methodology developed in this study can be applied to optical sensor-based flood products and to identifying non-hazard floodwaters due to irrigated paddy rice fields—a common problem in optical sensor-based operational flood products. Moreover, identifying non-hazard floodwaters or false positives in operational flood products can help decision makers understand the real flooding situation and allocate limited resources to where aid is needed most. The methodology is described in Section 2. Section 3 presents the results of paddy rice field identification from VIIRS flood products using the methods developed in this study. Section 4 discusses these findings, and Section 5 concludes with a summary.
2. Materials and Methods
2.1. Data Used
The datasets used in this study are as follows:
- VIIRS five-day composite flood maps, indicating floodwater fractions from 1 January 2021 to 31 December 2022. This data, since October 2019, is archived at George Mason University (https://jpssflood.gmu.edu/downloads (accessed on 8 February 2026)).
- VIIRS global land cover data [34] is used in this study. The VIIRS land cover map classifies the global surface into 17 types defined by the International Geosphere-Biosphere Programme (IGBP) [34], including cropland, which is used in this study.
- Rice Atlas data. The Rice Atlas is a spatial database on the seasonal distribution of world paddy rice yields, which includes data on planting and harvesting dates of planting seasons in various rice-growing regions across all countries worldwide, as well as estimates of monthly yields in all rice-producing countries [35]. Compared with other global crop calendars, Rice Atlas has 2725 spatial units and is the world’s most comprehensive spatial database for rice calendars and rice production. There are paddy rice planting or transplant dates in the rice calendar database. This data played an important role in the process of paddy rice extraction in this study.
- Rice data from the Cropland Data Layer (CDL) in Cropland Collaborative Research Outcomes System (CroplandCROS) from the USDA (United States Department of Agriculture). The CDL is an annual, geo-referenced, crop-specific land cover dataset for the United States. The inputs for the CDL project include medium-resolution satellite imagery, ground truth data collected by the USDA, and other auxiliary data such as the National Land Cover Dataset [36]. Rice data obtained from the USDA CDL (https://croplandcros.scinet.usda.gov/, accessed on 8 February 2026) is used for comparison and evaluation in this study.
2.2. Methods
2.2.1. Extract Paddy Rice Fields by the Difference in the Duration of Water Presence Between Paddy Rice Fields and Hazardous Floodwaters
In this study, the flood time series used were derived from the VIIRS 5-day composite flood product, in which each time step represents flood conditions summarized over a 5-day compositing period. The product provides a water fraction variable that represents the spatial proportion of surface water within an individual VIIRS pixel [4]. The data used in this study were obtained from the NOAA/GMU VIIRS Flood Product Version 1.0, which is based on VIIRS I-band observations with a spatial resolution of 375 m. At this spatial resolution, flood-affected pixels often consist of mixtures of land and water. To account for this, a linear spectral mixing model is applied to estimate the relative proportion of surface water within each pixel [3,4], yielding a continuous water fraction ranging from 1% to 100% rather than a binary water/non-water classification. As VIIRS is an optical sensor, the composite product integrates multi-temporal observations to mitigate cloud contamination and represent the maximum flood extent during each compositing period [37]. Based on these products, the flood time series was indexed along a daily timeline.
According to the definition of flood by the U.S. National Weather Service (NWS) [38], floods refer to water overflowing onto normally dry land and usually last for days or weeks. In contrast, paddy rice is cultivated under intentionally flooded conditions that typically persist for at least one month during the growing season. As a result, the standing water in paddy rice fields may be detected as floodwater by operational VIIRS flood products, even though it is associated with agricultural water management rather than hazardous flooding.
For paddy rice identification, the analysis period was defined as a 120-day temporal window centered on the rice planting peak date derived from the rice calendar, extending from 30 days before to 90 days after the peak. The planting peak represents the period during which rice planting activities are most concentrated at the regional scale, rather than a specific phenological boundary for individual fields. This temporal window was designed to capture the key inundation stages associated with paddy rice cultivation. Previous studies [26] have shown that rice canopy development typically covers most of the surface area within approximately 50–60 days after transplanting; therefore, this core period was extended on both sides of the planting peak to account for temporal variability in planting schedules and flooding practices across the region, resulting in a total analysis window of 120 days.
Within this 120-day analysis period, a rolling window analysis was implemented with a window length of 30 days, shifted forward by one day at each step. The 30 data points correspond to 30 daily records from the 5-day composite product, rather than 30 independent compositing periods, and therefore do not represent 150 consecutive days of observations. For each rolling window, flood frequency (or flood probability) was defined as the ratio of flooded days to the total number of clear days within the window. A clear day refers to a valid observation in the VIIRS 5-day composite flood product for which the pixel is not affected by clouds. Days affected by cloud contamination or missing data were excluded from the analysis, and no interpolation or temporal padding was applied.
where p(xi) represents the flood frequency or probability of pixel xi over one year. A threshold of 67% was applied, corresponding to water detection on at least 20 days within a 30-day moving window, to characterize the persistent water presence typical of paddy rice cultivation rather than short-lived flood events. Using this method, pixels preliminarily identified as paddy rice candidates were further refined using cropland information derived from the land cover dataset. Only pixels located within cropland areas were retained for subsequent analysis, serving as a spatial constraint to exclude non-agricultural water bodies. Although cropland includes multiple crop types, paddy rice cultivation is characterized by managed field inundation during the post-seeding and early growth stages, resulting in non-zero water fraction values that persist over time. In contrast, most non-rice croplands do not maintain standing water after seeding, and any surface water presence is typically short-lived or irregular. Therefore, pixels that satisfy the defined temporal persistence threshold and spatially coincide with cropland areas in the land cover map are classified as paddy rice in this study.
2.2.2. Extract Paddy Rice Fields Using Regression Analysis
Regression analysis is a fundamental method in statistics used to study the relationship between a dependent variable and one or more independent variables. It can be used both for prediction and for analyzing the relationship between variables. To analyze the trend of time-series data, regression analysis is a commonly used method. Due to the large number of pixels and the uncertainty about whether the time series data exhibits a linear or nonlinear trend, this study uses linear regression to detect whether there is a linear growth or decline trend. To exclude seasonal and cyclical fluctuations in the time series, rice calendar data is used to extract the time series of paddy rice growth periods. Additionally, data showing as cloud-covered during this period are excluded to reduce the impact of outliers on the results.
where the y is the water fraction of the pixel, the t is time, and are the regression coefficients ( is the intercept and is the slope).
R2 and p-value are used to assess the goodness-of-fit and significance of the regression model. To evaluate R2 and p-value, the Sum of Squared Errors (SSE), Total Sum of Squares (SST), and the Sum of Squares for the time variable (SXX) need to be calculated.
where the represents the true values of the original water fraction data, the represents the predicted values calculated by the model, the represents the mean of the true values, the represents the values of the time series, and the represents the mean of the time series values.
where is the standard error of the slope, which is used to quantify the uncertainty in the slope estimate. n is the number of data points, is the slope of the regression line, and t is the t-statistic, which is used for hypothesis testing to determine the significance of the slope.
Based on the obtained t-distribution, the corresponding p-value is determined. If the p-value is less than 0.05, the null hypothesis is rejected, indicating a significant trend. Conversely, if the p-value is greater than or equal to 0.05, the null hypothesis cannot be rejected, indicating no significant trend. By combining the slope and p-value, a positive and significant slope suggests an upward trend, while a negative and considerable slope indicates a downward trend. In this study, the water fraction values of the selected time series data decrease due to the growth of paddy rice. Therefore, pixels with a negative trend are extracted. Using the same method as above, the extracted pixels with a negative trend were combined with land cover data to identify all pixels corresponding to paddy rice.
2.2.3. Extract Paddy Rice Fields Using the Mann–Kendall Analysis
The Mann–Kendall test is a widely used non-parametric statistical method for detecting trends in time series data. By comparing all possible data pairs within the time series and analyzing their relative magnitudes, it determines whether there is a significant monotonic trend in the data. This method is particularly suitable for datasets that are non-normally distributed, contain missing values, or include outliers. As such, it is extensively applied in fields such as climatology, environmental science, and hydrology. In this study, the Mann–Kendall algorithm was applied to analyze the VIIRS flood time series data, and pixels with negative trends were extracted.
where S is the overall trend test statistic, and represent the water fraction values of the data points in the time series, with i < j.
The sign ( − ) is used to determine the relative magnitude between two data points: when > , it is assigned a value of +1; when < , it is assigned −1; and when = , it is assigned 0. The reason for using the sign function is that the Mann–Kendall algorithm is a non-parametric statistical method, meaning it does not depend on the data’s distribution or require the precise calculation of differences. This method is highly robust and less sensitive to outliers, non-normally distributed data, or missing values. In this study, the time series data were limited to 120 days during the growth period of paddy rice, and duplicate values are inevitably present. When the sample size is small, duplicate values have a more significant impact on the variance. When ties exist in the data, it is necessary to adjust the variance of the Mann–Kendall statistic S, as ties disrupt the independence between data pairs, thereby affecting the theoretical calculation of the variance. After adjusting the variance, the standardized Z statistic is calculated using S and its variance.
where n is the total number of data points in the time series, and is the size of a group with identical values.
The significance level α is set to 0.05. If Z > , a significant upward trend exists; if Z < , a significant downward trend exists; in all other cases, there is no significant trend. Using the same method, the extracted pixel with negative trends is matched with the crop data from the land cover, and the paddy rice areas are identified.
2.2.4. Evaluation Using Confusion Matrix Analysis
A confusion matrix is used to compute several classification performance metrics, including accuracy, precision, recall, and F1-score. The predicted values from the rice extraction in this study are compared with the USDA paddy rice data.
where TP is for True Positive, FN represents False Negative, FP is for False Positive, and TN refers to True Negative.
Accuracy = (TP + TN)/(TP + FP + TN + FN)
Recall = TP/(TP + FN)
Precision = TP/(TP + FP)
F1-Score = 2TP/(2TP + FP + FN)
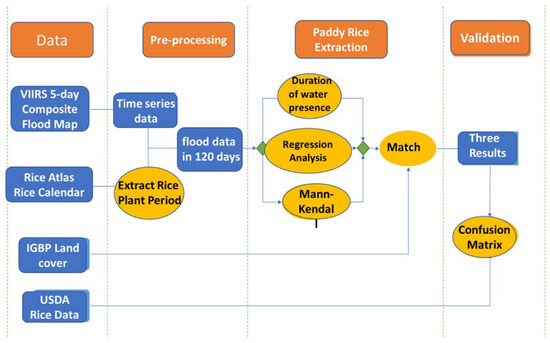
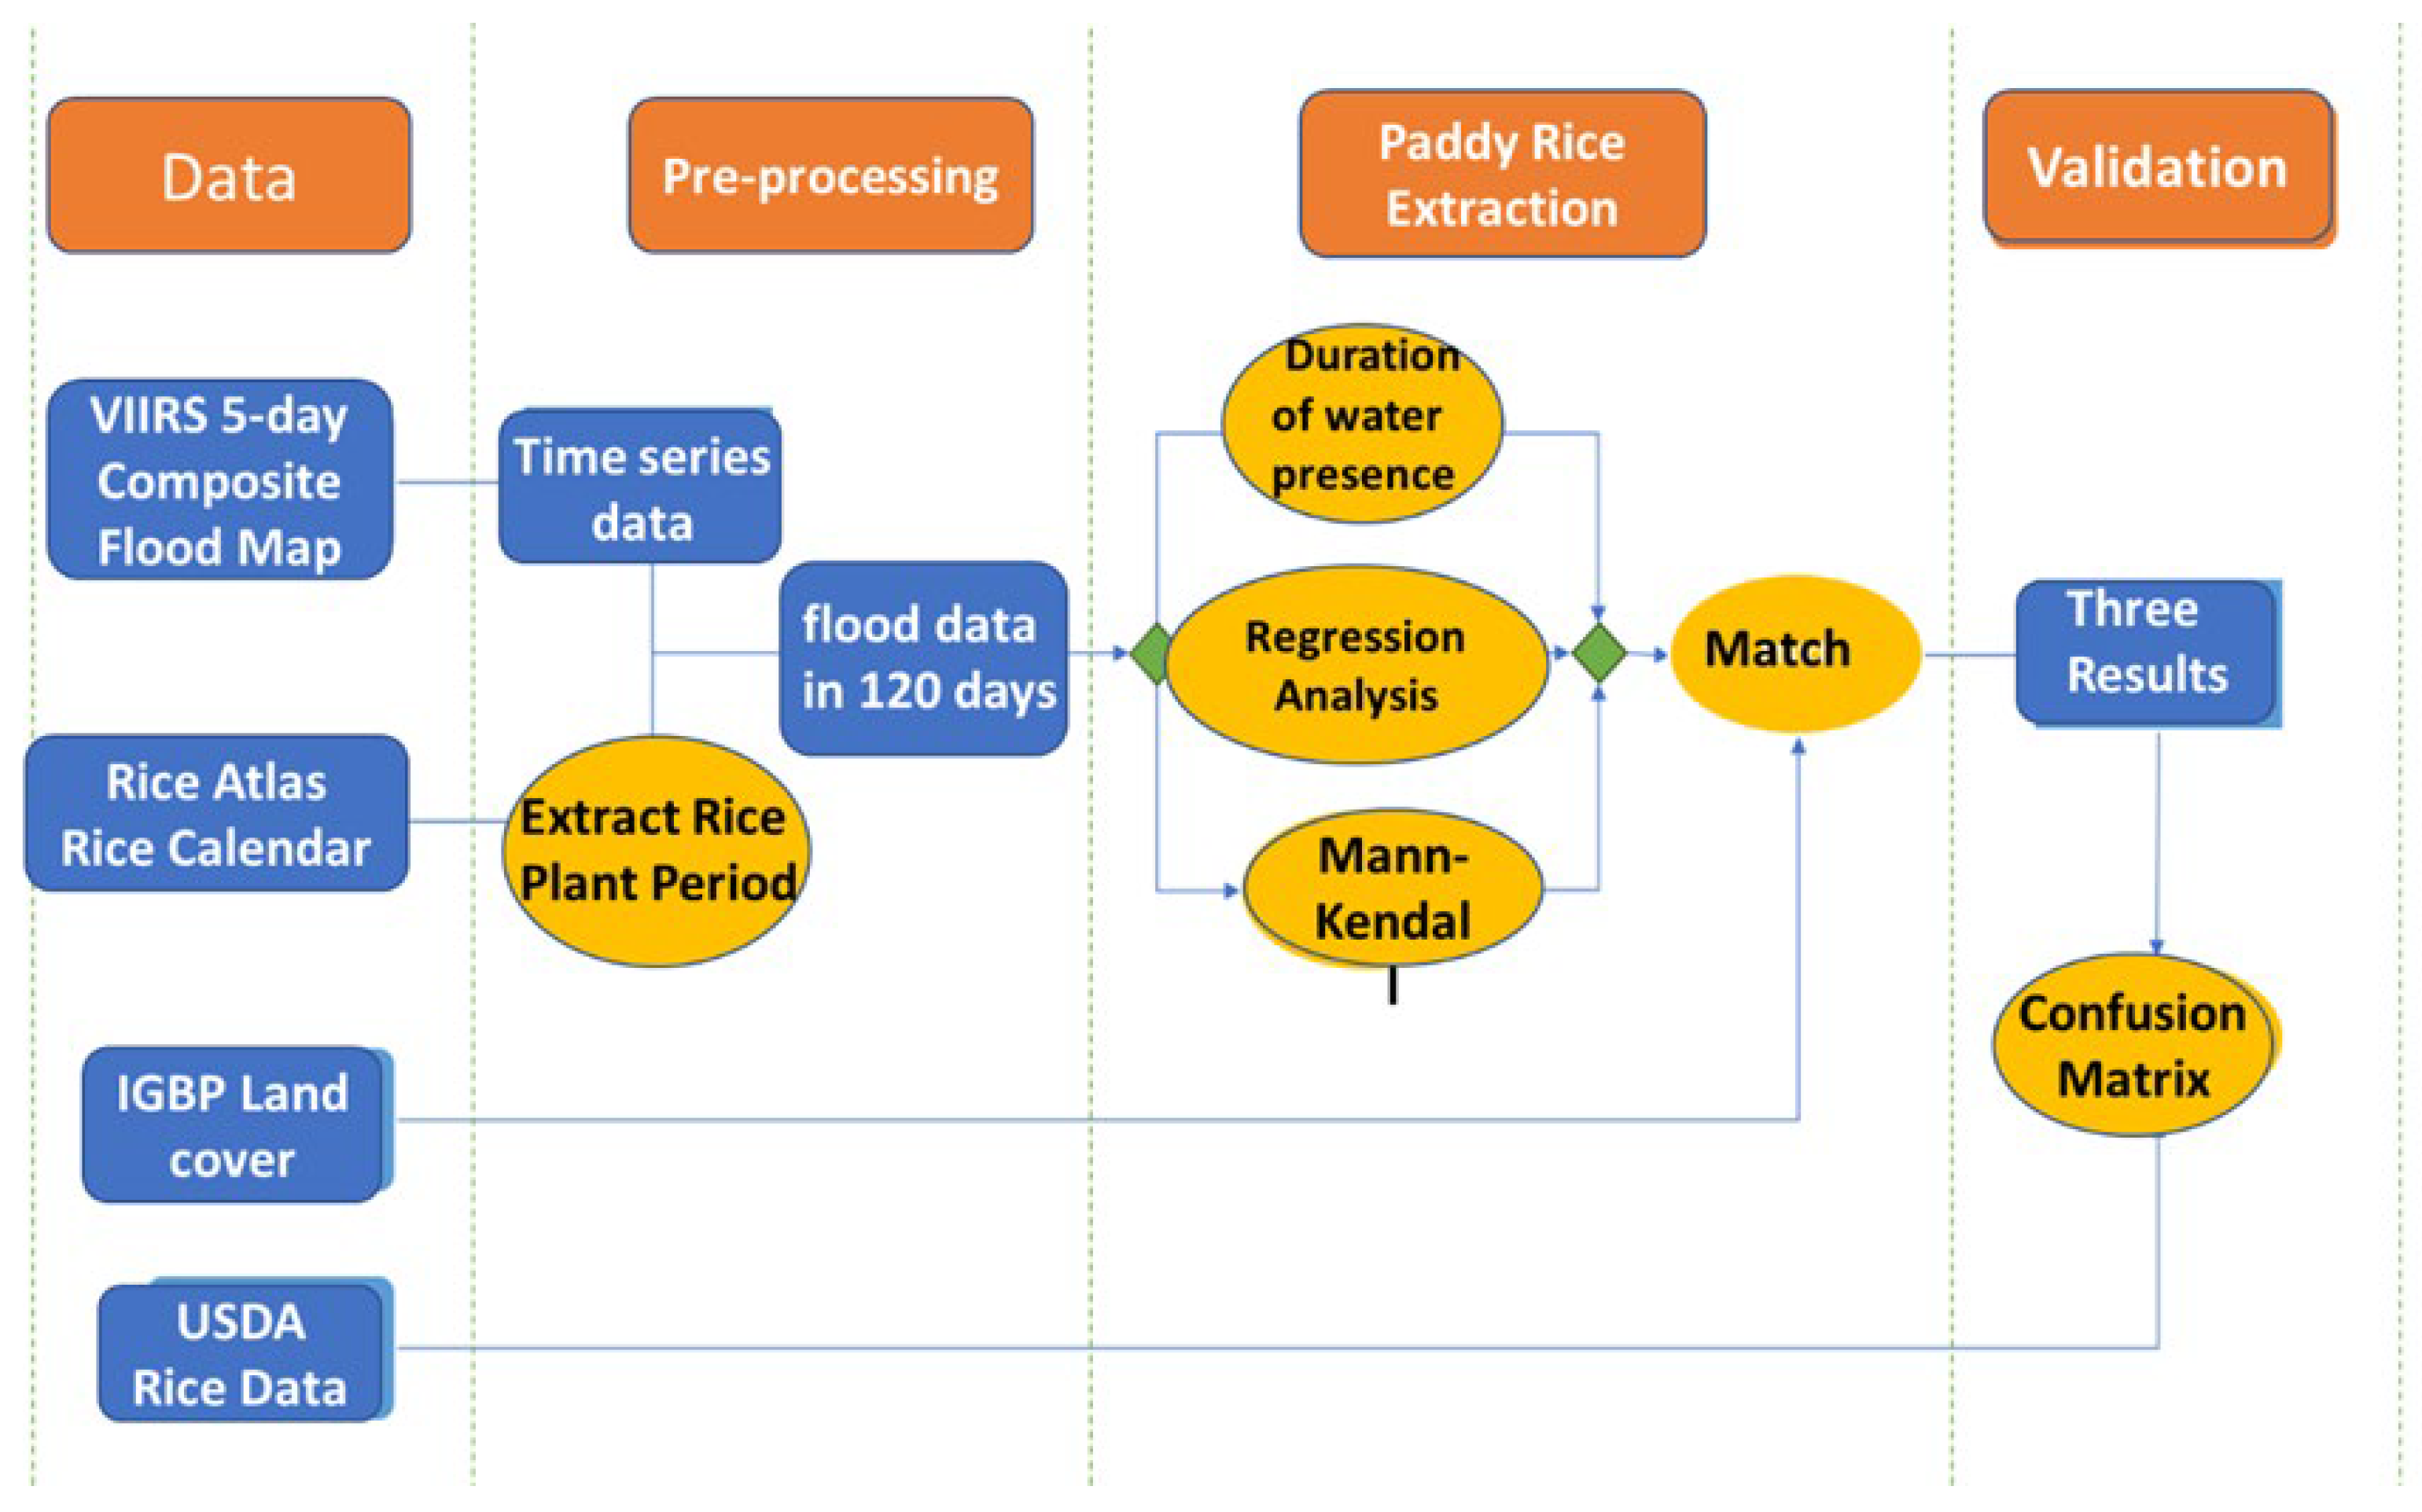
Figure 1 shows the flow chart for this study.
Figure 1.
Flow chart for paddy rice field detection in this study.
3. Results
3.1. Paddy Rice Extraction in Arkansas, US
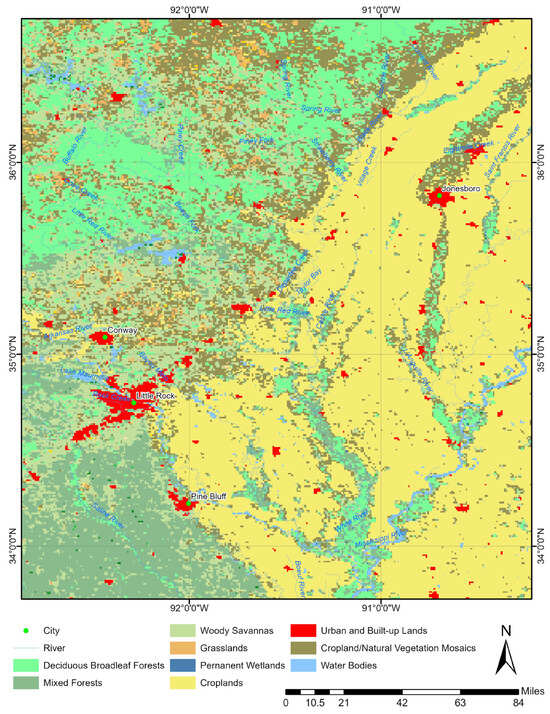
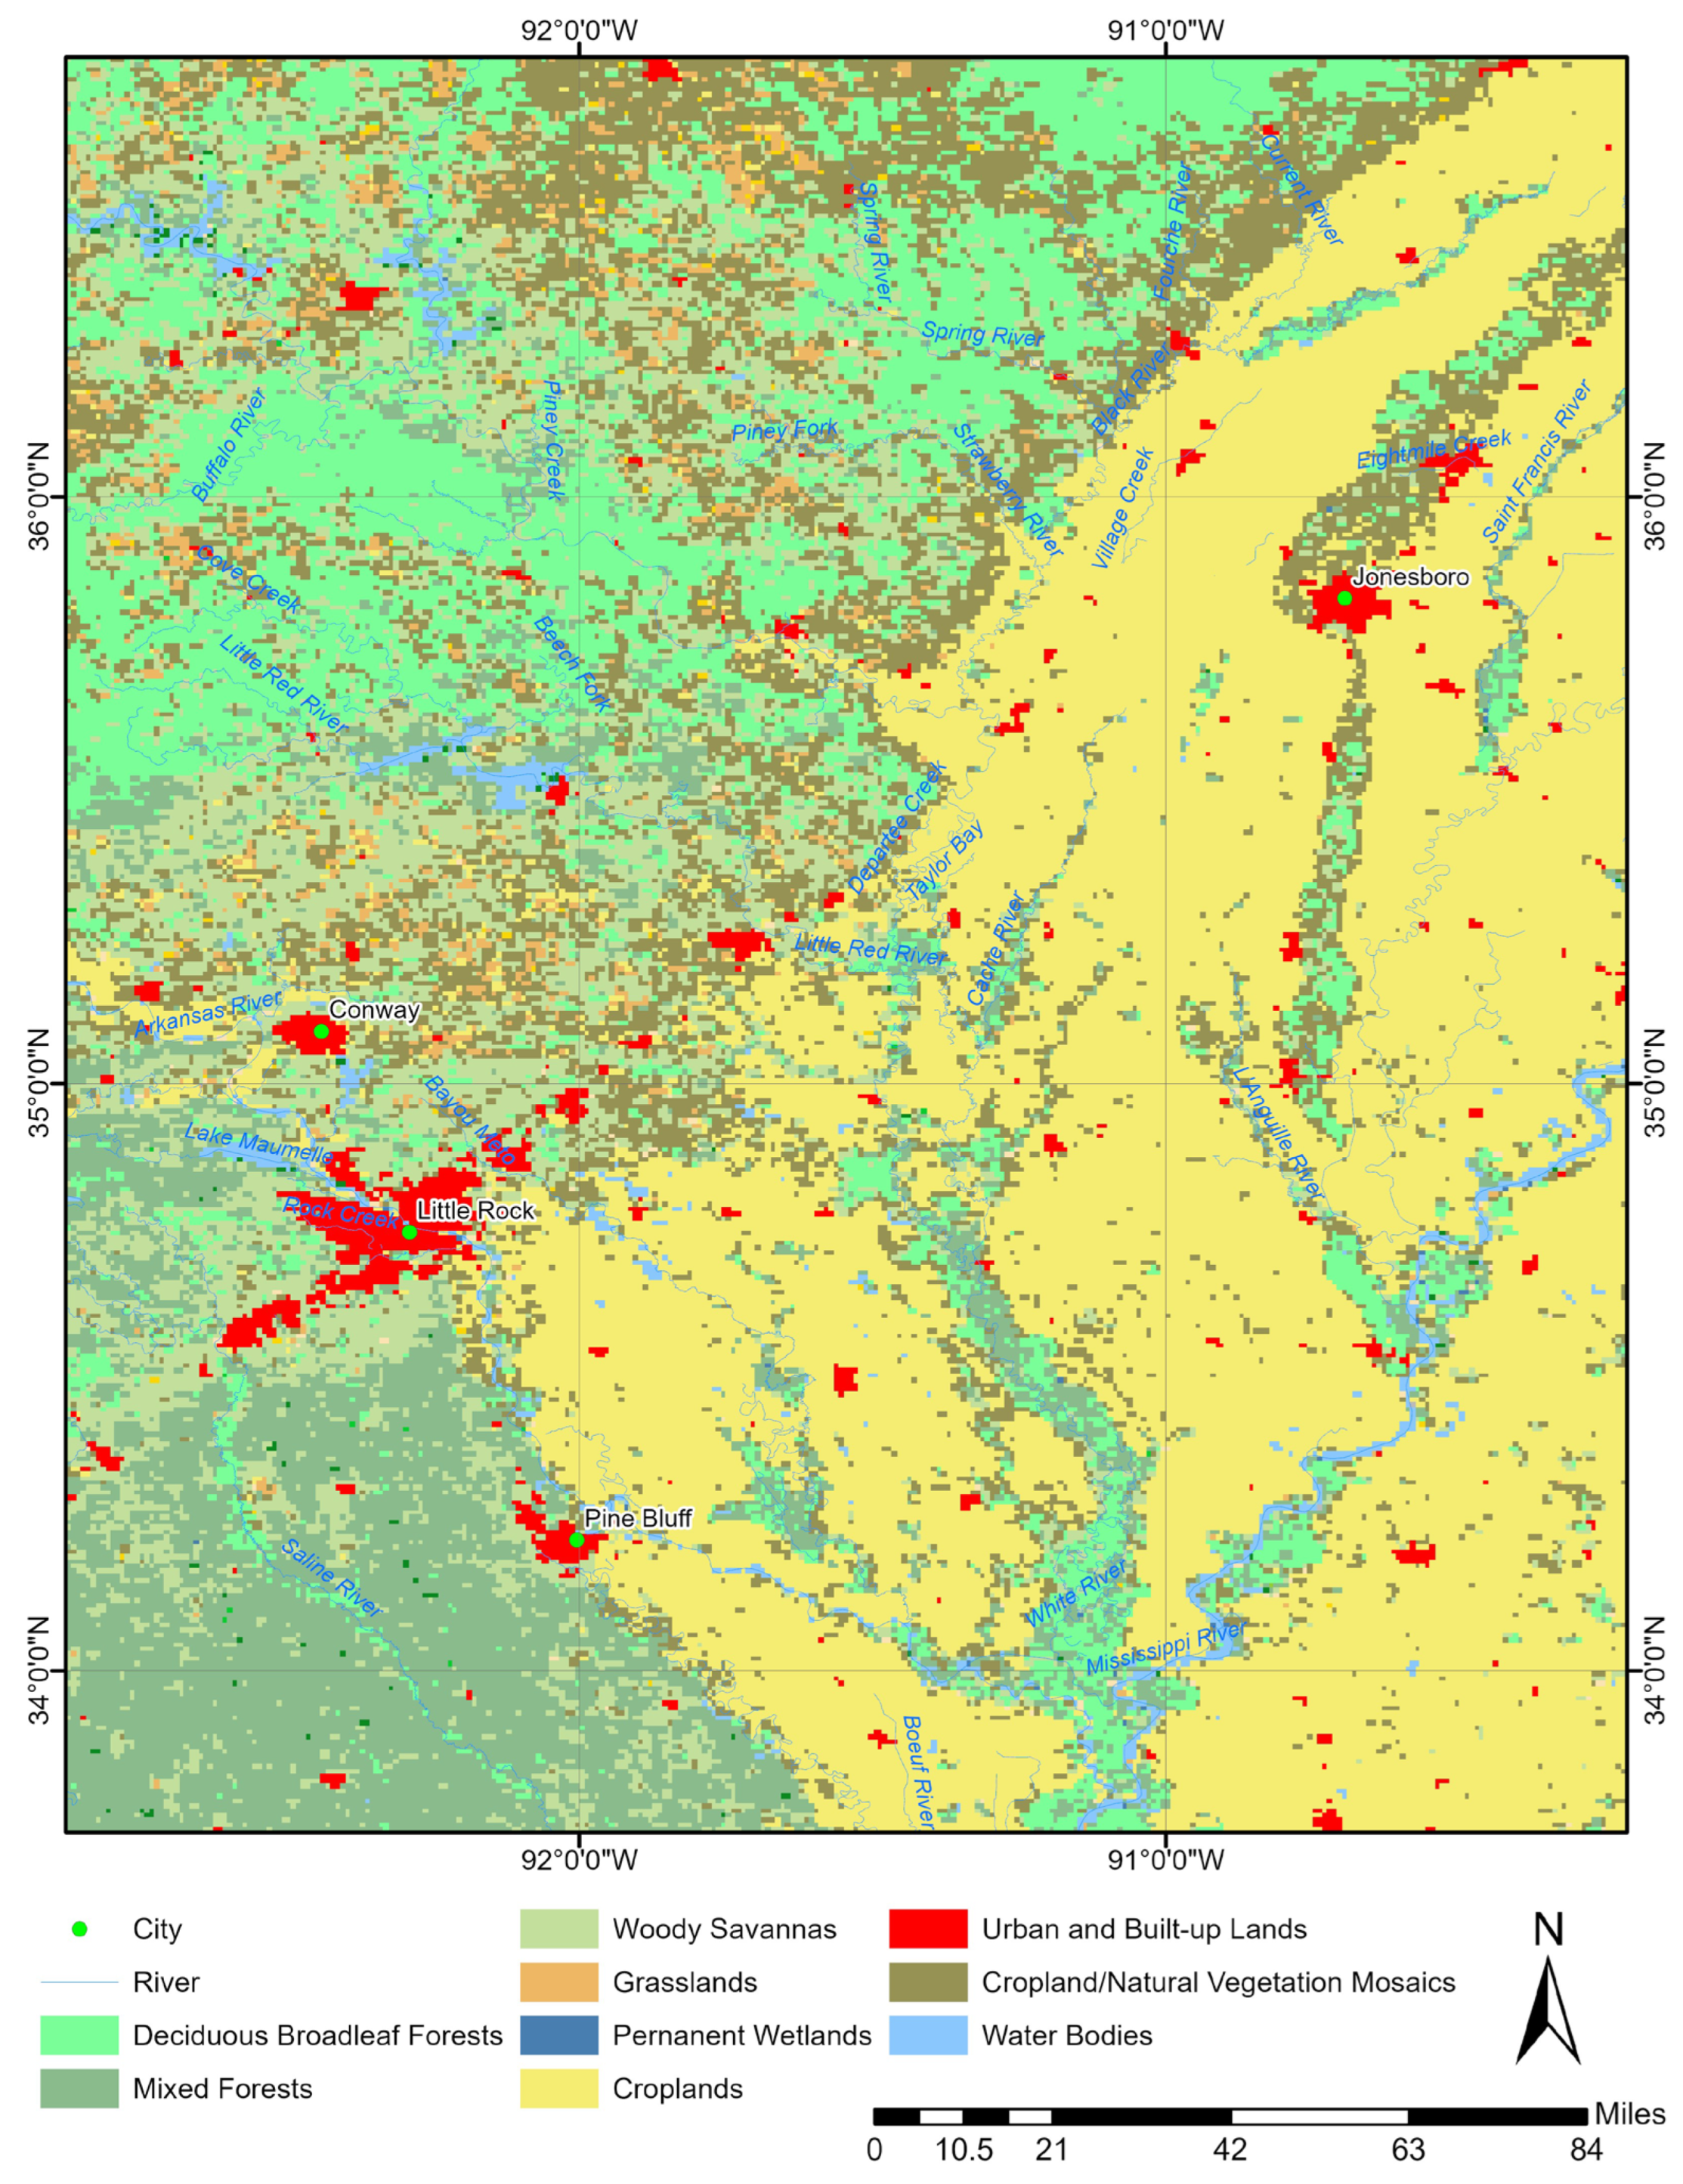
Arkansas is a significant contributor to the U.S. agricultural economy, with its primary crops including rice, soybeans, cotton, corn, and wheat. Figure 2 shows the land cover map of Arkansas, where the yellow areas represent cropland. Based on the data from the rice calendar, paddy rice in Arkansas is typically planted around mid-April and harvested in late September. Compared to the time-series data of the paddy rice growth period in the VIIRS flood product, the floods detected in Arkansas by the VIIRS flood product align with the phenology of paddy rice.
Figure 2.
Cropland areas of Arkansas in the land cover map.
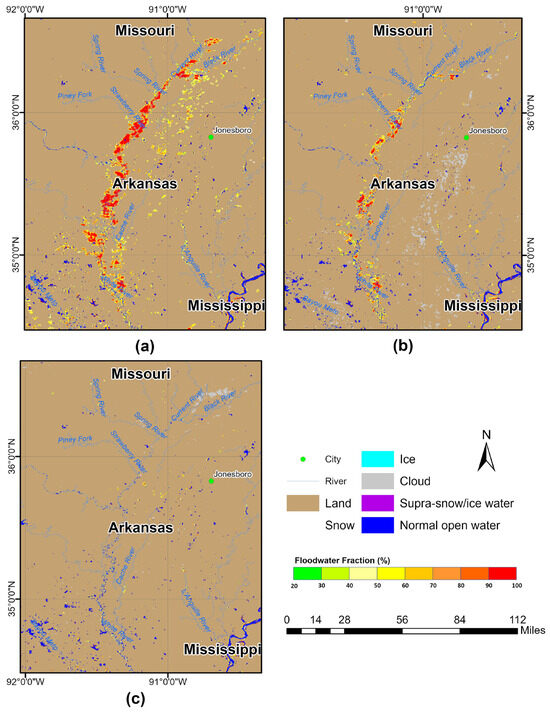
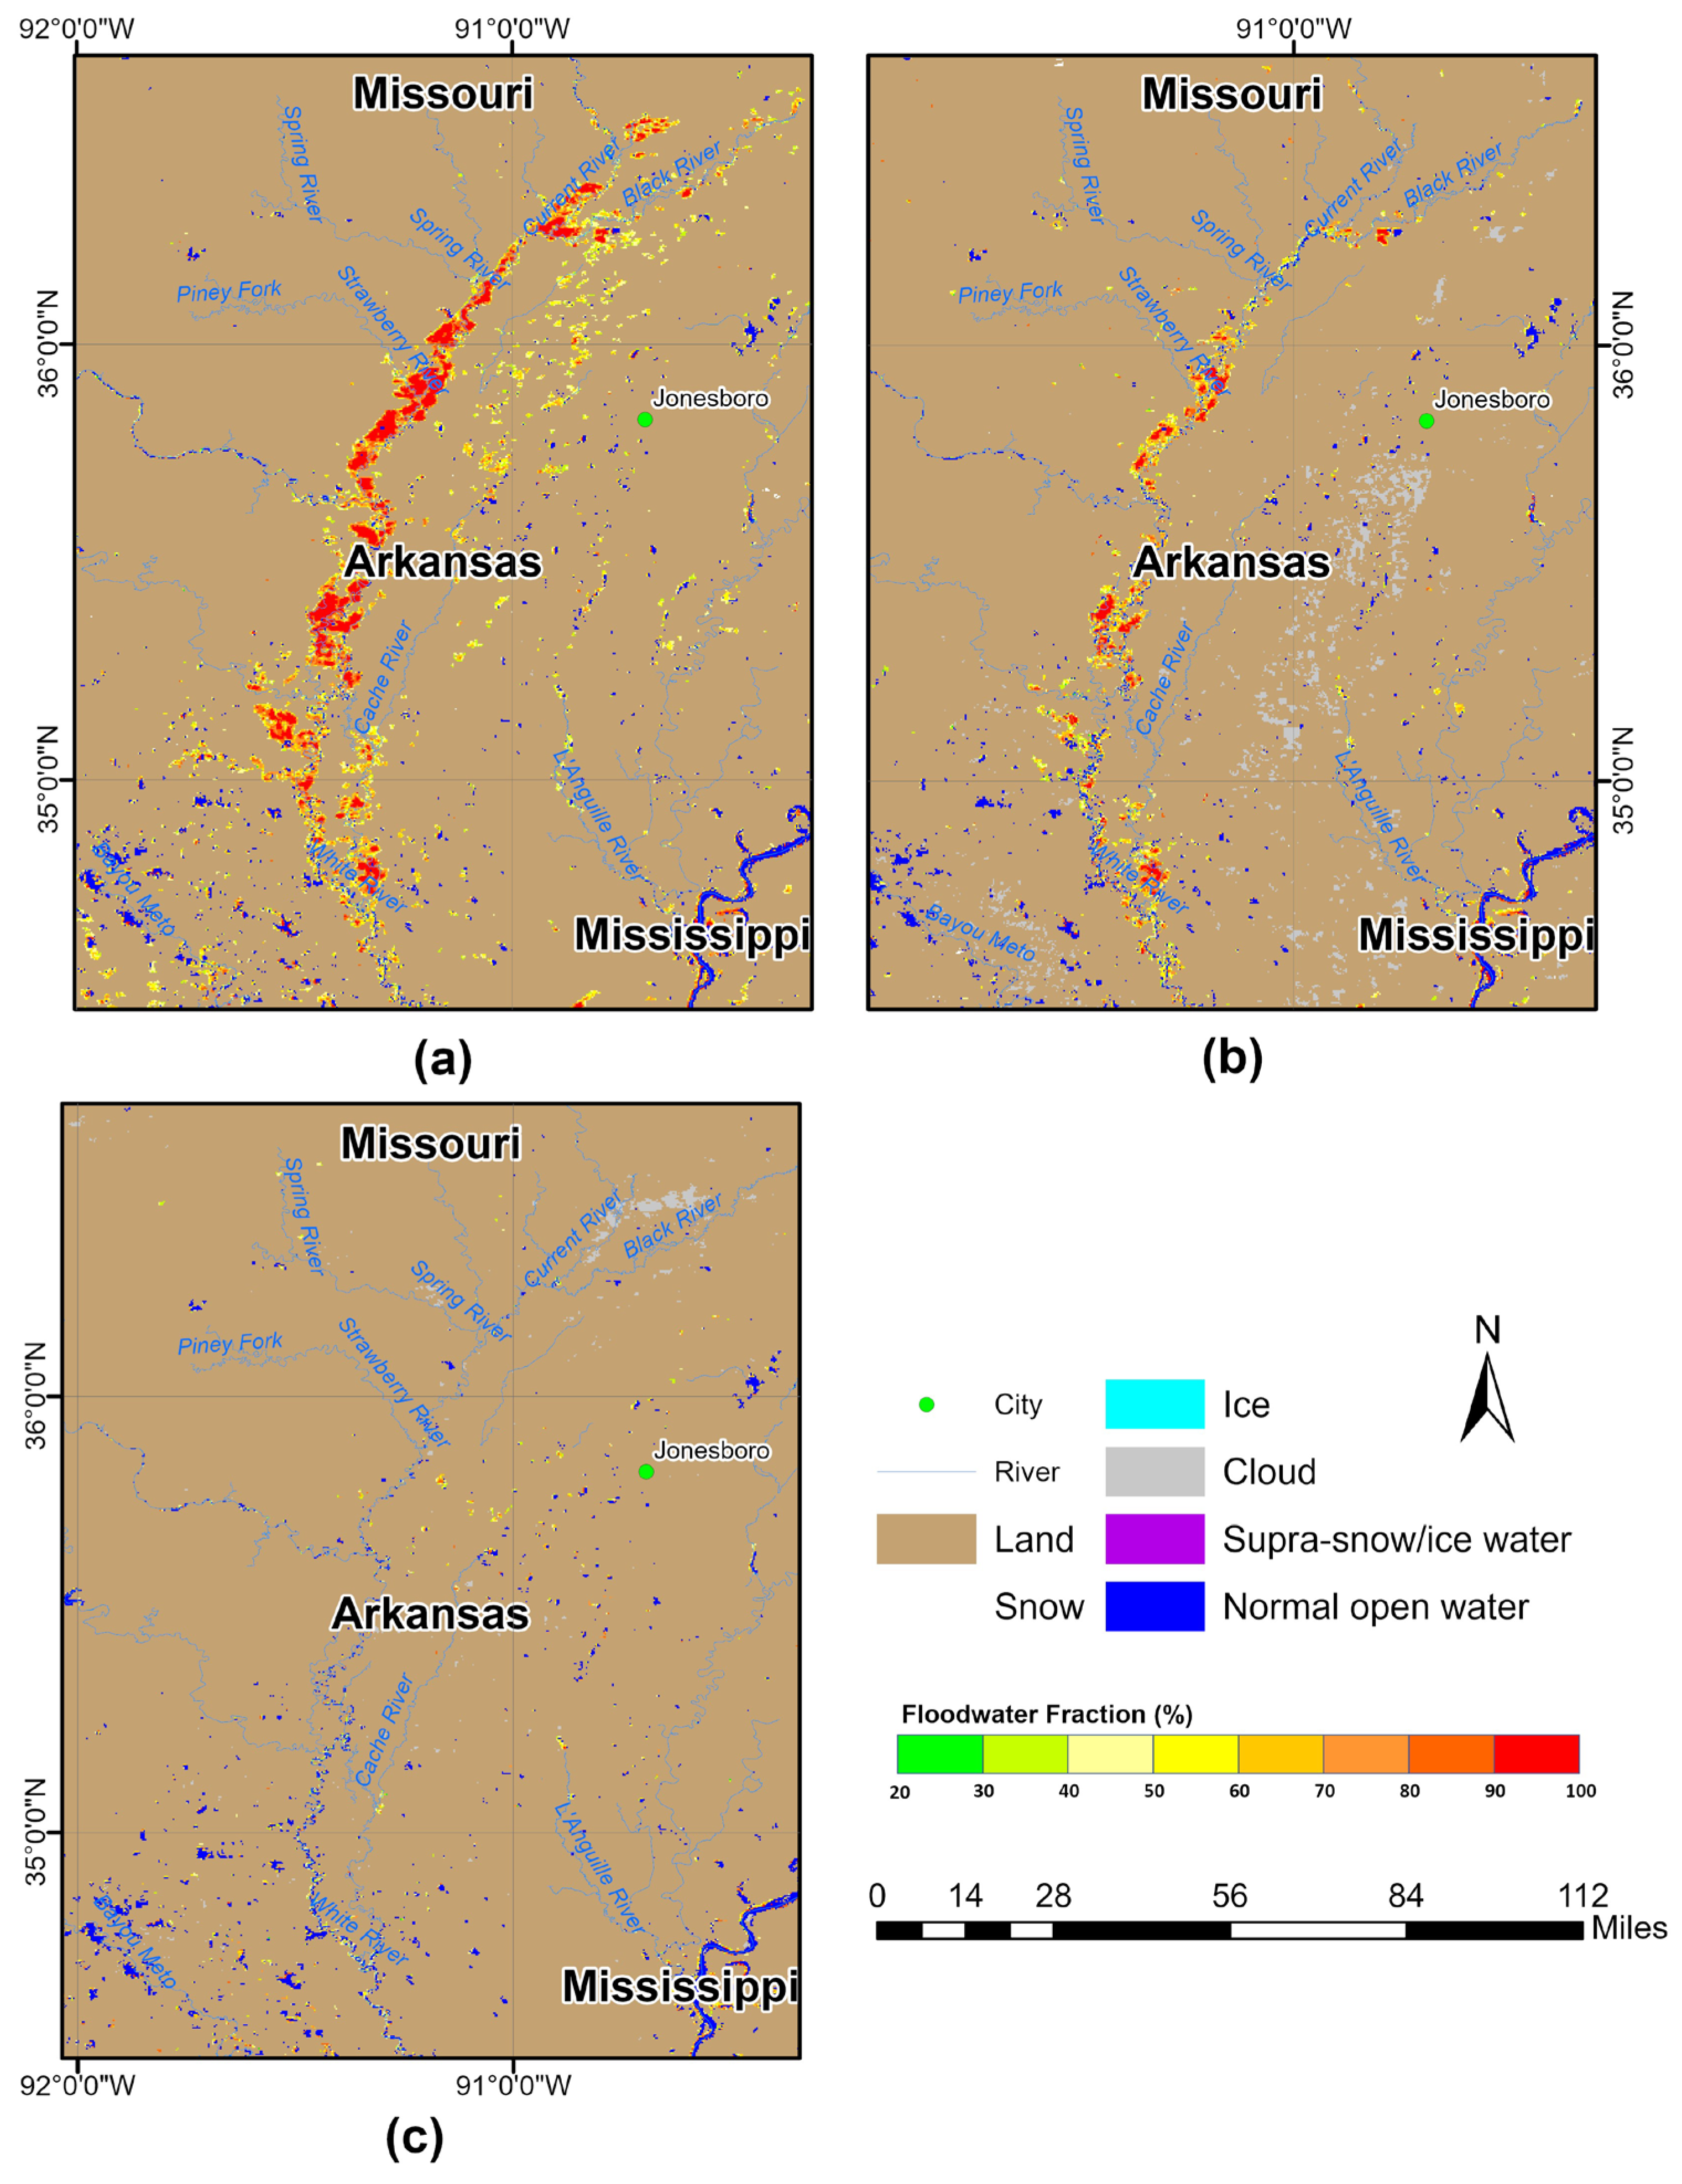
Figure 3 presents the VIIRS flood maps at three different periods during the paddy rice growing season in Arkansas. In early May, the flooded paddy rice fields are newly planted, and large flooded areas are detected in the VIIRS flood map, characterized by high water fraction values (a). By late May, as the rice canopy gradually develops, the water fraction values in these flooded areas decrease (b). The rice harvest period is around September, so by August the flood map shows almost no detected flood areas (c). The detected flood areas in the VIIRS flood product align with the phenology of paddy rice.
Figure 3.
VIIRS 5-day composited flood map: (a) (2 May 2022–6 May 2022), (b) (23 May 2022–27 May 2022), and (c) (13 August 2022–17 August 2022).
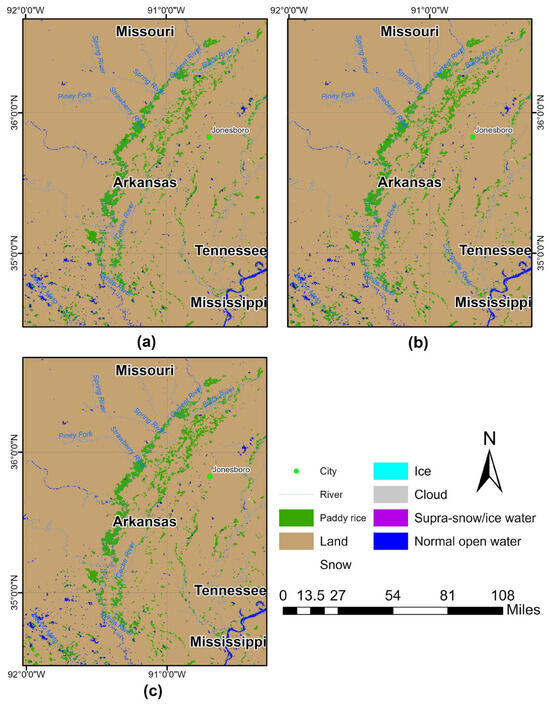
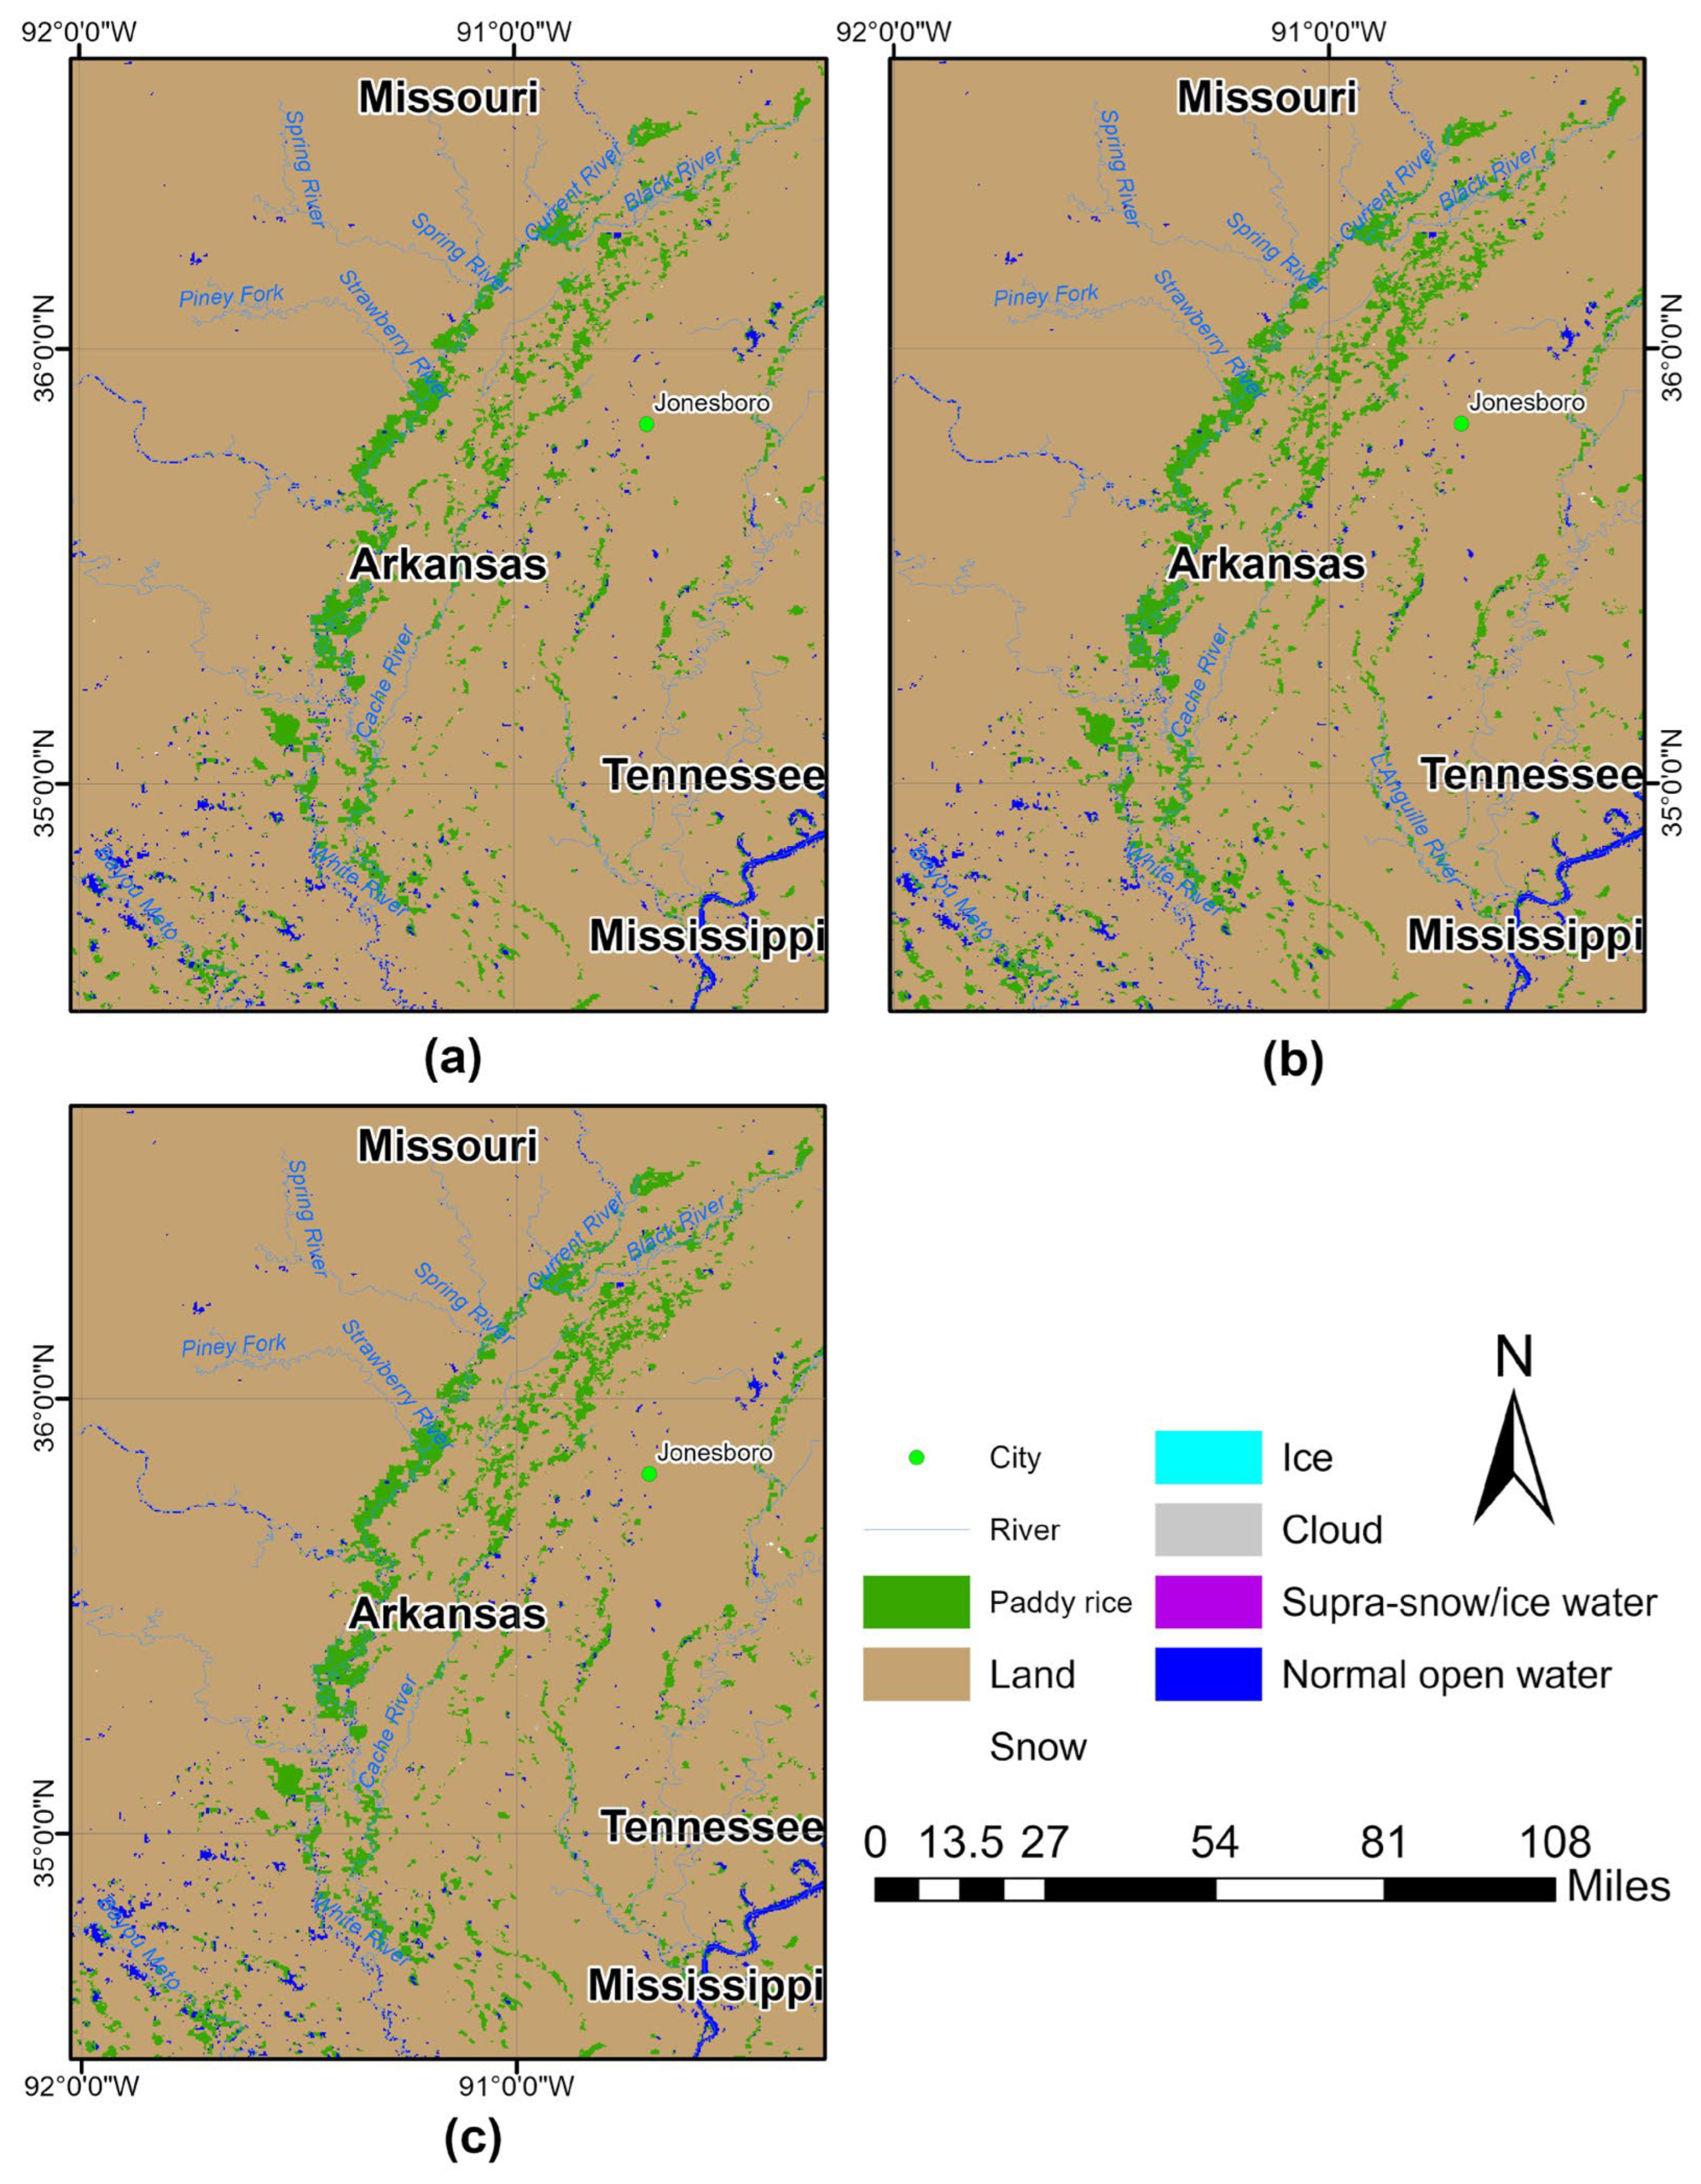
Using the three paddy rice extraction methods employed in this study, three paddy rice distribution maps are presented in Figure 4. The paddy rice extraction results for Arkansas appear visually consistent across the three methods (Figure 4a–c). Based on a review of the relevant literature, several reasons have been identified. In recent years, Arkansas and other rice-growing regions have gradually adopted water-saving cultivation techniques. The traditional practice of continuous flooding for rice cultivation is being replaced. The promotion of the Alternate Wetting and Drying (AWD) irrigation method in Arkansas has reduced rice cultivation’s dependence on constant flooding [39]. Rice farming in Arkansas relies heavily on groundwater, and over-extraction has caused groundwater resources to deplete gradually. Additionally, continuous flooding in rice fields produces methane emissions. These modern techniques not only conserve water resources but also reduce greenhouse gas emissions, enhancing agricultural sustainability.
Figure 4.
Comparison of the results of this study: (a) based on the principles of the difference in duration of the water presence, (b) regression analysis, and (c) Mann–Kendall analysis.
In fields using dry seeding or AWD, water often resides within the soil or forms only a thin surface layer, without creating the significant water surface reflectance typical of flooded fields with high near-infrared reflectance. Moreover, in dry-seeded rice fields, water presence is intermittent and short-lived, such as water percolating quickly after irrigation. Remote sensing, limited by satellite overpass times, struggles to capture these short-term flood events. Consequently, the VIIRS flood product cannot detect rice cultivated without continuous flooding, and this study was unable to extract those rice areas. However, this limitation does not affect the primary objective of this study: extracting non-hazardous flood water bodies that may interfere with hazardous floods to improve the accuracy of flood hazard assessments. Therefore, simply extracting the potential paddy rice fields identified in the VIIRS flood product is sufficient to achieve the objective of this study.
3.2. Paddy Rice Extraction in California, US
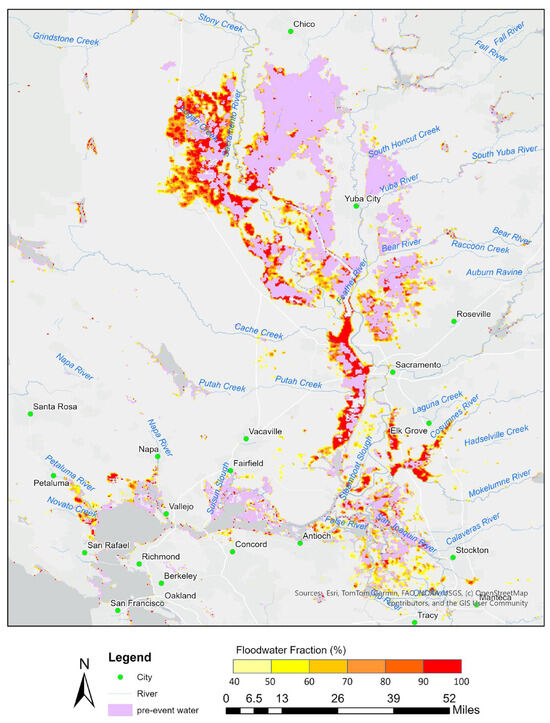
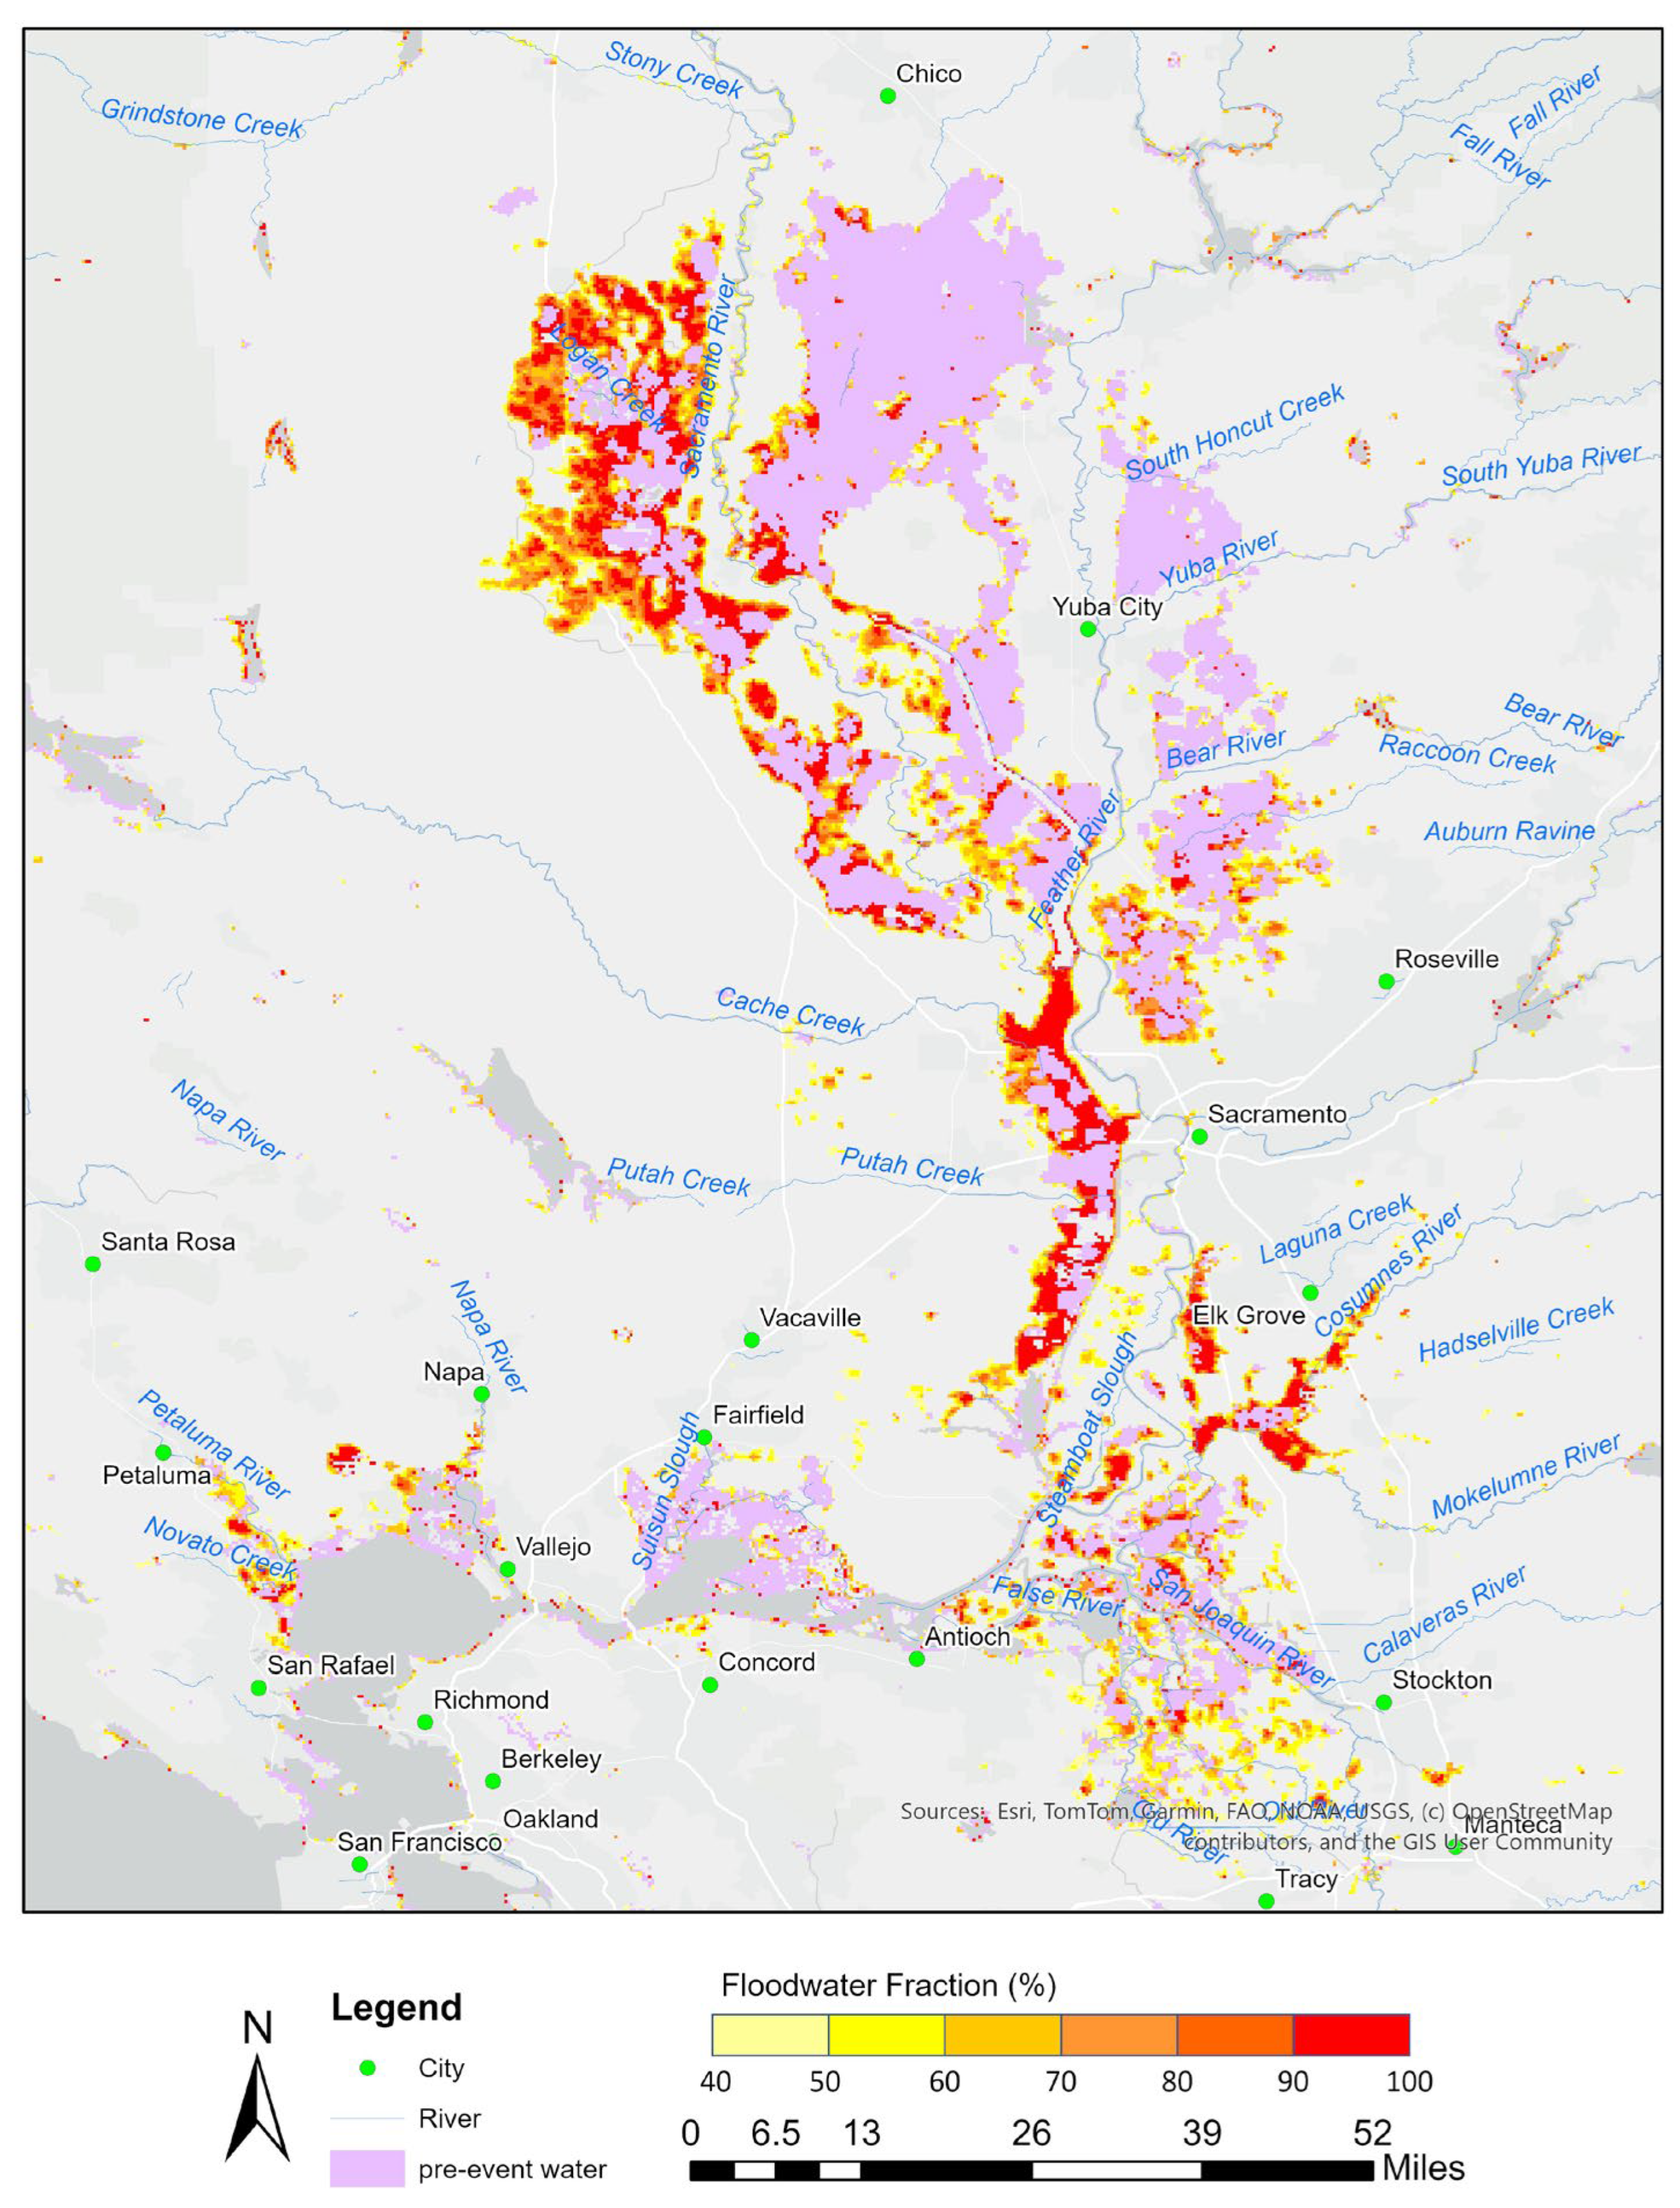
From 31 December 2022 to 20 January 2023, multiple storms caused widespread severe flooding in the Central Coast of California and parts of Nevada. By comparing the VIIRS original flood map before and after the California flood, it is found that large areas of floodwaters already existed before the California flood and were marked as pre-event water in Figure 5.
Figure 5.
VIIRS 5-day composite flood map with pre-event water marked after the CA flood event on 20 January 2023.
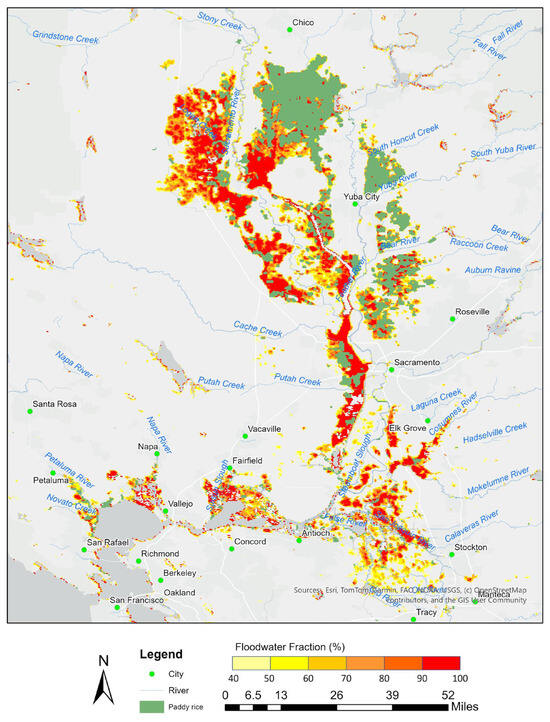
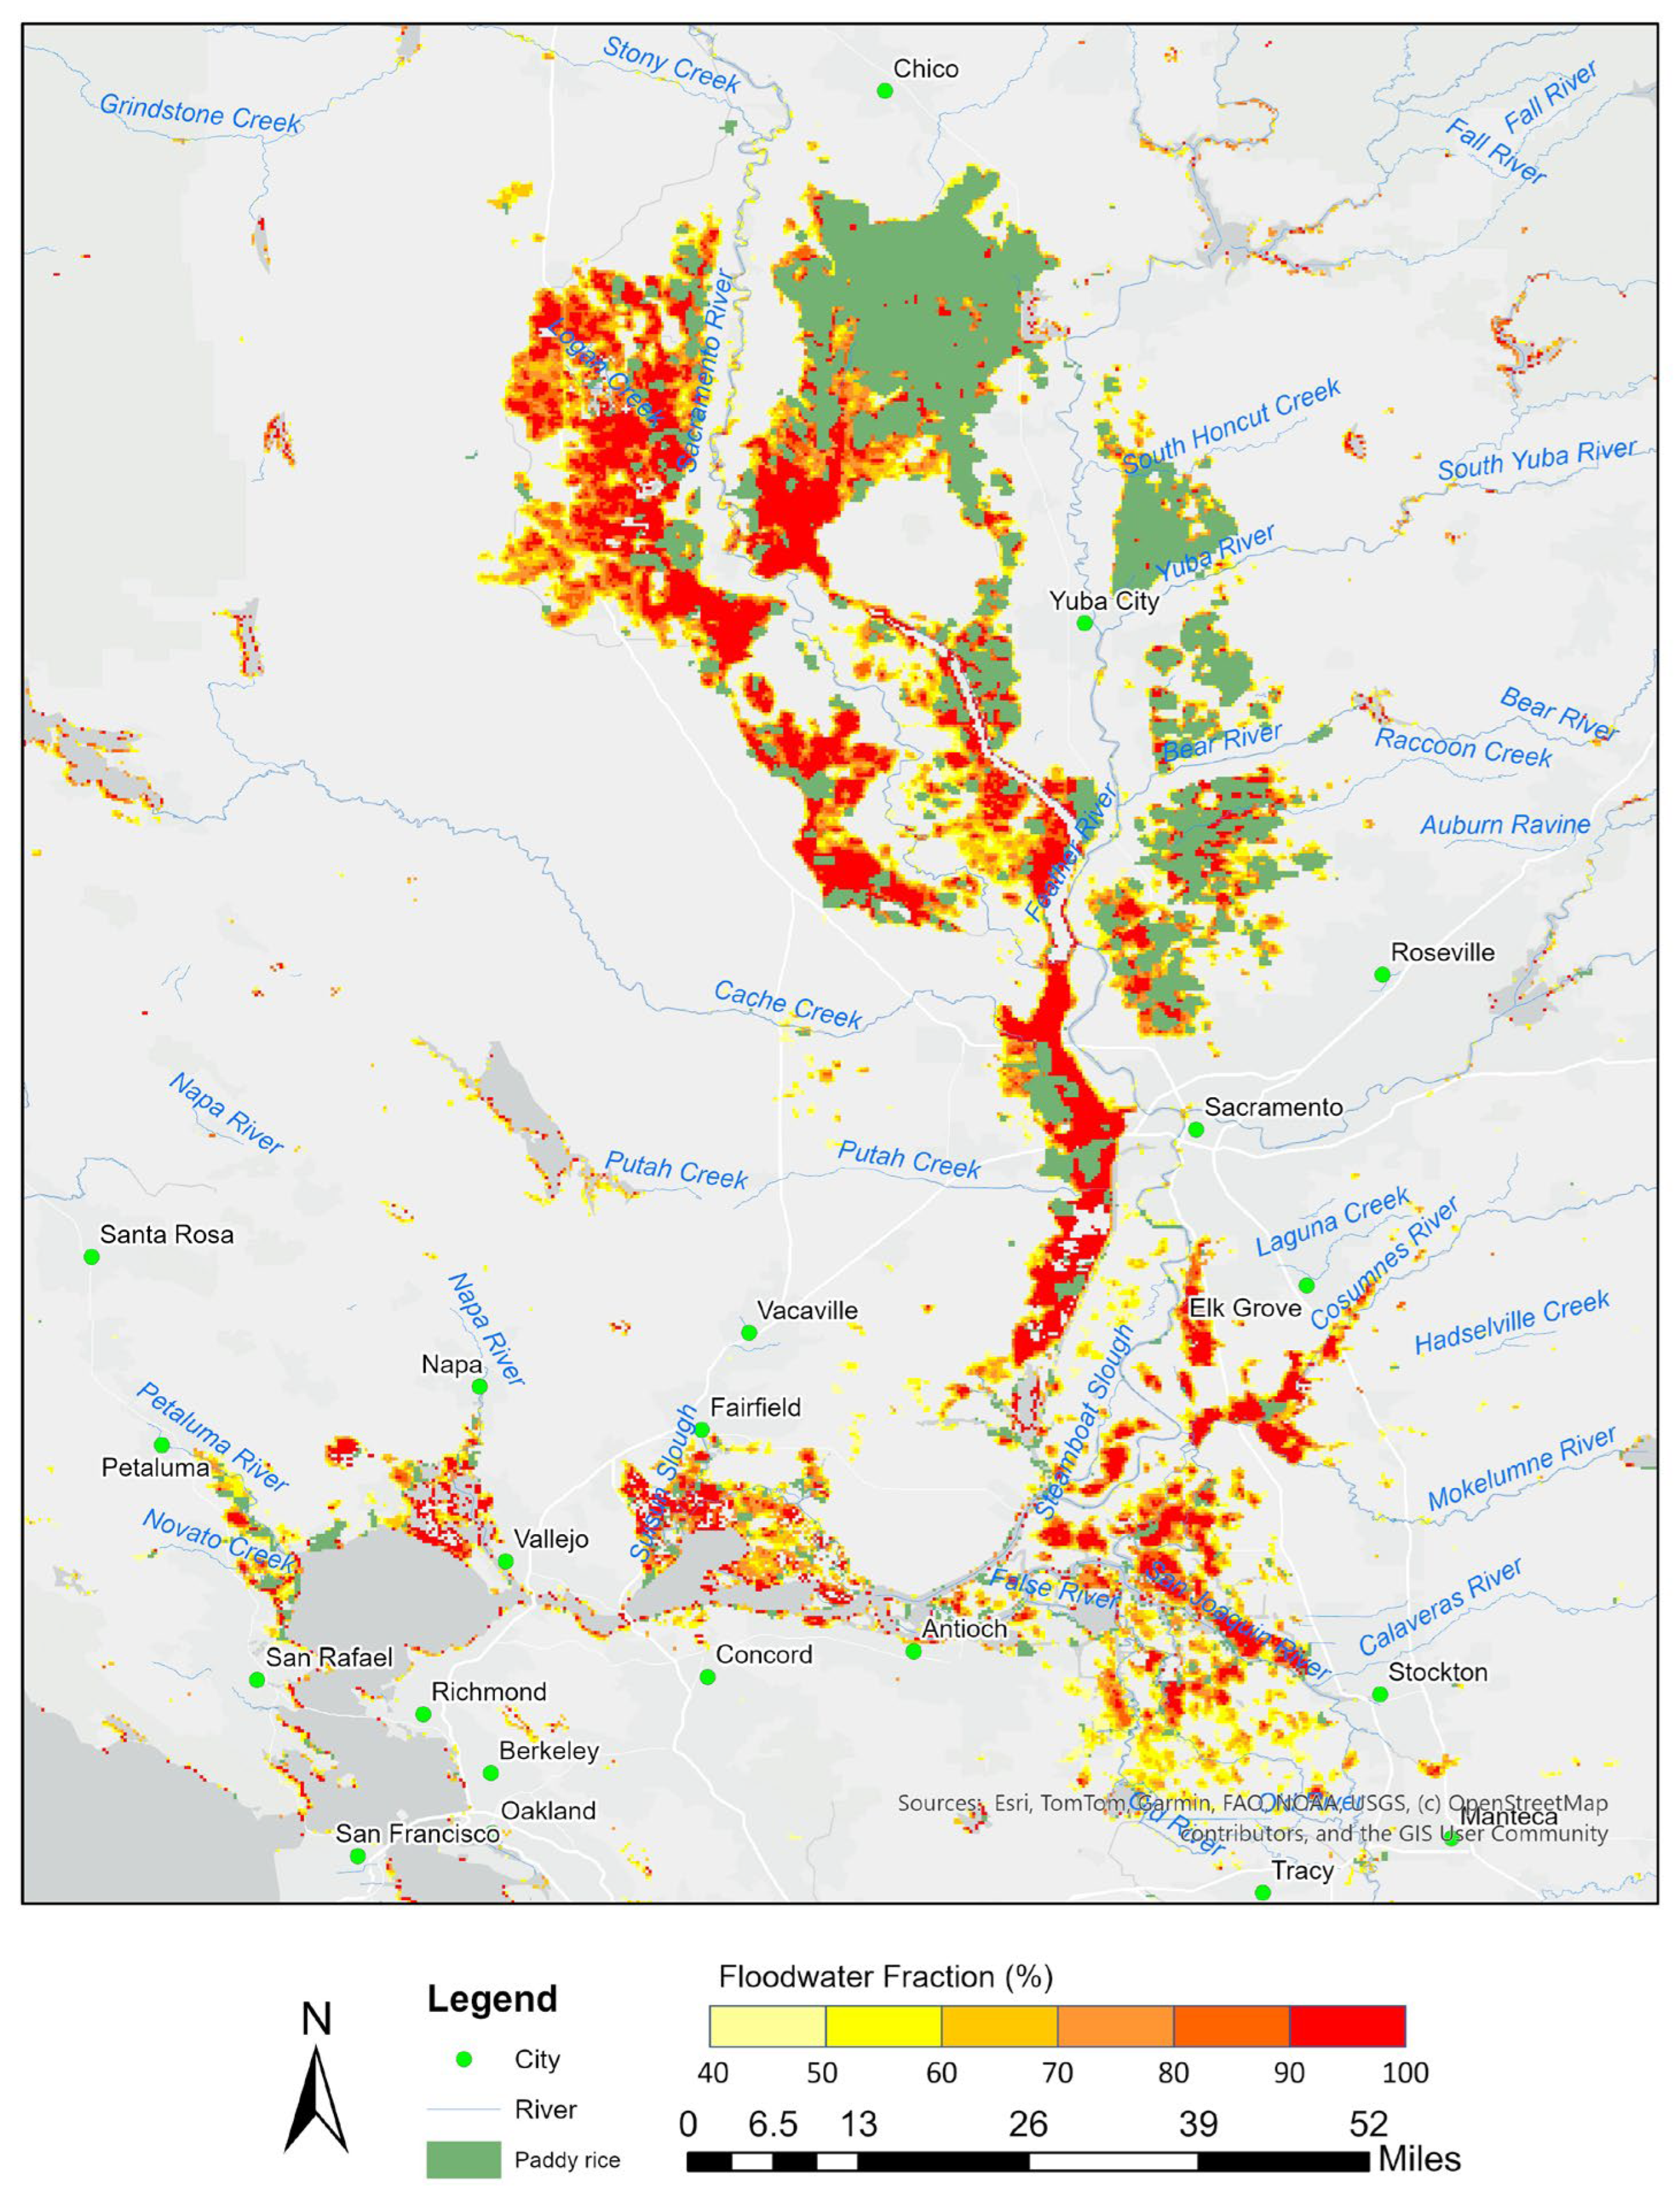
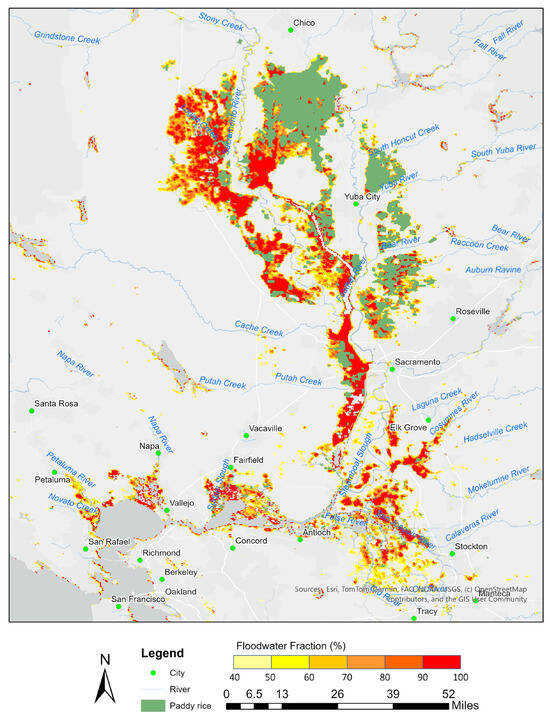
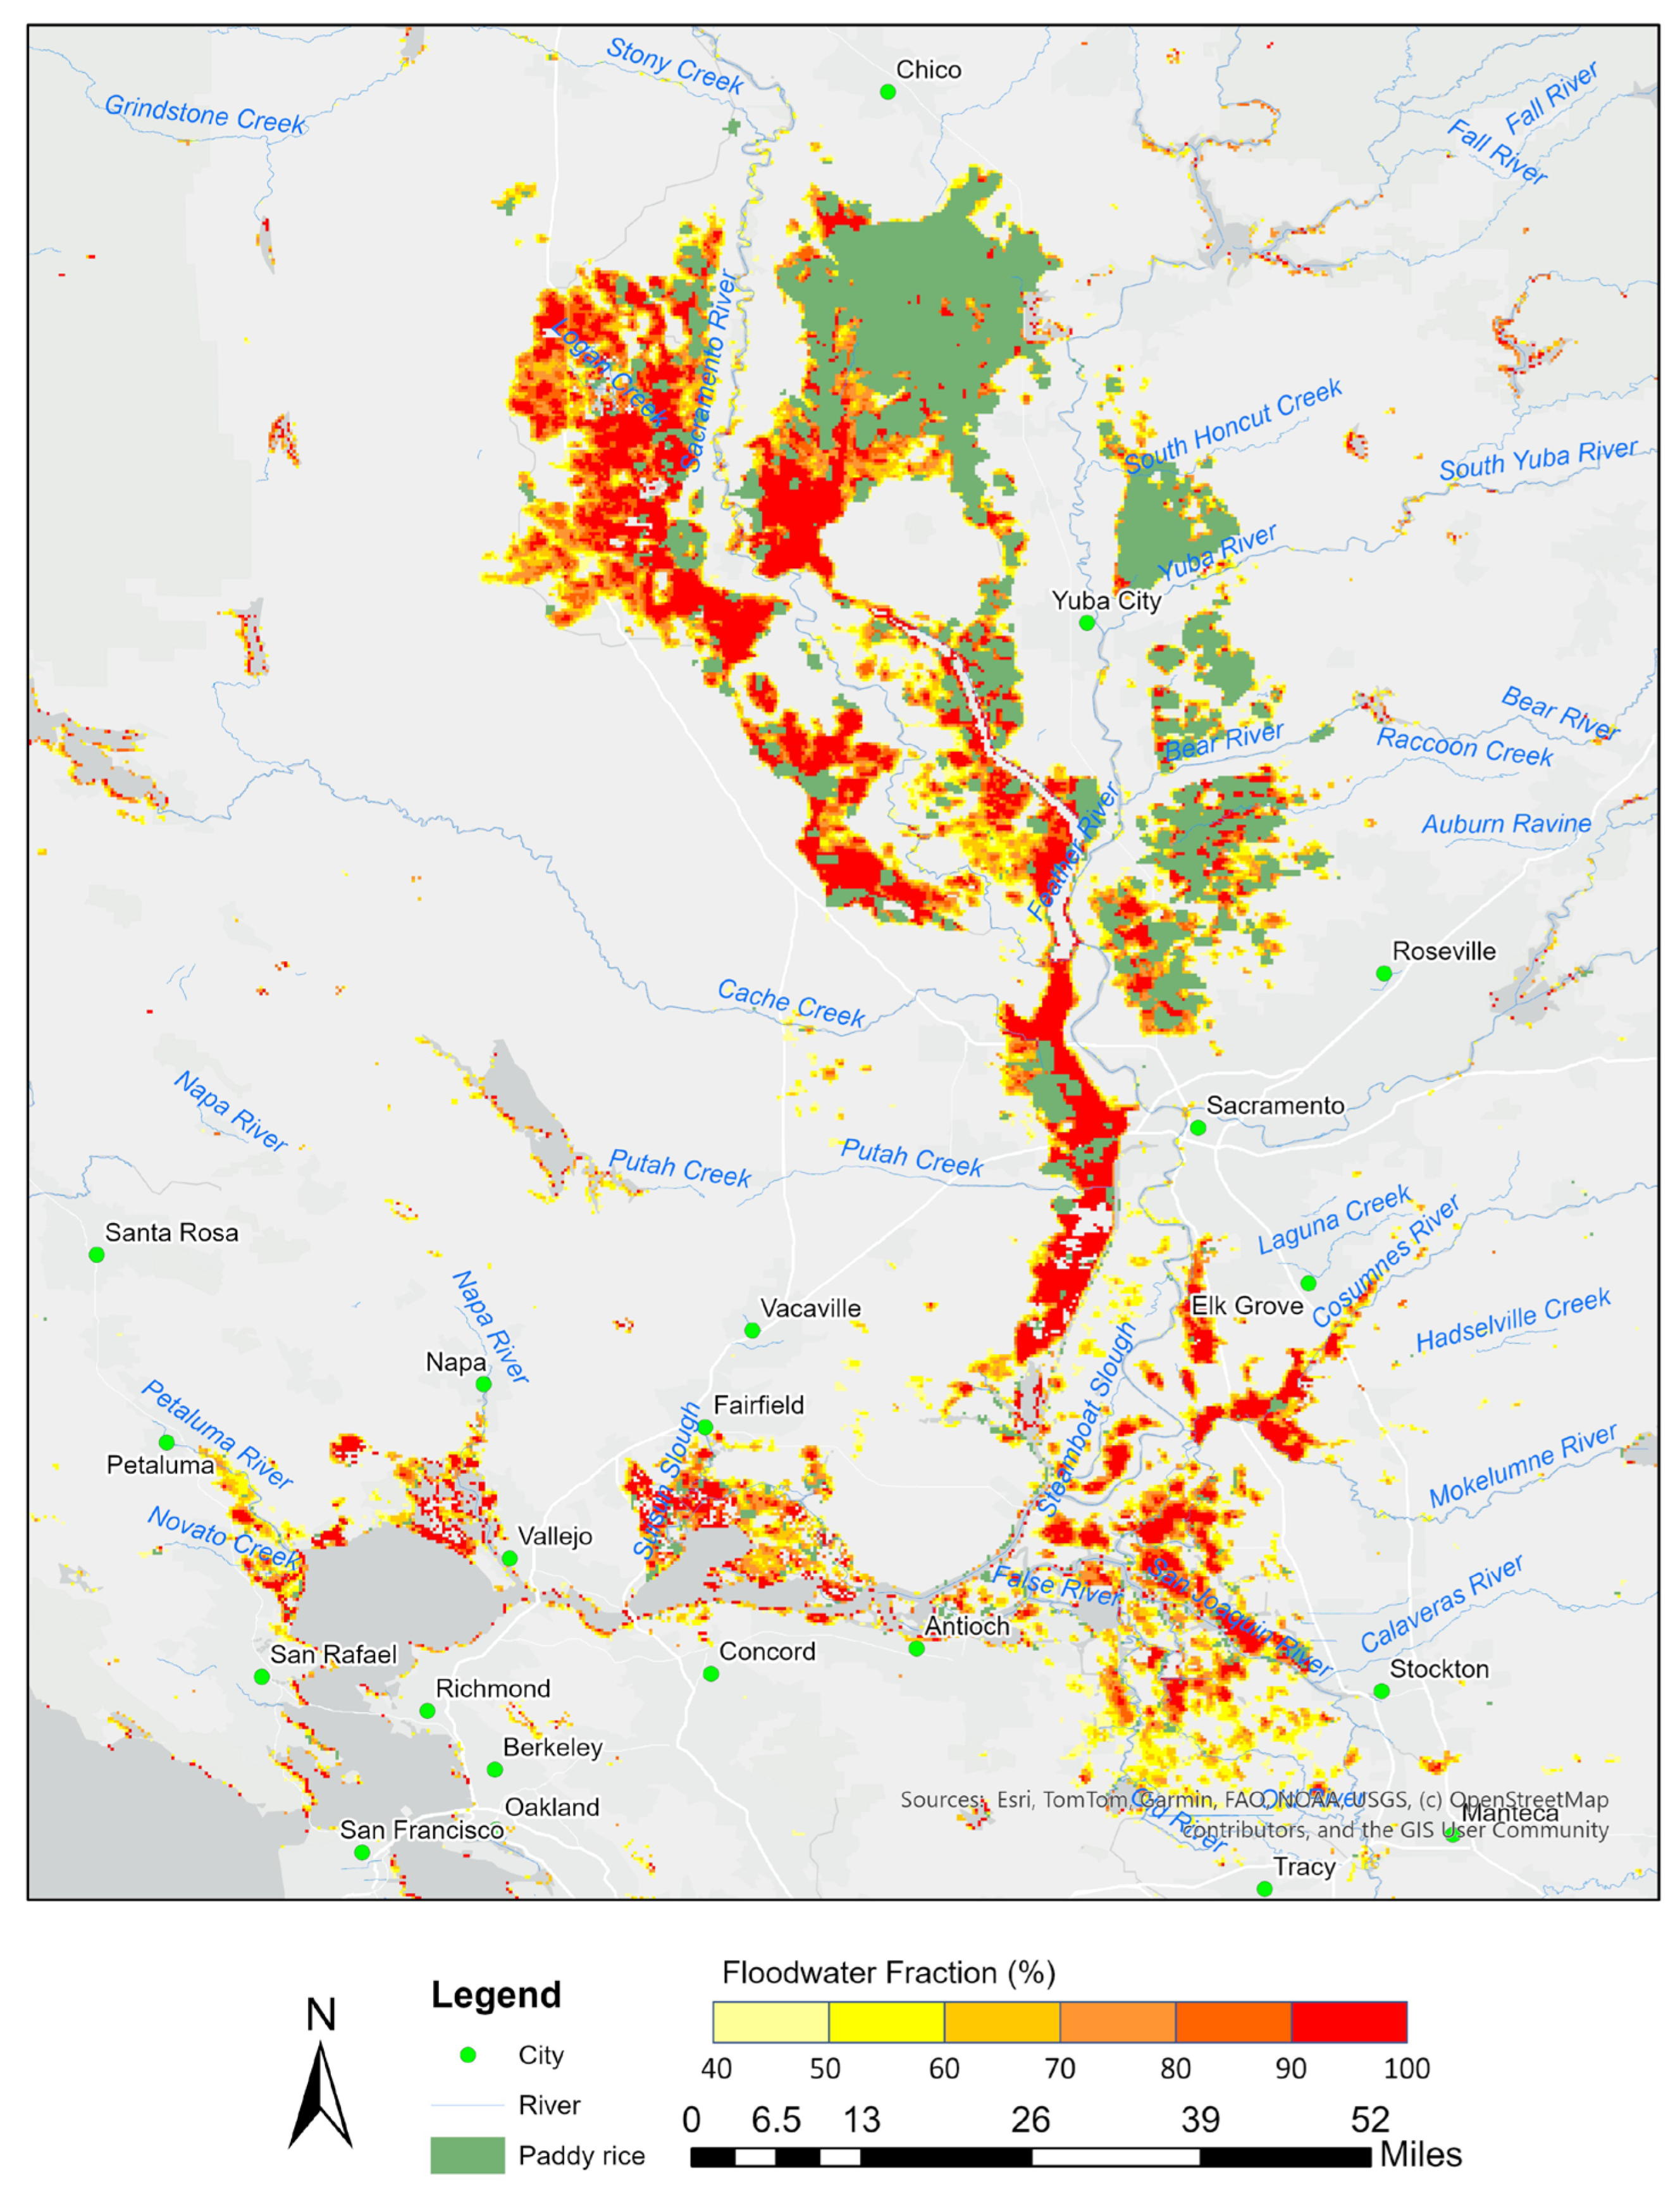
Through satellite images and online information, this area is a paddy rice field. Although paddy rice is typically harvested around October, the remaining rice fields serve as habitats for birds. During winter, when rice is not planted, a large portion of these fields may become flooded (Garr, 2014). Consequently, the California paddy rice fields may be detected as floods by the VIIRS flood map. Figure 6 is the resulting flood map in CA with paddy rice fields, made using the method of the difference in the duration of water presence between paddy rice fields and hazard floodwaters. The green area is a paddy field near Sacramento and Yuba City, California. After excluding paddy rice, the remaining flood areas are the real hazard flood areas after the California flooding.
Figure 6.
VIIRS 5-day composite flood map after the flood event on 20 January 2023, with the identified paddy rice fields based on the duration of water presence.
Figure 7 shows the results of the paddy rice area extracted using trend analysis based on linear regression. Comparing these results with those from the previous method, it can be observed that the results are very similar to those of the last method. As mentioned in the Section 2, the water fraction time series data for paddy rice areas cannot be definitively determined to follow a linear trend. Therefore, when only evaluating the trend in the data, it is sufficient to consider the slope and significance of the time series data.
Figure 7.
VIIRS 5-day composite flood map on 20 January 2023, with the identified paddy rice fields by the regression analysis.
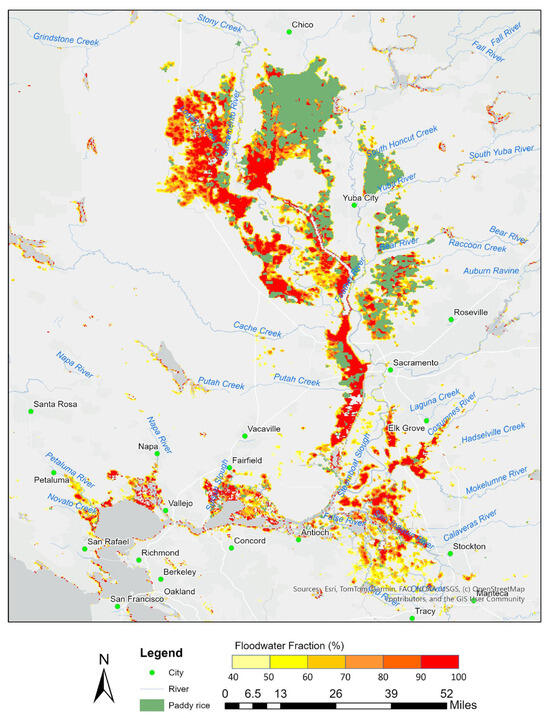
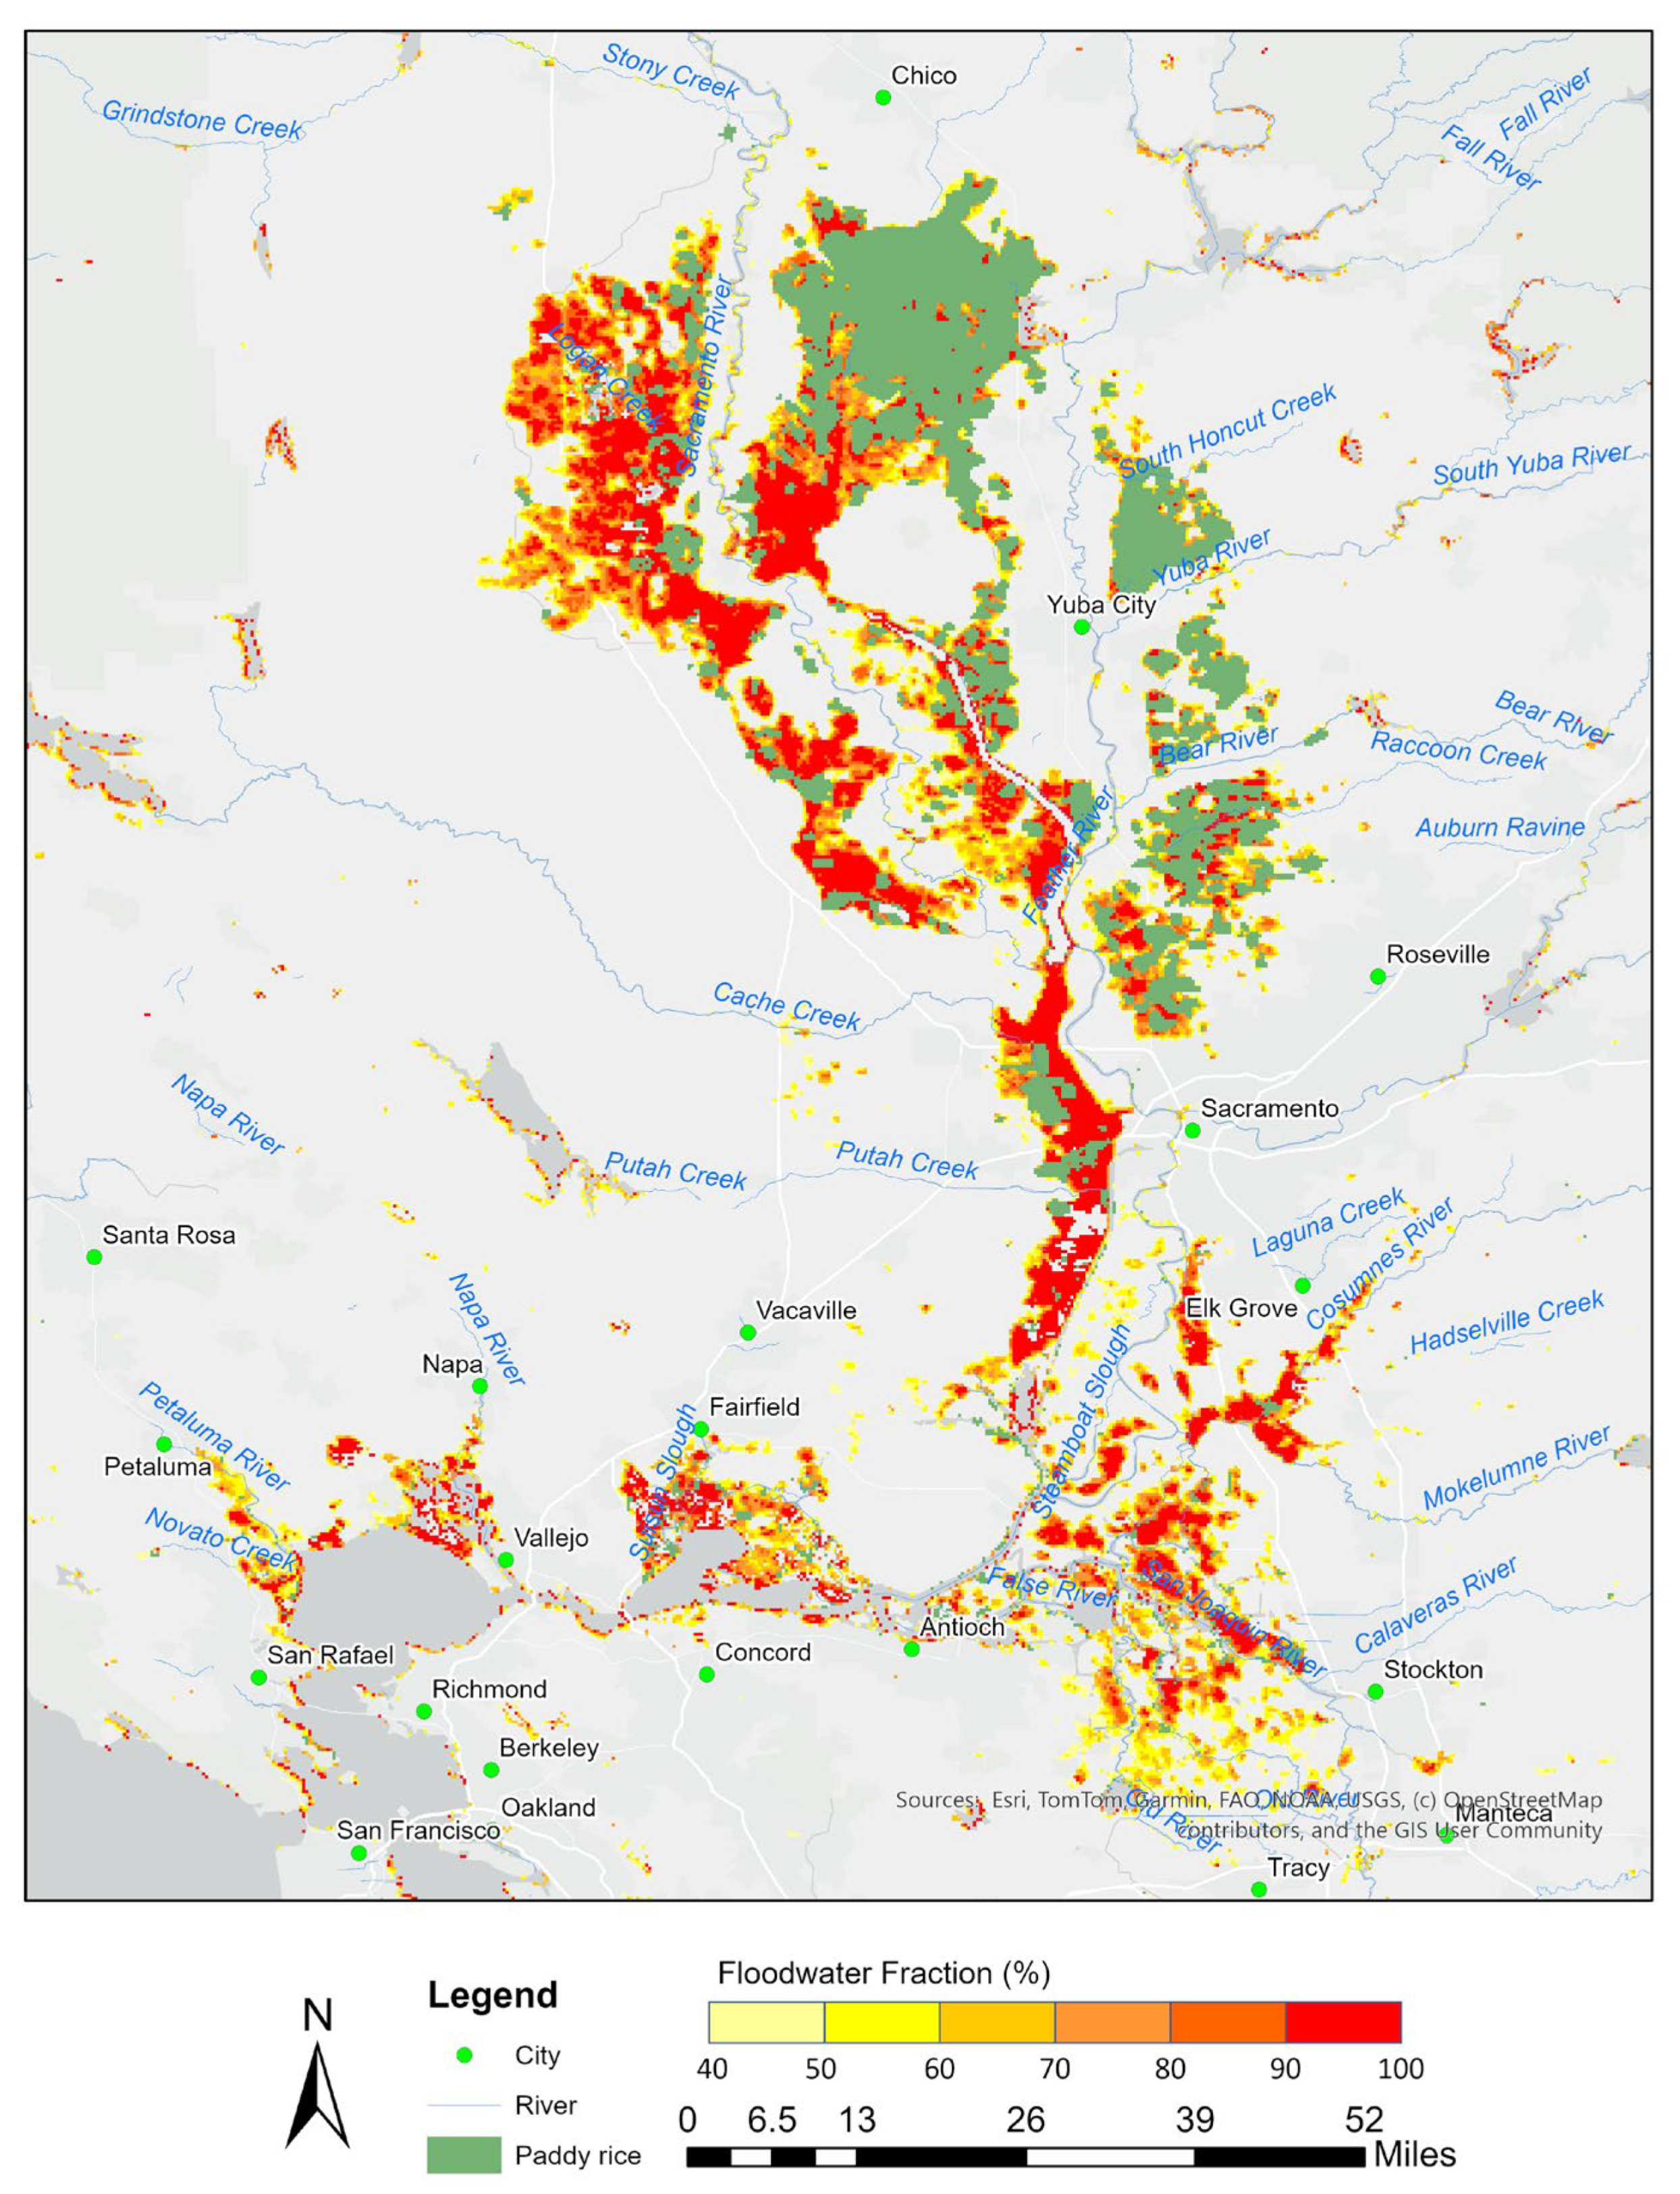
Figure 8 shows the VIIRS 5-day composite flood map on 20 January 2023, with the paddy rice fields identified by the Mann–Kendall analysis.
Figure 8.
VIIRS 5-day composite flood map after the flood event on 20 January 2023, with the identified paddy rice fields by the Mann–Kendall analysis.
By observing the results obtained from the Mann–Kendall analysis (Figure 8), the extracted paddy rice areas are generally similar to those derived from the previous two methods.
3.3. Evaluations
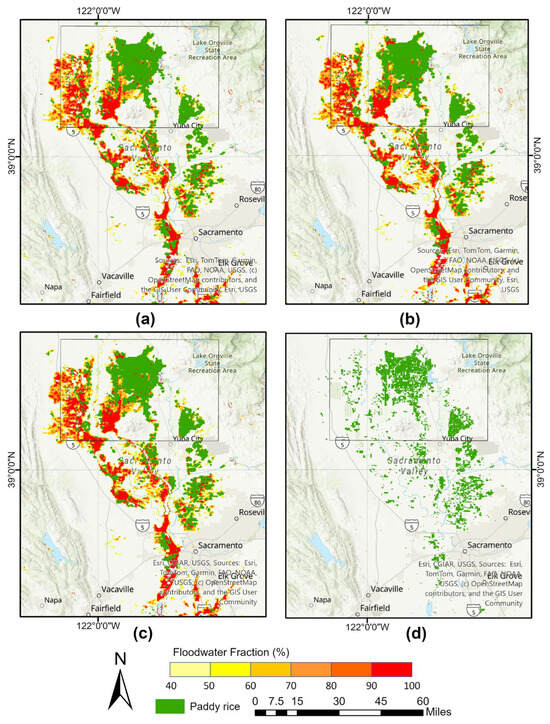
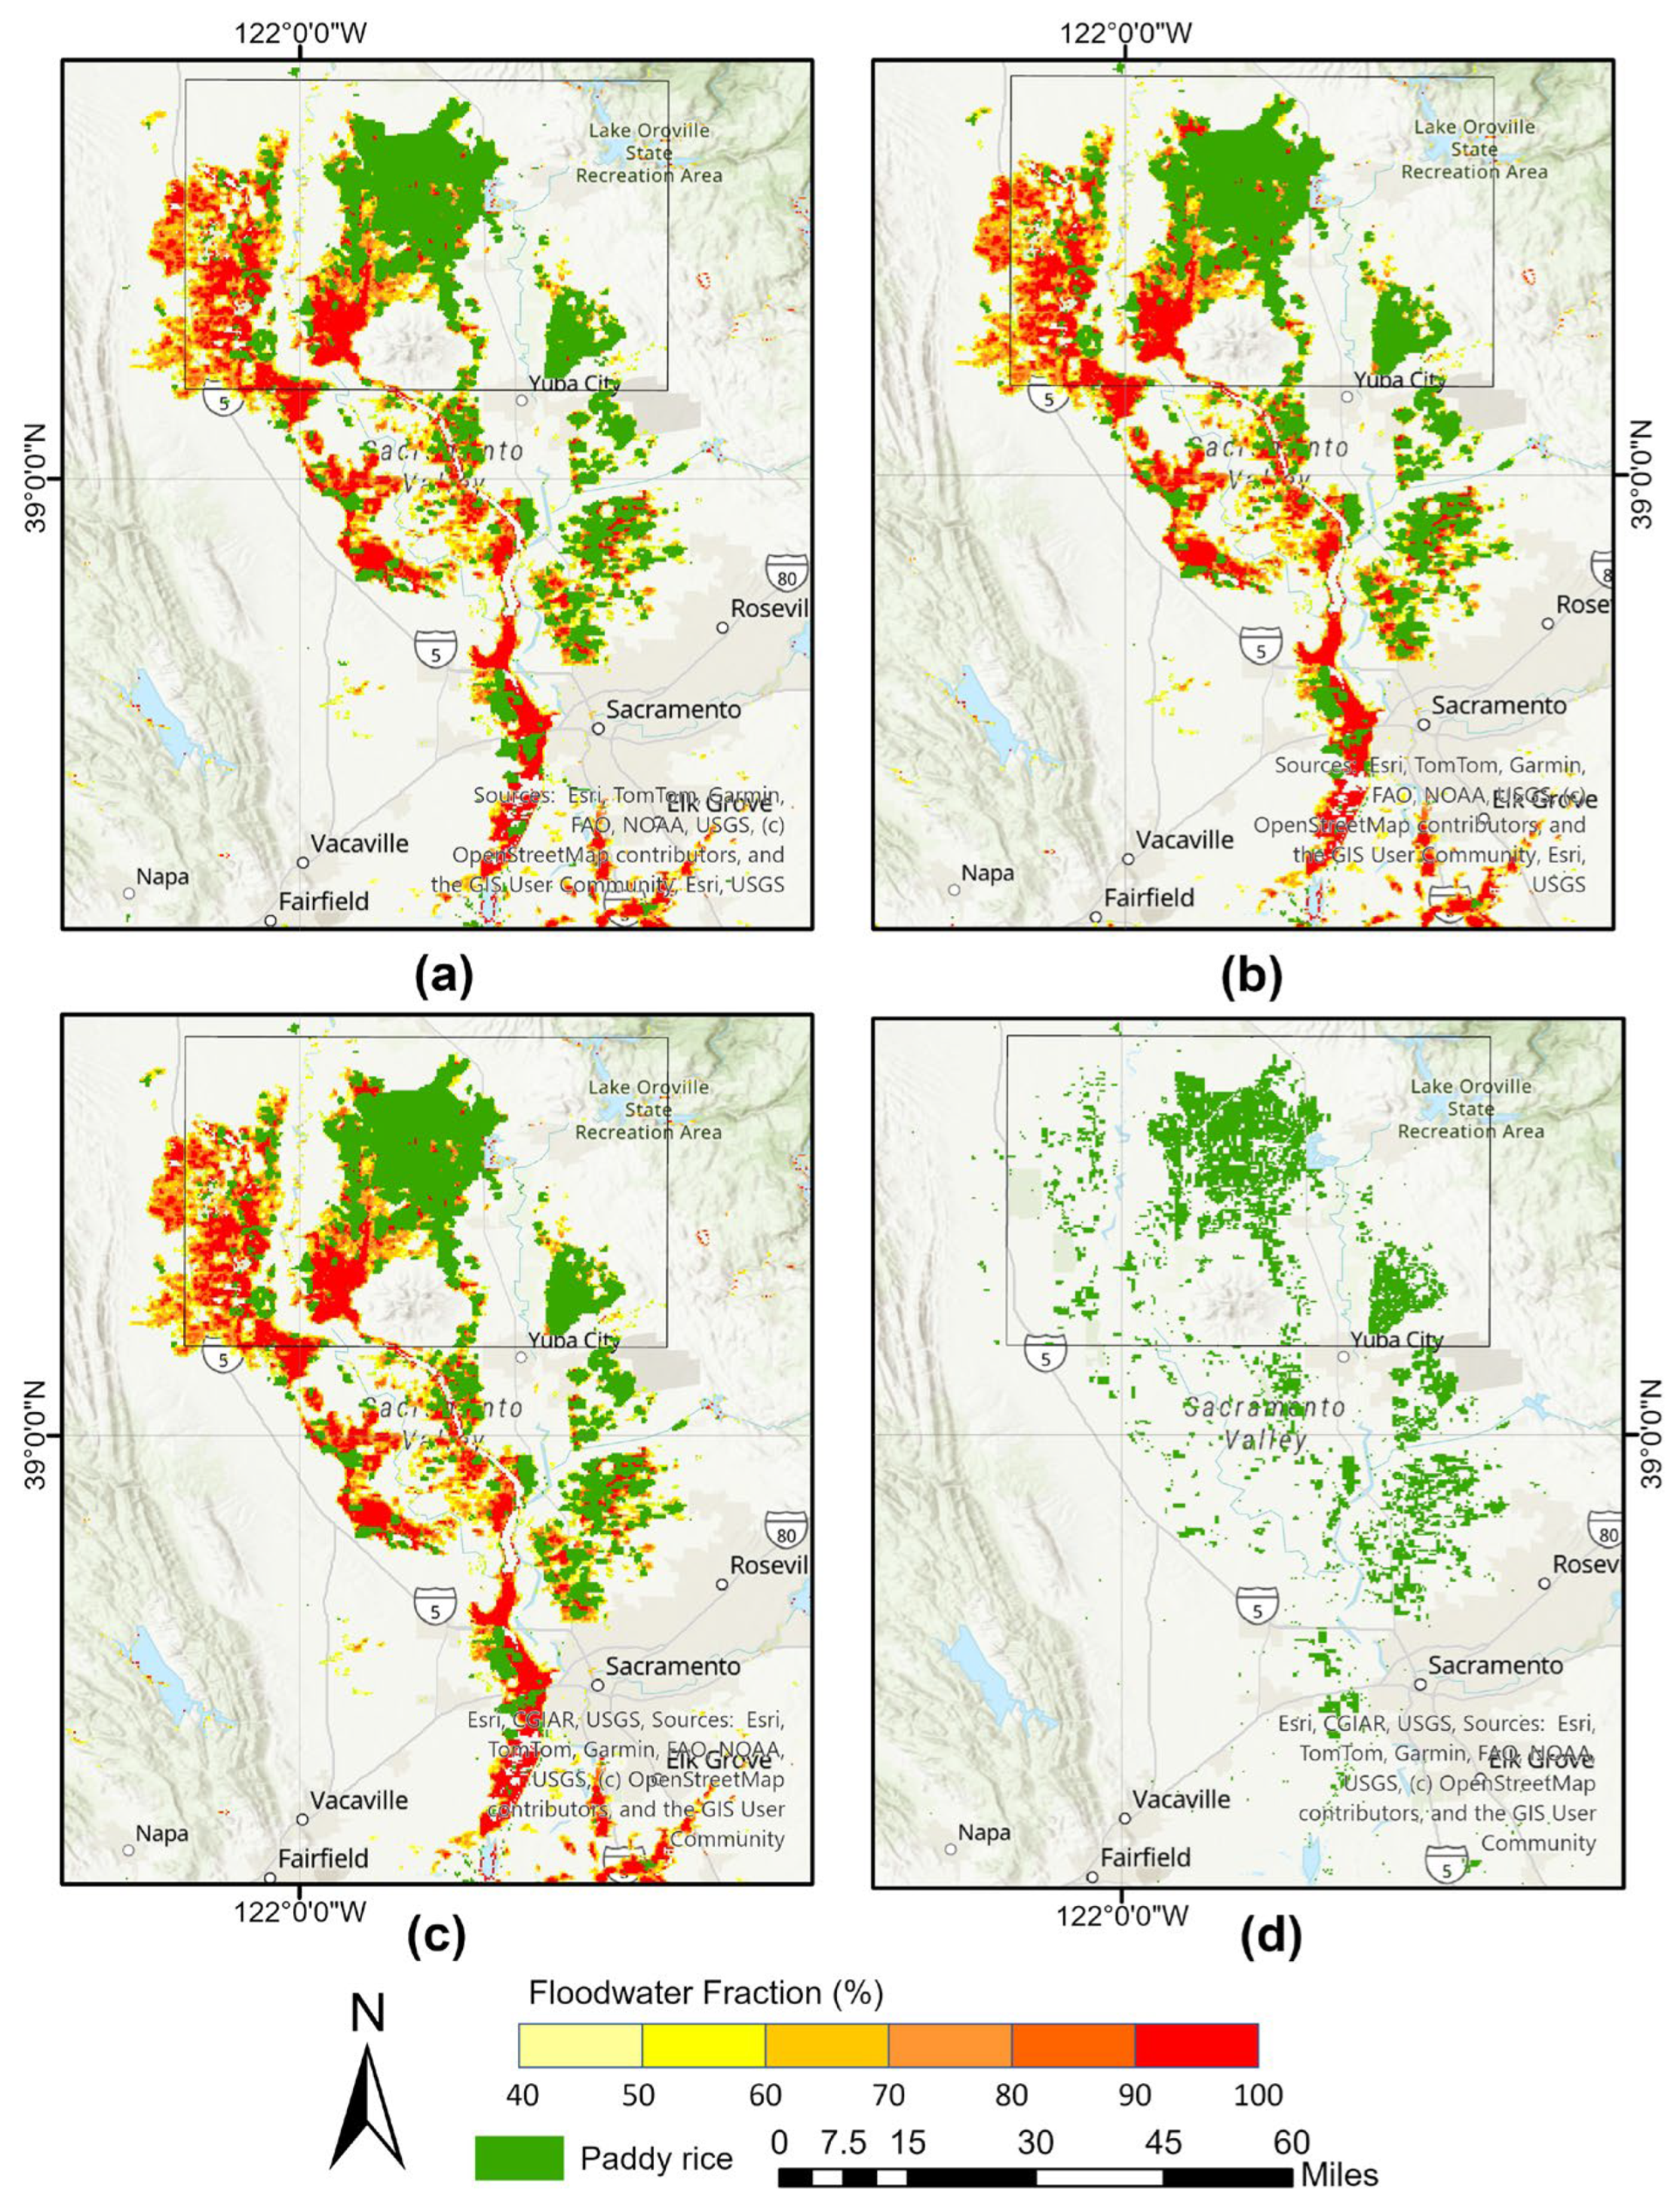
Due to the difficulty in obtaining ground observations in a large area, the feasibility of these three methods was evaluated using paddy rice data from the USDA’s CDL for the confusion matrix analysis. Figure 9 shows the comparison of paddy rice distributions, where (d) represents the paddy rice data obtained from the USDA, resampled to the same spatial resolution. Across the full study area, non-paddy rice pixels greatly outnumber paddy rice pixels. Conducting an accuracy assessment over the entire domain would therefore result in an overwhelming number of true negatives, masking performance differences among methods. To alleviate this class imbalance and enable a more informative comparison, a representative test area was selected (indicated by the black box in Figure 9). Within this area, confusion matrix analyses were performed for each method using the USDA CDL product as a reference dataset rather than an absolute ground truth. As a remote sensing-based classification product, the USDA CDL is subject to uncertainties, particularly in regions with mixed cropping systems or temporally variable surface water conditions [36].
Figure 9.
Paddy rice extraction based on the methods from the duration of water presence (a), regression analysis (b), and Mann–Kendall analysis (c), and compared with the rice distribution from the USDA (d).
The selected test area was not chosen to maximize performance, but to reflect typical conditions within the study region. It includes dense paddy rice cultivation, non-paddy cropland, and non-agricultural land covers, capturing the main land-cover combinations relevant to rice identification. Moreover, the relative balance between paddy and non-paddy pixels within this area reduces the bias introduced by extreme class imbalance, allowing a clearer comparison of method performance. The area also encompasses typical conditions where paddy rice is easily confused with flood signals, such as persistently inundated rice fields, short-term surface water, and non-hazardous shallow water bodies. As such, it provides a meaningful setting for evaluating both rice detection capability and potential misclassification risks in flood monitoring applications. Nevertheless, we acknowledge that validation based on a selected subregion cannot fully represent performance across all landscapes and crop management conditions within the entire study area.
Table 1, Table 2 and Table 3 summarize the confusion matrix results for the duration-difference method, the regression-based trend analysis, and the Mann–Kendall trend analysis, respectively. All three methods exhibit highly consistent performance, with overall accuracy exceeding 93% and F1-scores above 80%. Although precision values are relatively lower, they remain above 73%, indicating that all three approaches are capable of identifying paddy rice fields in California. The duration-difference method achieves slightly higher accuracy and F1-score than the other two methods; however, these differences are marginal and insufficient to establish a clear performance advantage.
Table 1.
Confusion matrix between the duration-difference method and the USDA CDL reference data.
Table 2.
Confusion matrix between the regression-based trend analysis and the USDA CDL reference data.
Table 3.
Confusion matrix between the Mann–Kendall trend analysis and the USDA CDL reference data.
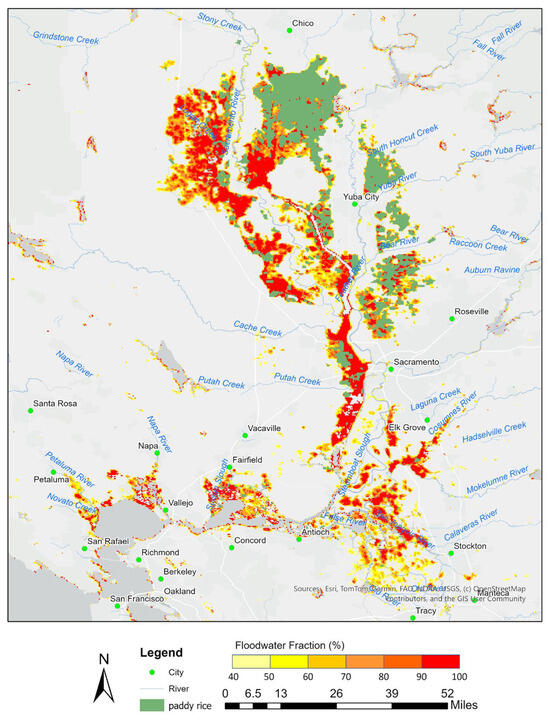
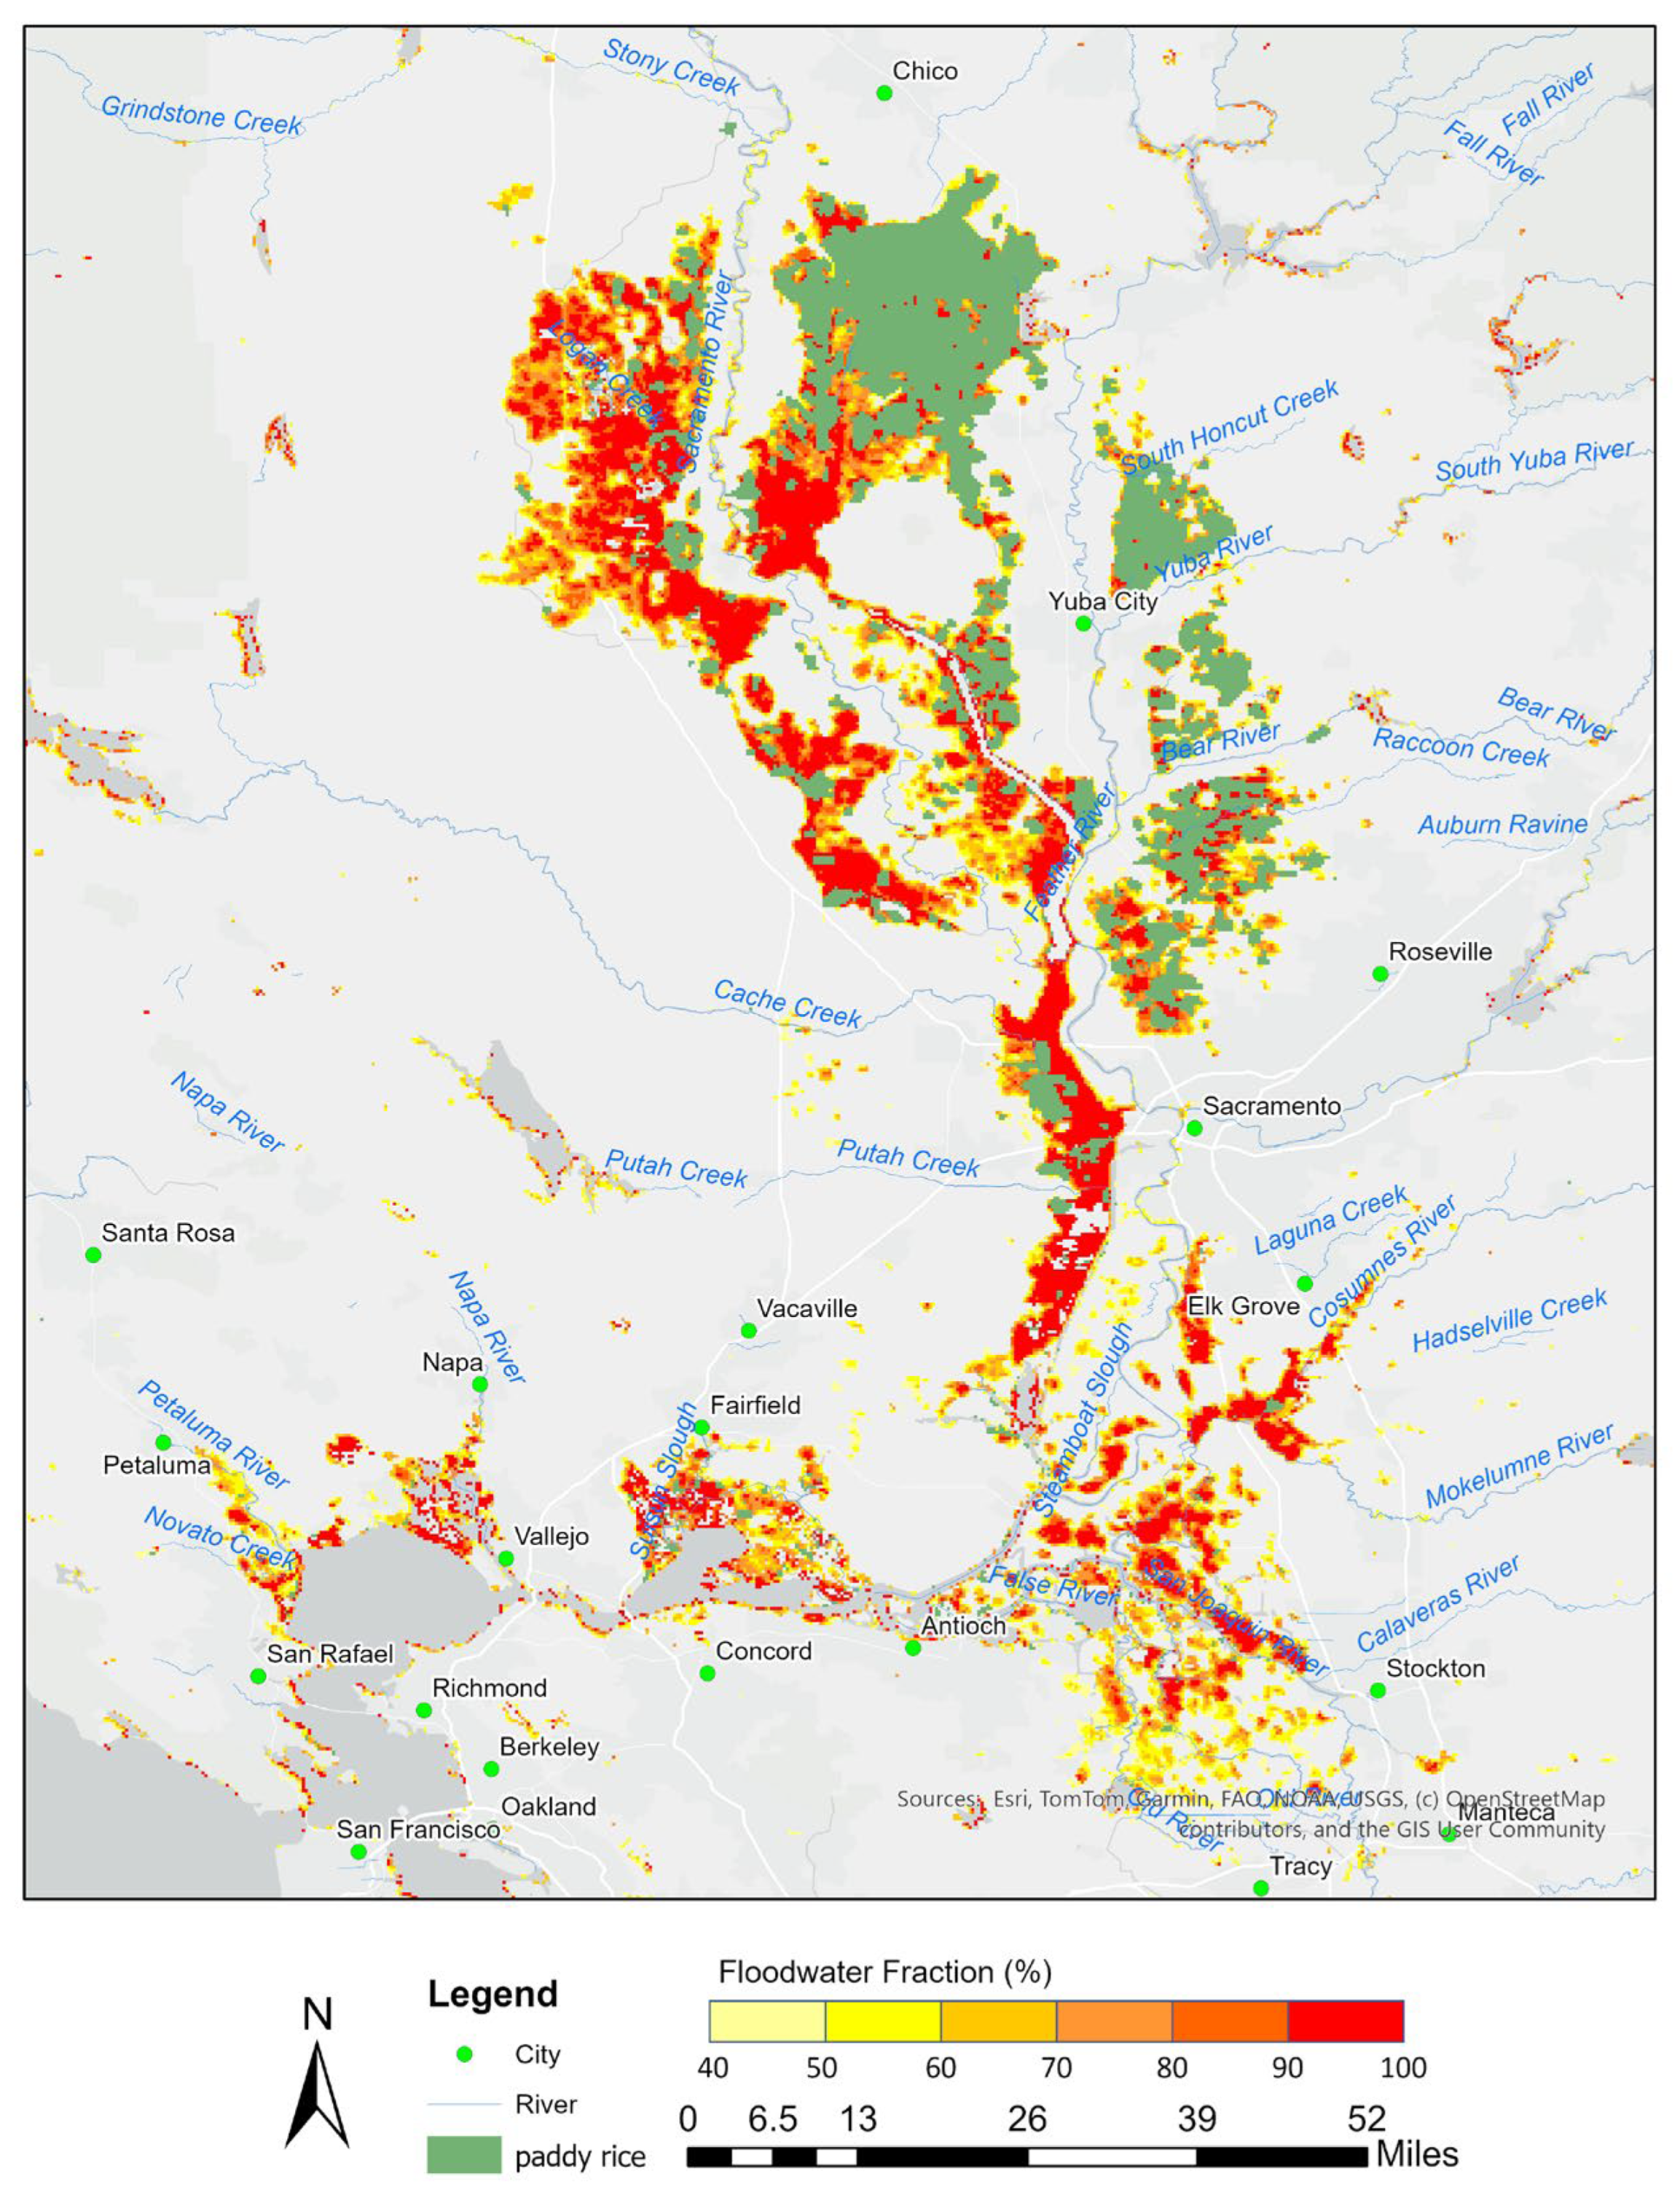
Beyond evaluating individual methods, a conservative consensus result was derived by identifying paddy rice pixels consistently detected by all three methods. Figure 10 shows a VIIRS 5-day composite flood map for 20 January 2023, with the consensus paddy rice mask overlaid. To assess the behavior of this consensus result in a flood-related context, an additional confusion matrix analysis was conducted using VIIRS flood reference data, as summarized in Table 4.
Figure 10.
VIIRS 5-day composite flood map on 20 January 2023, with paddy rice fields identified by the intersection of three methods.
Table 4.
Confusion matrix between the consensus paddy rice identification results (intersection of three methods) and the VIIRS flood reference data.
A quantitative comparison of performance metrics is provided in Table 5. While the three individual methods achieve similar accuracy and F1-scores, the intersection-based consensus result exhibits substantially higher precision, accompanied by a slight reduction in recall. This reflects an intentional trade-off: the consensus approach markedly reduces false positives by excluding pixels detected by only one or two methods, while inevitably omitting some true paddy rice pixels.
Table 5.
Summary of performance metrics for the paddy rice identification methods.
It should be emphasized that paddy rice identification in this study is not intended as an independent agricultural mapping product, but as an auxiliary step for suppressing rice-induced false alarms in optical flood detection. In flood monitoring applications, incorrectly removing true flood pixels by misclassifying them as paddy rice is more detrimental than retaining a limited number of rice-related false positives. Therefore, although the consensus result is more conservative and less complete, its higher precision makes it particularly suitable for improving the reliability of flood hazard products.
4. Discussion
The phenological characteristics of rice growth are the most important principle for extracting paddy rice areas from VIIRS flood maps. Unlike other crops or upland rice, paddy rice is primarily cultivated in flooded fields, requiring a substantial water supply and prolonged submersion during its growth period. The use of rice calendar data can significantly reduce computing time, as it allows the time series data for an entire year to be narrowed down to the specific period of paddy rice growth.
By applying a moving window, quantitative data can be extracted from the time series, and the frequency of pixels detected as flooded during this period can be statistically analyzed. The impact of the selected 67% threshold was evaluated in terms of its ability to balance sensitivity to transient flood events and robustness in identifying paddy rice–related inundation. Short-lived disaster-induced flooding typically persists for only a limited portion of a monthly time window, whereas paddy rice fields maintain surface inundation over a much longer duration. Consequently, lower thresholds may increase false positives from episodic water presence, while higher thresholds may exclude genuine paddy rice fields due to intermittent non-water observations caused by cloud contamination, mixed-pixel effects, or variations in observation geometry. The chosen threshold, therefore, represents a pragmatic balance that emphasizes temporal persistence of surface water while maintaining robustness under realistic observation conditions. The assumption linking persistent post-seeding surface water to paddy rice cultivation may not hold universally. Under certain conditions, such as heavy rainfall, poor drainage, or temporary flooding, non-rice croplands may also exhibit short-term surface water or wet soil conditions that can be misclassified as water. However, such cases are typically short-lived and rarely maintain high water occurrence frequencies over extended temporal windows. Based on this frequency-based screening, matching these results with land cover data enables the identification of pixels that experience continuous flooding within cropland areas over a specific period. However, this method may be affected during the rainy season or when disaster-induced floods occur, as paddy fields might not actually be cultivated with rice but instead be submerged due to excessive rainfall or flooding. To improve accuracy, trend analysis can be used to determine whether the water fraction of flooded pixels in the time series follows a decreasing trend, which helps to distinguish actual rice cultivation from seasonal or disaster-induced flooding. Comparing trend detection using regression analysis and the Mann–Kendall test, both methods can identify trends in time series data. However, regression analysis is more sensitive to outliers because it uses the least squares method for fitting, meaning extreme values can significantly affect the regression slope. In contrast, the Mann–Kendall test is robust to outliers since it is based on rank calculations rather than actual numerical values. Additionally, regression analysis is primarily suited for detecting linear trends, whereas the Mann–Kendall test can identify monotonic trends, whether linear or nonlinear. Theoretically, for flood data, the Mann–Kendall test is more advantageous. However, based on the paddy rice extraction results from California and Arkansas, when regression analysis is performed without considering the R-squared value, the results from both methods are quite similar, suggesting that both approaches are feasible.
In this study, the results of the three paddy rice extraction methods showed good agreement with the confusion matrix analysis results from the USDA (for California paddy rice) and VIIRS non-disaster flood areas (for Arkansas paddy rice). Therefore, the paddy rice extraction mechanism can be designed similarly to the GFM (Global Flood Mapping System) flood detection engine, for an approach that combines the results of the three paddy rice extraction methods. A pixel is classified as paddy rice only if it is detected as paddy rice by all three methods. This approach may help reduce false positives, thereby improving the precision of paddy rice extraction.
5. Conclusions
This study develops a new methodology and compares it with regression analysis and the Mann–Kendall analysis to identify and extract paddy rice fields from the operational VIIRS flood products. It can be summarized as follows:
This research utilized VIIRS five-day composite flood products to identify non-hazardous floodwaters associated with paddy rice fields. Long-time flood frequency was calculated from the 2-year VIIRS flood products. Methodologies that combine long-time flood frequency analysis, paddy rice phenological algorithms, and change detection analysis are developed. The results were compared with the rice data from the USDA CDL and showed good agreement. Through confusion matrix analysis with the USDA rice data, the results of the three methods for paddy rice identification are very similar. Their accuracies are all above 93%, their precisions are larger than 73%, their recalls are about 89%, and their F1-scores exceed 80%. The use of all three methods concurrently to identify paddy rice extraction may be a good solution. For paddy rice extraction, the rice calendar can be used to divide the time series into the paddy rice canopy development period and other times of the year. If a flooding event occurs during the canopy growing period, or if flooding is detected outside the rice planting period, it is likely a real hazardous flood, which may damage rice fields and affect crop yields.
Author Contributions
Conceptualization, T.Y. and D.S.; methodology, T.Y.; software, T.Y.; validation, T.Y. and D.S.; formal analysis, T.Y. and D.S.; investigation, T.Y. and D.S.; resources, S.K. and A.L.; data curation, T.Y.; writing—original draft preparation, D.S.; writing—review and editing, D.S., T.Y., S.K. and A.L.; visualization, T.Y. and D.S.; supervision, S.K.; project administration, S.K. and A.L.; funding acquisition, S.K. and A.L. All authors have read and agreed to the published version of the manuscript.
Funding
This research was funded by the NOAA LEO Program Office through the NSF I/UCRC for Spatiotemporal Thinking, Computing, and Applications.
Data Availability Statement
The data reported in the study are presented, archived, or available from the NOAA Satellite Proving Ground Global Products Archive System at George Mason University.
Acknowledgments
This work is supported by the NOAA LEO Program Offices. The contents are solely the opinions of the authors and do not constitute a statement of policy, decision, or position on behalf of NOAA or the U.S. Government. We thank the editor and the reviewers for their constructive and helpful comments, which have helped us improve this study.
Conflicts of Interest
The authors declare no conflicts of interest.
References
- Sun, D.; Yu, Y.; Goldberg, M.D. Deriving water fraction and flood maps from MODIS images using a decision tree approach. IEEE J. Sel. Top. Appl. Earth Obs. Remote Sens. 2011, 4, 814–825. [Google Scholar] [CrossRef] [Scilit]
- Sun, D.; Yu, Y.; Zhang, R.; Li, S.; Goldberg, M.D. Towards operational automatic flood detection using EOS/MODIS data. Photogramm. Eng. Remote Sens. 2012, 78, 637–646. [Google Scholar] [CrossRef] [Scilit]
- Li, S.; Sun, D.L.; Yu, Y.; Csiszar, Y.; Stefanidis, A.; Goldberg, M.D. A New Short-wave Infrared (SWIR) Method for Quantitative Water Fraction Derivation and Evaluation with EOS/MODIS and Landsat/TM data. IEEE Trans. Geosci. Remote Sens. 2013, 51, 1852–1862. [Google Scholar] [CrossRef] [Scilit]
- Li, S.; Sun, D.; Goldberg, M.D.; Sjoberg, B.; Santek, D.; Hoffman, J.P.; DeWeese, M.; Restrepo, P.; Lindsey, S.; Holloway, E. Automatic near real-time flood detection using Suomi-NPP/VIIRS data. Remote Sens. Environ. 2018, 204, 672–689. [Google Scholar] [CrossRef] [Scilit]
- Li, S.; Sun, D.; Goldberg, M.D.; Sjoberg, B.; Satya, K.; Lindsey, D.; Hoffman, J.P.; DeWeese, M.; Connelly, B.; Mckee, P.; et al. A downscaling model for derivation of 3-D flood products from VIIRS imagery and SRTM/DEM. ISPRS J. Photogramm. Remote Sens. 2022, 192, 279–298. [Google Scholar] [CrossRef] [Scilit]
- Childs, N. Rice Situation and Outlook Yearbook. United States Department of Agriculture. 2005. Available online: https://esmis.nal.usda.gov/sites/default/release-files/7s75dc36z/8049g5966/3t945r59b/RCS-yearbook-11-28-2005.pdf (accessed on 8 February 2026).
- Arouna, A.; Dzomeku, I.K.; Shaibu, A.-G.; Nurudeen, A.R. Water Management for Sustainable Irrigation in Rice (Oryza sativa L.) Production: A Review. Agronomy 2023, 13, 1522. [Google Scholar] [CrossRef] [Scilit]
- Zhao, R.; Li, Y.; Ma, M. Mapping Paddy Rice with Satellite Remote Sensing: A Review. Sustainability 2021, 13, 503. [Google Scholar] [CrossRef] [Scilit]
- Huang, C.; You, S.; Liu, A.; Li, P.; Zhang, J.; Deng, J. High-Resolution National-Scale Mapping of Paddy Rice Based on Sentinel-1/2 Data. Remote Sens. 2023, 15, 4055. [Google Scholar] [CrossRef] [Scilit]
- Abdali, E.; Valadan Zoej, M.J.; Taheri Dehkordi, A.; Ghaderpour, E. A parallel-cascaded ensemble of machine learning models for crop type classification in Google Earth Engine using multi-temporal sentinel-1/2 and landsat-8/9 remote sensing data. Remote Sens. 2024, 16, 127. [Google Scholar] [CrossRef] [Scilit]
- Fang, H.; Liang, S.; Chen, Y.; Ma, H.; Li, W.; He, T.; Tian, F.; Zhang, F. A comprehensive review of rice mapping from satellite data: Algorithms, product characteristics and consistency assessment. Sci. Remote Sens. 2024, 10, 100172. [Google Scholar] [CrossRef] [Scilit]
- Okamoto, K.; Kawashima, H. Estimating the total area of paddy fields in Heilongjiang, China, around 2000 using Landsat Thematic Mapper/Enhanced Thematic Mapper Plus data. Remote Sens. Lett. 2016, 7, 533–540. [Google Scholar] [CrossRef] [Scilit]
- Yin, Q.; Liu, M.; Cheng, J.; Ke, Y.; Chen, X. Mapping Paddy Rice Planting Area in Northeastern China Using Spatiotemporal Data Fusion and Phenology-Based Method. Remote Sens. 2019, 11, 1699. [Google Scholar] [CrossRef] [Scilit]
- Gumma, M.K.; Nelson, A.; Thenkabail, P.S.; Singh, A.N. Mapping rice areas of South Asia using MODIS multitemporal data. J. Appl. Remote Sens. 2011, 5, 053547. [Google Scholar] [CrossRef] [Scilit]
- Manjunath, K.R.; More, R.S.; Jain, N.K.; Panigrahy, S.; Parihar, J.S. Mapping of rice-cropping pattern and cultural type using remote-sensing and ancillary data: A case study for South and Southeast Asian countries. Int. J. Remote Sens. 2015, 36, 6008–6030. [Google Scholar] [CrossRef] [Scilit]
- Gumma, M.K.; Mohanty, S.; Nelson, A.; Arnel, R.; Mohammed, I.A.; Das, S.R. Remote sensing based change analysis of rice environments in Odisha, India. J. Environ. Manag. 2015, 148, 31–41. [Google Scholar] [CrossRef] [Scilit]
- Clauss, K.; Yan, H.; Kuenzer, C. Mapping Paddy Rice in China in 2002, 2005, 2010 and 2014 with MODIS Time Series. Remote Sens. 2016, 8, 434. [Google Scholar] [CrossRef] [Scilit]
- Zhang, M.; Lin, H. Object-based rice mapping using time-series and phenological data. Adv. Space Res. 2019, 63, 190–202. [Google Scholar] [CrossRef] [Scilit]
- Zhao, S.; Liu, X.; Ding, C.; Liu, S.; Wu, C.; Wu, L. Mapping Rice Paddies in Complex Landscapes with Convolutional Neural Networks and Phenological Metrics. GIScience Remote Sens. 2020, 57, 37–48. [Google Scholar] [CrossRef] [Scilit]
- Guan, X.; Huang, C.; Liu, G.; Meng, X.; Liu, Q. Mapping Rice Cropping Systems in Vietnam Using an NDVI-Based Time-Series Similarity Measurement Based on DTW Distance. Remote Sens. 2016, 8, 19. [Google Scholar] [CrossRef] [Scilit]
- Chen, C.-F.; Huang, S.-W.; Son, N.-T.; Chang, L.-Y. Mapping double-cropped irrigated rice fields in Taiwan using time-series Satellite Pour I’Observation de la Terre data. J. Appl. Remote Sens. 2011, 5, 053528. [Google Scholar] [CrossRef] [Scilit]
- Nuarsa, I.W.; Nishio, F.; Hongo, C.; Mahardika, I.G. Using variance analysis of multitemporal MODIS images for rice field mapping in Bali Province, Indonesia. Int. J. Remote Sens. 2012, 33, 5402–5417. [Google Scholar] [CrossRef] [Scilit]
- Wang, J.; Huang, J.; Zhang, K.; Li, X.; She, B.; Wei, C.; Gao, J.; Song, X. Rice Fields Mapping in Fragmented Area Using Multi-Temporal HJ-1A/B CCD Images. Remote Sens. 2015, 7, 3467–3488. [Google Scholar]
- Liu, W.; Dong, J.; Xiang, K.; Wang, S.; Han, W.; Yuan, W. A sub-pixel method for estimating planting fraction of paddy rice in Northeast China. Remote Sens. Environ. 2018, 205, 305–314. [Google Scholar] [CrossRef] [Scilit]
- Xiao, X.; Boles, S.; Liu, J.; Zhuang, D.; Frolking, S.; Li, C.; Salas, W.; Moore, B. Mapping paddy rice agriculture in southern China using multi-temporal MODIS images. Remote Sens. Environ. 2005, 95, 480–492. [Google Scholar] [CrossRef] [Scilit]
- Xiao, X.; Boles, S.; Frolking, S.; Li, C.; Babu, J.Y.; Salas, W.; Moore, B. Mapping paddy rice agriculture in South and Southeast Asia using multi-temporal MODIS images. Remote Sens. Environ. 2006, 100, 95–113. [Google Scholar] [CrossRef] [Scilit]
- Qin, Y.; Xiao, X.; Dong, J.; Zhou, Y.; Zhu, Z.; Zhang, G.; Du, G.; Jin, C.; Kou, W.; Wang, J.; et al. Mapping paddy rice planting area in cold temperate climate region through analysis of time series Landsat 8 (OLI), Landsat 7 (ETM+) and MODIS imagery. ISPRS J. Photogram. Remote Sens. 2015, 105, 220–233. [Google Scholar] [CrossRef] [Scilit] [PubMed]
- Son, N.-T.; Chen, C.-F.; Chen, C.-R.; Guo, H.-Y. Classification of multitemporal Sentinel-2 data for field-level monitoring of rice cropping practices in Taiwan. Adv. Space Res. 2020, 65, 1910–1921. [Google Scholar] [CrossRef] [Scilit]
- Su, T. Efficient paddy field mapping using Landsat-8 imagery and object-based image analysis based on advanced fractal net evolution approach. GIScience Remote Sens. 2017, 54, 354–380. [Google Scholar] [CrossRef] [Scilit]
- Singha, M.; Wu, B.; Zhang, M. An Object-Based Paddy Rice Classification Using Multi-Spectral Data and Crop Phenology in Assam, Northeast India. Remote Sens. 2016, 8, 479. [Google Scholar] [CrossRef] [Scilit]
- Bouvet, A.; Le Toan, T. Use of ENVISAT/ASAR wide-swath data for timely rice fields mapping in the Mekong River Delta. Remote Sens. Environ. 2011, 115, 1090–1101. [Google Scholar] [CrossRef] [Scilit]
- Misra, A.; White, K.; Nsutezo, S.F.; Straka, W., III; Lavista, J. Mapping global floods with 10 years of satellite radar data. Nat. Commun. 2025, 16, 5762. [Google Scholar] [CrossRef] [Scilit] [PubMed]
- Sianturi, R.; Jetten, V.G.; Ettema, J.; Sartohadi, J. Distinguishing between hazardous flooding and non-hazardous agronomic inundation in irrigated rice fields: A case study from West Java. Remote Sens. 2018, 10, 1003. [Google Scholar] [CrossRef] [Scilit]
- Belward, A.; Loveland, T. The DIS 1 km land cover data set. Glob. Change News Lett. 1996, 27, 7–9. [Google Scholar]
- Laborte, A.G.; Gutierrez, M.A.; Balanza, J.G.; Saito, K.; Zwart, S.J.; Boschetti, M.; Murty, M.V.R.; Villano, L.; Aunario, J.K.; Reinke, R.; et al. RiceAtlas, a spatial database of global rice calendars and production. Sci. Data 2017, 4, 170074. [Google Scholar] [CrossRef] [Scilit]
- Boryan, C.; Yang, Z.; Mueller, R.; Craig, M. Monitoring US agriculture: The US Department of Agriculture, National Agricultural Statistics Service, Cropland Data Layer Program. Geocarto Int. 2011, 26, 341–358. [Google Scholar] [CrossRef] [Scilit]
- Sun, D.; Li, S.; Yang, T.; Kalluri, S.; Zhou, L.; Helfrich, S.; Miralles-Wilhelm, F. JPSS Satellites Observed Historic Asia Floods and the Potentially Affected Population During the Summer Monsoon Rainy Season. In Proceedings of the IEEE International Geoscience and Remote Sensing Symposium Proceedings, Athens, Greece, 7–12 July 2024; pp. 1490–1493. [Google Scholar]
- National Weather Service (NWS) About Flood and Flash Flood Definitions. Available online: https://www.weather.gov/mrx/flood_and_flash#:~:text=Definitions%20of%20Flood%20and%20Flash%20Flood&text=Ponding%20of%20water%20at%20or,generally%20less%20than%206%20hours (accessed on 8 February 2026).
- Nalley, L.; Linquist, B.; Kovacs, K.; Anders, M. The Economic Viability of Alternative Wetting and Drying Irrigation in Arkansas Rice Production. Agron. J. 2015, 107, 579–587. [Google Scholar] [CrossRef] [Scilit]

Disclaimer/Publisher’s Note: The statements, opinions and data contained in all publications are solely those of the individual author(s) and contributor(s) and not of MDPI and/or the editor(s). MDPI and/or the editor(s) disclaim responsibility for any injury to people or property resulting from any ideas, methods, instructions or products referred to in the content. |
© 2026 by the authors. Licensee MDPI, Basel, Switzerland. This article is an open access article distributed under the terms and conditions of the Creative Commons Attribution (CC BY) license.