


Highlights
What are the main findings?
- Incorporating LPJ-simulated fuel-related variables improved model performance by approximately 2–4% across five models under spatial cross-validation, with CatBoost showing favorable overall performance.
- The importance of fuel- and moisture-related predictors varied across forest regions and types, and future fire-occurrence predictions showed increases in the SWF and SEF and an overall decline in the NEF.
What are the implications of the main findings?
- Coupling dynamic vegetation process models with data-driven machine learning provides a practical approach for incorporating dynamic fuel availability into fire prediction.
- Regional differences in future fire-occurrence predictions highlight the importance of targeted monitoring of fuel and moisture conditions for forest fire management.
Abstract
Rising fire frequency and intensity under global warming challenge ecological security, yet dynamic fuel-related variables remain insufficiently represented in forest fire prediction models. This study integrated LPJ-simulated fuel variables with five machine learning algorithms to assess their contribution to fire prediction across China. SHAP and partial dependence analyses examined predictor importance and responses in northeastern (NEF), southeastern (SEF), and southwestern (SWF) forests. Future fire occurrence (2041–2100) was projected with bias-corrected CMIP6 data under three SSP scenarios. The main findings were as follows: (1) Fuel inclusion improved model performance by approximately 2–4% under spatial cross-validation, with CatBoost showing favorable overall performance. (2) Predictor importance differed across regions and forest types. Aboveground litter carbon storage (LitterC) and vapor pressure deficit (VPD) were the leading predictors in northeastern coniferous forests; elevation (DEM) and soil moisture (SM) were important in the SWF; and SM ranked first in both SEF types. Partial dependence analyses revealed nonlinear responses, with prominent fuel-related patterns in the NEF and soil moisture-related patterns in the SWF and SEF. (3) Future predictions increased overall in the SWF and SEF, with larger absolute increases in the SEF. Increased predictions covered 66–69% of SWF forests and 74.80–94.01% of SEF forests. Although the NEF showed an overall decline in regional mean predictions, localized increases remained evident. These findings support integrating dynamic fuel information into fire prediction and identifying priority areas for future monitoring and management.
1. Introduction
Forest fires have drawn widespread attention due to their impacts on ecosystems and human society [1]. This concern stems not only from the complex role of fire in the Earth system, but also from the prolonged fire seasons and the nonlinear increase in the frequency of extreme fires [2,3]. The direct ecological and economic losses caused by forest fires, together with their intense carbon emissions, regional air quality deterioration, and damage to ecological barriers, have far-reaching consequences [4]. Against this backdrop, China faces considerable challenges. As one of the most fire-prone countries in East Asia, China’s forest areas in the Northeast (NEF), Southwest (SWF), and Southeast (SEF) are characterized by complex terrain and diverse climatic and vegetation conditions, resulting in distinct spatial patterns of fire occurrence [5,6]. Therefore, under climate change, accurately predicting fire occurrence and projecting its future spatial changes in China have become important scientific objectives.
The rapid development of machine learning algorithms has advanced forest fire prediction. Compared with traditional statistical models, algorithms such as Categorical Boosting (CatBoost), Random Forest (RF), and Back Propagation Neural Network (BPNN) have demonstrated strong capabilities in capturing nonlinear relationships between fire occurrence and complex environmental factors, improving the predictive performance of regional fire susceptibility models [7,8,9]. Machine learning algorithms have become important tools in fire prediction. However, existing machine learning-based fire prediction studies still have limitations. Many studies have primarily considered environmental predictors such as meteorological conditions, soil moisture, and topography [10,11], while the temporal dynamics of forest fuels have received comparatively less attention. Although some researchers have begun to recognize the role of fuel and have conducted preliminary studies [12,13,14], the data they rely on have certain limitations. For example, field surveys provide detailed fuel measurements but often have limited spatial coverage and temporal continuity. Satellite-derived vegetation products offer broader coverage but do not directly provide future fuel conditions under different climate scenarios.
To address the limitations of existing fuel data, process-based Dynamic Global Vegetation Models (DGVMs) provide a useful approach for simulating vegetation and carbon dynamics under changing environmental conditions [15]. As one of the widely used DGVMs, the Lund–Potsdam–Jena (LPJ) Dynamic Global Vegetation Model simulates vegetation dynamics, carbon allocation, litter production, and decomposition in response to climate, atmospheric CO2 concentration, and soil properties [16,17]. Vegetation carbon storage (VegC) and aboveground litter carbon storage (LitterC) simulated by LPJ can provide information related to vegetation biomass and litter accumulation. Incorporating them into machine learning models may therefore improve the representation of dynamic fuel-related conditions in fire occurrence prediction.
In light of this, the present study integrates LPJ-simulated fuel-related variables with machine learning algorithms to assess their contribution to forest fire prediction across China. Specifically, this study aims to: (1) quantify the predictive gain from incorporating dynamic fuel variables by benchmarking five machine learning models against a fuel-free baseline; (2) examine regional and forest-type differences in predictor importance and nonlinear model responses involving fuel availability and moisture conditions using SHAP and partial dependence plots; and (3) project future forest fire occurrence during 2041–2100 under three Shared Socioeconomic Pathway (SSP) scenarios and identify regional differences in projected changes. The findings are expected to improve our understanding of the predictive roles of dynamic fuel-related variables and environmental conditions and provide useful information for future forest fire monitoring and management.
2. Materials and Methods
2.1. Study Area
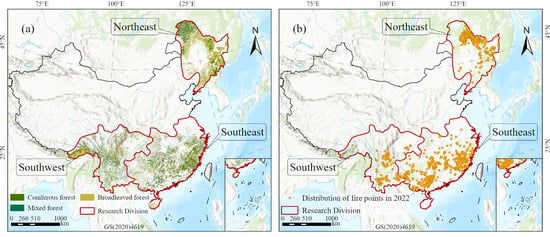
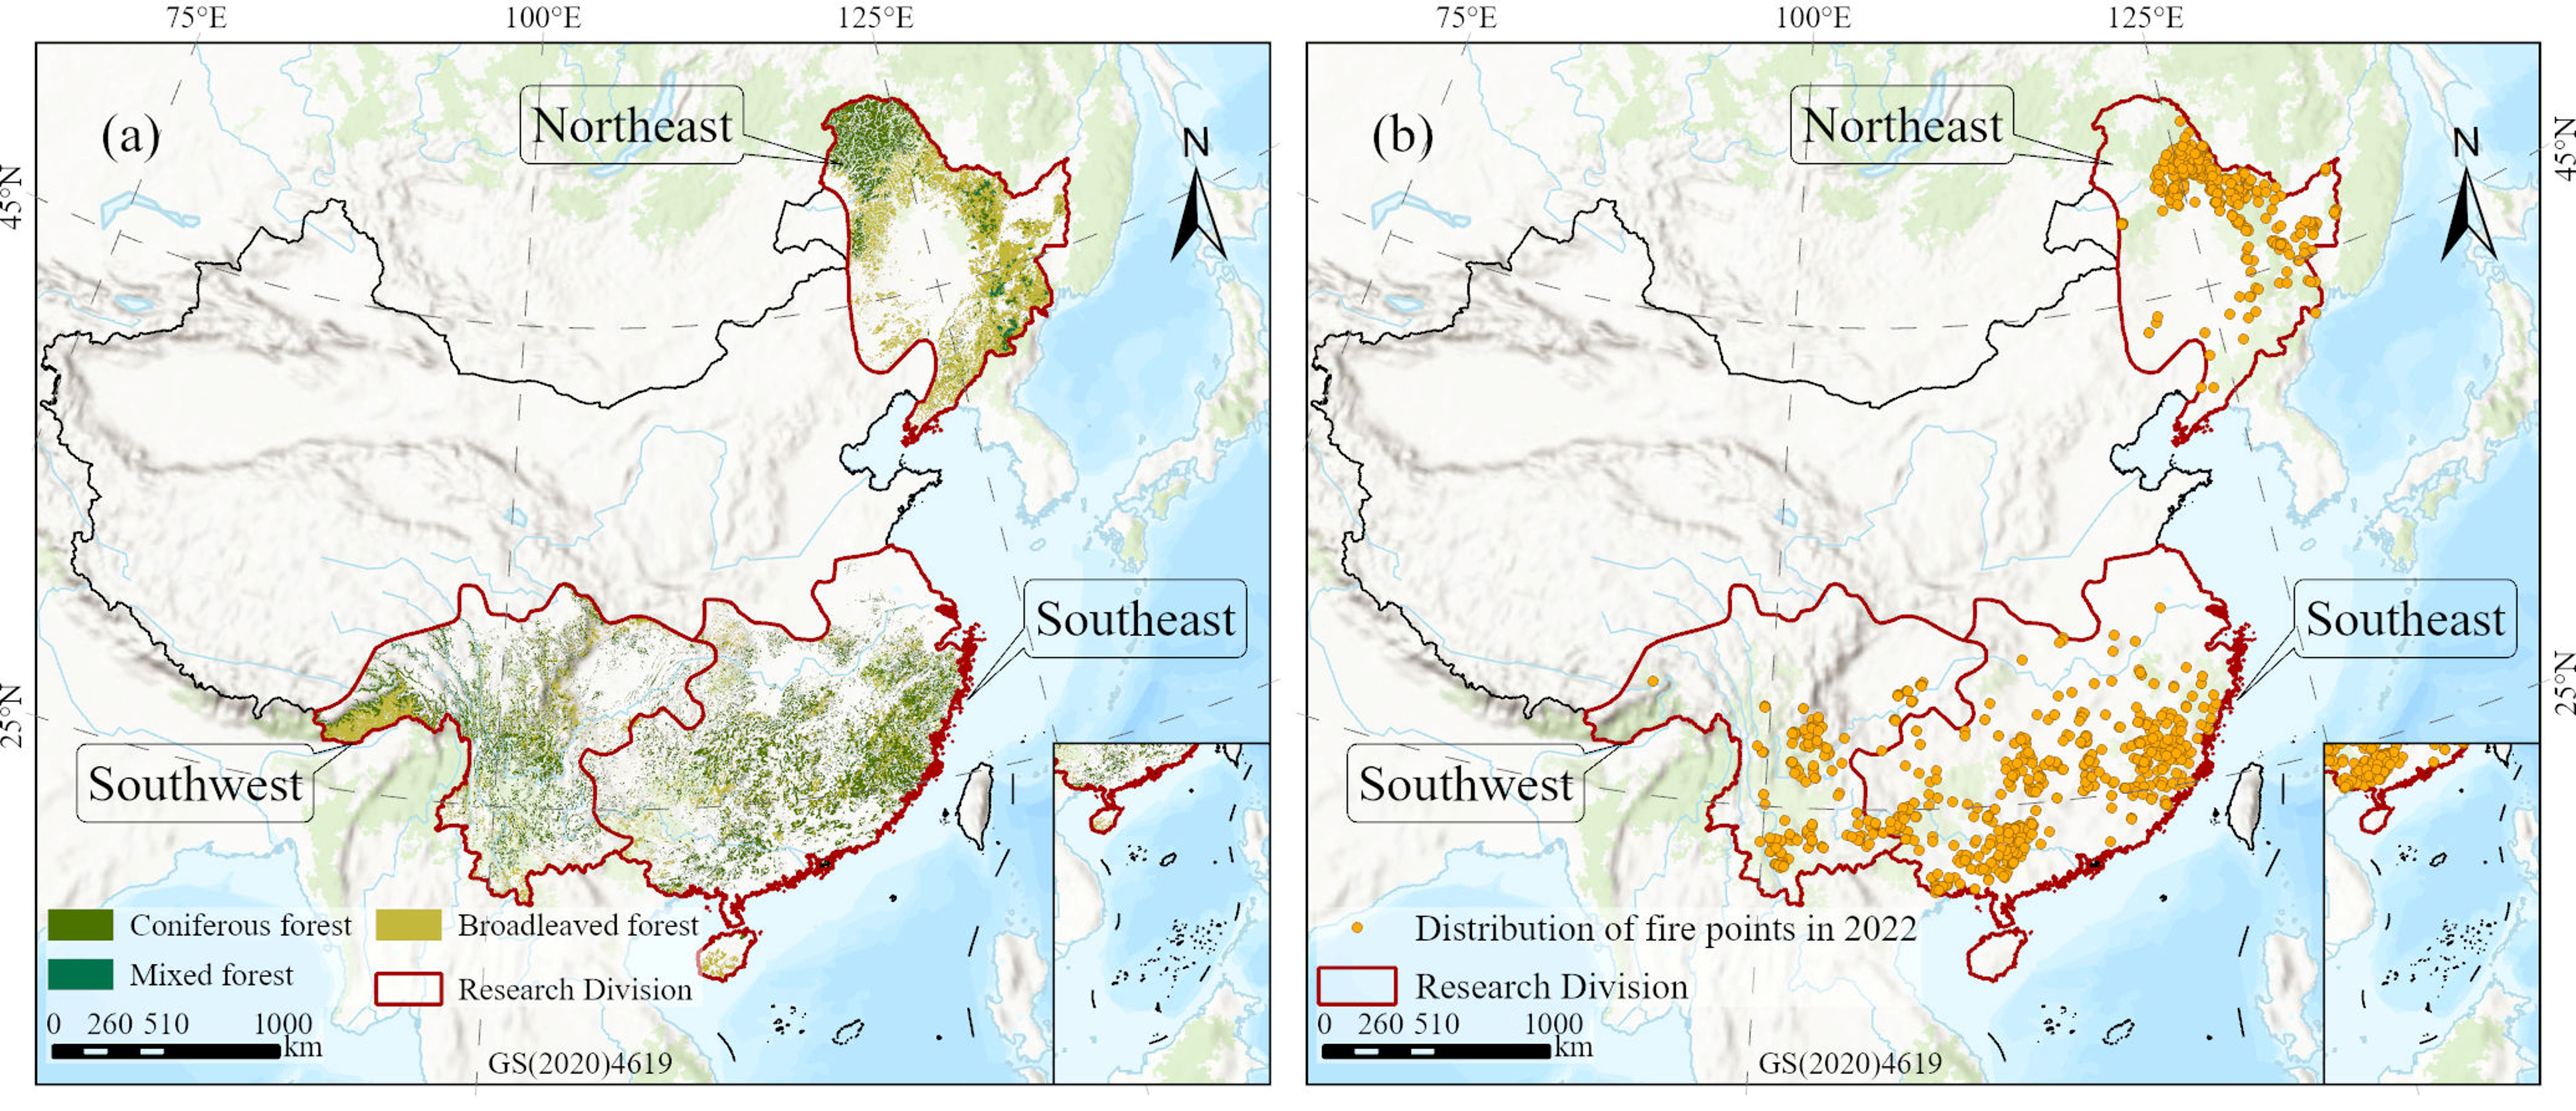
China features diverse topography and is jointly influenced by the East Asian monsoon and complex atmospheric circulation systems [18]. Forest fires in China are predominantly concentrated in the northeastern forest (NEF), the southeastern forest (SEF), and the southwestern forest (SWF), all of which are generally characterized by complex terrain, pronounced seasonal aridity, and dense vegetation cover (Figure 1a). These conditions collectively constitute high-risk environments for fire occurrence and thus delineate the focal study areas of this research (Figure 1b).
Figure 1.
Study area. (a) Geographic divisions and spatial distribution of the major forest areas in China (Northeast, Southeast, and Southwest); (b) spatial distribution of forest fires in 2022. The approval number of the China base map is GS(2020)4619.
2.2. Data Sources
The dependent variable is forest fire data, derived from the MODIS C6 Active Fire dataset [19] provided by the Fire Information for Resource Management System (FIRMS) of the National Aeronautics and Space Administration (NASA). This dataset is based on thermal anomaly information acquired by the Terra and Aqua satellites, employing the MOD14/MYD14 fire detection algorithm to identify active fire pixels globally. The data are provided in vector point format and contain attributes such as fire point location, detection time, fire radiative power (FRP), and confidence level [20], recording various fire events. In this study, we extracted fire point data within mainland China for the period 2001–2022 and retained only high-confidence fire points with confidence levels exceeding 80% as valid research samples, following existing studies [21].
For independent variables, a total of 18 variables were incorporated in this study and categorized into five groups according to relevant literature [11,22,23,24]. These include meteorological variables (temperature [25], precipitation [26], relative humidity [27], and wind speed [28]), drought-related variables (vapor pressure deficit [29,30] and soil moisture [31,32]), fuel variables (vegetation carbon storage, aboveground litter carbon storage and leaf area index), topographic variables [7,24,31] (elevation, slope and aspect), and ignition-source variables [22,33,34] (population density, GDP, and distances to the nearest road, railway, river, and residential area). Detailed information on the predictor variables used in this study is presented in Table 1.
In addition to the predictor variables, auxiliary datasets were collected for LPJ simulations, model validation, and vegetation classification. The aboveground biomass (AGB) data were obtained from the China Forest Aboveground Biomass Time Series Dataset (CFATD), with an annual temporal resolution and a spatial resolution of 30 m [35]. Leaf area index (LAI) data were derived from the NASA MODIS/Terra MOD15A2H Version 6.1 (V061) product, with a spatial resolution of approximately 500 m and an original temporal resolution of 8 days [36]. The 8-day LAI observations were aggregated into monthly values by calculating the mean of valid observations within each calendar month. Vegetation type (VT) data were obtained from the 1:1,000,000 Vegetation Dataset of China, provided by the National Cryosphere Desert Data Center. Monthly wet-day frequency and cloud cover data were obtained from the Climatic Research Unit time-series dataset (CRU TS v4.09), with a spatial resolution of 0.5° × 0.5° [37]. Soil texture data were obtained from the Harmonized World Soil Database (HWSD v1.2), with an original spatial resolution of 30 arc-seconds (approximately 1 km). Historical atmospheric CO2 concentration data during 2001–2022 were obtained from the Scripps Institution of Oceanography (SIO) CO2 Program, while future CO2 concentration data from 2041 to 2100 were obtained from the National Ecosystem Science Data Center, with a monthly temporal resolution and a spatial resolution of 1° × 1° [38].
We selected five global climate models (BCC-CSM2-MR, GFDL-ESM4, IPSL-CM6A-LR, MRI-ESM2-0, and UKESM1-0-LL) under SSP1-2.6, SSP2-4.5, and SSP5-8.5 for the period 2041–2100. Future temperature, precipitation, and soil moisture data were obtained from the corresponding CMIP6 projections. All five climate model datasets were downscaled and bias-corrected using the scheme previously developed by our research group [39,40], which effectively reduced the systematic biases of the raw model outputs, with the multi-model ensemble mean (MME) performing best. It should be noted that, in the future fire simulations, only temperature, precipitation, soil moisture, vegetation carbon storage, aboveground litter carbon storage, and leaf area index were allowed to vary, while all other factors were fixed at their historical average levels.
Table 1.
Description and sources of wildfire occurrence and the 18 predictor variables.
2.3. Methods
2.3.1. LPJ Model
To characterize the spatiotemporal dynamics of forest fuels from a process-based perspective, this study incorporates the LPJ (Lund–Potsdam–Jena) Dynamic Global Vegetation Model, which is grounded in ecophysiological processes [15]. The LPJ model couples large-scale vegetation dynamics with land–atmosphere carbon cycling, enabling the continuous simulation of forest ecosystem responses to long-term climatic stresses. The model includes eight woody and two herbaceous plant functional types (PFTs), each with distinct phenological and physiological characteristics (Table 2). The historical input data for the LPJ model include climate variables (precipitation, temperature, wet-day frequency, and cloud cover), soil texture, and atmospheric CO2 concentration. In the future simulations, temperature and precipitation were obtained from the corresponding CMIP6 climate projections, while atmospheric CO2 concentrations varied according to the respective SSP-specific trajectories.
Table 2.
Plant functional types in the LPJ model.
Based on the above configuration, the LPJ model simulated VegC, LitterC, and LAI for the historical period (2001–2022) and the future period (2041–2100). VegC and LitterC were represented at an annual temporal resolution, whereas LAI was simulated at a monthly temporal resolution. VegC and LitterC were used as fuel-related proxies rather than direct measurements of immediately available combustible fuel loads.
To validate the LPJ simulations, we compared the spatiotemporal trends of remotely sensed AGB and LAI with LPJ-simulated VegC and LAI, respectively, during 2001–2022, following previous studies [43,44]. Assuming a biomass carbon fraction of 0.5, as recommended in the IPCC guidelines, the observed AGB values, originally expressed in Mg/ha, were converted to kgC/m2 using a conversion factor of 0.05 (i.e., a factor of 0.1 for converting Mg/ha to kg/m2, multiplied by a carbon fraction of 0.5). Because observed AGB represents aboveground biomass whereas LPJ-simulated VegC represents vegetation carbon storage, their comparison was primarily used to evaluate the consistency of vegetation carbon dynamics rather than to directly validate the same carbon pool.
2.3.2. Sample Construction and Data Preprocessing
To construct the binary classification dataset, a presence–pseudo-absence sampling strategy was adopted [45,46]. Following Sloan et al. [47], MODIS active-fire detections were grouped into candidate fire events based on adjacency among 1-km grid cells and a maximum four-day gap between linked detections. The earliest detection from each event was retained, yielding 45,246 fire-presence candidates. Background points were randomly generated within forested areas outside 1-km buffers around recorded fire locations, and their sampling dates were assigned according to the temporal distribution of fire-presence samples. After excluding samples with missing predictor values, pseudo-absence samples were randomly selected to match fire-presence samples by year and month at a 1:1 ratio. The final dataset comprised 43,602 fire-presence samples (labeled 1) and 43,602 pseudo-absence samples (labeled 0).
To ensure spatial consistency, the historical datasets were transformed into the WGS 1984 geographic coordinate system. Environmental predictor values were extracted at the geographic coordinates of individual fire-presence and pseudo-absence samples and matched to their corresponding sampling dates. Monthly meteorological variables, vapor pressure deficit (VPD), soil moisture (SM), and LPJ-simulated LAI were matched to the sampling year and month, whereas annual LPJ-simulated VegC and LitterC values were assigned to all 12 months of the corresponding year. The extracted environmental variables and corresponding fire-occurrence labels were assembled into a tabular dataset for subsequent machine-learning analysis.
For future fire-occurrence projections, all environmental predictor datasets were resampled to a common spatial resolution of 0.1° × 0.1°. Nearest-neighbor resampling was applied to the categorical aspect variable, whereas bilinear interpolation was used for the remaining variables. Slope was transformed using the sine of the slope angle, relative humidity was divided by 100, and aspect was classified into eight directional categories. The remaining numerical predictors were normalized using Min–Max scaling, while the categorical aspect variable was one-hot encoded. All datasets were aligned to the same target grid to ensure spatial correspondence among predictor variables.
To avoid information leakage, data-dependent preprocessing procedures were incorporated into the spatial cross-validation framework [48]. During each cross-validation iteration, the Min–Max scaling parameters and categorical encoding transformations were fitted using only the corresponding training fold and subsequently applied to the held-out validation fold. After model selection and hyperparameter optimization, these transformations were refitted using all training samples from 2001–2018 and saved for independent testing, temporal validation, and future projections. The detailed model training and validation procedures are described in Section 2.3.3.
2.3.3. Machine Learning Algorithms and Model Evaluation
Given the complex nonlinear relationships between fire occurrence and multiple environmental variables [7,49], five machine-learning algorithms were selected: eXtreme Gradient Boosting (XGBoost) [50], Categorical Boosting (CatBoost) [51], Light Gradient Boosting Machine (LightGBM) [52], Random Forest (RF) [53], and Back Propagation Neural Network (BPNN) [54]. To evaluate the contribution of forest fuel variables to predictive performance, two modeling configurations were established: one without fuel variables (WF) and the other incorporating LPJ-simulated VegC, LitterC, and LAI (F). The WF and F configurations included 15 and 18 predictor variables, respectively. Following previous studies [6,55], the models were trained as binary classifiers and produced continuous predicted fire-occurrence probabilities ranging from 0 to 1. These predictions were used to calculate ROC-AUC across different classification thresholds and were retained as continuous values for subsequent partial dependence analyses and future fire-occurrence projections.
To assess the predictive performance of the machine-learning algorithms, we partitioned the dataset into training, testing, and validation subsets. Samples from 2001–2018 were used for model training, while those from 2019–2020 and 2021–2022 were reserved for independent testing and temporal validation, respectively. To reduce the influence of spatial autocorrelation, five-fold spatial cross-validation was performed within the training period using approximately 100-km spatial blocks constructed in the EPSG:6933 equal-area coordinate system [48]. Samples within the same spatial block were assigned to the same fold using GroupKFold. Model optimization was performed using hyperparameter search combined with spatial cross-validation.
Model performance was evaluated using the area under the receiver operating characteristic curve (ROC-AUC), the area under the precision–recall curve (PR-AUC), accuracy, precision, recall, F1-score, and Brier score. ROC-AUC and PR-AUC were used to evaluate model discrimination, while Brier scores and calibration curves were used to assess the calibration of predicted scores. To quantify the contribution of fuel variables, performance differences between the F and WF configurations were calculated for each algorithm across the five spatial cross-validation folds. The mean and standard deviation of the evaluation metrics were reported. Paired DeLong tests were used to assess differences in ROC-AUC between the F and WF configurations on the independent temporal datasets. The resulting p-values were adjusted for multiple comparisons using the Benjamini–Hochberg procedure across five models and two temporal datasets. All analyses were performed using Python 3.11.13, with scikit-learn 1.7.1, CatBoost 1.2.8, XGBoost 3.0.2, LightGBM 4.4.0, NumPy 2.0.0, and pandas 2.3.1.
2.3.4. Shapley Additive Explanations
Shapley Additive Explanations (SHAP) is a model interpretation method grounded in cooperative game theory [56]. By computing the marginal contribution of each feature across all possible coalitions, SHAP quantifies feature impacts on predictions in terms of Shapley values. This method satisfies the properties of local accuracy, missingness, and consistency, enabling both global and local interpretations while distinguishing the positive or negative direction of each feature’s contribution. The relative importance of each predictor was calculated by normalizing its mean absolute SHAP value by the sum of mean absolute SHAP values across all predictors and expressing the result as a percentage.
Partial Dependence Plots (PDPs) are a visualization tool for interpreting the predictive behavior of machine learning models, capable of revealing linear and nonlinear relationships between features and model predictions [57,58]. By averaging model predictions over the distribution of other features, PDPs display the average model response as one or two target features vary. Univariate PDPs illustrate changes in model predictions with individual features, while bivariate PDPs characterize their joint response patterns.
In this study, we combined SHAP and PDP analyses to enhance model interpretability. PDPs were generated using the partial_dependence method from the scikit-learn library based on the independent 2019–2020 test set. To assess the variability of one-dimensional PDP estimates, 300 bootstrap resamples were drawn with replacement within each forest region and type using the fitted CatBoost model. Then, 95% bootstrap intervals were calculated from the 2.5th and 97.5th percentiles of the resulting partial dependence estimates.
2.3.5. Theil–Sen Slope and Mann–Kendall Trend Test
The Theil–Sen slope estimator and the Mann–Kendall (MK) non-parametric test were jointly applied in this study to evaluate the long-term trends of fuel variables and their statistical significance (α = 0.05) on a pixel-by-pixel basis. The Theil–Sen method, as an improvement over conventional least-squares regression, effectively reduces the influence of outliers on time-series analysis [59]. The MK test, which is insensitive to outliers and does not require the data to follow a normal distribution, is widely used for significance assessment of long-term trends [60].
2.3.6. Future Fire-Occurrence Projections
Future forest fire occurrence was projected for 2041–2100 under three CMIP6 scenarios (SSP1-2.6, SSP2-4.5, and SSP5-8.5). Temperature (TEM), precipitation (PRE), and soil moisture (SM) were obtained from future climate projections, while VegC, LitterC, and LAI were simulated using the LPJ model under the corresponding climate and atmospheric CO2 conditions. These six variables were allowed to vary under future scenarios, whereas the remaining predictors were held at their historical mean values.
The future environmental datasets were harmonized to a common 0.1° × 0.1° grid and processed using the preprocessing transformations fitted on the 2001–2018 training dataset. The optimized machine-learning model was then applied to the future predictor combinations to generate spatial projections of fire-occurrence prediction scores under the three SSP scenarios.
3. Results
3.1. Spatiotemporal Comparison of Remote Sensed Fuel Data with LPJ Simulations
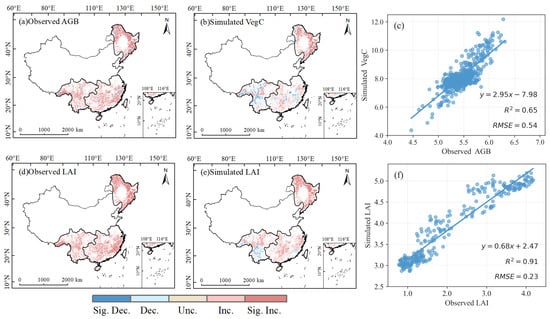
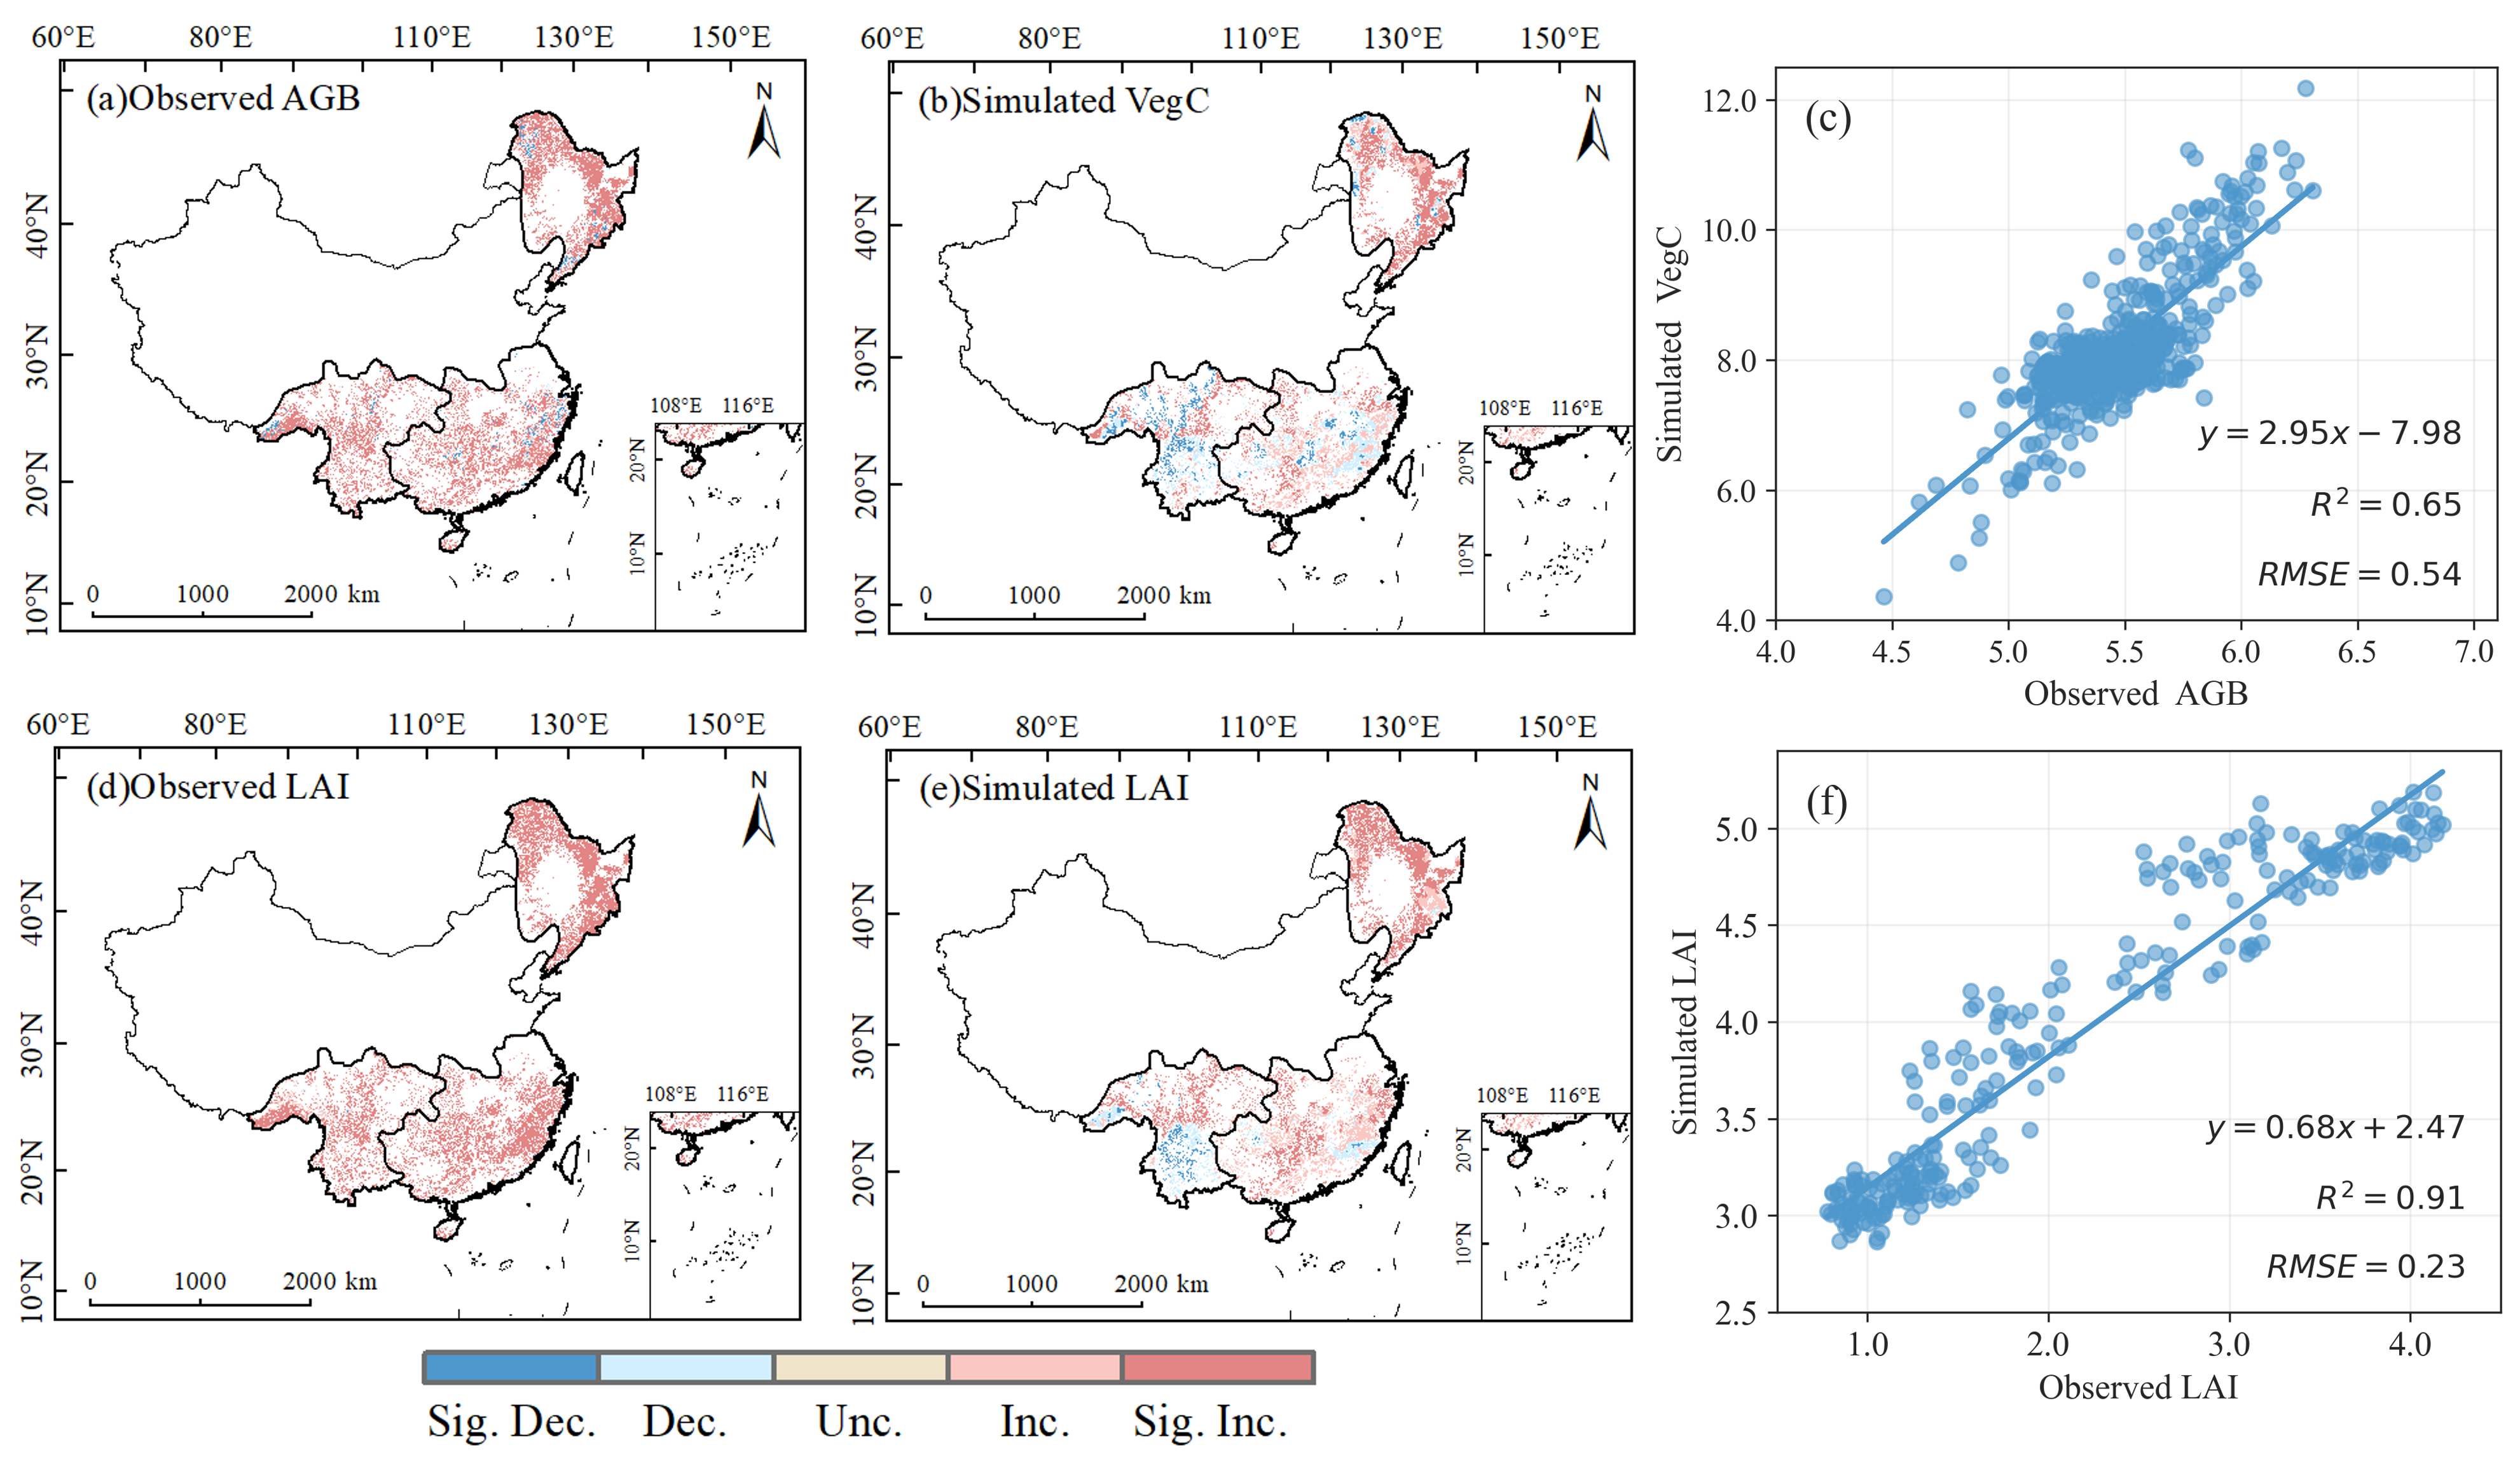
Figure 2 compares remotely sensed aboveground biomass (AGB) and LAI with LPJ-simulated VegC and LAI, respectively, over the period 2001–2022. Because AGB and VegC are not physically equivalent variables, this comparison provides only indirect support for the validation of the LPJ model rather than direct validation. Spatially, the LPJ-simulated VegC trends were generally consistent with the remotely sensed AGB trends, with both showing widespread increasing signals in the NEF and localized variations in the SWF (Figure 2a,b). LAI from both sources also showed similar large-scale spatial trends (Figure 2d,e). At the regional scale, the simulations reproduced the general pattern of vegetation change across the major forest regions of China, although the direction and significance of the simulated trends differed from the observations in some areas (such as the SEF).
Figure 2.
Spatial trend comparison and quantitative assessment of remotely sensed observations and LPJ-simulated vegetation variables across China’s major forest regions from 2001 to 2022. (a,d) Remotely sensed AGB and LAI; (b,e) simulated VegC and LAI; (c,f) scatter density plots comparing remote sensing observed AGB with simulated VegC and observed LAI with simulated LAI, respectively. Sig. Dec., significant decrease (p < 0.05); Dec., decrease; Unc., unchanged; Inc., increase; Sig. Inc., significant increase (p < 0.05).
Scatterplot comparisons showed that the coefficient of determination (R2) between VegC and AGB was 0.65, with a root mean square error (RMSE) of 0.54 kgC/m2 (Figure 2c). The R2 between simulated LAI and remotely sensed LAI was 0.91, with an RMSE of 0.23 m2/m2 (Figure 2f). Previous studies from our research group have also demonstrated the applicability of the LPJ model in China [61,62].
3.2. Effects of Fuel-Related Variables on Model Performance
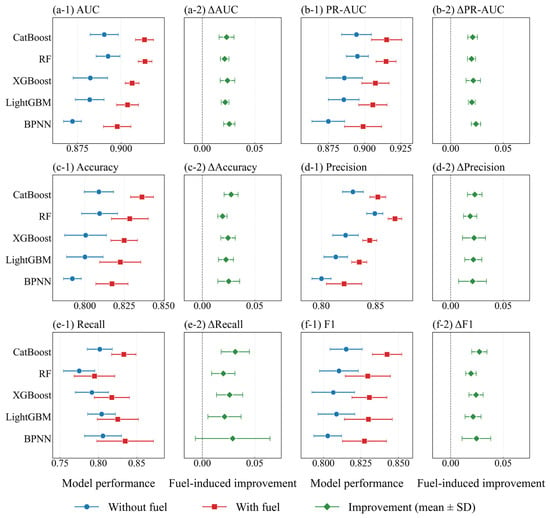
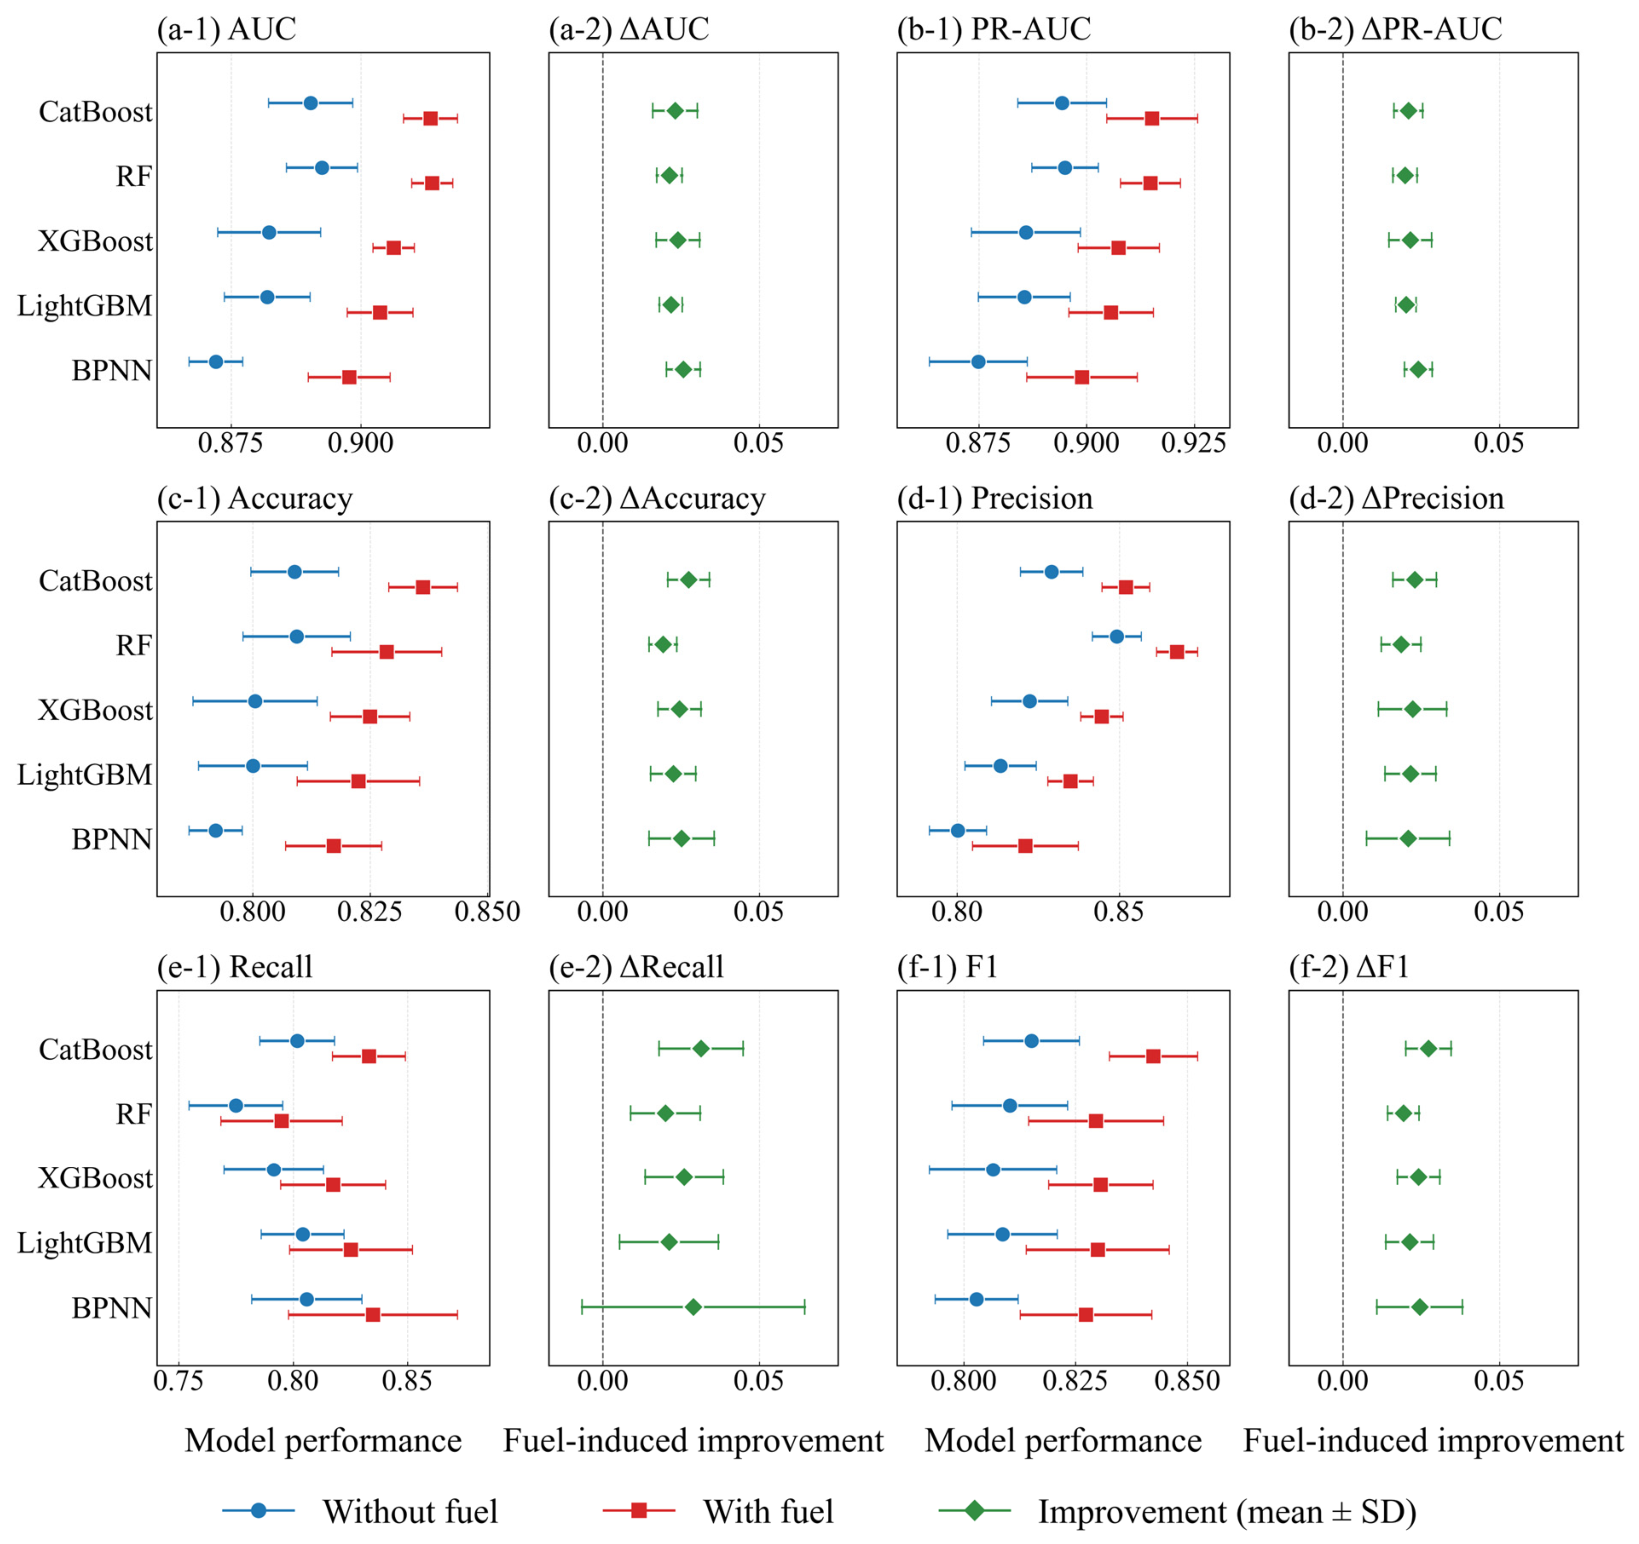
We compared the predictive performance of five machine learning models with and without fuel variables (LitterC, VegC, and LAI) using five-fold spatial cross-validation (Figure 3 and Table S1). The results showed that incorporating fuel variables consistently improved AUC, PR-AUC, accuracy, precision, recall, and F1-score across all five models, with relative gains ranging from approximately 2% to 4%. The mean performance improvements were positive across all five models, although their variability differed among algorithms and evaluation metrics.
Figure 3.
Predictive performance and improvements following the inclusion of fuel-related variables across five machine learning models under spatial cross-validation.
Further evaluation using independent temporal datasets showed positive improvements in AUC and PR-AUC across all five models in both the 2019–2020 test set and the 2021–2022 validation set, with paired DeLong tests indicating statistically significant improvements in AUC between the two configurations (Table S2).
Among the five models, CatBoost demonstrated favorable overall performance after fuel inclusion, achieving the highest PR-AUC, accuracy, and F1-score. RF showed slightly higher AUC and precision (Figure 3). Notably, CatBoost achieved higher recall and F1-score than RF, indicating a more favorable balance between precision and recall. Therefore, CatBoost was selected for subsequent hyperparameter optimization and further analysis.
The final selected hyperparameters of CatBoost were shown in Table S3. The predictive performance of the optimized model was subsequently evaluated using the independent 2019–2020 test set and 2021–2022 validation set (Table 3). The optimized CatBoost model demonstrated good discriminative performance across both periods, with AUC values of 0.9164 and 0.9001, respectively. The corresponding PR-AUC values were 0.8582 and 0.8397, while accuracy remained above 0.82 in both periods, indicating relatively stable predictive performance across different years.
Table 3.
Predictive performance of the optimized CatBoost model with fuel-related features on independent temporal datasets.
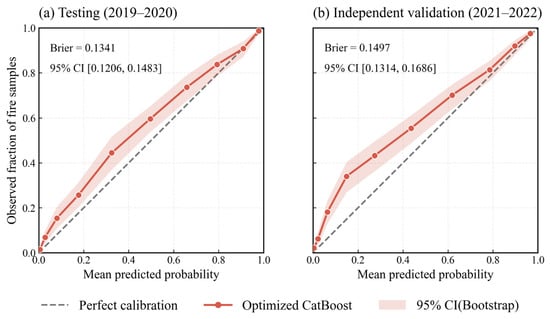
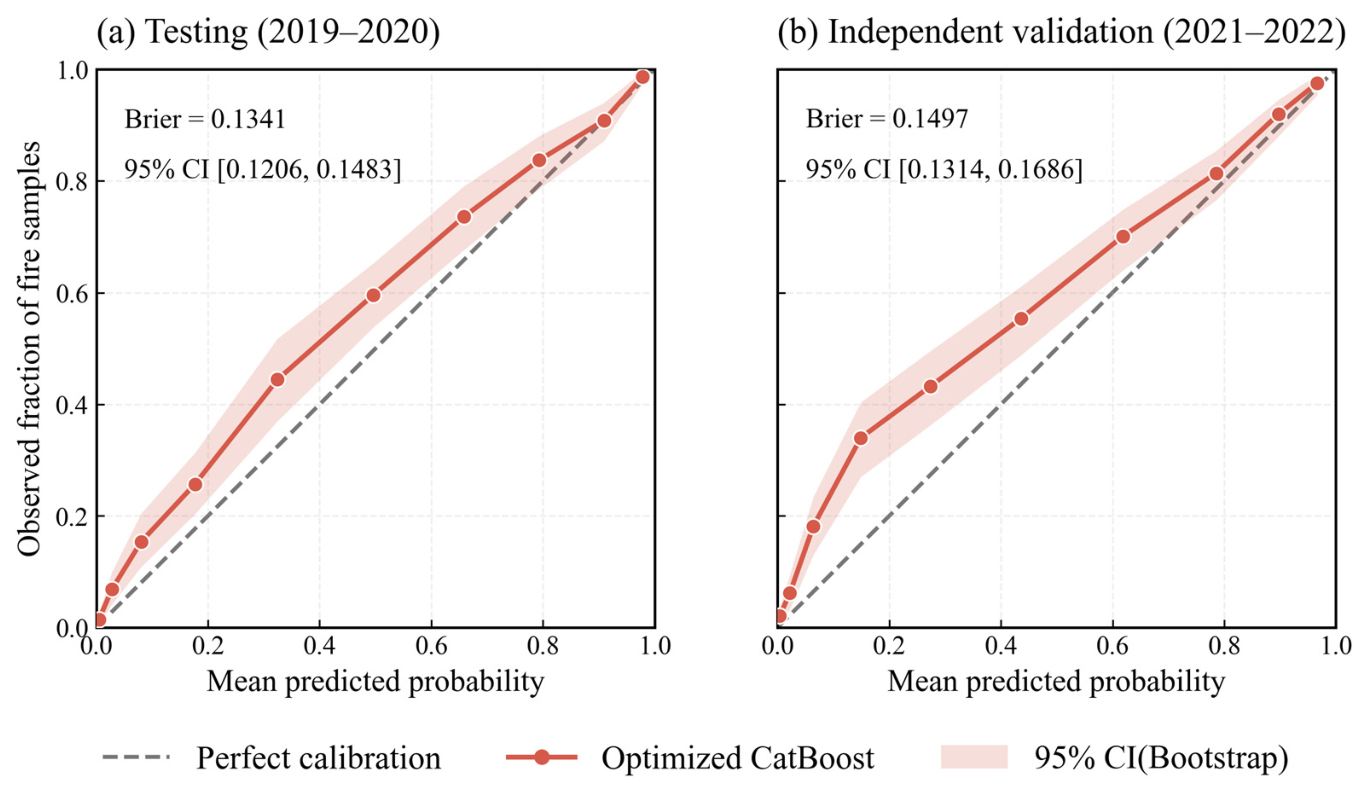
To further evaluate the probabilistic predictions of the optimized CatBoost model, calibration curves were generated for the 2019–2020 test set and the 2021–2022 independent validation set (Figure 4). The Brier scores were 0.1341 and 0.1497 for the test and validation sets, respectively, indicating a slightly higher probabilistic prediction error during the validation period.
Figure 4.
Probability calibration and Brier scores of the optimized CatBoost model with fuel-related features. Shaded areas indicate bootstrap-based 95% confidence intervals.
3.3. Identifying Key Predictors and Response Dependencies via Explainable Machine Learning
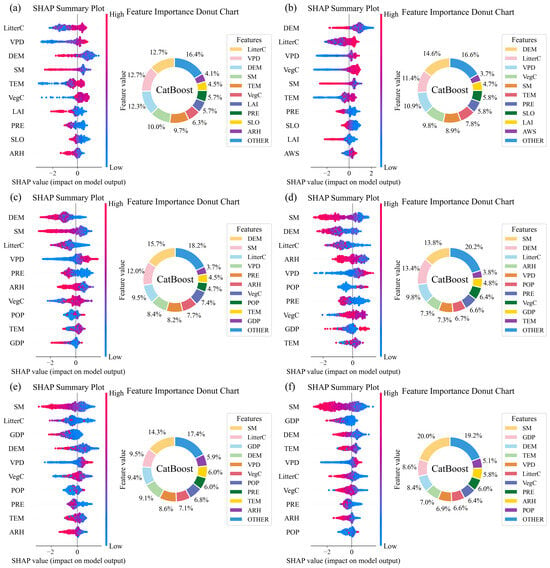
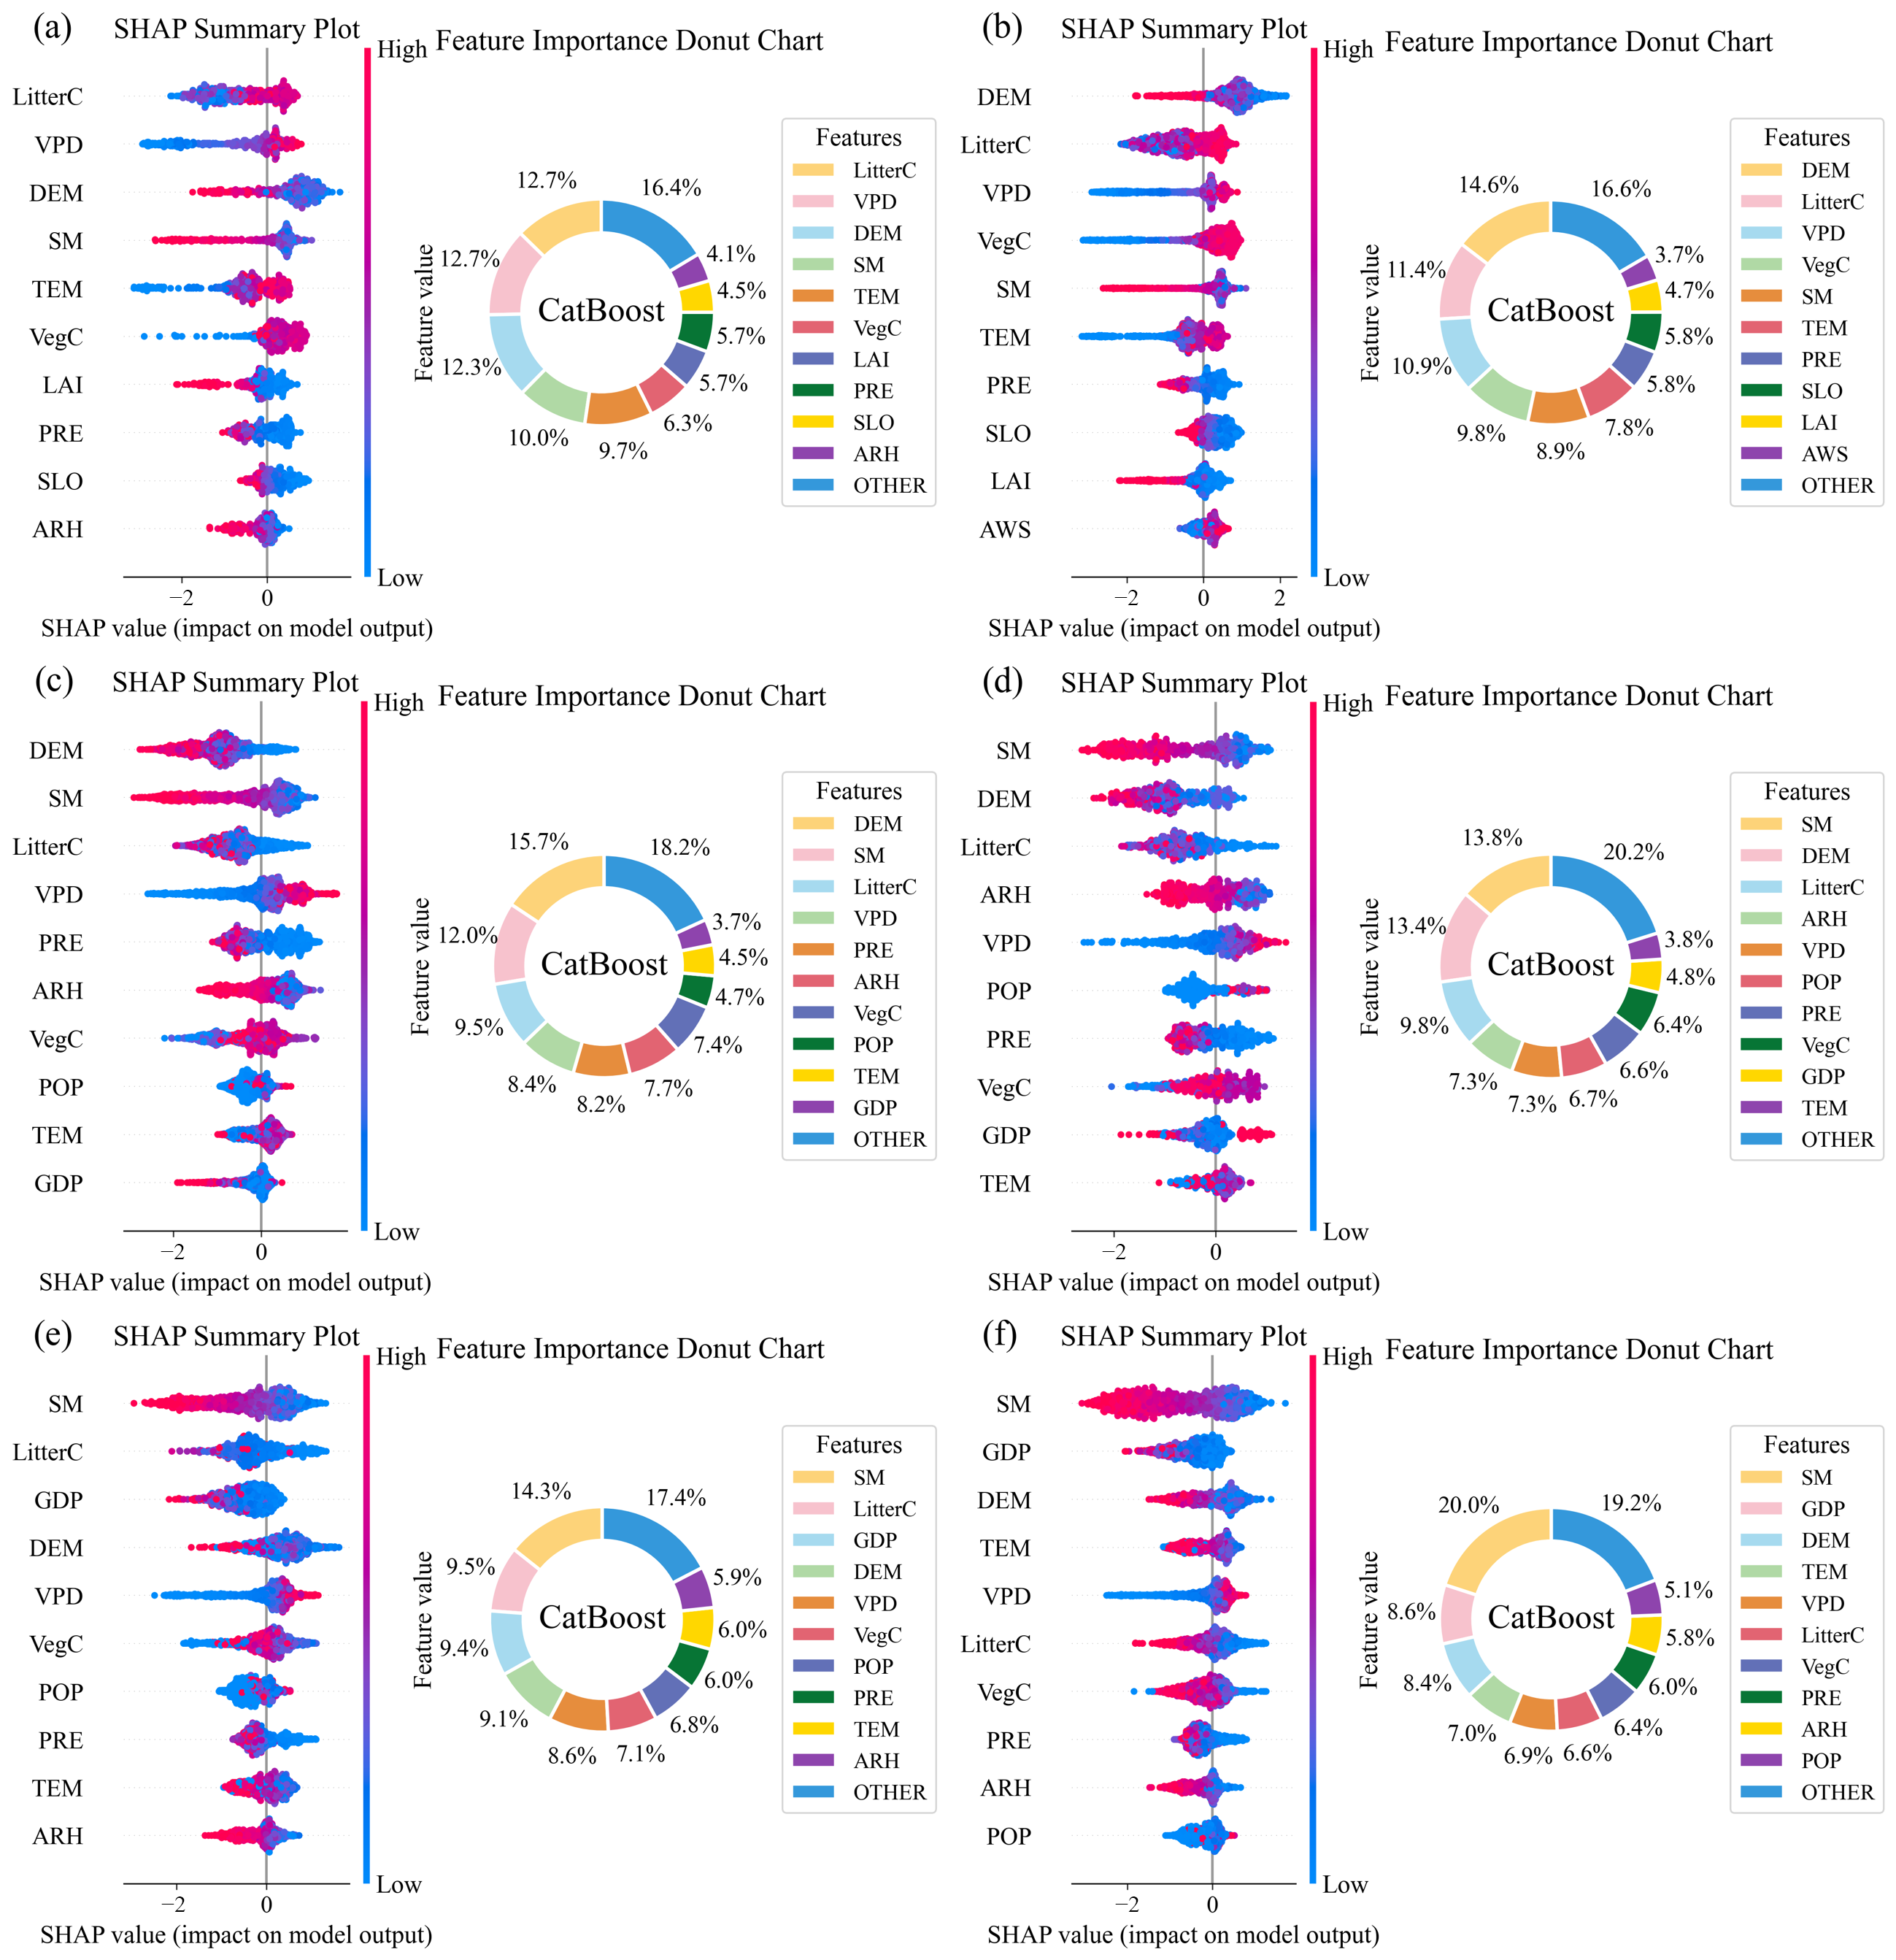
In this study, we employed SHAP to quantify the magnitude and direction of individual predictor contributions to model predictions and highlighted the top 10 variables in each forest region and forest type (Figure 5). The results revealed distinct regional and forest-type differences in predictor importance. In the NEF, LitterC and VPD showed the highest relative importance in coniferous forests (both 12.7%), while DEM (14.6%) and LitterC (11.4%) were the two leading predictors in broadleaved forests. In the SWF, DEM and SM showed the highest relative importance in coniferous (15.7%) and broadleaved forests (13.8%), respectively. In the SEF, SM was the leading predictor in both coniferous and broadleaved forests, contributing 14.3% and 20.0%, respectively. The importance of other predictors, particularly LitterC and GDP, also varied between forest types.
Figure 5.
SHAP-based predictor importance and relative contributions across forest regions and types in China. (a,b) Coniferous and broadleaved forests in the NEF; (c,d) coniferous and broadleaved forests in the SWF; and (e,f) coniferous and broadleaved forests in the SEF.
The SHAP distributions further indicated differences in the direction of predictor contributions. Higher SM values were generally associated with negative SHAP contributions, whereas higher VPD values tended to contribute positively to model predictions across several forest types. In contrast, the SHAP response patterns of LitterC and DEM varied among regions and forest types. Overall, these results highlight substantial spatial and forest-type heterogeneity in predictor importance and contributions to model predictions.
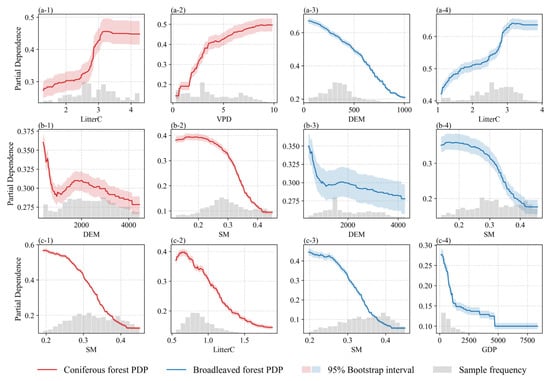
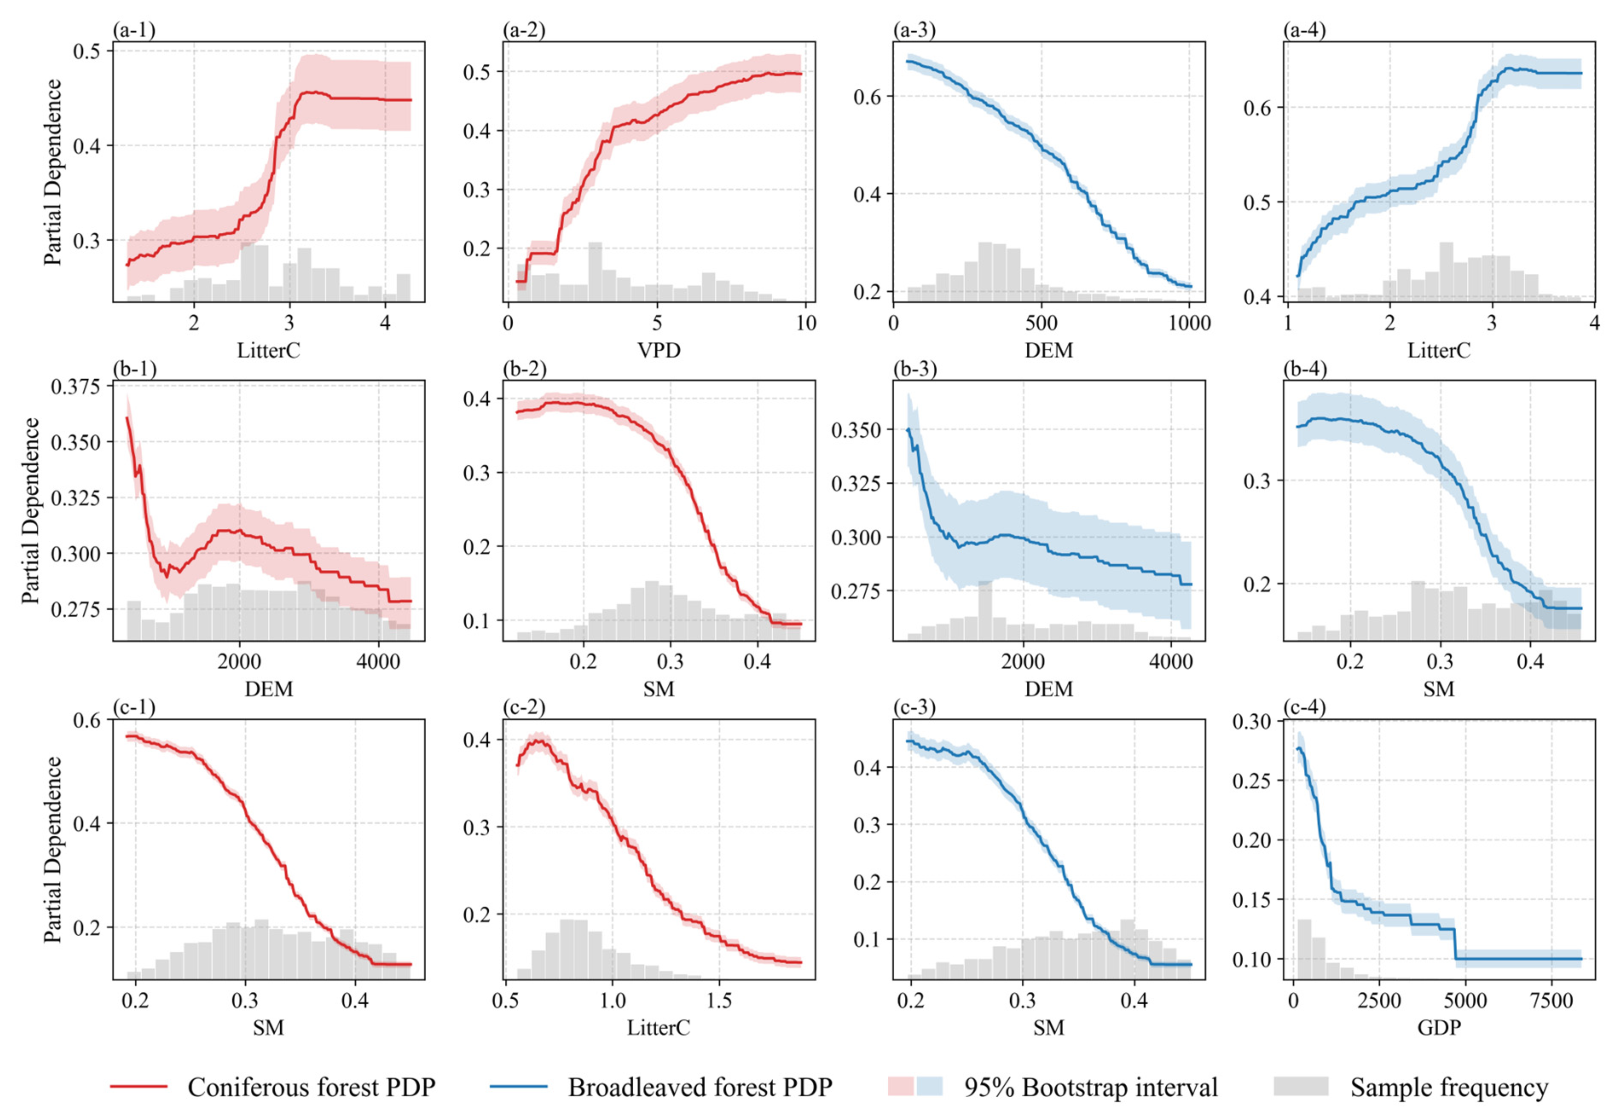
Based on the SHAP importance rankings, we selected the top two factors for one-dimensional partial dependence analysis across the major forest regions and forest types (Figure 6). The results revealed pronounced nonlinear responses and regional differences in the relationships between fuel-related variables (LitterC), climatic conditions (VPD and SM), topography (DEM), and model-predicted fire occurrence.
Figure 6.
Nonlinear model-predicted fire occurrence responses to key environmental predictors across forest regions and types. (a-1,a-2) Coniferous forests in the NEF; (a-3,a-4) broadleaved forests in the NEF; (b-1,b-2) coniferous forests in the SWF; (b-3,b-4) broadleaved forests in the SWF; (c-1,c-2) coniferous forests in the SEF; and (c-3,c-4) broadleaved forests in the SEF. Shaded bands indicate pointwise 95% bootstrap intervals. Histograms show the data distribution.
In the NEF, model-predicted fire occurrence generally increased nonlinearly with increasing LitterC and VPD in coniferous forests, with the partial dependence curve for LitterC showing a pronounced increase followed by a leveling-off trend (Figure 6(a-1,a-2)). In broadleaved forests, predicted fire occurrence increased with LitterC but decreased with increasing DEM. In the SWF, predicted fire occurrence decreased markedly with increasing SM in both forest types, whereas the responses to DEM were relatively weaker and differed between coniferous and broadleaved forests. In the SEF, increasing SM was associated with pronounced decreases in model-predicted fire occurrence in both forest types. In coniferous forests, predicted fire occurrence also showed an overall decreasing trend with increasing LitterC (Figure 6(c-2)). In broadleaved forests, predicted fire occurrence declined rapidly with increasing GDP at lower values before stabilizing (Figure 6(c-4)). Overall, these results highlight distinct regional differences in the nonlinear relationships between key predictors and model-predicted fire occurrence.
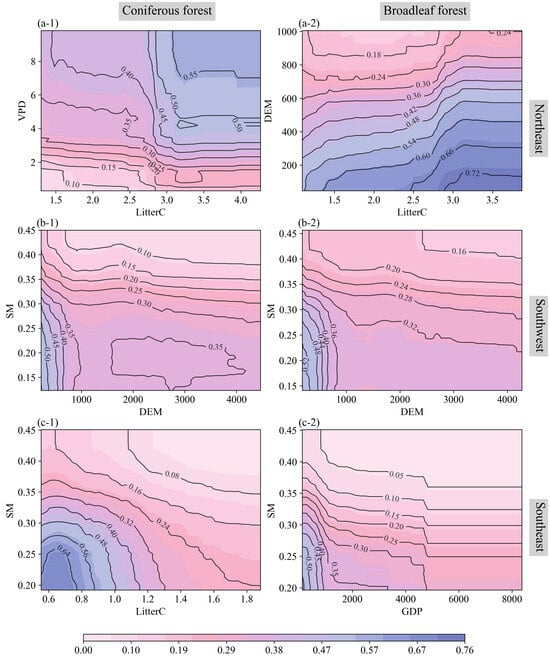
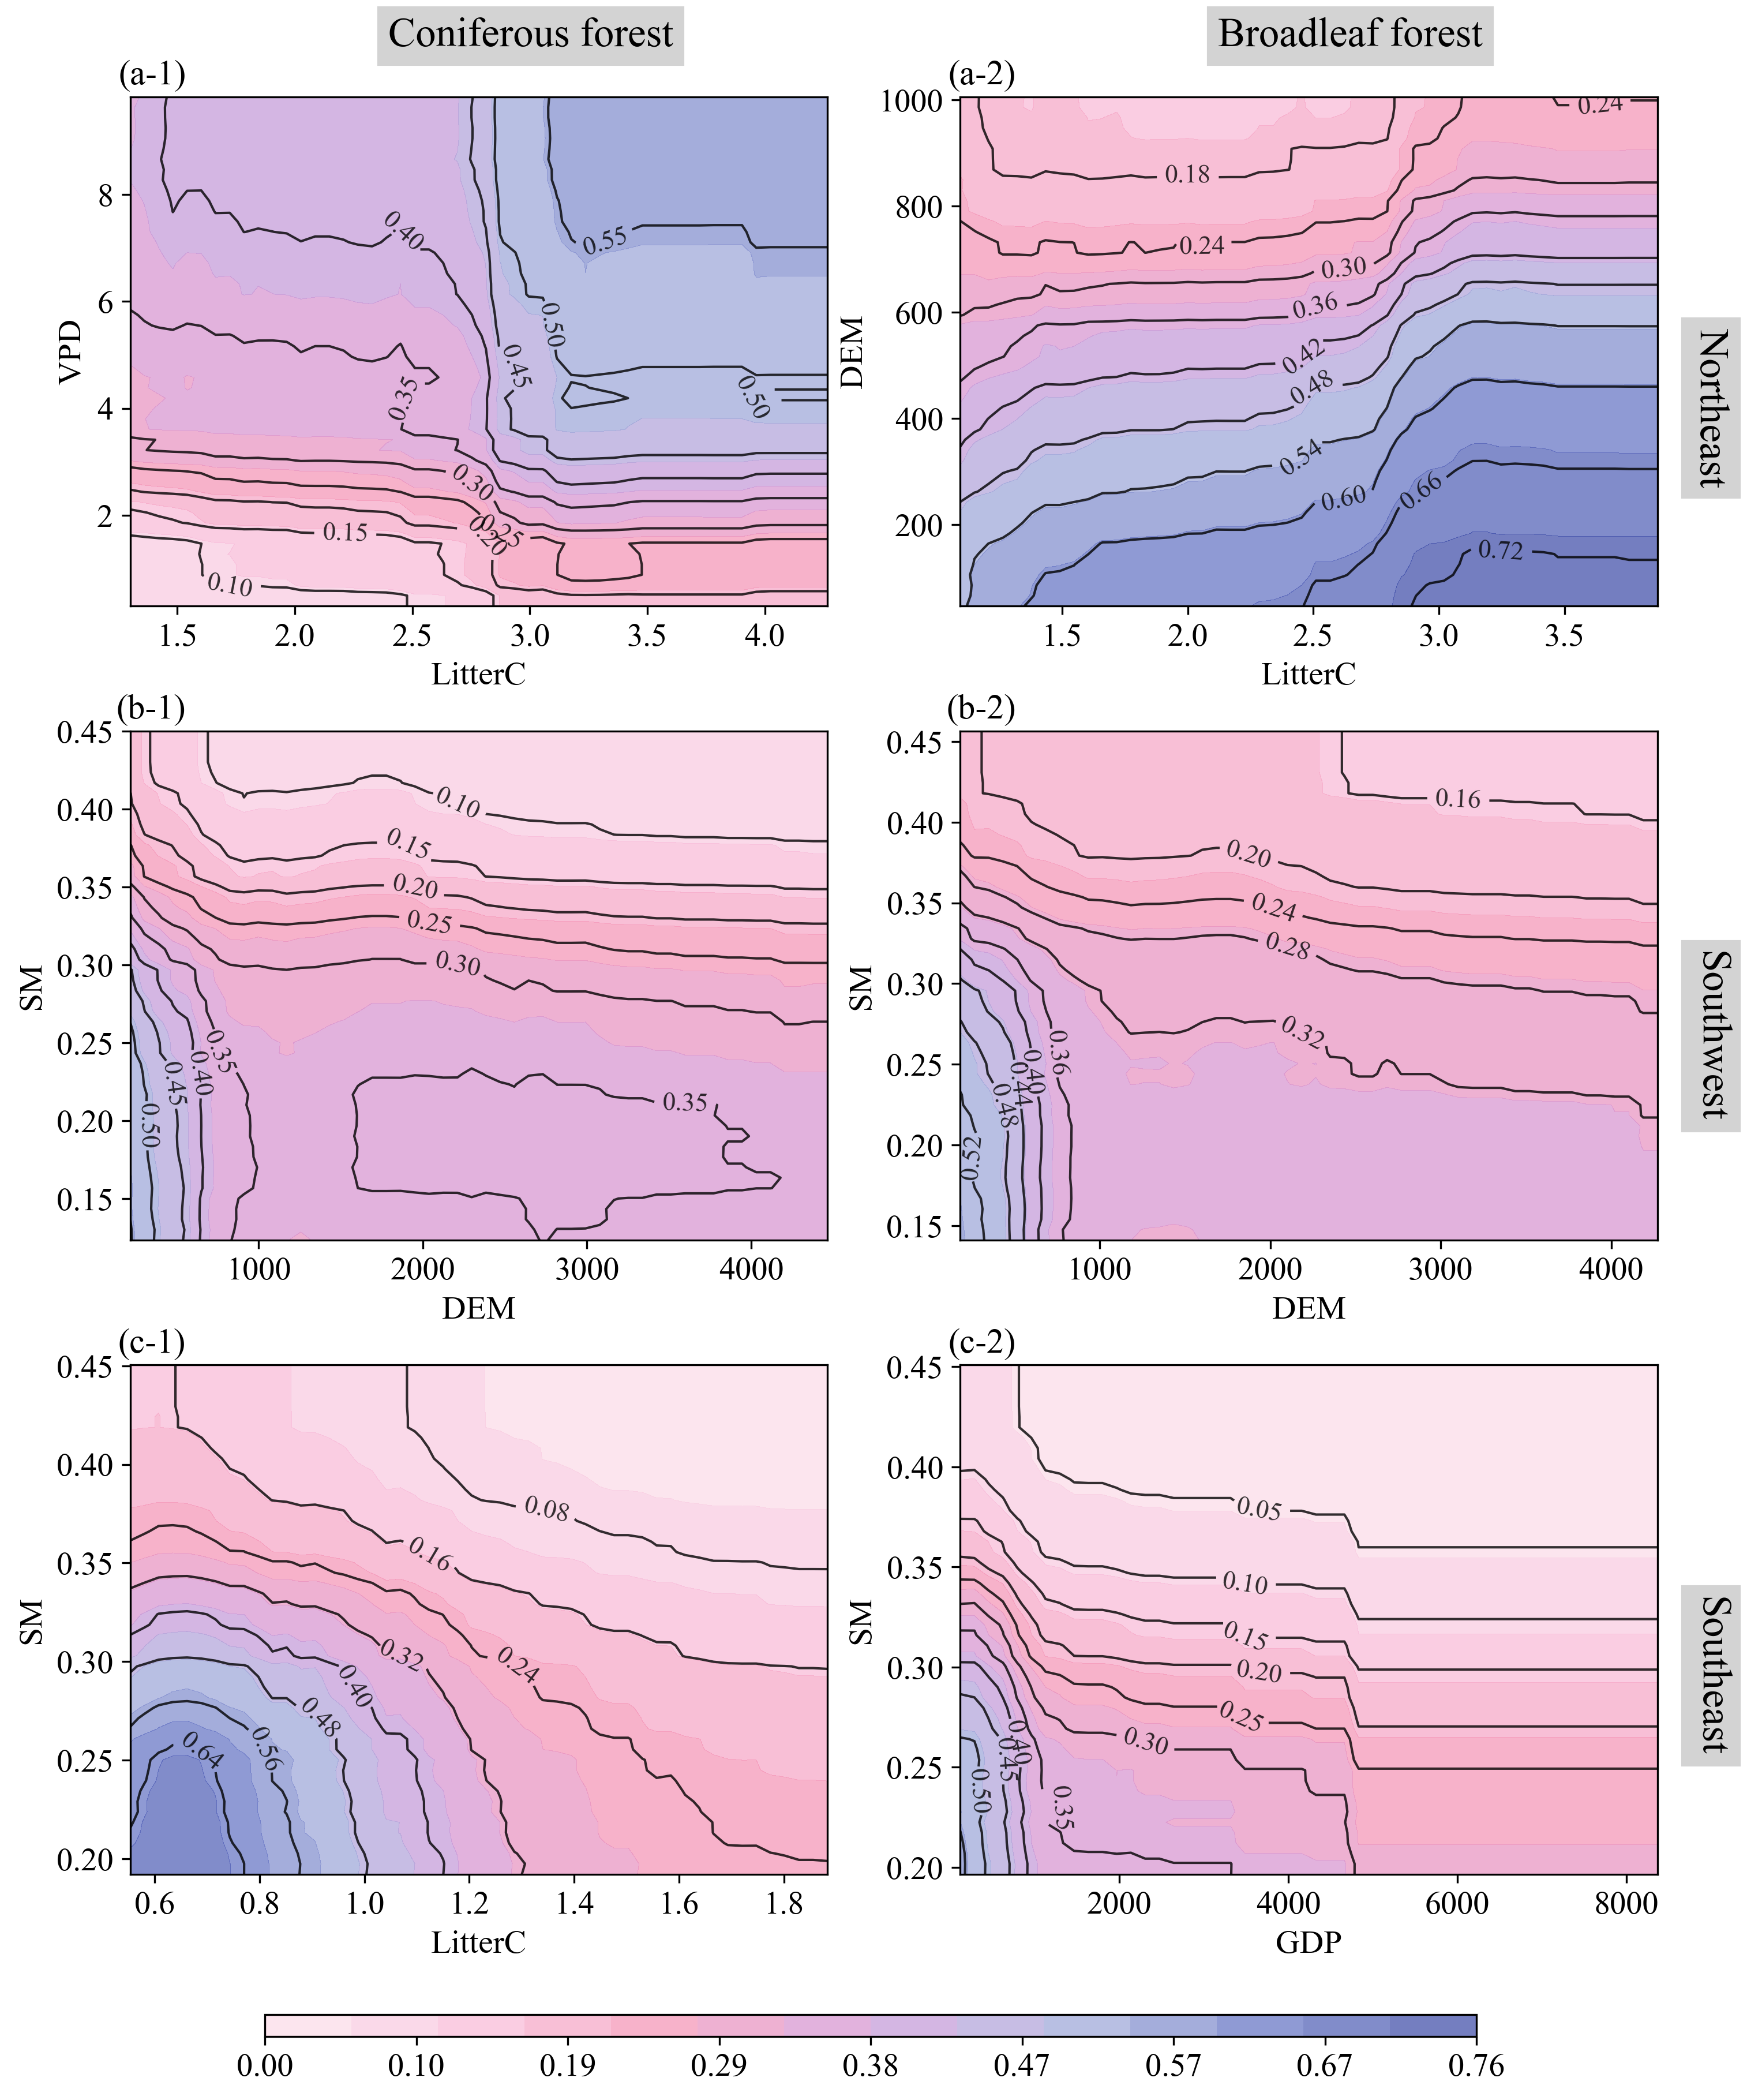
Two-dimensional partial dependence analysis further revealed distinct regional and forest-type differences in the joint model responses to key environmental predictors (Figure 7). In the NEF, higher model-predicted fire occurrence in coniferous forests was associated with elevated LitterC and VPD, with the positive response to LitterC becoming more pronounced under higher VPD conditions. In broadleaved forests, higher predictions were generally associated with lower DEM, particularly when LitterC was high (Figure 7(a-1,a-2)). In the SWF, both forest types exhibited pronounced SM-related gradients, with higher predictions concentrated under low SM conditions, especially at lower elevations (Figure 7(b-1,b-2)). Similar moisture-related patterns were observed in the SEF, although the joint responses differed between forest types. In coniferous forests, higher predictions were mainly associated with low SM and low LitterC. In broadleaved forests, higher predictions were concentrated under combinations of low SM and low GDP (Figure 7(c-1,c-2)). Overall, the joint model responses highlighted prominent moisture-related gradients in the SWF and SEF, alongside contrasting fuel-related prediction patterns between the NEF and SEF.
Figure 7.
Joint model-predicted fire occurrence responses to selected environmental predictor pairs across forest regions and types. (a-1) Coniferous forests and (a-2) broadleaved forests in the NEF; (b-1) coniferous forests and (b-2) broadleaved forests in the SWF; and (c-1) coniferous forests and (c-2) broadleaved forests in the SEF. Contour lines and colors represent partial dependence values.
3.4. Projection of Forest Fire Occurrence Under Future Climate Change Scenarios
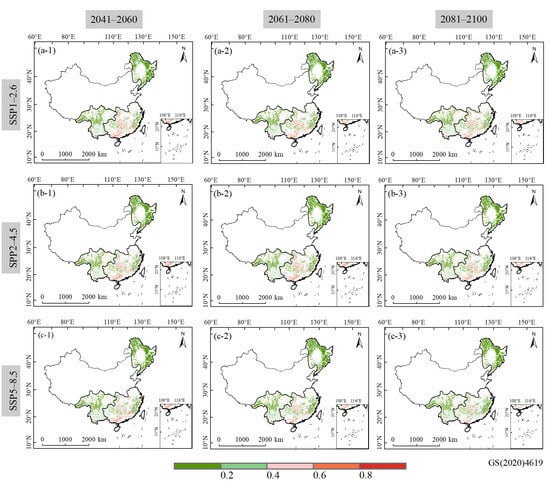
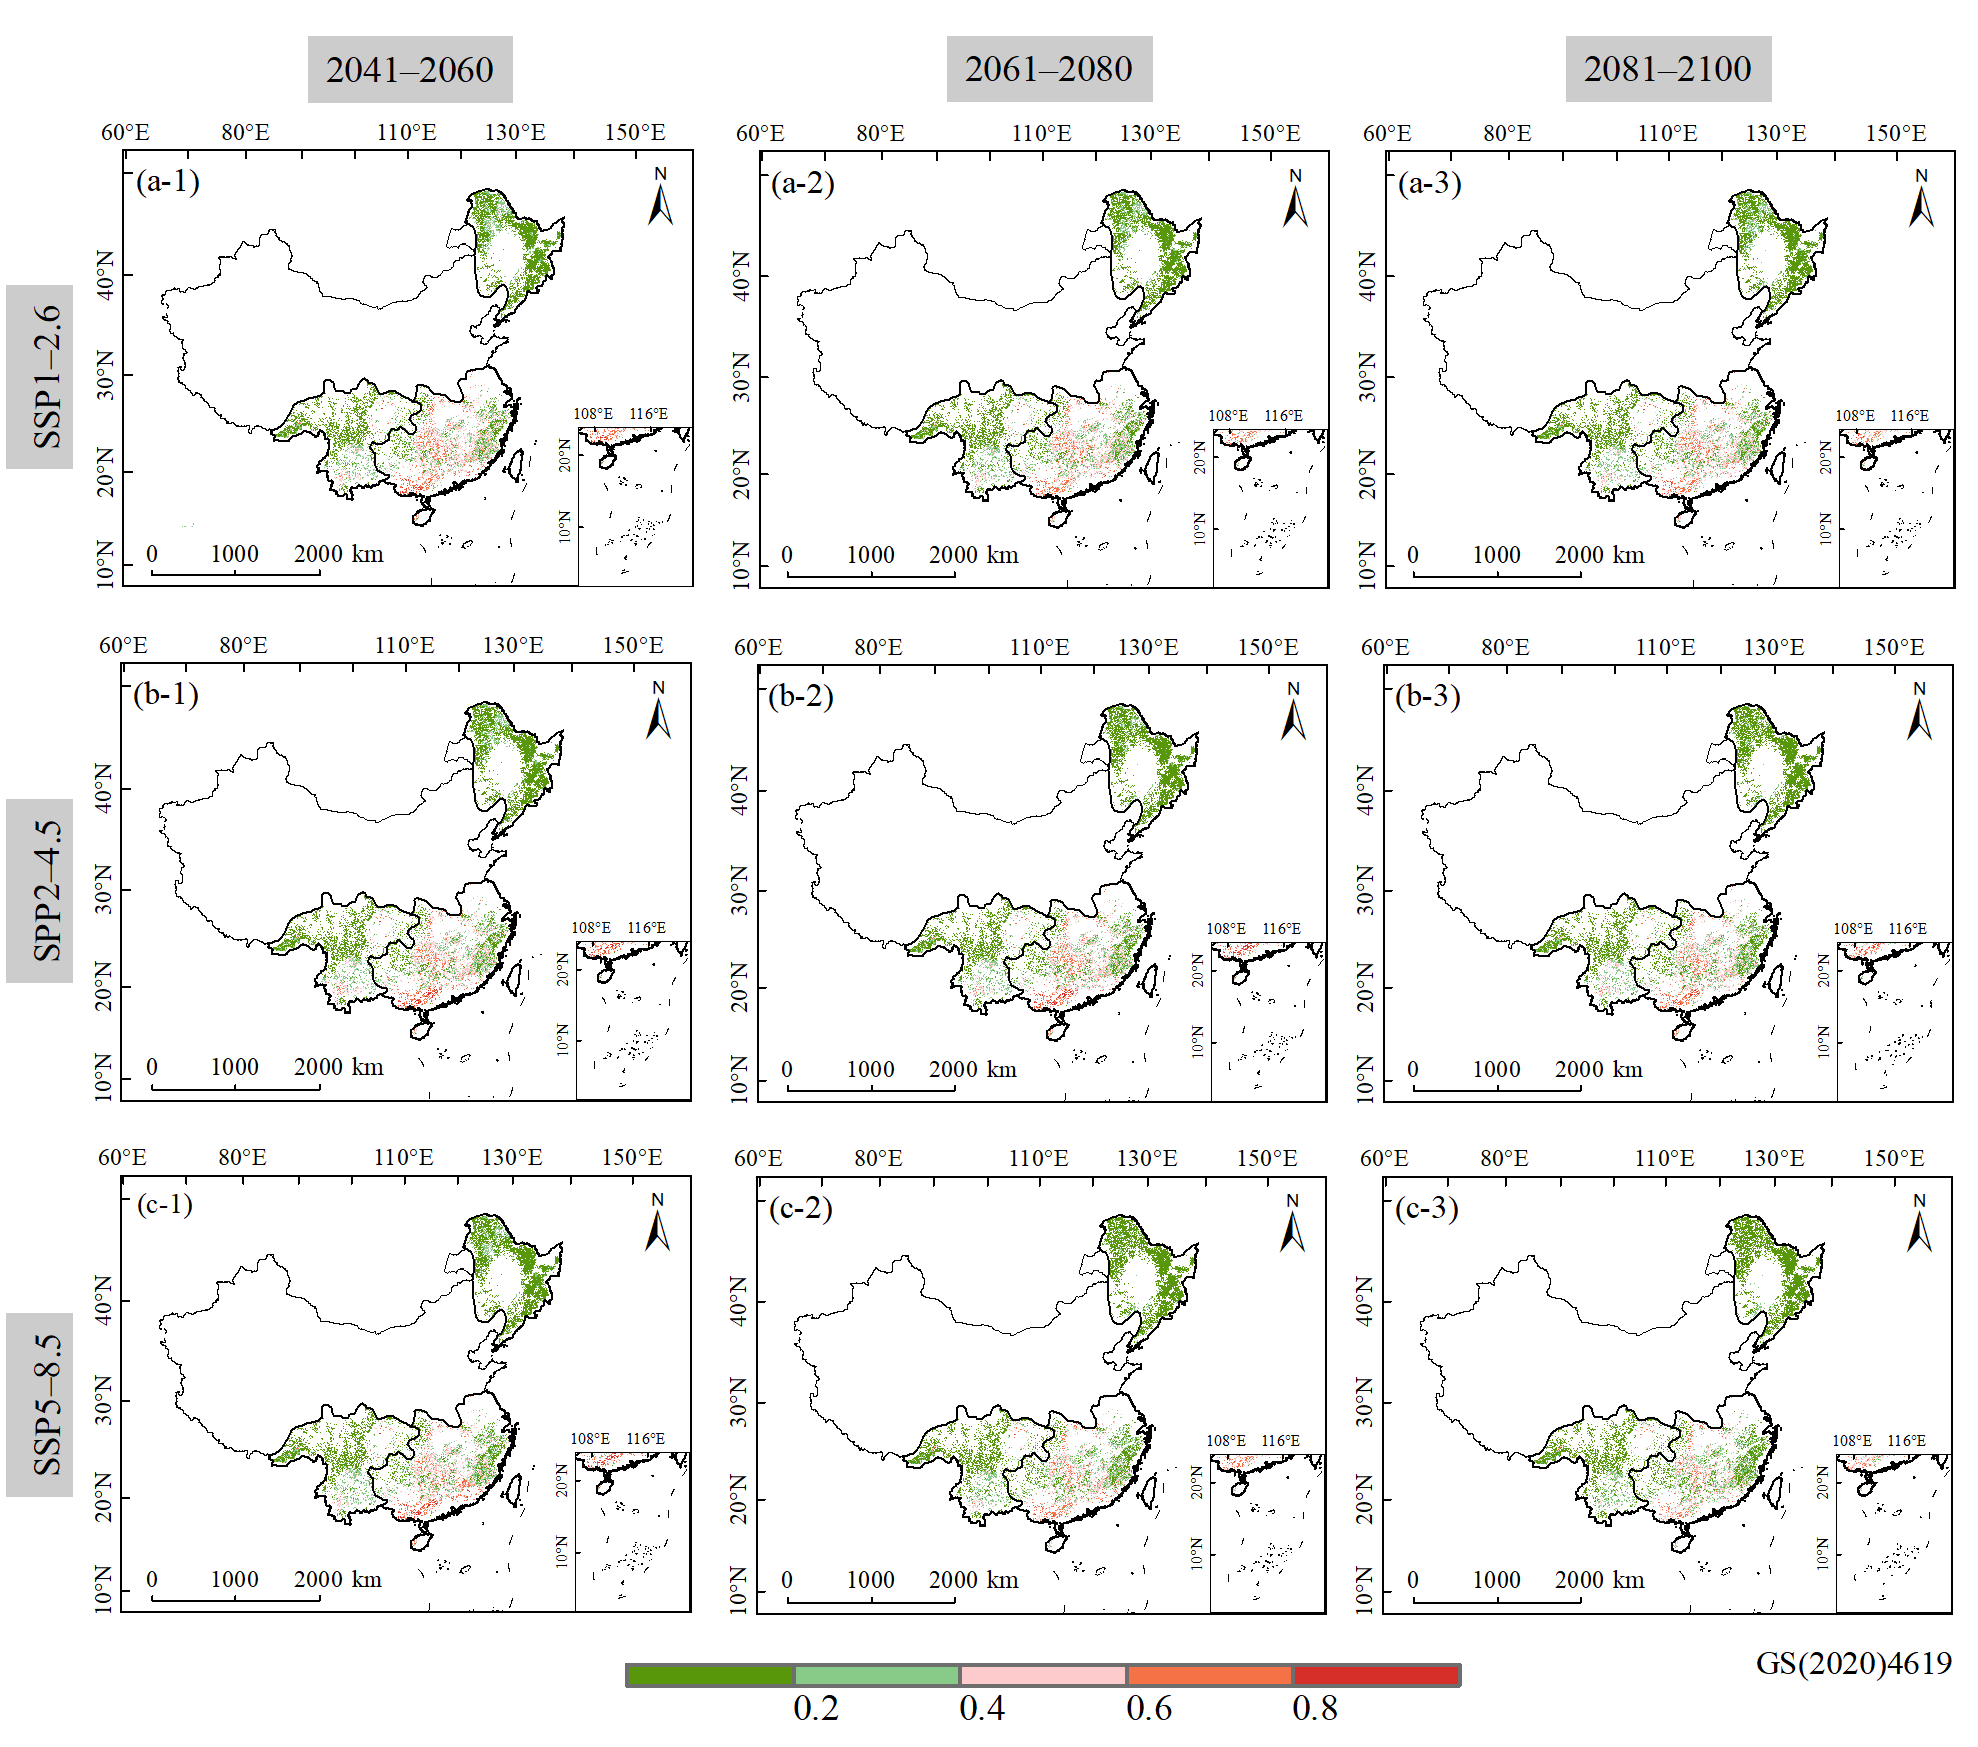
The spatial distributions of model-predicted forest fire occurrence under three SSP scenarios exhibited pronounced regional heterogeneity during 2041–2100 (Figure 8). Across the three scenarios and future periods, relatively low predicted values were widespread in the NEF and SWF, whereas areas with relatively high predicted values were more concentrated in SEF. In NEF, predicted values were predominantly within the lower ranges, with only scattered areas exhibiting moderately elevated values. SWF showed a more spatially fragmented distribution, characterized by extensive areas of relatively low predicted values interspersed with localized higher-value patches. By contrast, SEF exhibited more prominent clusters of elevated predicted fire occurrence, particularly in parts of the southern forest region.
Figure 8.
Spatial distribution of model-predicted forest fire occurrence generated by the CatBoost model using the bias-corrected CMIP6 multi-model ensemble (MME) under (a-1–a-3) SSP1-2.6, (b-1–b-3) SSP2-4.5, and (c-1–c-3) SSP5-8.5. Columns represent 2041–2060, 2061–2080, and 2081–2100, respectively.
Despite these regional differences, the overall spatial patterns remained broadly similar across the three future periods (2041–2060, 2061–2080, and 2081–2100) and emission scenarios (SSP1-2.6, SSP2-4.5, and SSP5-8.5). The principal areas of relatively high and low predicted fire occurrence were generally maintained, although localized variations were apparent between periods and scenarios. These results indicated that regional contrasts in model-predicted fire occurrence persist under different future climate scenarios, while changes in the magnitude and spatial extent of elevated predictions were different.
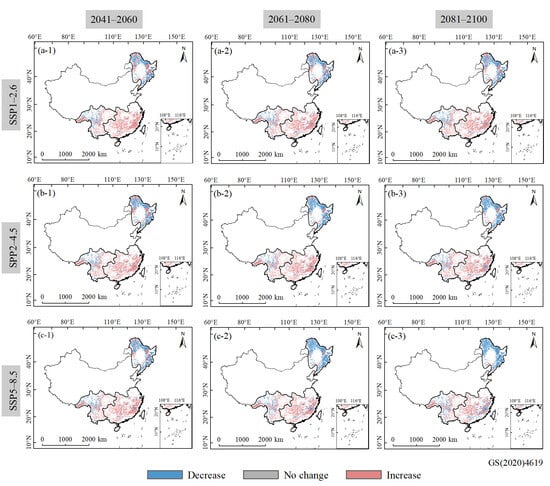
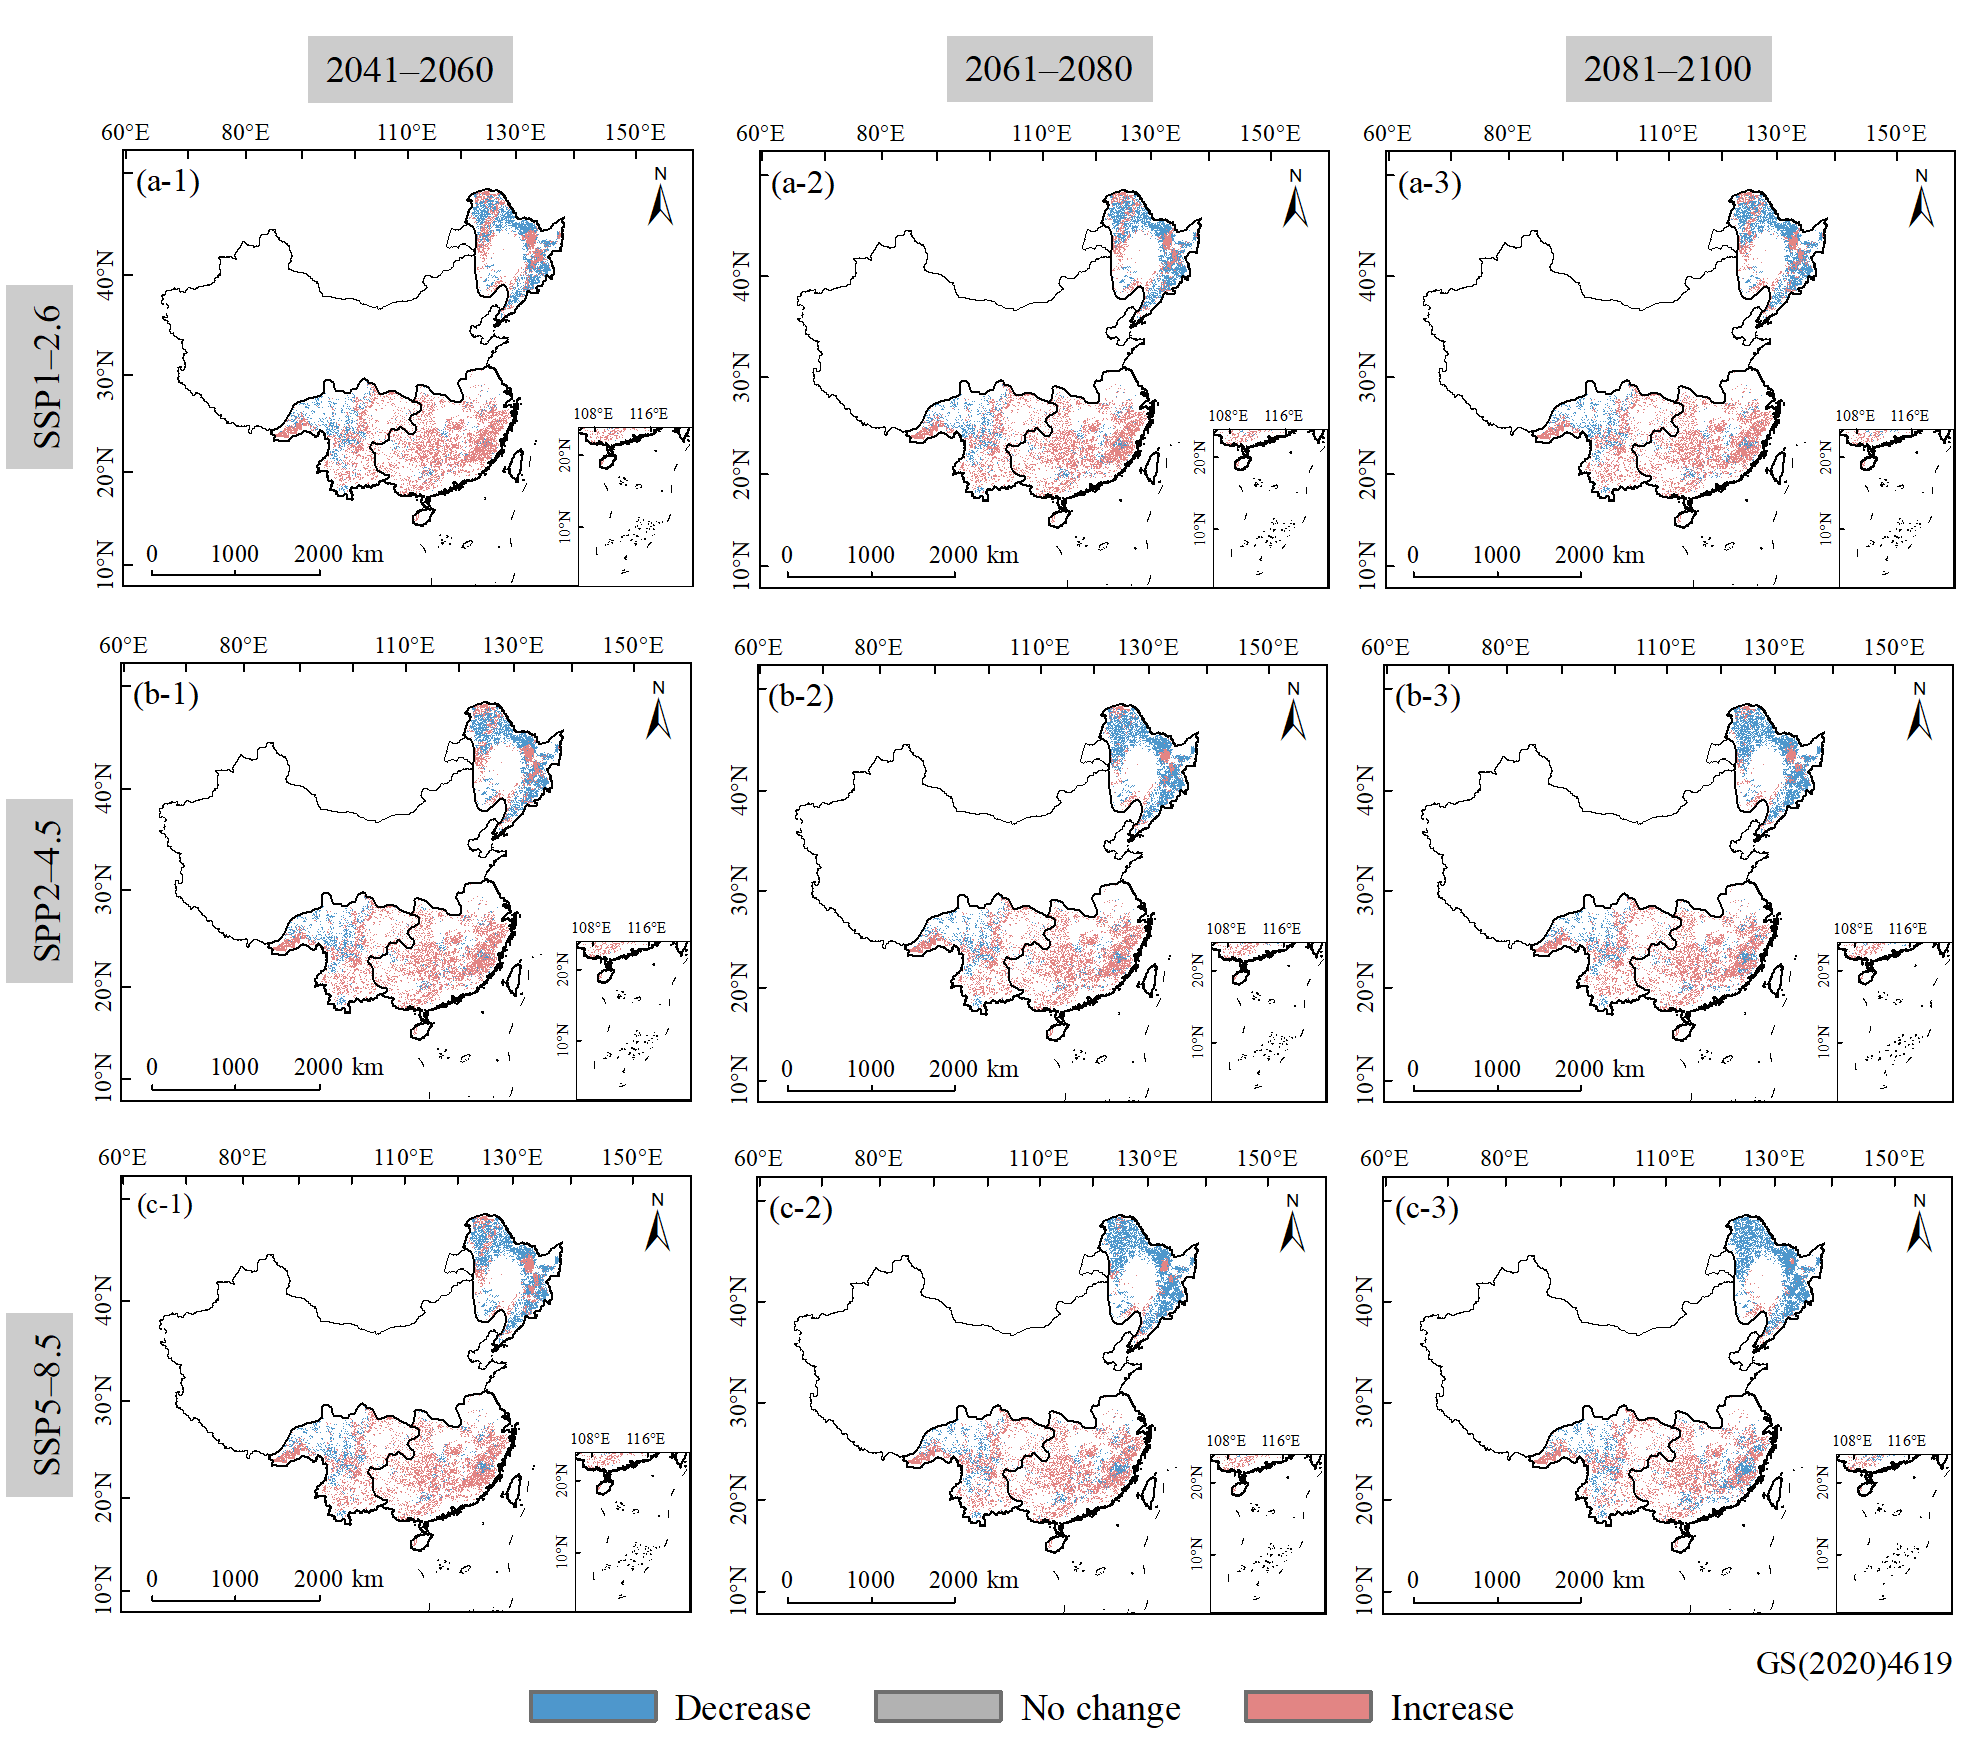
The projected changes in model-predicted forest fire occurrence relative to the historical baseline (2001–2022) exhibited pronounced spatial and regional heterogeneity across the three SSP scenarios (Figure 9). Decreases were predominantly observed in NEF, whereas increases were widespread in SEF. SWF exhibited a more heterogeneous spatial pattern, with areas of increasing and decreasing predictions occurring in close proximity.
Figure 9.
Spatial patterns of projected changes in model-predicted forest fire occurrence relative to the historical baseline (2001–2022). Projections were generated using the CatBoost model driven by bias-corrected CMIP6 multi-model ensemble (MME) data under (a-1–a-3) SSP1-2.6, (b-1–b-3) SSP2-4.5, and (c-1–c-3) SSP5-8.5. Columns represent 2041–2060, 2061–2080, and 2081–2100, respectively.
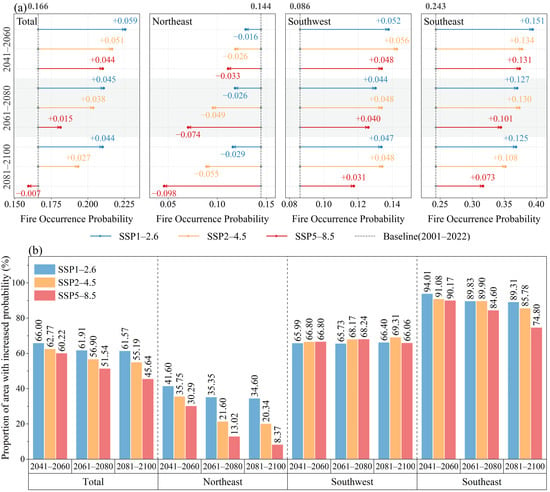
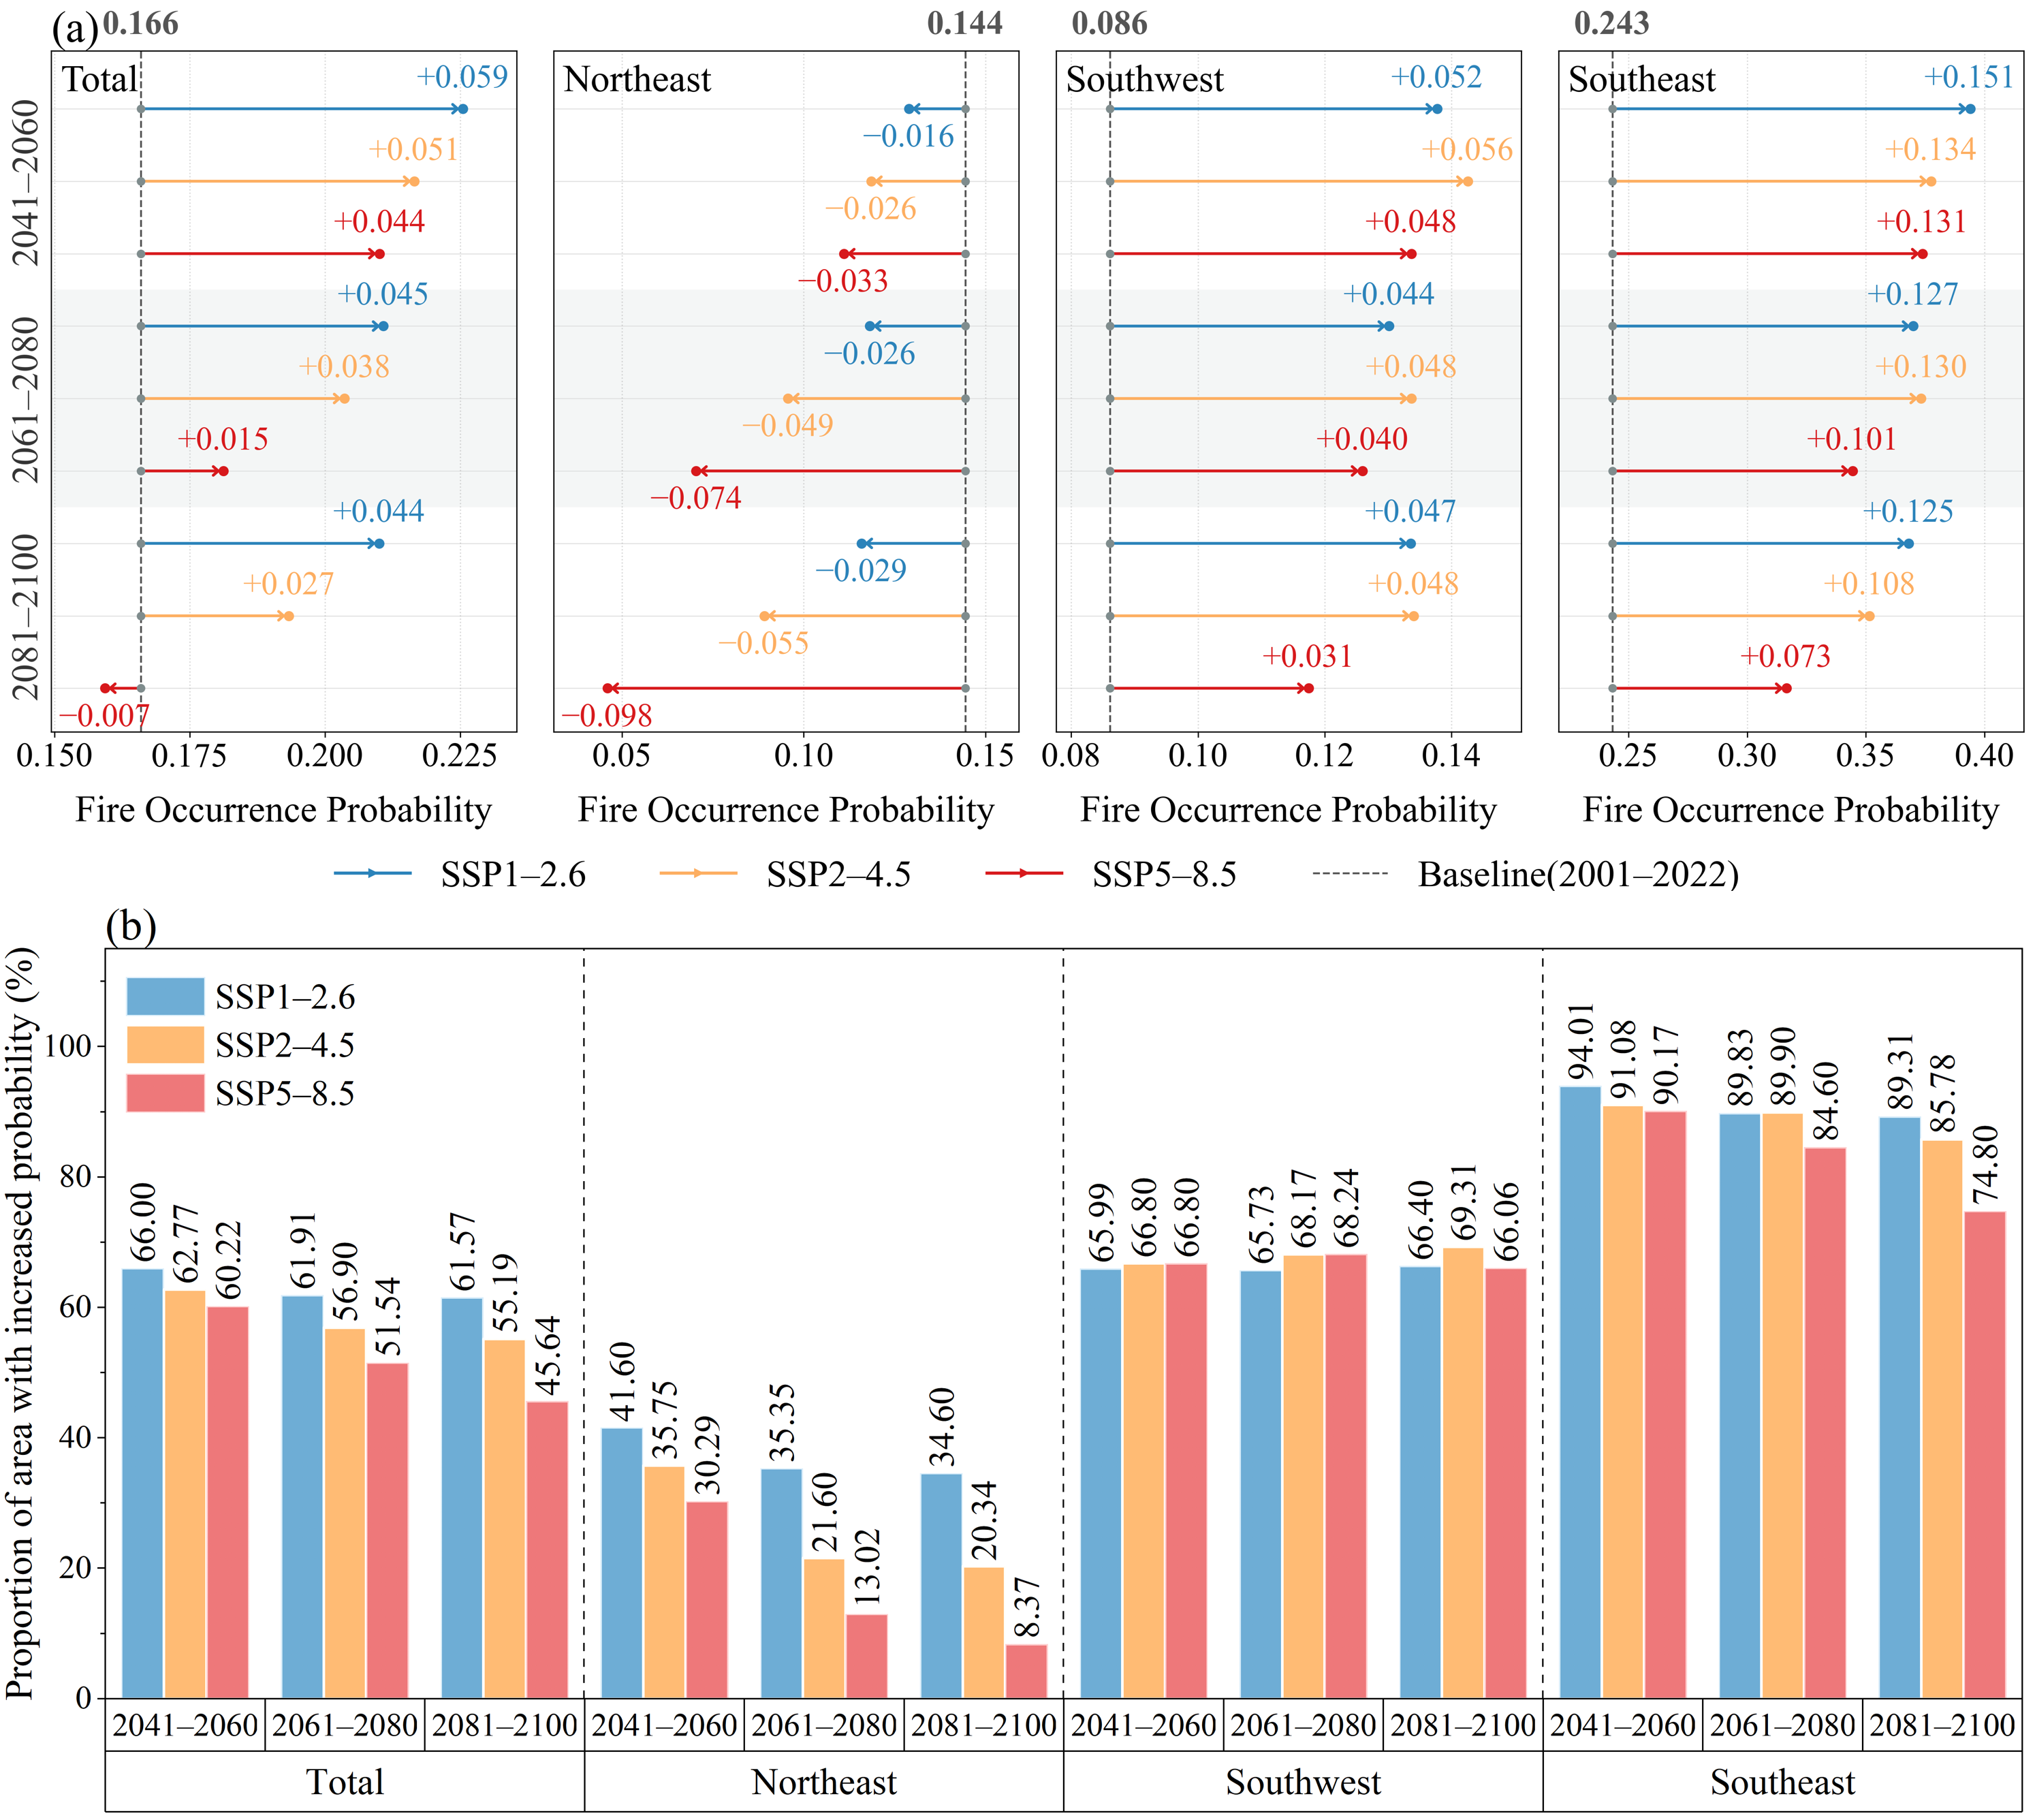
At the whole study area, mean predicted fire occurrence increased relative to the historical baseline (0.166) under all three SSP scenarios during 2041–2060 (Figure 10a). However, the magnitude of these increases generally weakened toward the end of the century. Consistently, the proportion of forest area with increased predicted values under SSP5-8.5 decreased from 60.22% in 2041–2060 to 45.64% in 2081–2100 (Figure 10b).
Figure 10.
Projected changes in model-predicted forest fire occurrence relative to the historical baseline (2001–2022) at the whole and regional scales under three SSP scenarios. (a) Mean predicted values for future periods compared with historical baseline values, indicated by vertical dashed lines. Arrows indicate the direction and magnitude of changes, with labeled values representing absolute differences from the baseline. (b) Proportion of forest area exhibiting increased predicted values relative to the historical baseline under each scenario and future period.
Substantial differences were observed among the three forest regions. In NEF, mean predicted fire occurrence decreased under all scenarios and future periods. The greatest decrease occurred under SSP5-8.5 during 2081–2100, accompanied by a reduction in the proportion of forest area exhibiting increases from 30.29% in 2041–2060 to only 8.37% in 2081–2100. In contrast, SWF consistently exhibited positive changes in mean predicted values, ranging from 0.031 to 0.056, with approximately 66–69% of forest areas showing increases across scenarios and periods. SEF showed the largest positive changes, with widespread increases under all future scenarios. Although the magnitude of these increases generally weakened over time, particularly under SSP5-8.5, the proportion of forest area exhibiting increased predictions remained substantial, reaching 74.80% even during 2081–2100 under SSP5-8.5.
Overall, these results indicate contrasting regional trajectories in future model-predicted fire occurrence, characterized by persistent decreases in NEF and predominantly positive changes in SWF and SEF. The diminishing increase in mean predicted fire occurrence across the study area toward the end of the century, particularly under SSP5-8.5, further highlights the heterogeneous responses of model predictions to future environmental conditions.
4. Discussion
Regional differences in predictor importance and partial dependence patterns indicate that forest fire occurrence is associated with different combinations of fuel availability, moisture conditions, and environmental factors across China’s major forest regions. Previous studies have shown that the relative influences of climate, vegetation, and human activities on fire occurrence vary among ecosystems [5,63,64]. In the NEF, LitterC showed positive relationships with model-predicted fire occurrence in both forest types, while the combination of high LitterC and VPD corresponded to higher predictions in coniferous forests. Litter accumulation provides potential surface fuel, whereas elevated VPD is associated with reduced dead fine-fuel moisture [13,14]. These conditions may therefore favor fire occurrence [2]. However, simulated LitterC represents a carbon pool rather than directly measured combustible fuel. In northeastern broadleaved forests, the negative relationship between DEM and fire occurrence may reflect variations in temperature, vegetation characteristics, and human accessibility along elevation gradients [5]. In the SWF, higher predictions occurred under low-SM and low-elevation conditions in both forest types. Complex terrain may create substantial environmental heterogeneity, while reduced soil moisture can indicate conditions associated with fuel drying and fire occurrence [12]. In the relatively humid SEF, SM was the leading predictor in both forest types, suggesting that moisture availability may be particularly important in distinguishing fire-prone conditions where vegetation provides substantial potential fuel [63,64]. Notably, LitterC exhibited opposite relationships with model-predicted fire occurrence in northeastern and southeastern coniferous forests, with a positive relationship in the NEF and a negative relationship in the SEF. This contrast suggests that the predictive role of litter carbon may depend on surrounding moisture and vegetation conditions [63,64]. However, higher predictions at low LitterC levels do not necessarily indicate that reduced litter promotes fire occurrence. Similarly, the negative association between GDP and model-predicted fire occurrence in southeastern broadleaved forests may reflect differences in land use and socioeconomic activities rather than a direct protective effect of economic development [22,23]. Overall, these findings highlight the context-dependent relationships among fuel availability, moisture conditions, topography, and human activities in forest fire prediction.
Future projections revealed contrasting regional changes in forest fire occurrence. Predicted values generally increased in the SWF and SEF but declined in the NEF, despite localized increases. These differences may reflect regional variations in projected climate and vegetation conditions, as fuel availability and moisture constraints influence fire activity differently across ecosystems [12,64]. The negative relationships between SM and fire occurrence in the SWF and SEF suggest that future moisture changes, together with vegetation dynamics, may contribute to the widespread increases in predicted values. However, the contributions of individual future predictors were not quantified, and the mechanisms underlying the NEF decline remain uncertain. Notably, the national increase weakened toward the end of the century, particularly under SSP5-8.5, as declining predictions in the NEF offset continued increases in southern forests. The smaller increases under SSP5-8.5 than under SSP1-2.6 may reflect nonlinear responses to different combinations of climatic and vegetation conditions [63,64], although the underlying mechanisms remain uncertain. The projected decline in the NEF contrasts with previous findings suggesting increasing future forest fire occurrence in northeastern China [6], whereas localized increases are consistent with projections for parts of the Daxing’anling region [65]. These discrepancies may arise from differences in study areas, model inputs, predicted fire characteristics, and reference periods. Previous studies have also demonstrated that vegetation and fuel-related processes can modify climate-driven fire projections [64,66], supporting the inclusion of dynamic vegetation information in future assessments. Nevertheless, because VPD and several other predictors were held at historical levels, these projections do not represent the full range of future environmental changes, particularly those related to atmospheric dryness [14,27]. From a management perspective, the widespread increases in the SWF and SEF highlight the importance of monitoring moisture and vegetation conditions, while localized areas of increasing predictions in the NEF also warrant attention.
Beyond these regional patterns, the principal contribution of this study is the quantitative evaluation of dynamic fuel-related information in forest fire prediction. Fire occurrence depends not only on meteorological conditions but also on the availability and characteristics of combustible vegetation, which are influenced by vegetation growth and accumulation over time [13,64]. Conventional meteorological and topographic predictors do not explicitly represent all aspects of these vegetation-related conditions. Incorporating LPJ-simulated VegC, LitterC, and LAI therefore provides complementary information on vegetation carbon storage, litter accumulation, and canopy development, potentially capturing aspects of fuel availability that are not fully represented by conventional environmental predictors. Dynamic vegetation models such as LPJ provide a process-based framework for representing vegetation dynamics and carbon cycling under changing environmental conditions [15]. The consistent improvements obtained across five machine learning algorithms support the additional predictive value of these variables. Although the improvements were relatively modest, their persistence under spatial cross-validation and independent temporal evaluation suggests that the gains were not solely attributable to a particular data partition. Spatially structured validation is also important for evaluating the transferability of environmental prediction models under spatial dependence [48]. Furthermore, integrating LPJ with machine learning allows vegetation-related predictors to respond to future climate and atmospheric CO2 scenarios, rather than assuming static vegetation conditions throughout the projection period. This approach is consistent with the growing use of dynamic vegetation information in assessments of ecosystem responses to future climate change [15,61]. It also complements existing fire prediction frameworks that combine vegetation characteristics, meteorological information, and machine learning [67], while specifically quantifying the contribution of LPJ-derived fuel-related predictors across different forest regions and types. Regional SHAP and partial dependence analyses further indicate that the same prediction model can exhibit different responses across forest environments, highlighting the importance of regional environmental context. Nevertheless, improved prediction performance does not establish the causal contributions of individual fuel components, which should be interpreted as fuel-related proxies rather than direct measurements of combustible fuel availability.
Nevertheless, this study has certain limitations. First, spatial resolution, sampling, and fuel representation may introduce uncertainty. Resampling 0.5° LPJ outputs and finer-resolution topographic and socioeconomic data to a 0.1° grid may obscure local spatial variations. Shared coarse-scale fuel information may increase spatial dependence. In addition, LPJ-simulated VegC and observed AGB are not directly equivalent measures of vegetation biomass and carbon storage [15,35], and LitterC lacks independent observational validation. These variables therefore serve as fuel-related proxies rather than direct measurements of available combustible fuel. Second, future projections involve uncertainties associated with climate forcing and model assumptions. VPD was held constant at its historical mean across all future scenarios, while differences among GCMs and potential extrapolation beyond the historical training domain may introduce additional uncertainty into future projections. Third, SHAP-based importance rankings may be affected by sampling variability, and PDP interpretations may be influenced by correlations among predictors and limited observational support at extreme predictor values or rarely observed predictor combinations.
5. Conclusions
This study integrated the LPJ dynamic vegetation model with five machine learning algorithms to evaluate the contribution of fuel-related variables to fire prediction performance across the major forest regions of China. The optimized CatBoost model was further used to examine regional predictor responses and project future fire occurrence under three SSP scenarios. The main conclusions are as follows:
- (1)
- Incorporating dynamic fuel-related variables improved predictive performance across all five machine learning models. The relative improvements generally ranged from 2% to 4% under spatial cross-validation. CatBoost provided a favorable balance among the evaluation metrics and was selected for further analysis.
- (2)
- Predictor importance differed considerably across forest regions and types. In the NEF, LitterC and VPD showed the highest relative importance in coniferous forests, while DEM and LitterC were the two leading predictors in broadleaved forests. In the SWF, DEM and SM were the leading predictors in coniferous and broadleaved forests, respectively. In the SEF, SM ranked first in both forest types. These findings highlight substantial regional and forest-type differences in predictor importance.
- (3)
- Key predictors exhibited nonlinear and region-specific relationships with model predictions. In the NEF, predicted fire occurrence generally increased with increasing LitterC in both forest types and with increasing VPD in coniferous forests. In the SWF and SEF, predicted fire occurrence generally decreased with increasing SM in both forest types. The joint model responses further highlighted regional and forest-type differences in the predictive relationships involving fuel availability, moisture conditions, and other environmental factors.
- (4)
- Future fire-occurrence projections showed pronounced regional differences. The SWF and SEF exhibited overall increases relative to the historical baseline. The SEF showed larger absolute increases, with 74.80–94.01% of its forest area showing increased predictions. In the SWF, the proportion of increasing areas remained relatively stable at approximately 66–69%. In contrast, the NEF showed a decline in regional mean predictions; however, localized increases were still evident, with 8.37–41.60% of its forest area showing projected increases.
Overall, these findings highlight the value of incorporating dynamic fuel information into forest fire prediction and provide insights for identifying priority areas for future forest fire monitoring and management.
Supplementary Materials
The following supporting information can be downloaded at https://www.mdpi.com/article/10.3390/rs18223991/s1, Table S1: Performance of five machine learning models with and without fuel features under five-fold spatial cross-validation; Table S2: Temporal robustness and uncertainty of fuel-induced performance improvements across five machine learning models; Table S3: Hyperparameter search ranges and optimal parameter settings for the CatBoost model.
Author Contributions
M.T.: data curation, methodology, writing—original draft preparation, writing—review & editing. Y.L.: data curation. S.L.: writing—review & editing. B.Z.: formal analysis, visualization. J.T.: data curation, software. G.L.: data curation. Z.Z.: validation, conceptualization. All authors have read and agreed to the published version of the manuscript.
Funding
This paper is financially supported by the Fundamental Research Funds for the Central Universities (grant number B260201949), the National Natural Science Foundation of China (grant number 41971025), and Priority Academic Program Development of Jiangsu Higher Education Institutions (PAPD).
Data Availability Statement
The original contributions presented in this study are included in the article/Supplementary Materials. Further inquiries can be directed to the corresponding author.
Acknowledgments
The authors sincerely thank the Editor and anonymous reviewers for their constructive comments and valuable suggestions, which greatly helped improve the quality of this manuscript. We also gratefully acknowledge the institutions and research teams that provided the remote sensing, meteorological, hydrological, vegetation, and climate model datasets used in this study. Their efforts in collecting, processing, and sharing these datasets are greatly appreciated.
Conflicts of Interest
The authors declare no conflicts of interest.
References
- He, K.; Shen, X.; Anagnostou, E. Global Burn Severity in Forest Ecoregions: Trends, Climate Drivers, and Predictive Insights. npj Nat. Hazards 2025, 2, 61. [Google Scholar] [CrossRef] [Scilit]
- Ellis, T.M.; Bowman, D.M.J.S.; Jain, P.; Flannigan, M.D.; Williamson, G.J. Global Increase in Wildfire Risk Due to Climate-Driven Declines in Fuel Moisture. Glob. Change Biol. 2022, 28, 1544–1559. [Google Scholar] [CrossRef] [Scilit]
- Parisien, M.-A.; Barber, Q.E.; Bourbonnais, M.L.; Daniels, L.D.; Flannigan, M.D.; Gray, R.W.; Hoffman, K.M.; Jain, P.; Stephens, S.L.; Taylor, S.W.; et al. Abrupt, Climate-Induced Increase in Wildfires in British Columbia since the Mid-2000s. Commun. Earth Environ. 2023, 4, 309. [Google Scholar] [CrossRef] [Scilit]
- Deng, H.; Li, D.; Cai, S.; Zhao, F.; Zhao, J. Spatio-Temporal Dynamics of Forest Fire Occurrence in Yunnan, China from 2001 to 2021 Based on MODIS. npj Nat. Hazards 2025, 2, 52. [Google Scholar] [CrossRef] [Scilit]
- Guo, F.; Su, Z.; Wang, G.; Sun, L.; Tigabu, M.; Yang, X.; Hu, H. Understanding Fire Drivers and Relative Impacts in Different Chinese Forest Ecosystems. Sci. Total Environ. 2017, 605–606, 411–425. [Google Scholar] [CrossRef] [Scilit]
- Li, G.; Hai, J.; Qiu, J.; Zhang, D.; Ge, C.; Wang, H.; Wu, J. Revealing Future Changes in China’s Forest Fire under Climate Change. Agric. For. Meteorol. 2025, 371, 110609. [Google Scholar] [CrossRef] [Scilit]
- Iban, M.C.; Sekertekin, A. Machine Learning Based Wildfire Susceptibility Mapping Using Remotely Sensed Fire Data and GIS: A Case Study of Adana and Mersin Provinces, Turkey. Ecol. Inform. 2022, 69, 101647. [Google Scholar] [CrossRef] [Scilit]
- Pang, Y.; Li, Y.; Feng, Z.; Feng, Z.; Zhao, Z.; Chen, S.; Zhang, H. Forest Fire Occurrence Prediction in China Based on Machine Learning Methods. Remote Sens. 2022, 14, 5546. [Google Scholar] [CrossRef] [Scilit]
- Shao, Y.; Fan, G.; Feng, Z.; Sun, L.; Yang, X.; Ma, T.; Li, X.; Fu, H.; Wang, A. Prediction of Forest Fire Occurrence in China under Climate Change Scenarios. J. For. Res. 2023, 34, 1217–1228. [Google Scholar] [CrossRef] [Scilit]
- Eugenio, F.C.; dos Santos, A.R.; Fiedler, N.C.; Ribeiro, G.A.; da Silva, A.G.; dos Santos, Á.B.; Paneto, G.G.; Schettino, V.R. Applying GIS to Develop a Model for Forest Fire Risk: A Case Study in Espírito Santo, Brazil. J. Environ. Manag. 2016, 173, 65–71. [Google Scholar] [CrossRef] [Scilit]
- Sari, F. Forest Fire Susceptibility Mapping via Multi-Criteria Decision Analysis Techniques for Mugla, Turkey: A Comparative Analysis of VIKOR and TOPSIS. For. Ecol. Manag. 2021, 480, 118644. [Google Scholar] [CrossRef] [Scilit]
- Alizadeh, M.R.; Adamowski, J.; Entekhabi, D. Land and Atmosphere Precursors to Fuel Loading, Wildfire Ignition and Post-Fire Recovery. Geophys. Res. Lett. 2024, 51, e2023GL105324. [Google Scholar] [CrossRef] [Scilit]
- Li, Y.; Liu, B.; Veraverbeke, S.; Janssen, T.A.J.; He, B. A Review of Multi-Category Forest Fuel Load Estimation Methods from Traditional Measurements to Remote Sensing and Future Perspectives: Towards Fire Prevention. Remote Sens. Environ. 2026, 343, 115508. [Google Scholar] [CrossRef] [Scilit]
- Rodrigues, M.; Resco de Dios, V.; Sil, Â.; Cunill Camprubí, À.; Fernandes, P.M. VPD-Based Models of Dead Fine Fuel Moisture Provide Best Estimates in a Global Dataset. Agric. For. Meteorol. 2024, 346, 109868. [Google Scholar] [CrossRef] [Scilit]
- Sitch, S.; Smith, B.; Prentice, I.C.; Arneth, A.; Bondeau, A.; Cramer, W.; Kaplan, J.O.; Levis, S.; Lucht, W.; Sykes, M.T.; et al. Evaluation of Ecosystem Dynamics, Plant Geography and Terrestrial Carbon Cycling in the LPJ Dynamic Global Vegetation Model. Glob. Change Biol. 2003, 9, 161–185. [Google Scholar] [CrossRef] [Scilit]
- Bergkvist, J.; Lagergren, F.; Islam, M.R.; Wårlind, D.; Miller, P.A.; Finnander Linderson, M.-L.; Lindeskog, M.; Jönsson, A.M. Quantifying the Impact of Climate Change and Forest Management on Swedish Forest Ecosystems Using the Dynamic Vegetation Model LPJ-GUESS. Earth’s Future 2025, 13, e2024EF004662. [Google Scholar] [CrossRef] [Scilit]
- Krinner, G.; Viovy, N.; de Noblet-Ducoudré, N.; Ogée, J.; Polcher, J.; Friedlingstein, P.; Ciais, P.; Sitch, S.; Prentice, I.C. A Dynamic Global Vegetation Model for Studies of the Coupled Atmosphere-Biosphere System. Glob. Biogeochem. Cycles 2005, 19, GB1015. [Google Scholar] [CrossRef] [Scilit]
- Zhang, Z.; Zhang, W.; Yang, B.; Xie, W.; Tao, C.; Hong, Z.; Xie, Y.; Li, J.; Li, L.; Meng, L. Long-Term Spatiotemporal Characteristics of Meteorological Drought in China from a Three-Dimensional (Longitude, Latitude, Time) Perspective. Int. J. Appl. Earth Obs. Geoinf. 2024, 126, 103633. [Google Scholar] [CrossRef] [Scilit]
- Giglio, L.; Schroeder, W.; Justice, C.O. The Collection 6 MODIS Active Fire Detection Algorithm and Fire Products. Remote Sens. Environ. 2016, 178, 31–41. [Google Scholar] [CrossRef] [Scilit]
- Lian, C.; Li, P.; Feng, Z. Accelerated Reduction in China’s Cropland Fires against the Background of Policy Enhancement. Environ. Impact Assess. Rev. 2024, 106, 107512. [Google Scholar] [CrossRef] [Scilit]
- Lu, J.; Li, M.; Qin, Y.; Chen, N.; Wang, L.; Yang, W.; Song, Y.; Zheng, Y. A Study on Forest Fire Risk Assessment in Jiangxi Province Based on Machine Learning and Geostatistics. Environ. Res. Commun. 2024, 6, 125020. [Google Scholar] [CrossRef] [Scilit]
- Carrasco, J.; Acuna, M.; Miranda, A.; Alfaro, G.; Pais, C.; Weintraub, A. Exploring the Multidimensional Effects of Human Activity and Land Cover on Fire Occurrence for Territorial Planning. J. Environ. Manag. 2021, 297, 113428. [Google Scholar] [CrossRef] [Scilit]
- Reilley, C.; Crandall, M.S.; Kline, J.D.; Kim, J.B.; de Diego, J. The Influence of Socioeconomic Factors on Human Wildfire Ignitions in the Pacific Northwest, USA. Fire 2023, 6, 300. [Google Scholar] [CrossRef] [Scilit]
- Truong, T.X.; Nhu, V.-H.; Phuong, D.T.N.; Nghi, L.T.; Hung, N.N.; Hoa, P.V.; Bui, D.T. A New Approach Based on TensorFlow Deep Neural Networks with ADAM Optimizer and GIS for Spatial Prediction of Forest Fire Danger in Tropical Areas. Remote Sens. 2023, 15, 3458. [Google Scholar] [CrossRef] [Scilit]
- Senande-Rivera, M.; Insua-Costa, D.; Miguez-Macho, G. Spatial and Temporal Expansion of Global Wildland Fire Activity in Response to Climate Change. Nat. Commun. 2022, 13, 1208. [Google Scholar] [CrossRef] [Scilit]
- Cho, Y.; Yoon, J.-H.; Jeong, J.-H.; Kug, J.-S.; Kim, B.-M.; Kim, H.; Park, R.J.; Kim, S.-W. Precipitation-Induced Abrupt Decrease of Siberian Wildfire in Summer 2022 under Continued Warming. Environ. Res. Lett. 2024, 19, 074037. [Google Scholar] [CrossRef] [Scilit]
- Jain, P.; Castellanos-Acuna, D.; Coogan, S.C.P.; Abatzoglou, J.T.; Flannigan, M.D. Observed Increases in Extreme Fire Weather Driven by Atmospheric Humidity and Temperature. Nat. Clim. Change 2022, 12, 63–70. [Google Scholar] [CrossRef] [Scilit]
- Feng, S.; Zscheischler, J.; Hao, Z.; Bevacqua, E. Growing Human-Induced Climate Change Fingerprint in Regional Weekly Fire Extremes. npj Clim. Atmos. Sci. 2025, 8, 152. [Google Scholar] [CrossRef] [Scilit]
- Jain, P.; Barber, Q.E.; Taylor, S.W.; Whitman, E.; Castellanos Acuna, D.; Boulanger, Y.; Chavardès, R.D.; Chen, J.; Englefield, P.; Flannigan, M.; et al. Drivers and Impacts of the Record-Breaking 2023 Wildfire Season in Canada. Nat. Commun. 2024, 15, 6764. [Google Scholar] [CrossRef] [Scilit]
- Luo, B.; Luo, D.; Dai, A.; Xiao, C.; Simmonds, I.; Hanna, E.; Overland, J.; Shi, J.; Chen, X.; Yao, Y.; et al. Rapid Summer Russian Arctic Sea-Ice Loss Enhances the Risk of Recent Eastern Siberian Wildfires. Nat. Commun. 2024, 15, 5399. [Google Scholar] [CrossRef] [Scilit]
- Jiang, W.; Qiao, Y.; Zheng, X.; Zhou, J.; Jiang, J.; Meng, Q.; Su, G.; Zhong, S.; Wang, F. Wildfire Risk Assessment Using Deep Learning in Guangdong Province, China. Int. J. Appl. Earth Obs. Geoinf. 2024, 128, 103750. [Google Scholar] [CrossRef] [Scilit]
- Sharma, S.; Dhakal, K. Boots on the Ground and Eyes in the Sky: A Perspective on Estimating Fire Danger from Soil Moisture Content. Fire 2021, 4, 45. [Google Scholar] [CrossRef] [Scilit]
- Kanwal, R.; Rafaqat, W.; Iqbal, M.; Weiguo, S. Data-Driven Approaches for Wildfire Mapping and Prediction Assessment Using a Convolutional Neural Network (CNN). Remote Sens. 2023, 15, 5099. [Google Scholar] [CrossRef] [Scilit]
- Zhang, G.; Zhang, L.; Li, X.; Feng, X.; Wang, Y.; Guo, J.; Li, P.; Wei, X. Spatiotemporal Evolution Characteristics and Driving Mechanisms of Wildfires in China under the Context of Climate Change and Human Activities. Ecol. Indic. 2025, 176, 113694. [Google Scholar] [CrossRef] [Scilit]
- Cai, Y.; Zhu, P.; Li, X.; Liu, X.; Chen, Y.; Shen, Q.; Xu, X.; Zhang, H.; Nie, S.; Wang, C.; et al. Dynamics of China’s Forest Carbon Storage: The First 30m Annual Aboveground Biomass Mapping from 1985 to 2023. Earth Syst. Sci. Data 2025, 17, 6993–7018. [Google Scholar] [CrossRef] [Scilit]
- Myneni, R.; Knyazikhin, Y.; Park, T. MODIS/Terra Leaf Area Index/FPAR 8-Day L4 Global 500m SIN Grid V061; NASA Earthdata: Washington, DC, USA, 2021.
- Harris, I.; Osborn, T.J.; Jones, P.; Lister, D. Version 4 of the CRU TS Monthly High-Resolution Gridded Multivariate Climate Dataset. Sci. Data 2020, 7, 109. [Google Scholar] [CrossRef] [Scilit]
- Cheng, W.; Dan, L.; Deng, X.; Feng, J.; Wang, Y.; Peng, J.; Tian, J.; Qi, W.; Liu, Z.; Zheng, X.; et al. Global Monthly Gridded Atmospheric Carbon Dioxide Concentrations under the Historical and Future Scenarios. Sci. Data 2022, 9, 83. [Google Scholar] [CrossRef] [Scilit]
- Tian, J.; Zhang, Z.; Fu, Y.; Tao, H.; Zhu, B.; Yang, L. Does CMIP6 Inspire More Confidence in Projecting Precipitation over China? Int. J. Climatol. 2023, 43, 4965–4986. [Google Scholar] [CrossRef] [Scilit]
- Zhang, Y.; Hu, X.; Zhang, Z.; Kong, R.; Peng, Z.; Zhang, Q.; Chen, X. The Increasing Risk of Future Simultaneous Droughts over the Yangtze River Basin Based on CMIP6 Models. Stoch. Environ. Res. Risk Assess. 2023, 37, 2577–2601. [Google Scholar] [CrossRef] [Scilit]
- Zhang, Q.; Miao, C.; Su, J.; Gou, J.; Hu, J.; Zhao, X.; Xu, Y. A New High-Resolution Multi-Drought-Index Dataset for Mainland China. Earth Syst. Sci. Data 2025, 17, 837–853. [Google Scholar] [CrossRef] [Scilit]
- Liu, L.; Cao, X.; Li, S.; Jie, N. A 31-Year (1990–2020) Global Gridded Population Dataset Generated by Cluster Analysis and Statistical Learning. Sci. Data 2024, 11, 124. [Google Scholar] [CrossRef] [Scilit]
- Fu, Y.; Li, W.; Niu, Z.; Chen, F.; Zhang, B.; Qiao, H.; Wang, L.; Svenning, J.-C. Enhanced Forest Carbon Gains from Stronger Protection in China’s Protected Areas. Nat. Commun. 2026, 17, 2609. [Google Scholar] [CrossRef] [Scilit]
- Schaphoff, S.; von Bloh, W.; Rammig, A.; Thonicke, K.; Biemans, H.; Forkel, M.; Gerten, D.; Heinke, J.; Jägermeyr, J.; Knauer, J.; et al. LPJmL4—A Dynamic Global Vegetation Model with Managed Land—Part 1: Model Description. Geosci. Model. Dev. 2018, 11, 1343–1375. [Google Scholar] [CrossRef] [Scilit]
- VanDerWal, J.; Shoo, L.P.; Graham, C.; Williams, S.E. Selecting Pseudo-Absence Data for Presence-Only Distribution Modeling: How Far Should You Stray from What You Know? Ecol. Model. 2009, 220, 589–594. [Google Scholar] [CrossRef] [Scilit]
- Barbet-Massin, M.; Jiguet, F.; Albert, C.H.; Thuiller, W. Selecting Pseudo-absences for Species Distribution Models: How, Where and How Many? Methods Ecol. Evol. 2012, 3, 327–338. [Google Scholar] [CrossRef] [Scilit]
- Sloan, S.; Locatelli, B.; Andela, N.; Cattau, M.E.; Gaveau, D.; Tacconi, L. Declining Severe Fire Activity on Managed Lands in Equatorial Asia. Commun. Earth Environ. 2022, 3, 207. [Google Scholar] [CrossRef] [Scilit]
- Valavi, R.; Elith, J.; Lahoz-Monfort, J.J.; Guillera-Arroita, G. BLOCK CV: An R Package for Generating Spatially or Environmentally Separated Folds for k-fold Cross-validation of Species Distribution Models. Methods Ecol. Evol. 2019, 10, 225–232. [Google Scholar] [CrossRef] [Scilit]
- Bustillo Sánchez, M.; Tonini, M.; Mapelli, A.; Fiorucci, P. Spatial Assessment of Wildfires Susceptibility in Santa Cruz (Bolivia) Using Random Forest. Geosciences 2021, 11, 224. [Google Scholar] [CrossRef] [Scilit]
- Chen, T.; Guestrin, C. XGBoost: A Scalable Tree Boosting System. In Proceedings of the 22nd ACM SIGKDD International Conference on Knowledge Discovery and Data Mining, San Francisco, CA, USA, 13–17 August 2016; ACM: New York, NY, USA, 2016; pp. 785–794. [Google Scholar] [CrossRef] [Scilit]
- Hancock, J.T.; Khoshgoftaar, T.M. CatBoost for Big Data: An Interdisciplinary Review. J. Big Data 2020, 7, 94. [Google Scholar] [CrossRef] [Scilit]
- Bentéjac, C.; Csörgő, A.; Martínez-Muñoz, G. A comparative analysis of gradient boosting algorithms. Artif. Intell. Rev. 2021, 54, 1937–1967. [Google Scholar] [CrossRef] [Scilit]
- Breiman, L. Random Forests. Mach. Learn. 2001, 45, 5–32. [Google Scholar] [CrossRef] [Scilit]
- Rumelhart, D.E.; Hinton, G.E.; Williams, R.J. Learning Representations by Back-Propagating Errors. Nature 1986, 323, 533–536. [Google Scholar] [CrossRef] [Scilit]
- Preisler, H.K.; Brillinger, D.R.; Burgan, R.E.; Benoit, J.W. Probability Based Models for Estimation of Wildfire Risk. Int. J. Wildland Fire 2004, 13, 133–142. [Google Scholar] [CrossRef] [Scilit]
- Shapley, L.S. Stochastic Games. Proc. Natl. Acad. Sci. USA 1953, 39, 1095–1100. [Google Scholar] [CrossRef] [Scilit]
- Zahura, F.T.; Bisht, G.; Li, Z.; McKnight, S.; Chen, X. Impact of Topography and Climate on Post-Fire Vegetation Recovery across Different Burn Severity and Land Cover Types through Random Forest. Ecol. Inform. 2024, 82, 102757. [Google Scholar] [CrossRef] [Scilit]
- Friedman, J.H. Greedy Function Approximation: A Gradient Boosting Machine. Ann. Stat. 2001, 29, 1189–1232. [Google Scholar] [CrossRef] [Scilit]
- Fernandes, R.; Leblanc, S.G. Parametric (Modified Least Squares) and Non-Parametric (Theil–Sen) Linear Regressions for Predicting Biophysical Parameters in the Presence of Measurement Errors. Remote Sens. Environ. 2005, 95, 303–316. [Google Scholar] [CrossRef] [Scilit]
- Juhl, T.; Xiao, Z. A Nonparametric Test for Changing Trends. J. Econom. 2005, 127, 179–199. [Google Scholar] [CrossRef] [Scilit]
- Kong, R.; Zhang, Z.; Huang, R.; Tian, J.; Feng, R.; Chen, X. Projected Global Warming-Induced Terrestrial Ecosystem Carbon across China under SSP Scenarios. Ecol. Indic. 2022, 139, 108963. [Google Scholar] [CrossRef] [Scilit]
- Zhu, B.; Zhang, Z.; Kong, R.; Wang, M.; Li, G.; Sui, X.; Tao, H. Future Reductions in Suitable Habitat for Key Tree Species Result in Declining Boreal Forest Aboveground Biomass Carbon in China. Forests 2023, 14, 2053. [Google Scholar] [CrossRef] [Scilit]
- Kelley, D.I.; Bistinas, I.; Whitley, R.; Burton, C.; Marthews, T.R.; Dong, N. How Contemporary Bioclimatic and Human Controls Change Global Fire Regimes. Nat. Clim. Change 2019, 9, 690–696. [Google Scholar] [CrossRef] [Scilit]
- Jones, M.W.; Abatzoglou, J.T.; Veraverbeke, S.; Andela, N.; Lasslop, G.; Forkel, M.; Smith, A.J.P.; Burton, C.; Betts, R.A.; van der Werf, G.R.; et al. Global and Regional Trends and Drivers of Fire Under Climate Change. Rev. Geophys. 2022, 60, e2020RG000726. [Google Scholar] [CrossRef] [Scilit]
- Shao, Y.-K.; Li, W.-K.; Wang, M.-Y.; Du, Q.-Y.; Wang, J.; Shu, L.-F.; Si, L.-Q.; Zhao, F.-J.; Feng, Z.-K.; Sun, L.-H.; et al. Optimising Future Scenarios of Forest Fire Occurrence in Daxing’anling Using Long-Term Survey Data and Intelligent Modelling. Adv. Clim. Change Res. 2026, 17, 388–399. [Google Scholar] [CrossRef] [Scilit]
- Abatzoglou, J.T.; Battisti, D.S.; Williams, A.P.; Hansen, W.D.; Harvey, B.J.; Kolden, C.A. Projected Increases in Western US Forest Fire despite Growing Fuel Constraints. Commun. Earth Environ. 2021, 2, 227. [Google Scholar] [CrossRef] [Scilit]
- McNorton, J.R.; Di Giuseppe, F.; Pinnington, E.; Chantry, M.; Barnard, C. A Global Probability-Of-Fire (PoF) Forecast. Geophys. Res. Lett. 2024, 51, e2023GL107929. [Google Scholar] [CrossRef] [Scilit]

Disclaimer/Publisher’s Note: The statements, opinions and data contained in all publications are solely those of the individual author(s) and contributor(s) and not of MDPI and/or the editor(s). MDPI and/or the editor(s) disclaim responsibility for any injury to people or property resulting from any ideas, methods, instructions or products referred to in the content. |
© 2026 by the authors. Licensee MDPI, Basel, Switzerland. This article is an open access article distributed under the terms and conditions of the Creative Commons Attribution (CC BY) license.