


Highlights
- •
- Radar- and lightning-based methods show comparable sensitivity to confirmed hail events, while their combined application identifies 93.5% of the confirmed hail events.
- •
- Very large hail events show more persistent and more intense lightning activity than large hail events.
- •
- The intensity of the hail lightning jump strongly increases for very large hail.
- •
- Lightning-derived indicators provide useful real-time information on hailstorm evolution and potential hail severity.
Abstract
Recent studies indicate an increasing frequency of hailstorms in the Mediterranean region, strengthening the need for improved monitoring and detection methods due to their impacts on human safety and socio-economic activities. This study proposes a real-time method for hail diagnosis in thunderstorms based on the joint use of X-band weather radars and lightning measurements. The approach integrates the Vertically Integrated Liquid Density (VILD) algorithm with a new version of the lightning jump algorithm (hail lightning jump), relating hail growth mechanisms to VILD maxima and lightning-derived variables. Hail reports were used to classify hailstorm severity and link hail occurrence with radar and lightning variables. The 31 confirmed hailstorms examined in Southern Italy show comparable sensitivity of the radar- and lightning-based methods, which identify 80.6% and 77.4% of the events, respectively. When combined using a logical “OR” configuration, the fraction of identified hail events increases to 93.5%. Lightning-based analysis over the Italian Peninsula shows higher lightning activity for very large hail events (≥5 cm) than for large hail cases (2–5 cm). A strong positive correlation between maximum hail size and lightning activity was also found. These results highlight the benefits of a combined approach and the crucial role of lightning activity in diagnosing hail formation and size in thunderstorms.
1. Introduction
In recent decades, hailstorms have gradually increased both in frequency and intensity in the Mediterranean region [1]. Hail damage depends on the hail size, the number of hailstones per unit area and the mean winds affecting the hail falling and has been examined in different parts of the world [2]. It is rarely associated with loss of human lives but, more frequently, prevention and financial compensation systems are developed against the adverse effects of hail [3,4]. For these reasons, investigating the possible presence of hail in thunderstorms and understanding the intensity of these storms may produce crucial social and economic benefits. Weather radars appear to be invaluable instruments for achieving these goals, thanks to their ability to provide key information to infer the severity of convective clouds. In many studies, radar data have been reprocessed together with hail ground observations, leading to new hail distribution maps and new hail climatologies (e.g., [5,6,7,8,9,10]). In addition, frequencies such as X, C and S-bands were explored and tested to compare the different radar performances in hail diagnosis [9,11,12,13,14]. In recent decades, several techniques based on single-polarization systems have also been proposed. Such methods rely on some features in horizontally-polarized reflectivity measurements that can be used as proxies of the physical processes connected to hail growth [15,16,17,18,19]. Many works present results in terms of hail probability obtained by the Vertically Integrated Liquid Density (VILD) algorithm that was proposed by Amburn and Wolf [20]. The working principle of the VILD method has been explored in detail in different parts of the world, and it has been widely used for hailstorm detection with very good outcomes (e.g., [19,21,22,23,24,25,26,27]). Nowadays, the most innovative approaches developed to distinguish between raindrops and hailstones take advantage of dual-polarization weather radar features, which allow to detect hail precipitation and to better explore features and morphological characteristics of hail clouds through the differential reflectivity and other polarimetric parameters (e.g., [14,28,29]). Moreover, hail and damage reports can be used to link radar variables to the effects of hailstorms at the ground. These reports show that average values of the radar parameters increase as hail diameter grows [23]. However, the radar-based hail detection can be affected by some common range-dependent and systematic errors that may locally introduce relevant uncertainties in the estimation of hail risk. Also, Murillo et al. [10] state that hail climatologies based on radar observations alone are insufficient for reproducing the broad characteristics of hail report distributions. For these reasons, algorithms based on a proper merge between radar data and other meteorological measurements, such as in situ and atmospheric sounding data, could help to overcome these limitations [30,31].
In this study, we propose a new combined method that incorporates radar data and several lightning characteristics for severe hail identification. Recently, in fact, the relationship between lightning activity and very large hail has been explored in the Italian territory obtaining very interesting results [32]. Some previous works stated that the hailstorm’s severity is well correlated to the rate of flashing during the hailfall (e.g., [33]) and that most thunderstorms have peaks in lightning flash rate that occur at or near the plowable hail report times [34]. From the physical point of view, lightning strikes can be considered a proxy for hail formation, since graupel particles play a crucial role during the electrification process in hailstorms (e.g., [35,36]). Previous investigations about lightning activity during the life cycle of hailstorms revealed that total lightning is the best indicator to recognize the intensification of storms [37]. Indeed, total lightning and lightning densities are several times more active in hailstorms than ordinary thunderstorms [38,39], and the probability of lightning occurrence is much higher in convective rain regions than in the stratiform ones [40]. In addition, large and rapid increases in lightning flash rates, termed “lightning jumps” by Williams et al. [41], indicate the growth of a storm; however, it should be noted that level or decreasing strokes do not necessarily imply that thunderstorms are in steady state or weakening [42]. Since lightning jumps have been observed to occur as severe weather manifests within the storm, these outcomes lead to the development of several lightning jump algorithms [37,39,43,44,45,46,47,48,49,50,51,52] used to diagnose possible severe weather manifestations such as large hail, strong wind gusts, heavy rainfall, tornadoes and flash floods. Farnell et al. [48] introduced a modified lightning jump algorithm, in which the identification of storm cells was solely based on total lightning data, without radar data. This innovative concept has also been implemented in Vermi et al. [32]. Links between lightning jumps and updraft intensification have been confirmed by Gatlin and Goodman [44] and Schultz et al. [53], while Chronis et al. [47] reported that, when at least one lightning jump is detected, storms last longer and are better related to maximum hail size expected, Vertically Integrated Liquid and lightning flash rates. Also, the authors determined that stronger jumps imply more time until storm decay, but a clear relationship between the maximum hail diameter and the number of lightning jumps has never been observed [49]. Consequently, the algorithms related to the total lightning and lightning jumps may be used as hailfall nowcasting predictors, especially considering lead times obtained between lightning jump detection and severe weather occurrence. Indeed, almost all above-mentioned studies state that the average lead times range typically from 10 to 40 min (e.g., [39,43,44,45,50]), but lightning jumps can be detected up to 120 min before and 30 min after severe weather observations (e.g., [48,49,54]). Moreover, lightning jump algorithms based on total lightning outperform the corresponding cloud-to-ground algorithms, showing further improved lead times (e.g., [37,46]).
In this work, we introduce a combined method for integrating lightning data into the radar-based hail detection algorithm developed by Capozzi et al. [26] in the framework of “Campania Region Meteorological Radar Network” (hereafter, CARMEN). Starting from results obtained by Capozzi et al. [26], the main goal of this study is to support the radar hail detection tool by adding the information provided by lightning activity, in order to better discriminate evolving hailstorms. To achieve this purpose, we investigated 31 case studies that occurred in the Campania Region (Southern Italy) and surrounding areas in which large hail or very large hail (maximum diameter of the hailstones ≥ 2 cm or ≥5 cm, respectively) has been detected. The present study therefore adopts an event-based approach, focusing on independently confirmed hail-producing thunderstorms to investigate the sensitivity and complementarity of radar- and lightning-based indicators during hailstorm evolution, rather than to perform a complete binary hail/no-hail verification. In the second part of this work, we will discuss some features of lightning activity that could help to infer the potential maximum diameter of the hailstones. Since these trends are based on lightning activity and are mainly found during the initial development of the hailstorms, these preliminary findings may represent an important outcome for predictors of hail diagnosis in thunderstorms.
The organization of this work is the following: Section 2 presents the study area and describes types of data analyzed (hail reports, radar and lightning strikes) and the corresponding methodologies applied. In Section 3, by comparing two methods derived from radar and lightning data, we will show how lightning features can support the CARMEN project in identifying and tracking the hailstorms. After that, the potential relationship between some lightning variables and the maximum hail diameter will be discussed. Finally, the main conclusions of this work will be provided in Section 4.
2. Materials and Methods
2.1. Study Area
In this work, the combined method involving hail reports, radar and lightning data has been tested on the Campania Region (Southern Italy) and adjacent areas within a geographical domain starting from 40.10°N to 41.50°N in latitude and from 13.60°E to 15.80°E in longitude, as shown in the zoomed area in Figure 1. This territory is characterized by a diversified morphology that rapidly changes: the coastline and main inland sectors on the western side of the region are opposed to the Apennine ridge, which is located on the eastern side. The latter occupies a large part of the region and stands out for a complex orography in which Mount Miletto (red triangle in the zoomed map) reaches the highest elevation, i.e., 2050 m above sea level (hereafter, m asl) in the northern sector, but many other mountain chains exceed 1400–1500 m asl. These morphological features impede radar data measurements, reducing their quality in terms of reliability and spatial coverage. For these reasons, the introduction of lightning activity may support the radar hail detection tool, given that lightning detection is generally independent of altitude itself and, only for localized areas, lightning activity is positively correlated with the elevation slope [55,56].
Figure 1.
Geographical setting of the study area. In the upper panel, the Campania Region is highlighted by the red box within the Mediterranean basin. The lower panel shows the study domain topography, defined in terms of latitudinal and longitudinal extent (Image credit: QGIS Development Team (2025). QGIS Geographic Information System (Version 3.44.6). Open-Source Geospatial Foundation Project. http://qgis.org (accessed on 20 March 2026)).
2.2. Hail Reports
Hail reports are fundamental to confirm the occurrence of hail at a given location and have been crucial to build up several hail climatologies all over the world. Indeed, thanks to this information, it is possible to classify the hailstorms and to understand how they are born and develop, considering the entire lifecycle of these systems. On the other hand, we must take into account that hail reports are strongly dependent on population density, and sometimes hail phenomena can be greatly underestimated or totally missed [9,57,58,59,60,61,62,63,64,65,66,67]. In this work, we used two networks to select 39 large (hail diameter between 2 and 5 cm) and very large (hail size equal to or greater than 5 cm) hail reports in the Campania Region from 2018 to 2023 (a detailed table about hail observations used in this study has been provided in Appendix A). Most of them (35/39) belong to the European Severe Storm Laboratory’s European Severe Weather Database [68], which is the first European database containing many different severe weather observations, including large hail reports (maximum hail diameter ≥ 2.0 cm). In the European Severe Weather Database (hereafter, ESWD), for each hail observation, date, time, latitude, longitude, maximum hail size (cm), pictures, newspaper articles or posts on social media are provided [69]. All reports are classified using four quality-control levels:
- •
- QC0 (“as received”);
- •
- QC0+ (“plausibility check passed”);
- •
- QC1 (“report confirmed by reliable source”);
- •
- QC2 (“scientific case study”).
In the study area considered, from 1 January 2018 to 31 December 2023, the total number of hail observations provided by ESWD is equal to 96. We discarded 61/96 (63.5%) hail reports for several reasons:
- •
- A total of 40/96 (41.7%) because radar data were unavailable.
- •
- A total of 13/96 (13.5%) due to the lack of maximum hail diameter information.
- •
- A total of 7/96 (7.3%) since we decided to reject QC0 and QC0+ data (e.g., [70]).
- •
- A total of 1/96 (1.0%) had a temporal uncertainty exceeding ± 30 min.
Secondly, 4/39 hail observations were recorded by the local meteorological community “Campanialive” [71], which is a regional network in which users can upload pictures, comments or news about weather phenomena that occurred in this territory. Considering the high variability of population density in Campania Region, this local network is particularly useful to provide information on hailstorms in remote areas. Sometimes, a single hail event can be described by several hail observations, increasing the information about the trajectories and the size of the hail. Overall, using this dataset, the 39 hail reports selected for this work showed the occurrence of 31 separate hailstorms, which will be discussed in the next Section.
2.3. Radar and Lightning Data
Radar data used in this study are provided by two single-polarization X-band weather radars (Figure 2) located in Naples urban area, at the top of Castel Sant’Elmo (40.8433°N, 14.2385°E; 280 m asl, approaching the coastline) and in Trevico (41.0522°N, 15.2357°E; 1050 m asl, eastern sector of the Campania Region) that together make up the CARMEN project hail detection tool. These systems, named WR-10X and manufactured by ELDES srl (Scandicci (Firenze), Italy), ensure some advantages such as low power consumption (<300 W on average), low weight (about 100 kg) and minor costs of installation and maintenance with respect to typical S and C-band instruments. Radars are synchronized in time, producing a scan every 10 min characterized by a spatial resolution of 450 m, an azimuth resolution equal to 1.0° and a maximum available range of 108 km. The only difference between the two radars is the elevation scanning mode, since the Trevico radar performs the scan exploiting nine different elevations (1, 2, 3, 4, 5, 7.5, 10, 12.5 and 15°), while the Naples radar adds a 20° elevation. In some areas, especially between Naples and Trevico, the radar beams may overlap (as visible by the light circles in Figure 2): in this case, the highest reflectivity measurement coming from the two instruments has been considered. However, a known problem for X-weather radar beams is attenuation of the radar signal as it passes through heavy rain and hail cells. During radar data processing, the impact of the attenuation issue was quantified and mitigated through the two-way path integrated attenuation (PIA) algorithm, along the entire beam path [72]. Indeed, sensitivity analyses revealed that the incidence of attenuation on the performance of X-band weather radars was not so relevant to score values [19]. Also, the presence of several mountains in the region affects reflectivity measurements, highlighting the beam blocking issue: in this case, the correction scheme includes the topography, the radar beam cross section and the percentage of the radar beam cross section shielded, as proposed by [73].
Figure 2.
Red dots indicate the X-band weather radars’ locations throughout the Campania Region. The light circle surrounding red dots shows the maximum spatial coverage (108 km) of the two instruments (Image credit: Base map: Google Satellite via QuickMapServices, © Google, https://earth.google.com (accessed on 15 January 2026)).
Further technical details about the development of a radar composite product are provided by [19,26]. In the framework of the CARMEN project, the probability of hail results from the Vertically Integrated Liquid Density (VILD) algorithm [20].
The VILD parameter, expressed in g m−3, can be defined as the ratio between the Vertically Integrated Liquid (VIL; [74]) and the EchoTop in Equation (1):
where VIL (expressed in kg·m−2) is computed through the vertical integral of the horizontal reflectivity (Zh) within the atmospheric column, while the EchoTop (expressed in m) is the maximum altitude at which a significant radar reflectivity has been detected. According to these previous studies, VILD can be considered a more homogeneous parameter for the identification of hailstorms, thanks to the normalization with respect to the vertical extension of the thunderstorms. It is important to emphasize that the VILD method adopted in this study was previously derived and evaluated using an independent dataset including both hail- and non-hail-producing thunderstorms [19,26], and was not optimized on the hail cases analyzed here. More specifically, in [19] the performance of the VILD method was evaluated using 53 case studies that occurred over the Campania Region between April 2012 and June 2015. Based on a scatterplot analysis of Vertically Integrated Liquid and EchoTop height ([26], their Figure 5), three VILD threshold values (2.0, 2.4, and 3.0 g m−3) were tested to discriminate between hail- and non-hail-producing storms. The optimal threshold was identified as 2.4 g m−3, yielding the following results:
- •
- A total of 33/34 hail cases were correctly classified as hailstorms.
- •
- A total of 11/19 convective events (only heavy rainfall) were falsely detected as hail-producing.
Using this threshold, the VILD method correctly identified almost all hail case studies but, on the other hand, more than half of non-hail-producing events were misclassified. For this reason, in this work it was decided to support the CARMEN project hail detection tool with additional information (i.e., lightning activity and related variables), in order to improve the identification and tracking of the hailstorms. In the same way, the VILD threshold value equal to 2.4 g m−3 was used in this study to diagnose hail in 31 thunderstorms that occurred in the Campania Region and surrounding areas from 2018 to 2023. Using one or more hail ground observations available for each hail event, the VILD pattern (which directly depends on the horizontal reflectivity Zh) has been analyzed. More specifically, starting from the hail report, the associated hail-producing storm cell is identified and tracked backward in time to the first radar scan exhibiting VILD values greater than 0 g m−3. Once identified, the storm is enclosed at each scan within a variable-size box, adjusted to its spatial extent. This procedure allows reconstruction of the complete storm lifecycle, from initiation to dissipation, by analyzing successive 10 min scans and computing the maximum VILD value characterizing each hailstorm. To classify a storm cell as a hailstorm, the VILD threshold value equal to 2.4 g m−3 must be exceeded within 10 km of the hail report geolocation. Otherwise, the storm system will be labelled as an ordinary thunderstorm without producing hail, even if VILD values higher than 2.4 g m−3 are measured at a distance greater than 10 km [26].
The Meteorological Service of the National Air Force manages the Italian lightning detection network LAMPINET, which consists of 15 sensors that provide lightning data in the Italian territory both on the sea and on the inlands. LAMPINET antennas’ bandwidth is 1–350 kHz (containing low- and very low-frequency emissions), an optimal frequency range especially for measuring cloud-to-ground (CG) strokes. Consequently, the detection efficiency for CG lightning strikes reaches 90%, while it decreases to about 30% for intra-cloud (IC) flashes [75,76]. However, IC flashes are predominant in thunderstorms [77] and, especially during the development of hailstorms, the IC/CG ratio can reach values even close to 400 [78]. Thus, since the low IC DE makes it challenging to analyze lightning strikes in terms of absolute values, we decided to focus mostly on lightning activity and trends. For each stroke, time, latitude, longitude, type (IC or CG), polarity and electric field values are reported, with a spatial resolution of about 500 m and a temporal resolution of 1 s. Firstly, radar and lightning data have been synchronized in time, aggregating strokes in 10 min files in order to have an output comparable with scans performed by X-band weather radars. Subsequently, we remap lightning data using a regular grid to ease the stroke count and, employing the same methodology proposed for computing the VILD maximum value, we apply a box surrounding the distribution of lightning strikes related to the investigated hailstorm. The box size and location are the same as those used to analyze the VILD pattern, even if small differences can occur due to the different distribution of the two variables. For lightning analysis, the same spatial box is used to count the total number of lightning strokes produced by the hailstorm within each 10 min interval. This quantity, hereafter referred to as total lightning (TL), is computed for the entire duration of the storm (an example of this procedure is provided in Section S1 of Supplementary Materials).
Using the total lightning data, we can introduce the lightning jump computation. As explained in Section 1, lightning jump detection has been widely used in many previous works for the determination of severe weather manifestations (e.g., heavy rain, large hail, severe wind gusts, tornadoes, flash floods, etc.), and many algorithms have been proposed on this topic. In this work, we adapted the method introduced by Vermi et al. [32], which exclusively focuses on the hail formation mechanism, with the final aim of diagnosing hail in thunderstorms. The hail process has been recently reviewed by Allen et al. [62] and Kim et al. [4], who state that hail formation and growth require condensation nuclei, supercooled water droplets and sufficient growth time. Considering the microphysical time scale, the hail growth period lasts at least 10–15 min [79], while Brimelow et al. [80] affirm that, when simulating the hail growth history by models, hailstones can reach the ground even after 60 min, depending on the trajectories and on the slow and fast growth regimes experienced.
For our aims, since this work concentrates on large and very large hail, it is useful to analyze the variations in lightning activity by adapting and enlarging the classical lightning jump temporal window, according to the time needed for the hail growth mechanism. The idea behind this type of approach regards the research of potential relationships between lightning activity and the size of the hailstones developing in thunderclouds. For these reasons, in this work, we decided to introduce the computation of a lightning jump related to the hail formation mechanism in thunderstorms, i.e., “Hail Lightning Jump” (hereafter, HLJ), through Equations (2)–(4):
where HLJ is defined as the ratio between the TL measured at time t (TLt) and the TL recorded 20, 30 or 40 min before (TLt−20, TLt−30 and TLt−40), respectively. After applying these formulations, an HLJ is valid only when the TLt is equal to or greater than 20 flashes: it means that, on average, the minimum lightning rate considered to calculate HLJ is equal to 2 per minute. This threshold is quite low, especially if compared with previous studies (e.g., [43]), but it should be taken into account that LAMPINET network detection efficiency reaches only 30% for IC strokes, justifying the use of such a threshold. In addition, the operative frequency range of LAMPINET sensors (1–350 kHz) is lower than that of other lightning detection networks, leading to a smaller TL measured under the same conditions. The second important threshold concerns the denominator (i.e., TLt−20; TLt−30; TLt−40) of Equations (2)–(4): indeed, when TL is above 20, but the denominator is very low or even equal to 0, it can result in a very high but insignificant HLJ. To overcome this problem, we decided to set the denominator equal to 10, even when its value is between 0 and 9. This normalization is valid throughout the whole duration of the hailstorm, but it is particularly useful to highlight potential jumps occurring in the initial stage of the storm that, otherwise, would be lost. Consequently, the minimum HLJ value that is possible to calculate is HLJi = 20/10 = 2.0. Accordingly, the HLJ threshold of 2.0 directly follows from the algorithm formulation and was defined a priori, rather than being optimized on the 31 hail cases analyzed in this study (see Section S1 of Supplementary Materials for HLJ series computation details). HLJ series computation allows us to introduce two new variables related to lightning activity:
- •
- Number of hail lightning jumps (NHLJ): number of times that, in each HLJ series, the HLJ value is equal to or higher than 2.0;
- •
- Intensity of the strongest hail lightning jump (ISHLJ): the HLJ that reaches the maximum value in each HLJ series.
After computing the three HLJ series, a single series is selected to represent the lightning activity and the associated variables (NHLJ and ISHLJ) for each case study. Since we are interested in studying abrupt increases in TL (i.e., hail lightning jumps) potentially related to developing hailstorms, we decided to use the HLJ series that reaches the highest ISHLJ.
At the same time, lightning activity could be analyzed by calculating other HLJ series, for instance, considering a time difference of 10 or 50 min (i.e., HLJ10 or HLJ50) or even shorter or longer. However, Vermi et al. [32] found that the ISHLJ found in HLJ10 series is constantly lower when compared to Equation (2), Equation (3) and Equation (4) representing only partially jumps produced by lightning activity. On the other hand, enlarging the temporal window too much (HLJ50 or more) does not take into account the dynamic evolution of strokes: in this way, a large part of HLJ values is simply obtained by normalizing the TL by 10, without adding anything to the information already provided by TL itself.
Lead time (hereafter, LT) is the last variable we decided to investigate in order to understand if hailstorms can be detected in advance using lightning activity (see Section S1 of Supplementary Materials for NHLJ, ISHLJ and LT computation details). LT is defined as the time difference (in minutes) between the first hail report observed and the first HLJ measured (i.e., HLJ ≥ 2.0) in the HLJ series. It follows that LT will be:
- •
- Positive, when HLJ advances the hail report.
- •
- Equal to 0, when HLJ and the hail observation are coincident.
- •
- Negative, when HLJ is late compared to the time of hail detection.
Since radar and lightning data are compared every 10 min, we decided to calculate LT only if the temporal uncertainty of the first hail report does not exceed ±15 min. This last criterion avoids including in results and conclusions inaccurate lead times, characterized by a large uncertainty.
2.4. Very Large Hail Dataset
In the second part of the next Section (i.e., Section 3.2), we will discuss the behaviour and possible trends of lightning activity found for large hail and very large hail classes, analyzing them with the HLJ methodology proposed in the previous paragraph. Very large hail events are associated with a substantially increased risk of injuries and damage to vehicles and buildings; although their frequency is relatively low [1,59,70], understanding their dynamics is crucial to mitigate societal and economic impacts. As expected, within the dataset of 31 case studies analyzed over the Campania Region and surrounding areas between 2018 and 2023, only two events include observations of very large hail (maximum hailstone diameter ≥ 5 cm). Consequently, the splitting of hail events into two categories (large hail and very large hail) would lead to two very unbalanced datasets (29 case studies for the large hail class and only 2 for the very large hail one) that would make any trend found statistically insignificant. To overcome this problem, we decided to enlarge the very large hail dataset including other 10 case studies happened on the Italian Peninsula from 2015 to 2022, using the hail reports provided by ESWD (further details about this dataset are provided in Vermi et al. [32]). In this way, lightning features, variables and potential trends characterizing large hail (29 case studies) and very large hail (12 case studies) categories are examined and compared. Differences in NHLJ, ISHLJ, and LT between the large hail and very large hail categories were assessed using two-sided Mann–Whitney U tests [81]. p-values were calculated using the asymptotic normal approximation, with correction for tied ranks and continuity correction. Statistical significance was assessed at the 0.05 level.
3. Results
3.1. HLJ Algorithm to Support the CARMEN Project
Within the CARMEN project framework, the hailstorm dataset was analyzed by applying both the VILD and HLJ algorithms to assess the respective contribution of each method to hailstorm detection. Accordingly, the 31-case dataset used in the present study was designed to evaluate the response of the VILD and HLJ methods to confirmed hail-producing thunderstorms. Since non-hail thunderstorms were not included, the present analysis quantifies sensitivity to confirmed hail events but does not provide estimates of specificity, false alarm ratio, or overall binary classification skill.
Please note that, hereafter, HLJ refers to the case-specific series selected among HLJ20, HLJ30 and HLJ40 according to the criterion described in Section 2.3. A schematization of this data flow architecture is provided in Figure 3.
Figure 3.
The data flow architecture converging into the VILD and HLJ algorithms.
Considering the 31 case studies that occurred in the study area in the 2018–2023 period, if we focus on the number of hail events identified by each method, we can simply compute the probability of detection (hereafter, POD) indicator, which can be expressed as the ratio between the number of positive tests and the total number of tests. The latter results from the sum of positive (named “hits”; hereafter, H) and negative (denominated “missed”; hereafter, M) tests, as shown in Equation (5):
From Table 1, we can notice a very similar outcome for both VILD and HLJ methods: indeed, the VILD threshold value has been reached in 25/31 (POD = 80.6%) hailstorms, while the lightning algorithm found at least one HLJ in 24/31 (POD = 77.4%) case studies. Table 1 highlights that VILD and HLJ algorithms identify most of the hailstorms, and sometimes the two methods yield the same result.
Table 1.
Results achieved from the application of VILD and HLJ algorithms. The “YES” column reports the number of case studies (%) in which the threshold value has been overcome. In contrast, the “NO” column counts the hail events that were not recognized by these methods.
To better understand how they perform, we cross-classified the confirmed hail events according to the response of the two methods (Table 2). The latter shows that both methods correctly identify 20 of the 31 confirmed hailstorms (POD = 64.5%); the level of agreement increases to 71% when the two events missed by both methods (2/31, 6.5%) are included. Moving to the remaining nine case studies, it is interesting to note that these events are almost symmetrically split in the last two categories: 5/31 (16.1%) are recognized only by the VILD method while, in the same way, solely the HLJ algorithm identifies 4/31 (12.9%) hailstorms. In a corresponding way, the former show HLJ values equal to 1.9, 1.3, 0.4, 0.1, and 0.0, while the latter measure a maximum VILD equal to 2.3, 1.4, 1.3 and 0.6. As clearly visible from the outcomes just mentioned, these hail events are characterized by one of the two algorithms that does not reach the threshold value established, but convective signals are still present since results are almost always different from 0.0 and sometimes they are very close with the VILD (2.4 g m−3) or HLJ (2.0) thresholds established.
Table 2.
Cross-classification of the 31 confirmed hail events according to the response of the VILD and HLJ methods.
Thus, taking into account four different configurations, the results provided in Table 1 and in Table 2 can be summarized as follows:
- •
- VILD method-only (VILD ≥ 2.4 g m−3): H = 25, M = 6, POD = 80.6%.
- •
- HLJ method-only (HLJ ≥ 2.0): H = 24, M = 7, POD = 77.4%.
- •
- Combined method-AND (VILD ≥ 2.4 g m−3 AND HLJ ≥ 2.0): H = 20, M = 11, POD = 64.5%.
- •
- Combined method-OR (VILD ≥ 2.4 g m−3 OR HLJ ≥ 2.0): H = 29, M = 2, POD = 93.5%.
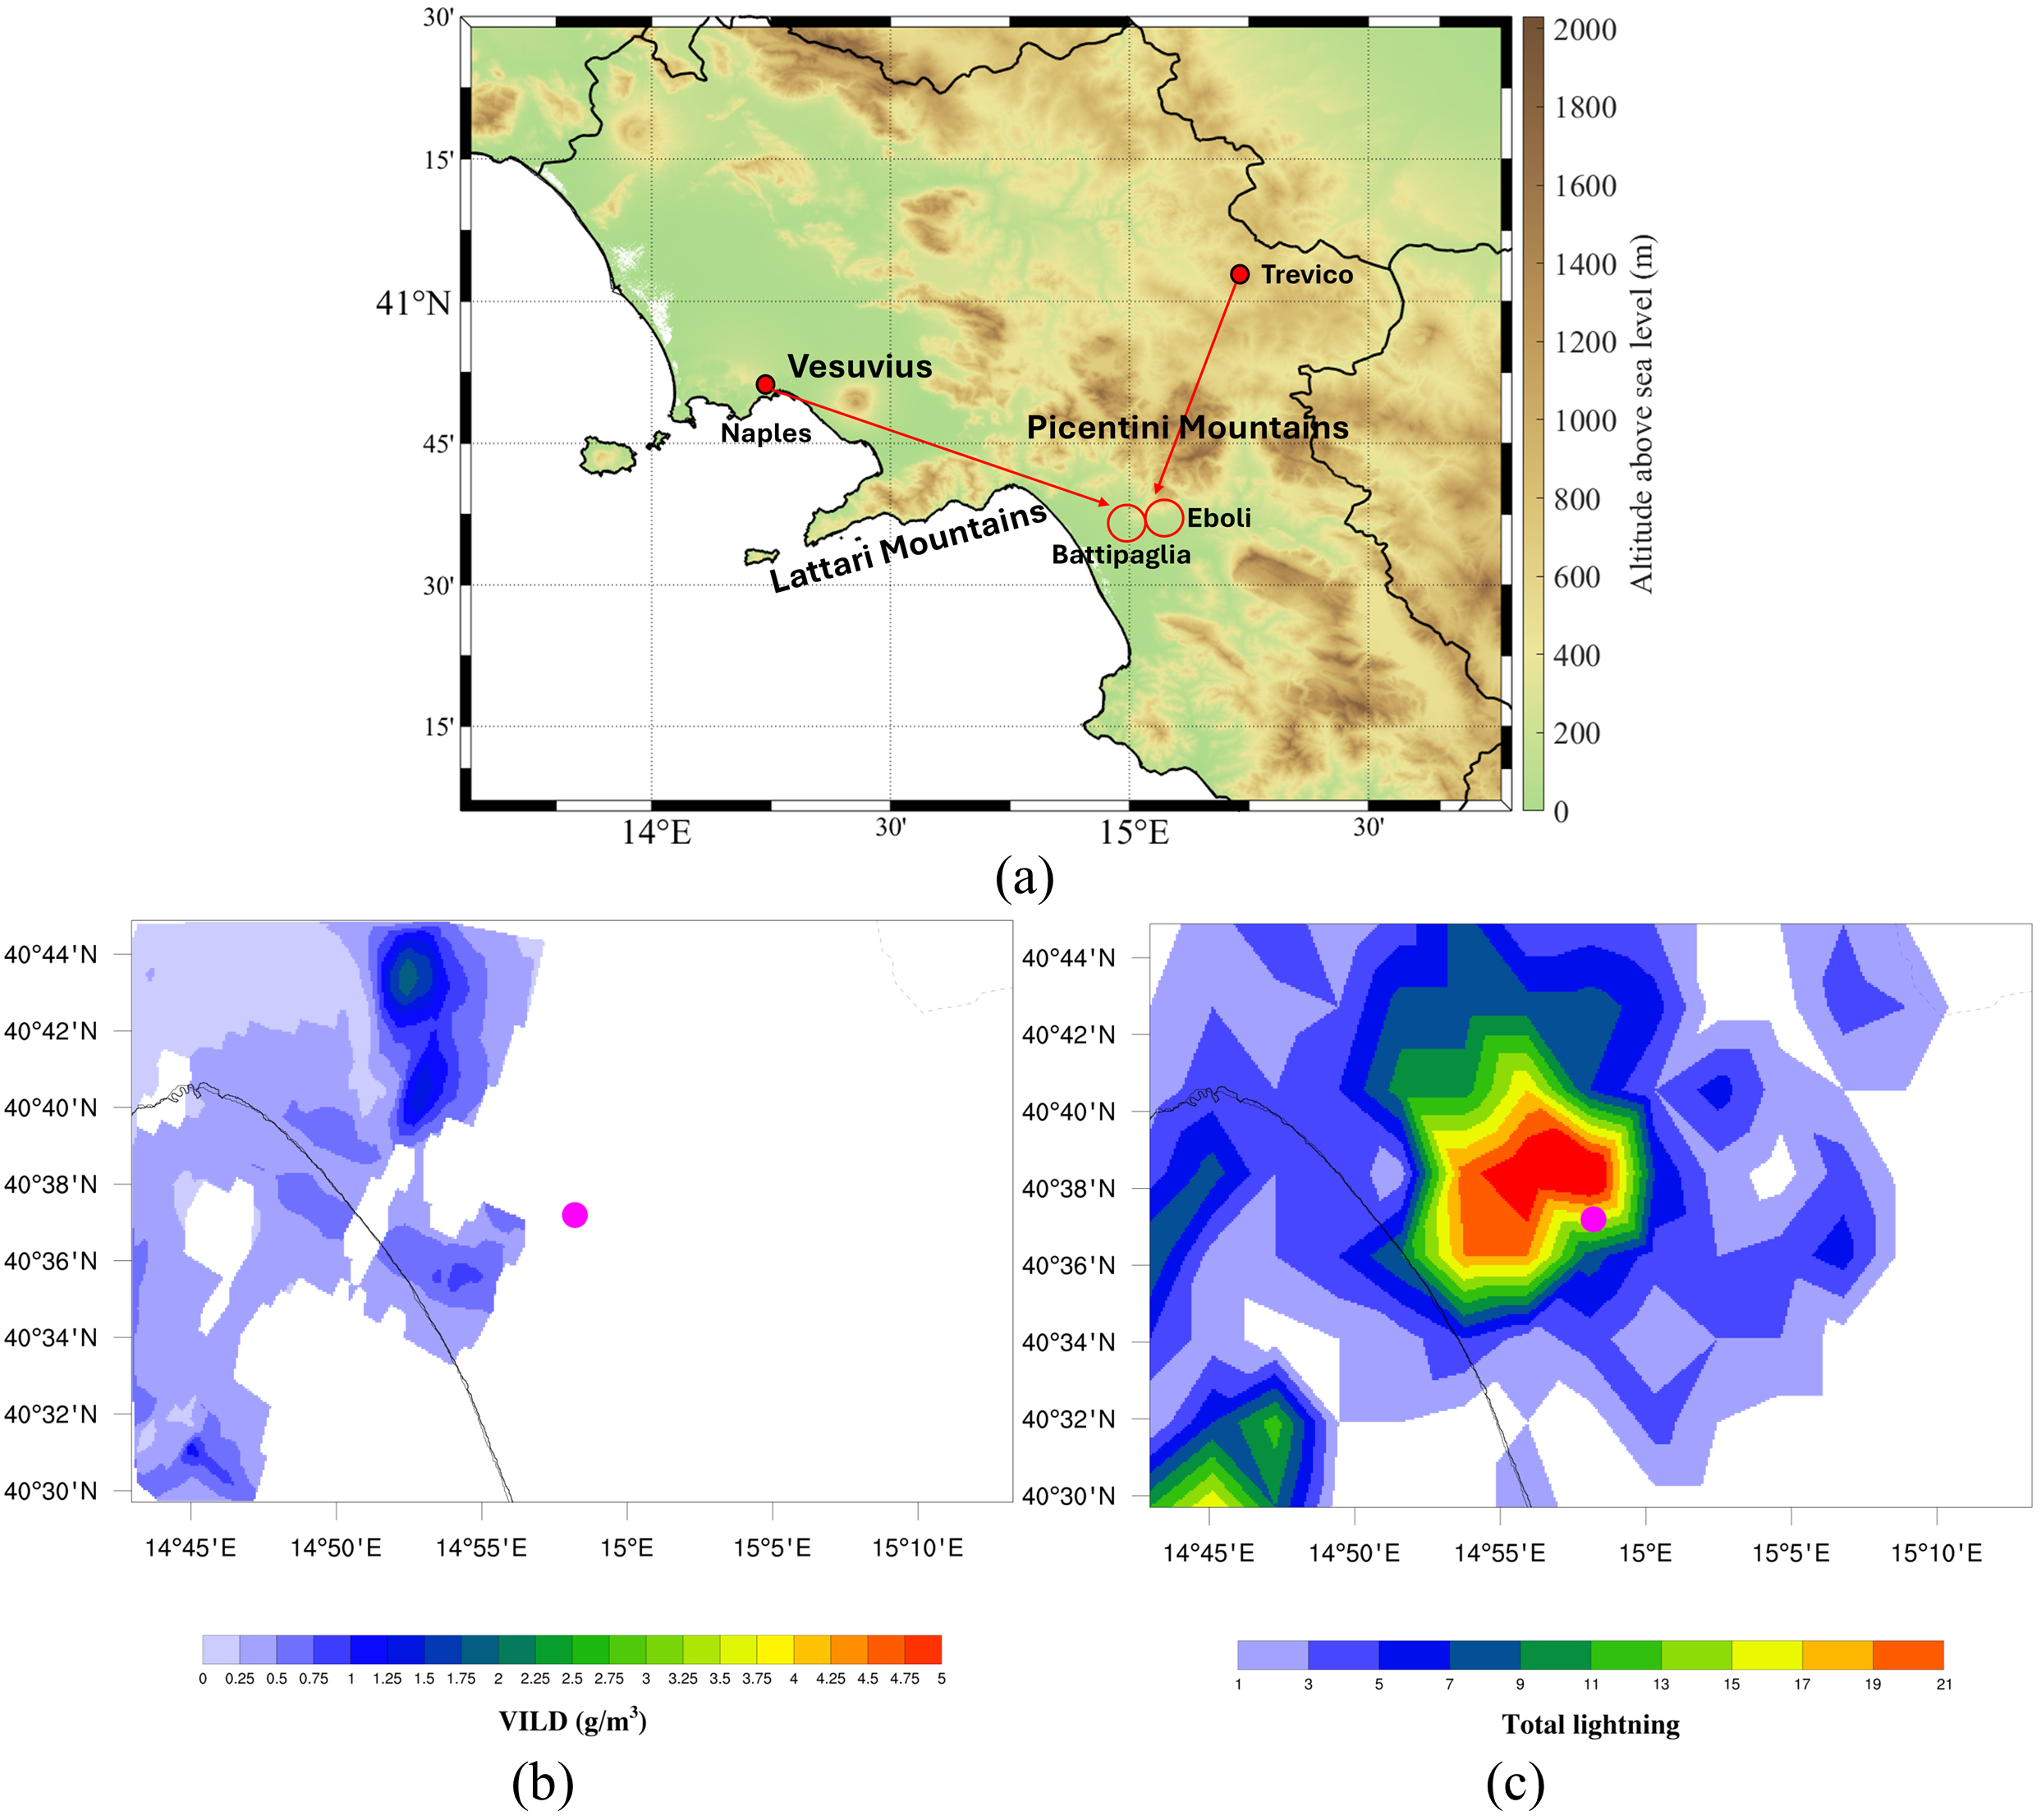
In the following part, we will describe two hail events showing how the CARMEN project benefits from the HLJ algorithm addition. The first instance is related to the hailstorm that occurred in Caivano (40.95°N, 14.30°E) on 9 August 2022, when hailstones with a maximum size of 2 cm were collected at 14:45 UTC (±30 min; https://eswd.eu/ (accessed on 22 March 2026). This is one of the 20 cases in which both algorithms identified a potential developing hailstorm, thanks to the overcoming of the two algorithms’ threshold values. VILD maximum values and HLJ40 series (the latter has been chosen after comparing the HLJ20, HLJ30 and HLJ40 performances) values are reported, every 10 min, in Table 3.
Table 3.
VILD maximum values and HLJ values (using the HLJ40 series) are shown for the case study of Caivano on 9 August 2022 from 13:30 UTC to 15:20 UTC.
Starting from 13:40 UTC, we can notice that the VILD maximum value constantly exceeds the VILD threshold value equal to 2.4 g m−3 and, at the same time, the HLJ method confirms the presence of strong lightning activity detecting four consecutive jumps from 14:10 UTC to 14:40 UTC, having an ISHLJ = 10.30 measured at 14:20 UTC. Moreover, both methods reach threshold values well before the hail report recorded in Caivano at 14:45 UTC (±30 min), even if an accurate LT cannot be computed since the temporal uncertainty is higher than ±15 min. At the top of Figure 4a–c, the study domain map is provided (Figure 4a): here, the red circle surrounds the hail report geolocation, while the two red arrows indicate from where the Naples and Trevico X-radar beams are coming. Caivano is located in the Campania plain and, as visible in Figure 4a, the Naples radar is in a favourable position to carry out reflectivity measurements, whereas the Trevico radar beam is blocked by the presence of the Partenio mountains. Consequently, for this case study, we used data from the Naples radar, which reported the highest reflectivity values. Considering that the hail report time was at 14:45 UTC (±30 min), in Figure 4b,c we show VILD and TL maps produced at 14:50 UTC, respectively. The pink dot in Figure 4b,c represents the hail observation close to Caivano. As can be noticed, VILD and TL maxima are arranged near the hail report, indicating an elevated hail risk for that area, considering that both algorithm threshold values were exceeded. This hail event shows how lightning activity and the HLJ algorithm can be a good support for the CARMEN project hail detection tool, confirming results obtained by the VILD method.
Figure 4.
Above (a), a Campania Region map is provided, with the city of Caivano highlighted by the red circle and radar beam directions from Naples and Trevico indicated by red arrows. At the bottom left (b) and right (c), VILD and TL maps at 14:50 UTC are depicted, respectively. The pink dot in (b,c) indicates the geolocation of the hail report at 14:45 UTC (±30 min; https://eswd.eu/).
However, the potential of HLJ algorithm can be further investigated analyzing the hailstorm that affected the cities of Battipaglia and Eboli on 23 September 2023: here, two different hail observations of maximum hail diameter equal to 4 cm were detected in both locations at 11:00 UTC (40.62°N, 14.97°E; ±5 min) and 11:10 UTC (40.63°N, 15.05°E; ±5 min), respectively (https://eswd.eu/). This case study is particularly interesting because only the HLJ method was able to detect a potential hailstorm, largely exceeding the threshold value established. Indeed, if we focus on the VILD maximum value columns in Table 4a,b, we can observe that only one temporal window (3.1 g∙m−3 at 11:10 UTC) exceeds the threshold of 2.4 g m−3, but these values have been measured at a distance greater than 10 km with respect to the geolocation of the hail reports. In addition, around Battipaglia (Table 4a) and Eboli (Table 4b), the maximum VILD measured is equal to 0.5 g m−3 at 11:10 UTC. Consequently, for this case study, there are no valid VILD values useful to classify the storm system as a potential hailstorm.
Table 4.
VILD maximum values and HLJ values (using the HLJ40 series) are shown for the case study of Battipaglia (a) and Eboli (b) on 23 September 2023 from 09:50 UTC to 11:30 UTC.
On the other hand, enhanced lightning activity has been observed: from the right column in Table 4a,b, it can be noted that the HLJ40 series is characterized by five consecutive jumps from 10:10 UTC to 10:50 UTC, showing an ISHLJ = 54.80 at 10:30 UTC. In addition, the HLJ method provides a 50 min LT with respect to the first reported hail occurrence (first jump detected at 10:10 UTC and first hail report recorded at 11:00 UTC). As in Figure 4a–c, in Figure 5a–c we provide the study area (Figure 5a), VILD (Figure 5b) and TL (Figure 5c) maps processed on 23 September 2023 at 11:00 UTC. The pink dot refers to the hail observation recorded in Battipaglia at 11:00 UTC (±5 min). The reduced reflectivity measurements can be attributed to beam blockage by the Vesuvius volcano and the Lattari and Picentini mountains, which partially obstruct the radar beams from Naples and Trevico (red arrows in Figure 5a). Considering that the cities of Battipaglia and Eboli are placed in the Sele Plain, which is located on the other side of the above-mentioned ridges, the VILD pattern is totally compromised (Figure 5b). In these situations, TL demonstrates to be a reliable variable, being able to monitor in real-time what is happening even in regions characterized by complex orography, as can be noticed by the strong lightning activity (red and orange colours in Figure 5c) detected around the hail report location. In addition, the HLJ algorithm points out an abrupt increase in lightning activity from 10:10 UTC to 10:50 UTC, indicating the possible formation of hailstones in the analyzed storm system.
3.2. Lightning Activity as a Proxy for the Hailstorms
In this Section, we will exclusively focus on the analysis of lightning activity in hailstorms, distinguishing between large hail (maximum hail size between 2 and 5 cm) and very large hail (maximum hail size ≥ 5 cm) case studies. The dataset used in the previous paragraph is too unbalanced, so we decided to enrich the number of very large hail events, even considering ten cases that occurred outside the study area defined in Section 2.1. According to the two hail categories, here we will examine:
- •
- A total of 29 large hail events.
- •
- A total of 12 very large hail case studies.
Based on the hail lightning jump series composing the HLJ algorithm, Table 5 reports how frequently each temporal series (HLJ20, HLJ30, or HLJ40) was selected as representative of a hailstorm according to the maximum-ISHLJ criterion described in Section 2.3. The HLJ40 series is totally predominant in the very large hail category, describing most of the hailstorms (11/12 hail events). On the other hand, in the large hail class, results are more distributed: seven case studies are missed because lightning activity is not strong enough to be detected by the HLJ algorithm, while for the other three hailstorms the HLJ method returns the same outcomes using different HLJ series. In about half of the events (52%), HLJ40 is preferred to find the ISHLJ, but also HLJ20 and HLJ30 series show a not negligible contribution (4/29 case studies).
Table 5.
HLJ series selected to represent each hailstorm according to the maximum-ISHLJ criterion described in Section 2.3. Values indicate the frequency with which HLJ20, HLJ30 or HLJ40 were selected.
Figure 5.
In (a), the red circles surround the cities of Battipaglia and Eboli, while the red arrows indicate where the radar beams of Naples and Trevico come from. At the bottom left (b) and right (c), VILD and TL maps at 11:00 UTC are depicted, respectively. The pink dot in (b,c) indicates the geolocation of the hail report in Battipaglia at 11:00 UTC (±5 min) having a maximum size of 4 cm (https://eswd.eu/).
After that, we examined both datasets, calculating NHLJ, ISHLJ and LT and performing the Mann–Whitney U tests to check the statistical significance of these variables. The analysis included 29 large hail and 12 very large hail cases for NHLJ and ISHLJ. For LT, only cases with an available LT estimate were included (18 large hail and 11 very large hail cases). Main results are summarized through boxplots in Figure 6a–c, where the distribution of NHLJ (Figure 6a), ISHLJ (Figure 6b) and LT (Figure 6c) has been computed for large hail (blue columns) and very large hail (orange columns) categories. The boxes represent the interquartile range (hereafter, IQR) and contain the median (the horizontal black line inside the box), while single points show outliers that significantly differ from the rest of the dataset.
Figure 6.
Boxplots of NHLJ (a), ISHLJ (b) and LT (c) are provided for large hail (blue columns) and very large hail (orange columns) categories.
If we focus on NHLJ (Figure 6a), it emerges that the IQR moves from [1.00–4.00] for large hail events to [6.75–8.00] for very large hail events. In the same way, the median rises from 3.00 to 7.50. For the latter, considering that lightning data are counted every 10 min, the number of jumps found by the HLJ method is 2.5 times higher. This means that these hailstorms have a longer period in which TL is increasing with respect to the previous 10 min temporal steps, being more active from the lightning activity point of view. The p-value resulting from the Mann–Whitney U test is equal to 3.05 × 10⁻⁶, confirming that the NHLJ variable is statistically significant.
Probably, the most important difference between the two datasets was found for ISHLJ (Figure 6b): indeed, IQR increases from [2.40–7.20] for large hail class to [14.58–61.13] for very large hail category. Similarly, the median grows from 3.80 to 27.75. This big difference between the two categories indicates that very large hail cases are characterized not only by a larger number of jumps, but also by jumps that are much more intense. Again, we can state that the ISHLJ variable is statistically significant, showing a p-value equal to 1.41 × 10⁻⁵.
In Figure 6c, we introduce lead times calculated as the difference between the first hail report recorded and the first jump detected. LT distribution is very wide, ranging from two hours in advance to ten minutes late overall, and this result is clearly comparable with lead times presented in previous studies [39,43,44,45,48,49,50,54]. Among the two hail categories, LT results are closer to each other with respect to NHLJ and ISHLJ distributions. Overall, the IQR partially overlaps, moving from [7.50–50.00] to [10.00–70.00] and confirming that even LT increases for hailstorms producing very large hailstones. However, also due to the reduced number of cases, the p-value found equal to 0.379 makes the LT variable not statistically significant.
Considering the big gap found for the ISHLJ between large and very large hail (Figure 6b) and its statistical significance, we decided to deepen the analysis on this topic. Figure 7 sketches, for each case study, the ISHLJ as a function of the maximum hail diameter (cm) recorded in the ESWD and in the monitoring network “Campanialive”.
Figure 7.
For each case study, ISHLJ and maximum hail diameter (cm) are reported. Blue dots represent large hail events while red dots indicate very large hail cases. The horizontal green dashed line shows ISHLJ = 12, while the vertical purple dashed line separates large hail and very large hail classes.
The vertical purple dashed line splits the large hail category (on the left) from the very large hail one (on the right), while blue and red dots represent 29 large hail and 12 very large hail events, respectively. From this graph, most large hail events are found at the bottom left: indeed, 27/29 large hail events have an ISHLJ lower than 12.0 (green horizontal dashed line in Figure 7), with only two cases characterized by stronger jumps. On the other hand, 10/12 very large hail case studies exceed this value, showing an ISHLJ much more intense. Given this distribution, we computed Pearson’s correlation coefficient (r), which resulted in r = 0.70, indicating a good positive correlation between these two variables. Being aware of the limitations of taking the maximum hail diameter (e.g., some larger hailstones could not be collected and recorded) and only lightning data (e.g., the detection efficiency of the lightning network is far from 100%), we think that any upgrade of these datasets could further improve these results.
4. Discussion
VILD and HLJ algorithms have been tested on 31 confirmed hail-producing thunderstorms. This analysis allows the sensitivity of the algorithms to be quantified through POD but does not permit a quantitative assessment of false alarms. Therefore, the POD values reported should not be interpreted as a complete verification of the operational hail/no-hail classification skill. Such an assessment would require an independently verified dataset of non-hail thunderstorms, which currently is not available. However, some speculations can be made considering that for the VILD method in [26], a false-alarm rate (FAR) equal to 57.9% (11/19 ordinary thunderstorms falsely detected as hailstorms) was reported. In this work, the AND configuration represents the more restrictive criterion, identifying 20/31 confirmed hail events (POD = 64.5%), and it is reasonably associated with a minimized FAR, which should be lower than 57.9%, thanks to the presence of two thresholds that need to be exceeded. On the other hand, the OR configuration maximizes sensitivity within the present hail-event dataset, identifying 29/31 events (POD = 93.5%), even if it could be related to a FAR even higher than 57.9%. These findings highlight that the HLJ algorithm can provide good support to monitor and track the hailstorms and that, in some situations, the lightning method is the only one able to identify these storm systems. In addition, the VILD and HLJ combined methods make it possible to optimize the strategy for POD maximization or FAR minimization. Another important point is that the VILD method POD was equal to 80.6%, and it must be emphasized that this result has been obtained using X-band weather radars (having a frequency between 8 and 12 GHz), which is the worst band for large hail detection, if compared with typical C-band (4–8 GHz) and, especially, S-band (2–4 GHz) frequencies. Indeed, if the hail size is larger than 1 cm, it is well-known that hailstones have a much larger backscattering cross section at 10 cm (S-band wavelength) than at 3 cm (X-band wavelength) [12]. Even if in this study it is challenging to quantify the potential improvement of performance among X, C and S-bands, we can state that including new C or S-band instruments in the CARMEN project could lead to a further improvement in the diagnosis of hail in thunderstorms.
Before discussing results about lightning activity characterizing the 31 hailstorms dataset, we decided to include 10 more very large hail case studies [32]. This new addition was necessary for a better evaluation of the HLJ algorithm performance in very large hail conditions, but it could have introduced some elements of heterogeneity in this dataset, affecting the final conclusions. This last examination was solely based on lightning data, preventing VILD results from suffering from any discontinuity and, in the same way, lightning strikes were measured by the LAMPINET network even in the rest of the Italian Peninsula, ensuring good homogeneity in the data collection process (further details in Vermi et al. [32]). However, in Italy, coastlines and inland areas rapidly give way to hills and high mountain chains, which can partially affect the detection of the discharges. The latter could also be influenced by small differences in the geographical distribution of the antennas, which may locally modify the DE.
In addition, population density is another key element that is directly related to hail reports. Indeed, the same hailstorm may be flagged as large hail or very large hail producing, depending more on the availability of hail observations rather than its true intensity. All these aspects must be considered during the discussion of lightning trends found.
According to Table 5, it is particularly interesting to note that, moving from the large to very large hail category, missed hailstorms disappear, indicating that lightning activity generally increases in storms producing very large hailstones. In addition, the HLJ40 series dominates (92%) the very large hail class, meaning that, on average, these hailstorms need more time to reach the peak of lightning activity and that the growth of the hailstones is longer, allowing them to become larger in size.
Probably, the main reason why NHLJ and ISHLJ indicators increase with the diameter of the hailstones (Figure 6a,b) has to be searched into the development dynamics of hailstorms and into the mechanism of hail formation. Indeed, the realistic time needed for the hail growth process is from 10 to 30 min, but in the case of giant hailstones the time required is even higher [80,82].
Starting from this concept, the maximum diameter reached by hailstones in thunderclouds strictly depends on the strength of the updraft and on the trajectories taken by hailstones inside the storm (e.g., [62,80,83,84,85,86,87]): indeed, the longer the hailstones remain in the storm cloud, the more they will collect cloud droplets, allowing them to become larger and heavier (e.g., [88]). This process proceeds until the hailstone is too heavy to be supported by the updraft, leading to the final hailfall to the ground. In addition, we must take into account that the lightning peak generally occurs when the amount of ice crystals and graupel, which have a crucial role in the electrification process, is dominant in the storm cloud [89,90,91]. After hail has grown in the storm cloud, usually the quantity of ice crystals and graupel diminishes, and the total lightning decreases. It follows that, for very large hail, NHLJ is larger because the hail growth process is longer and hailstones have more time to increase in size, due to the presence of stronger updrafts. The latter also justifies why sometimes hailstones can be collected far away from the HLJ detection. Indeed, in a first approximation, the hailstorm can be considered as a closed system, which is embedded in a main wind flow and tends to drift with the mean winds [83]. Moreover, the greater duration of the hail growth mechanism for very large hail cases is testified by results shown in Table 5, in which the HLJ40 series is almost always (92%) preferred, while the corresponding outcomes for large hail class are more distributed, indicating that the hailstone growth process is more ephemeral. In the same way, ISHLJ reaches much higher values for very large hail cases, since the amount of ice crystals and graupel formed in the thundercloud is considerably greater, leading to much more pronounced lightning activity. On the other hand, even if LT statistical indicators such as median and IQR slightly increase moving from large to very large hail class, LT was not statistically significant, not allowing us to make further speculations about this topic.
These findings confirm that very large hailstones are most likely to form when lightning activity is stronger and more persistent and when the intensity of the strongest jump increases by several tens of times. These aspects are particularly interesting also from the operational point of view for identifying hailstorms and supporting other hail detection tools in real-time. Indeed, NHLJ and ISHLJ can be calculated only from lightning data, making it easier to obtain these variables even in real-time.
In the next two subsections, we propose the application of the HLJ algorithm to two independent hail events (one producing large hail and one very large hail) that occurred in Campania Region and adjacent areas, not belonging to the case studies examined in Section 3.1 and in Section 3.2. Since, in those days, the X-band weather radars of the CARMEN project were not working due to planned maintenance work, we studied these two hailstorms only applying the HLJ algorithm. These examples demonstrate that analyzing lightning data using the proposed method is highly effective for identifying and monitoring hailstorms, even in the absence of other hail detection tools.
4.1. Large Hail Event on 7 July 2022
The first case study we examine is a large hail event which affected the southern part of the Molise Region and the northern sector of the Campania Region on 7 July 2022. In the areas stated above, two hail observations were recorded in Longano (41.52°N, 14.24°E) at 13:10 UTC (±5 min) and in Piedimonte Matese (41.36°N, 14.38°E) at 13:45 UTC (±5 min), reporting a maximum hail diameter of 3 cm (Figure 8a–c, https://eswd.eu/). The analysis of this large hail event begins with the generation of TL maps at 10 min intervals for the areas indicated by the hail reports (see Section S2 of Supplementary Materials for TL maps).
Figure 8.
Hailstones detected in Longano (a), Molise Region, at 13:10 UTC (±5 min) and in Piedimonte Matese (b,c), Campania Region, at 13:45 UTC (±5 min), having a maximum size of 3 cm (https://eswd.eu/).
The lightning activity of this hailstorm had a duration of 100 min, from 12:40 UTC to 14:20 UTC, as described by black columns representing TL in Figure 9a. In this case, using the ISHLJ criteria proposed in Section 2.3, the HLJ40 series was chosen, whose evolution over time is presented in Figure 9b. The series indicates a total of six hail lightning jumps (NHLJ = 6), including four consecutive jumps between 12:50 UTC and 13:20 UTC, followed by two additional jumps at 13:50 UTC and 14:00 UTC, associated with a renewed increase in total lightning. In addition, considering that the first jump was found at 12:50 UTC and the first hail report was in Longano at 13:10 UTC, it follows that LT is in advance of 20 min with respect to the first hailstones collected. Given this information, if we compare NHLJ and LT found for this case study with results shown in Figure 6a–c, we can observe that lightning activity seems to confirm the development of hail phenomena (Figure 6a), having intermediate characteristics (NHLJ = 6) between large and very large hail categories. However, the comparison between the ISHLJ equal to 6.1 at 13:10 UTC and the distribution provided in Figure 7 probably provides a more crucial result. Indeed, if we look at Figure 7, we can observe that the ISHLJ of the hailstorm examined is placed in the bottom left of the panel, that is, the area commonly populated by large hail events analyzed in Section 3.2. It confirms that this large hail case study was characterized by a quite high number of jumps (NHLJ) but, even considering the most intense one, the ISHLJ value is more in accordance with the large hail events distribution.
Figure 9.
TL evolution of the hailstorm (a) and HLJ algorithm application using the HLJ40 series (b). In (b), the ISHLJ is equal to 6.1, and it is identified with the label above the corresponding time window.
4.2. Very Large Hail Event on 16 June 2025
The second case study proposed is a very large hail event that happened on 16 June 2025. The development of this hailstorm was similar to the previous one, with a storm system that evolved from the Molise to the northeastern sector of the Campania Region. The first two hail reports are located in the Molise Region in the city of Campobasso (41.56°N, 14.66°E) at 15:55 UTC (±5 min) and in Ferrazzano (41.53°N, 14.67°E) at 16:05 UTC (±5 min), with a maximum hail size of 6 cm (Figure 10a,b). Later, the hailstorm moved from Molise to Campania Region and, at 16:30 UTC (±5 min), other hailstones were collected in Castelvetere in Val Fortore (41.44°N, 14.94°E; Figure 10c) and in Colle Sannita (41.37°N, 14.84°E) with a maximum hail diameter of 5 and 4.5 cm, respectively. Finally, at 16:35 UTC (±5 min), the last hail report was measured in San Bartolomeo in Galdo (41.40°N, 15.01°E), with hailstones reaching a maximum diameter of 5 cm (https://eswd.eu/). See Section S3 of Supplementary Materials for TL maps.
Figure 10.
Pictures of hailstones collected in (a), Campobasso (Molise Region) at 15:55 UTC (±5 min), (b) Ferrazzano (Molise Region) at 16:05 UTC (±5 min) and (c) Castelvetere in Val Fortore (Campania Region) at 16:30 UTC (±5 min). The hailstones picked had a maximum size of 6 cm in (a,b) and of 5 cm in (c) (https://eswd.eu/).
From Figure 11a, it can be noted that lightning activity had a total duration of four hours, from 14:50 UTC to 18:50 UTC, in which the hailstorm produced more than 300 strokes in 10 min at 16:20 UTC (Figure 11a) and an overall of almost 2500 strokes during the whole period of development. The HLJ algorithm identified, also in this case, the HLJ40 series as the most suitable temporal window for highlighting the ISHLJ: in Figure 11b, HLJ40 shows five consecutive jumps from 15:10 UTC to 15:50 UTC and, after more than two hours, a final jump at 18:20 UTC resulting in an NHLJ = 6. Being the first jump at 15:10 UTC and the first hail report in Campobasso at 15:55 UTC, it follows that LT is equal to 45 min. Comparing these results with average and median values of large and very large hail datasets analyzed in Figure 6a–c, we can state that both six jumps and an advance of 45 min are intermediate values not decisive for discriminating among the two hail categories. In Figure 11b, the ISHLJ reaches a value of 23.4 at 15:30 UTC. The HLJ40 series indicates that TL increased by more than a factor of 23 over the preceding 40 min, reflecting very intense lightning activity within the hailstorm. If we reconsider the distribution of ISHLJ provided in Figure 6b and in Figure 7, the highest maximum diameter reported for this case study is associated with a much more intense jump that differs from values typically measured for large hail events, which range almost always between 2.0 and 12.0. This represents a key result, as lightning data alone—through the combined use of total lightning and hail lightning jump indicators (especially ISHLJ and NHLJ)—can effectively characterize developing hailstorms and support real-time discrimination between large and very large hail events.
Figure 11.
As in Figure 9, for the case study of 16 June 2025, TL (a) and HLJ40 series (b) have been reported. In (b), the ISHLJ is equal to 23.4, and it is identified with the label above the corresponding time window.
5. Conclusions
In this work, a new lightning data-based method (i.e., hail lightning jump, derived from [32]) has been proposed for identifying and tracking the hailstorms in real-time. The most important novelty of this methodology is to enlarge the classical lightning jump temporal window from a few minutes to some tens of minutes to derive new key lightning features. The main goal of this study was to use the hail lightning jump (HLJ) method to support the CARMEN project hail detection tool [26], which computes the hail probability through the Vertically Integrated Liquid Density (VILD) Method [20], thanks to data coming from two X-band weather radars located in the Campania Region (Southern Italy). Considering the 31 confirmed hailstorms that occurred in the study area from 2018 to 2023, the VILD and HLJ methods identified 80.6% and 77.4% of the events, respectively. The two methods jointly identified 20 events, whereas five additional events were recognized only by VILD and four only by HLJ. Their combination using an OR criterion increased the sensitivity to confirmed hail events to 93.5%. These values refer specifically to the event-based dataset considered here and do not represent complete hail/no-hail classification skill, since false alarms cannot be quantified without an independently verified sample of non-hail thunderstorms. Results about the HLJ algorithm highlight that lightning strikes can follow the evolution of the hailstorms even in complex orography, where the beam blockage partially impedes radar measurements, leading to better monitoring of the hailstorms. For these reasons, the 10 min synchronization between radar and lightning data can add important information on lightning activity that characterizes the storm systems, especially in areas not accurately observed by X-band weather radars. On the other hand, assessing the potential gains in performance using other frequency bands (e.g., C or S-band) or dual-polarization instruments is an important perspective to be pursued in the future.
In the second part of this study, we analyzed the same dataset, adding some very large hail events that occurred on the Italian Peninsula from 2015 to 2022 in order to examine all of them only from a lightning activity point of view, using results obtained by the application of the HLJ algorithm. In this case, we dealt with 29 large hail (maximum hail size between 2 and 5 cm) phenomena and 12 very large hail (maximum hail size ≥ 5 cm) events. The HLJ method misses 24% of large hail case studies, while it always detects jumps produced in the very large hail class, meaning that total lightning (TL) generally increases in the latter. The HLJ40 temporal series is predominantly selected for very large hail events, indicating that these storms are characterized by stronger and more prolonged increases in TL, which allow hailstones to grow and reach larger sizes. After computing some stroke-related variables like the number of jumps (NHLJ), the intensity of the strongest jump (ISHLJ) and lead time (LT) characterizing each hailstorm, we found that, on average, all these indicators reach higher values when very large hailstorms are examined, supporting the hypothesis that lightning activity and the hail growth mechanism evolve in a coherent way. Even if the LT indicator was not statistically significant, very important outcomes were obtained from NHLJ and mainly from ISHLJ, for which an intensity difference oscillating from five to eight times was observed moving from the large hail to very large hail category. In addition, to strengthen this trend, a positive correlation (r = 0.70) was found between the maximum hail size reported and the computed ISHLJ. In the last part of this work, these outcomes have been confirmed to be very useful for describing new independent large hail and very large hail case studies, especially when the CARMEN project hail detection tool was switched off due to planned maintenance work and the HLJ algorithm was the only method operating in real-time. Indeed, the potential relationship between lightning features and the severity of the hailstorms could let to recognize storm systems belonging to different categories (e.g., large or very large hail) simply by using lightning data and applying the HLJ algorithm, having important benefits on human society for the mitigation of injuries and economic losses. However, future studies will need to confirm these findings through more extensive analyses (also comparing the HLJ algorithm with previously developed LJ methods) and larger datasets, including independently verified non-hail-producing thunderstorms, which will allow a complete operational verification of the proposed approach through the assessment of the false alarm rate and other relevant skill scores.
Supplementary Materials
The following supporting information can be downloaded at: https://www.mdpi.com/article/10.3390/rs18223879/s1.
Author Contributions
Conceptualization, F.V., V.C. and S.L.; methodology: F.V., V.C. and S.L.; software, F.V.; validation, F.V.; formal analysis, F.V. and G.M.; investigation, F.V., V.C. and G.M.; resources, F.V.; data curation, F.V.; writing—original draft preparation, F.V. and V.C.; writing—review and editing, F.V., V.C., G.M., G.B. and S.L.; visualization, F.V.; supervision: G.B. and S.L.; project administration, G.B. and S.L. All authors have read and agreed to the published version of the manuscript.
Funding
This work was partially carried out within the MOST—Sustainable Mobility National Research Center and received funding from the European Union Next-Generation EU (Piano Nazionale di Ripresa e Resilienza (PNRR)—Missione 4 Componente 2, Investimento 1.4—D.D. 1033 17/06/2022, CN00000023).
Data Availability Statement
Data supporting this research work are available on request. For further information, please contact the corresponding author.
Acknowledgments
The authors would like to thank the Meteorological Service of the National Air Force for providing lightning data on the Italian Peninsula from 2015 to 2025. This manuscript reflects only the authors’ views and opinions; neither the European Union nor the European Commission can be considered responsible for them. Moreover, the authors are grateful to ELDES s.r.l. and Autostrade per l’Italia S.p.A. personnel for the kind technical support.
Conflicts of Interest
The authors declare no conflicts of interest.
Appendix A
Table A1 provides the hail reports (https://eswd.eu/ and http://www.campanialive.it/ (accessed on 5 November 2025)) used for the comparison between the VILD and HLJ algorithms (Section 3.1) for the 31 hailstorms that occurred over the Campania Region and adjacent areas.
Table A1.
For each hail report, the following information is listed: date, UTC time, temporal uncertainty, latitude, longitude, location and maximum hail diameter.
References
- Laviola, S.; Monte, G.; Cattani, E.; Levizzani, V. Hail climatology in the Mediterranean basin using the GPM constellation (1999–2021). Remote Sens. 2022, 14, 4320. [Google Scholar] [CrossRef] [Scilit]
- Changnon, S.A.; Changnon, D.; Hilberg, S.D. Hailstorms Across The Nation: An Atlas About Hail and Its Damages; ISWS Contract Report CR-2009-12; Illinois State Water Survey: Champaign, IL, USA, 2009. [Google Scholar]
- Cerveny, R.S.; Bessemoulin, P.; Burt, C.C.; Cooper, M.A.; Cunjie, Z.; Dewan, A.; Finch, J.; Holle, R.L.; Kalkstein, L.; Kruger, A.; et al. WMO assessment of Weather and climate mortality extremes: Lightning, tropical cyclones, tornadoes, and hail. Weather Clim. Soc. 2017, 9, 487–497. [Google Scholar] [CrossRef] [Scilit]
- Kim, M.H.; Lee, J.; Lee, S.J. Hail: Mechanisms, monitoring, forecasting, damages, financial compensation systems, and prevention. Atmosphere 2023, 14, 1642. [Google Scholar] [CrossRef] [Scilit]
- Saltikoff, E.; Tuovinen, J.P.; Kotro, J.; Kuitunen, T.; Hohti, H. A climatological comparison of radar and ground observations of hail in Finland. J. Appl. Meteorol. Climatol. 2010, 49, 101–114. [Google Scholar] [CrossRef] [Scilit]
- Cintineo, J.L.; Smith, T.M.; Lakshmanan, V.; Brooks, H.E.; Ortega, K.L. An objective high-resolution hail climatology of the contiguous United States. Weather Forecast. 2012, 27, 1235–1248. [Google Scholar] [CrossRef] [Scilit]
- Burcea, S.; Cică, R.; Bojariu, R. Hail climatology and trends in Romania: 1961–2014. Mon. Weather Rev. 2016, 144, 4289–4299. [Google Scholar] [CrossRef] [Scilit]
- Nisi, L.; Martius, O.; Hering, A.; Kunz, M.; Germann, U. Spatial and temporal distribution of hailstorms in the Alpine region: A long-term, high resolution, radar-based analysis. Q. J. R. Meteorol. Soc. 2016, 142, 1590–1604. [Google Scholar] [CrossRef] [Scilit]
- Fluck, E.; Kunz, M.; Geissbuehler, P.; Ritz, S.P. Radar-based assessment of hail frequency in Europe. Nat. Hazards Earth Syst. Sci. 2021, 21, 683–701. [Google Scholar] [CrossRef] [Scilit]
- Murillo, E.M.; Homeyer, C.R.; Allen, J.T. A 23-year severe hail climatology using GridRad MESH observations. Mon. Weather Rev. 2021, 149, 945–958. [Google Scholar] [CrossRef] [Scilit] [PubMed]
- Lemon, L.R. The radar “three-body scatter spike”: An operational large-hail signature. Weather Forecast. 1998, 13, 327–340. [Google Scholar] [CrossRef] [Scilit]
- Feral, L.; Sauvageot, H.; Soula, S. Hail detection using S- and C-band radar reflectivity difference. J. Atmos. Ocean. Technol. 2003, 20, 233–248. [Google Scholar] [CrossRef] [Scilit]
- Kaltenboeck, R.; Ryzhkov, A. Comparison of polarimetric signatures of hail at S and C bands for different hail sizes. Atmos. Res. 2013, 123, 323–336. [Google Scholar] [CrossRef] [Scilit]
- Ortega, K.L.; Krause, J.M.; Ryzhkov, A.V. Polarimetric radar characteristics of melting hail. Part III: Validation of the algorithm for hail size discrimination. J. Appl. Meteorol. Climatol. 2016, 55, 829–848. [Google Scholar] [CrossRef] [Scilit]
- Holleman, I. Hail Detection Using Single-Polarization Radar; Koninklijk Nederlands Meteorologisch Instituut: De Bilt, The Netherlands, 2001. [Google Scholar]
- Kunz, M.; Kugel, P.I. Detection of hail signatures from single-polarization C-band radar reflectivity. Atmos. Res. 2015, 153, 565–577. [Google Scholar] [CrossRef] [Scilit]
- Vulpiani, G.; Baldini, L.; Roberto, N. Characterization of Mediterranean hail-bearing storms using an operational polarimetric X-band radar. Atmos. Meas. Tech. 2015, 8, 4681–4698. [Google Scholar] [CrossRef] [Scilit]
- Puskeiler, M.; Kunz, M.; Schmidberger, M. Hail statistics for Germany derived from single-polarization radar data. Atmos. Res. 2016, 178, 459–470. [Google Scholar] [CrossRef] [Scilit]
- Capozzi, V.; Picciotti, E.; Mazzarella, V.; Marzano, F.S. Fuzzy-logic detection and probability of hail exploiting short-range X-band. Atmos. Res. 2018, 201, 17–33. [Google Scholar] [CrossRef] [Scilit]
- Amburn, S.A.; Wolf, P.L. VIL Density as a Hail Indicator. Weather Forecast. 1997, 12, 473–478. [Google Scholar] [CrossRef] [Scilit]
- Lahiff, C.T. Vertically Integrated Liquid Density and Its Associated Hail Size Range Across the Burlington, Vermont County Warning Area; NOAA/National Weather Service: Silver Spring, MD, USA, 2005.
- Skripniková, K.; Řezáčová, D. Radar-based hail detection. Atmos. Res. 2014, 144, 175–185. [Google Scholar] [CrossRef] [Scilit]
- Cică, R.; Burcea, S.; Bojariu, R. Assessment of severe hailstorms and hail risk using Weather radar data. Meteorol. Appl. 2015, 22, 746–753. [Google Scholar] [CrossRef] [Scilit]
- Ortega, K.L. Evaluating multi-radar, multi-sensor products for surface hailfall diagnosis. E-J. Sev. Storms Meteorol. 2018, 13, 1–36. [Google Scholar] [CrossRef] [Scilit]
- Nisi, L.; Hering, A.; Germann, U.; Schroeer, K.; Barras, H.; Kunz, M.; Martius, O. Hailstorms in the Alpine region: Diurnal cycle, 4D-characteristics, and the nowcasting potential of lightning properties. Q. J. R. Meteorol. Soc. 2020, 146, 4170–4194. [Google Scholar] [CrossRef] [Scilit]
- Capozzi, V.; Mazzarella, V.; De Vivo, C.; Annella, C.; Greco, A.; Fusco, G.; Budillon, G. A Network of X-Band Meteorological Radars to Support the Motorway System (Campania Region Meteorological Radar Network Project). Remote Sens. 2022, 14, 2221. [Google Scholar] [CrossRef] [Scilit]
- Rigo, T.; Farnell, C. A Comparison between Radar Variables and Hail Pads for a Twenty-Year Period. Climate 2024, 12, 158. [Google Scholar] [CrossRef] [Scilit]
- Bechini, R.; Chandrasekar, V. A Semisupervised Robust Hydrometeor Classification Method for Dual-Polarization Radar Applications. J. Atmos. Ocean. Technol. 2015, 32, 22–47. [Google Scholar] [CrossRef] [Scilit]
- Li, N.; Zhang, J.; Wang, D.; Wang, P. Research on Hail Mechanism Features Based on Dual-Polarization Radar Data. Atmosphere 2023, 14, 1827. [Google Scholar] [CrossRef] [Scilit]
- Hardaker, P.J.; Auer, A.H., Jr. The separation of rain and hail using single polarisation radar echoes and IR cloud-top temperatures. Meteorol. Appl. 1994, 1, 201–204. [Google Scholar] [CrossRef] [Scilit]
- Stumpf, G.J.; Smith, T.M.; Hocker, J. New hail diagnostic parameters derived by integrating multiple radars and multiple sensors. In Proceedings of the 22nd Conference on Severe Local Storms, Hyannis, MA, USA, 6 October 2004; p. 7.8. [Google Scholar]
- Vermi, F.; Capozzi, V.; Monte, G.; Budillon, S.; Laviola, S. Lightning jump as precursor of very large hail occurrence: First evidence in the Italian territory. Bull. Atmos. Sci. Technol. 2025, 6, 21. [Google Scholar] [CrossRef] [Scilit]
- Changnon, S.A. Temporal and Spatial Relations between Hail and Lightning. J. Appl. Meteorol. Climatol. 1992, 31, 587–604. [Google Scholar] [CrossRef] [Scilit]
- Kalina, E.A.; Friedrich, K.; Motta, B.C.; Deierling, W.; Stano, G.T.; Rydell, N.N. Colorado plowable hailstorms: Synoptic Weather, radar, and lightning characteristics. Weather Forecast. 2016, 31, 663–693. [Google Scholar] [CrossRef] [Scilit]
- Williams, E.R.; Zhang, R.; Rydock, J. Mixed-phase microphysics and cloud electrification. J. Atmos. Sci. 1991, 48, 2195–2203. [Google Scholar] [CrossRef] [Scilit]
- Saunders, C.P. A review of thunderstorm electrification processes. J. Appl. Meteorol. Climatol. 1993, 32, 642–655. [Google Scholar] [CrossRef] [Scilit]
- Schultz, C.J.; Petersen, W.A.; Carey, L.D. Lightning and Severe Weather: A Comparison between Total and Cloud-to-Ground Lightning Trends. Weather Forecast. 2011, 26, 744–755. [Google Scholar] [CrossRef] [Scilit]
- Jurković, P.M.; Mahović, N.S.; Počakal, D. Lightning, overshooting top and hail characteristics for strong convective storms in Central Europe. Atmos. Res. 2015, 161, 153–168. [Google Scholar] [CrossRef] [Scilit]
- Wapler, K. The life-cycle of hailstorms: Lightning, radar reflectivity and rotation characteristics. Atmos. Res. 2017, 193, 60–72. [Google Scholar] [CrossRef] [Scilit]
- Feng, G.; Qie, X.; Yuan, T.; Niu, S. Lightning activity and precipitation structure of hailstorms. Sci. China Ser. D Earth Sci. 2007, 50, 629–639. [Google Scholar] [CrossRef] [Scilit]
- Williams, E.R.; Boldi, B.; Matlin, A.; Weber, M.; Hodanish, S.; Sharp, D.; Goodman, S.; Raghavan, R.; Buechler, D. The behavior of total lightning activity in severe Florida thunderstorms. Atmos. Res. 1999, 51, 245–265. [Google Scholar] [CrossRef] [Scilit]
- Emersic, C.; Heinselman, P.L.; MacGorman, R.; Bruning, E.C. Lightning activity in a hail-producing storm observed with phased-array radar. Mon. Weather Rev. 2011, 139, 1809–1825. [Google Scholar] [CrossRef] [Scilit]
- Schultz, C.J.; Petersen, W.A.; Carey, L.D. Preliminary Development and Evaluation of Lightning Jump Algorithms for the Real-Time Detection of Severe Weather. J. Appl. Meteorol. Climatol. 2009, 48, 2543–2563. [Google Scholar] [CrossRef] [Scilit]
- Gatlin, P.N.; Goodman, S.J. A Total Lightning Trending Algorithm to Identify Severe Thunderstorms. J. Atmos. Ocean. Technol. 2010, 27, 3–22. [Google Scholar] [CrossRef] [Scilit]
- Metzger, E.; Nuss, W.A. The relationship between total cloud lightning behavior and radar-derived thunderstorm structure. Weather Forecast. 2013, 28, 237–253. [Google Scholar] [CrossRef] [Scilit]
- Yao, W.; Zhang, Y.; Meng, Q.; Wang, F.; Lu, W. A comparison of the characteristics of total and cloud-to-ground lightning activities in hailstorms. Acta Meteorol. Sin. 2013, 27, 282–293. [Google Scholar] [CrossRef] [Scilit]
- Chronis, T.; Carey, L.D.; Schultz, C.J.; Schultz, E.V.; Calhoun, K.M.; Goodman, S.J. Exploring Lightning Jump Characteristics. Weather Forecast. 2015, 30, 23–37. [Google Scholar] [CrossRef] [Scilit]
- Farnell, C.; Rigo, T.; Pineda, N. Lightning jump as a nowcast predictor: Application to severe Weather events in Catalonia. Atmos. Res. 2017, 183, 130–141. [Google Scholar] [CrossRef] [Scilit]
- Farnell, C.; Rigo, T.; Pineda, N. Exploring radar and lightning variables associated with the Lightning Jump. Can we predict the size of the hail? Atmos. Res. 2018, 202, 175–186. [Google Scholar] [CrossRef] [Scilit]
- Tian, Y.; Qie, X.; Sun, Y.; Wang, D.; Yuan, S.; Sun, Z.; Lu, G.; Yu, L.; Sun, H.; Li, L.; et al. Total lightning signatures of thunderstorms and lightning jumps in hailfall nowcasting in the Beijing area. Atmos. Res. 2019, 230, 104646. [Google Scholar] [CrossRef] [Scilit]
- Farnell, C.; Rigo, T. The Lightning Jump Algorithm for Nowcasting Convective Rainfall in Catalonia. Atmosphere 2020, 11, 397. [Google Scholar] [CrossRef] [Scilit]
- Tian, Y.; Yao, W.; Sun, Y.; Wang, Y.; Liu, X.; Jiang, T.; Zhang, L.; Meng, L.; Wang, L.; Sun, X.; et al. A method for improving the performance of the 2σ lightning jump algorithm for nowcasting hail. Atmos. Res. 2022, 280, 106404. [Google Scholar] [CrossRef] [Scilit]
- Schultz, C.J.; Carey, L.D.; Schultz, E.V.; Blakeslee, R.J. Kinematic and microphysical significance of lightning jumps versus nonjump increases in total flash rate. Weather Forecast. 2017, 32, 275–288. [Google Scholar] [CrossRef] [Scilit] [PubMed]
- Rigo, T.; Farnell, C. Characterisation of thunderstorms with multiple lightning jumps. Atmosphere 2022, 13, 171. [Google Scholar] [CrossRef] [Scilit]
- Kotroni, V.; Lagouvardos, K. Lightning occurrence in relation with elevation, terrain slope, and vegetation cover in the Mediterranean. J. Geophys. Res. Atmos. 2008, 113, D21. [Google Scholar] [CrossRef] [Scilit]
- Bourscheidt, V.; Junior, O.P.; Naccarato, K.P.; Pinto, I.R. The influence of topography on the cloud-to-ground lightning density in South Brazil. Atmos. Res. 2009, 91, 508–513. [Google Scholar] [CrossRef] [Scilit]
- Punge, H.J.; Bedka, K.M.; Kunz, M.; Werner, A. A new physically based stochastic event catalog for hail in Europe. Nat. Hazards 2014, 73, 1625–1645. [Google Scholar] [CrossRef] [Scilit]
- Allen, J.T.; Tippett, M.K. The characteristics of United States hail reports: 1955–2014. E-J. Sev. Storms Meteorol. 2015, 10, 1–31. [Google Scholar] [CrossRef] [Scilit]
- Pilorz, W. Very large hail occurrence in Poland from 2007 to 2015. Contemp. Trends Geosci. 2015, 4, 45–55. [Google Scholar] [CrossRef] [Scilit]
- Punge, H.J.; Kunz, M. Hail observations and hailstorm characteristics in Europe: A review. Atmos. Res. 2016, 176, 159–184. [Google Scholar] [CrossRef] [Scilit]
- Istrate, V.; Dobri, R.V.; Bărcăcianu, F.; Ciobanu, R.A.; Apostol, L. A ten years hail climatology based on ESWD hail reports in Romania. Geogr. Tech. 2017, 12, 110–118. [Google Scholar] [CrossRef] [Scilit]
- Allen, J.T.; Giammanco, I.M.; Kumjian, M.R.; Jurgen Punge, H.; Zhang, Q.; Groenemeijer, P.; Kunz, M.; Ortega, K. Understanding hail in the earth system. Rev. Geophys. 2020, 58, e2019RG000665. [Google Scholar] [CrossRef] [Scilit]
- Kunz, M.; Wandel, J.; Fluck, E.; Baumstark, S.; Mohr, S.; Schemm, S. Ambient conditions prevailing during hail events in central Europe. Nat. Hazards Earth Syst. Sci. 2020, 20, 1867–1887. [Google Scholar] [CrossRef] [Scilit]
- Wilhelm, J.; Mohr, S.; Punge, H.J.; Mühr, B.; Schmidberger, M.; Daniell, J.E.; Bedka, K.M.; Kunz, M. Severe thunderstorms with large hail across Germany in June 2019. Weather 2021, 76, 228–237. [Google Scholar] [CrossRef] [Scilit]
- Battaglioli, F.; Groenemeijer, P.; Púčik, T.; Taszarek, M.; Ulbrich, U.; Rust, H. Modeled multidecadal trends of lightning and (very) large hail in Europe and North America (1950–2021). J. Appl. Meteorol. Climatol. 2023, 62, 1627–1653. [Google Scholar] [CrossRef] [Scilit]
- Hulton, F.; Schultz, D.M. Climatology of large hail in Europe: Characteristics of the European Severe Weather Database. Nat. Hazards Earth Syst. Sci. 2024, 24, 1079–1098. [Google Scholar] [CrossRef] [Scilit]
- Kahraman, A.; Kendon, E.J.; Fowler, H.J. Climatology of severe hail potential in Europe based on a convection-permitting simulation. Clim. Dyn. 2024, 62, 6625–6642. [Google Scholar] [CrossRef] [Scilit] [PubMed]
- Dotzek, N.; Groenemeijer, P.; Feuerstein, B.; Holzer, A.M. Overview of ESSL’s severe convective storms research using the European Severe Weather Database ESWD. Atmos. Res. 2009, 93, 575–586. [Google Scholar] [CrossRef] [Scilit]
- European Severe Weather Database (ESWD). Available online: https://eswd.eu/ (accessed on 22 March 2026).
- Púčik, T.; Castellano, C.; Groenemeijer, P.; Kühne, T.; Rädler, A.T.; Antonescu, B.; Faust, E. Large hail incidence and its economic and societal impacts across Europe. Mon. Weather Rev. 2019, 147, 3901–3916. [Google Scholar] [CrossRef] [Scilit]
- Campanialive Meteorological Community. Available online: https://www.campanialive.it/ (accessed on 15 November 2025).
- Capozzi, V.; Picciotti, E.; Budillon, G.; Marzano, F.S. X-band weather radar monitoring of precipitation fields in Naples urban areas: Data quality, comparison and analysis. In Proceedings of the Eighth European Conference on Radar in Meteorology and Hydrology, Garmisch-Partenkirchen, Germany, 1–5 September 2014; Volume 25. [Google Scholar]
- Fulton, R.A.; Breidenbach, J.P.; Seo, D.J.; Miller, D.A. The WSR-88D rainfall algorithm. Weather Forecast. 1998, 13, 377–395. [Google Scholar] [CrossRef] [Scilit]
- Greene, D.R.; Clark, R.A. Vertically integrated liquid water-A new analysis tool. Mon. Weather Rev. 1972, 100, 548–552. [Google Scholar] [CrossRef] [Scilit]
- Biron, D. LAMPINET—Lightning Detection in Italy. In Lightning: Principles, Instruments and Applications; Betz, H., Schumann, U., Laroche, P., Eds.; Springer: Dordrecht, The Netherlands, 2009; pp. 141–159. [Google Scholar] [CrossRef] [Scilit]
- Rosati, V. I principi della lightning detection: La rete LAMPINET dell’Aeronautica Militare. Riv. Meteorol. Aeronaut. 2023, 3, 6–23. Available online: https://www.meteoam.it/rivista-di-meteorologia-aeronautica/edizione-luglio-settembre-2023 (accessed on 14 September 2026).
- Montanyà, J.; Soula, S.; Pineda, N. A study of the total lightning activity in two hailstorms. J. Geophys. Res. Atmos. 2007, 112, D13118. [Google Scholar] [CrossRef] [Scilit]
- Montanyà, J.; Soula, S.; Pineda, N.; van Der Velde, O.; Clapers, P.; Solà, G.; Bech, J.; Romero, D. Study of the total lightning activity in a hailstorm. Atmos. Res. 2009, 91, 430–437. [Google Scholar] [CrossRef] [Scilit]
- Nelson, S.P. The influence of storm flow structure on hail growth. J. Atmos. Sci. 1983, 40, 1965–1983. [Google Scholar] [CrossRef] [Scilit]
- Brimelow, J.C.; Reuter, G.W.; Poolman, E.R. Modeling maximum hail size in Alberta thunderstorms. Weather Forecast. 2002, 17, 1048–1062. [Google Scholar] [CrossRef] [Scilit]
- Mann, H.B.; Whitney, D.R. On a test of whether one of two random variables is stochastically larger than the other. Ann. Math. Stat. 1947, 18, 50–60. Available online: http://www.jstor.org/stable/2236101 (accessed on 23 October 2026). [CrossRef] [Scilit]
- Foote, G.B. A study of hail growth utilizing observed storm conditions. J. Clim. Appl. Meteorol. 1984, 23, 84–101. [Google Scholar] [CrossRef] [Scilit]
- Browning, K.A. The structure and mechanisms of hailstorms. In Hail: A Review of Hail Science and Hail Suppression; American Meteorological Society: Boston, MA, USA, 1977; pp. 1–47. [Google Scholar]
- Macklin, W.C. The characteristics of natural hailstones and their interpretation. In A Review of Hail Science and Hail Suppression; American Meteorological Society: Boston, MA, USA, 1977; pp. 65–91. [Google Scholar]
- Jewell, R.; Brimelow, J. Evaluation of Alberta hail growth model using severe hail proximity soundings from the United States. Weather Forecast. 2009, 24, 1592–1609. [Google Scholar] [CrossRef] [Scilit]
- Adams-Selin, R.D.; Ziegler, C.L. Forecasting hail using a one-dimensional hail growth model within WRF. Mon. Weather Rev. 2016, 144, 4919–4939. [Google Scholar] [CrossRef] [Scilit]
- Kumjian, M.R.; Lombardo, K. A hail growth trajectory model for exploring the environmental controls on hail size: Model physics and idealized tests. J. Atmos. Sci. 2020, 77, 2765–2791. [Google Scholar] [CrossRef] [Scilit]
- Knight, C.A.; Knight, N.C. Hailstorms. In Severe Convective Storms; American Meteorological Society: Boston, MA, USA, 2001; pp. 223–254. [Google Scholar]
- Rawlins, F. A numerical study of thunderstorm electrification using a three dimensional model incorporating the ice phase. Q. J. R. Meteorol. Soc. 1982, 108, 779–800. [Google Scholar] [CrossRef]
- Takahashi, T.; Tajiri, T.; Sonoi, Y. Charges on graupel and snow crystals and the electrical structure of winter thunderstorms. J. Atmos. Sci. 1999, 56, 1561–1578. [Google Scholar] [CrossRef] [Scilit]
- Hou, T.; Lei, H.; Hu, Z. Numerical simulation of the relationship between electrification and microphysics in the prelightning stage of thunderstorms. Atmos. Res. 2009, 91, 281–291. [Google Scholar] [CrossRef] [Scilit]
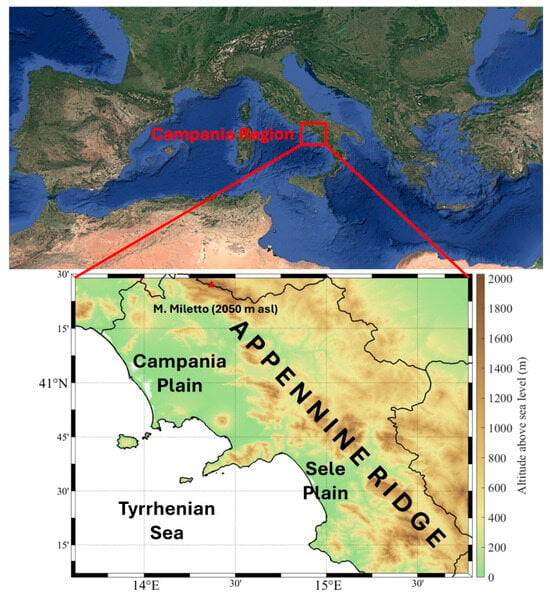
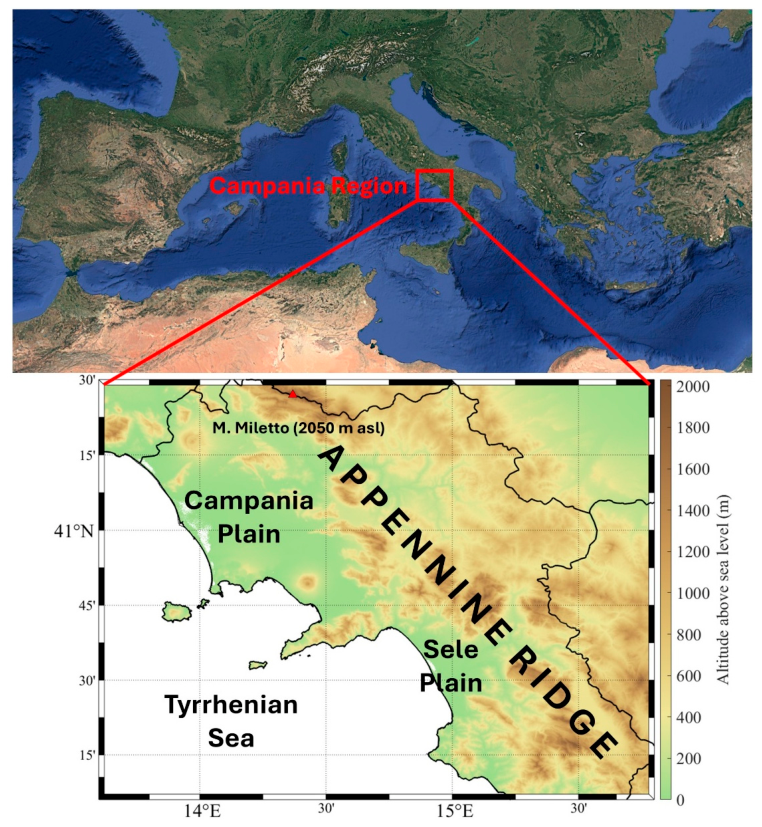
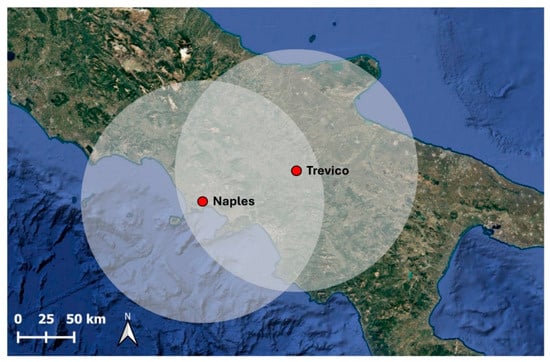
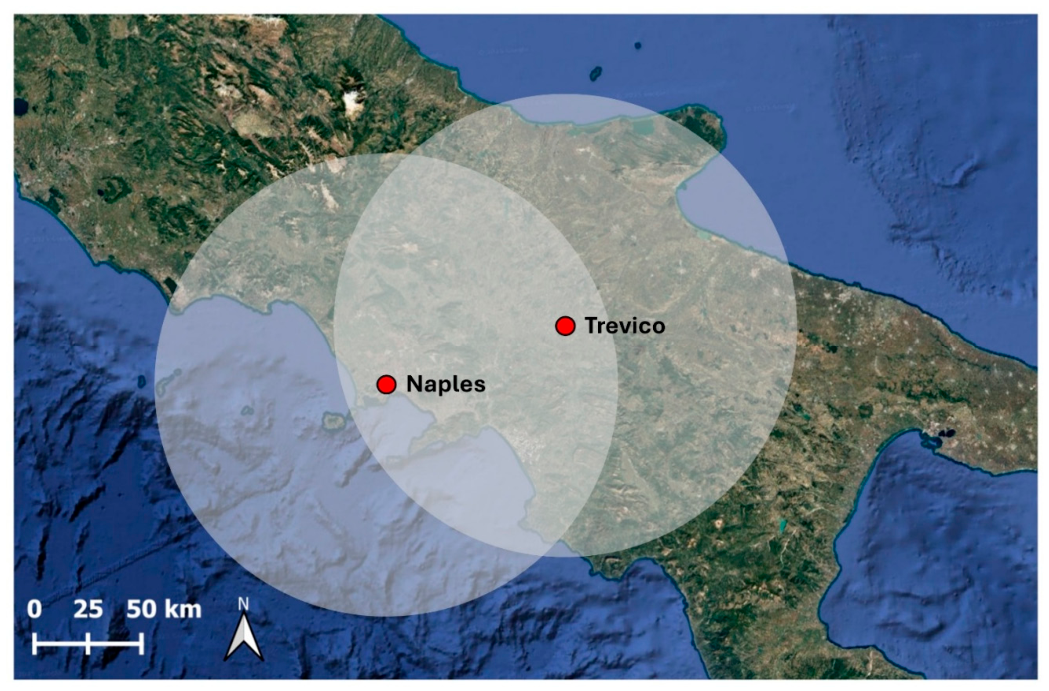
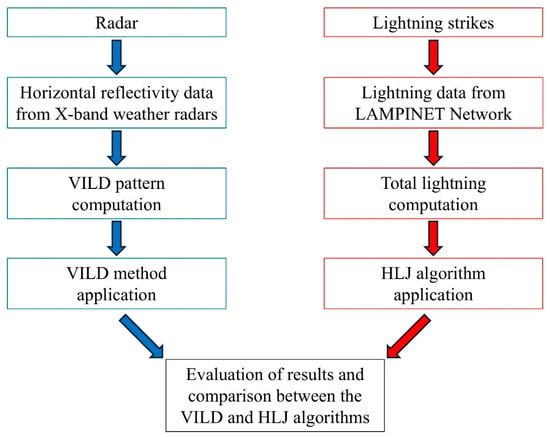
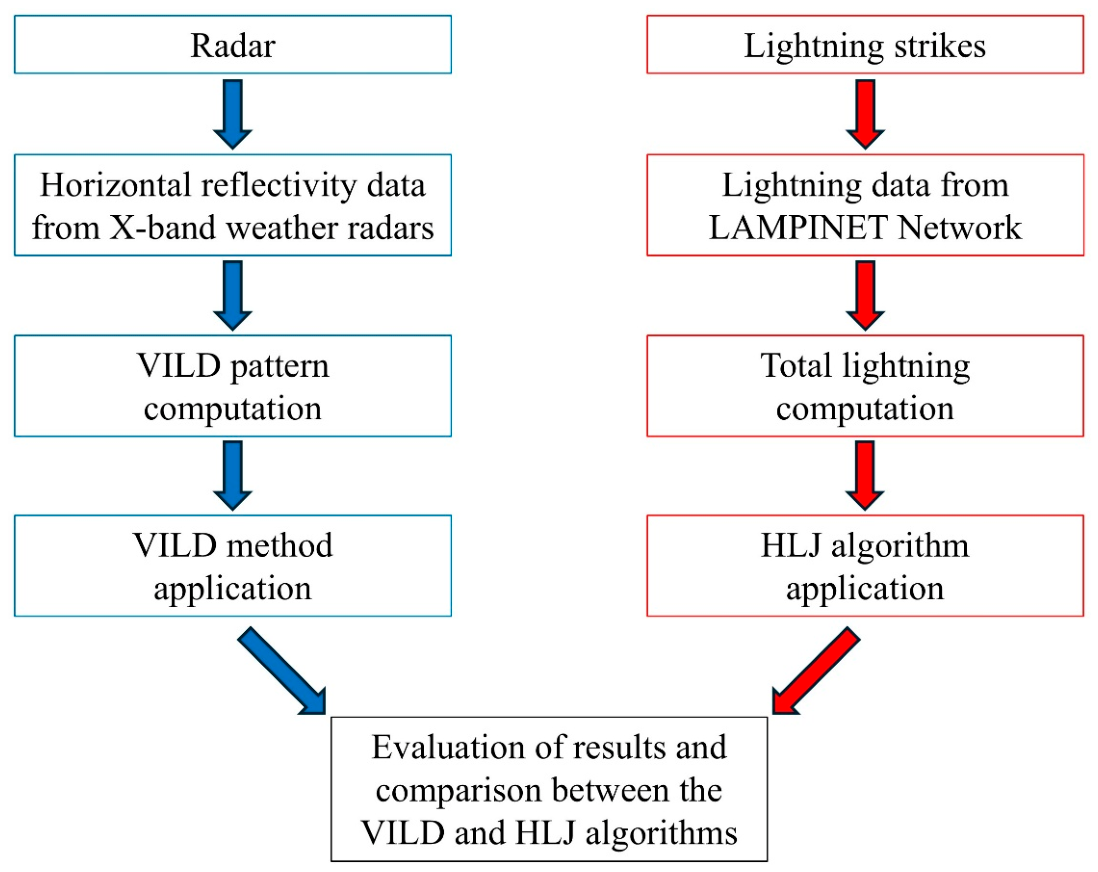
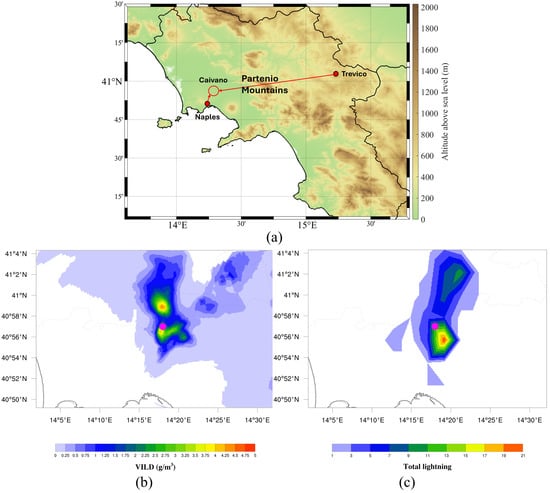
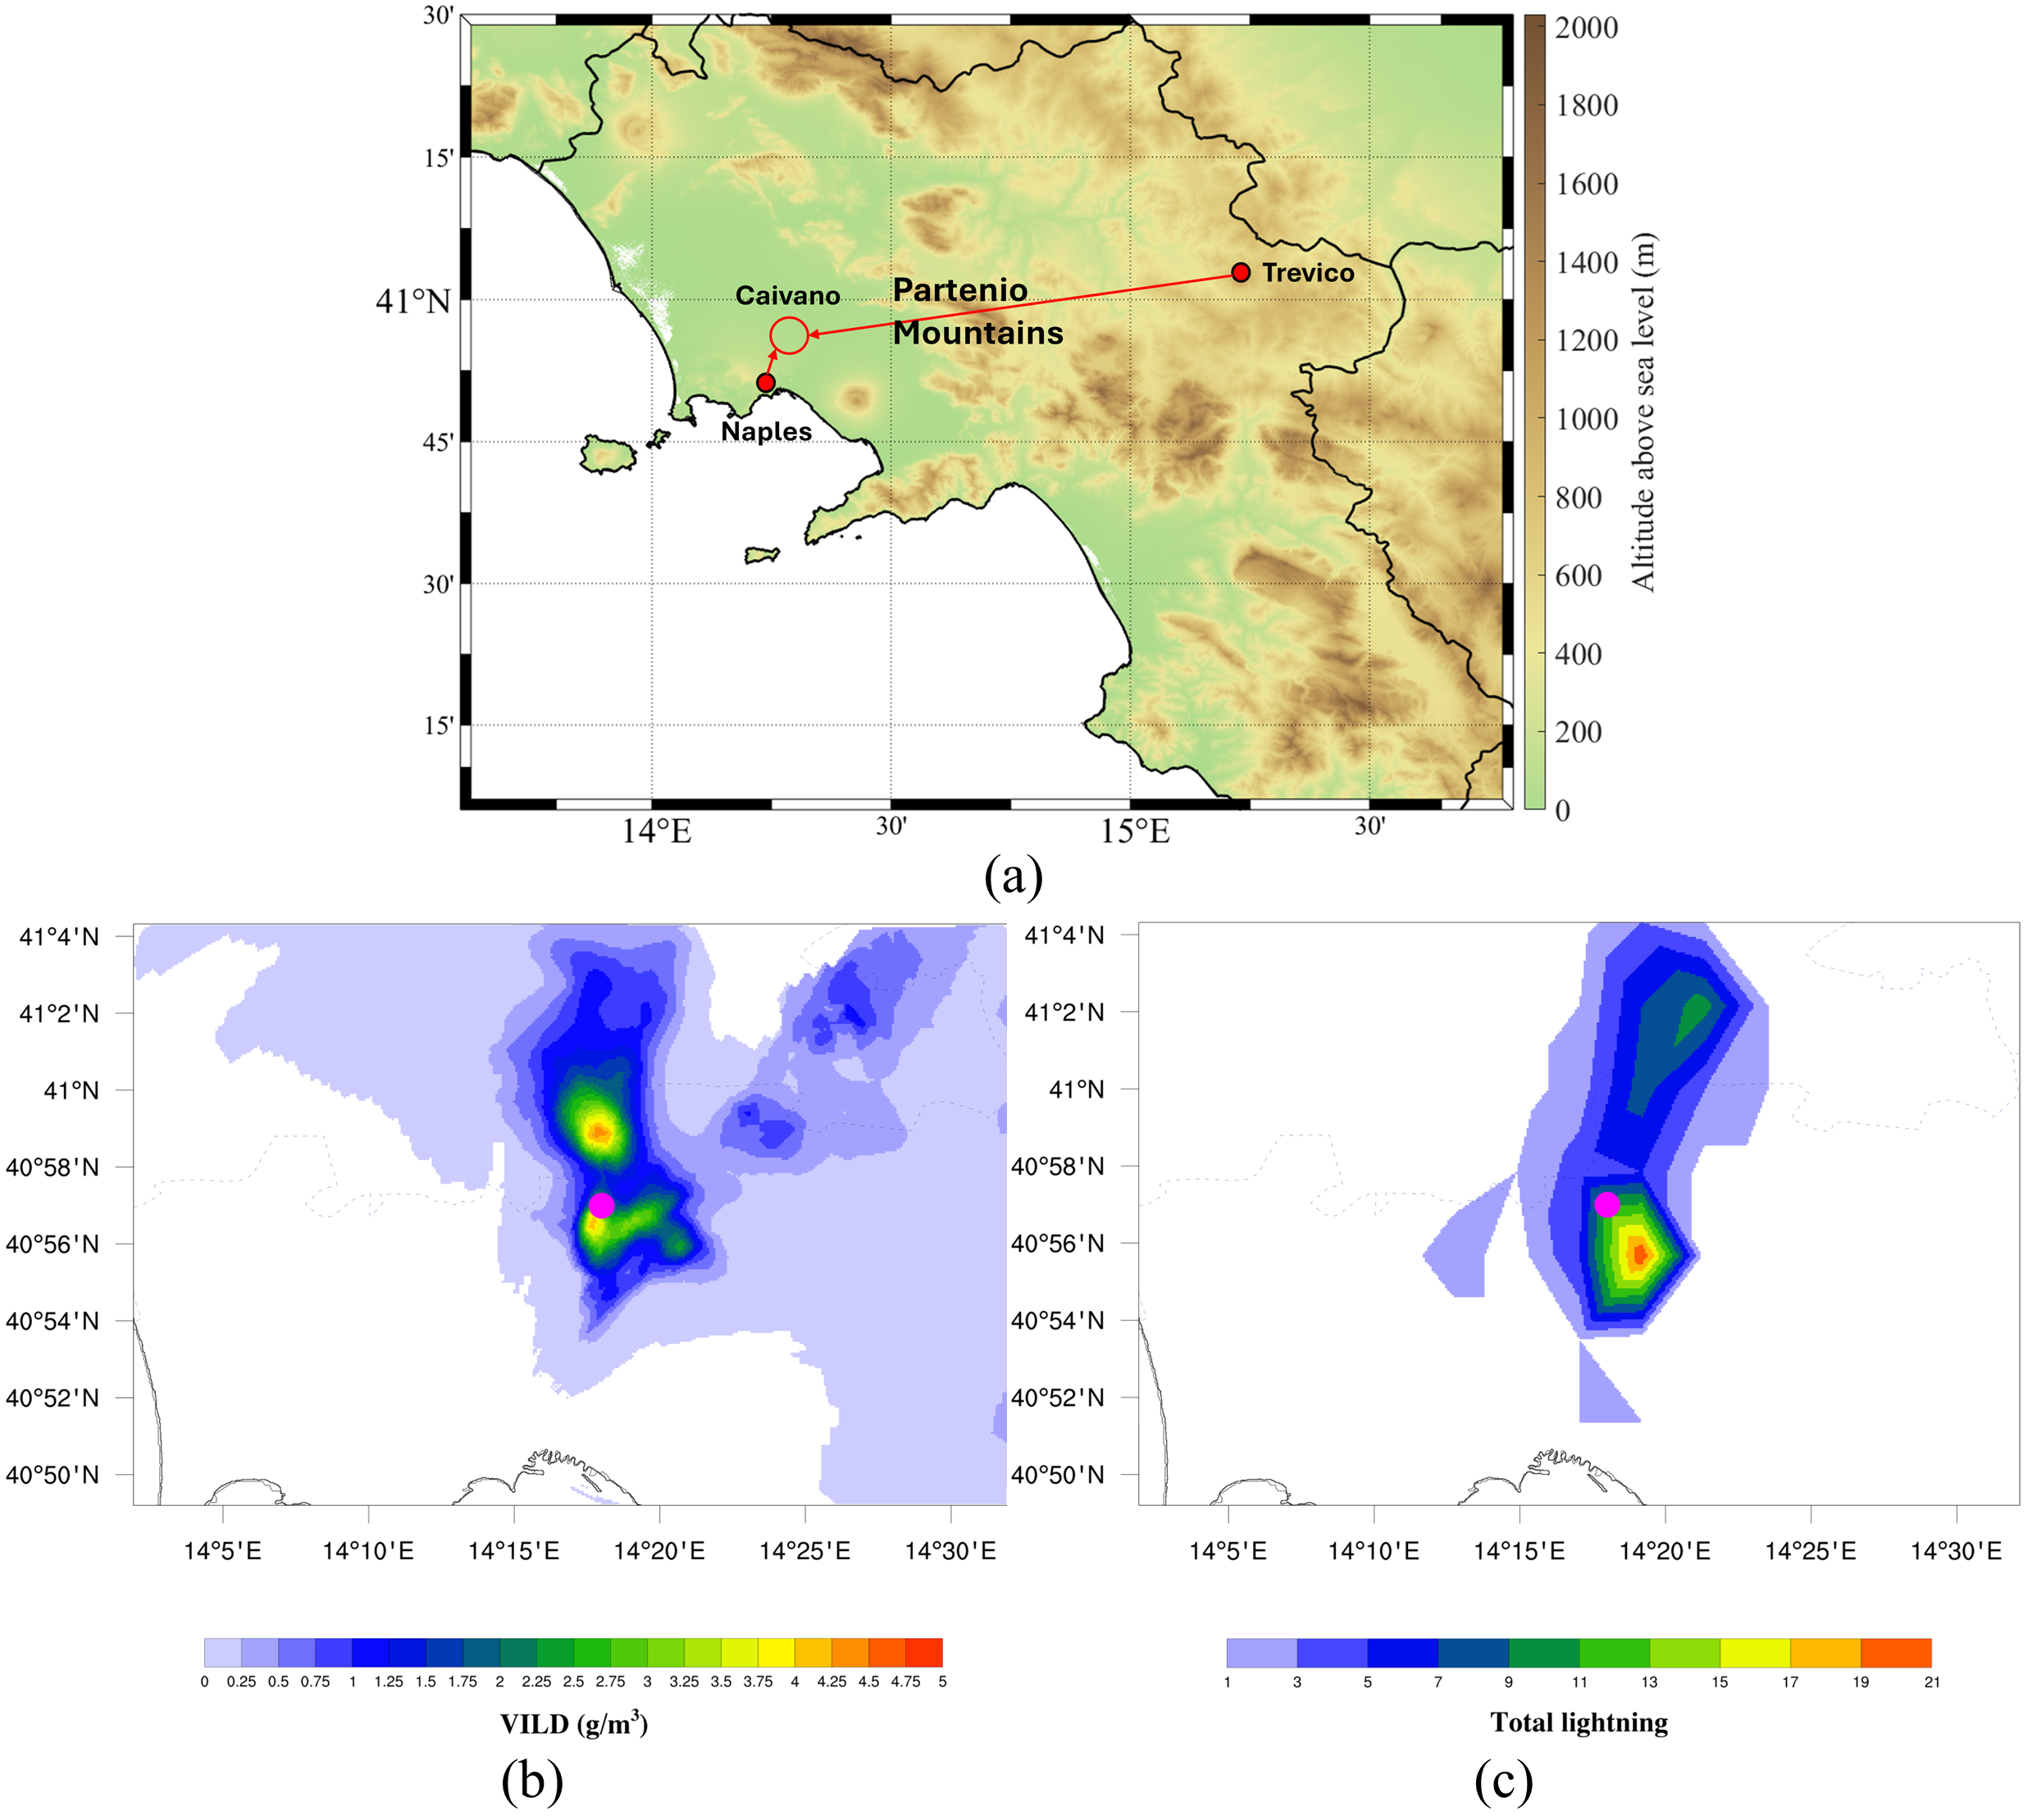
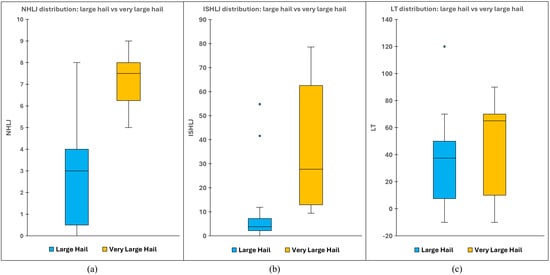
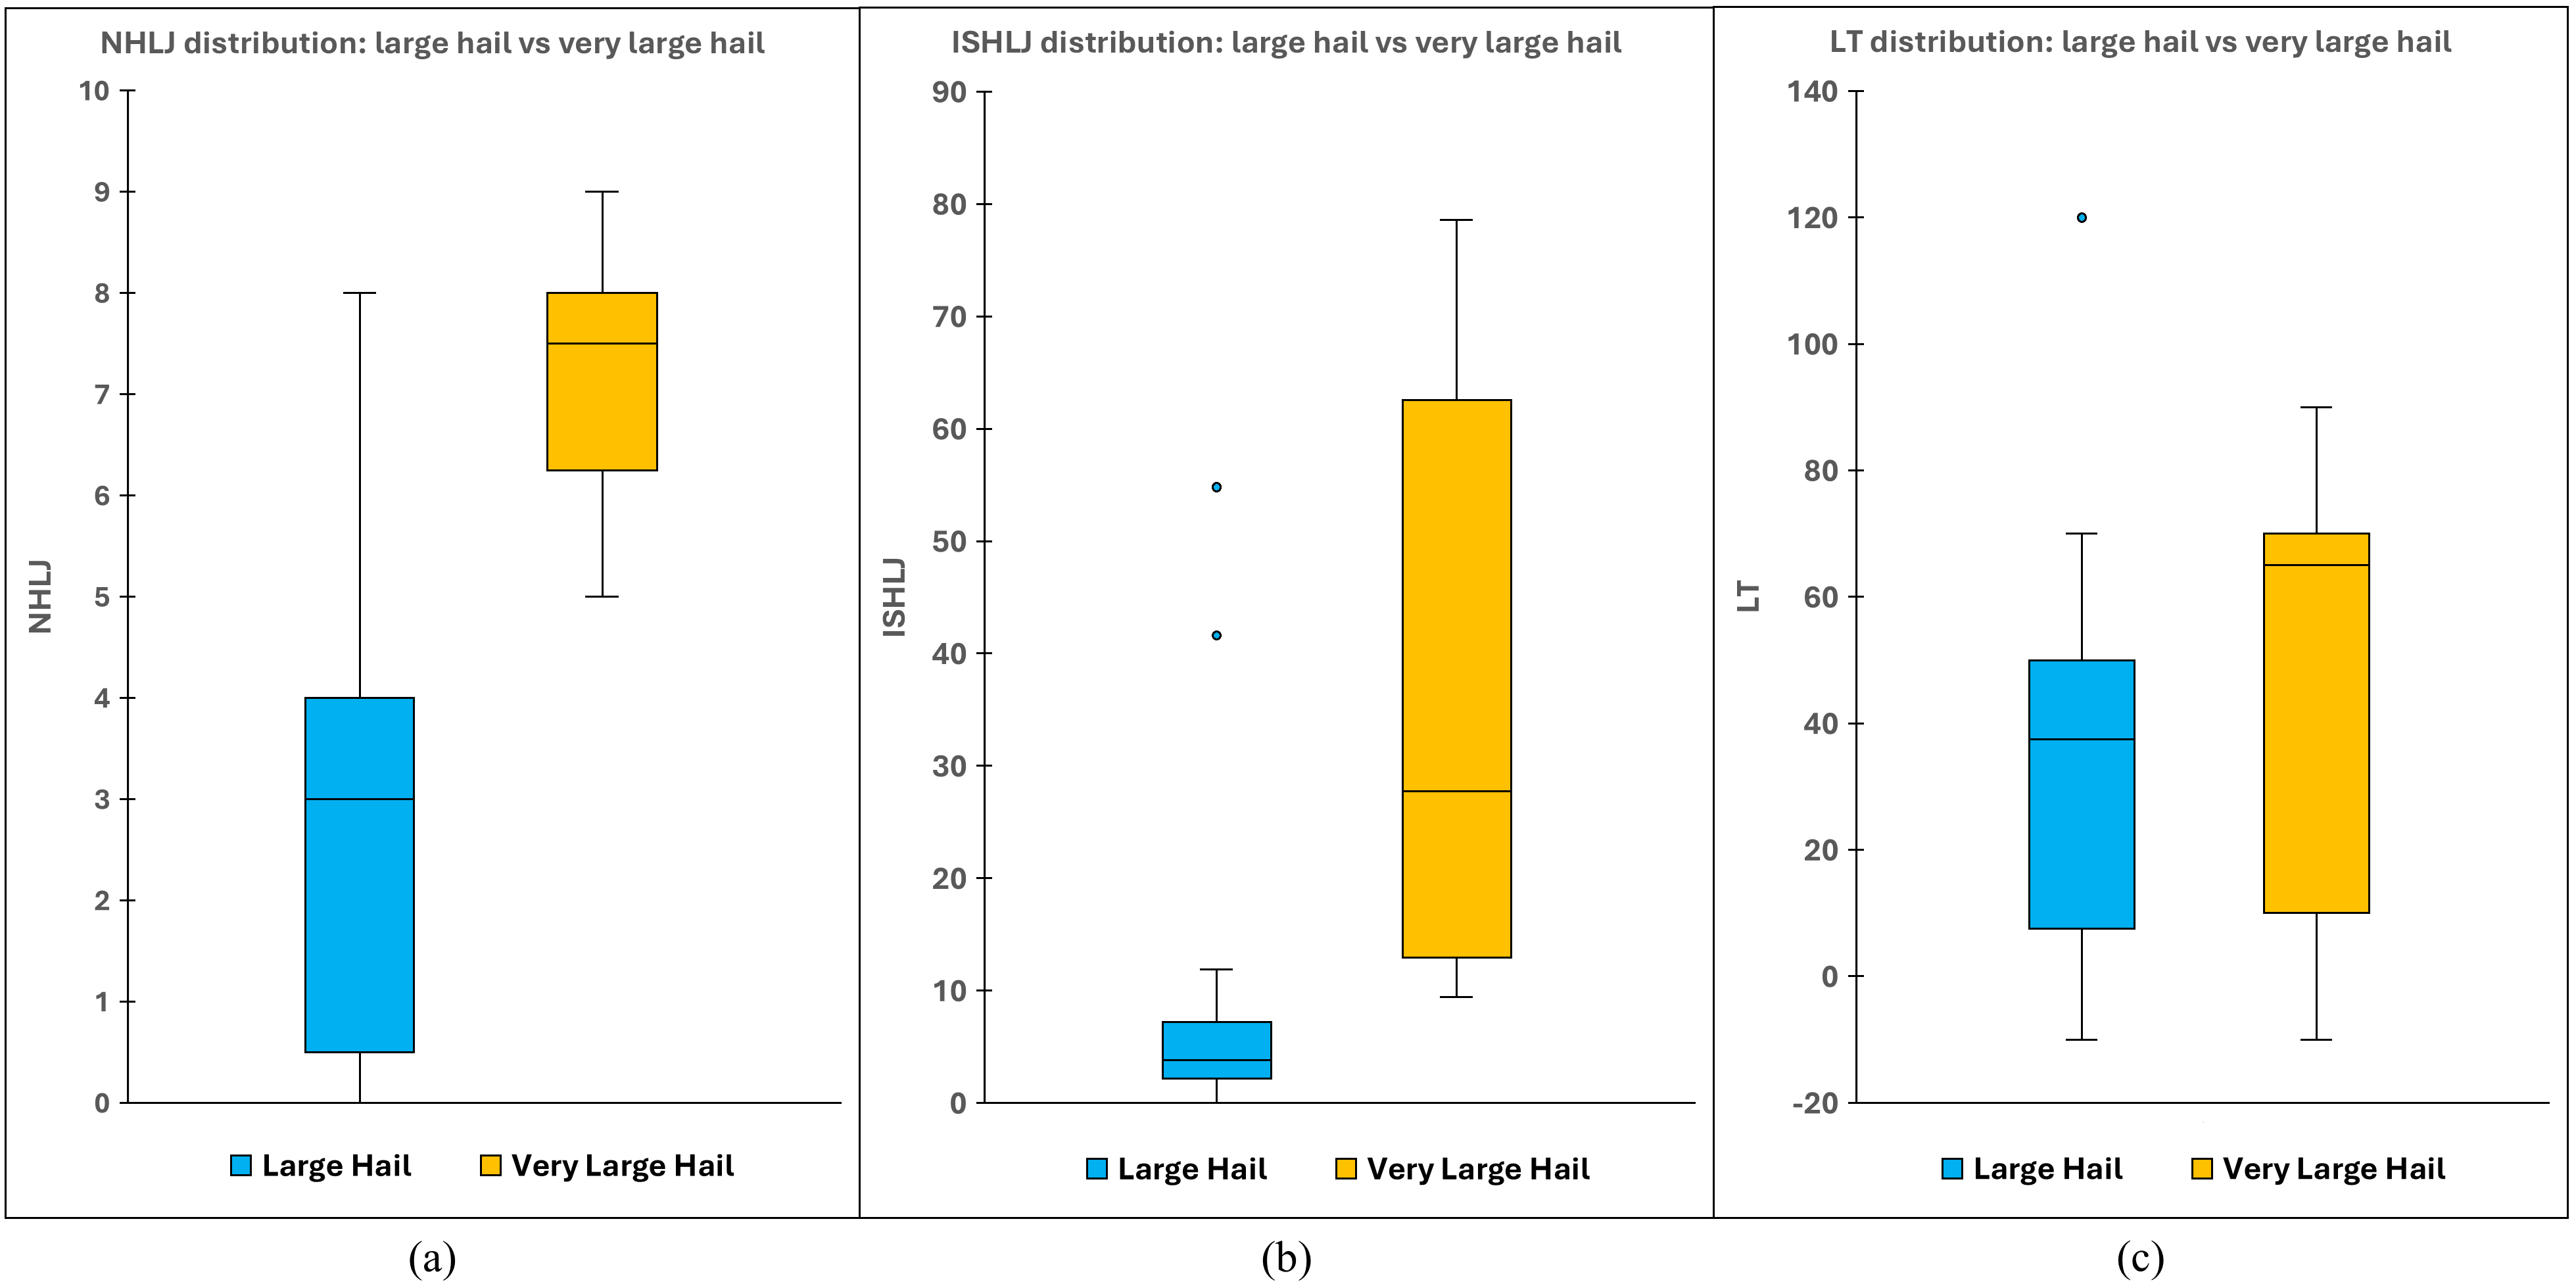
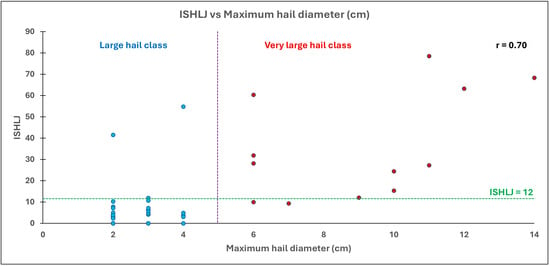
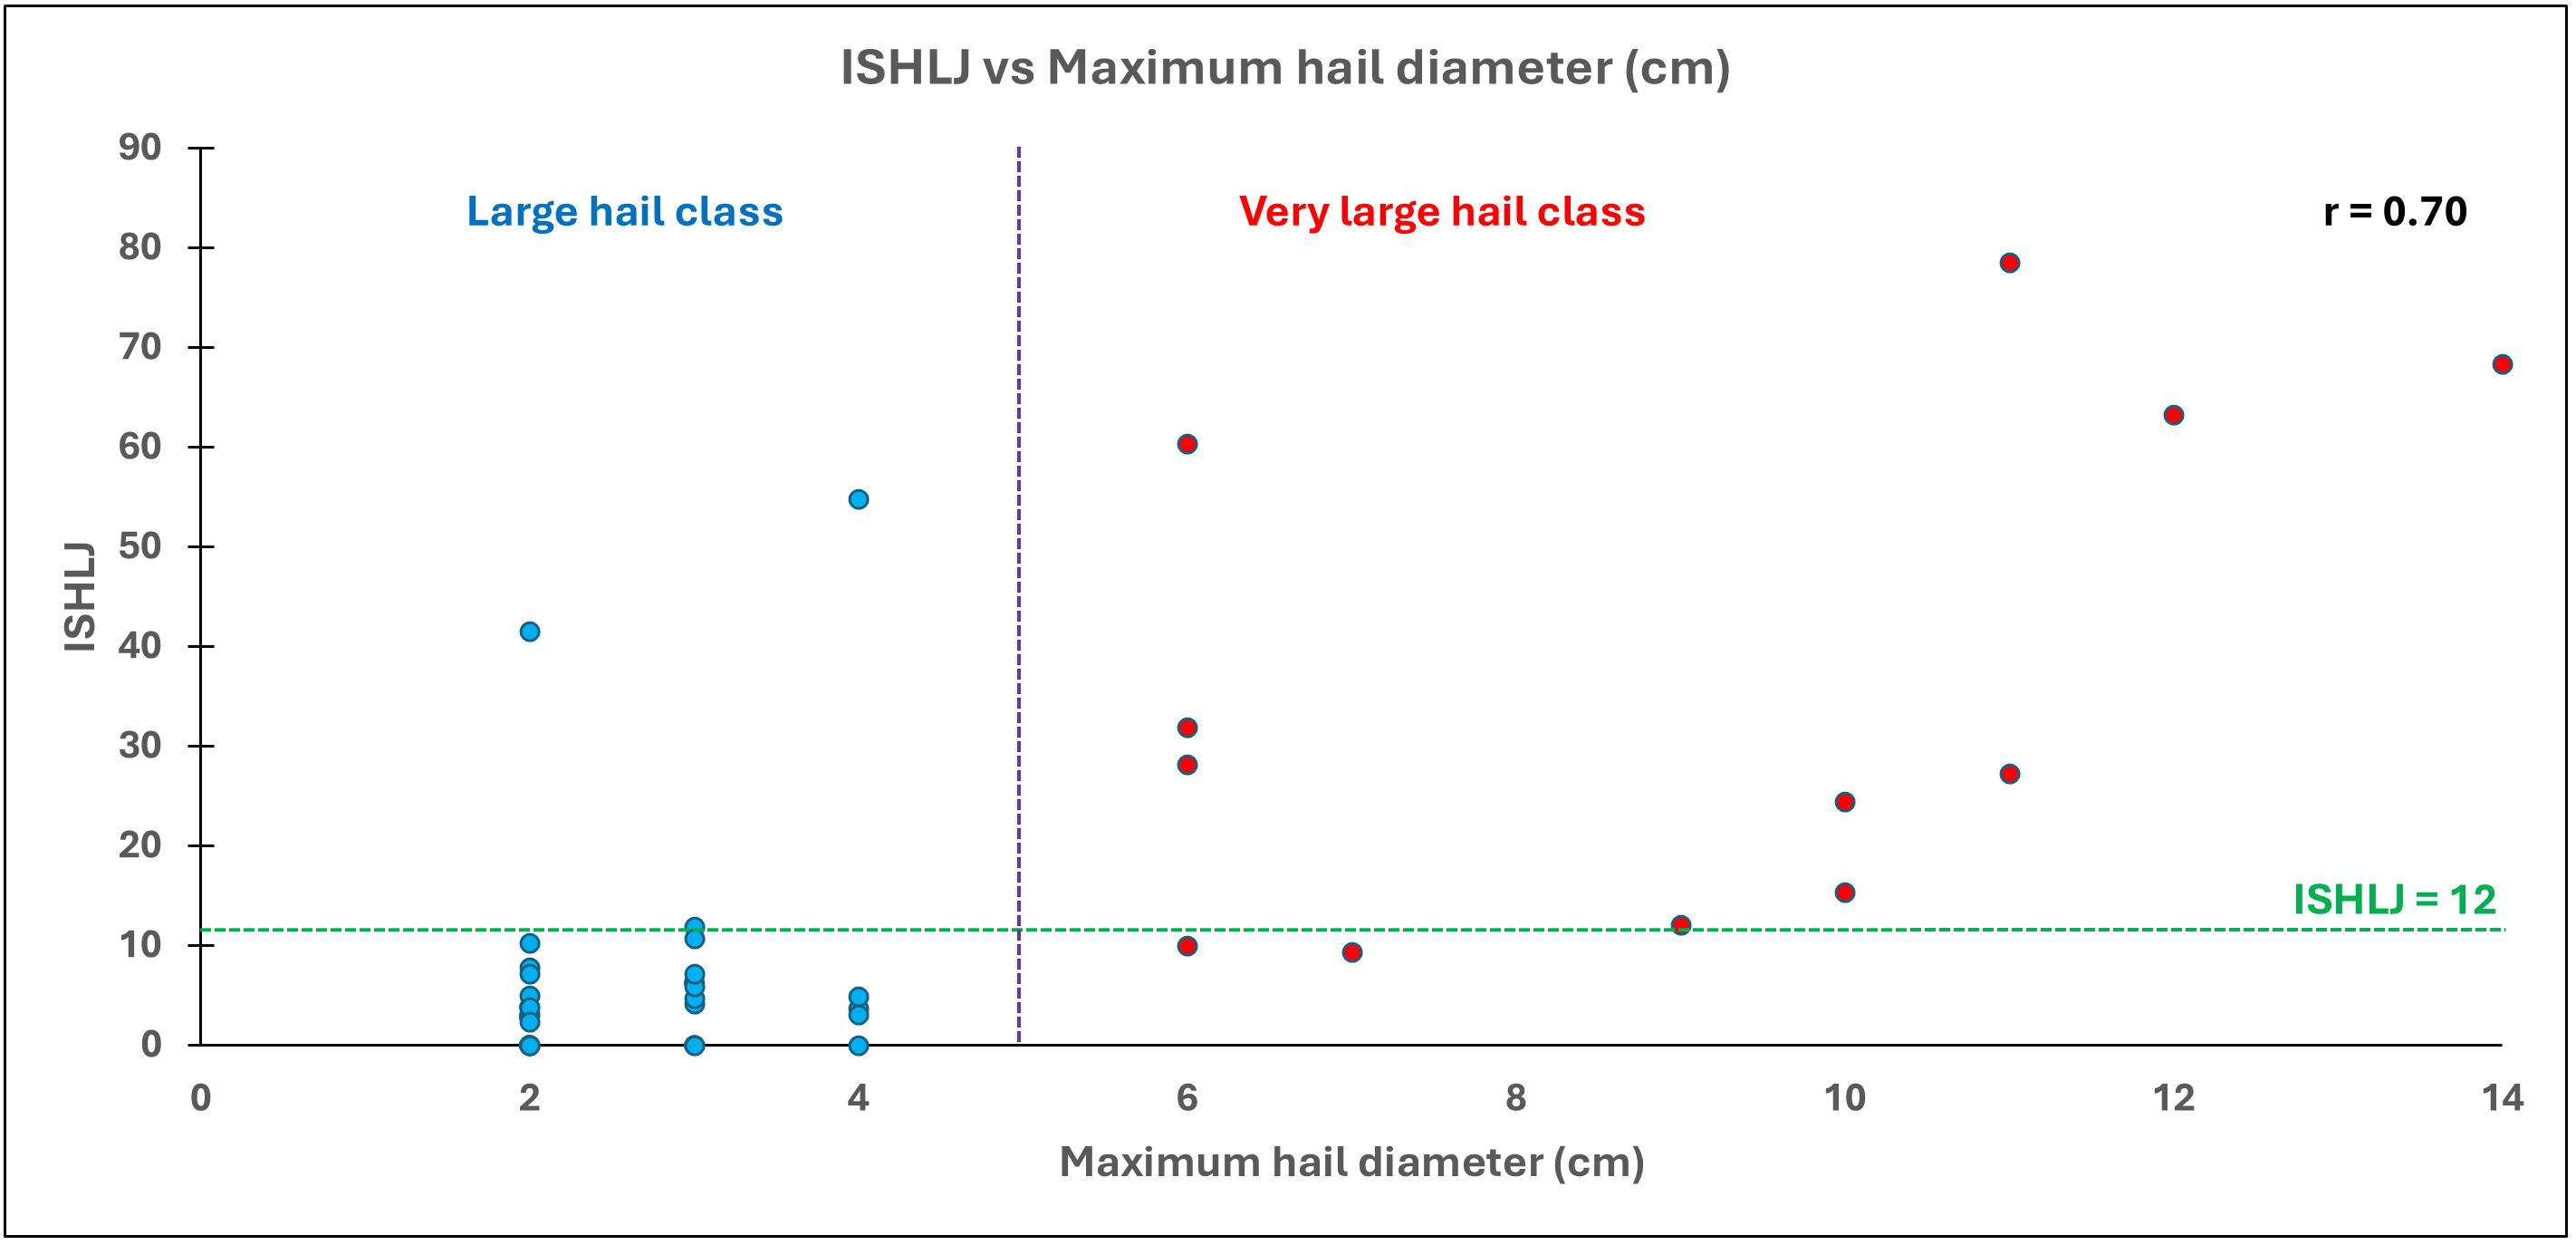
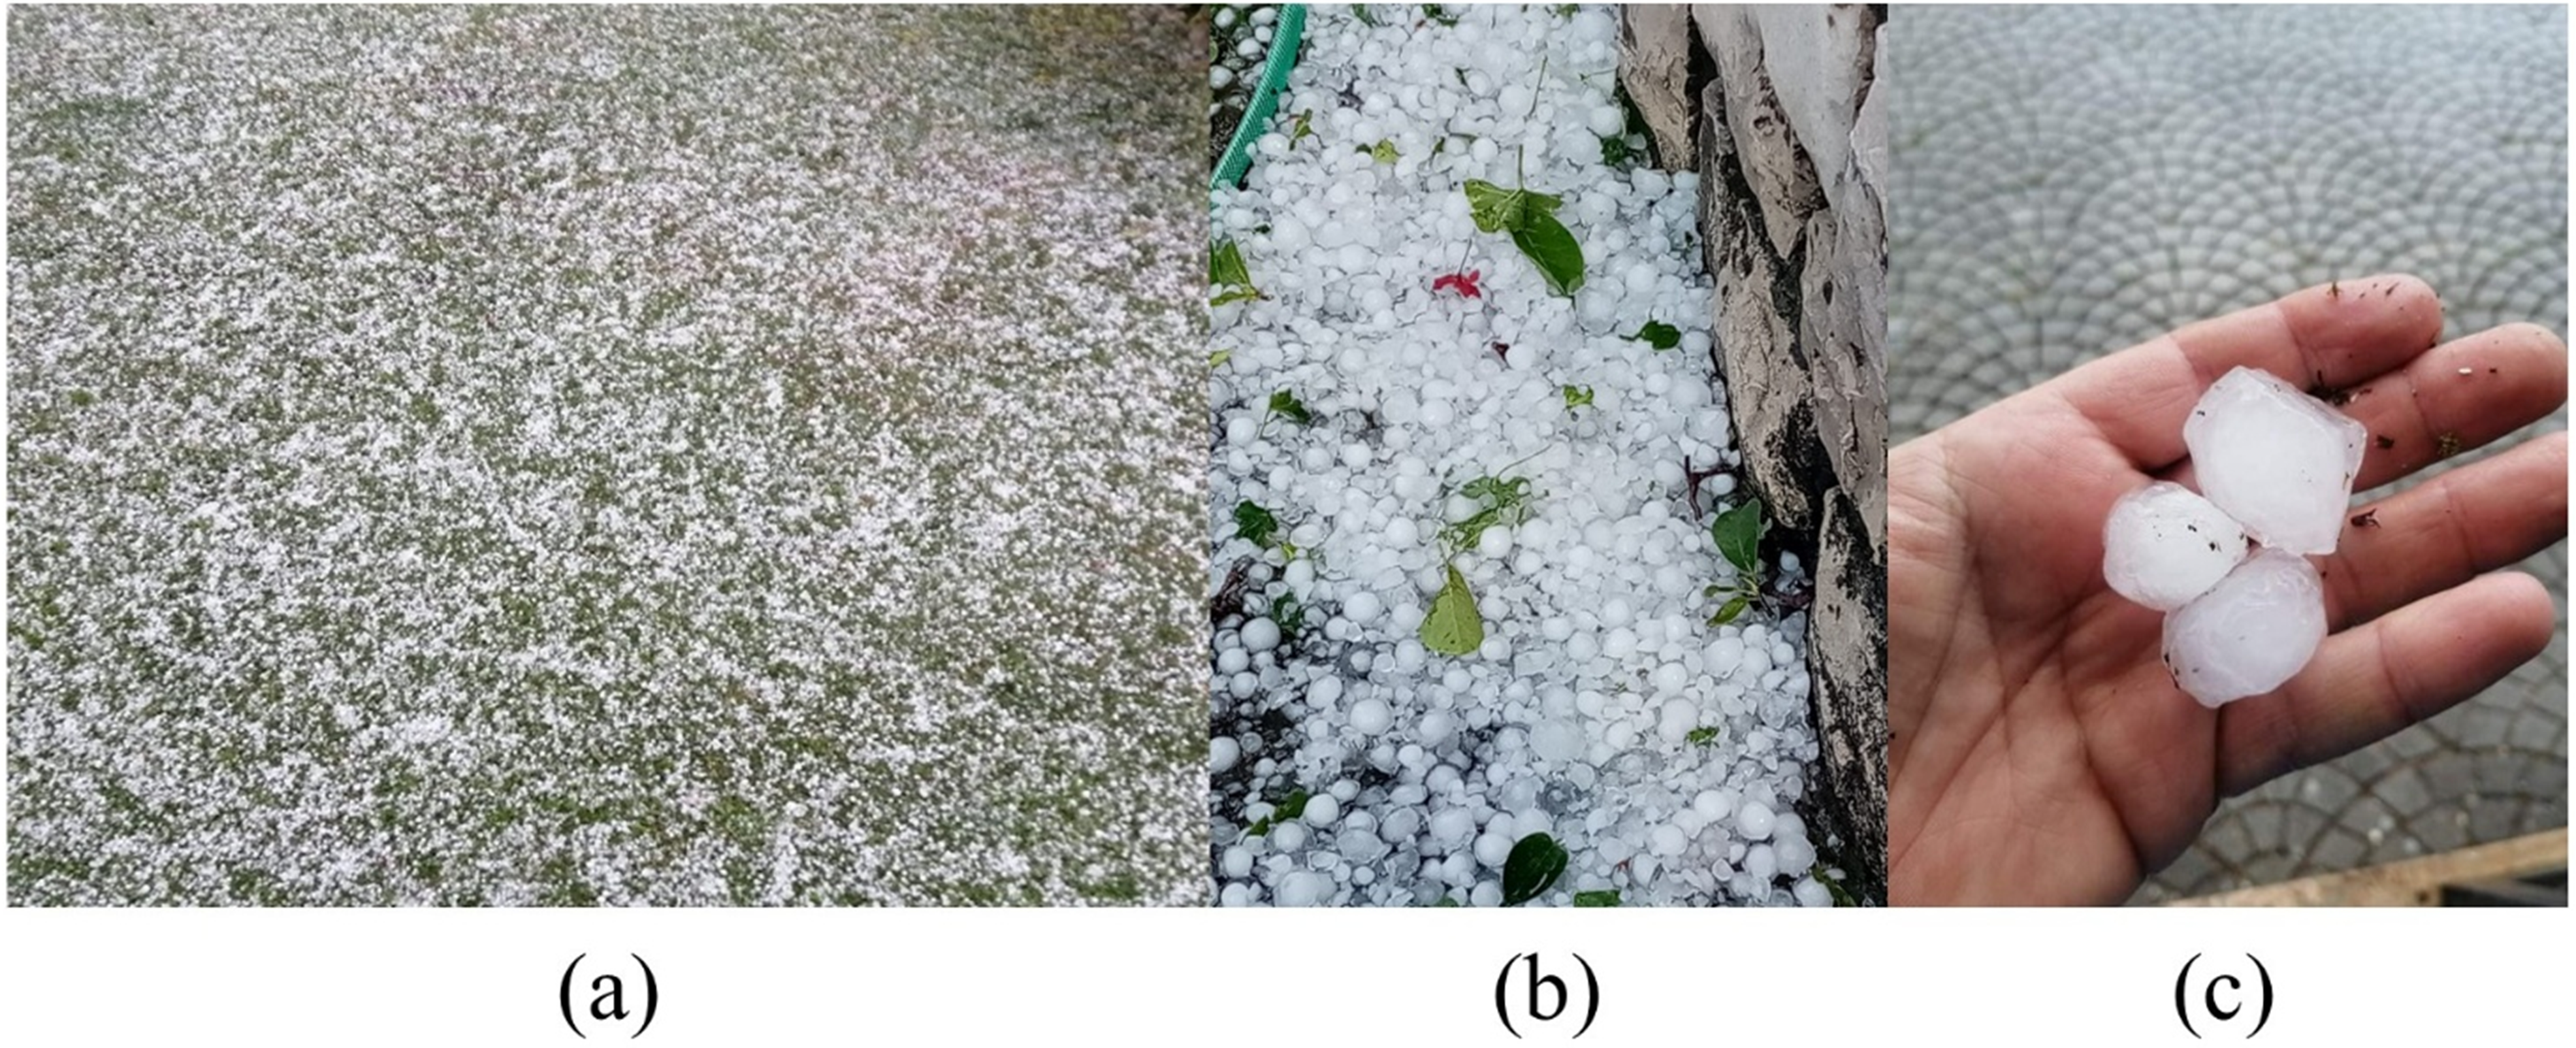
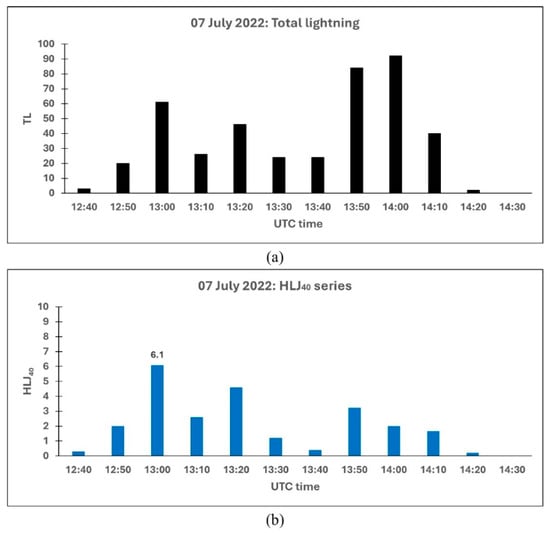
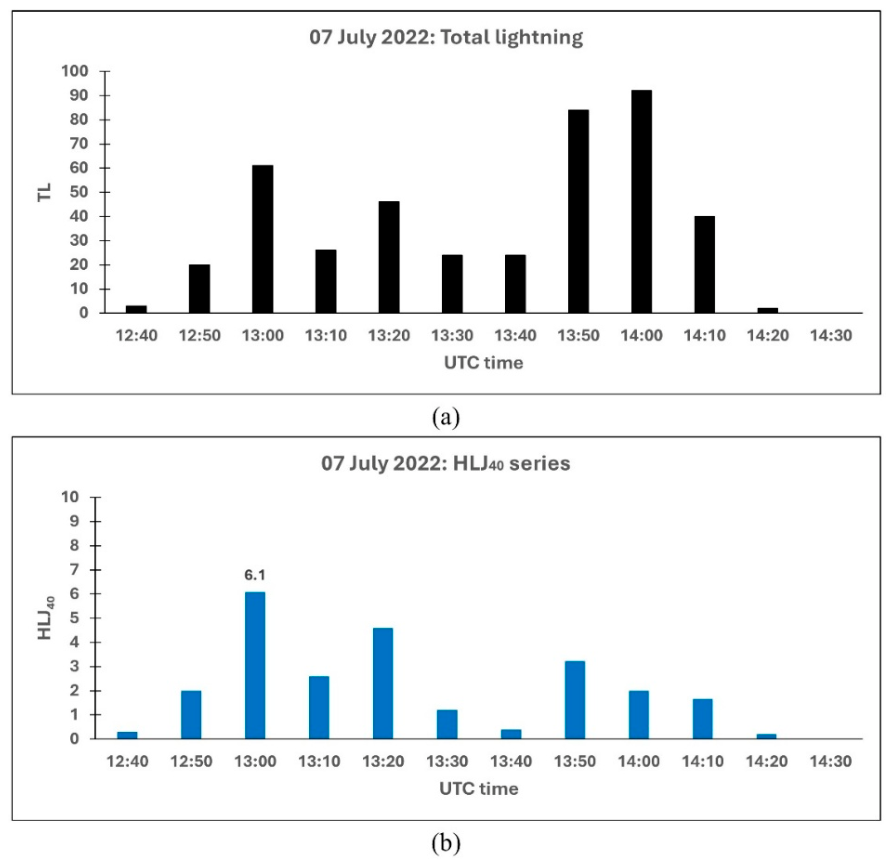
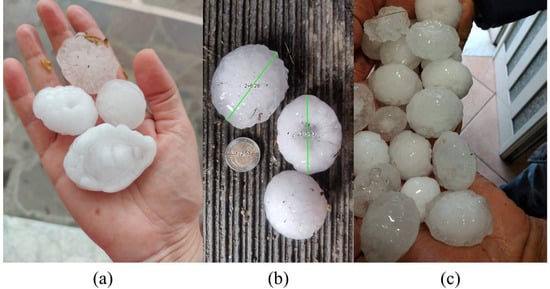
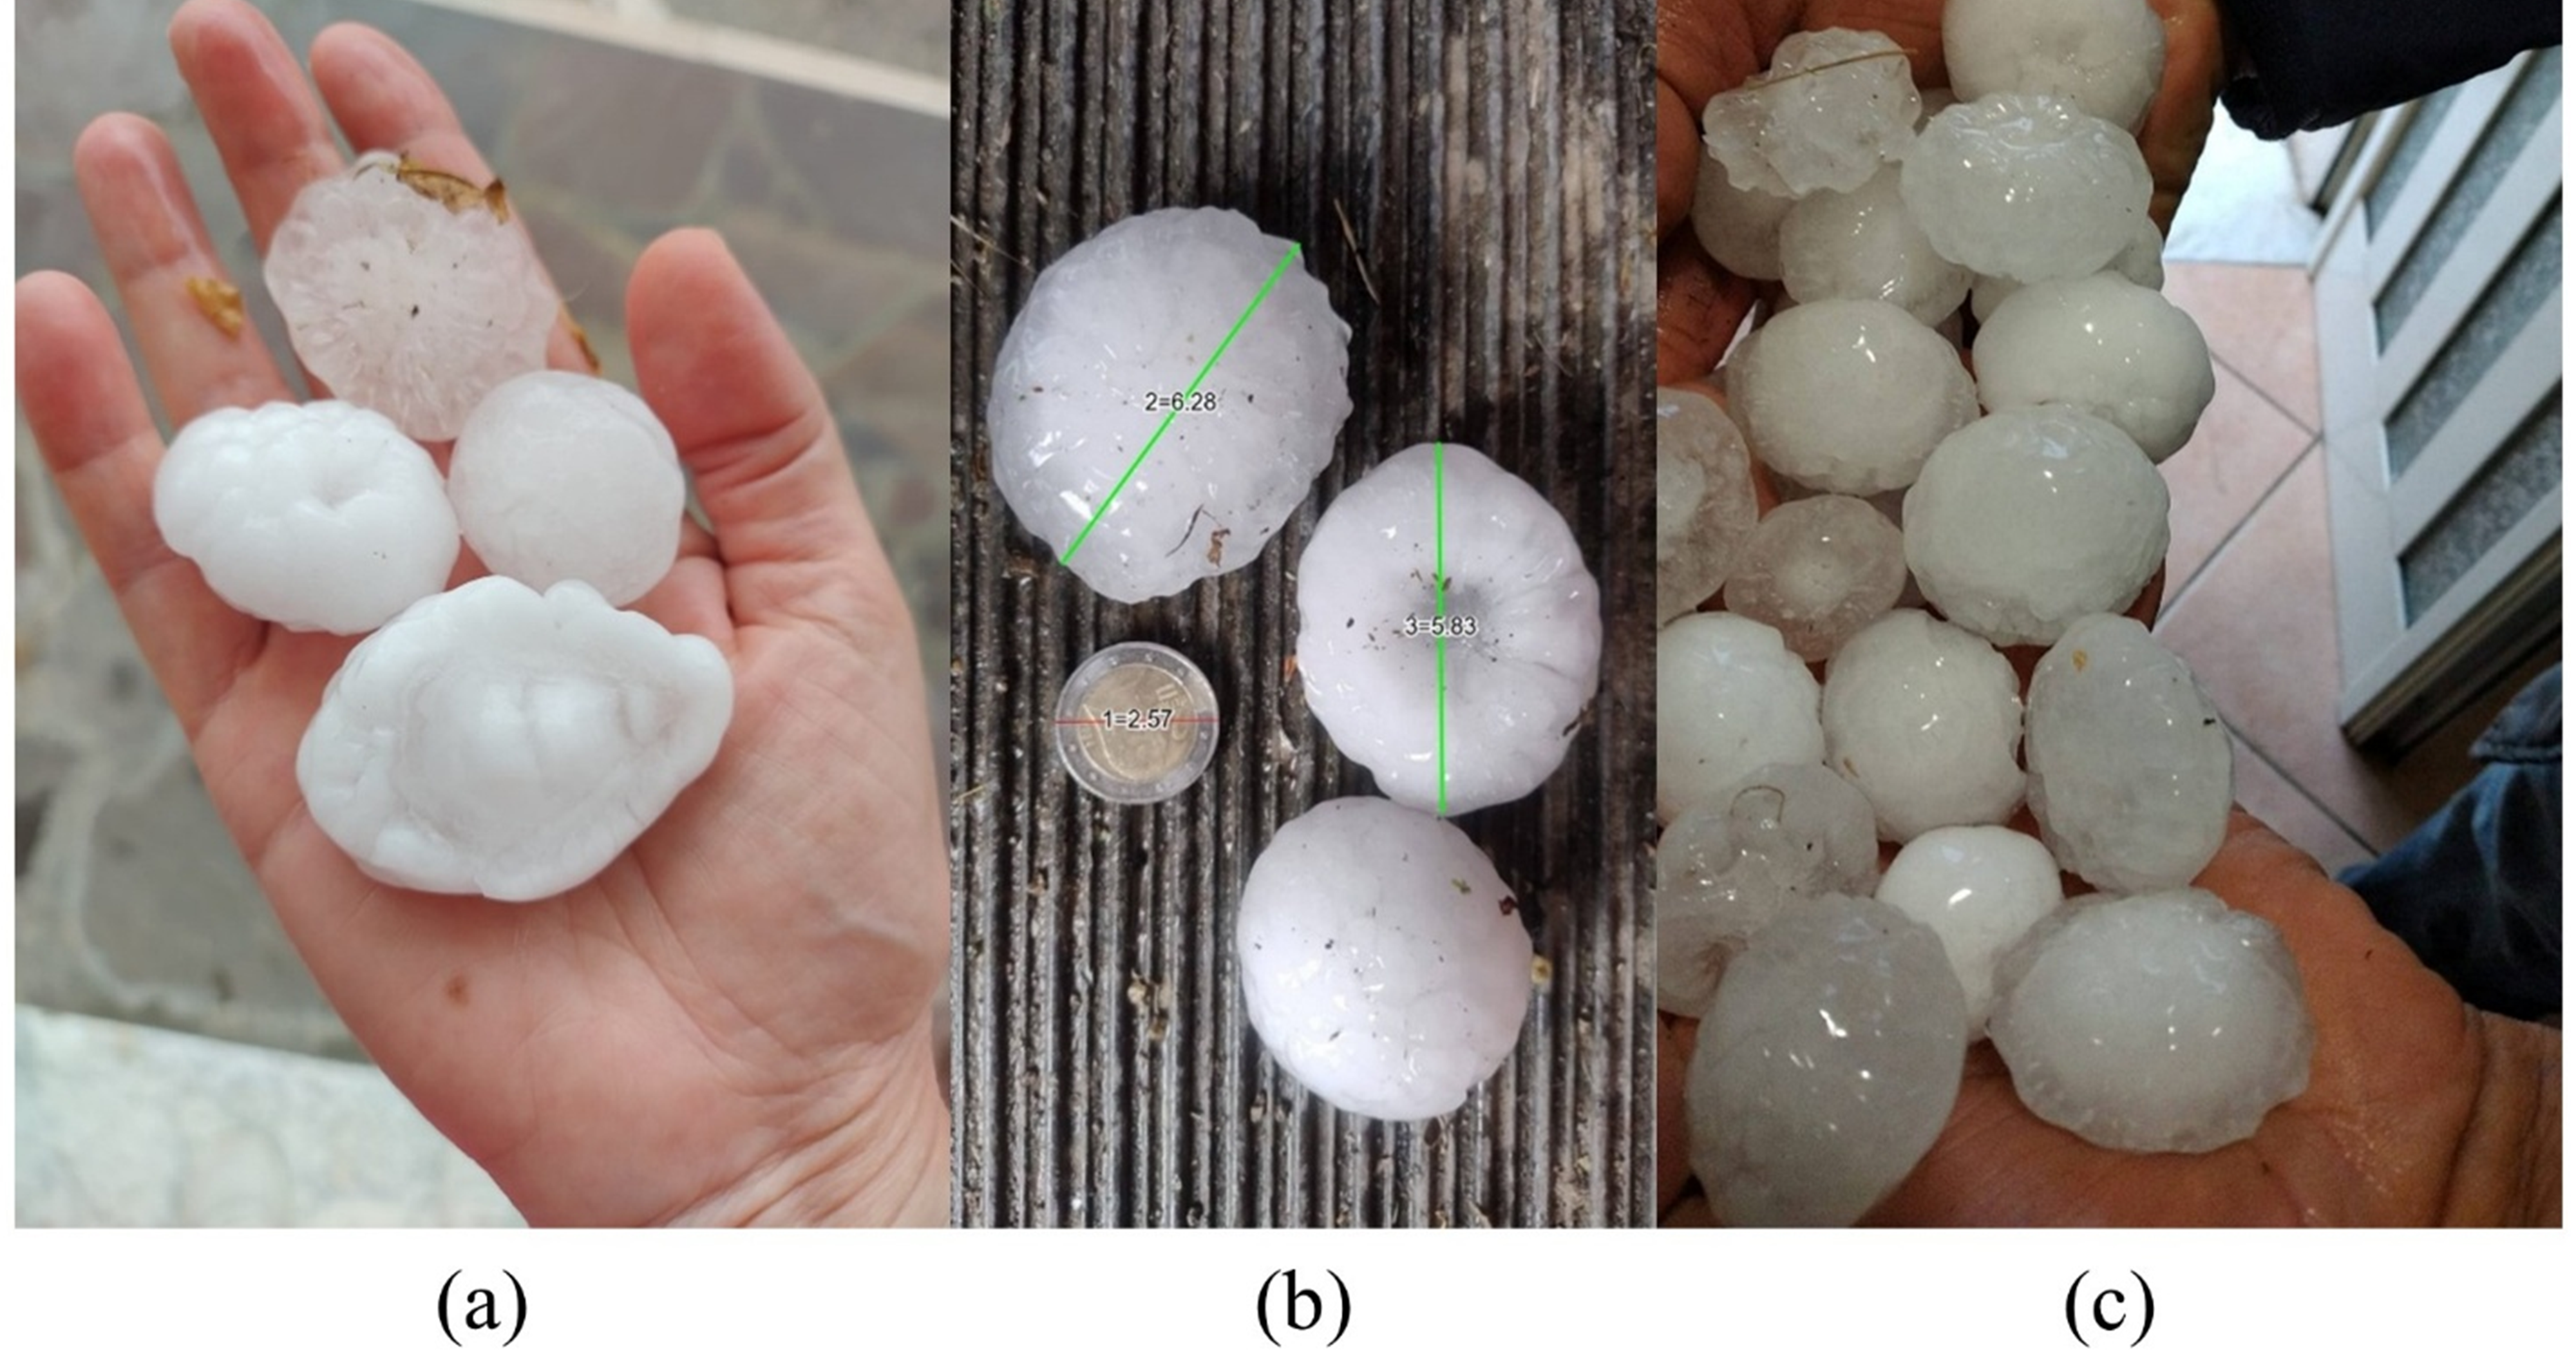
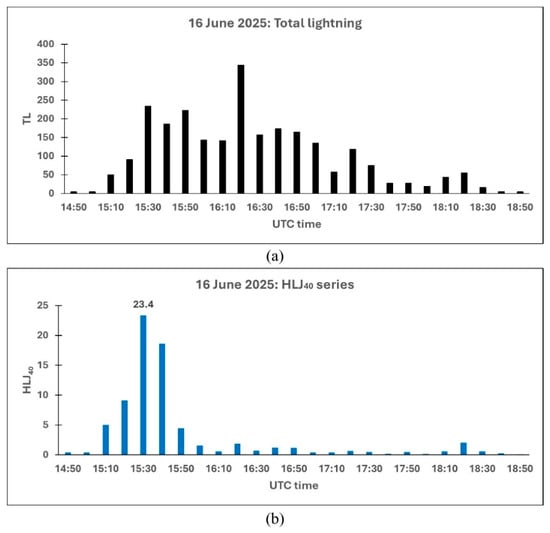
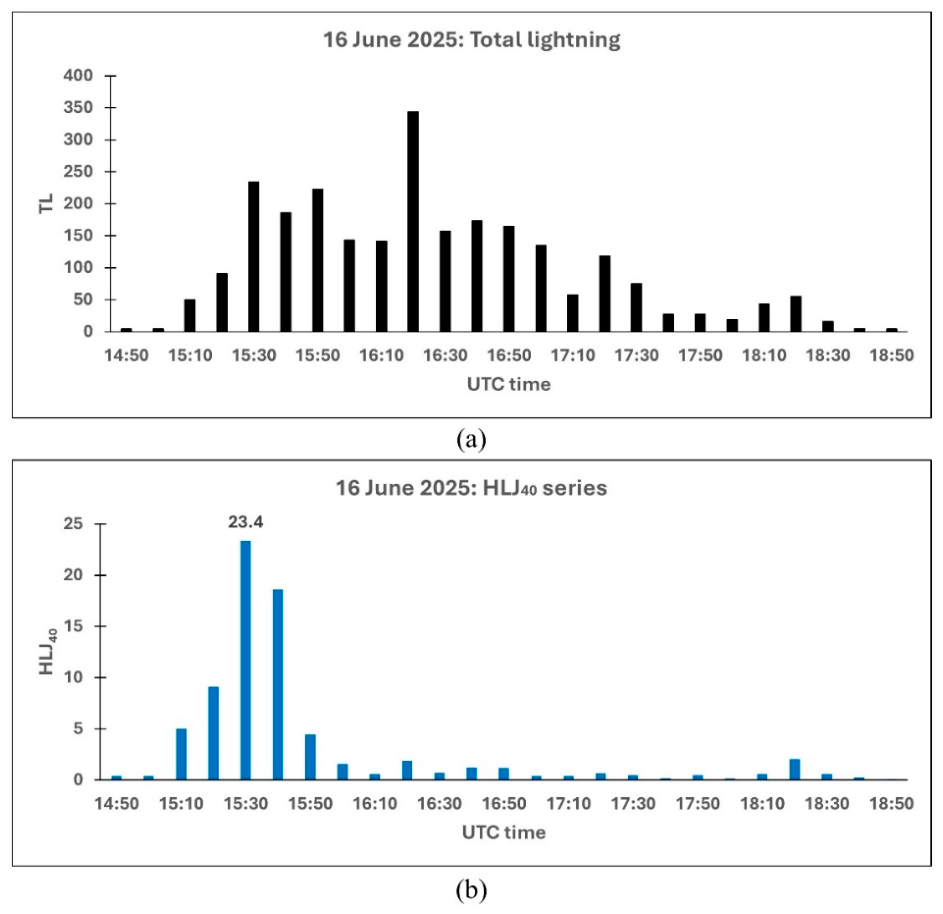

Disclaimer/Publisher’s Note: The statements, opinions and data contained in all publications are solely those of the individual author(s) and contributor(s) and not of MDPI and/or the editor(s). MDPI and/or the editor(s) disclaim responsibility for any injury to people or property resulting from any ideas, methods, instructions or products referred to in the content. |
© 2026 by the authors. Licensee MDPI, Basel, Switzerland. This article is an open access article distributed under the terms and conditions of the Creative Commons Attribution (CC BY) license.