


Highlights
What are the main findings?
- The complete shared-start-point framework yields higher pixel-level overlap than the evaluated alternatives and reconstructs each conductor by grouping keypoints around a common reference point.
- The proposed method achieves IoU/F1 scores of 85.76%/91.76% on PLDU and 75.23%/83.95% on TTPLA, and the highest IoU (70.44%) among the compared methods on CPLD.
What are the implications of the main findings?
- A shared global reference provides a useful grouping cue for thin conductors under occlusion, low contrast, and complex background interference.
- The framework targets offline analysis of UAV-acquired transmission-corridor imagery; onboard deployment would require separate edge-hardware validation.
Abstract
Unmanned aerial vehicle (UAV) optical remote sensing provides a flexible means of mapping and inspecting power-transmission corridors. However, the automatic extraction of power lines from aerial imagery remains challenging because conductors have slender geometry, weak texture, low contrast, and discontinuous visibility and are easily affected by imaging noise, occlusion, and complex background interference. Consequently, segmentation-based methods often produce fragmented masks that limit the reliability of subsequent structural reconstruction. This study presents a power line detection and reconstruction framework based on global keypoint regression for UAV optical imagery. Rather than recursively associating adjacent keypoints, the framework regresses every keypoint belonging to the same power line toward a common start point. This shared reference is designed to avoid recursive propagation through a chain of local associations. Three complementary components are incorporated: a multi-scale region-aware feature extractor (MSRAFE) for combining local and global semantics across scales, a line feature aggregation (LFA) module for adaptive multi-level feature fusion, and a linear structure-aware feature strategy (LSAFS) for coupling local geometric cues with global structural relationships. The method was evaluated on two public aerial-image benchmarks and a self-constructed dataset. It achieved intersection-over-union (IoU) and F1 scores of 85.76% and 91.76% on PLDU and 75.23% and 83.95% on TTPLA, respectively. On the self-constructed CPLD dataset, it obtained the highest IoU (70.44%) and precision (83.87%) among the compared methods. These pixel-level results support the performance of the complete framework for detecting thin linear objects in airborne optical remote sensing imagery.
1. Introduction
Power-transmission corridors form a spatially extensive component of modern energy infrastructure, and their reliable monitoring is essential for maintaining grid safety and continuity. Airborne remote sensing platforms, particularly unmanned aerial vehicles (UAVs) equipped with optical sensors, provide non-contact, high-resolution, and flexible image acquisition over corridors located in remote, complex, or hazardous environments. The UAV-based intelligent inspection of high-voltage and ultra-high-voltage transmission lines has therefore become an important approach to supporting early anomaly detection and preventive maintenance [1]. However, UAV optical imagery is affected by imaging noise, illumination variation, viewpoint changes, occlusion, and heterogeneous natural or urban backgrounds [2,3,4]. In addition, power lines are thin, weakly textured, and often represented by only a small number of low-contrast pixels. These properties make them difficult to distinguish from background structures and create a demanding remote sensing image interpretation problem. The accurate extraction of both their locations and structural continuity is thus important for converting aerial observations into reliable information for automated corridor inspection.
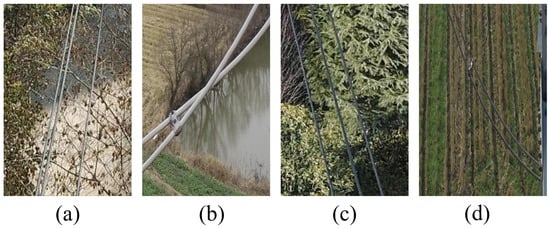
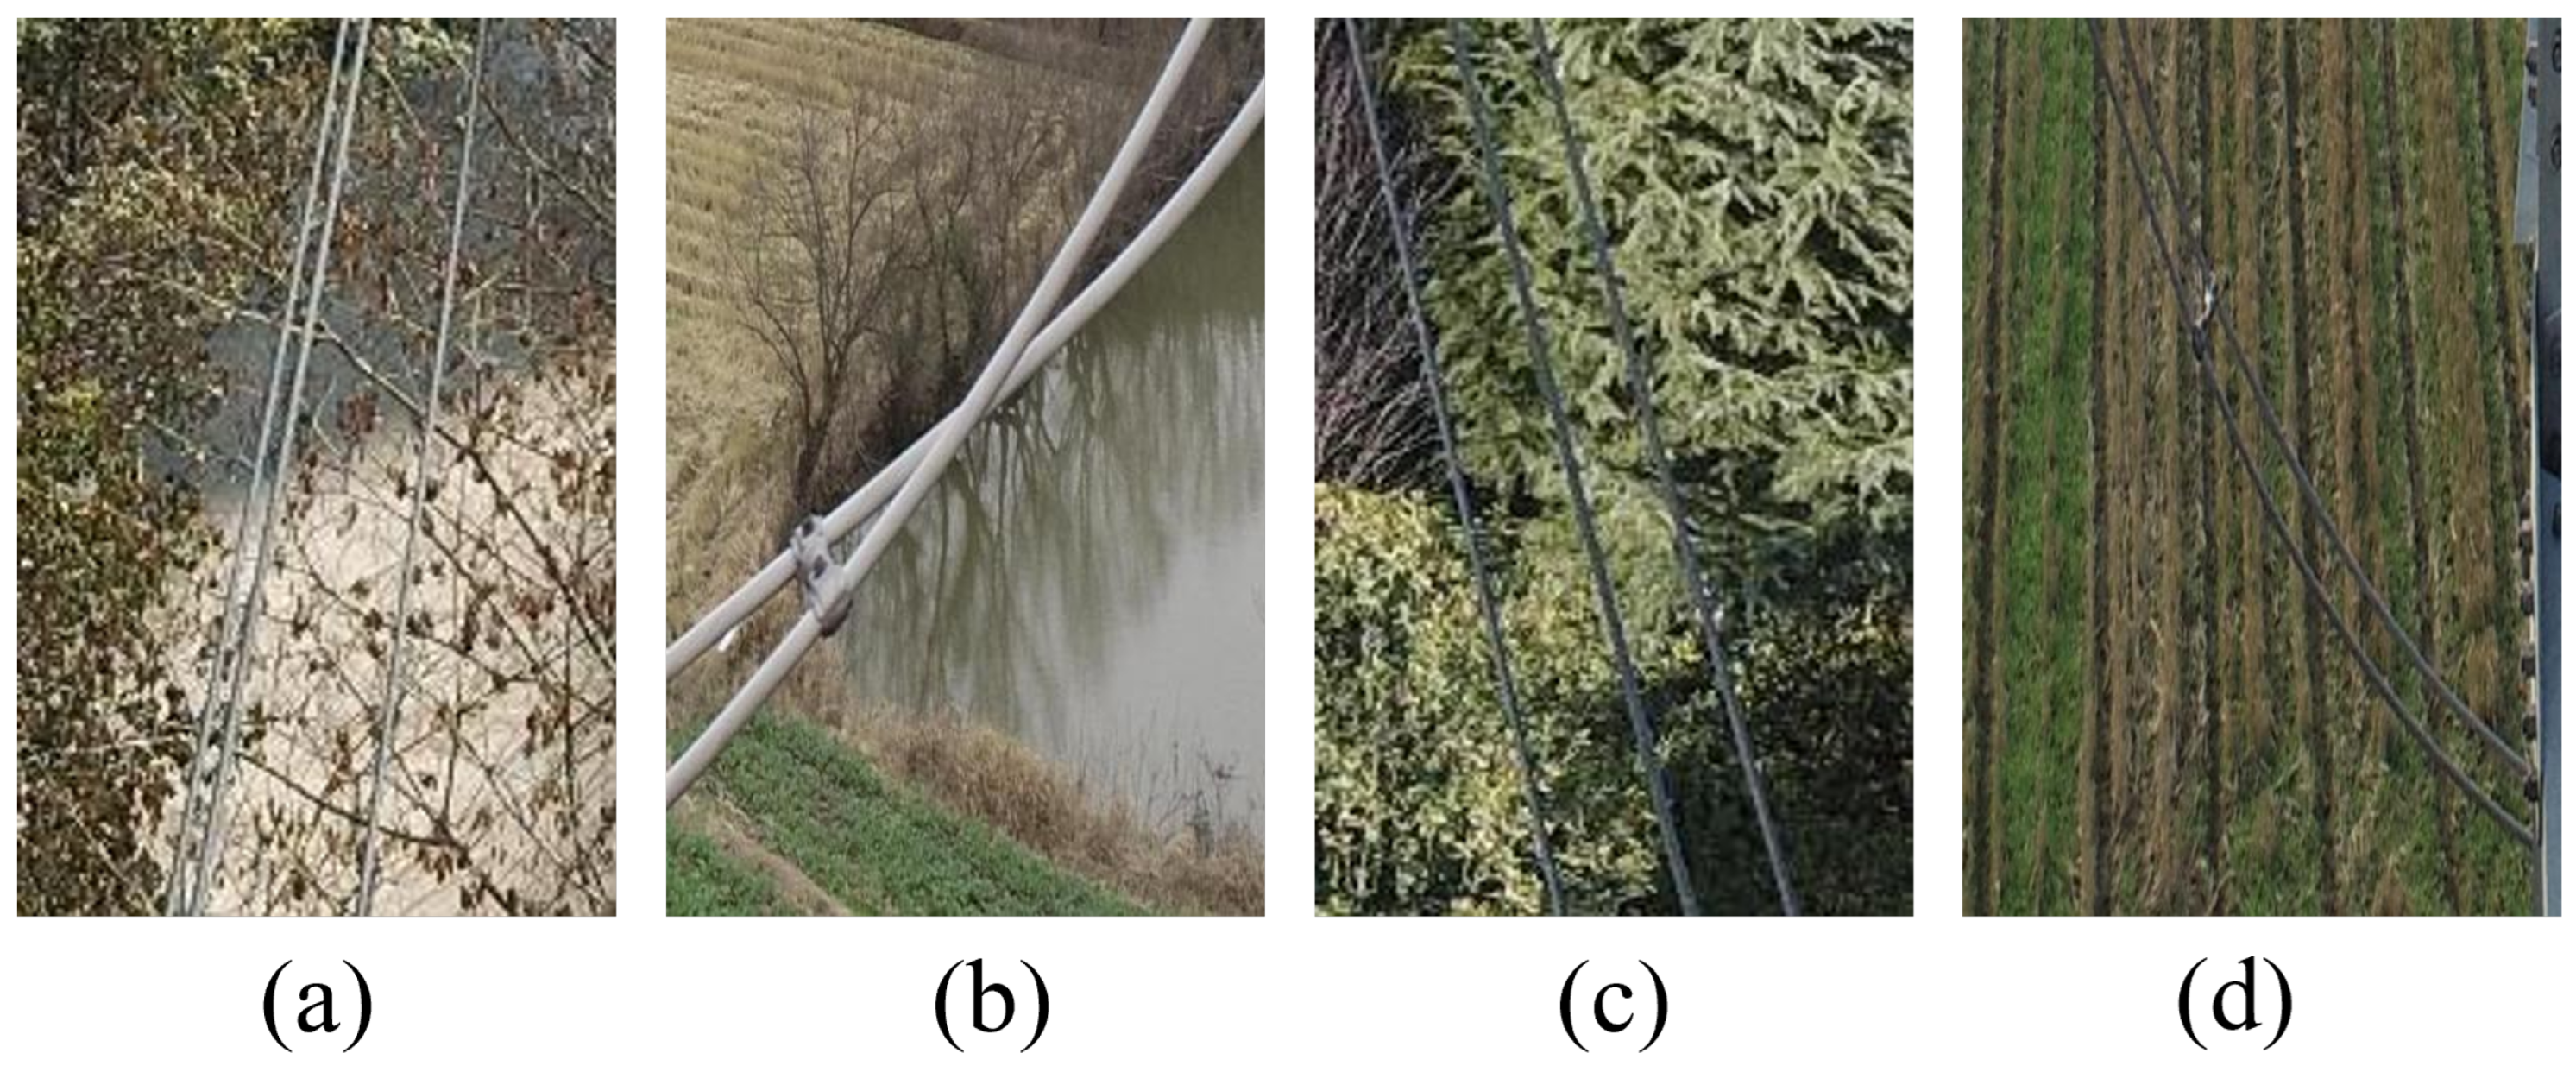
Conventional power line detection relies mainly on edge-based and handcrafted-feature techniques. Under low-contrast conditions, these methods are sensitive to noise and provide limited accuracy for elongated targets [5,6,7,8]. Recent deep-learning approaches generally formulate the task as semantic or instance segmentation and classify individual pixels as power line or background. Although segmentation provides dense spatial predictions, pixel-level classification does not explicitly guarantee topological continuity. Its performance therefore deteriorates for distant, occluded, or weak-contrast conductors, frequently producing fragmented or distorted line masks [2,3,4,9]. Keypoint-based modeling offers an alternative formulation in which sparsely sampled points and their spatial relationships describe line geometry. Nevertheless, conventional keypoint association commonly extends a structure point by point without a global reference; an incorrect local match can consequently propagate through subsequent connections and reduce reconstruction accuracy and completeness. This limitation is especially relevant to remote sensing scenes containing multiple closely spaced or intersecting conductors, as illustrated in Figure 1a,b. Tree occlusion and low contrast suppress line saliency in Figure 1c, whereas morphologically similar background objects increase the risk of false detections in Figure 1d. These observations motivate a method that jointly uses local geometric evidence and global line-level constraints.
Figure 1.
Representative power line detection images: (a,b) illustrate complex cases in which the wires are densely spaced or even intertwined; (c) presents a scene with pronounced background heterogeneity—such as occlusion and low global contrast—that poses significant challenges for detection algorithms; (d) shows background objects whose morphology closely resembles that of power lines, thereby acting as distractors.
To address this gap, this study develops a global keypoint regression framework for power line detection and structural reconstruction in UAV optical imagery. All keypoints associated with a conductor are regressed directly toward a common start point, establishing a global spatial reference intended to avoid recursive propagation through local point-to-point associations. The framework further introduces three complementary components. A multi-scale region-aware feature extractor (MSRAFE) represents power lines across spatial scales and strengthens their salient semantics. A line feature aggregation (LFA) module adaptively reweights and fuses heterogeneous features for precise localization. Finally, a linear structure-aware feature strategy (LSAFS) integrates local geometric cues with global structural reasoning to compensate for the loss of fine details that may arise during global regression.
This work makes the following key contributions:
- A global keypoint regression formulation is proposed for extracting and reconstructing power lines from UAV optical imagery. Regressing all keypoints toward a shared line start point avoids recursive point-to-point association and provides a common instance-level reference.
- An MSRAFE is designed to preserve complementary local details and global semantics across multiple spatial scales, strengthening the representation of low-contrast power lines in complex aerial backgrounds.
- Gated convolution and AKConv are integrated into an LFA module that adaptively fuses multi-level features and enhances the local representation of elongated line structures.
- An LSAFS predicts spatial offsets between keypoints and combines local geometric awareness with global structure modeling, which is designed to support continuity reconstruction when occlusion or background clutter interrupts local evidence.
- Comparative experiments on two public aerial-image datasets and the self-constructed CPLD dataset show that the method achieves the highest IoU among the evaluated approaches on all three test partitions. Module ablations on the PLDU test partition further show complementary gains from MSRAFE, LFA, and LSAFS.
2. Related Work
2.1. Detection of Linear Structures
Machine-learning and deep-learning methods have also been applied to crack detection. Traditional approaches use intensity thresholds, morphology, and handcrafted features [10,11,12]. Shi et al. [11] used random structured forests to learn crack structure and suppress background noise. More recent convolutional neural network (CNN)-based methods learn multi-scale features from annotated crack images [13,14,15]. For vessel segmentation, U-Net-based architectures and multi-scale attention networks combine features from different encoder levels. Gu et al. [16] used a context encoder for ocular-vessel segmentation, at the cost of greater complexity than the standard U-Net. Shi et al. [17] combined multi-scale information from different encoder layers for retinal-vessel segmentation, and Yuan et al. [18] used a U-shaped network with multi-scale attention to aggregate decoder features.
2.2. Keypoint Detection
Keypoint-based methods have been used for lane detection and human pose estimation. Philion et al. [19] extracted lane-marking pixels with a neural network and predicted their adjacency relationships to cluster spatially connected pixels into lanes. Ko et al. [20] used a stacked hourglass network to predict lane keypoints and clustered lane instances from feature-embedding similarity. CPN [21], which combines GlobalNet and RefineNet, was designed to localize difficult human keypoints under occlusion and complex backgrounds. In multi-person pose estimation, bottom-up methods [22,23,24] detect all keypoints without prior person identification and then group them by geometric relationships. Bottom-up methods can localize keypoints less accurately than top-down methods. Top-down methods [25,26,27] first use a person detector to extract individual regions and then localize keypoints within each region. Their computational cost increases with the number of people, which can constrain real-time use in crowded scenes. This paper adopts a keypoint-based formulation for power line identification. Compared with dense segmentation alone, the keypoint representation exposes an explicit grouping variable for reconstructing individual line hypotheses.
2.3. Power Line Detection and Transferable Representation Learning
Early power line detection methods relied mainly on handcrafted low-level features, straight-line detection, and morphological constraints [5]. In the initial stage, the task was commonly simplified to standard line detection and then refined by filtering the detected segments according to length, orientation, width, and other shape attributes. To address complex backgrounds in power line images, Li et al. [6] introduced a pulse-coupled neural network (PCNN) filter to suppress background noise and then applied rule-based clustering to group lines with similar attributes. Conductors, however, may appear as non-rigid curves rather than ideal straight lines, whereas many traditional methods assume straight or polynomial curves [28]. These assumptions are restrictive when conductors vary in width, deform, or are partially occluded. Segmentation-based networks are widely used for power-line detection. Wei [29] proposed MiT-U-Net, which combines multistage convolutional neural networks with self-attention; TLFM and TLFE further process features during hierarchical transitions. Ma [30] presented a segmentation method based on an improved SOLOv2 network for transmission-line detection, using transfer learning on single-type conductor data to recognize high-aspect-ratio linear features. Abdelfattah [31] embedded decoder features from a GAN into a separate semantic-segmentation network to use additional context, geometry, and appearance cues. These methods can still miss or misclassify power lines under tree occlusion or background clutter.
Beyond power-line-specific models, recent representation-learning studies provide components relevant to thin, weakly textured, or partially occluded structures. Frequency-aware boundary preservation and dual-scale transformer context help to retain fine structures across scales [32,33]; relational compensation addresses incomplete observations [34,35]; and self-supervised pretraining offers a route to representation learning when annotations are limited [36]. The present method draws on these general principles; task-specific prediction heads and input pipelines are not transferred.
3. Methodology
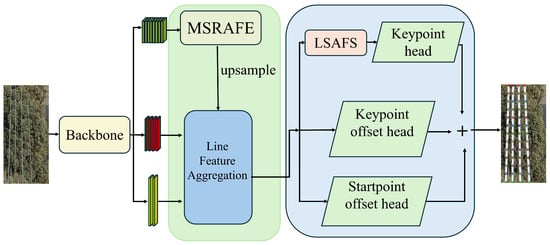
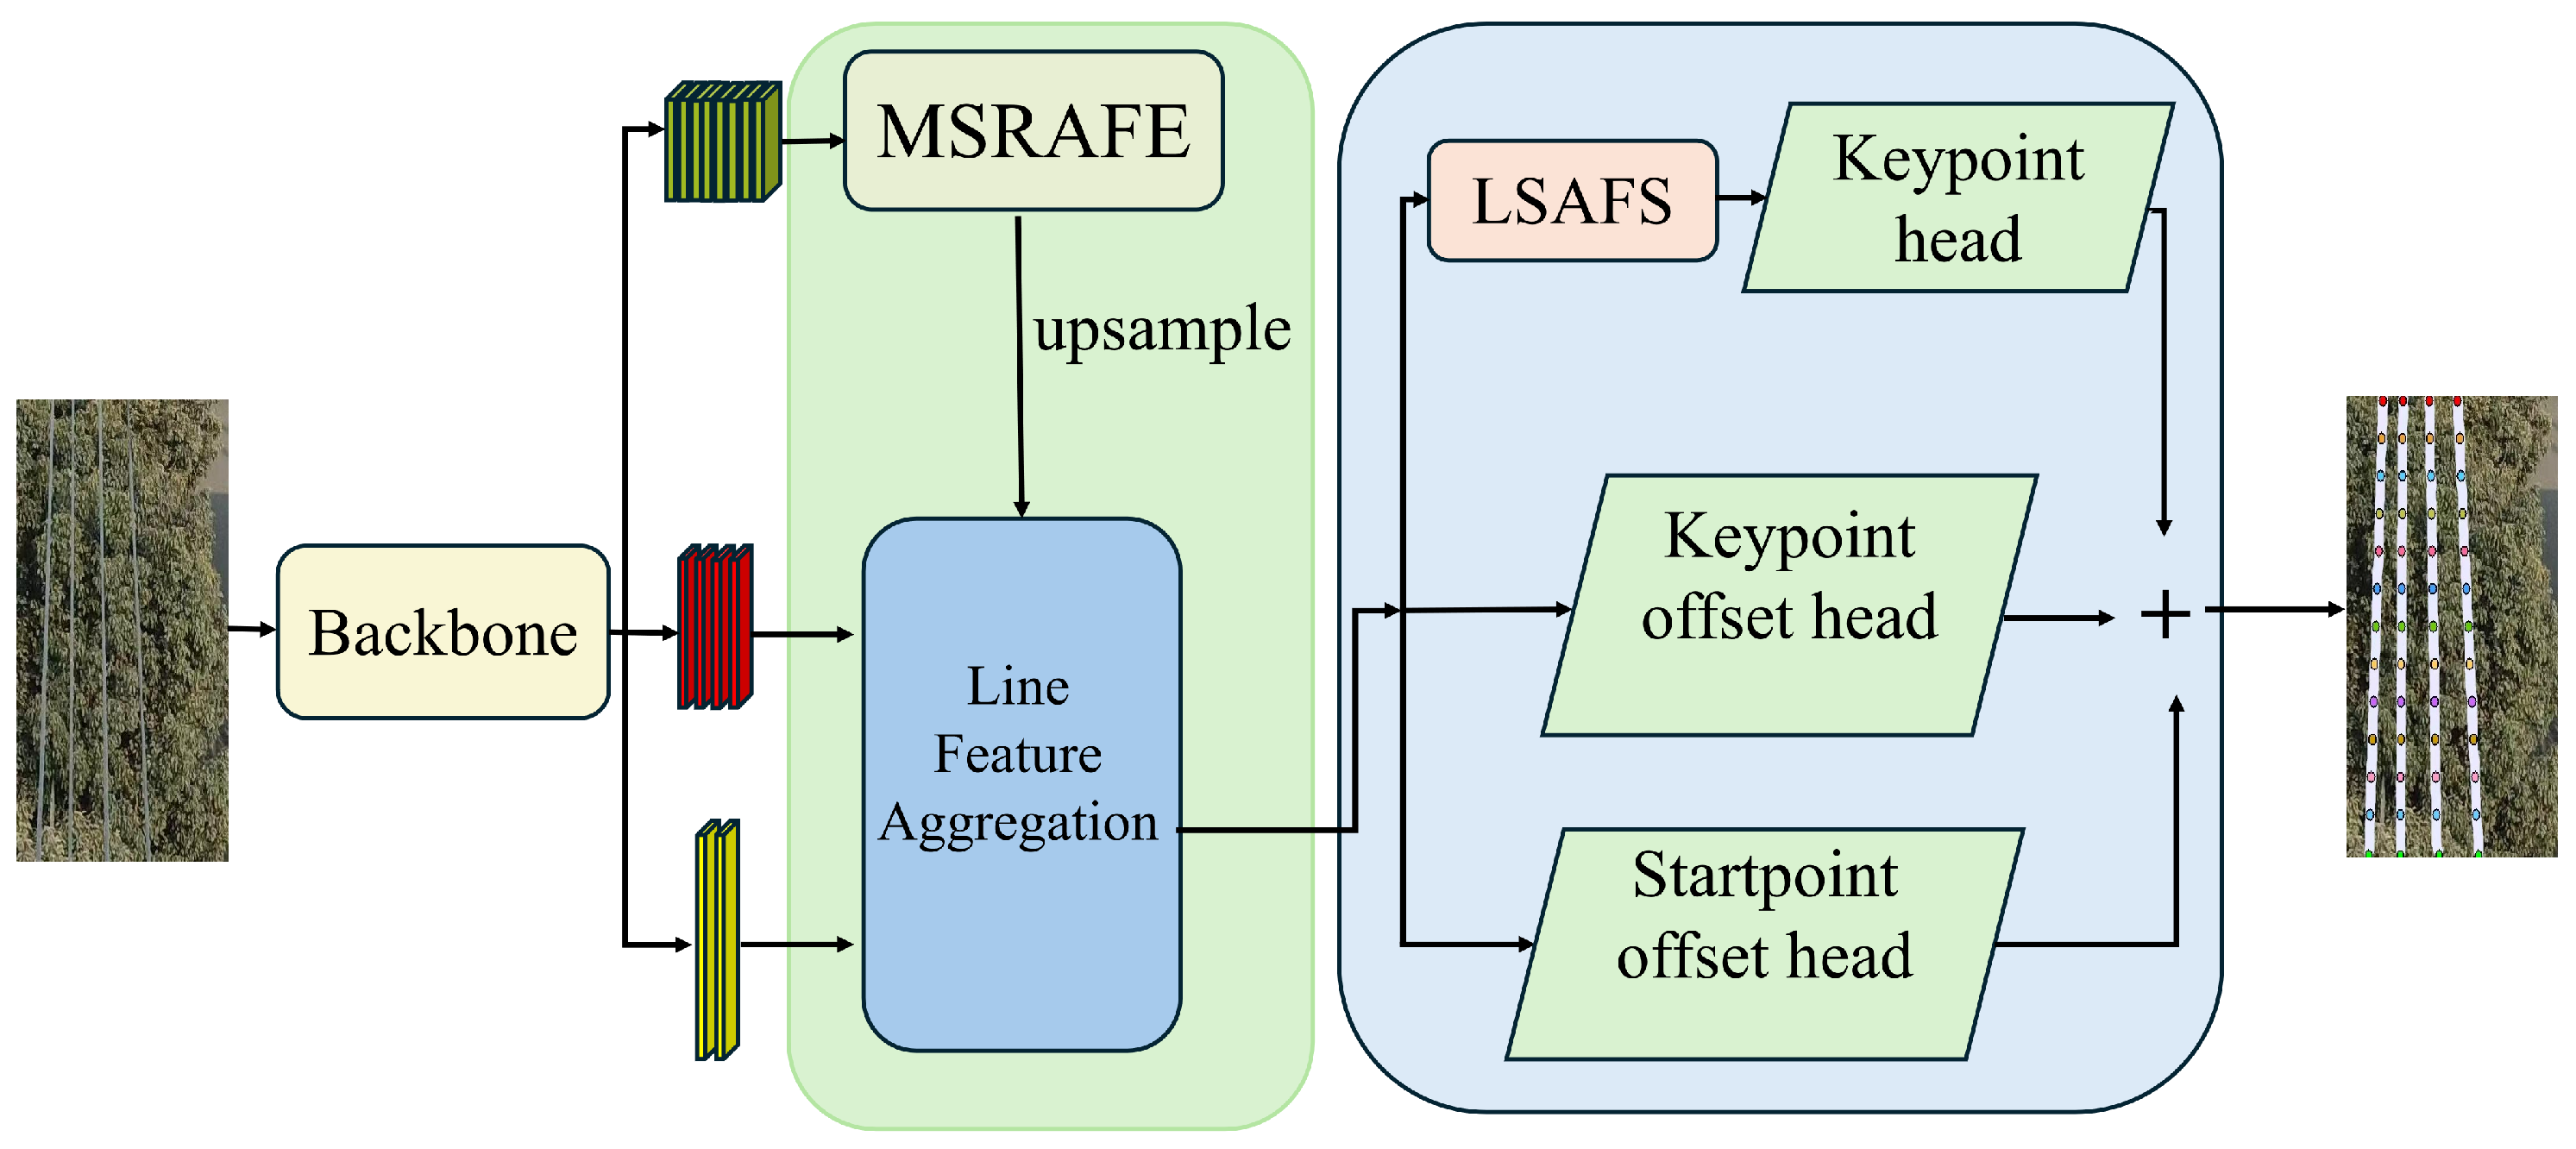
Figure 2 presents the proposed global keypoint-localization framework. A pretrained backbone extracts multi-level features, MSRAFE enhances the deepest representation, LFA fuses three resolution levels, and LSAFS refines line features before the three prediction heads for keypoint confidence, subpixel offset, and keypoint-to-start-point offset. During inference, confidence filtering, start-candidate selection, and clustering use the thresholds specified in Section 3.1. Retained keypoints vote for a start point, are assigned to the nearest compatible cluster, and are then mapped, ordered, and connected into line hypotheses.
Figure 2.
Schematic overview of the proposed power line detection network architecture. Colored circles distinguish adjacent sampled keypoints along each conductor; the colors are used only for visualization and do not indicate class or confidence.
3.1. Power Line Detection Based on Global Keypoint Regression
Given an input image , the model outputs a set of power-line hypotheses , where N is the number of reconstructed instances. Each line is represented by an ordered sequence of keypoints:
where is the common reference start point and , are subsequent samples on the i-th visible line fragment. The term “start” does not indicate a physical conductor direction or a real-world endpoint. For each annotated instance, the polyline is clipped to the image and interpolated; the visible sample nearest the bottom image boundary is then selected as . Every keypoint on that instance is supervised to predict an offset toward this same reference. The reference-selection rule is reapplied after geometric augmentation or cropping, so it uses the visible portion of the transformed annotation. Near-horizontal fragments and points at nearly the same height remain potential ambiguities, as discussed in Section 5.
The heatmap head outputs , with , , and output stride . At this scale, every annotated line is interpolated to 45 samples. A ground-truth Gaussian is centered on each discretized keypoint :
The implementation uses radius , a kernel, and output-map pixels; overlapping kernels are combined by an element-wise maximum. The Gaussian focal heatmap loss addresses the foreground–background imbalance:
where and control the positive focusing and negative-target attenuation, respectively.
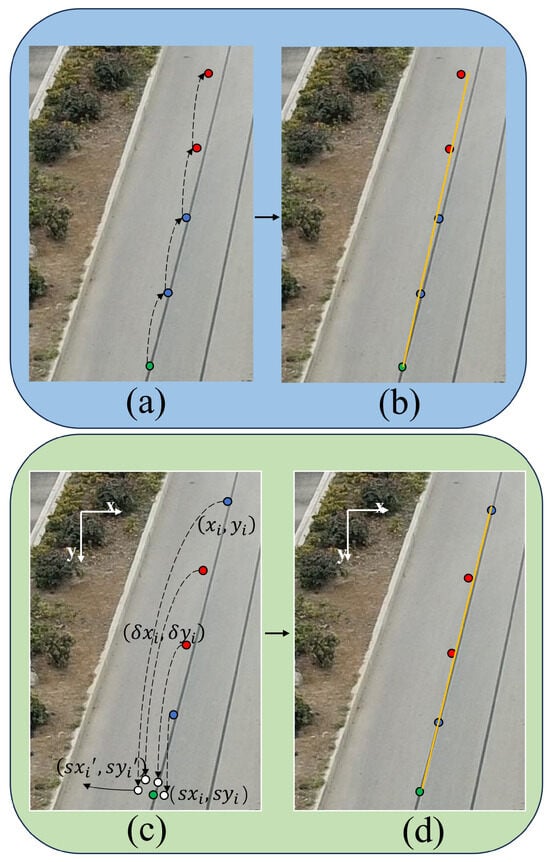
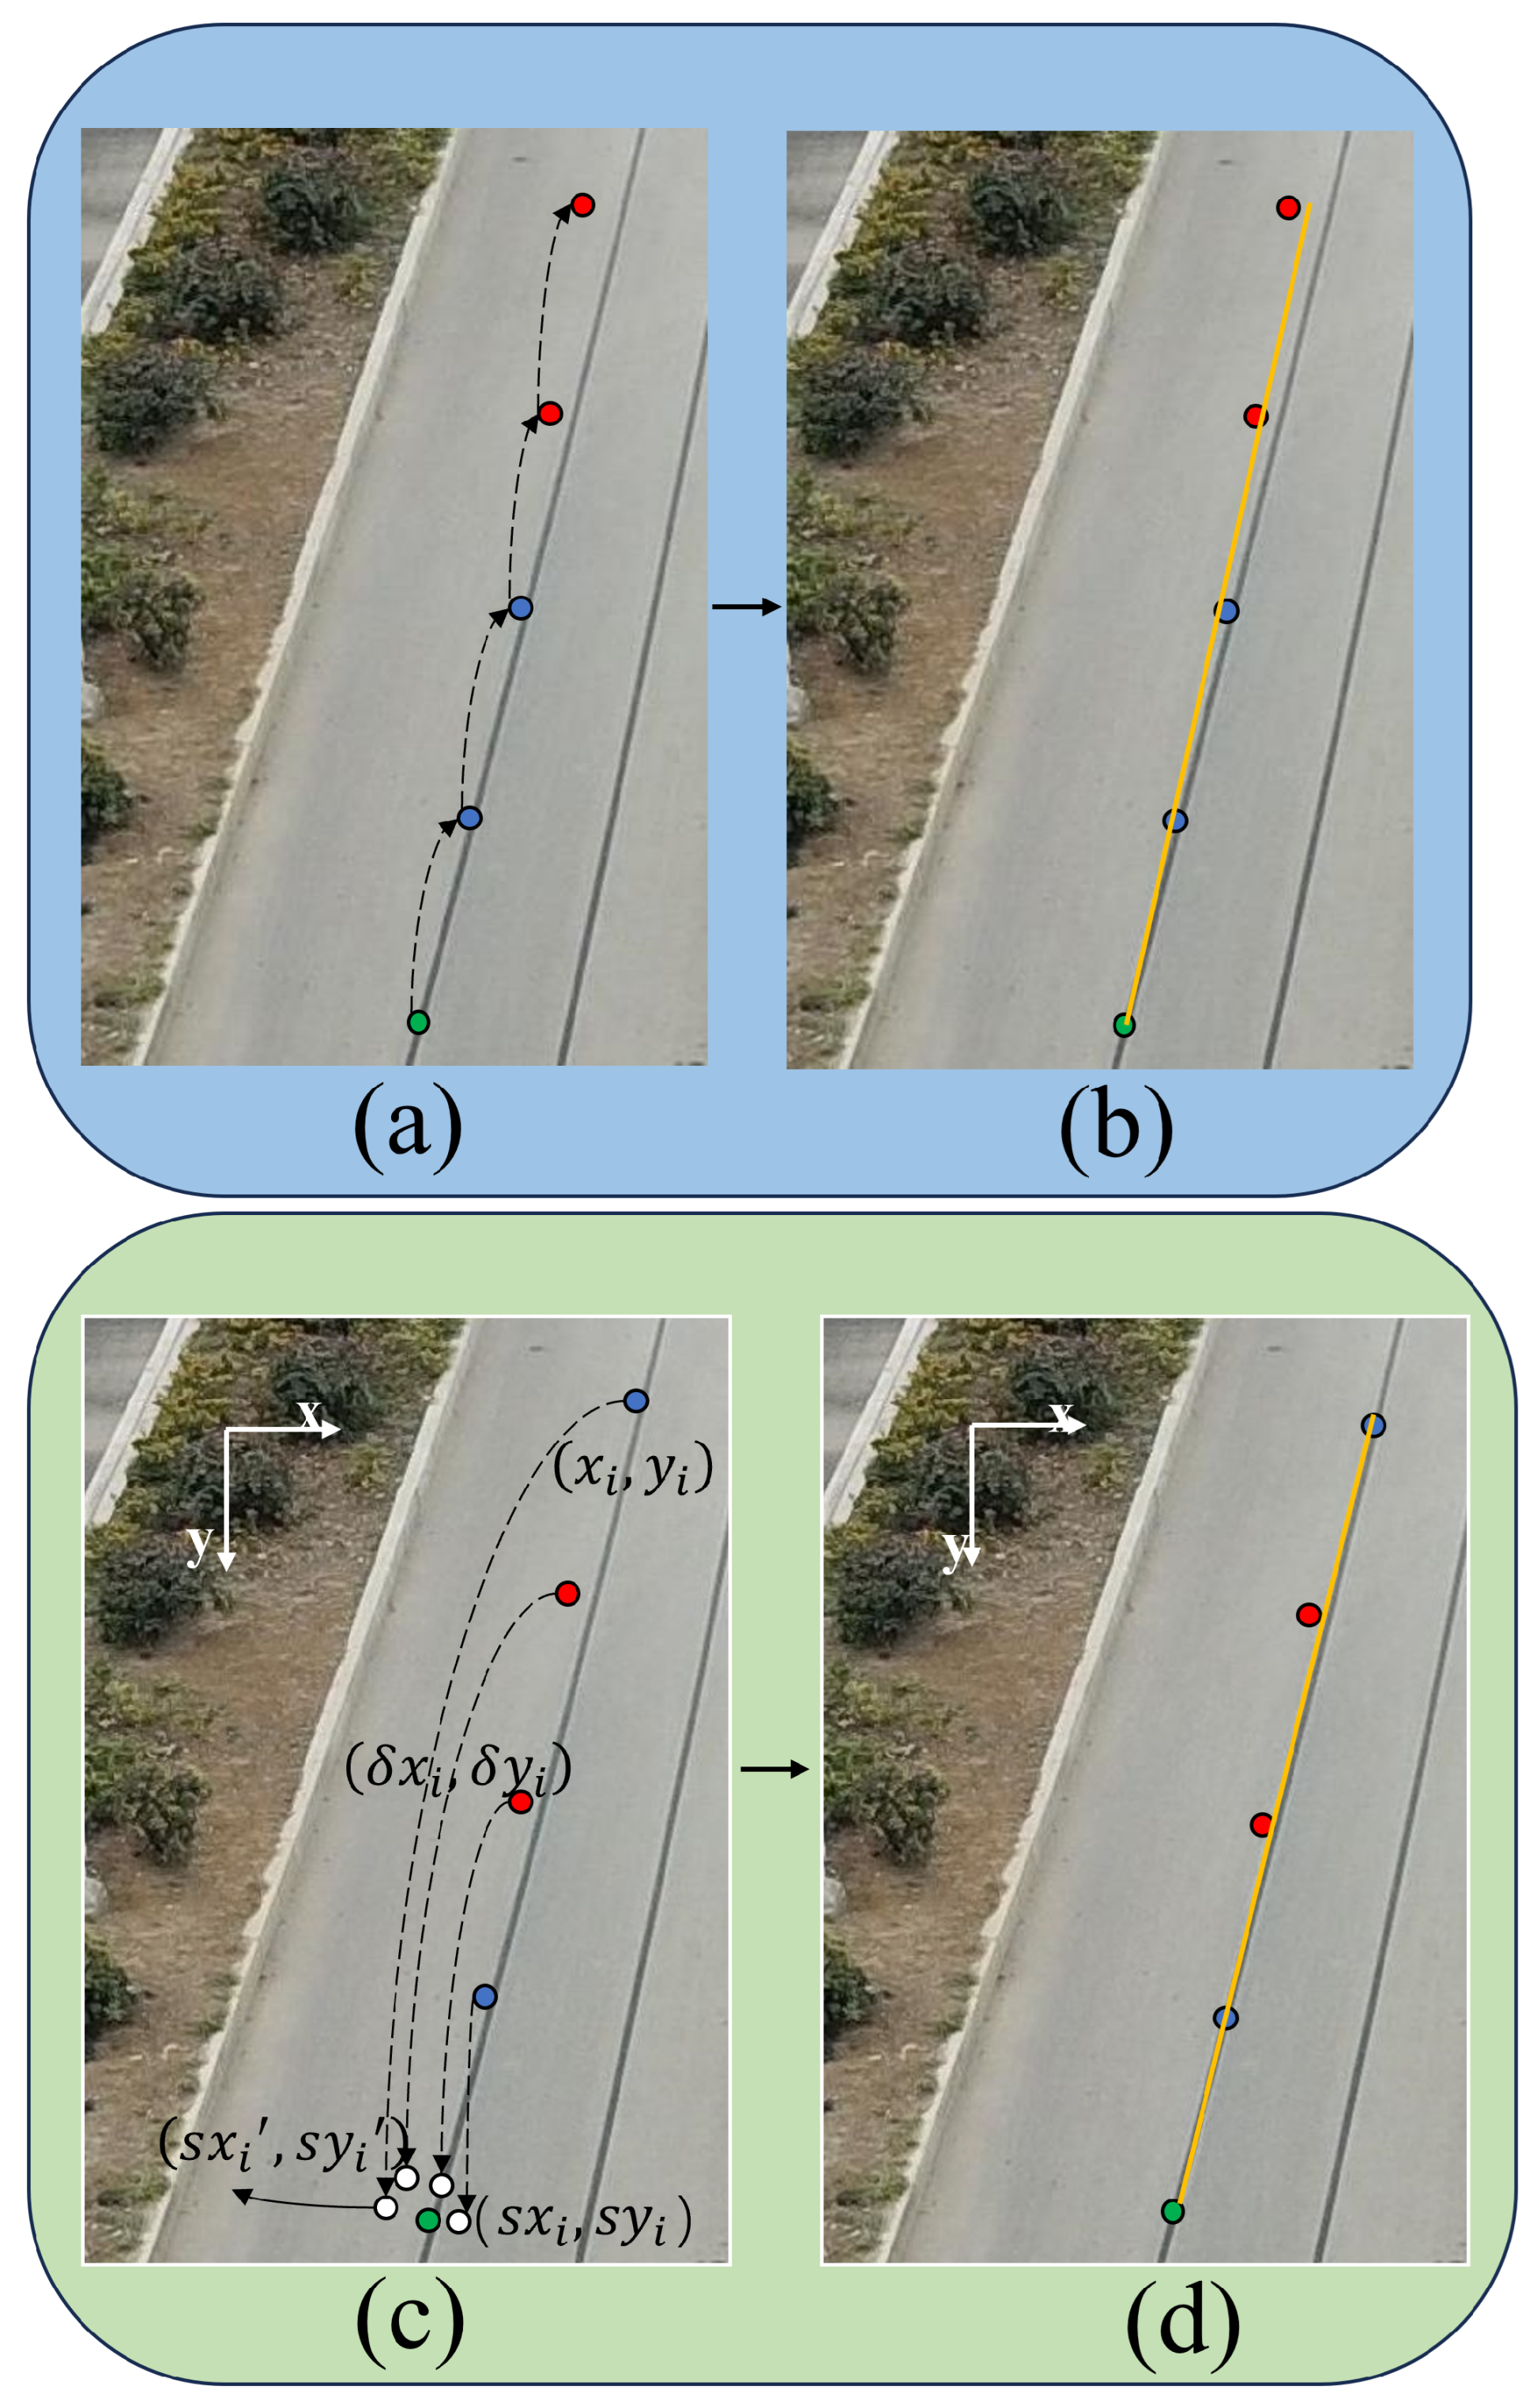
Figure 3a,b illustrates how recursively extending a line through adjacent matches can propagate an early association error. The proposed global strategy instead trains every keypoint on instance i to predict the same start-point reference. For an observed keypoint and its predicted offset , the voted reference is
During training, the keypoint-to-start target is , while a separate keypoint-offset head predicts the subpixel quantization residual . During inference, keypoints with confidence below 0.2 are discarded. A retained keypoint initializes a root candidate when its predicted vertical start offset is below 0.7 output-map pixels; voted references are then clustered using output-map pixels. A keypoint is assigned to cluster c when , where is the cluster center. Because all points vote independently, a local keypoint error does not recursively shift later samples; nevertheless, a biased start-point vote can still cause a wrong instance assignment.
Figure 3.
Green dots indicate start points, blue dots denote keypoints predicted with small errors, and red dots denote keypoints with larger errors. Black dashed arrows in (a) indicate sequential keypoint association, whereas those in (c) indicate direct regression to the common start point; yellow solid lines in (b,d) show the reconstructed conductors. (a) Ordinary keypoint method; (b) power line reconstruction obtained with the ordinary keypoint method; (c) global keypoint method; (d) power line reconstruction produced by the global keypoint method.
3.2. Multi-Scale Region-Aware Feature Extractor
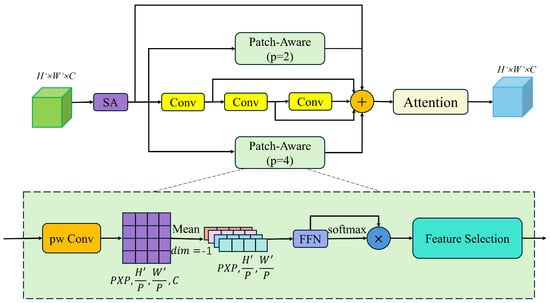
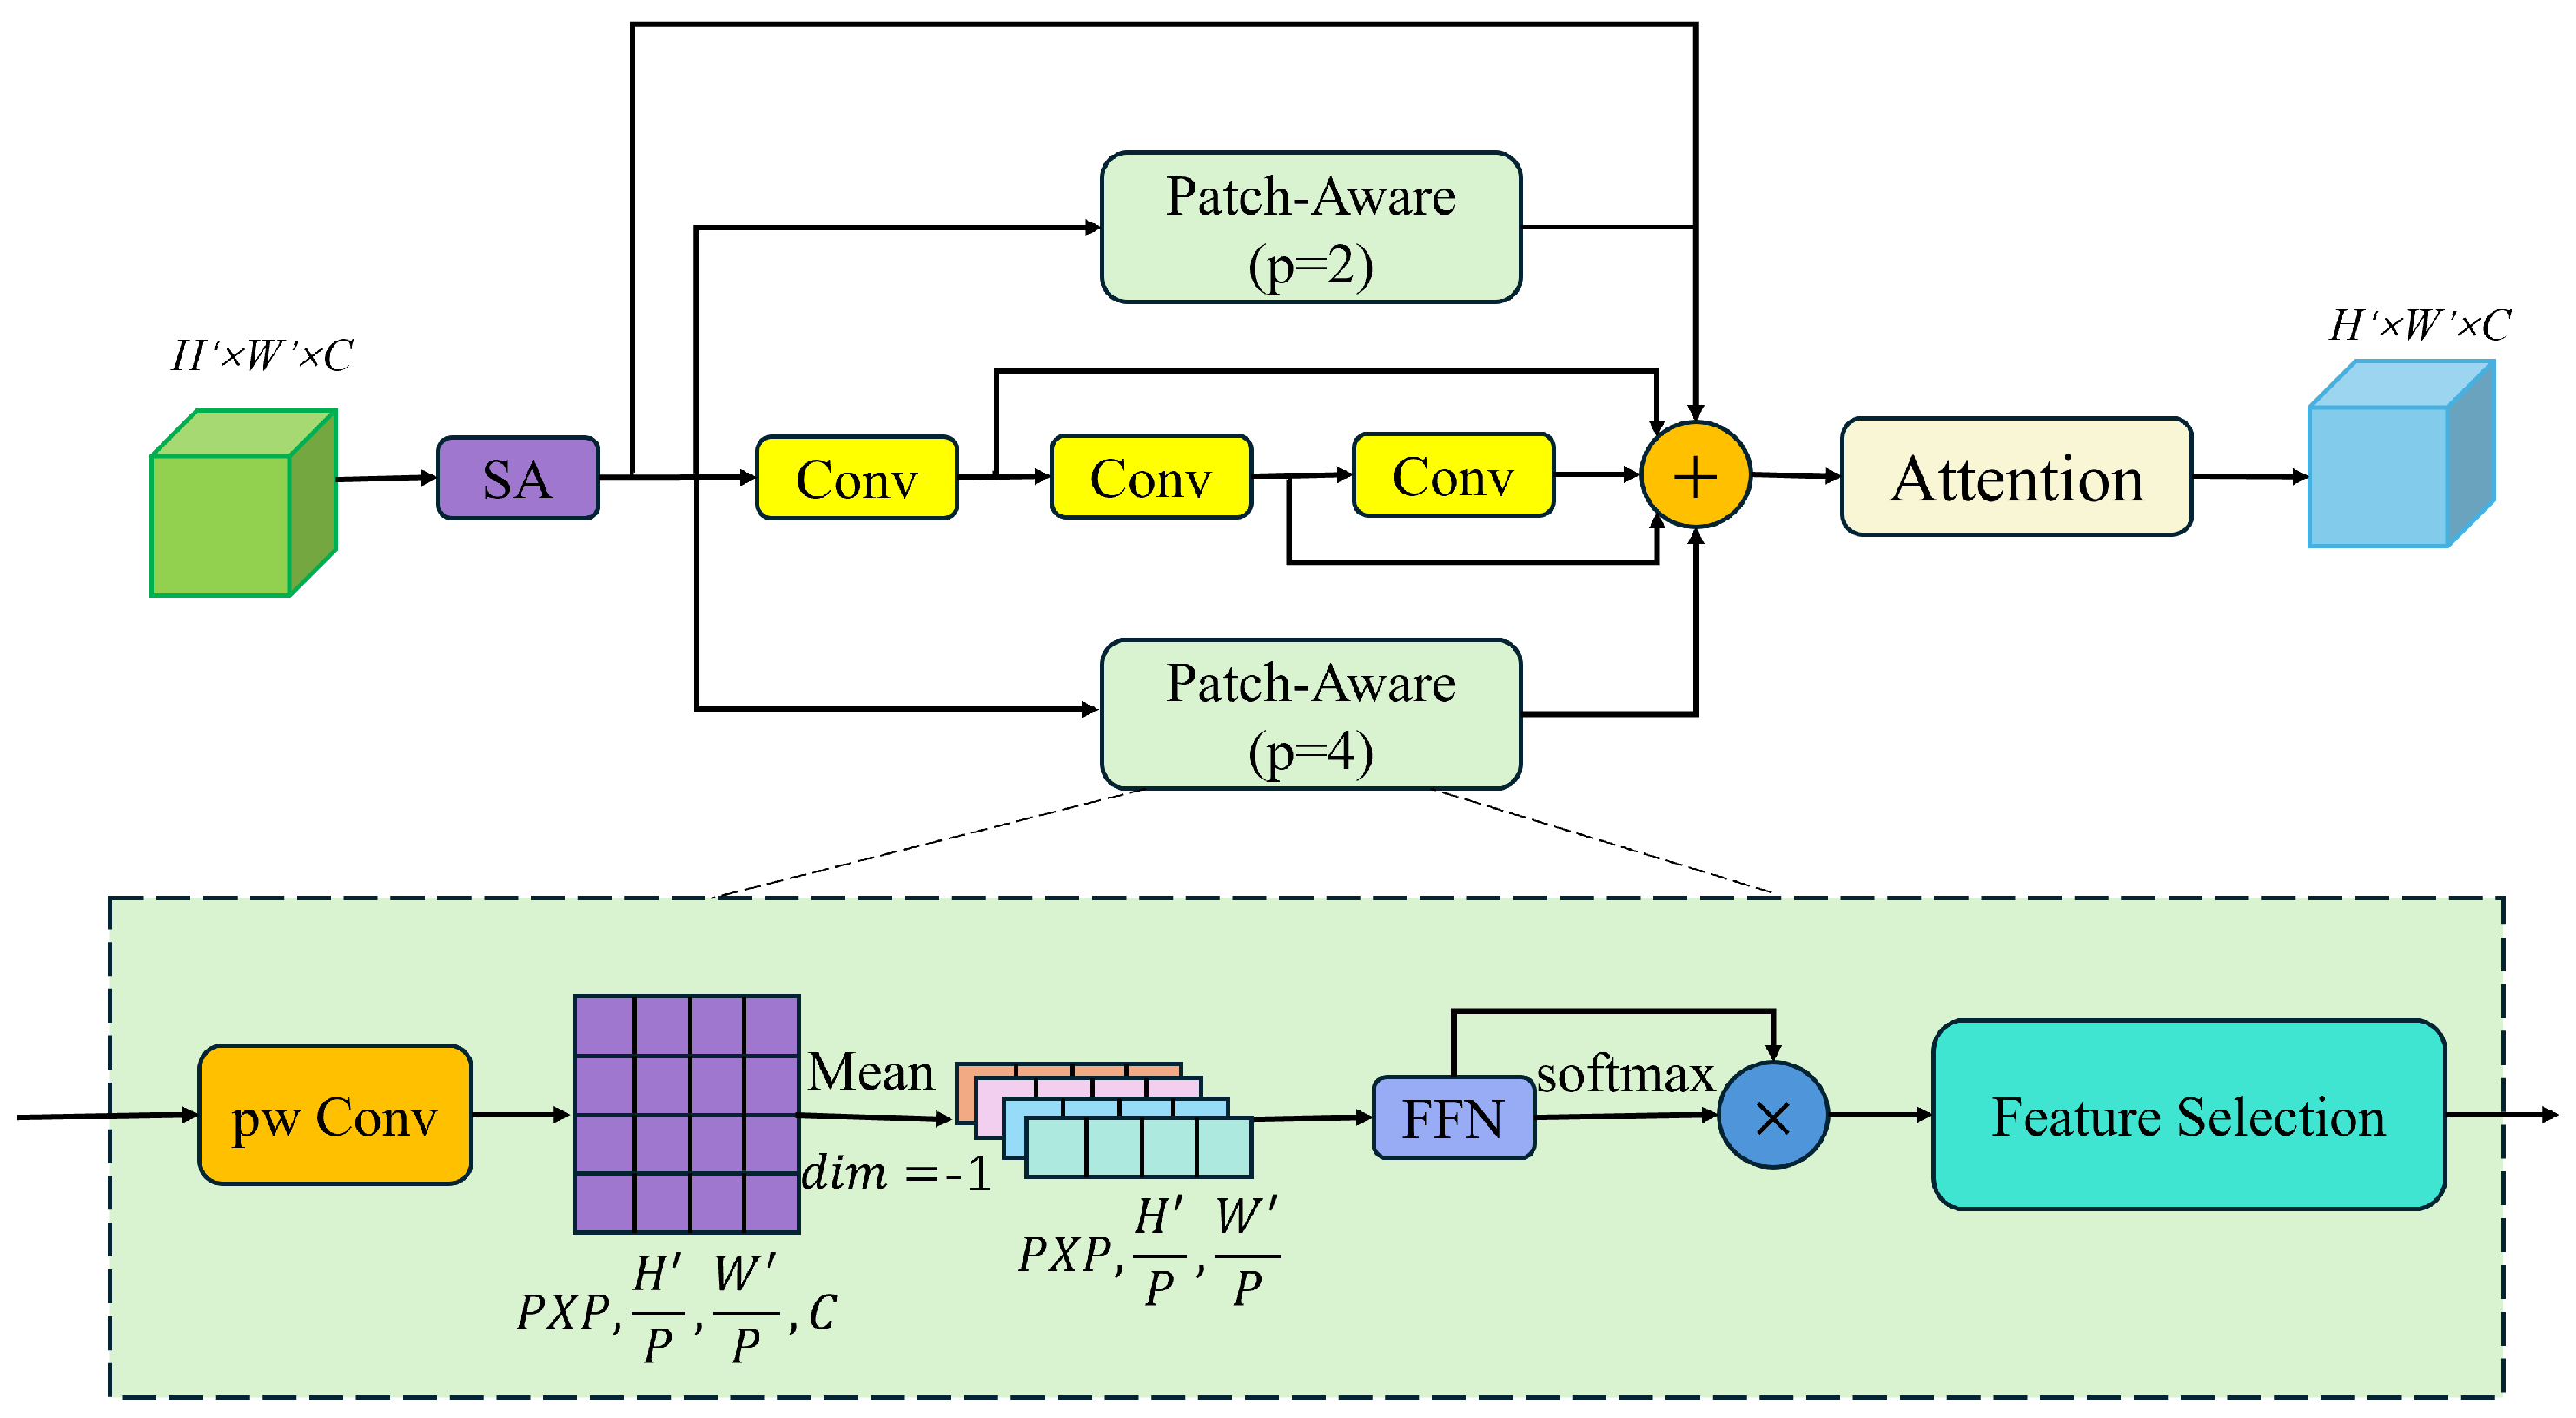
Power lines occupy thin, low-contrast regions and can be interrupted by background clutter, so a single receptive-field scale is insufficient for robust representation. The multi-scale region-aware feature extractor (MSRAFE, Figure 4) therefore combines parallel local, global, and convolutional branches. Given the feature tensor output by the self-attention module, the model divides the input into contiguous blocks using a spatial partition strategy: . After channel-wise mean compression, compact representations are generated. These are then passed through a feedforward neural network to output local features . Simultaneously, the global feature branch uses a spatial probability distribution weighting mechanism to generate . The convolutional branch, through three levels of serial 3×3 convolutions, extracts structured features , , and . These multi-scale features are then fused into the enhanced feature .
Figure 4.
Network architecture of the proposed MSRAFE.
In the feature enhancement stage, a dual-attention mechanism is employed: is processed by both the self-attention module and the channel attention module.
where denotes the one-dimensional channel-attention map. ⊗ denotes element-wise multiplication. is the feature map refined by channel attention and is therefore the input to dropout in the final refinement equation. and denote the rectified-linear unit (ReLU) and batch normalization (BN), respectively. is the final output of the module.
3.3. Line Feature Aggregation Module
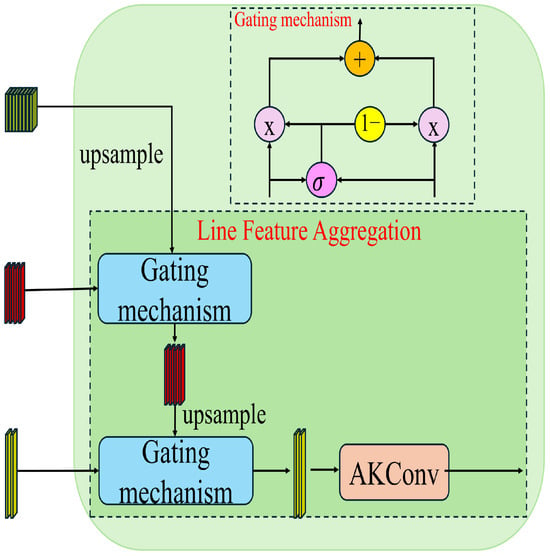
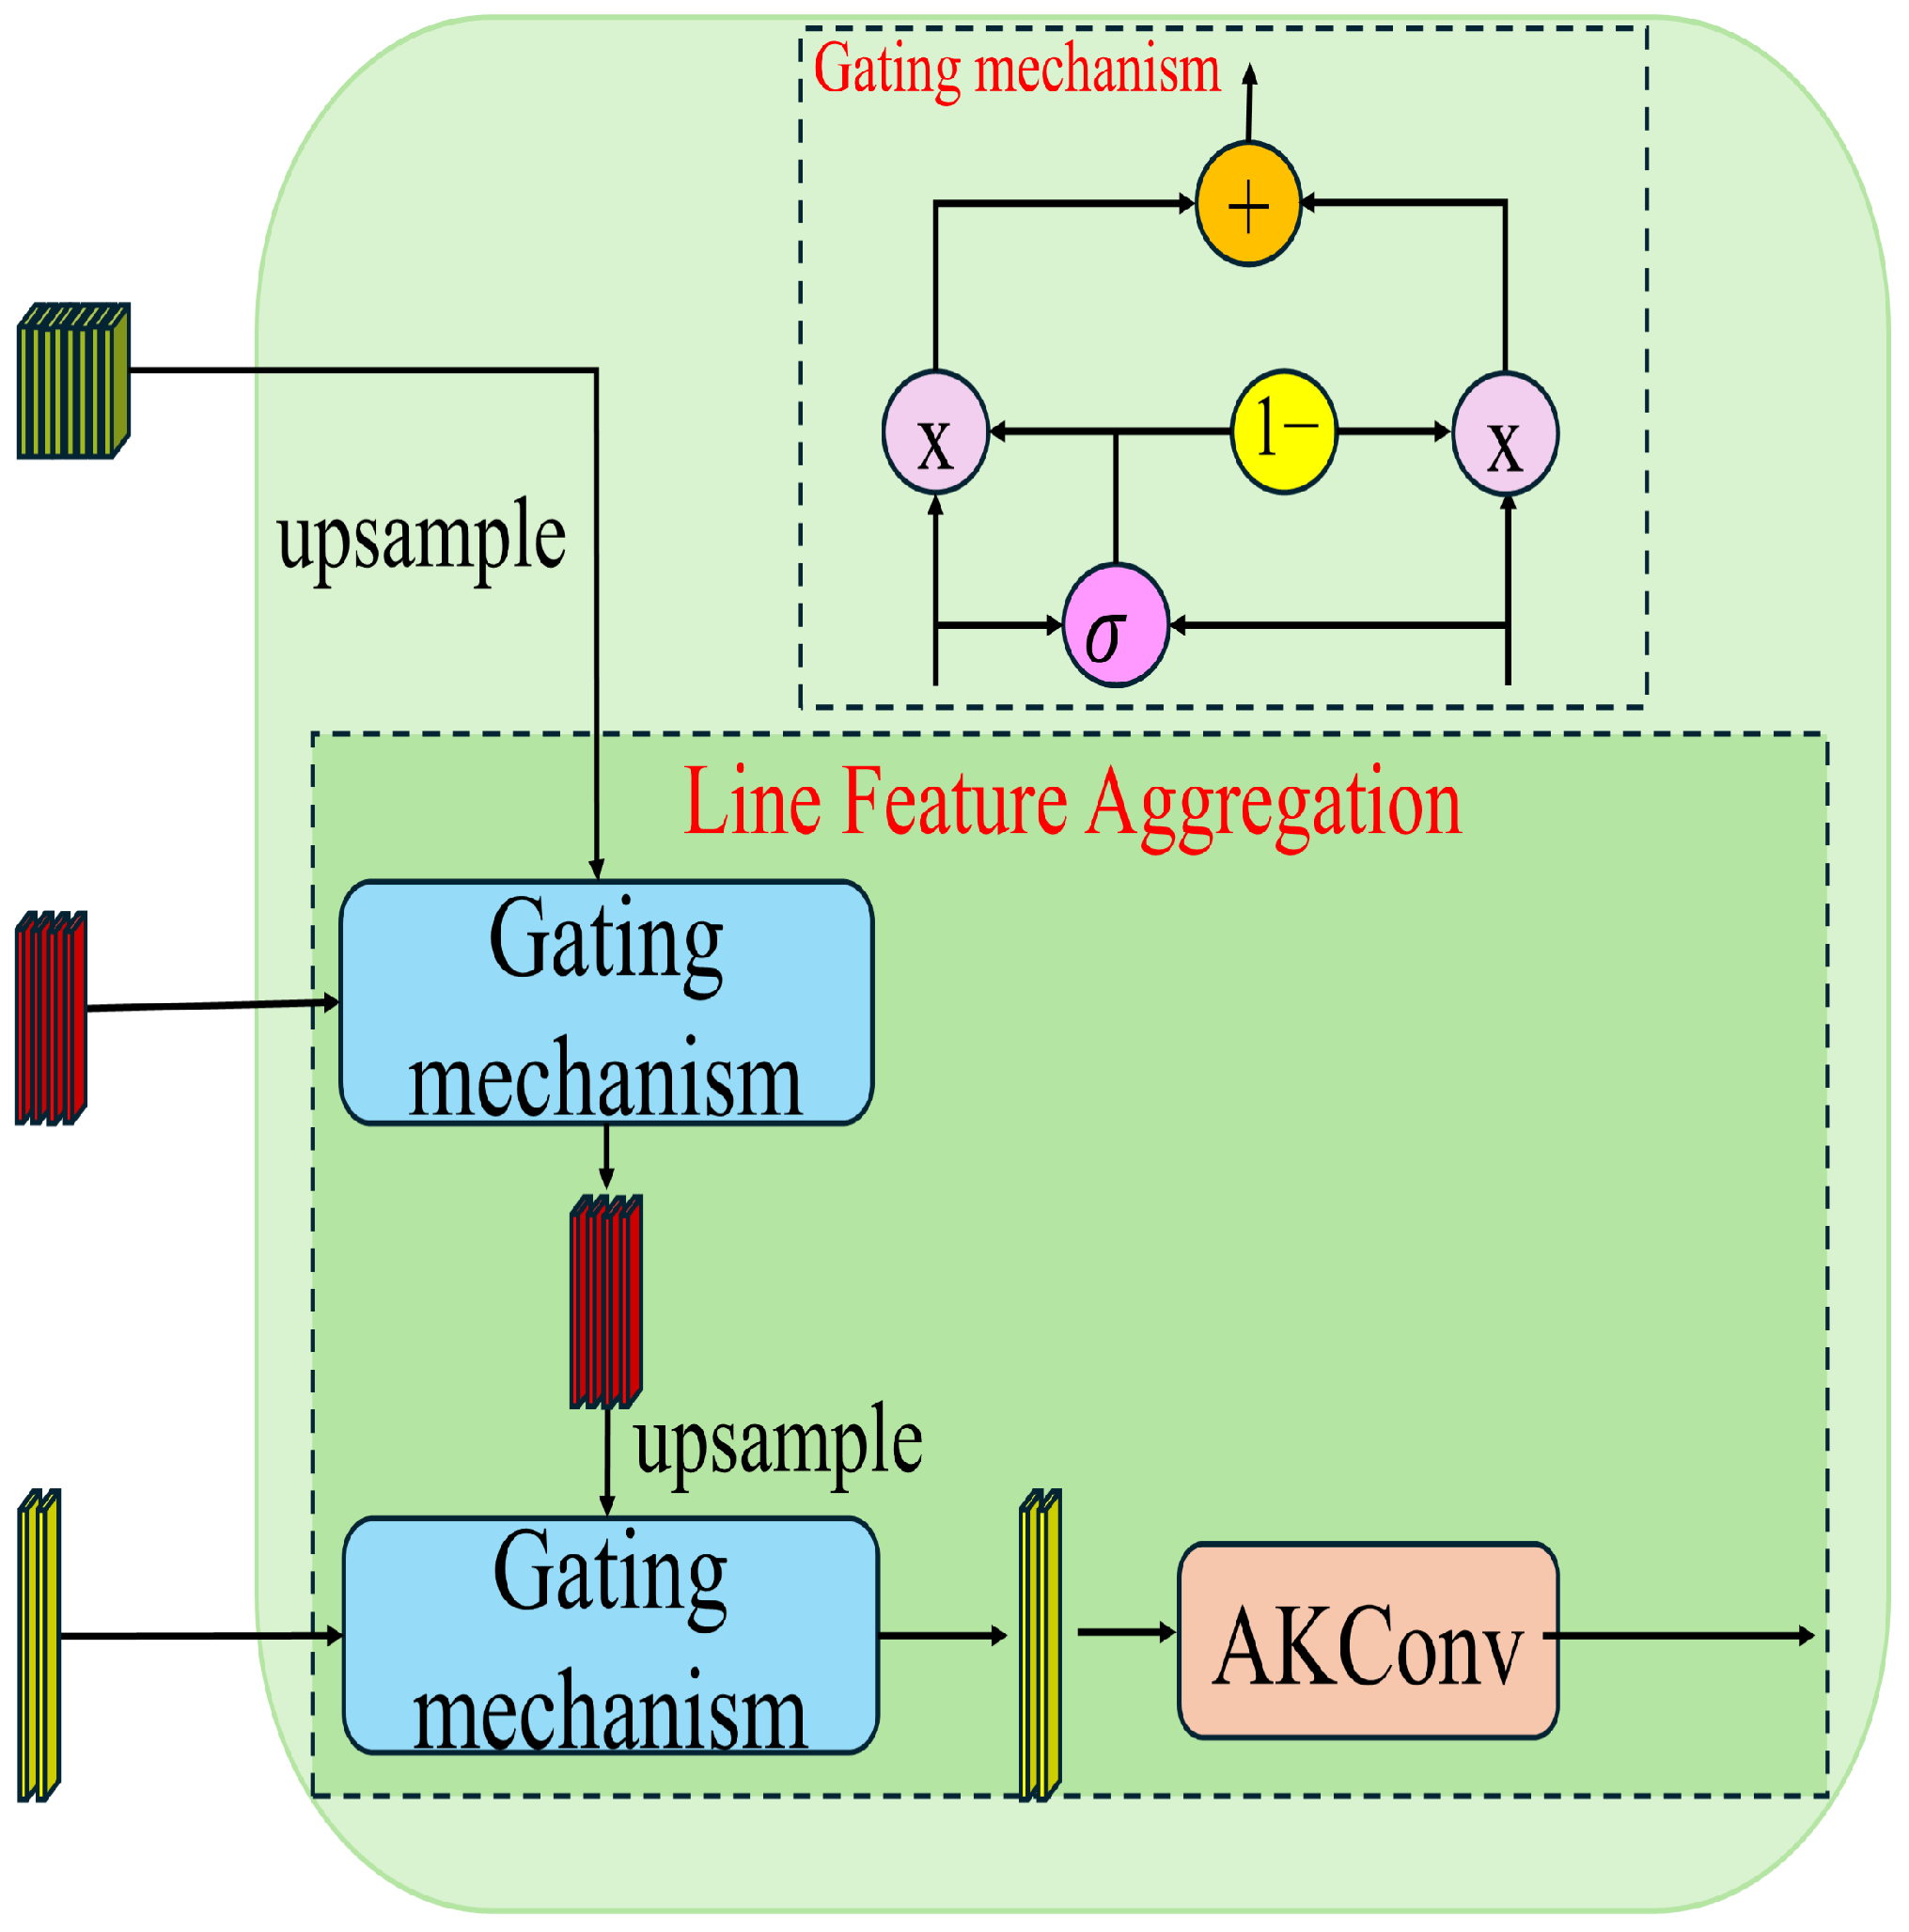
Deep pyramid levels carry semantics but lack spatial detail, whereas shallow levels preserve fine structure with weaker semantic abstraction. The line feature aggregation module (LFA, Figure 5) addresses this trade-off with content-adaptive gating instead of fixed additive fusion. Given the lateral feature and the upsampled coarser feature , the gate is
where is the lateral feature at the current pyramid level, is the upsampled feature from the next coarser level, and are learned projections, is the gate, Y is the fused output passed to the next LFA stage, and ⊙ denotes element-wise multiplication. Following the learned-offset sampling principle introduced by deformable convolution [37], Adaptive Kernel Convolution (AKConv) [38] is used to mitigate geometric information degradation during feature-pyramid processing. Standard 2D convolutions use a fixed grid, whereas AKConv predicts offsets for an arbitrary number of sampling locations:
where denotes the coordinates of the i-th keypoint, is its feature representation, and is the set of predicted offsets. Then, AKConv is used to aggregate the context information of the i-th keypoint by combining the features of adjacent points:
where , , are learned convolution weights. The implementation uses adaptive sampling locations.
Figure 5.
The proposed line feature aggregation (LFA) module. The gating block receives the lateral feature and the upsampled coarser feature ; its output Y is forwarded to AKConv and the subsequent fusion stage.
3.4. Linear Structure-Aware Feature Strategy
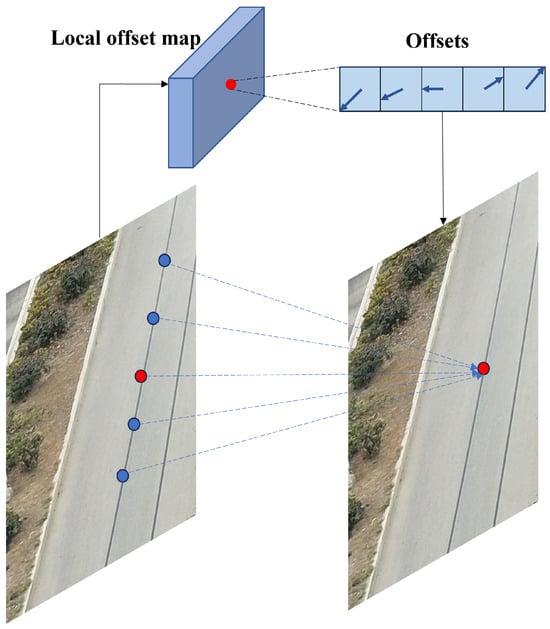
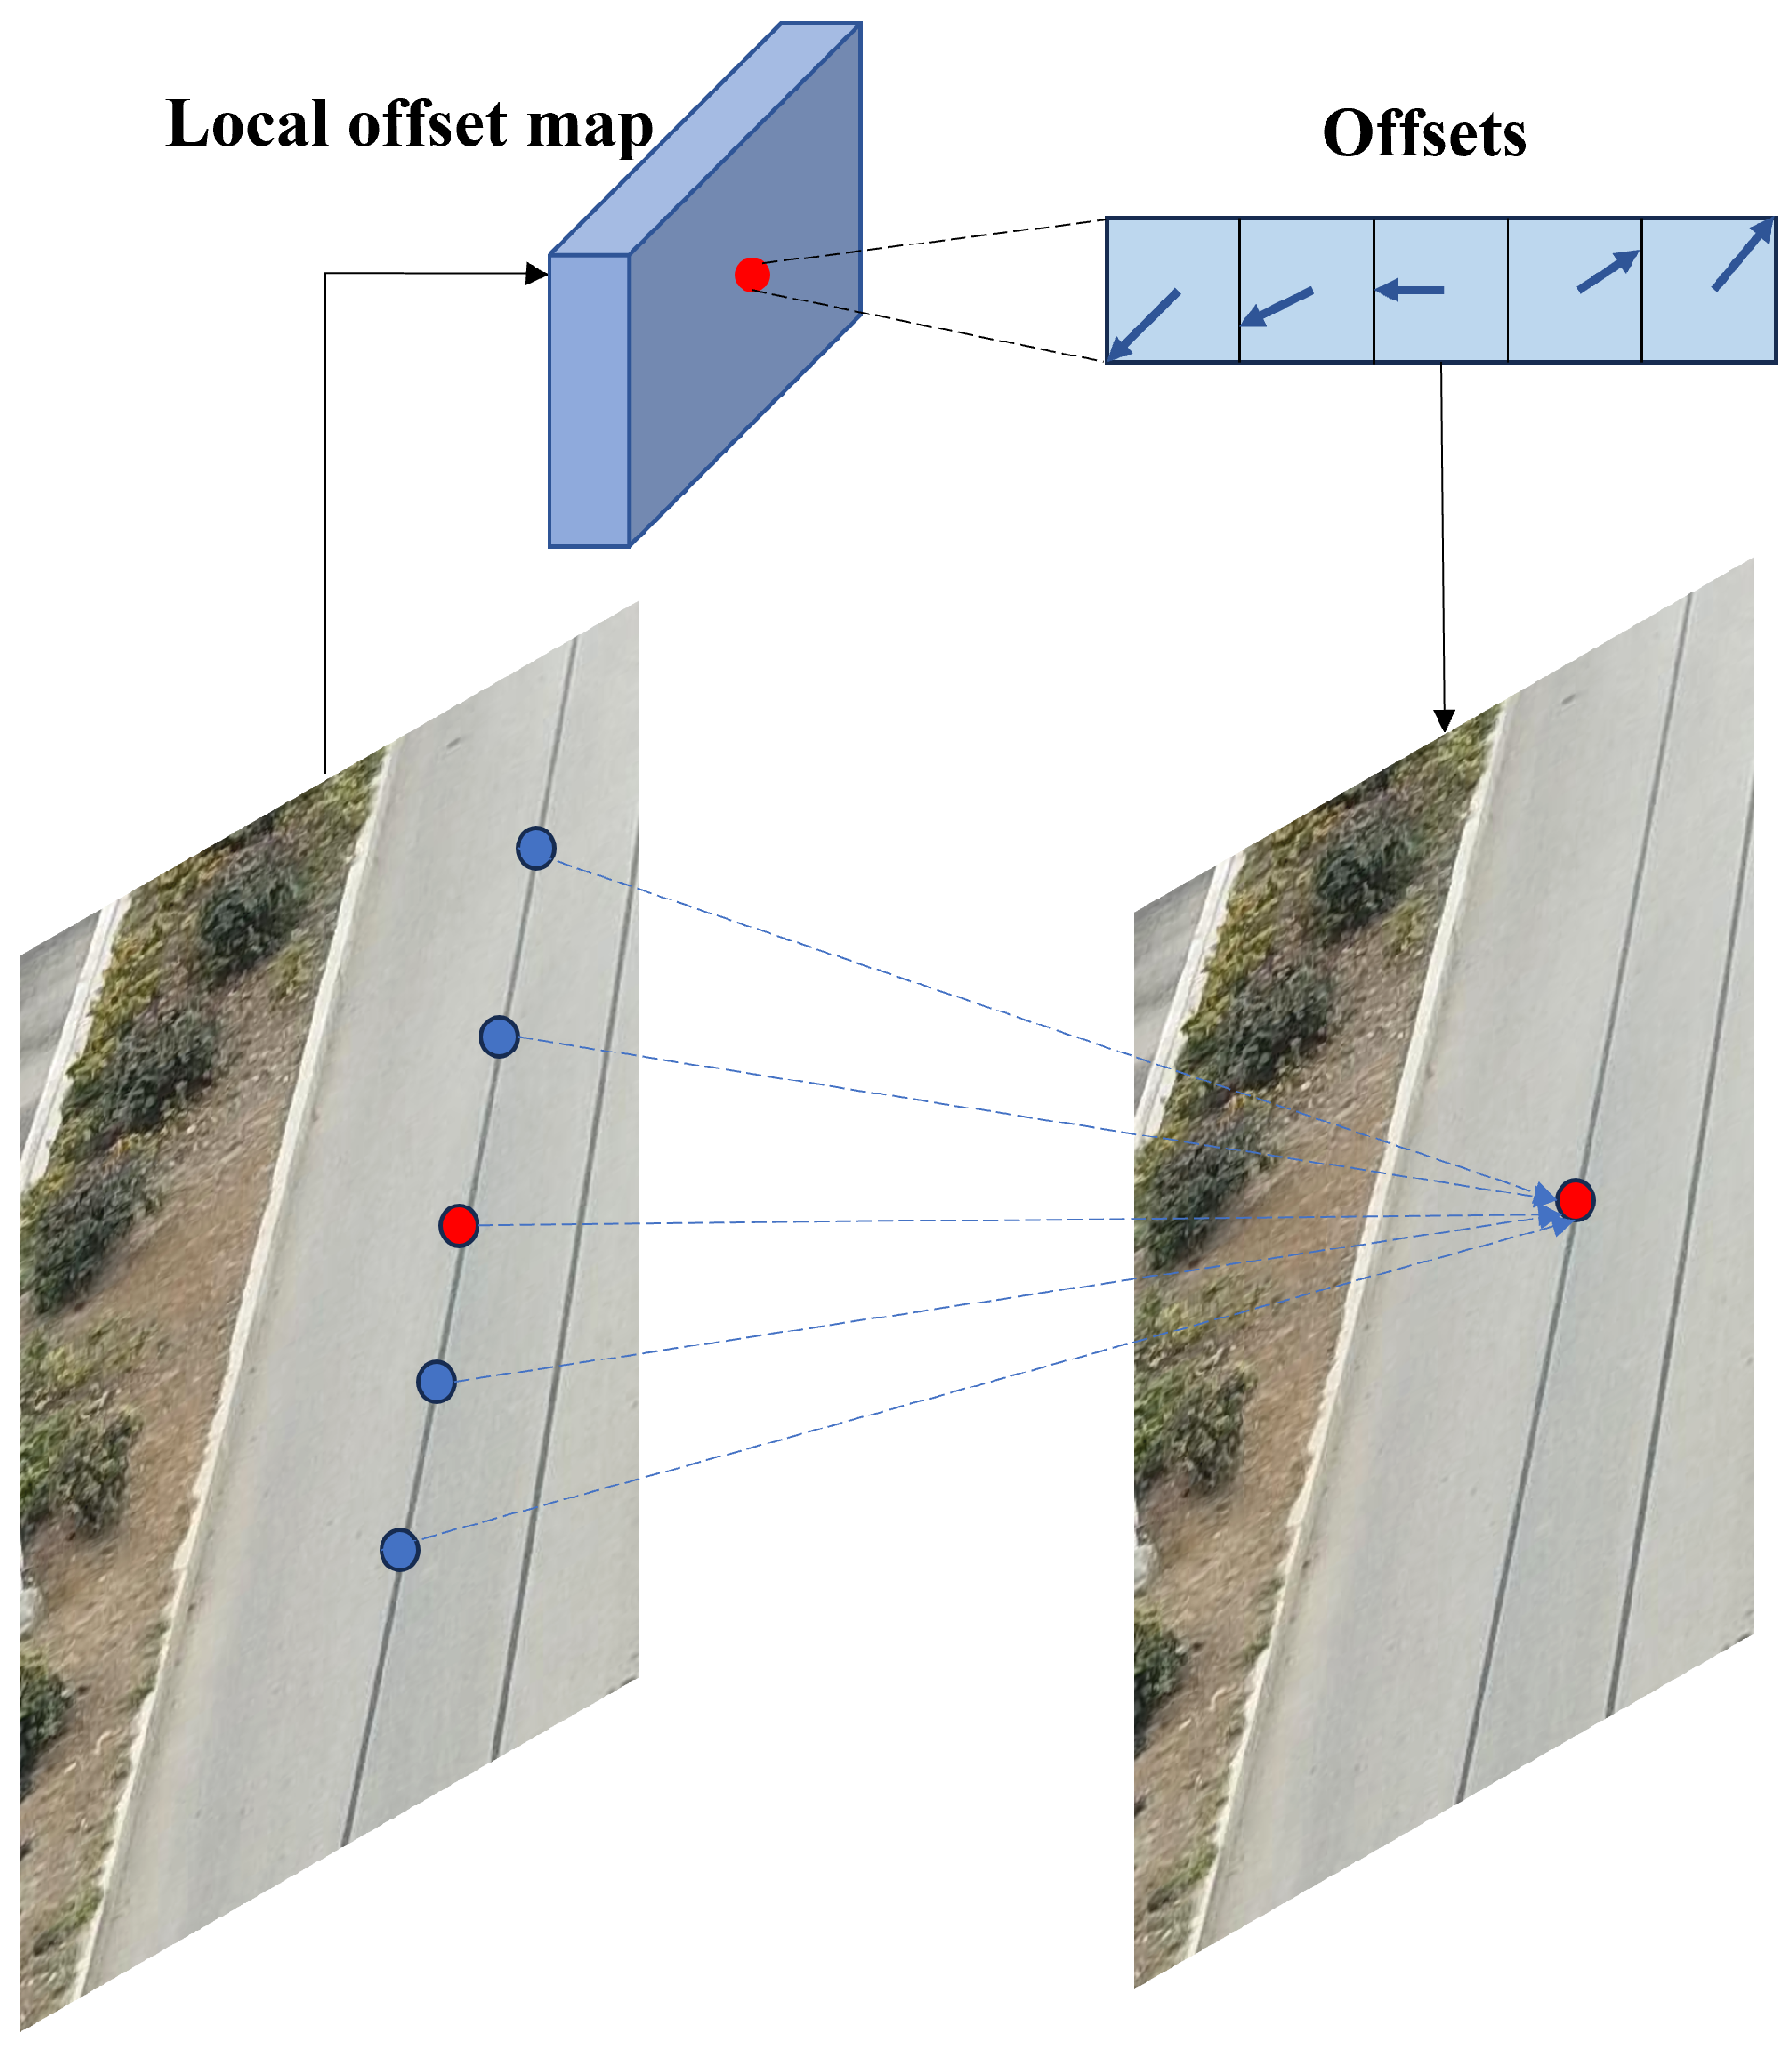
The linear structure-aware feature strategy (LSAFS, Figure 6) adds supervision on the geometric relation between each keypoint and its neighbors on the same conductor. The offset ground truth between the i-th keypoint and other keypoints on the same power line is defined as , where the calculation is given by , with representing the true coordinates of the k-th keypoint on the same power line as the i-th keypoint, and is the coordinate of the i-th keypoint.
Figure 6.
Schematic of LSAFS. Red dots denote detected keypoints and blue dots denote neighboring samples. The module predicts offsets from each keypoint to its neighboring samples and aggregates their features to enrich the keypoint representation.
To establish a correspondence between the predicted offsets and the ground-truth offsets , we search for a permutation that minimizes the matching cost:
where . The Hungarian algorithm is employed to compute this optimal assignment efficiently. We then supervise the prediction of adjacent keypoints with a Smooth loss:
where K is the number of keypoints on each power line, N is the number of power lines, and is the number of adaptive samples.
The three prediction heads and LSAFS are trained jointly. In addition to , is an loss on the subpixel keypoint offset, is an loss on the keypoint-to-start-point offset, and is the Smooth- matching loss above. The total loss is
with . The Smooth- transition parameter is .
4. Experiments
4.1. Experimental Settings
This study uses three UAV power-line datasets: the public PLDU [28] and TTPLA [39] datasets and the self-constructed CPLD dataset. Images are represented at pixels (width × height) and padded to for network input. The fixed, disjoint partitions used in all experiments areas follows:
- PLDU: 573 samples (training set: 393; validation set: 60; test set: 120).
- TTPLA: 1248 samples (training set: 876; validation set: 124; test set: 248).
- CPLD: 1000 samples (training set: 700; validation set: 100; test set: 200).
The validation set contains half as many images as the test set, and the remaining images form the training set. It was used for checkpoint selection; the test set was used only for final evaluation.
CPLD contains UAV images of power-transmission corridors with mountainous terrain, farmland, and rivers as typical backgrounds. Its conductor morphology includes curved lines, supplementing the predominantly straight-line geometry considered in the public benchmarks. Each sample comprises an original image and its corresponding power-line segmentation annotation, which distinguishes conductor foreground from background for pixel-level evaluation.
The training files used in this study contain an original image, a segmentation map, and a separate coordinate sequence for each annotated conductor. The data-preparation procedure therefore treats each coordinate sequence as one instance rather than inferring instance identity from the binary mask. Each sequence is resampled from the bottom of the image upward, and the lowest visible sample is used as the common reference point. The procedure then generates the keypoint heatmap, subpixel position offsets, and offsets from each sampled point to the common reference; keypoints, start points, ordering labels, and offset vectors do not require additional manual point-by-point annotation. During inference, the network predicts these quantities from the image, groups points that vote for the same reference, and connects the ordered points to reconstruct each conductor. The reconstructed lines are rasterized with a 14-pixel width and compared with the binary segmentation map for pixel-level evaluation.
Experiments were performed under Linux on one NVIDIA GeForce RTX 4090 GPU (24 GB). The ResNeXt50-32×4d backbone was initialized with ImageNet-pretrained weights. The model was trained for 500 epochs with Adam, a batch size of 8, an initial learning rate of , gradient clipping at a maximum norm of 35, and polynomial learning-rate decay to . Linear warm-up was used for the first 100 iterations, starting at 0.1 times the initial rate. Training augmentation comprised horizontal flipping with probability 0.5 and random affine transformation with probability 0.7 (rotation , translation 0.1, scale 0.2, and zero shear). The same training configuration, including data augmentation, pretrained initialization, optimizer, learning-rate schedule, and training budget, was used for PLDU, TTPLA, CPLD, and all retrained comparison methods.
The inference thresholds were 0.2 for keypoint confidence, 0.7 output pixels for root-candidate selection, and 1.35 output pixels for center clustering. The proposed method and all retrained comparison methods used the same fixed partitions, with the random seed fixed to 42.
4.2. Evaluation Metrics
Pixel-level detection performance is evaluated using intersection over union (IoU), recall, precision, and F1 score. For each image, the reconstructed polylines are rasterized as a binary prediction mask, the four metrics are computed against the binary reference mask, and the reported dataset value is the arithmetic mean of the per-image scores (macro averaging). Thus, large images or images with more foreground pixels do not receive greater weight. Specific definitions are as follows:
- IoU: Quantifies localization accuracy by computing the overlap ratio between predicted and ground truth regions.
- Recall: Measures the completeness of true target detection.
- Precision: Evaluates the reliability of positive predictions.
- F1: Provides integrated assessment of detection performance as the harmonic mean of Recall and Precision, balancing accuracy and completeness within a single scalar.
4.3. Comparative Results and Model Complexity
4.3.1. PLDU and TTPLA Comparison
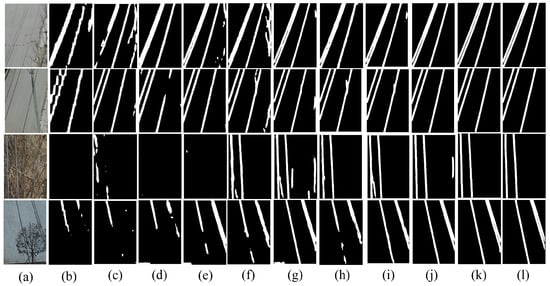
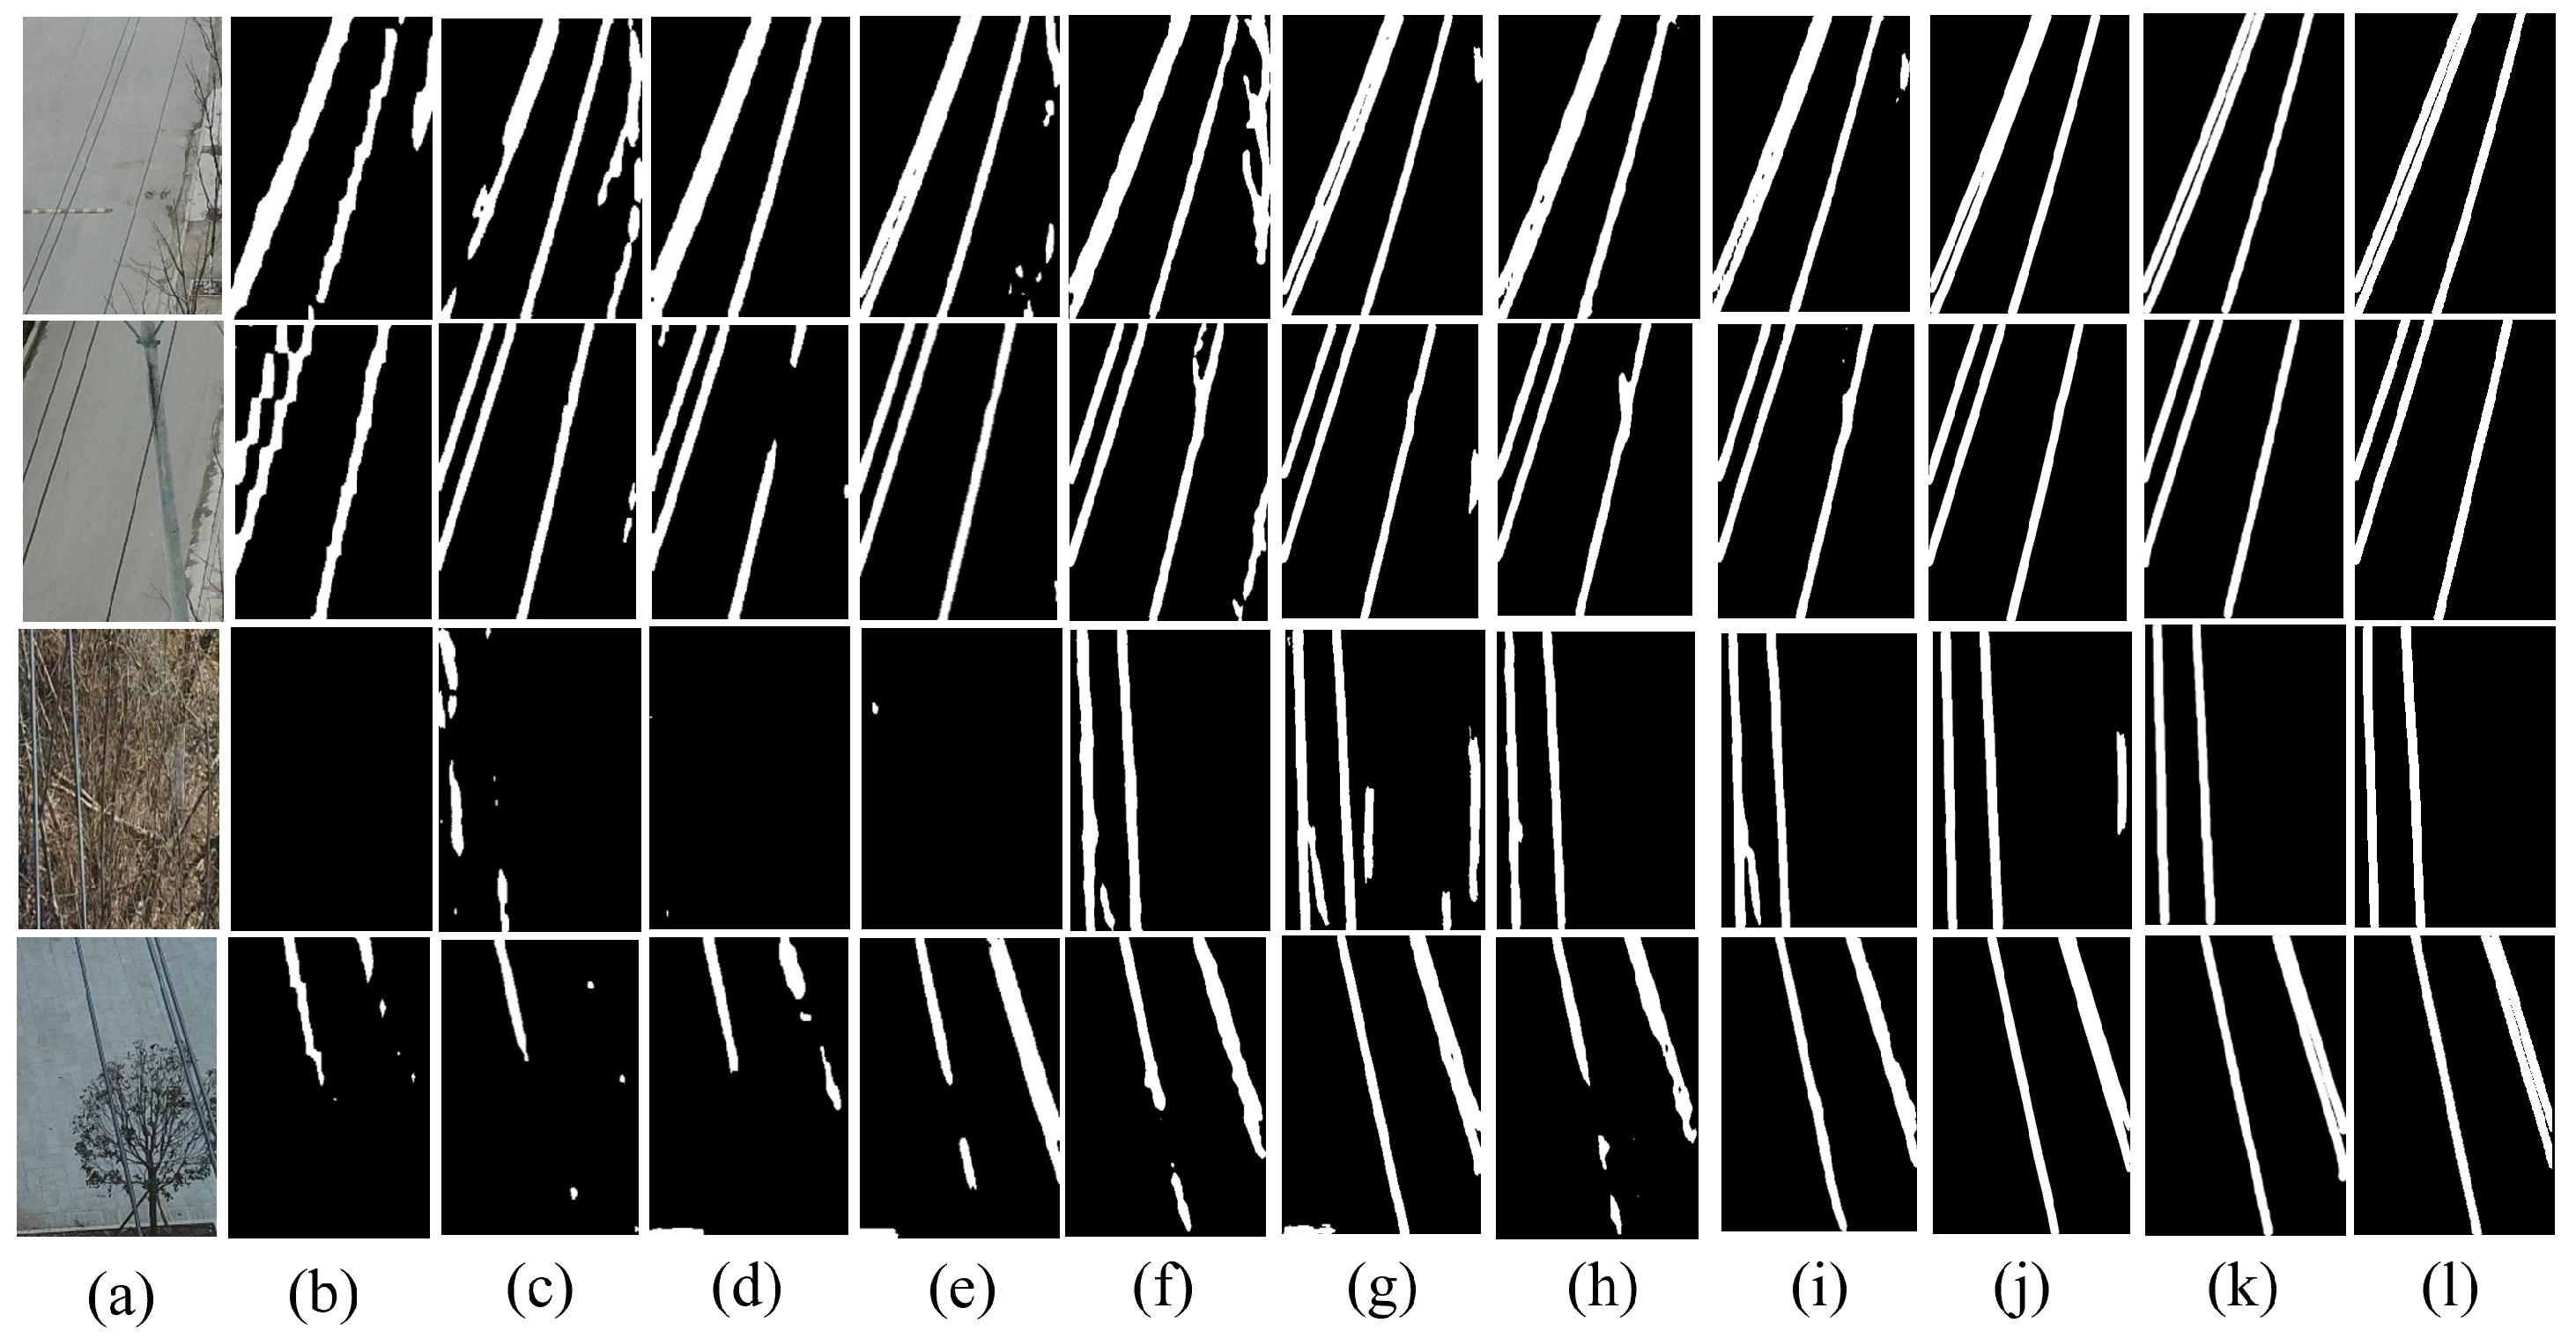
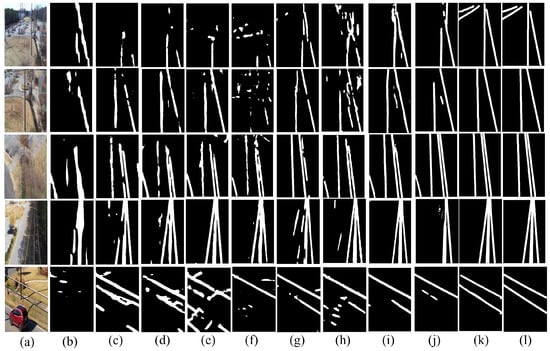
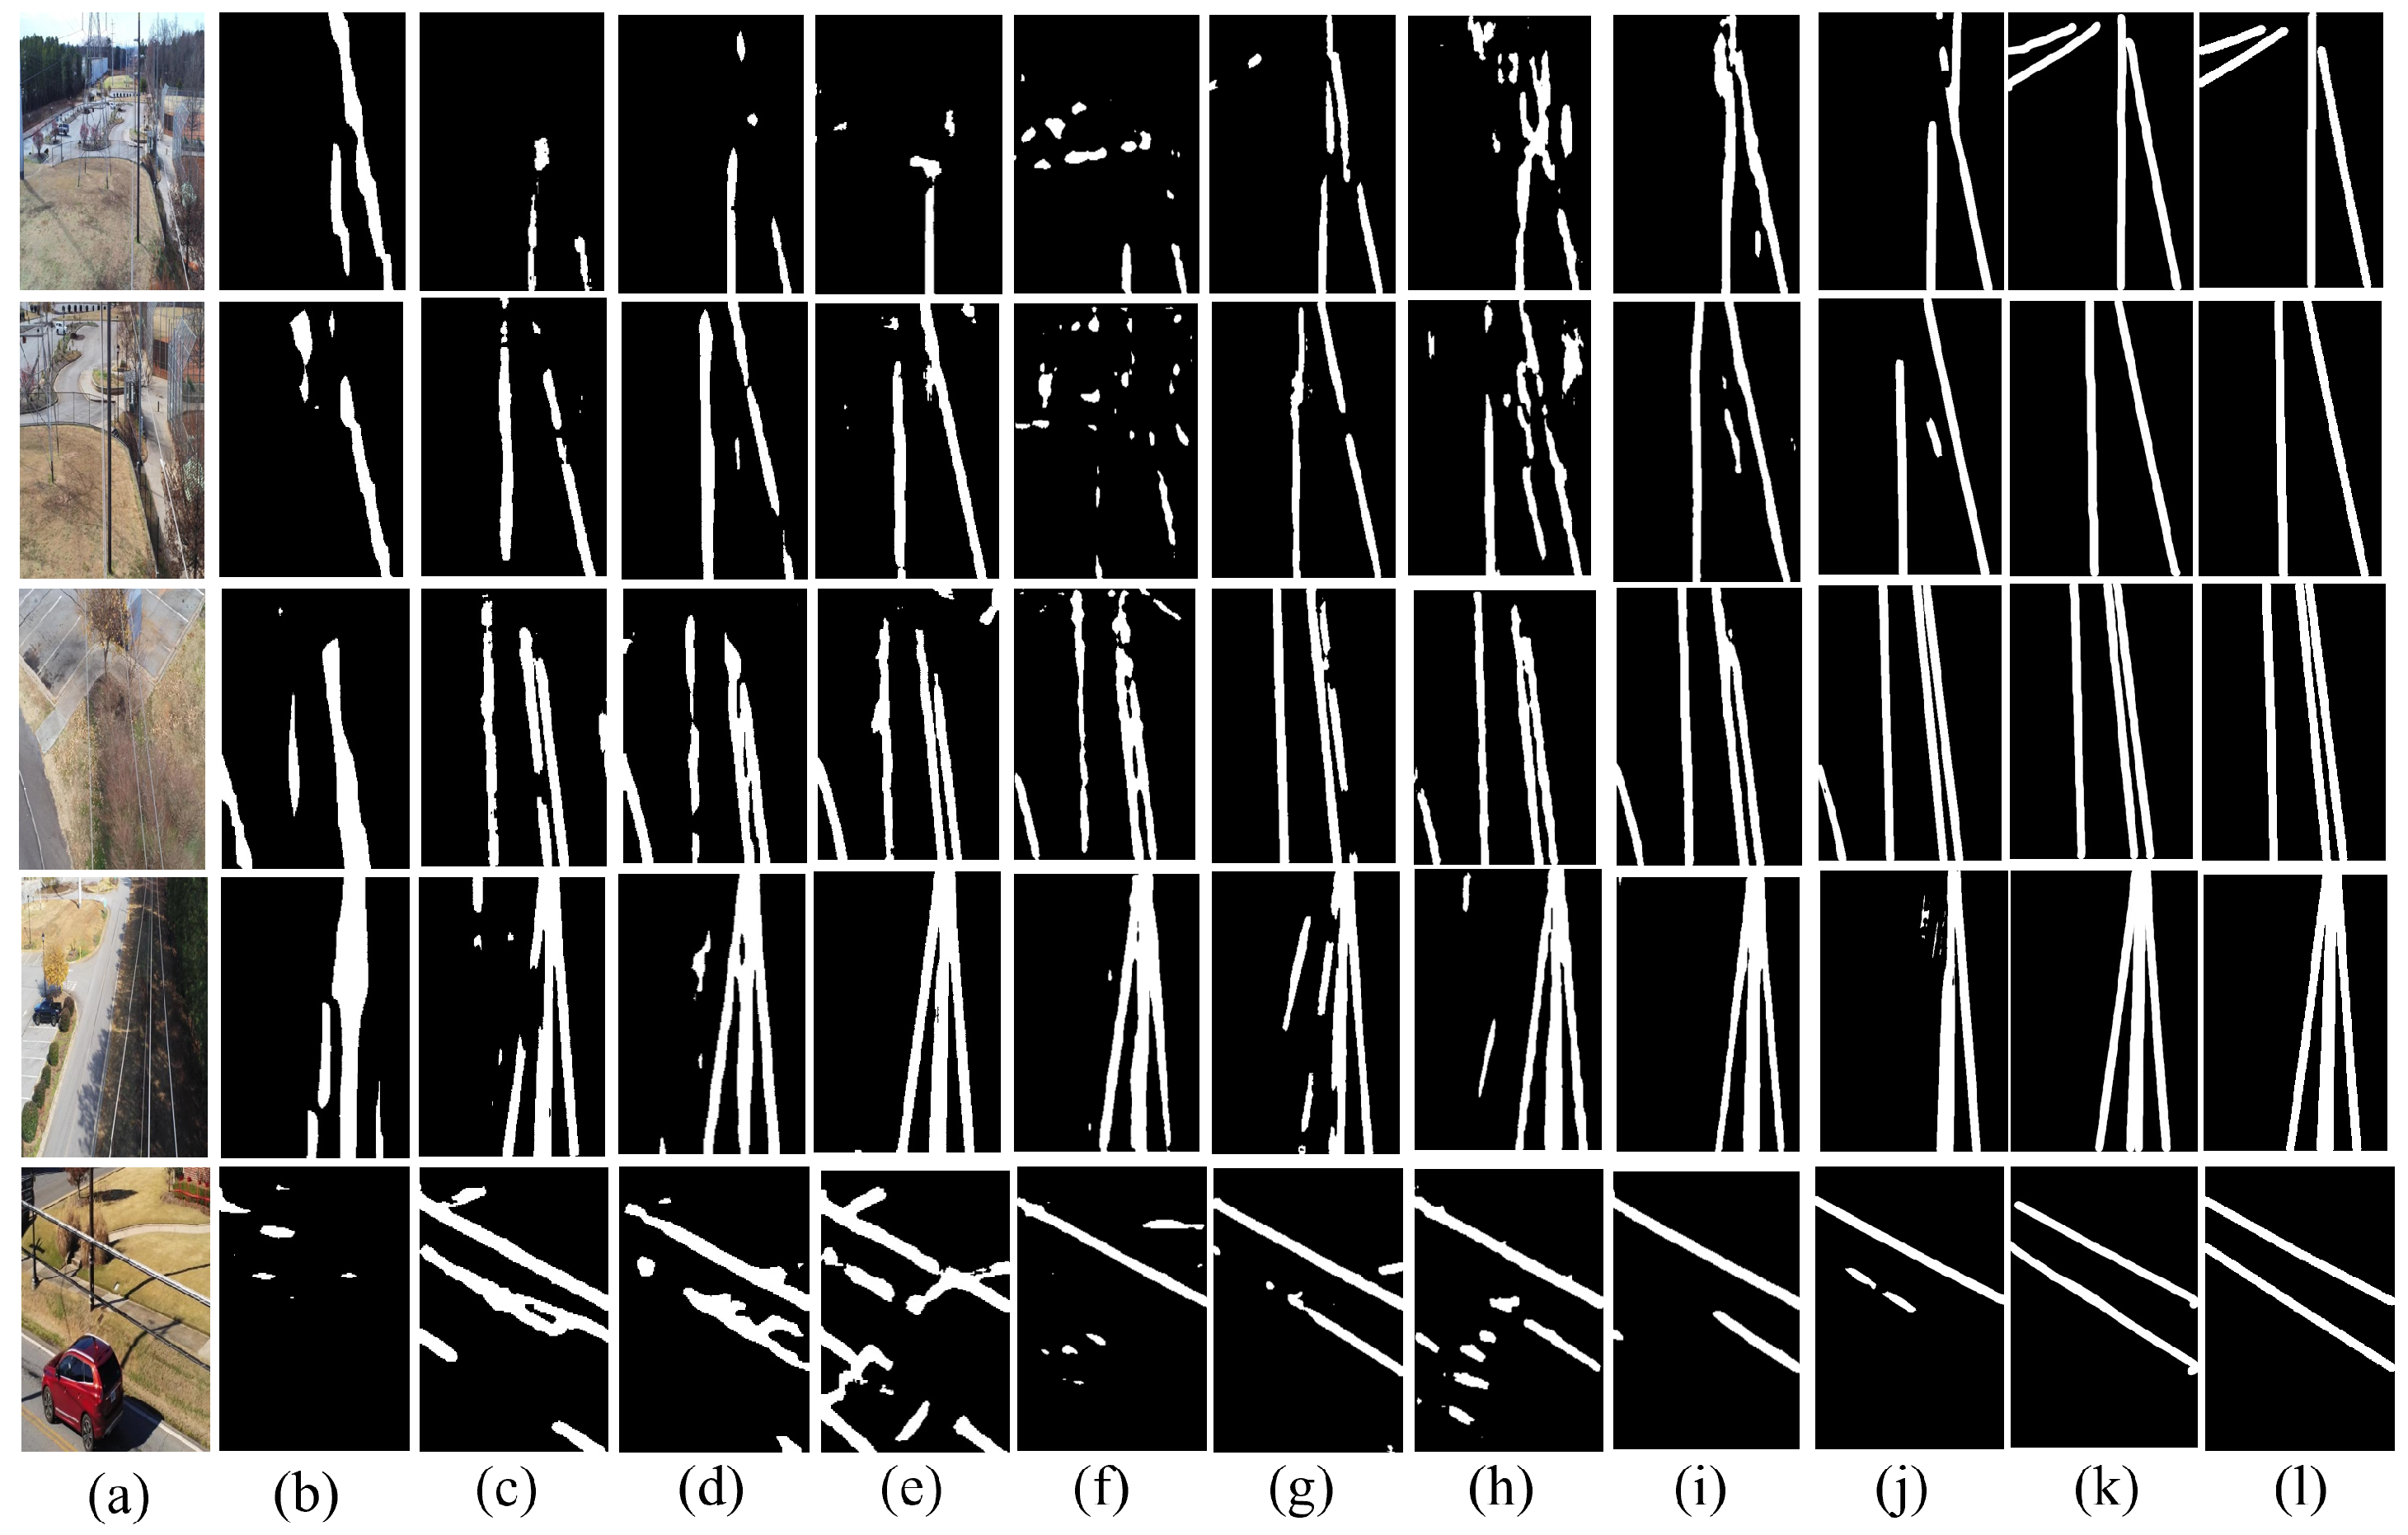
To compare pixel-level power-line recognition, we evaluated DANet [40], TransUNet [41], BiSeNetV2 [42], PMFSNet [43], EGEUNet [44], RollingUNet [45], UltraLightVMUNet [46], HVMUNet [47], and nnWNet [48] on the PLDU and TTPLA test partitions. All compared methods follow the protocol in Section 4. Architecture-specific outputs are converted to binary masks and rasterized at a line width of 14 pixels before the per-image metrics are calculated. Table 1 shows that the proposed method has the highest IoU and F1 score on PLDU and the highest four pixel metrics on TTPLA among the evaluated models. Figure 7 and Figure 8 provide qualitative examples under vegetation occlusion and for fine conductors.
Table 1.
Comparative experimental results on the PLDU [28] and TTPLA [39] test partitions.
Figure 7.
Comparative visualization on the public PLDU dataset. (a) Original image; (b) DANet; (c) TransUNet; (d) BiSeNetV2; (e) PMFSNet; (f) EGEUNet; (g) RollingUNet; (h) UltraLightVMUNet; (i) HVMUNet; (j) nnWNet; (k) proposed method; (l) ground truth.
Figure 8.
Comparative visualization on the public TTPLA dataset. (a) Original image; (b) DANet; (c) TransUNet; (d) BiSeNetV2; (e) PMFSNet; (f) EGEUNet; (g) RollingUNet; (h) UltraLightVMUNet; (i) HVMUNet; (j) nnWNet; (k) proposed method; (l) ground truth.
4.3.2. CPLD Comparison
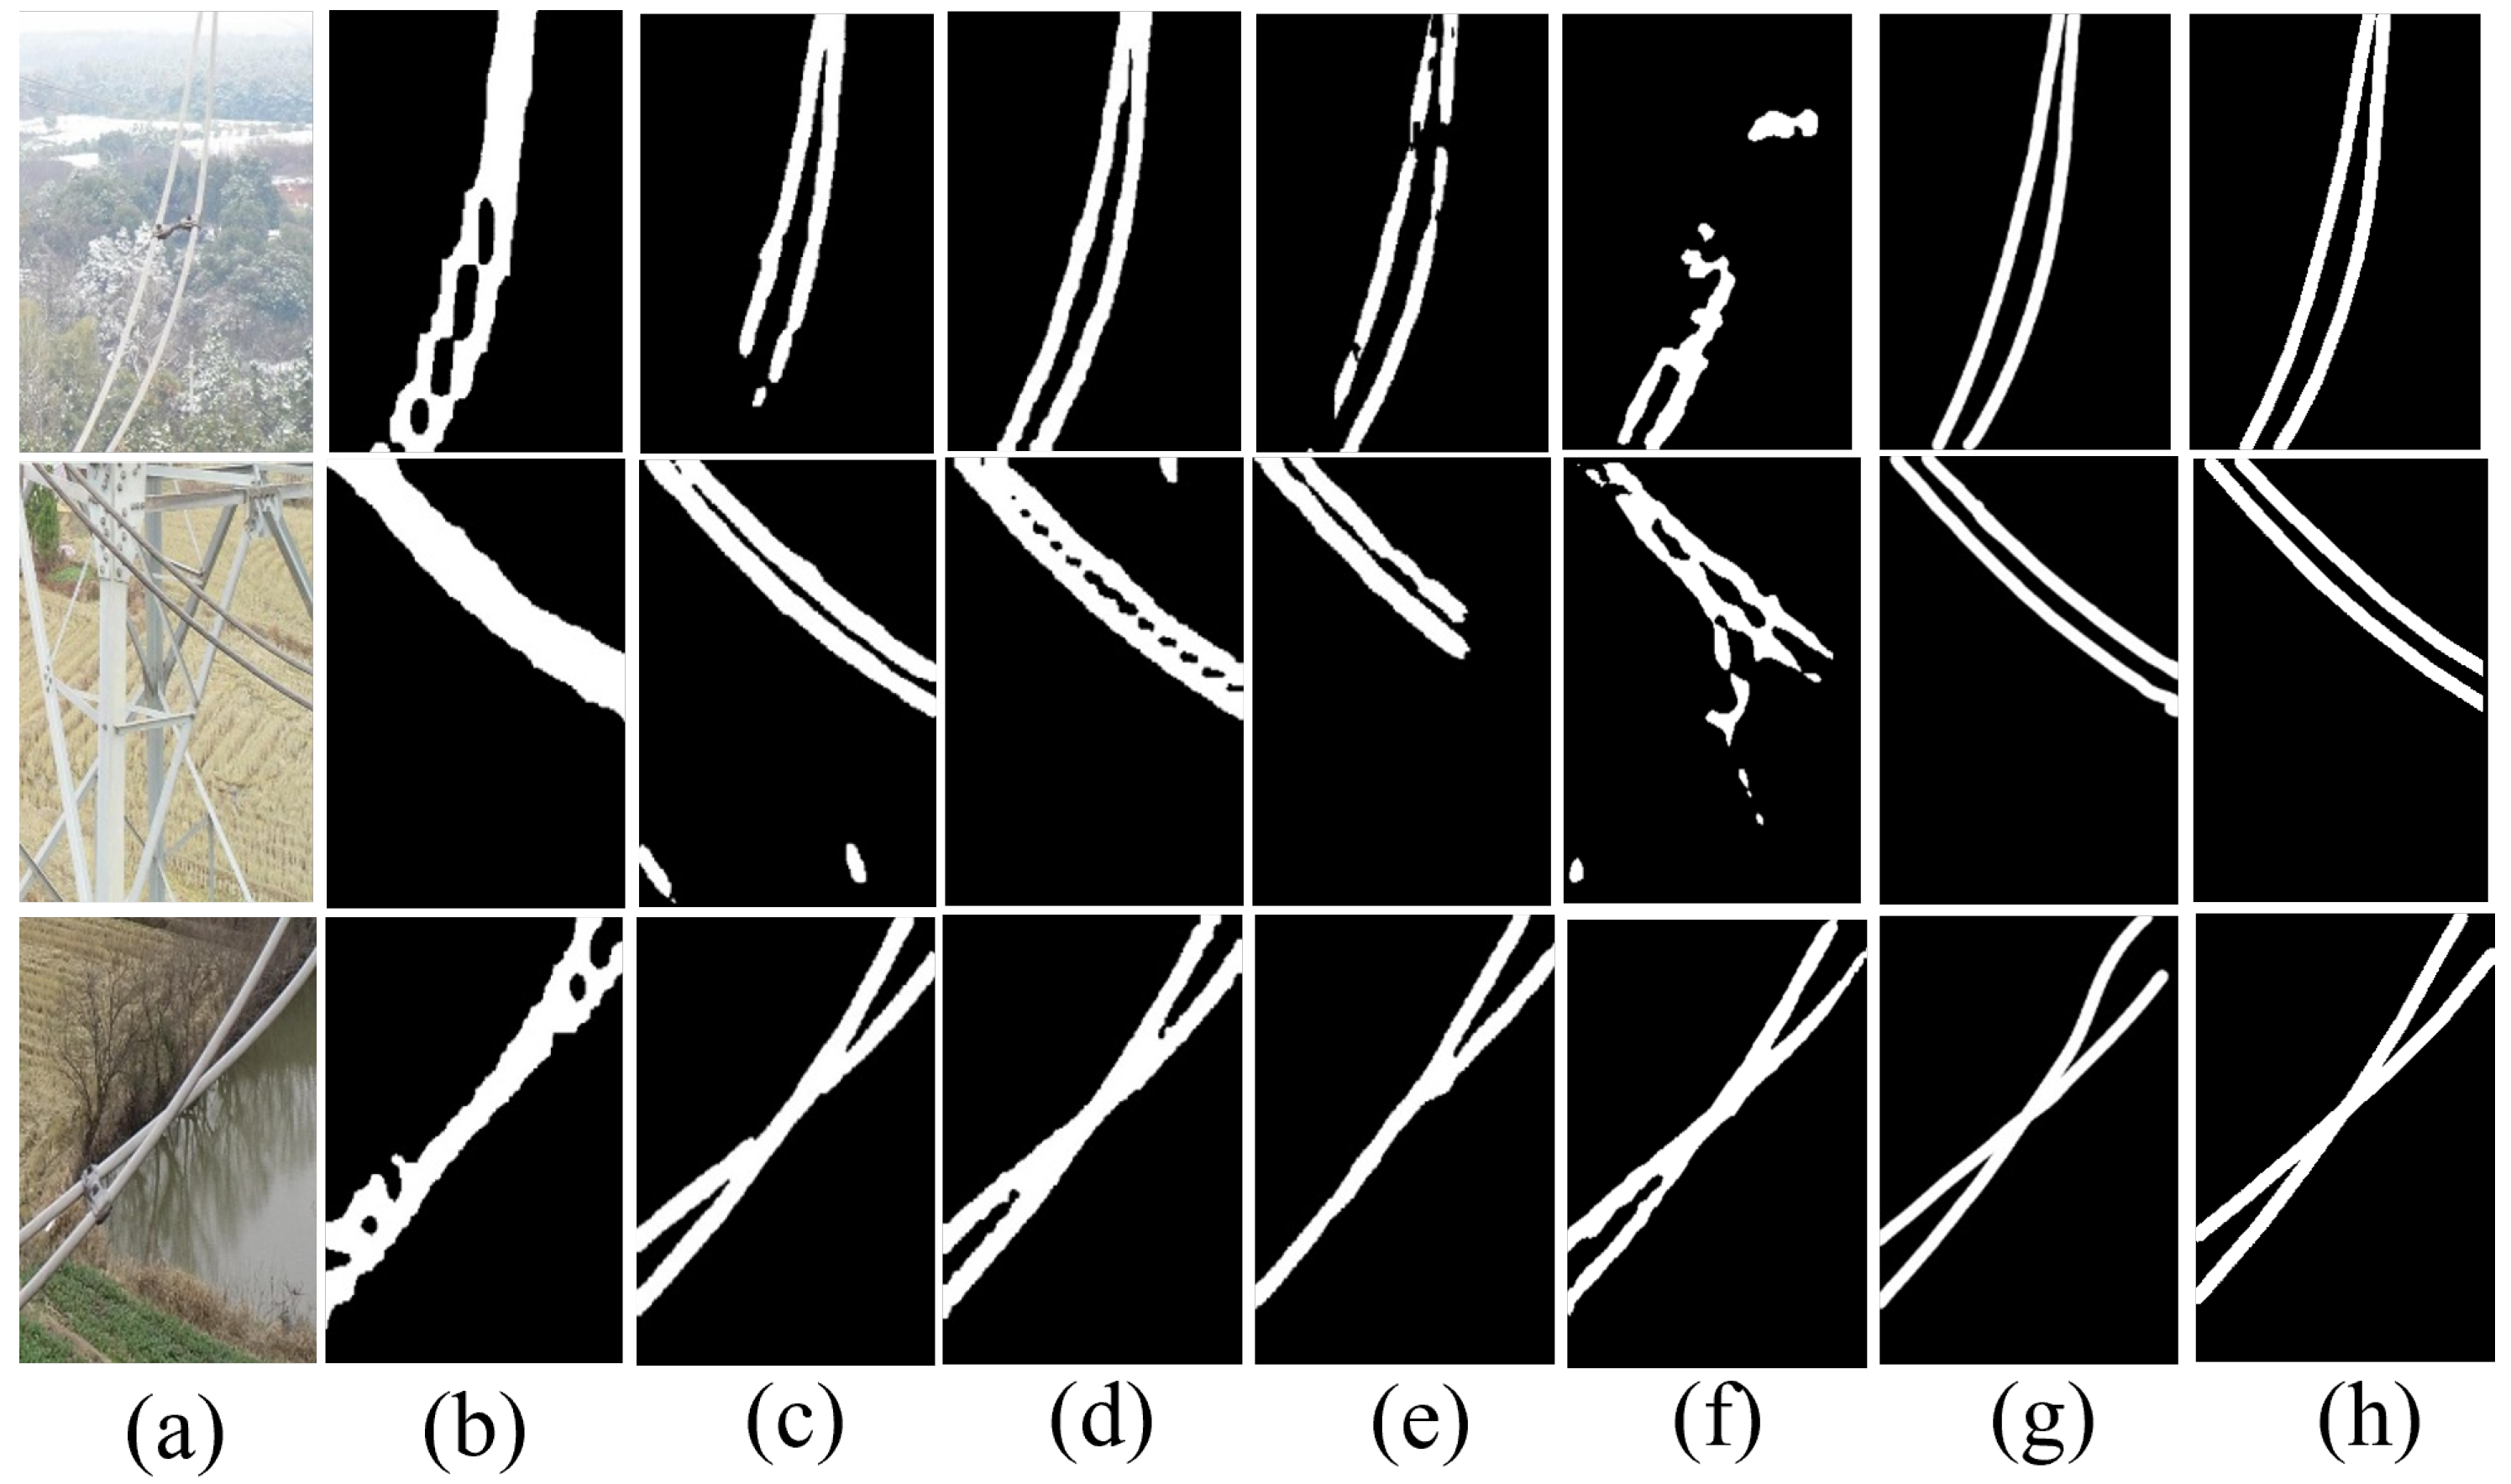
Because CPLD includes curved conductors against mountainous, farmland, and river backgrounds, we additionally evaluated DANet [40], TransUNet [41], BiSeNetV2 [42], PMFSNet [43], and EGEUNet [44] on its test partition. As shown in Table 2, the proposed method has the highest IoU (70.44%) and precision (83.87%) among these models. Its recall is 9.70 percentage points below BiSeNetV2 (82.38% versus 92.08%), while its F1 score is 0.05 points lower (80.69% versus 80.74%), indicating a Precision–Recall trade-off. Figure 9 shows representative narrow-spacing and intersection cases.
Table 2.
Comparative experimental results on the CPLD test partition.
Figure 9.
Comparative visualization on the self-constructed CPLD dataset. (a) Original image; (b) DANet; (c) TransUNet; (d) BiSeNetV2; (e) PMFSNet; (f) EGEUNet; (g) proposed method; (h) ground truth.
4.3.3. Model Complexity
Table 1 retains the whole-model value of 36.76 GFLOPs used for cross-method comparison. Table 3 reports module-level parameter counts and MAC estimates for an input size of . Parameter counts are exact tensor counts. A MAC denotes one multiply–accumulate operation; MACs (G) reports billions of MACs, and MAC Share reports each module’s percentage of the estimated model total. The estimates were obtained with the MMCV complexity counter, which may not include all work performed by unsupported custom sampling operations. The module-level total of 18.32 billion MACs corresponds to approximately 36.64 GFLOPs when one multiply–accumulate is counted as two floating-point operations. The two values are therefore reported separately. The backbone accounts for most of the parameters and estimated arithmetic. The MSRAFE aggregator contributes 5.29% of parameters and 1.45% of estimated MACs, while the neck, including LFA and LSAFS, contributes 0.92% and 3.00%, respectively. Within the neck, AKConv contributes approximately 0.079 M parameters and 0.247 billion MACs, and dynamic fusion contributes approximately 0.008 M parameters and 0.032 billion MACs.
Table 3.
Module-level profile of the current implementation at . MAC estimates may omit unsupported custom-operator work.
4.4. Ablation Experiments
4.4.1. Backbone Network Ablation
On the PLDU test partition, we conducted experiments on four backbone networks, namely, ResNet50, RegNet, HRNet, and ResNeXt50. The experimental results are presented in Table 4. It can be observed that ResNeXt50 achieves optimal performance across all four evaluation metrics. Consequently, ResNeXt50 is selected as the backbone network for our final model.
Table 4.
Evaluation metrics of the model using different backbone networks on the PLDU test partition.
4.4.2. Functional Module Ablation
Table 5 reports ablations on the PLDU test partition. The baseline obtains 83.48% IoU and 90.18% F1, and adding MSRAFE raises them to 84.55% and 90.88%. Relative to baseline+MSRAFE, LFA adds 0.35/0.22 points in IoU/F1, while LSAFS adds 0.46/0.38 points. Using all three modules gives 85.76% IoU and 91.76% F1, indicating that their effects are complementary within the complete framework.
Table 5.
Ablation experiments of MSRAFE, LFA, and LSAFS on the PLDU test partition.
4.5. Qualitative Results
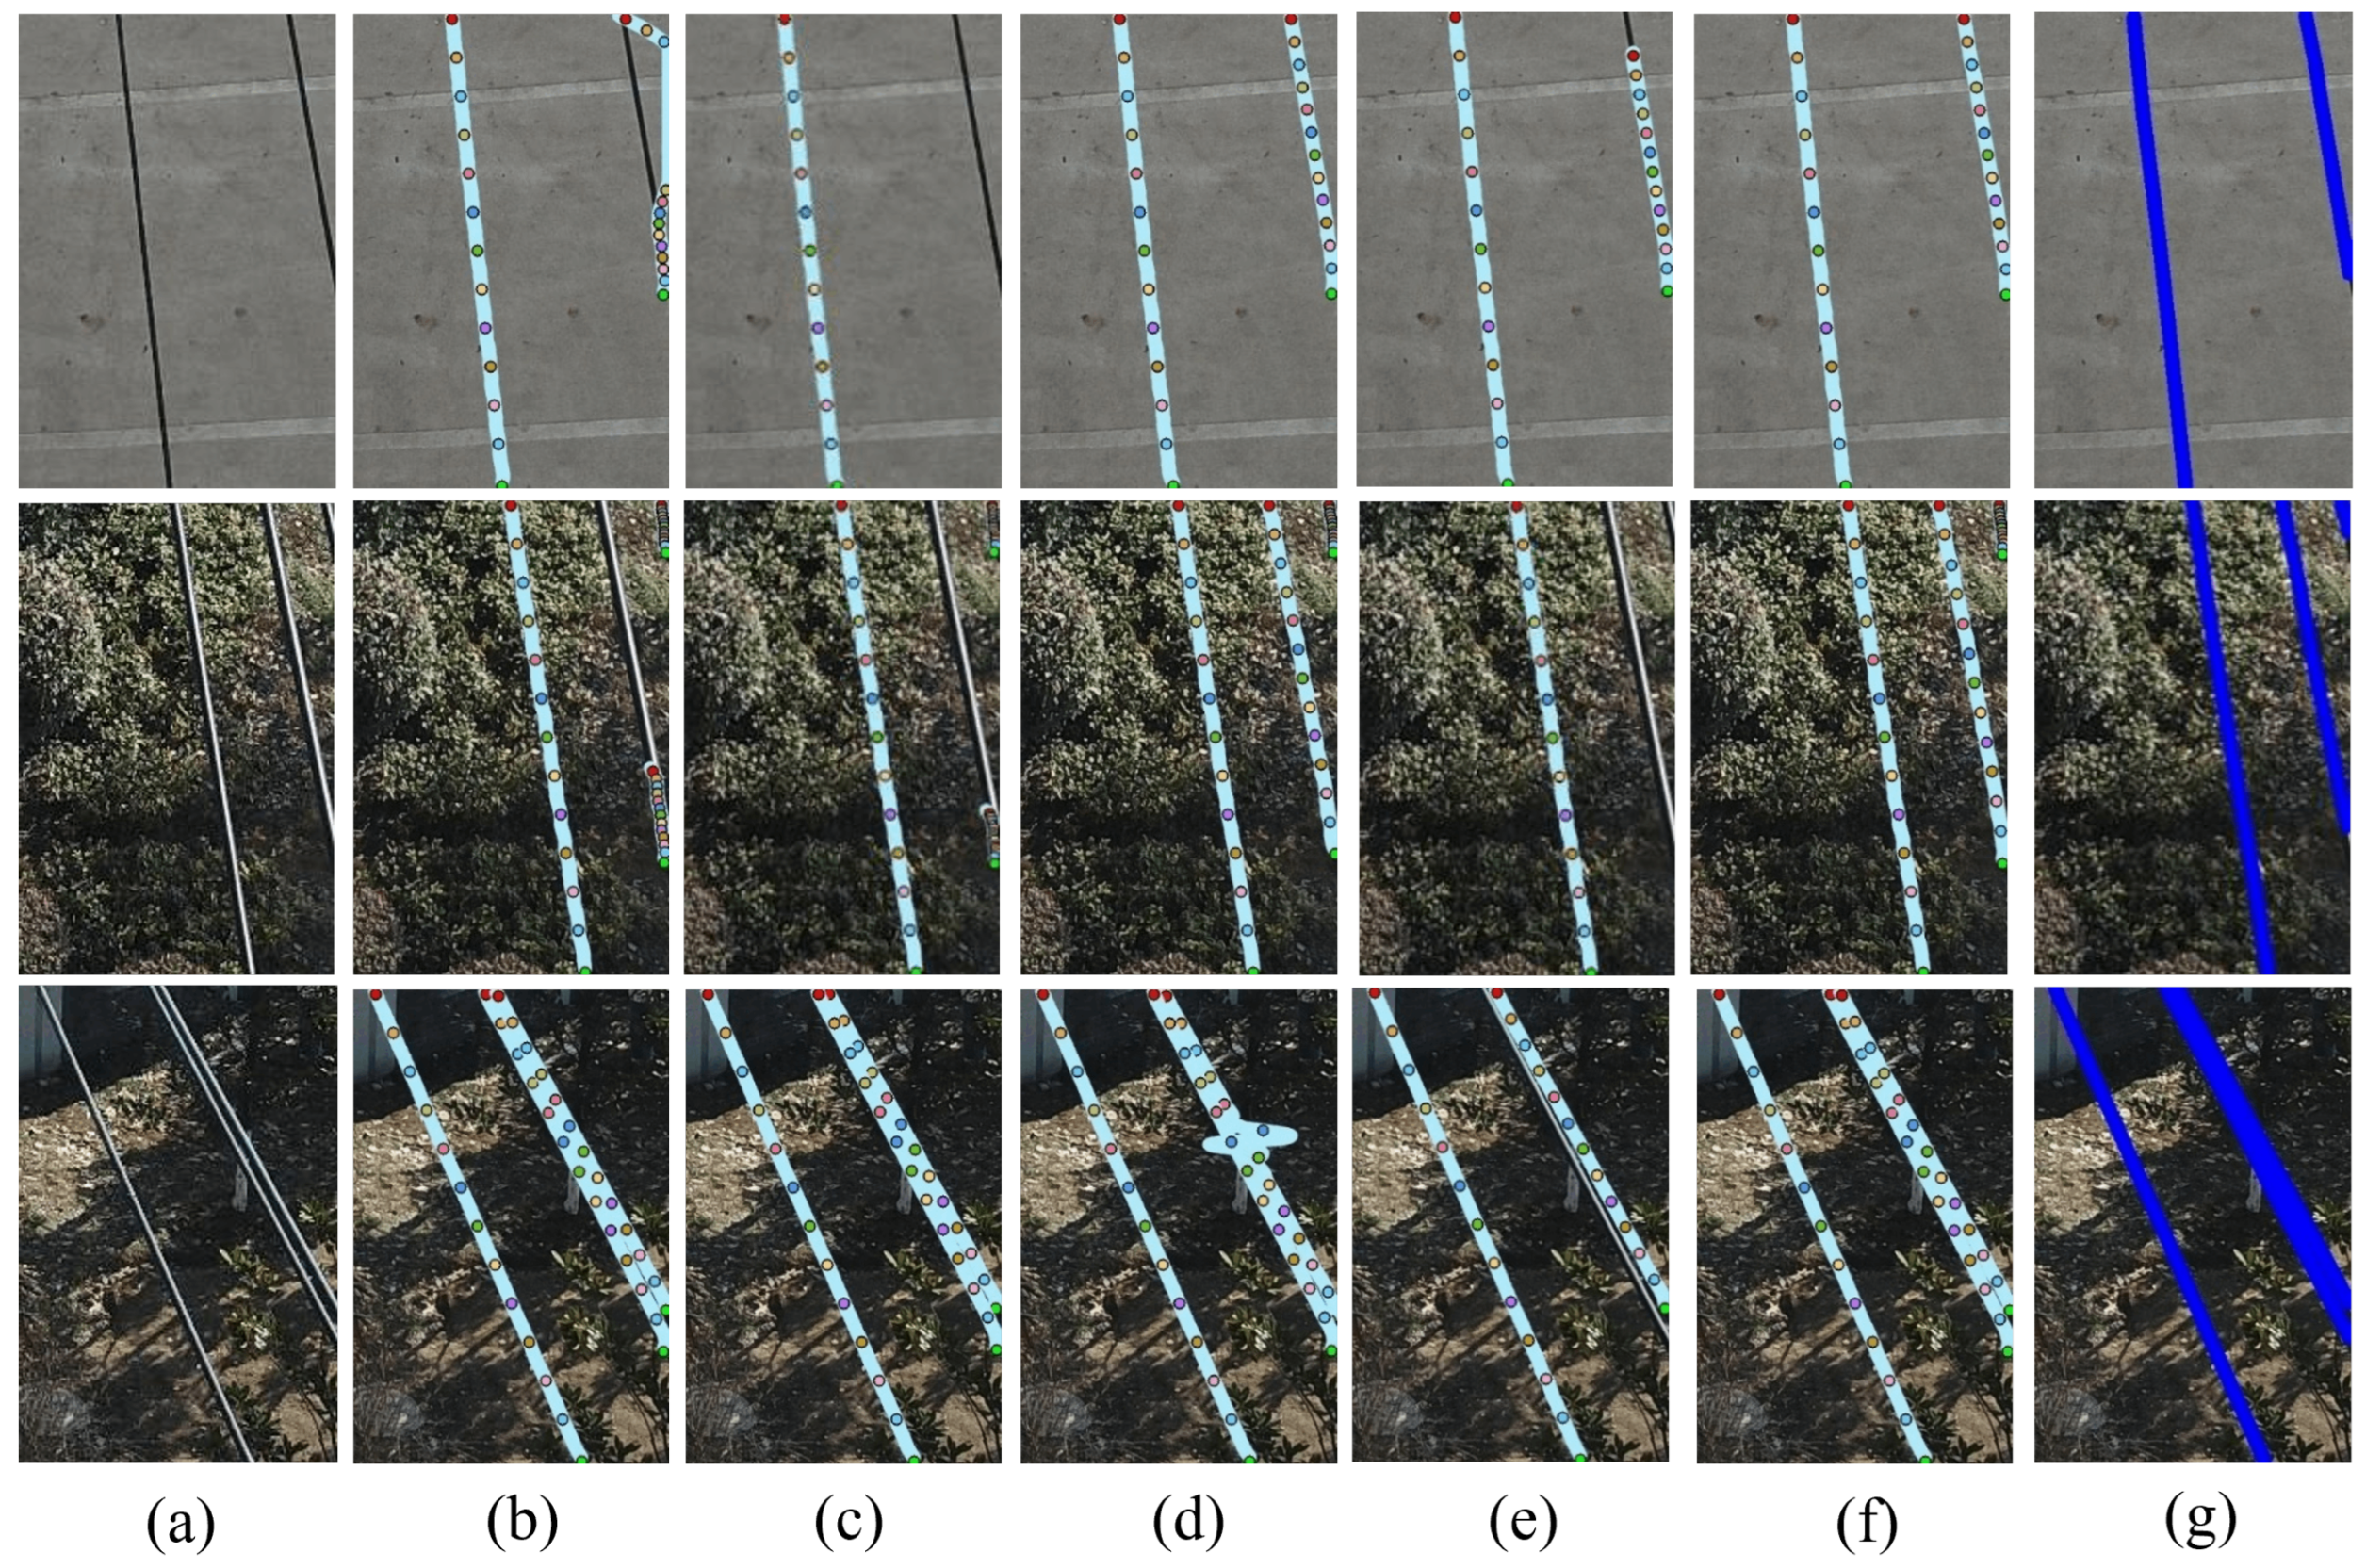
Figure 10 shows qualitative comparisons: (a) original image; (b) w/o MSRAFE; (c) w/o LFA; (d) w/o LSAFS; (e) w/o all three modules; (f) full model (MSRAFE+LFA+LSAFS); (g) ground truth. Keypoints are overlaid in light blue. In these examples, the complete model keeps adjacent conductors separated and shows fewer interruptions than the ablated variants.
Figure 10.
Qualitative prediction maps under different settings: (a) original image; (b) w/o MSRAFE; (c) w/o LFA; (d) w/o LSAFS; (e) w/o all three modules; (f) proposed full model (with MSRAFE+LFA+LSAFS); (g) ground truth. Colored circles distinguish adjacent sampled keypoints along each conductor; the colors are used only for visualization and do not indicate class or confidence.
5. Discussion and Limitations
IoU, recall, precision, and F1 quantify rasterized mask overlap, but do not reveal instance merging, fragmentation, or incorrect connectivity. The qualitative examples illustrate reconstructed line patterns; a full structural evaluation would additionally require matched-instance precision/recall, fragmentation count, endpoint error, and path-continuity measures.
The shared start point is a grouping reference rather than a physical conductor endpoint. After the joint geometric transformation of the image and instance coordinates, the visible point nearest the bottom boundary is selected; invisible or shorter-than-two-point instances produce no target. Severe occlusion, near-horizontal geometry, disconnected visible fragments, and crops that change the lowest visible point can make this reference ambiguous.
Model selection used the validation partitions described in Section 4. All dataset-level table results reported above were obtained on the corresponding test partitions, which were not used for checkpoint selection. No nested cross-validation was performed. Each table entry comes from one run (seed 42), and no multi-seed uncertainty or paired significance test is reported. Small differences, such as those from nnWNet on PLDU, should therefore be read within this protocol. The ablation isolates MSRAFE, LFA, and LSAFS but not the shared-start association, for which a matched local or adjacent-keypoint baseline remains future work.
The proposed model has 24.62 M parameters and 36.76 GFLOPs, and its measured throughput is 56.6 frames/s under the comparative protocol used for all methods. These results describe the desktop implementation; edge-hardware performance has not yet been measured.
6. Conclusions
This paper presented a keypoint-regression framework for power-line detection in UAV optical imagery. A shared start-point vote groups keypoints, MSRAFE and LFA combine multi-scale representations, and LSAFS introduces adaptive local sampling. The method achieved the highest IoU among the evaluated approaches on the PLDU, TTPLA, and CPLD test partitions. On CPLD, it produced higher Precision but lower Recall than BiSeNetV2. Combining MSRAFE, LFA, and LSAFS produced the highest ablation scores.
Future work will further study structural and instance-level evaluation, failure cases under boundary cropping and occlusion, and efficient implementation on representative edge hardware.
Author Contributions
Conceptualization, X.S.; Methodology, K.X.; Validation, H.P.; Formal analysis, H.P. and Y.T.; Investigation, H.P.; Data curation, Y.T.; Writing—original draft, X.S.; Writing—review and editing, K.X., B.P. and Y.T.; Visualization, B.P.; Funding acquisition, B.P. All authors have read and agreed to the published version of the manuscript.
Funding
This work was supported by the National Natural Science Foundation of China (Grant No. 12475018), the China Scholarship Council (Project ID: 202408420224), and the General Project of the Department of Science and Technology of Liaoning Province (Grant No. 2026080311-JH3/107).
Institutional Review Board Statement
Not applicable.
Informed Consent Statement
Not applicable.
Data Availability Statement
The publicly available PLDU and TTPLA datasets analyzed in this study are described in the corresponding sources cited in the manuscript. The self-constructed CPLD dataset cannot be made publicly available because it contains privacy-sensitive information.
Acknowledgments
During the preparation and revision of this manuscript, the authors used OpenAI Codex CLI (version 0.146.0; OpenAI, San Francisco, CA, USA) to assist with English-language editing, drafting and rephrasing limited portions of the text, auditing the archived code and configurations, and preparing scripts for the computational-complexity analysis. The tool was not used to implement the proposed method or to create the original datasets, annotations, trained models, or comparative accuracy results. The authors reviewed and verified all AI-assisted text, calculations, and code and take full responsibility for the scientific content and conclusions.
Conflicts of Interest
The authors declare no conflicts of interest.
References
- Zhang, S.; Zhang, X.; Ren, W.; Shen, L.; Zhang, J. Shape-Aware and Feature Fused Power Line Detection Network. Eng. Appl. Artif. Intell. 2026, 170, 113981. [Google Scholar] [CrossRef] [Scilit]
- Tran, D.K.; Nguyen, V.N.; Roverso, D.; Jenssen, R.; Kampffmeyer, M. LSNetv2: Improving Weakly Supervised Power Line Detection with Bipartite Matching. Expert Syst. Appl. 2024, 250, 123773. [Google Scholar] [CrossRef] [Scilit]
- Kong, S.; Yang, L.; Huang, H.; Liu, Y. MAF-Net: A Multi-Attention Fusion Network for Power Transmission Line Extraction from Aerial Images. Expert Syst. Appl. 2024, 250, 123936. [Google Scholar] [CrossRef] [Scilit]
- Lan, K.; Zheng, X.; Li, S.; Hu, J.; Shao, L. AMFA-Net: Aerial Power Line Segmentation Network Based on Attention Mechanism and Feature Aggregation. Measurement 2026, 257, 118684. [Google Scholar] [CrossRef] [Scilit]
- Liu, X.; Hou, L.; Ju, X. A Method for Detecting Power Lines in UAV Aerial Images. In Proceedings of the 2017 3rd IEEE International Conference on Computer and Communications (ICCC), Chengdu, China, 16–16 December 2017; pp. 2132–2136. [Google Scholar] [CrossRef] [Scilit]
- Li, Z.; Liu, Y.; Hayward, R.; Zhang, J.; Cai, J. Knowledge-Based Power Line Detection for UAV Surveillance and Inspection Systems. In Proceedings of the 2008 23rd International Conference Image and Vision Computing New Zealand, Christchurch, New Zealand, 26–28 November 2008; pp. 1–6. [Google Scholar] [CrossRef] [Scilit]
- Yang, T.W.; Yin, H.; Ruan, Q.Q.; Han, J.D.; Qi, J.T.; Yong, Q.; Wang, Z.T.; Sun, Z.Q. Overhead Power Line Detection from UAV Video Images. In Proceedings of the 2012 19th International Conference on Mechatronics and Machine Vision in Practice (M2VIP), Auckland, New Zealand, 28–30 November 2012; pp. 74–79. [Google Scholar]
- Zhang, Y.; Yuan, X.; Li, W.; Chen, S. Automatic Power Line Inspection Using UAV Images. Remote Sens. 2017, 9, 824. [Google Scholar] [CrossRef] [Scilit]
- Jin, Y.; He, M.; Han, G.; Qin, L.; Liu, K. Research on Segmentation Technology of Transmission Lines Based on Aerial Images. Complex Intell. Syst. 2026. [Google Scholar] [CrossRef] [Scilit]
- Li, H.; Song, D.; Liu, Y.; Li, B. Automatic Pavement Crack Detection by Multi-Scale Image Fusion. IEEE Trans. Intell. Transp. Syst. 2019, 20, 2025–2036. [Google Scholar] [CrossRef] [Scilit]
- Shi, Y.; Cui, L.; Qi, Z.; Meng, F.; Chen, Z. Automatic Road Crack Detection Using Random Structured Forests. IEEE Trans. Intell. Transp. Syst. 2016, 17, 3434–3445. [Google Scholar] [CrossRef] [Scilit]
- Amhaz, R.; Chambon, S.; Idier, J.; Baltazart, V. Automatic Crack Detection on Two-Dimensional Pavement Images: An Algorithm Based on Minimal Path Selection. IEEE Trans. Intell. Transp. Syst. 2016, 17, 2718–2729. [Google Scholar] [CrossRef] [Scilit]
- Ma, N.; Fan, R.; Xie, L. UP-CrackNet: Unsupervised Pixel-Wise Road Crack Detection via Adversarial Image Restoration. IEEE Trans. Intell. Transp. Syst. 2024, 25, 13926–13936. [Google Scholar] [CrossRef] [Scilit]
- Chen, P.H.; Hsieh, J.W.; Hsieh, Y.K.; Chang, C.W.; Huang, D.Y. Cross-Scale Overlapping Patch-Based Attention Network for Road Crack Detection. IEEE Trans. Intell. Transp. Syst. 2025, 26, 7587–7599. [Google Scholar] [CrossRef] [Scilit]
- Dinh, T.H.; Anh, V.T.T.; Nguyen, T.; Le, C.H.; Trung, N.L.; Duc, N.D.; Lin, C.T. Toward Vision-Based Concrete Crack Detection: Automatic Simulation of Real-World Cracks. IEEE Trans. Instrum. Meas. 2023, 72, 1–15. [Google Scholar] [CrossRef] [Scilit]
- Gu, Z.; Cheng, J.; Fu, H.; Zhou, K.; Hao, H.; Zhao, Y.; Zhang, T.; Gao, S.; Liu, J. CE-Net: Context Encoder Network for 2D Medical Image Segmentation. IEEE Trans. Med. Imaging 2019, 38, 2281–2292. [Google Scholar] [CrossRef] [Scilit] [PubMed]
- Shi, Z.; Wang, T.; Huang, Z.; Xie, F.; Liu, Z.; Wang, B.; Xu, J. MD-Net: A Multi-Scale Dense Network for Retinal Vessel Segmentation. Biomed. Signal Process. Control 2021, 70, 102977. [Google Scholar] [CrossRef] [Scilit]
- Yuan, Y.; Zhang, L.; Wang, L.; Huang, H. Multi-Level Attention Network for Retinal Vessel Segmentation. IEEE J. Biomed. Health Inform. 2022, 26, 312–323. [Google Scholar] [CrossRef] [Scilit] [PubMed]
- Philion, J. FastDraw: Addressing the Long Tail of Lane Detection by Adapting a Sequential Prediction Network. In Proceedings of the 2019 IEEE/CVF Conference on Computer Vision and Pattern Recognition (CVPR), Long Beach, CA, USA, 15–20 June 2019; pp. 11574–11583. [Google Scholar] [CrossRef] [Scilit]
- Ko, Y.; Lee, Y.; Azam, S.; Munir, F.; Jeon, M.; Pedrycz, W. Key Points Estimation and Point Instance Segmentation Approach for Lane Detection. IEEE Trans. Intell. Transp. Syst. 2022, 23, 8949–8958. [Google Scholar] [CrossRef] [Scilit]
- Chen, Y.; Wang, Z.; Peng, Y.; Zhang, Z.; Yu, G.; Sun, J. Cascaded Pyramid Network for Multi-Person Pose Estimation. In Proceedings of the 2018 IEEE/CVF Conference on Computer Vision and Pattern Recognition (CVPR), Salt Lake City, UT, USA, 18–23 June 2018; pp. 7103–7112. [Google Scholar] [CrossRef] [Scilit]
- Cao, Z.; Hidalgo, G.; Simon, T.; Wei, S.E.; Sheikh, Y. OpenPose: Realtime Multi-Person 2D Pose Estimation Using Part Affinity Fields. IEEE Trans. Pattern Anal. Mach. Intell. 2021, 43, 172–186. [Google Scholar] [CrossRef] [Scilit] [PubMed]
- Kreiss, S.; Bertoni, L.; Alahi, A. PifPaf: Composite Fields for Human Pose Estimation. In Proceedings of the 2019 IEEE/CVF Conference on Computer Vision and Pattern Recognition (CVPR), Long Beach, CA, USA, 15–20 June 2019; pp. 11969–11978. [Google Scholar] [CrossRef] [Scilit]
- Papandreou, G.; Zhu, T.; Chen, L.C.; Gidaris, S.; Tompson, J.; Murphy, K. PersonLab: Person Pose Estimation and Instance Segmentation with a Bottom-Up, Part-Based, Geometric Embedding Model. In Computer Vision—ECCV 2018; Lecture Notes in Computer Science; Ferrari, V., Hebert, M., Sminchisescu, C., Weiss, Y., Eds.; Springer International Publishing: Cham, Switzerland, 2018; Volume 11218, pp. 282–299. [Google Scholar] [CrossRef] [Scilit]
- Papandreou, G.; Zhu, T.; Kanazawa, N.; Toshev, A.; Tompson, J.; Bregler, C.; Murphy, K. Towards Accurate Multi-Person Pose Estimation in the Wild. In Proceedings of the 2017 IEEE Conference on Computer Vision and Pattern Recognition (CVPR), Honolulu, HI, USA, 21–26 July 2017; pp. 3711–3719. [Google Scholar] [CrossRef] [Scilit]
- Varamesh, A.; Tuytelaars, T. Mixture Dense Regression for Object Detection and Human Pose Estimation. In Proceedings of the 2020 IEEE/CVF Conference on Computer Vision and Pattern Recognition (CVPR), Seattle, WA, USA, 13–19 June 2020; pp. 13083–13092. [Google Scholar] [CrossRef] [Scilit]
- Moon, G.; Chang, J.Y.; Lee, K.M. Camera Distance-Aware Top-Down Approach for 3D Multi-Person Pose Estimation from a Single RGB Image. In Proceedings of the 2019 IEEE/CVF International Conference on Computer Vision (ICCV), Seoul, Republic of Korea, 27 October–2 November 2019; pp. 10132–10141. [Google Scholar] [CrossRef] [Scilit]
- Zhang, H.; Yang, W.; Yu, H.; Zhang, H.; Xia, G.S. Detecting Power Lines in UAV Images with Convolutional Features and Structured Constraints. Remote Sens. 2019, 11, 1342. [Google Scholar] [CrossRef] [Scilit]
- Wei, N.; Chen, J.; Sun, S. MiT-Unet: Mixed Transformer Unet for Transmission Line Segmentation in RAV Images. IEEE Trans. Power Deliv. 2025, 40, 1279–1288. [Google Scholar] [CrossRef] [Scilit]
- Ma, W.; Xiao, J.; Zhu, G.; Wang, J.; Zhang, D.; Fang, X.; Miao, Q. Transmission Tower and Power Line Detection Based on Improved Solov2. IEEE Trans. Instrum. Meas. 2024, 73, 1–11. [Google Scholar] [CrossRef] [Scilit]
- Abdelfattah, R.; Wang, X.; Wang, S. PLGAN: Generative Adversarial Networks for Power-Line Segmentation in Aerial Images. IEEE Trans. Image Process. 2023, 32, 6248–6259. [Google Scholar] [CrossRef] [Scilit] [PubMed]
- Li, X.; Xu, F.; Zhang, J.; Zhang, H.; Lyu, X.; Liu, F.; Gao, H.; Kaup, A. Frequency-Guided Denoising Network for Semantic Segmentation of Remote Sensing Images. IEEE Trans. Geosci. Remote Sens. 2026, 64, 1–17. [Google Scholar] [CrossRef] [Scilit]
- Wang, Y.; Wu, Y.; Zhang, Z.; Huang, Q.; Tang, B.; Yang, Z.; Zhang, K.; Zhang, L. Dual-Scale Transformer with Variable Bitrate Synchronization for Neural Video Compression. ACM Trans. Multimed. Comput. Commun. Appl. 2026, 22, 1–24. [Google Scholar] [CrossRef] [Scilit]
- Li, X.; Geng, Q.; Huang, Q.; Li, X.; Tang, J.; Ye, Q. Spatial–Temporal Self-Compensating Graph Convolutional Network for Skeleton-Based Action Recognition Under Data Constraints. IEEE Trans. Image Process. 2026, 35, 5818–5833. [Google Scholar] [CrossRef] [Scilit] [PubMed]
- Khan, M.; Alkilani, J.; Abusafia, W.; Ahmad, J.; Ullah, F.; Dilshad, N. ST-GCVA: Hierarchical Graph-Based Spatio-Temporal Reasoning for Robust Violence Detection. Intell. Syst. Appl. 2026, 31, 200676. [Google Scholar] [CrossRef] [Scilit]
- Ali, L.; Khan, M.; Ahmad, B.; Saqib, M.; Alnajjar, F.; Aljassmi, H. Self-Supervised Learning for Driver Distraction Detection: A Comparative Study with Traditional Supervised Models. Proc. AAAI Symp. Ser. 2026, 9, 351–359. [Google Scholar] [CrossRef]
- Dai, J.; Qi, H.; Xiong, Y.; Li, Y.; Zhang, G.; Hu, H.; Wei, Y. Deformable Convolutional Networks. In Proceedings of the 2017 IEEE International Conference on Computer Vision (ICCV), Venice, Italy, 22–29 October 2017; pp. 764–773. [Google Scholar] [CrossRef] [Scilit]
- Zhang, X.; Song, Y.; Song, T.; Yang, D.; Ye, Y.; Zhou, J.; Zhang, L. LDConv: Linear Deformable Convolution for Improving Convolutional Neural Networks. Image Vis. Comput. 2024, 149, 105190. [Google Scholar] [CrossRef] [Scilit]
- Abdelfattah, R.; Wang, X.; Wang, S. TTPLA: An Aerial-Image Dataset for Detection and Segmentation of Transmission Towers and Power Lines. In Proceedings of the Computer Vision—ACCV 2020; Springer: Cham, Switzerland, 2021; pp. 601–618. [Google Scholar] [CrossRef] [Scilit]
- Fu, J.; Liu, J.; Jiang, J.; Li, Y.; Bao, Y.; Lu, H. Scene Segmentation with Dual Relation-Aware Attention Network. IEEE Trans. Neural Netw. Learn. Syst. 2021, 32, 2547–2560. [Google Scholar] [CrossRef] [Scilit] [PubMed]
- Chen, J.; Mei, J.; Li, X.; Lu, Y.; Yu, Q.; Wei, Q.; Luo, X.; Xie, Y.; Adeli, E.; Wang, Y.; et al. TransUNet: Rethinking the U-Net Architecture Design for Medical Image Segmentation through the Lens of Transformers. Med. Image Anal. 2024, 97, 103280. [Google Scholar] [CrossRef] [Scilit] [PubMed]
- Yu, C.; Gao, C.; Wang, J.; Yu, G.; Shen, C.; Sang, N. BiSeNet V2: Bilateral Network with Guided Aggregation for Real-Time Semantic Segmentation. Int. J. Comput. Vis. 2021, 129, 3051–3068. [Google Scholar] [CrossRef] [Scilit]
- Zhong, J.; Tian, W.; Xie, Y.; Liu, Z.; Ou, J.; Tian, T.; Zhang, L. PMFSNet: Polarized Multi-Scale Feature Self-Attention Network for Lightweight Medical Image Segmentation. Comput. Methods Programs Biomed. 2025, 261, 108611. [Google Scholar] [CrossRef] [Scilit] [PubMed]
- Ruan, J.; Xie, M.; Gao, J.; Liu, T.; Fu, Y. EGE-UNet: An Efficient Group Enhanced UNet for Skin Lesion Segmentation. In Proceedings of the Medical Image Computing and Computer Assisted Intervention—MICCAI 2023; Springer: Cham, Switzerland, 2023; pp. 481–490. [Google Scholar] [CrossRef] [Scilit]
- Liu, Y.; Zhu, H.; Liu, M.; Yu, H.; Chen, Z.; Gao, J. Rolling-Unet: Revitalizing MLP’s Ability to Efficiently Extract Long-Distance Dependencies for Medical Image Segmentation. In Proceedings of the AAAI Conference on Artificial Intelligence; PKP Publishing Services: Burnaby, BC, Canada, 2024; Volume 38, pp. 3819–3827. [Google Scholar] [CrossRef] [Scilit]
- Wu, R.; Liu, Y.; Liang, P.; Chang, Q. H-vmunet: High-Order Vision Mamba UNet for Medical Image Segmentation. Neurocomputing 2025, 624, 129447. [Google Scholar] [CrossRef] [Scilit]
- Wu, R.; Liu, Y.; Ning, G.; Liang, P.; Chang, Q. UltraLight VM-UNet: Parallel Vision Mamba Significantly Reduces Parameters for Skin Lesion Segmentation. Patterns 2025, 6, 101298. [Google Scholar] [CrossRef] [Scilit] [PubMed]
- Zhou, Y.; Li, L.; Lu, L.; Xu, M. nnWNet: Rethinking the Use of Transformers in Biomedical Image Segmentation and Calling for a Unified Evaluation Benchmark. In Proceedings of the 2025 IEEE/CVF Conference on Computer Vision and Pattern Recognition (CVPR), Nashville, TN, USA, 10–17 June 2025; pp. 20852–20862. [Google Scholar] [CrossRef] [Scilit]

Disclaimer/Publisher’s Note: The statements, opinions and data contained in all publications are solely those of the individual author(s) and contributor(s) and not of MDPI and/or the editor(s). MDPI and/or the editor(s) disclaim responsibility for any injury to people or property resulting from any ideas, methods, instructions or products referred to in the content. |
© 2026 by the authors. Licensee MDPI, Basel, Switzerland. This article is an open access article distributed under the terms and conditions of the Creative Commons Attribution (CC BY) license.