


Highlights
What are the main findings?
- A dual-scale validation framework that integrates calibrated reference targets for point-scale accuracy assessment with airborne hyperspectral measurements for field-scale characterization to quantify site-level UAS sensor biases and provide a traceable framework for radiometric accuracy assessment.
- Reflectance biases propagated into NDVI estimates, producing systematically lower NDVI values from both UAS sensors; however, the strong spatial agreement with hyperspectral reference data demonstrates that multispectral UAS sensors can support ecological applications when coupled with robust radiometric calibration.
What is the implication of the main finding?
- Calibration methods and sensor-specific limitations must be carefully considered when using UAS multispectral data for ecological and agricultural monitoring.
- The study demonstrates a scalable framework for validating UAS multispectral data against hyperspectral measurements, enabling improved cross-platform integration and confidence in ecological remote sensing applications.
Abstract
This study evaluates the accuracy and usability of two low-cost uncrewed aerial system (UAS) multispectral sensors—MicaSense RedEdge-M and SlantRange 3p—using a dual-scale comparison framework. Calibrated 3% and 48% reflectance tarps and Analytical Spectral Device (ASD) field spectrometry were used for point-scale absolute validation. The NEON imaging spectrometer (NIS), a well-calibrated airborne hyperspectral sensor, was utilized for a field-scale comparison by spectrally resampling the hyperspectral data to align with the multispectral bands and performing spatial co-registration and aggregation of the multispectral data to a common 1 m grid. Over the 48% tarp, MicaSense Near-infrared (NIR) reflectance was 7.2% below the ASD reference while SlantRange NIR was 7.9% lower, validating previous studies that have observed the underestimation of the NIR band with UAS multispectral sensors. Both sensors overestimated the 3% tarp across all bands when compared to the ASD measurements. Field-scale regressions yielded R2 values above 0.90 for most bands, while NIR slopes were 0.74 for MicaSense and 0.72 for SlantRange. Consistent with these trends, the largest radiometric errors occurred in the NIR region, where both sensors increasingly underestimated high-reflectance surfaces relative to NIS. Median Normalized Difference Vegetation Index (NDVI) differences relative to NIS were −0.027 and −0.064, and these became more negative with an increasing NIS NDVI. Edge buffering reduced MicaSense bias, whereas the SlantRange showed limited edge effects. These results demonstrate that low-cost UAS multispectral imagery can support ecological applications when calibration, reflectance range, view geometry, and ecosystem-specific validation requirements are explicitly considered.
1. Introduction
Lightweight imaging sensors paired with Uncrewed Aerial Vehicles (UAVs) have become ubiquitous research tools for Earth observation over the last 20 years [1]. Coupling UAVs with lightweight remote sensing instruments—collectively termed Uncrewed Aerial Systems (UASs)—provides a low-cost and effective solution to collect imagery of landscapes that would otherwise be cost prohibitive with satellite or crewed aircraft platforms [2]. Due to the compact size and portability of low-cost UASs, surveys benefit from flexibility in mission timing and location. However, UASs suffer from constraints on flight altitude and payload endurance. Within the United States, modern UASs are required to operate with a low altitude acquisition height (<400 feet above ground level) due to FAA constraints. UAV platforms also typically have limited payload endurance, which is dependent on the type of platform, power source and payload capacity. The height and endurance limitations constrain surveys to a small geographic extent (~1 km2 per flight), and result in images with high spatial resolutions. UASs have normalized the capture of EO (Earth Observing) images at extremely high spatial resolutions, often achieving sub-decimeter or centimeter ground sampling distances (GSDs).
The high spatial and temporal resolution provide landscape characteristics, such as plant health and crop characteristics, at previously unavailable observational scales. Fine-scale spatial patterns that may have been previously indiscernible using lower resolution imaging typical of sensors mounted on crewed aircraft and satellite platforms [3] are often revealed. In this capacity, UASs offer landscape ecologists a timely, cost-effective means of monitoring environmental phenomena at ecologically meaningful spatiotemporal resolutions, providing a powerful tool for ecological scaling studies [4]. UASs equipped with multispectral sensors have supported a multitude of agricultural applications, including the mitigation of disease spread in rice fields [5], yield monitoring of fertilized peas and oats [6], high-resolution assessment of vine health in viticulture [7], and monitoring of nitrogen status in wheat to optimize fertilization practices [8,9]. However, ecological applications are being increasingly addressed as well, such as identifying sensitivities to environmental change in Antarctic moss beds [10] and the precise and frequent mapping of rangeland characteristics [3]. Collectively, these studies and others underscore the value of UASs and offer a promising path forward for fine-scale localized environmental monitoring efforts. Large-scale ecological networks, such as the National Ecological Observatory Network (NEON), may be particularly well suited to incorporate UASs due to the need for taking repeated measurements across numerous large and dispersed research sites.
Imaging sensors typically mounted on UASs are commonly constrained by payload capacity, cost, flight endurance, and accident risk, creating design trade-offs in optics, detectors, radiometric resolution, and calibration. UAS sensor performance can be influenced by several factors, including band-specific spectral response differences, detector sensitivity and noise, radiometric calibration drift, bidirectional reflectance distribution function (BRDF) effects, internal stray light, and limitations in downwelling light sensor (DLS) cosine response corrections. These factors can lead to measurement bias, even when following manufacturer recommendations. While many studies have provided valuable insights into the implementation of lightweight and low-cost UAS sensors in agriculture and ecological research [2,3,4,5,6,7,8,9,10,11], quantitative assessments of the spectral accuracy against traceable standards remain limited. Matese et al. [11] compared Normalized Difference Vegetation Index (NDVI) values from a crewed aircraft sensor (ASPIS) and UAS sensor (Tetracam ADC Lite) across Italian vineyards, representing an early field-scale intercomparison, albeit one without absolute radiometric validation against traceable standards or per-band validation. Berni et al. [12] demonstrated broad-area coverage with rigorously calibrated sensors, but they did not include independent in situ validation measurements. More recently, Shrestha et al. [13] performed rigorous radiometric calibration and reflectance accuracy assessment for a Headwall Nano-Hyperspec and MicaSense RedEdge-MX system using in situ calibration targets. However, their validation was limited to point-scale targets; a planned broad-area validation against high resolution satellite imagery was precluded by weather. Fawcett et al. [14] demonstrated the value of combining reference panels and airborne hyperspectral imagery to evaluate the radiometric performance of a single multispectral UAS sensor with a focus on agriculture, though the data were not corrected for changes in irradiance, and only a single multispectral camera was used. This is the only previous study found in our literature review to perform simultaneous point-scale absolute radiometric validation with field spectrometry and field-scale sensor characterization using a hyperspectral airborne reference.
The limited studies that combine traceable field measurements with a hyperspectral reference over the complete UAS acquisition area was the motivation for this validation study. The objective of this study was to develop a dual-scale framework to: (1) assess absolute radiometric accuracy with calibrated targets and field spectrometry; (2) characterize field-scale, band-specific sensor behavior using a traceably calibrated airborne imaging spectrometer; (3) evaluate the propagation of band bias into a commonly used vegetation index to highlight implications for use cases; and (4) identify operational calibration and flight-planning implications. The remainder of this manuscript is organized as follows. Section 2 describes the study site, sensor acquisitions, calibration procedures, spectral and spatial resampling, and analytical derivations. Section 3 presents the target- and field-scale reflectance results and vegetation index analyses. Section 4 discusses the physical mechanisms, calibration limitations, image edge effects, operational implications, and generalizability. Section 5 summarizes the findings, limitations, and future validation priorities for UAS sensors.
2. Materials and Methods
2.1. Study Site
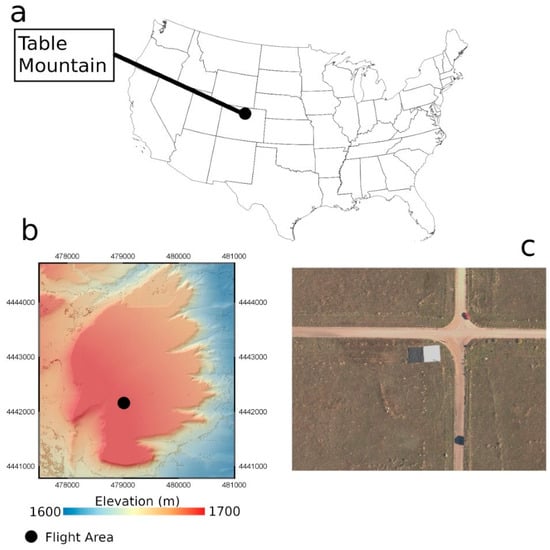
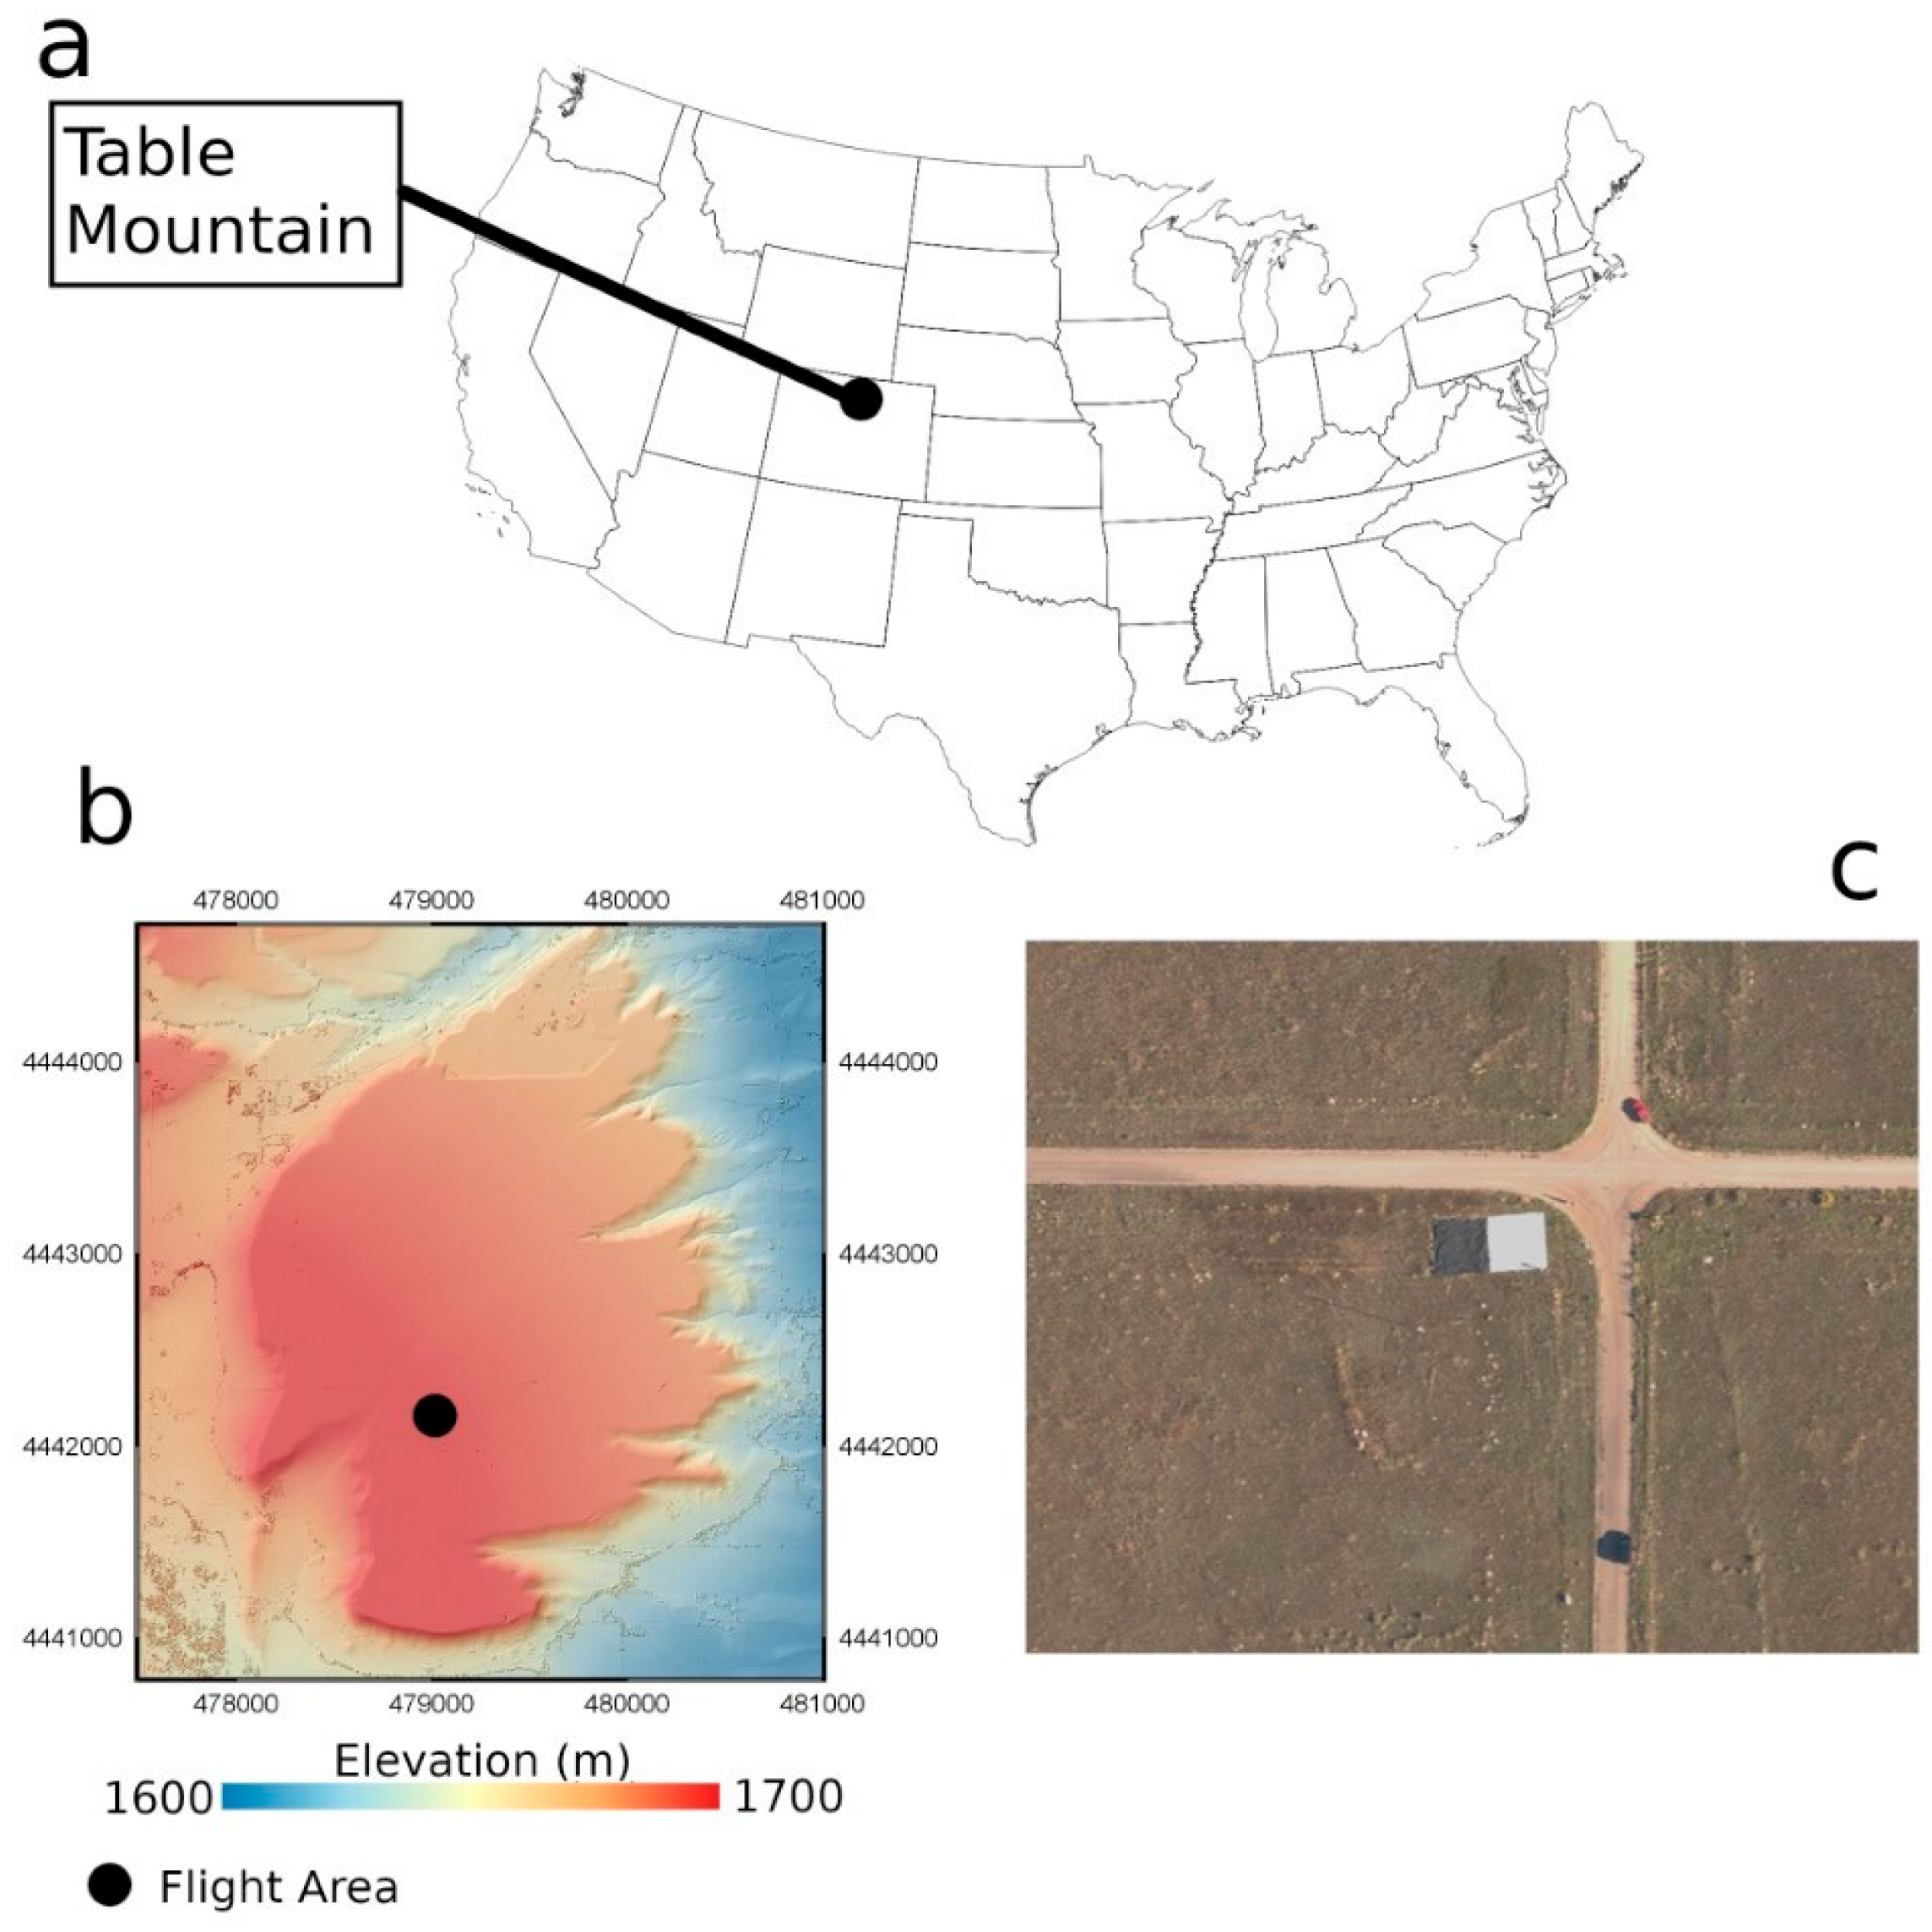
Data collections were conducted at Table Mountain, north of Boulder, CO, USA (Figure 1). Table Mountain is used for annual NEON Airborne Observation Platform (AOP) calibration flights, and the UAS data collection was conducted coincidentally with an annual operational NEON AOP calibration flight. In addition to its proximity to NEON’s headquarters (Boulder, CO, USA), Table Mountain offers three advantages as a study site for conducting the proposed comparison between the UAS-mounted sensors and the NEON AOP: (1) the vegetated portion of the landscape is homogeneous, which minimizes the uncertainty in comparisons due to slight spatial mismatches between the UAS and AOP data; (2) it is relatively flat, which reduces uncertainty in reflectance retrievals due to topographic variation; and (3) it houses a permanently mounted aerosol monitoring sensor (part of AERONET, https://aeronet.gsfc.nasa.gov/ (accessed on 24 April 2018)), which allows for the accurate characterization of aerosol optical depth at the time of data acquisition, improving reflectance retrieval accuracy of the imaging spectrometer. The Table Mountain data collection area included two intersecting gravel roads, vegetation, and deployed reference tarps.
Figure 1.
(a) Location of the Table Mountain study site, (b) topography of the Table Mountain study site, and (c) image showing the flight area at Table Mountain.
2.2. Data Collection
2.2.1. Reference Tarps with Field Spectral Measurements
Two reference tarps, manufactured by Group 8 Technologies (https://www.group8tech.com/ (accessed on 26 June 2022)), were placed within the flight area observed by the NEON AOP and the UAS. The tarps were 10 m by 10 m in size and coated with a specialized material that has a well-known spectral response in the visible through to short-wave infrared (SWIR) portion of the electromagnetic spectrum. The two reference tarps represent end-member reflectance targets, with one tarp reflecting ~48% of incoming energy and the other reflecting ~3% across all wavelengths of interest. The tarps are hereafter referred to as the ‘bright’ and ‘dark’ reference tarps.
Although the tarps are designed to have specific reflectance values across all wavelengths, the reflectance can vary slightly from the design value. Given the intention to assess the absolute spectral accuracy of the UAS-mounted sensors, the tarps were also observed with an Analytical Spectral Device (ASD) field spectrometer during the airborne acquisitions to ensure spectral accuracy. The ASD provides highly accurate measurements of spectral reflectance at 1 nm intervals, which serves a basis for comparing the UAS-mounted sensors to a known reflectance target, as well as verifying the spectral accuracy of the imaging spectrometer to ensure its suitability as a validation source. Directly before and after ASD measurements were acquired over each reference tarp, the ASD also observed a calibrated Spectralon panel, which is used as a white reference to calibrate the ASD measurements.
2.2.2. National Ecological Observatory Network Airborne Observation Platform
The NEON imaging spectrometer (NIS) was developed at the Jet Propulsion Laboratory (JPL) and is a next-generation AVIRIS (Airborne Visible/Infrared Imaging Spectrometer) instrument. The NIS collects data in 428 spectral bands covering 380 to 2510 nm. Band centers are separated by ~5 nm [15], and the spectral response for individual bands is up to ~6 nm. The NIS operates in a push-broom configuration with a cross-track field of view (FOV) of ~36° and an instantaneous field of view (IFOV) of 1 mRad. The NIS undergoes an annual rigorous calibration process to ensure spectral and radiometric fidelity of the instrument.
The NEON AOP’s Table Mountain flight plan included three flight lines, which were flown in a south–north, east–west, and north–south orientation, all at an altitude of 1000 m. The flight-line placement captured the calibration tarps and the area observed by the UAS at the center of each NIS flight line. At a 1000 m altitude, the total flight-line width is 628 m and with an IFOV of 1 mRAD the individual sensing elements of the spectrometer focal plane array will observe an area of ~1 m2. The NIS observes lines at 100 Hz and the aircraft traveled at ~50 m/s, which allows for an oversampling of the terrain, as a single line of observations was collected approximately every 0.5 m. The NEON AOP features a positioning and orientation system that includes a high-accuracy GPS and inertial measurement unit allowing for highly accurate aircraft positioning throughout the survey. Annual calibration flights determine the boresight angles of the imaging spectrometer, and coupled with the high accuracy positioning, it can achieve a spatial accuracy of less than 1 m at the normal flying altitude of 1000 m.
2.2.3. Uncrewed Aerial System
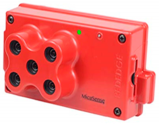
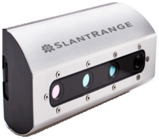
The UAS mission captured images using two multispectral sensors, namely the MicaSense RedEdge-M (MicaSense Inc., Seattle, WA, USA) and the SlantRange 3p (SlantRange Inc., San Diego, CA, USA), which was temporally coincident with an acquisition by the NEON AOP. The multispectral sensors capture images over the visible-to-near-infrared (NIR) spectral range, with the RedEdge-M being a 5-channel sensor and the SlantRange a 4-channel sensor (Table 1). Table 1 provides the center wavelength and approximate width of the spectral response function for each band; however, precise spectral response functions for each multispectral band were provided by the manufacturers. Each multispectral sensor is accompanied by a downwelling light sensor (DLS) and a GPS antenna and receiver. Both the MicaSense and SlantRange use the DLS to correct reflectance for ambient light changes.
Table 1.
Multispectral sensor specification information.
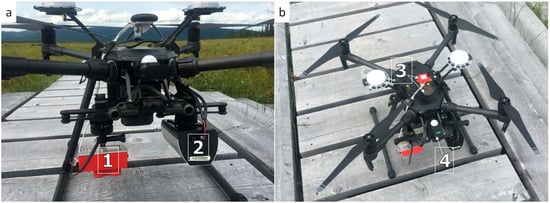
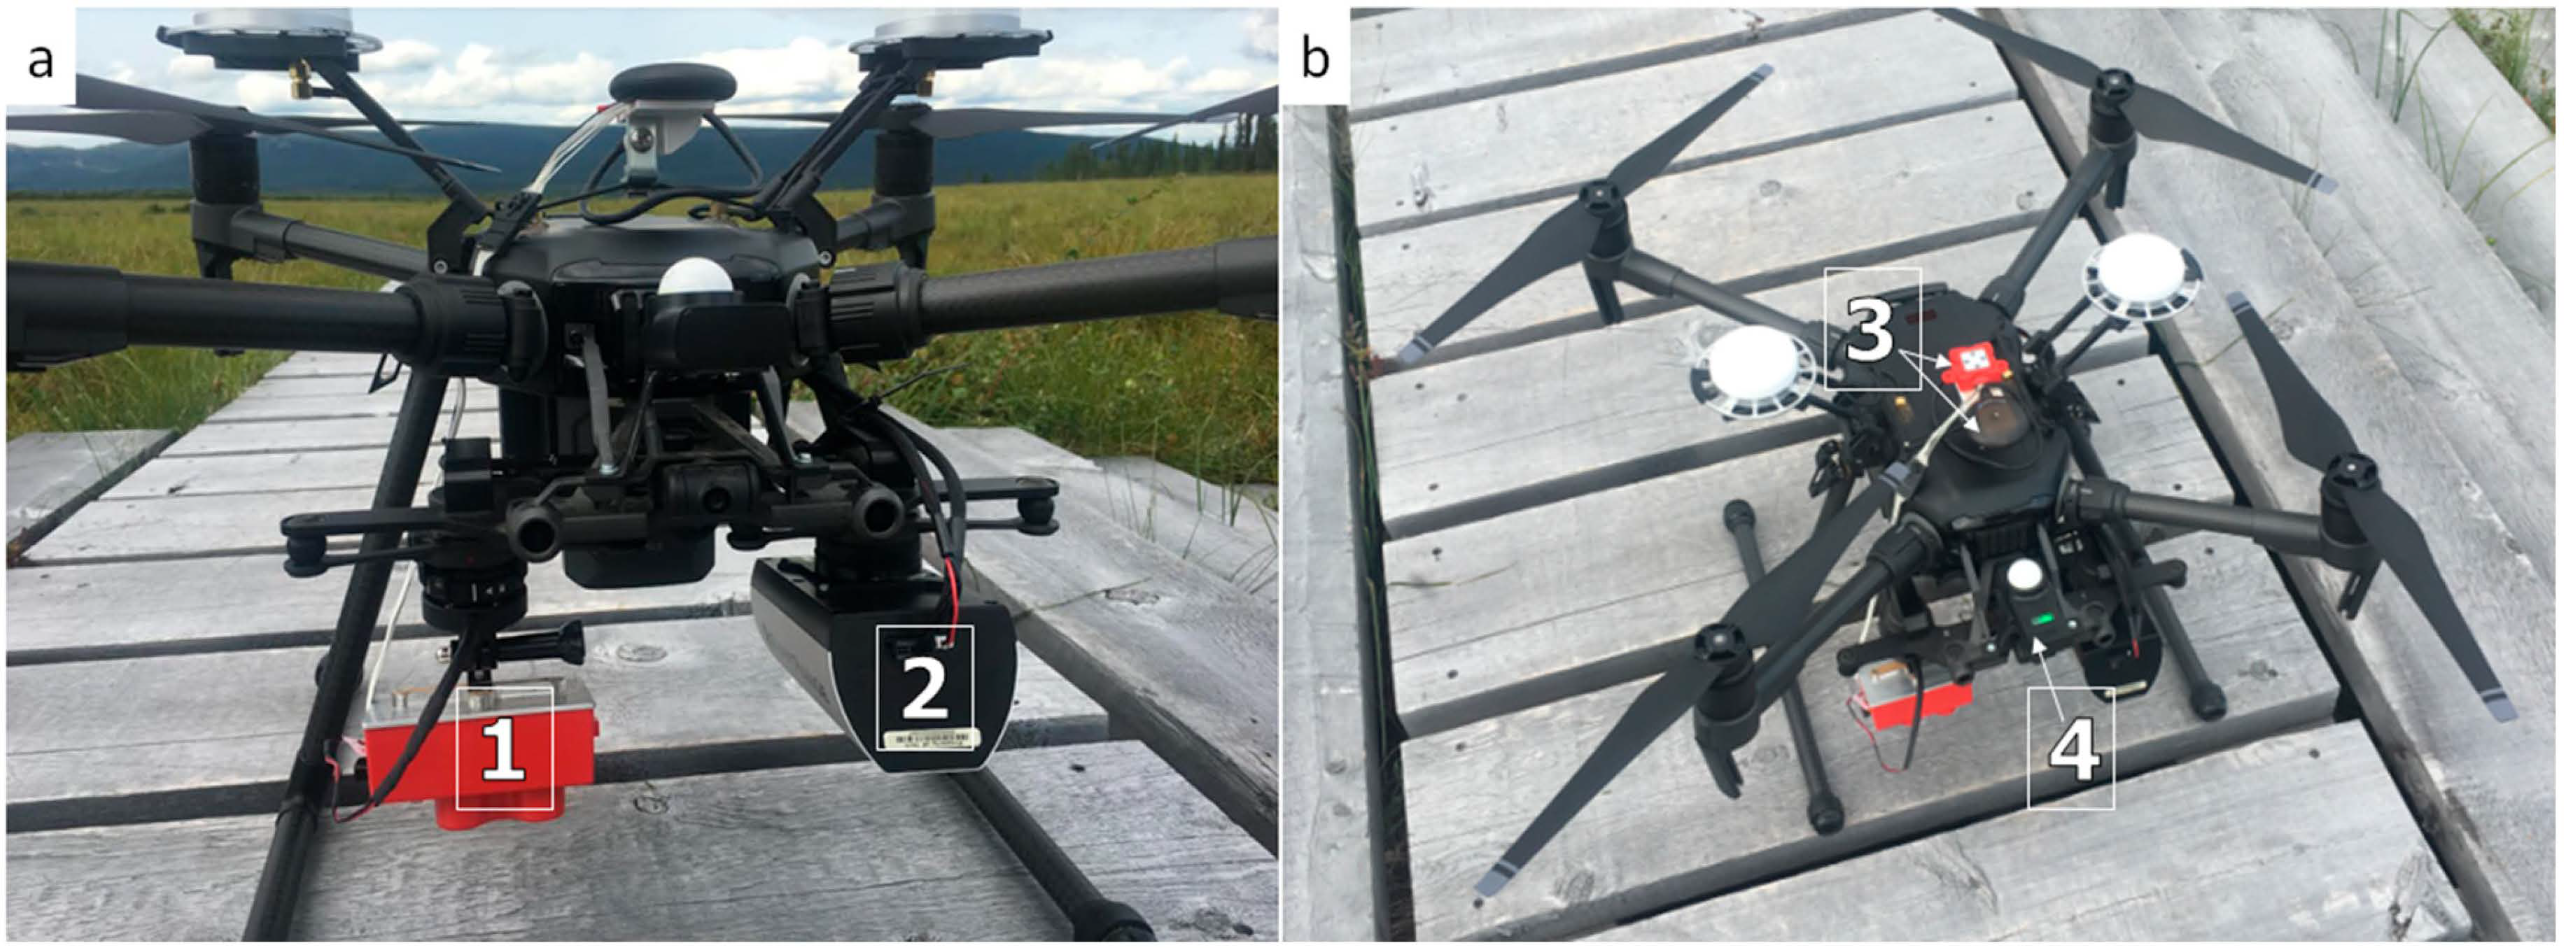
The sensors were mounted on a DJI Matrice 210 (hereafter referred to as ‘M210’ for the remainder of the manuscript; DJI Inc., Shenzhen, China). The M210 is a VTOL (vertical takeoff and landing) quadcopter, powered by two 22.8 V rechargeable batteries, and is equipped with two downward-facing gimbals and one upward-facing gimbal. Each camera was independently secured to the downward-facing gimbals of the M210 at an ~8° offset from nadir (Figure 2a). Gimbals ensure the camera remains stabilized while the UAS maneuvers during flight. The DLS and GPS units of the MicaSense sensor were secured to the upward-facing gimbal of the M210, whereas the DLS and GPS of the SlantRange—a single piece of equipment—was attached to the bar of the M210’s field-of-view camera (Figure 2b). Prior to flight, all manufacturer-recommended sensor-specific calibrations were performed, and the SlantRange was factory calibrated before being shipped.
Figure 2.
(a) Front view of the M210, with the MicaSense RedEdge-M (1) and the SlantRange 3p (2) attached to the right and left downward-facing gimbals, respectively; (b) bird’s-eye view of the M210, showing the MicaSense DLS and GPS (3) and SlantRange DLS/GPS components (4).
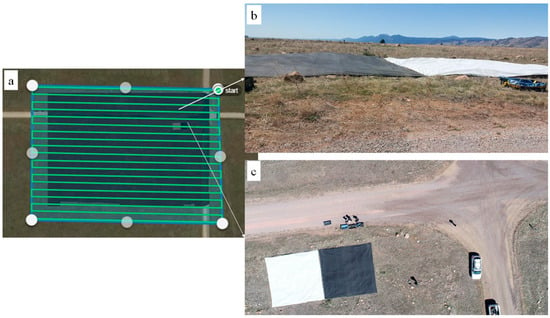
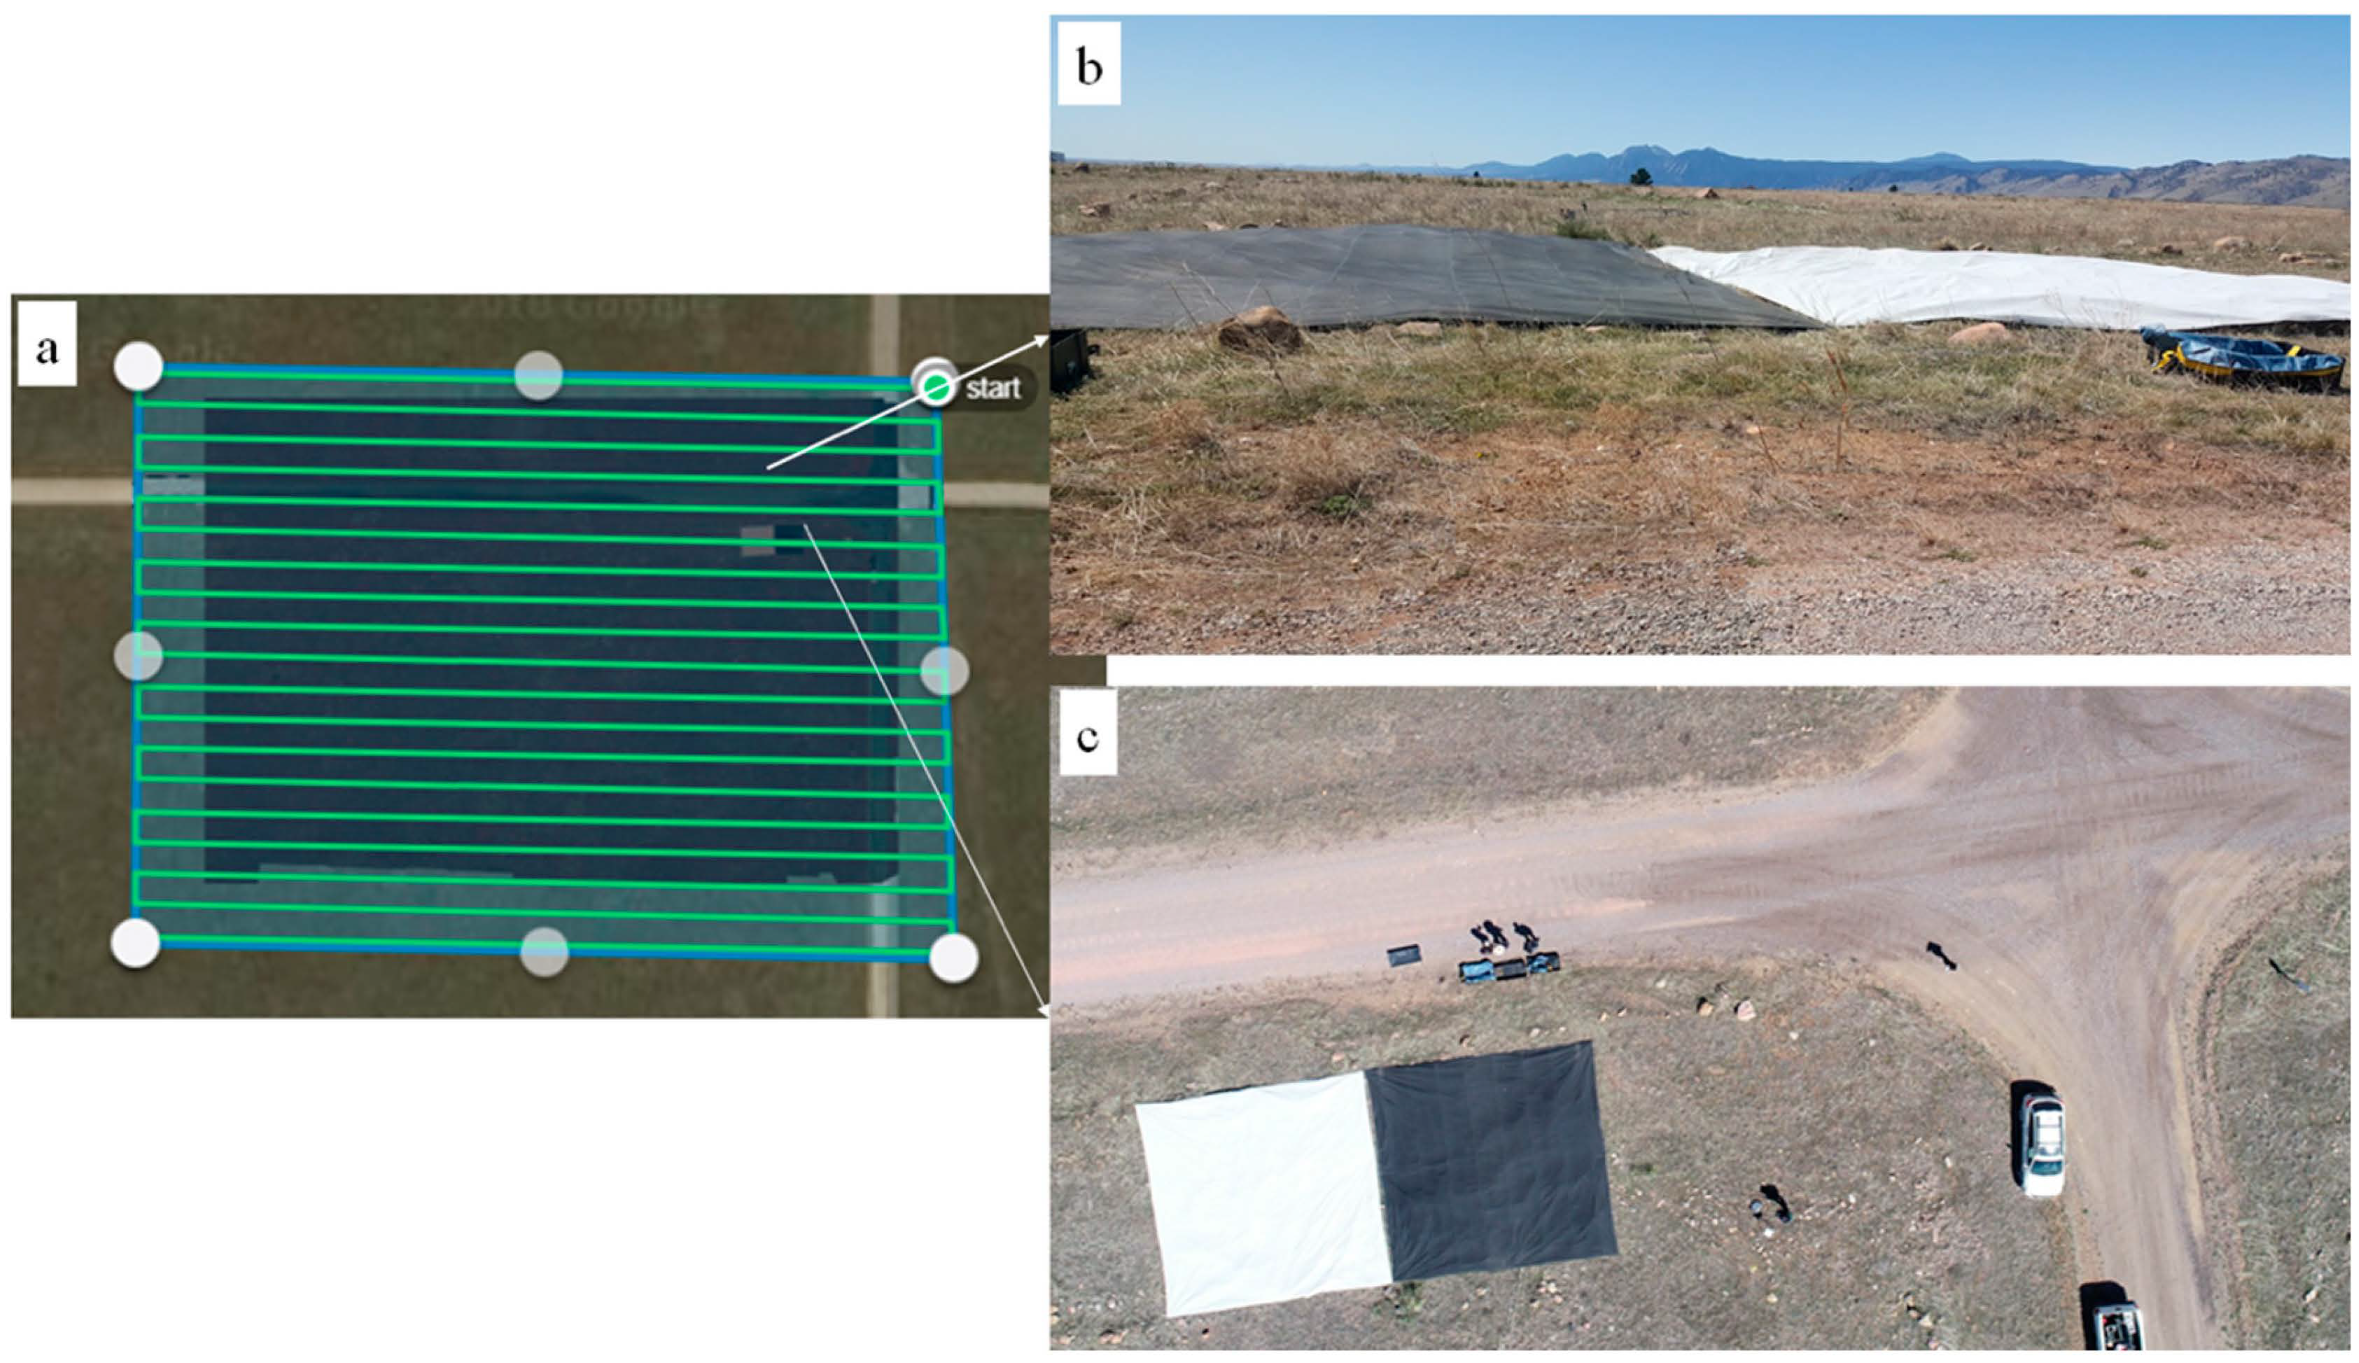
Flight planning was conducted using Drone Deploy, a UAS flight-planning and auto-pilot software (Drone Deploy, San Francisco, CA, USA). The flight area is depicted in Figure 3a, and the speed and flight altitude were set at 6 m/s and 62 m above ground level (AGL), respectively. The image overlap settings of the SlantRange 3p are provided as ‘sidelap’ (cross-track overlap) and ‘frontlap’ (along-track overlap), both set to 75%. This is the minimum recommended overlap of the MicaSense sensor [16]. The MicaSense flight-planning application was used to determine the appropriate image capture rate (>1.72 s) for the desired overlap and flight altitude settings. The MicaSense sensor was then calibrated by positioning the UAS above the MicaSense Calibration Reflectance Panel (CRP), capturing two calibration images of the panel. This approach follows recommendations from MicaSense for flying in clear-sky conditions, which notes to use the CRP for post-processing calibrations rather than relying solely on the DLS corrections [16]. The flight path of the UAS was programmed to perform a ‘lawnmower pattern’, consisting of parallel east–west lines within the flight area (Figure 3a).
Figure 3.
(a) Screenshot of the Drone Deploy software showing the UAV flight area with east–west flight pattern (the tarps are slightly visible here). (b) Looking south–southwest over the flight area; sunny conditions and good visibility persisted during the flight campaign. (c) Bird’s-eye view of the northeast quadrant of the flight area; photo was taken by a DJI Phantom 4 (DJI Inc, DJI Inc., Shenzhen, China) prior to the flight campaign.
Best practices dictate that flights should be conducted within ±2 h of local solar noon to mitigate solar angle variation [18]. Our UAS flight began at 11:56:58 (MST) and overlapped with solar noon (11:58:52 MST; see [19]). The 12 min flight ended at 12:09:10 (MST) and was accompanied by light winds and sunny conditions (0% cloud cover), with visibility > 10 miles (see Figure 3b,c). The entire flight was auto-piloted by the Drone Deploy software, and minimal manual flying was utilized except when realigning the UAS with the launch pad prior to landing. During the UAS acquisition (11:56:58–12:09:10 MST), the solar zenith angle ranged from 30.5° to 31.7°. The AERONET aerosol optical thickness at 500 nm was 0.085, with an Ångström exponent of 1.01. Equation (1) yielded an AOT at 550 nm of 0.075–0.080, corresponding to Equation (2) with a visibility of approximately 47 km. These values indicate low aerosol loading and high solar elevation during the coordinated acquisitions.
2.3. Data Processing
2.3.1. National Ecological Observatory Network Imaging Spectrometer (NIS)
The NIS laboratory determined calibration parameters were used to transition raw observations to at-sensor radiance. The details of the application of calibration parameters to raw data to produce at-sensor radiance can be found in Gallery and Leisso, 2014 [20]. After determination of at-sensor radiance, each pixel is rigorously geo-referenced using a ray-tracing algorithm outlined in Kampe et al., 2016 [21], which intersects the observation vector with the high-accuracy terrain model derived from an airborne lidar survey. The NEON AOP is prohibited from operating their lidar sensor over Table Mountain, so a publicly available lidar acquisition was used [22]. After ray-tracing, pixels are geo-located in a pseudo-random pattern that is dependent on flight conditions. To re-locate pixels to an even one-meter grid, a nearest neighbor resampling routine was employed.
At-sensor radiance is transitioned to surface reflectance using the ATCOR (Atmospheric and Topographic Correction) 4 commercial software package developed by ReSe Applications (https://www.rese-apps.com/ (accessed on 26 June 2022)). Details of the atmospheric correction algorithms can be found in Richter and Schläpfer, 2018 [23]. Although several parameters required for surface reflectance retrievals can be fine-tuned prior to executing ATCOR, experience has shown that results are primarily sensitive to the ‘visibility’ parameter, which is related to the aerosol optical thickness (AOT). ATCOR can provide an estimate of this parameter based on information determined from dark, dense vegetation in the scene (see Richter and Schläpfer, 2018 [23]). However, at the time of flight, very little dark, dense vegetation was available at the Table Mountain site, which would inhibit a reliable numerical estimate of the visibility parameter. A more accurate determination of the visibility parameter can be obtained through direct measurement using a sun photometer. For the time of acquisition, sun photometer measurements from Table Mountain are available through AERONET (https://aeronet.gsfc.nasa.gov/ (accessed on 24 April 2018)). ATCOR requires visibility to be calculated from AOT at 550 nm; however, AERONET does not provide AOT at 550 nm. Therefore, AOT at 550 nm was calculated as:
where AC is the Angstrom coefficient (also provided by AERONET) and is the AOT at 500 nm. Following Wilson et al., 2015 [24], the visibility at 550 nm was calculated as:
Parameters supplied to ATCOR included visibility, a flag to turn on topographic correction, a flag to apply an adjacency correction, the limit of the adjacency correction (which was set to 10 m), a flag to correct for changes in the solar zenith angle, and the scene class, which was set to ‘rural’. Output surface reflectance was produced at the input spectral resolution of 5 nm and the input spatial resolution of 1 m.
The spectral resolution of the multispectral UAS sensors is coarse compared to that of the NIS. To allow a direct comparison between the MicaSense and SlantRange sensors and the NIS, the NIS surface reflectance was spectrally resampled to the system’s spectral response curves for the corresponding multispectral sensors’ bands. Both the manufacturers of the SlantRange and MicaSense provided the spectral response curves for each band of the sensors, though we note that the provided curves were generalized curves associated with the sensor product line and were not specific to a unique sensor. A spectral convolution was applied to the NIS data to produce new bands that corresponded to the spectral response for each band of the MicaSense and SlantRange sensors. The resampled NIS bands, based on the spectral response of the UAS sensors, were calculated as:
where is the result of the NIS data resampled to the UAS band; is the observed value of reflectance from the NIS at band , and the integration occurred across all measured NIS bands from to ; and is the convolution operator for band j of the UAS sensor with band k of the NIS, which can be defined as:
where is the value for the spectral response function for the NIS at wavelength , and is the spectral response function for the UAS sensor. To numerically determine values of , an interval () of 1 nm was used and integrated across all wavelengths.
2.3.2. Analytical Spectral Device Field Spectrometer
Data collected with the ASD field spectrometer were transitioned from raw measurements to reflectance using in-house NEON algorithms. Comparisons of the NIS resampled data, as well as data from the SlantRange and MicaSense sensors, with the field spectrometer measurements required a spectral resampling from the 1 nm field spectrometer reflectance curves to the spectral response of each band of the SlantRange and MicaSense sensors. Since ASD band-level spectral response functions were unavailable, each 1 nm ASD sample was treated as uniformly distributed within its sampling interval. The ASD resolution is substantially narrower than the 20–40 nm UAS bandwidths; therefore, the uncertainty introduced with the assumed 1 nm ASD response will be negligible given the multispectral bandwidth. This simplifies the spectral resampling calculations as:
where is the wavelength, is the value of the spectral response function of the UAS sensor for a particular band at a given wavelength, is the observed reflectance from the ASD at a given wavelength, and is a simulation of what the ASD would have observed for a particular band of the UAS sensor. These calculations were performed at a 1 nm interval to match the precision of the ASD observations. Since the spectral resolution of the field spectrometer was much finer (1 nm) than the MicaSense and SlantRange sensors, we do not believe that simplifying the resampling relationship by assuming a uniform distribution of spectral response functions of the ASD has a significant effect on the final reflectance values of .
2.3.3. SlantRange
Raw data files from the SlantRange sensor were pre-processed using the proprietary Slantview software (SlantRange Inc., San Diego, CA, USA) to convert raw images into reflectance and perform image calibration and alignment. Orthomosaic images were made using the DroneDeploy software (https://www.dronedeploy.com (version 2.0.51—accessed on 24 April 2018)), a cloud-based image processing software application. Because the DroneDeploy software is limited to images of three bands or less, SlantRange orthomosaics were generated over two executions of the DroneDeploy software. In the first execution, the green, red, and LIR (Leading Infrared) bands were processed, and the green, red, and NIR bands were processed in the second execution. This routine resulted in two final orthomosaics for comparison with the NIS; however, the green and red bands were redundant and required access from only one of the orthomosaic images. The final SlantRange reflectance values were scaled between 0 and 255 to maintain the maximum amount of radiometric resolution in an 8-bit image. All SlantRange reflectance values were normalized by dividing by 255 prior to comparison with reflectance traps or the NIS.
2.3.4. MicaSense
The raw data files output by the MicaSense RedEdge-M multispectral sensor are in GeoTIFF format; however, the individual bands are provided as individual TIFF files. This results in 5 total TIFF files per capture. Images were processed using Agisoft Metashape Pro (Agisoft LLC, St. Petersburg, Russia; version 1.9.x (accessed on 12 September 2024)). The data were processed following instructions provided by Agisoft that were specific to MicaSense RedEdge cameras. The photos were ingested to Metashape along with the two calibration images and the reflectance panel calibration coefficients. The photos were then geo-referenced and the individual band cameras optimized using an Agisoft Metashape Pro built-in functionality that identifies ‘tie points’ between images to create a model surface for aligning photos. Subsequently, the calibrated and aligned images were used to build an orthomosaic image. The resulting orthomosaic was output as a signed 16-bit GeoTIFF with normalized reflectance values by dividing each band by 32,768, which is the maximum scale factor for a signed 16-bit integer.
2.3.5. Spatial Resampling
The spatial resolutions of the multispectral sensors are dependent upon the flight altitude specified during mission planning. The specified ground sampling distance (GSD) at a 62 m flight altitude is 2.48 cm for the SlantRange and 4.31 cm for the MicaSense. Comparatively, the NIS provides post-processed data at a 1 m resolution. To compare the output of these remote sensing platforms, the UAS multispectral sensor data were resampled at a 1 m resolution to match the NIS data. The resampling involved defining the extent to crop out aligned areas of the UAS and NIS mosaics, ensuring that multispectral data were aggregated over the same 1 m areas sampled by the NIS. For each 1 m NIS pixel, all pixels from the higher resolution UAS acquisitions whose centers were located within the NIS pixel were included in the average. Given the pixel sizes in the UAS images were not perfectly divisible within the 1 m NIS pixel, this could result in some pixels from the UAS acquisitions with a partial overlap in adjacent NIS pixels; however, this artifact is believed to have negligible influence on the final mean given the much smaller size of the UAS pixels.
A small spatial mismatch was observed between the NIS data and the UAS data. Visual inspection of the mismatch revealed it consisted of only a translational component since its rotational and scale components were negligible. An iterative approach was employed to solve the spatial mismatch by shifting the UAS mosaics in 0.05 m intervals between −1 and 1 m, in both the northing and easting components. The shift associated with the minimum mean difference between the UAS and NIS mosaics was determined and inspected visually to ensure the images were aligned. This resulted in a shift of 0.45 m west and 0.4 m south for the MicaSense mosaic comparisons, and 0.1 m east and 0.5 m west for the SlantRange comparisons.
2.3.6. Reflectance Comparison
To assess the accuracy of the UAS sensors, we compared the MicaSense and SlantRange sensor results to the ASD field spectral measurements. The comparisons to the ASD measurements provided a spatially localized and high-fidelity accuracy verification. The ASD measurements were also compared to the NIS to validate the accuracy of the NIS and provide confidence in the comparisons between the NIS and UAS sensors made across the extent of the entire UAS acquisition. Due to the spectral and spatial resampling procedures, direct comparisons were made between spatially overlapping pixels in the NIS and UAS data. Four dominant validation features, assumed to spectrally homogeneous, were identified in the acquisition for comparison: (1) the 48% reflectance (bright) tarp; (2) the 3% reflectance (dark) tarp; (3) a vegetation patch; and (4) a section of gravel road. Sample areas from each feature that had minimal natural variation were identified visually and then compared through a two-tailed unpaired two-sample t-test (TSTT) with unequal variances. These t-tests have a null hypothesis (Ho) of equal mean, and an alternative hypothesis (H1) of unequal means. The t statistic was calculated at 95% confidence (alpha = 0.05). In addition to the localized comparisons of homogeneous features, the entire spatially resampled map generated by the UAS sensors was subtracted from the spectrally resampled map from the NIS. The difference maps were visually assessed for anomalies, and a large rectangular section south and west from the gravel roads was extracted to generate linear regressions between the NIS and UAS data. This area was selected to avoid the tarps and other equipment (e.g., truck, loading boxes) stationed in the scene, as well as because it was largely homogeneous, which would eliminate any residual spatial mismatch in the data due to the nearest neighbor resampling of the NIS data. The selected area also avoided edge effects that were apparent in the MicaSense data and will be discussed in the Results Section. A best fit line was determined from the plots of the UAS and NIS data, which should fall on a 1:1 line if they are perfectly correlated. The slope, intercept, R2, and standard deviation are provided for the regressions. A p-value that represents whether the regression line is statistically different from the ideal 1:1 line with an intercept at zero was also calculated but not reported, as no results were statistically significant.
To demonstrate the compatibility of the NIS resampled bands and the multispectral sensors in a practical context, the NDVI was also compared across the entire mapped area. NDVI was not assessed at the localized validation points, as it is a vegetation-specific index and not meaningful on non-vegetated surfaces, such as the validation tarps. NDVI was selected as an additional proxy because of its ubiquity as a tool for assessing vegetation greenness as a proxy for plant health, as well as for its usage in precision agriculture, which is a common application for drone-based multispectral sensors. Additionally, due to its incorporation of only the red and NIR bands, it was possible to calculate NDVI using both the MicaSense and SlantRange sensors as:
where is the value for the NIR band, the fifth band on the MicaSense sensor, and the fourth band on the SlantRange sensor; and is the red band, the third band on the MicaSense sensor, and the second on the SlantRange sensor.
3. Results
3.1. Comparison of UAS and NIS Images with Validation Targets
3.1.1. MicaSense
The average deviations between the ASD measurements and each NIS MicaSense resampled bands for all lines over the bright reflectance tarp were −2.62%, −0.9%, −1.0%, −0.09%, and 0.61% for the blue (band 1), green (band 2), red (band 3), LIR (band 4), and NIR (band 5) bands, respectively. The NIS observations differed from the ASD measurements by as much as −3.15% for the resampled blue band on NIS Line 1 over the bright reflectance tarp (Table 2). Results over the dark reflectance tarp showed a maximum deviation of −1.29%, which were observed in the blue band of NIS Line 3. The average deviations for all bands across the three lines over the 3% reflectance tarp were −1.1%, −0.89%, −0.8%, −0.75%, and −0.70%. The blue band for the NIS appeared to contain larger errors than the other bands, with the remaining bands all generally falling within 1% of the ASD measurements.
Table 2.
Table of reflectance values for the ASD, MicaSense sensor, and the MicaSense resampled NIS sampling lines (1–3) over the reflectance calibration targets (high—Tarp 48; low—Tarp 03), vegetation, and the road.
The MicaSense results performed well against the ASD measurements over the bright tarp, even demonstrating higher accuracy in the blue band than the NIS results. However, for all remaining bands, the MicaSense tended to underestimate both the ASD and NIS. Underestimates of reflectance with results from a MicaSense are consistent with results from Shrestha et al. [13]; however, the results presented here over the bright tarp tended to be more accurate than those observed by Shrestha et al. [13] over bright targets. The MicaSense performance achieved relatively consistent accuracies in the visible bands, while experiencing a reduction in accuracy in LIR and NIR bands. When comparing the NIS and MicaSense sensor results in the NIR band, the MicaSense sensor reflectance values were >7% lower than the NIR results observed across all NIS lines and the ASD measurement. The corresponding relative difference between the MicaSense sensor in the NIR band over the bright was ~15%. For observations of the 3% reflectance tarp, the MicaSense sensor generally resulted in reflectance values that were inaccurate due to reflectance values higher than the ASD and NIS. This indicates that the MicaSense sensor potentially suffers from a background signal that prohibits accurate representation of low-reflectance targets. Similar to the bright reflectance tarp, the NIR band was the worst offending band over the dark reflectance tarp, overestimating the ASD by 4.85%, resulting in a relative error of 178%.
The results over the vegetation and gravel targets showed minor differences across all bands. The vegetation showed a maximum difference of 1.18% for the green band in NIS Line 3 and a minimum difference of 0.06% for the blue band of NIS Line 1. The gravel road showed a maximum difference of 0.95% and a minimum difference of 0.01%. Due to the consistency in results over the gravel road, the results of the t-test comparisons between the NIS and MicaSense data showed that only the gravel road was statistically significant at the 95% confidence interval. The statistically significant results occurred across all the lines for the green and red bands, as well as the NIR band in NIS Line 2 and NIS Line 3. In these cases, there was insufficient separation between the mean reflectance values to conclude that the two sensors observed different results and sensors could be used interchangeably. For the validation tarps and the vegetation, there were sufficient differences in the means and variation to conclude that the sensors observed different results for reflectance, meaning that the two sensors cannot be used interchangeably for these targets.
3.1.2. SlantRange
The NIS data resampled to the SlantRange bands differed from the ASD measurements by as much as −1.59% (maximum deviation) for the resampled green band of NIS Line 2 over the bright reflectance tarp (Table 3). The average deviations across all lines for each band were −1.15%, −0.64%, −0.14%, and −0.67% for the green (band 1), red (band 2), LIR (band 3), and NIR (band 4) bands, respectively. The maximum deviation over the dark reflectance tarp was −0.98%, which occurred in the green band for NIS Line 3. The average deviations across all lines for the dark reflectance tarp were −0.82%, −0.69%, −0.62%, and −0.82%, for the green, red, LIR, and NIR bands, respectively. Similar to the NIS data resampled to MicaSense bands, the NIS data resampled to SlantRange bands slightly overestimated the ASD measurements over the dark tarp. It was expected that similar trends would be observed between the resampled bands of the MicaSense and SlantRange because the band passes for each sensor covered similar regions. The largest deviation occurred in the SlantRange green band which was marginally better than the largest deviation in the MicaSense blue band. We note that the SlantRange sensor does not contain a blue band; therefore, the resampled SlantRange bands did not overlap with this region of the NIS, which performed poorly against ASD measurements.
Table 3.
Table of reflectance values for the ASD, SlantRange sensor, and the SlantRange resampled NIS sampling lines (1–3) over the reflectance calibration targets (high—Tarp 48; low—Tarp 03), vegetation, and the road.
Results from the SlantRange sensor over the bright validation tarp showed high deviation from both the ASD and NIS. Particularly in the visible bands, the SlantRange results over the bright tarp were consistently inaccurate and low, with the green band showing an underestimate by nearly 27% and a relative error of 53%. The SlantRange results improved in the NIR band over the bright tarp, with an underestimate of 8% and a relative error of 16%. Similar to the MicaSense results, the SlantRange consistently over predicted reflectance on the dark tarp, indicating there is excessive background signal in the sensor that prevents accurate reflectance retrievals over dark targets. Despite the overestimation of results over the dark tarp, the green band of the SlantRange did show high consistency with the NIS results over the dark validation tarp. The SlantRange performed better over the vegetation and gravel targets than the validation tarps. The maximum deviation over the vegetation was 4.7% which occurred in the NIR band when compared to the NIR band in NIS Line 1, representing a relative error of ~25%. The minimum deviation was only 0.07%, which occurred when it was compared to the green band of NIS Line 2. The gravel target showed a maximum deviation of 3.7% for the NIR band on NIS Line 1, resulting in a relative error of 18%. The minimum deviation was 0.01%, which occurred when it was compared to the red band of NIS Line 2. Results of the t-test showed that the SlantRange green band was statistically significant over the dark validation tarp for the green band of NIS Lines 1 and 2. All other targets were not statistically significant, indicating the two sensors could not be used interchangeably for those bands/targets.
3.2. Comparison of UAS and NIS Across the Entire Flight Area
3.2.1. MicaSense
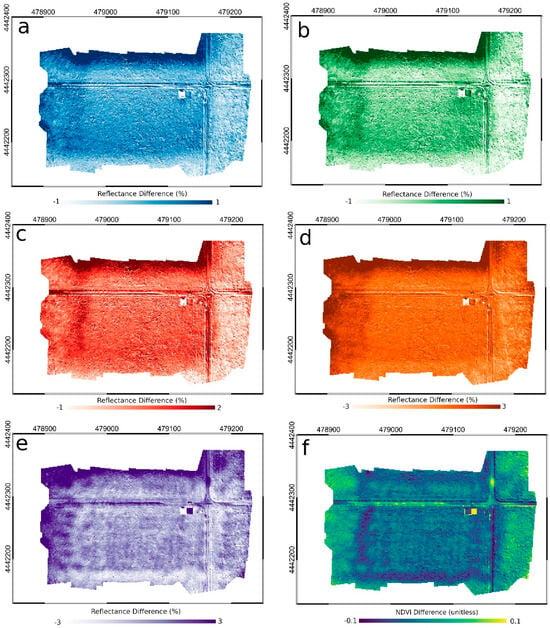
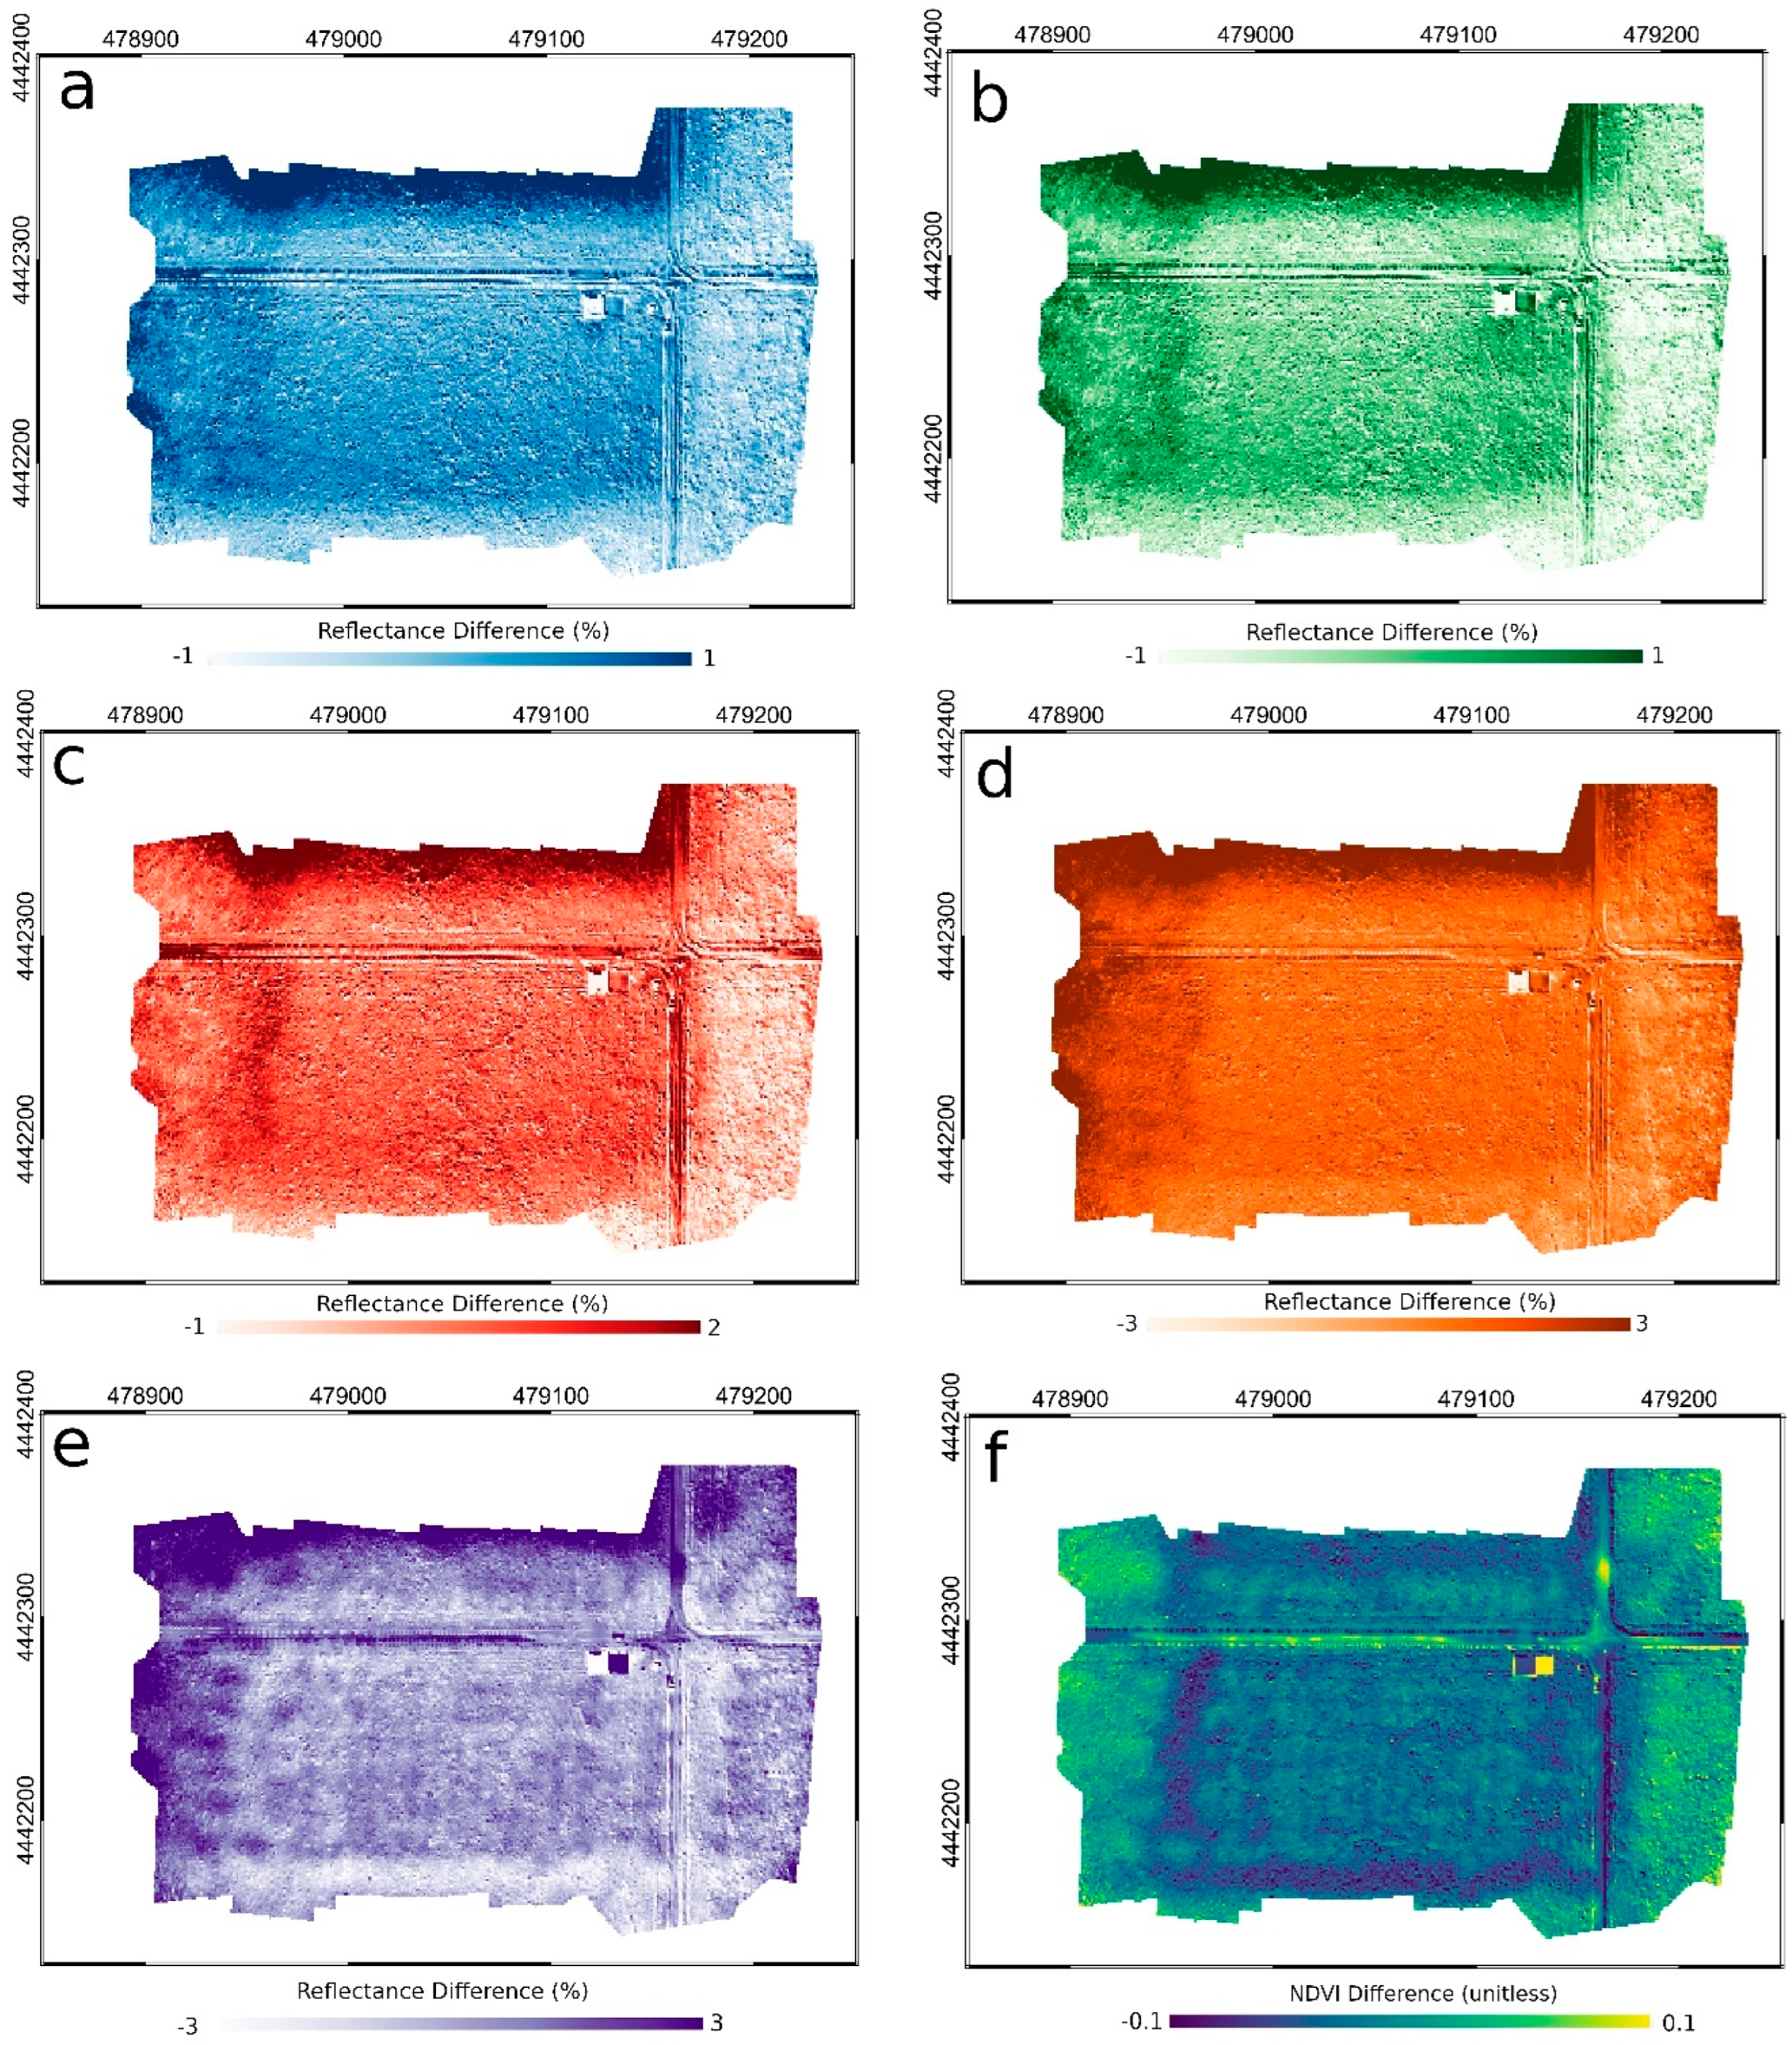
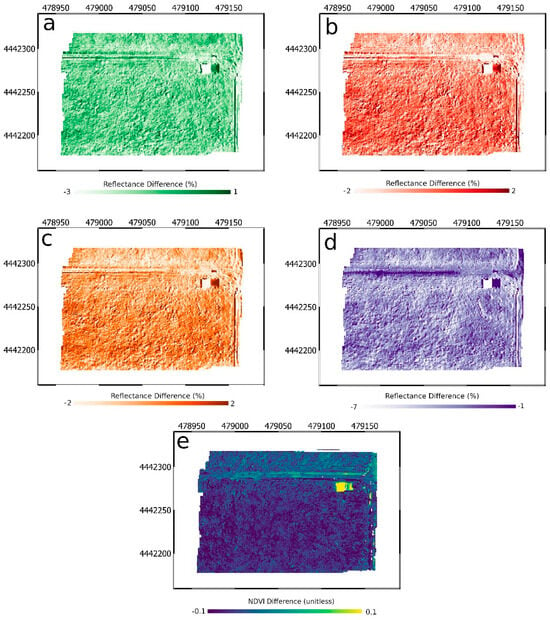
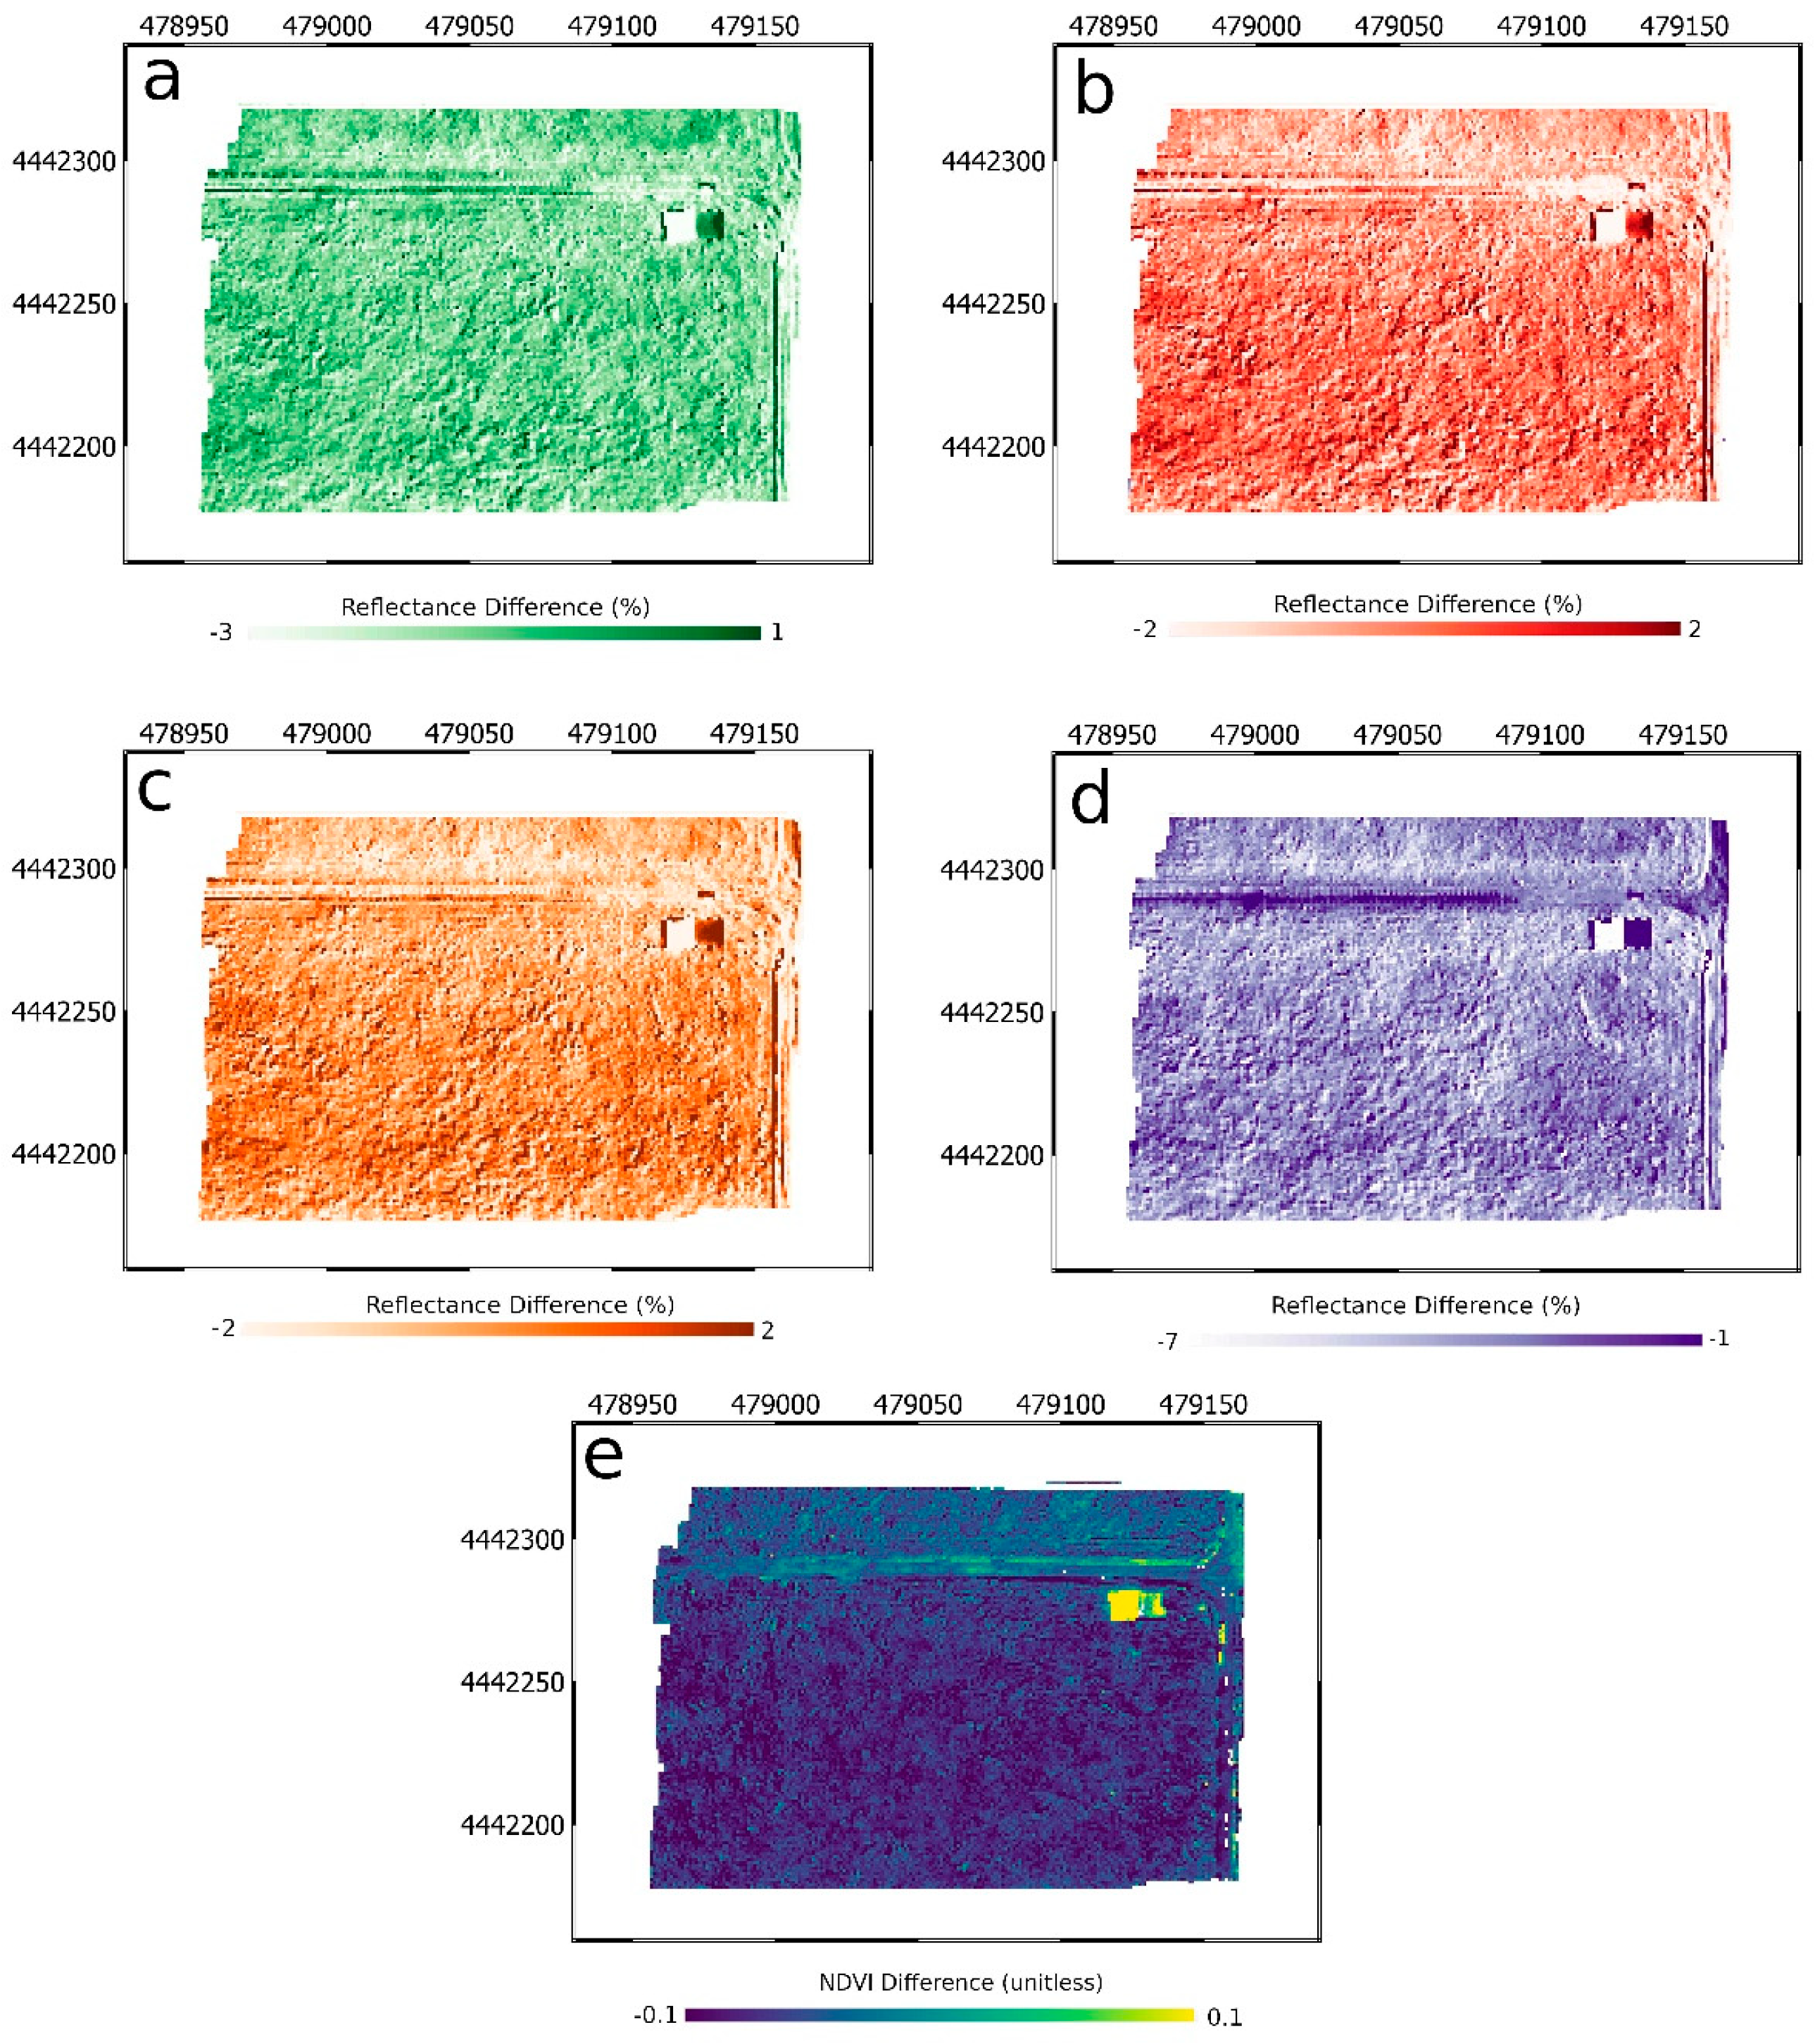
When assessing the entire flight area captured by the MicaSense sensor against the NIS data, noticeable artifacts in the reflectance difference can be seen along the edges of the acquisition area (Figure 4). These artifacts are evident in all bands are particularly noticeable on the northern and western edges of the flight area. These edge effects are discussed in more detail below.
Figure 4.
Reflectance differences between MicaSense and MicaSense resampled NIS values for the five MicaSense measurement bands ((a)—band 1 [blue]; (b)—band 2 [green]; (c)—band 3 [red]; (d)—band 4 [LIR]; (e)—band 5 [NIR]) and (f) the difference in calculated NDVI values from each instrument.
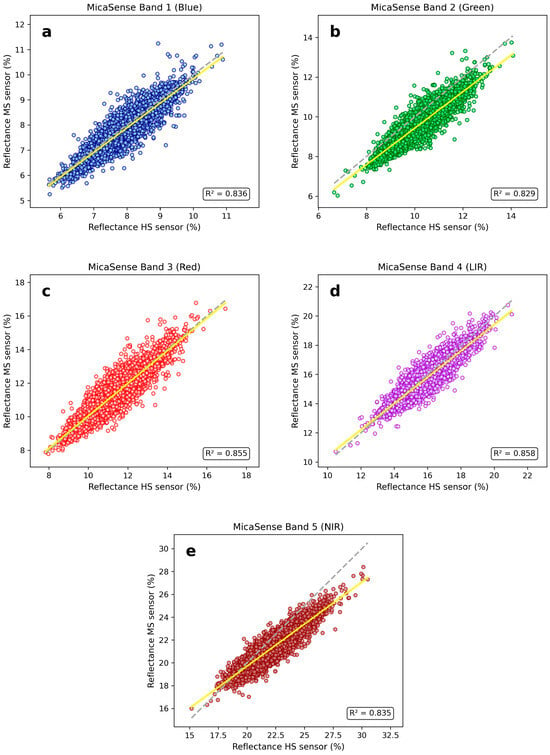
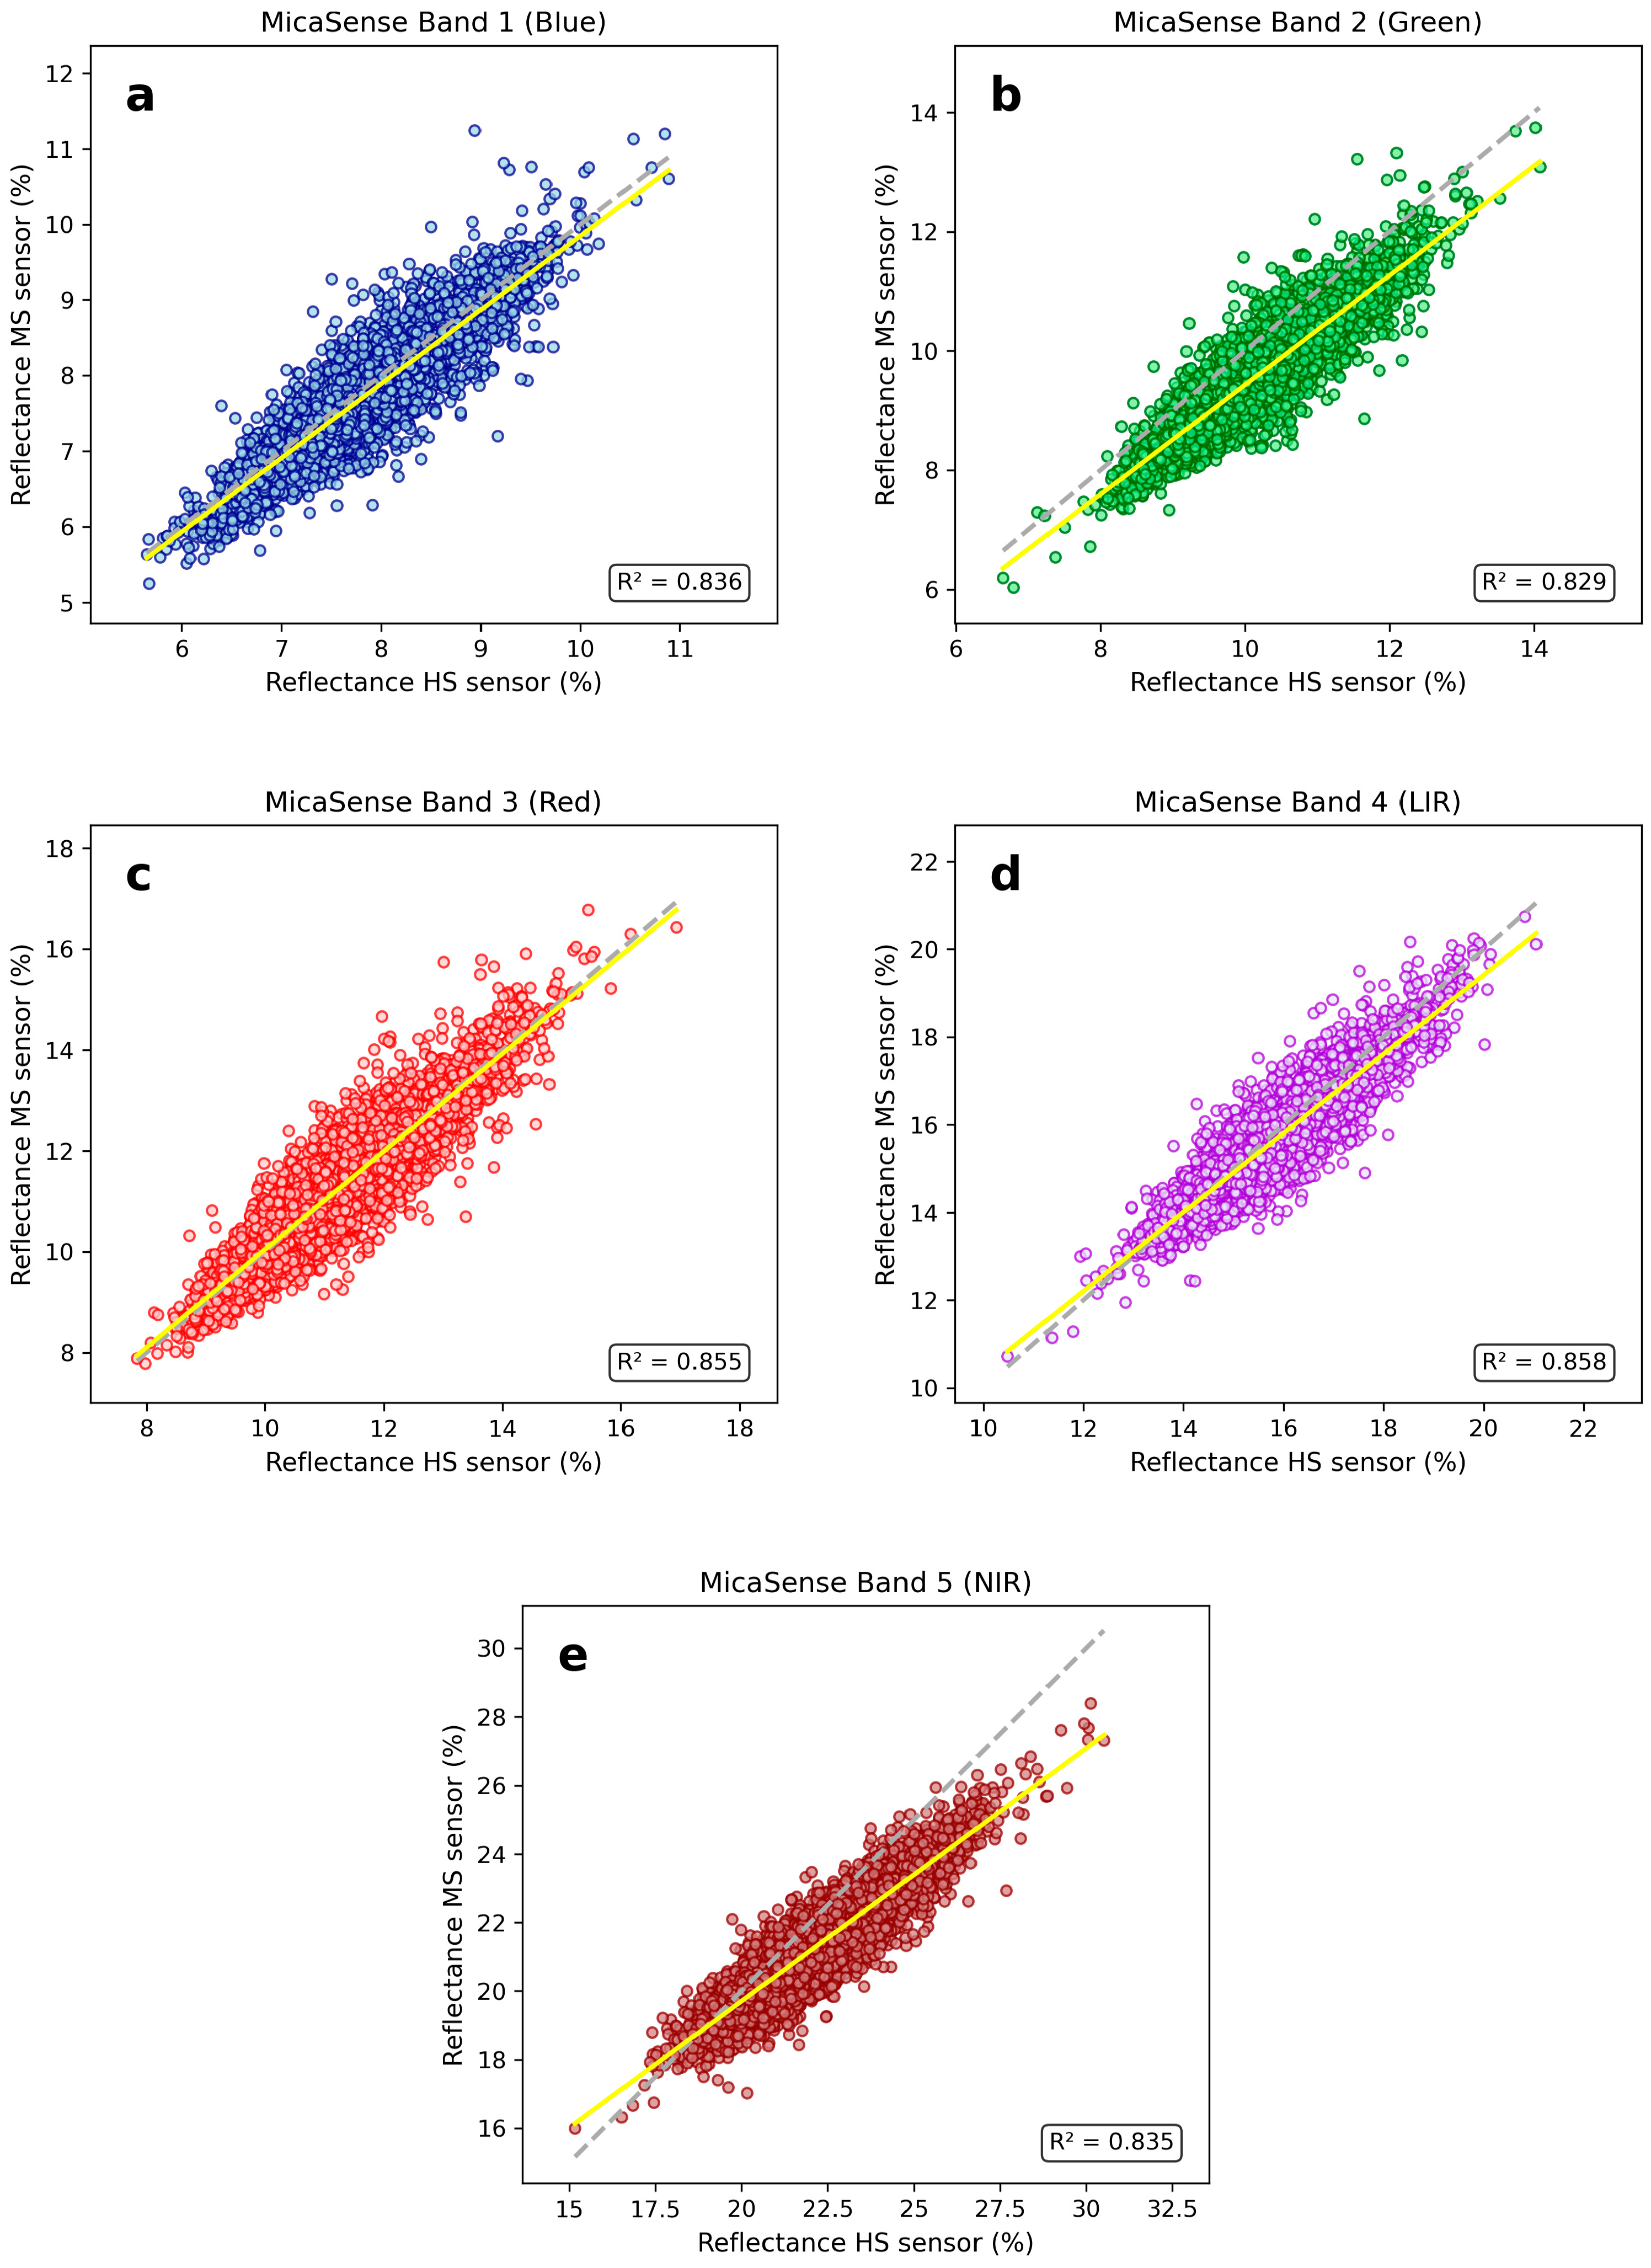
The linear regressions between the MicaSense data and resampled NIS data showed consistent results between the sensors across all NIS lines (Table S1, Figure 5). We note that Figure 5 shows results for only the NIS Line 1, but results were consistent across all lines (Table S1). Although none of the regressions showed statistical significance, the slope and intercept were nearest to one and zero, respectively, for the green and blue bands. Visual inspection of the scatterplots indicates a high degree of correlation between the two sets of observations and the R2 values, which were above 0.9 for all lines except one, demonstrating the high correlation. Consistent with these results, RMSE values ranged from 0.31% to 0.90% reflectance and mean RRMSE values ranged from 3.3% to 5.5%, indicating relatively low error across spectral bands despite the observed band-specific biases (Table S1). The worst performing band was the NIR band, with a slope averaging 0.74 and an average intercept of 5.1. This indicates that the NIR band of the MicaSense increasingly underestimates the true reflectance as reflectance increases. This is consistent with the results observed on validation targets. We note that for the NIR band, the 1:1 line intersects the regression line at a reflectance of 19.7%. It is at this reflectance that the NIS data and MicaSense data for NIR observations appear to be equivalent. This is in the vicinity of observed reflectance observed for both the vegetation (20.66%) and gravel (20.03%), which showed high agreement, even showing statistical significance in two of the NIS lines over gravel. This demonstrates the importance of characterizing the relationship at a variety of target reflectance, as analyzing only the vegetation and gravel targets would indicate a better compatibility between the NIS and MicaSense NIR data than truly exists across the observational space.
Figure 5.
Scatterplot of reflectance values from the MicaSense and the MicaSense resampled NIS values for the five MicaSense measurement bands: (a)—band 1 [blue]; (b)—band 2 [green]; (c)—band 3 [red]; (d)—band 4 [LIR]; and (e)—band 5 [NIR].
3.2.2. SlantRange
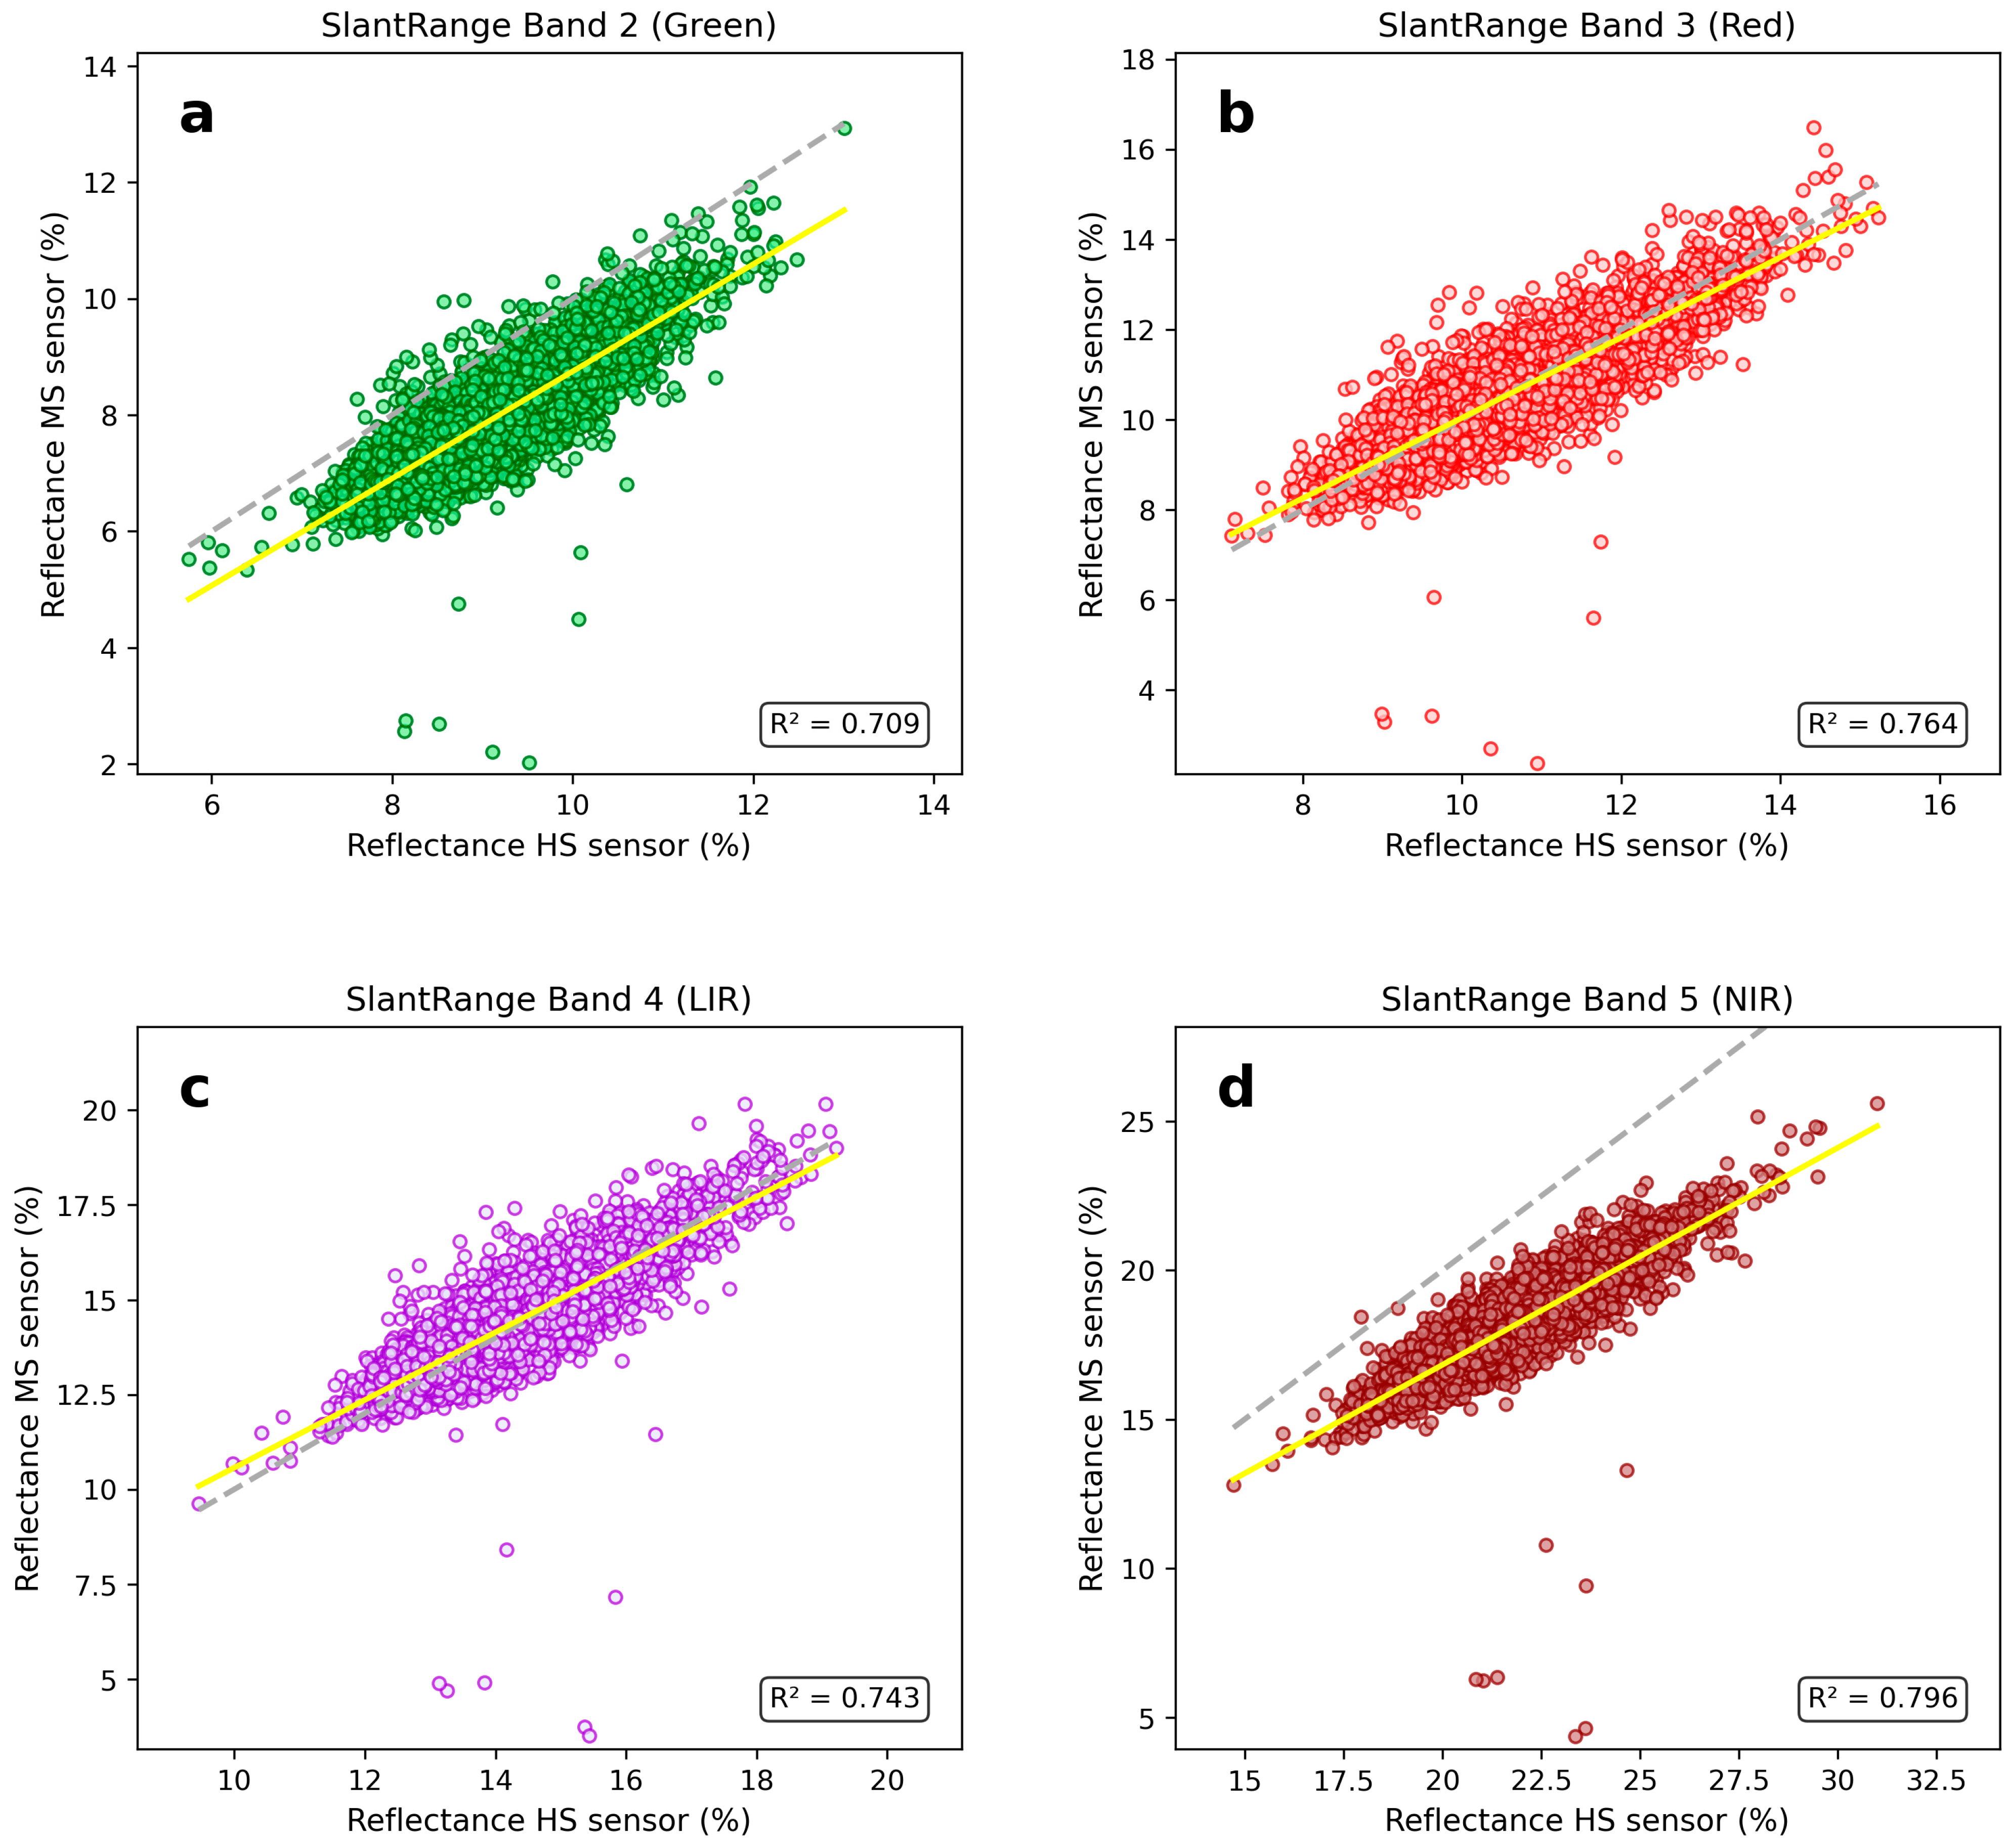
The SlantRange data compared to the NIS resampled data across the whole acquisition area had less noticeable edge artifacts than the MicaSense (Figure 6), which could be due to their wider field-of-view camera design. However, a noticeable bias is observed in the NIR band, especially in vegetated area (Figure 6d). The linear regressions between the SlantRange data and resampled NIS data showed consistent results between the sensors across all NIS lines (Table S2, Figure 7). Although none of the regressions showed statistical significance, the slope and intercept were nearest to one and zero, respectively, for the red and LIR bands. Similar to the MicaSense, the SlantRange NIR band performed the worst when compared to the resampled NIS data with an average slope of 0.725. Additionally, error metrics showed substantially larger uncertainty for the green and NIR bands, with mean RRMSE values of 16.2% and 19.1%, respectively, and a mean NIR bias of −4.17% reflectance, further highlighting the systematic underestimation observed relative to the NIS reference (Table S2).
Figure 6.
Reflectance differences between SlantRange and SlantRange resampled NIS values for the four SlantRange measurement bands ((a)—band 1 [green]; (b)—band 2 [red]; (c)—band 3 [LIR]; (d)—band 4 [NIR]); and (e) the difference in calculated NDVI values from each instrument.
Figure 7.
Scatterplot of reflectance values from the SlantRange and the SlantRange resampled NIS values for the four SlantRange measurement bands: (a)—band 1 [green]; (b)—band 2 [red]; (c)—band 3 [LIR]; and (d)—band 4 [NIR].
3.2.3. NDVI Differences
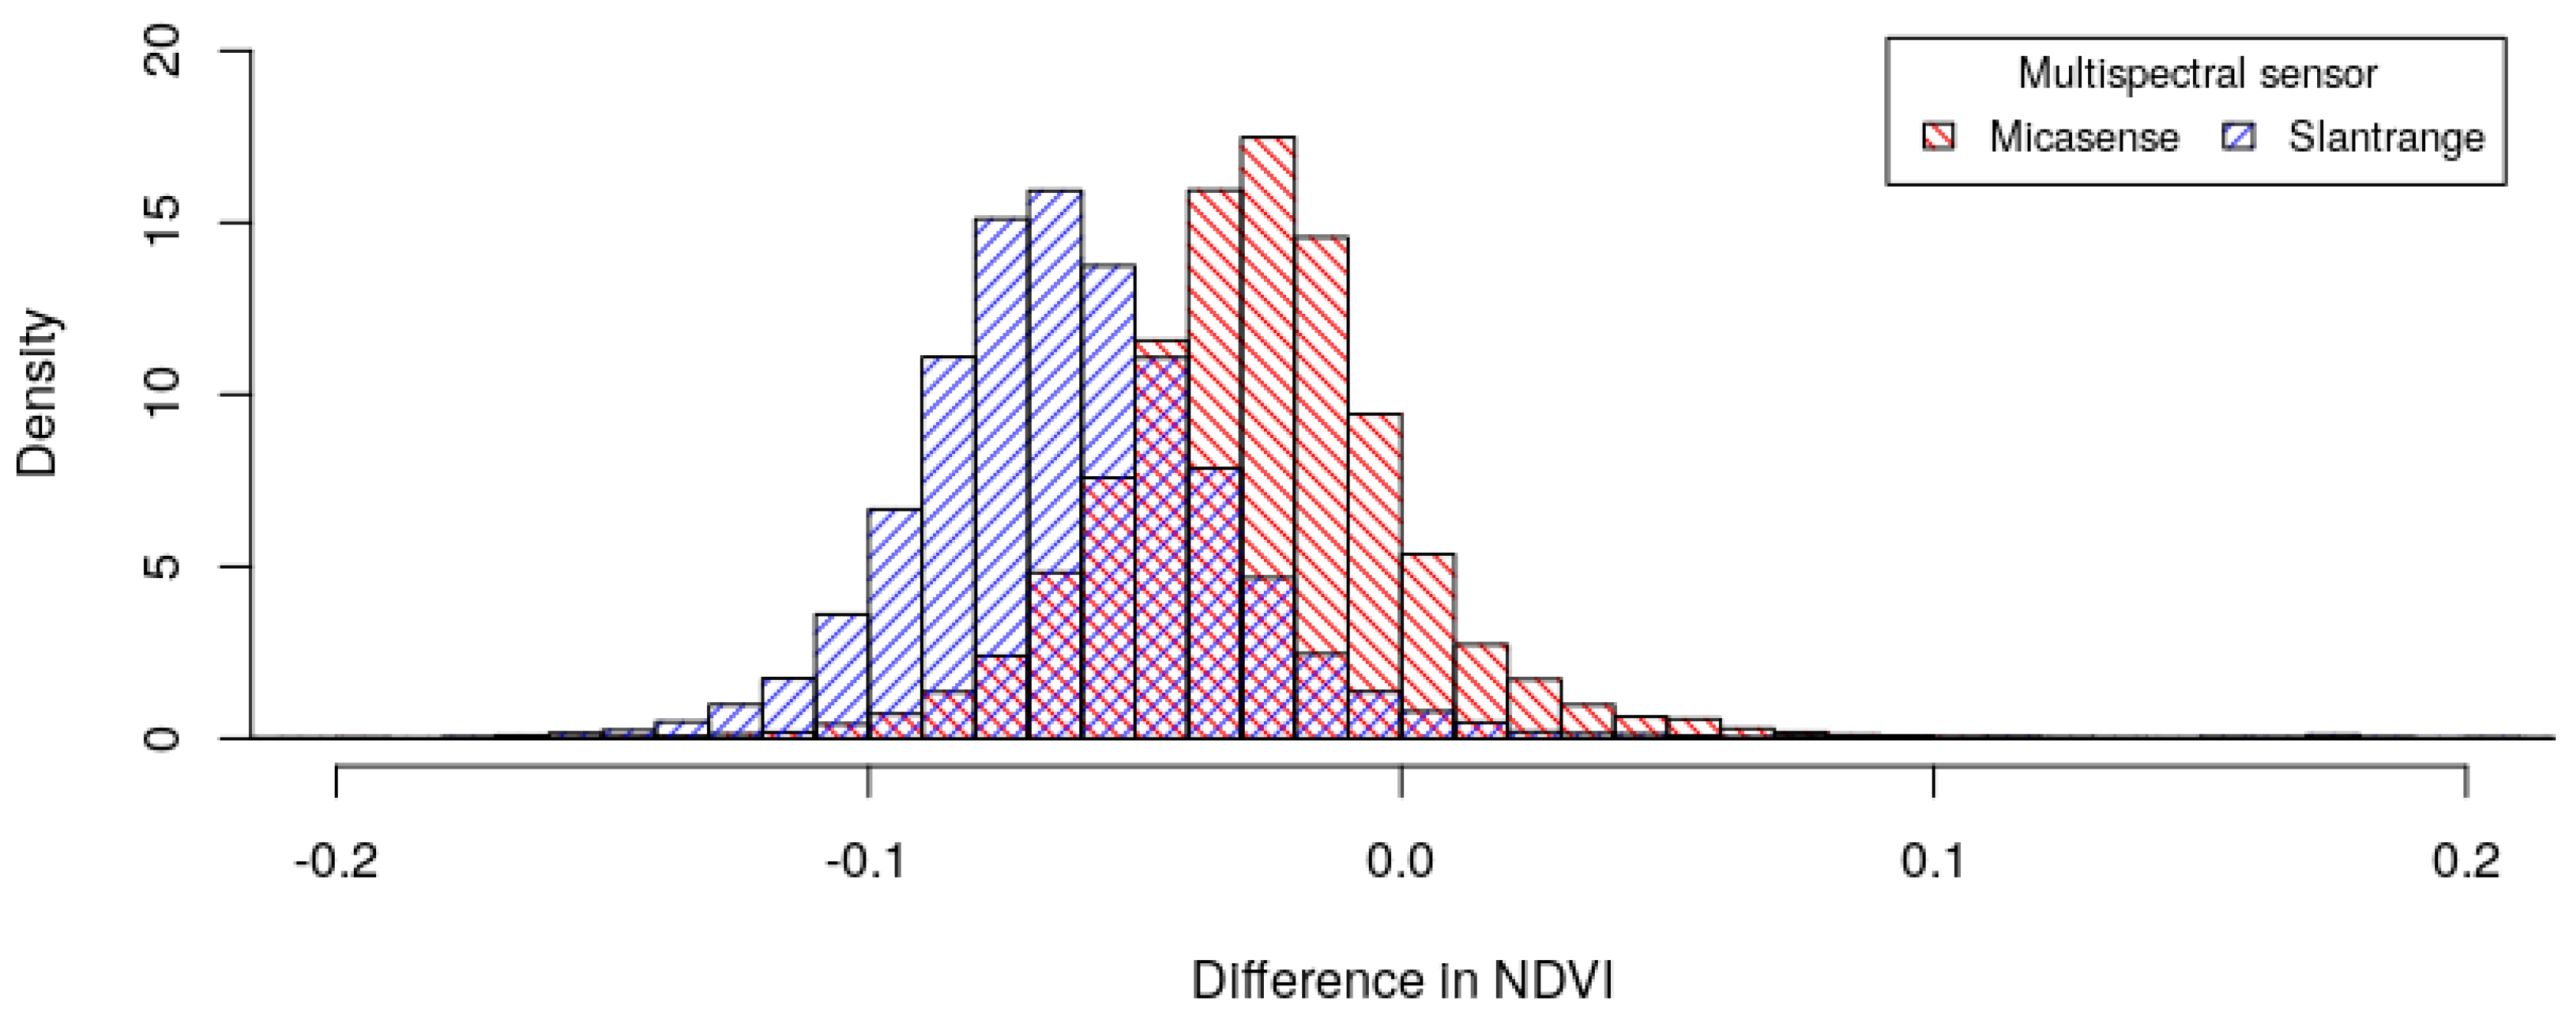
NDVI is calculated as a function of reflected red and near-infrared radiation [NIR] [25]. The red NDVI is calculated for this study to assess the impact of the band’s bias on an important vegetative index used to monitor plant and crop health as it relates to plant water retention [26]. The calculated NDVIs from both multispectral sensors (MicaSense and SlantRange) were lower than the NIS calculated NDVIs, with median differences of −0.0274 and −0.064, respectively. Figure 8 portrays the histograms of the NDVI differences between the NIS and the UAS multispectral sensors (MicaSense and SlantRange) aggregated across the entire orthomosaic. It is observed that the calculated differences in the NDVI from both multispectral sensors display a normal distribution, with SlantRange being slightly more negatively biased. The SlantRange NDVI differences spanned a larger range with a larger positive (maximum) and negative (minimum) difference compared to the MicaSense NDVI differences, which contributed to a slightly larger standard deviation and a greater interquartile range.
Figure 8.
Differences in calculated NDVIs between the NIS and the UAS multispectral sensors, MicaSense and SlantRange.
4. Discussion
This method of data analysis and sensor intercomparison provides a novel framework to evaluate UAS multispectral sensor ability to accurately capture surface reflectance. The use of calibration tarps, the ASD, and the NIS provided multiple methods of cross-referencing and calibration during the UAS flight campaign. The tarps and ASD served to ‘ground truth’ the reflectance data captured by the NIS, the SlantRange sensor, and the MicaSense sensor, allowing for the calibration at the ‘point scale’. The NIS served as the reference standard for assessing accuracy of the SlantRange and MicaSense sensors across the entire flight area. The high spectral resolution, number of narrow bands, and robust calibration regiment provide high confidence in the NIS data to compare and evaluate measurements of the UAS multispectral sensors. The general agreement between the UAS multispectral sensors and the NIS across most sampled bands is a positive sign for the use of UAS multispectral sensors in ecological applications, even though most bands were not found to be statistically significant. Moreover, the individual band bias can compound errors in derived data products, such as vegetative indices, especially if biases are in opposite directions.
This field-scale intercomparison allows us to evaluate the accuracy of the UAS multispectral sensors across varying surface properties among all applicable spectral bands. Large outliers in the multispectral sensor reflectance values relative to the NIS were observed at the edges of the tarps, where the multispectral sensors were likely averaging pixels with very different reflectance values, or the NIS resampling procedure relocated a pixel from within the tarp boundary partially outside the tarp boundary; however, these discrepancies were minimized by maximizing the cross correlation. Some of the reflectance artifacts observed in the MicaSense data around the edges of the acquisition area are due to the high incidence angle that the sensor creates with the terrain at photo edges resulting in an artifact introduced by observations obtained with high incidence angle. This type of artifact can often be corrected with modeling a bidirectional reflectance distribution function (BRDF) correction. Artifacts are notable on the edge, because in the mosaic procedure, pixels closer to nadir will be selected in high overlap areas. With little overlap on acquisition edges, pixels with high incidence angles will have to be utilized and will suffer more severely from the errors introduced by incidence angle. In contrast, nadir pixels tend to suffer minimally from BRDF effects because the observation is orthogonal to the surface normal creating a low incidence angle. Petracca et al. [27] identified the solar zenith angle, viewing zenith angle, and relative azimuth angle as the principal geometric variables controlling BRDF, such that the camera records different surface responses as these angles and the flight direction change. BRDF therefore represents a systematic, geometry-dependent effect rather than random measurement error. Qin et al. [28] investigated multi-angular observations arising from the low flight altitudes and wide camera fields of view common to UAS multispectral systems, and they reported 119–137% variability between maximum and minimum reflectance over a grassland target in the red-edge and NIR bands.
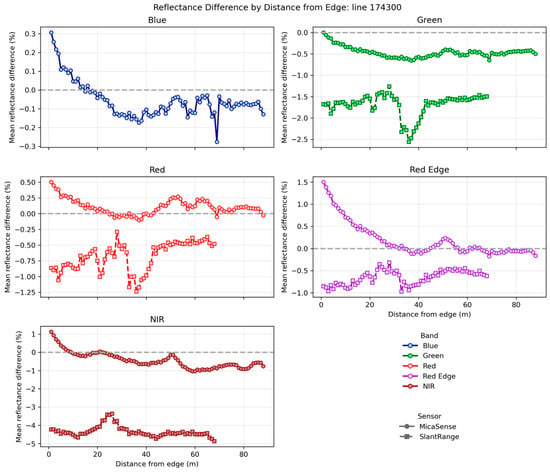
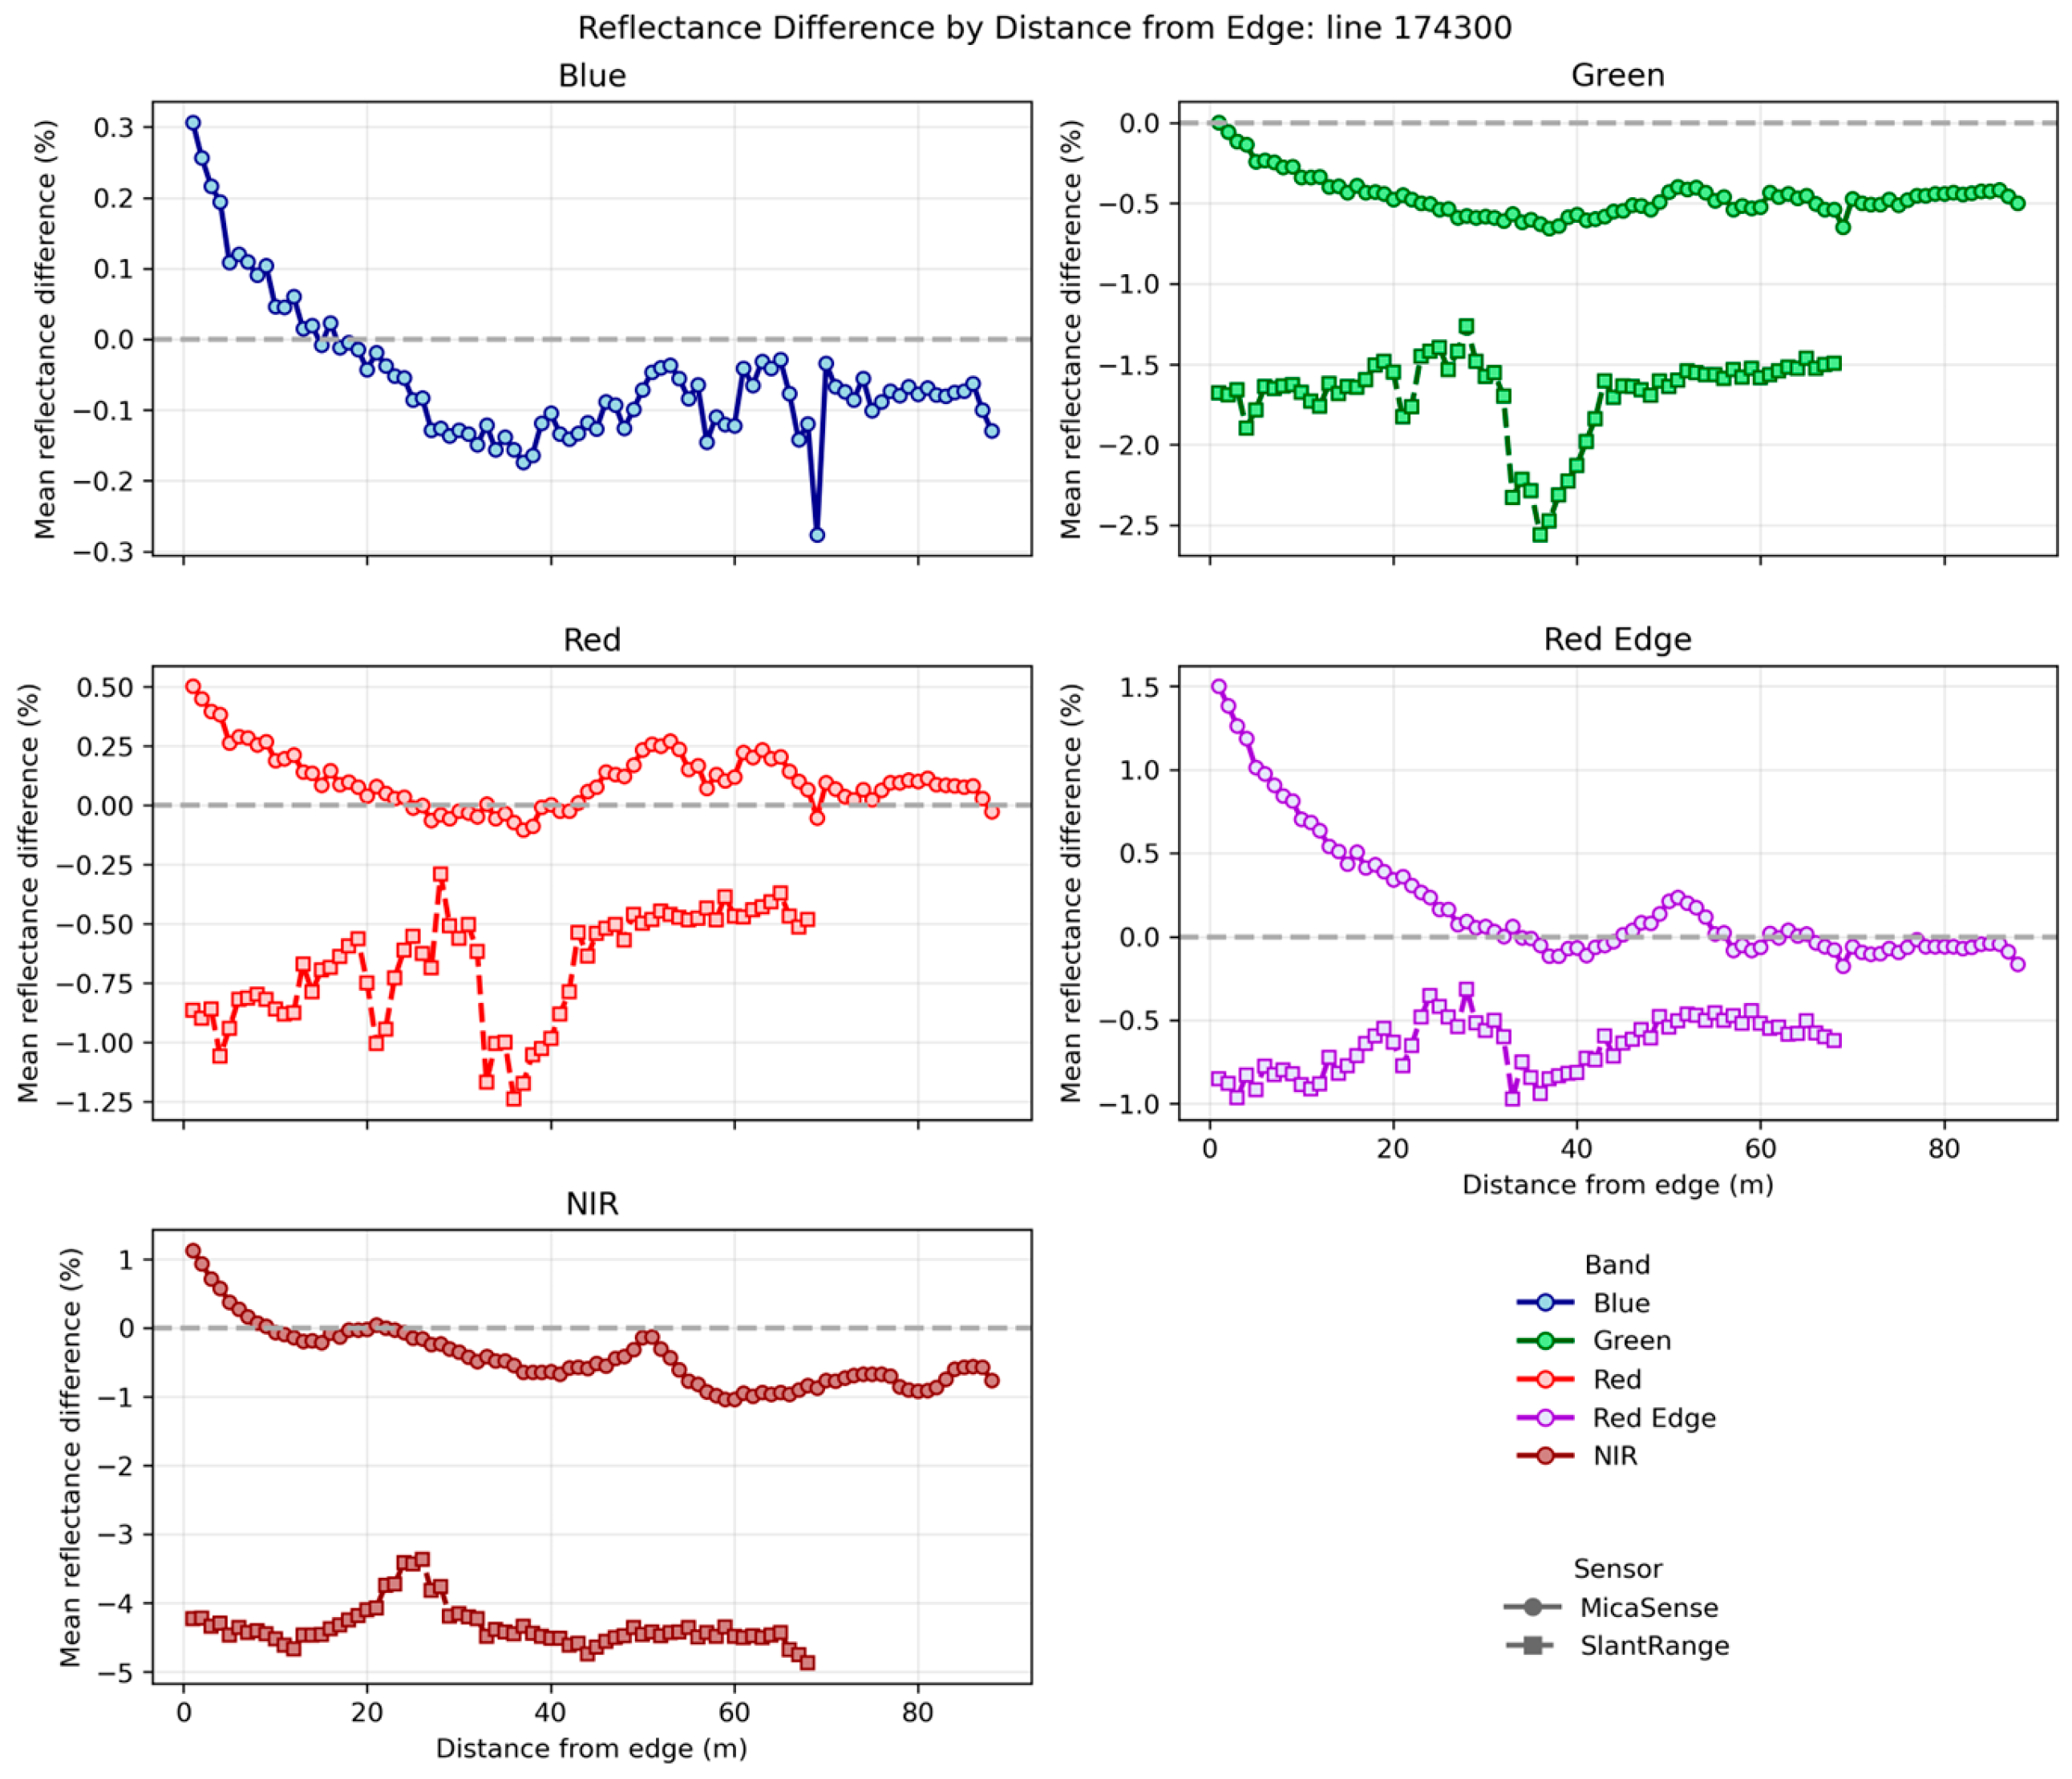
The band specific bias as a function of distance from the edge of the image for NIS Line 1 is presented in Figure 9; NIS Lines 2 and 3 demonstrated a similar behavior (Figures S1 and S2). The BRDF effects are particularly noticeable in the MicaSense sensor because the short focal length causes a wider FOV that introduces observations at high incidence angles at image edges. Therefore, users of the MicaSense sensor should plan their flight acquisitions to cover a slightly larger region than required and remove edges, around a 20 m buffer based on our flight parameters, in post-processing to avoid the increased uncertainty on the acquisition boundary. Ahn et al. [29] found that implementation of a BRDF correction for UAV multispectral mosaics reduced radiance differences, indicating the potential for utilizing a BRDF correction provided that a BRDF model and coefficients are developed for the specific camera and mapping scenario.
Figure 9.
Mean reflectance difference (%) as a function of distance from image edge for the blue, green, red, red-edge, and near-infrared (NIR) bands along NIS Line 1. Circular markers represent measurements from the MicaSense sensor, while square markers represent measurements from the SlantRange sensor. The dashed horizontal line indicates zero reflectance difference.
Both multispectral sensors systematically overestimated reflectance over the 3% dark tarp, a bias that was proportionally largest in the NIR and is consistent with several, likely compounding, mechanisms. Over a low-reflectance target the true at-sensor signal approaches the instrument noise floor, so any residual additive contribution produces a large relative error. A primary contributor is uncorrected additive instrument signal—dark-level bias and dark-current offset—which is small in absolute terms but dominates the weak signal returned by dark surfaces; such offsets are known to persist in low-cost sensors whose factory radiometric parameters are not routinely re-characterized [30]. Scattered light from the bright, high-albedo surroundings (the 48% tarp and gravel roads) can further inflate dark-pixel values through atmospheric and within-sensor adjacency and stray-light (veiling-glare) effects, which the NIS partially mitigates via stray light corrections and an explicit adjacency correction but the low-cost cameras do not [31]. Finally, empirical-line calibration anchored on a single high-reflectance panel has poorly constrained near-zero reflectance, so the calibration extrapolates upward at the dark end [18]. The practical consequence is a compression of the sensors’ usable dynamic range: reflectance is lifted at the dark end (here) and depressed at the bright end (as seen in the NIR over the 48% tarp), which biases derived indices and undermines retrievals over intrinsically dark or shadowed targets, such as water, wet or dark soils, shadowed canopy, and senescent vegetation where these sensors are least reliable. This behavior mirrors the both-ends bias reported for a comparable low-cost multispectral sensor validated against an airborne imaging spectrometer [14].
Since the UAS sensors are advertised for applications such as precision agricultural, the results in the green and LIR bands over a high reflectance target will likely not be an issue for its primary advertised use-cases. The band-specific biases identified here provide insight into the expected behavior of vegetation indices in general, as errors in the green, red-edge, red, and NIR bands will propagate into metrics such as GNDVI, NDRE, SAVI, MSAVI, and EVI; however, the NIR and red bands that underpin NDVI are particularly important because of their widespread use in vegetation health assessments. The subpar performance in the NIR band over photosynthetically active vegetation is likely to result in misrepresentation of vegetation conditions due to low NDVI estimates. An NIR value that is underestimated, combined with a red band that is accurate or too high, will result in a decrease in the true NDVI value and will falsely indicate lower photosynthetic activity. This is evident in the NDVI difference images where it is observed that NDVI values are generally lower in results from both multispectral sensors versus those produced by the NIS. The results indicate that the MicaSense sensor reflectance data for this campaign were generally less variable and appreciably less biased in the RE and NIR bands relative to those of the SlantRange sensor.
These results highlight the importance of adhering to manufacturer recommendations that images of the CRP should be captured by the MicaSense sensor prior to and following each flight campaign to account for ambient light changes that may have occurred. It should be noted that although we captured two calibration images of the CRP immediately prior to the flight, we did not capture any calibration images after the flight campaign. However, the duration of the UAS campaign was only 12 min, and changes in ambient lighting were trivial to nonexistent. As such, we assume that the lack of capturing an image of the CRP post flight had minimal impact on our study. The SlantRange sensor, per the manufacturer, does not require radiometric calibration photos, instead leveraging a proprietary algorithm to correct measurements based on solar irradiance measured during the flight. The SlantRange sensor still performed relatively well, particularly in the green and red bands; however, our results are consistent with those of Assman et al. [18], indicating radiometric calibration is important for collecting highly accurate multispectral data. Reliance on factory calibration without user-accessible panel recalibration increases uncertainty associated with calibration drift and unit-to-unit variability. The findings therefore support routine independent validation of each camera unit, periodic checks against traceable targets, retention of raw measurements where possible, and manufacturer provision of calibration dates, coefficients, and recalibration services.
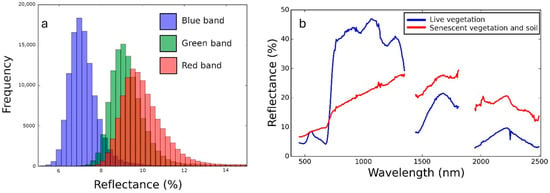
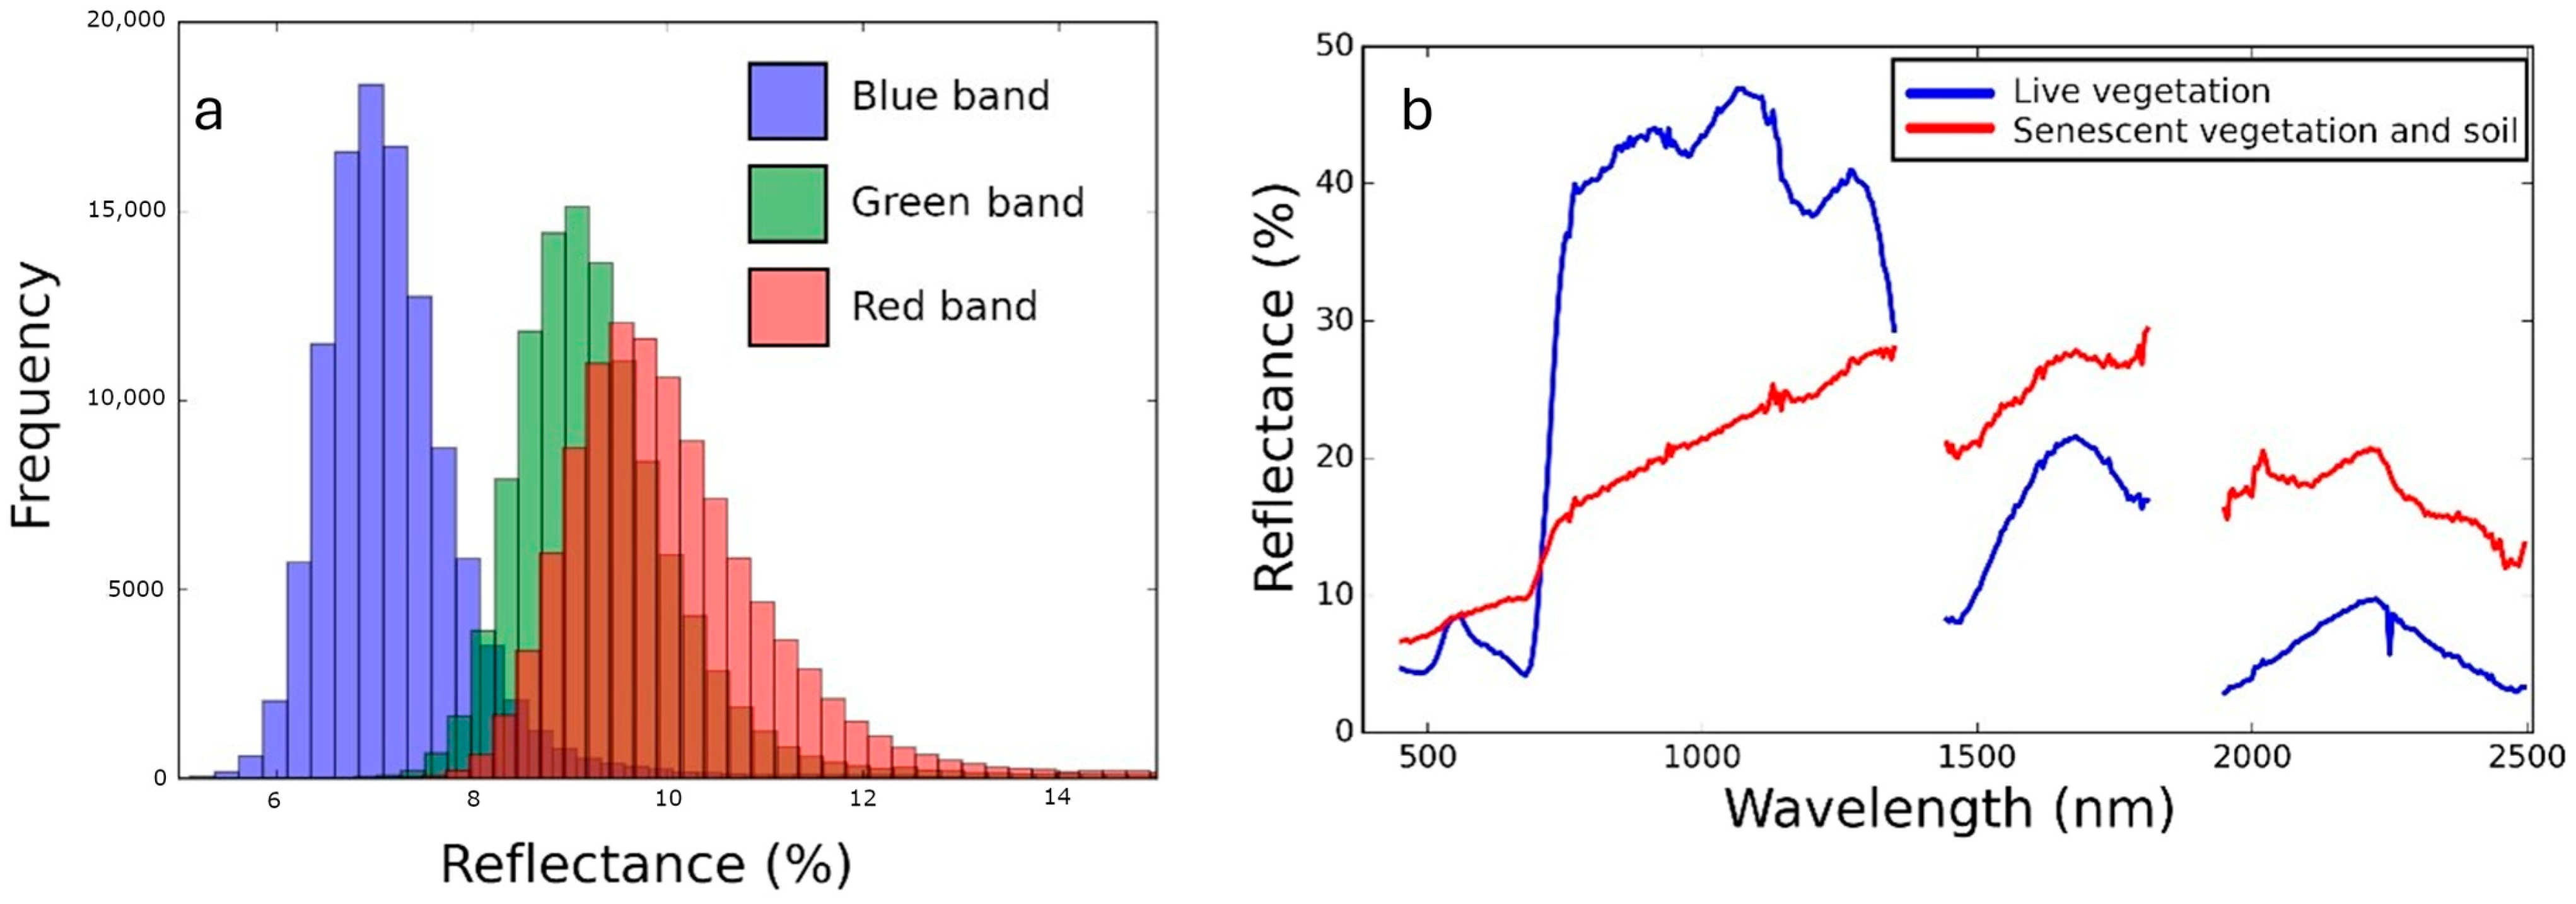
Differences in vegetation are particularly important because vegetation analysis is one of the primary applications of low-cost drone sensors, particularly for precision agriculture. Additionally, the NDVI is calculated based on bands that respond to the photosynthetic activity of vegetation (red and NIR), and errors in these bands will propagate into NDVI estimates. Although the t-test did not show multispectral bands as statistically the same as the NIS in the vegetation class, the low differences in reflectance indicated that vegetation reflectance is well-characterized. Furthermore, NDVI-stratified analyses revealed little variation in reflectance differences across the observed NDVI range (Figure S3), suggesting that the sensor biases were largely consistent rather than strongly influenced by vegetation density or condition. This relates to the NDVI findings, where differences in NDVI were all within the range of −0.1 to 0.1, which is 10% of the total NDVI range of −1 to 1. However, it should be noted that at the time of acquisition, the vegetation at Table Mountain had not yet reached the leaf-out or canopy growth stages of the phenological cycle. In combination with the underlying soil signal, an atypical vegetation reflectance curve resulted in higher than expected values in the visible region and lower than expected reflectance in the LIR and NIR regions (Figure 10). The red band resulted in a particularly high reflectance, which was greater than the green band. This pattern is not typical of actively photosynthesizing vegetation. Due to these complications, it is not possible to ascertain how the sensor would perform over vigorously growing and photosynthetically active vegetation. Results from the 48% reflectance tarp may be a better proxy for reflectance characteristics of photosynthetically active vegetation, which can reach reflectance values of 48% or greater in the NIR bands. Therefore, the results obtained here for vegetation and NDVI may be optimistic given the superior performance of the vegetation class over the 48% reflectance tarp. Additionally, the gravel road showed the best results of all the classes, which indicates open soil could also perform well. In this instance, the underlying soil signal that is mixed with the vegetation signal may substantially improve the accuracy of the vegetation results.
Figure 10.
(a) Histogram of reflectance values for different visible wavelength bands over live vegetation. (b) Reflectance values over measured wavelengths for live and senescent vegetation.
5. Conclusions
This study presents a rigorous field-scale comparison of UAS multispectral sensors (MicaSense and SlantRange) against a well-calibrated hyperspectral reference (NIS), ASD spectroradiometer, and standardized reflectance targets. Both sensors showed good overall agreement with the NIS in the visible bands, supporting their use in ecological applications where accurate reflectance data are required. However, performance varied by band and surface types, with the NIR band consistently exhibiting the greatest discrepancies, particularly in high-reflectance targets, leading to systematic underestimation of reflectance and subsequent NDVI bias. Field-scale regression analyses demonstrated strong correspondence between the sensors and NIS, with mean R2 values exceeding 0.82 for the MicaSense and low relative errors (mean RRMSE of 3.3–5.5%), although larger errors were observed for select SlantRange bands, particularly in the green and NIR regions.
The MicaSense sensor demonstrated lower bias and variability than the SlantRange, especially in the NIR and LIR bands, though reflectance values from either sensor were statistically equivalent to the NIS across most targets. NDVI values derived from both sensors were negatively biased relative to NIS, with median differences of −0.027 (MicaSense) and −0.064 (SlantRange). These differences stem from compounded band-level errors, particularly the underestimation of NIR reflectance, which can distort vegetation condition assessments in applications such as precision agriculture. Artifacts near image edges highlight the need to mitigate BRDF effects through appropriate flight planning and image overlap or applied algorithmic corrections.
This study provides a reproducible and transferable framework for comparing UAS multispectral data to airborne hyperspectral data. However, the results reported here are based on a single acquisition campaign at one site and therefore should not be interpreted as a comprehensive characterization of sensor performance across all ecosystem types, vegetation conditions, or environmental settings. In particular, the vegetation sampled during this campaign had not yet reached peak leaf-out or canopy development, resulting in reflectance characteristics influenced by senescent vegetation and exposed soil background. Consequently, the observed relationships between the UAS sensors and NIS, as well as the resulting NDVI comparisons, may not fully represent performance over vigorously photosynthesizing canopies or across different phenological stages.
Future work should apply this framework across multiple NEON sites encompassing a broader range of ecosystems, canopy structures, topographic conditions, and vegetation phenological stages to better quantify how sensor biases vary with surface reflectance characteristics and environmental conditions. Such analyses would help establish the operational limits of low-cost multispectral sensors, improve confidence in ecosystem-specific applications, and support development of calibration correction factors that enhance interoperability between UASs and airborne remote sensing platforms. Establishing traceable radiometric accuracy is also important for emerging UAS workflows, as reliable spectral measurements provide the foundation for automated feature detection, temporal tracking, classification, and other machine-learning-based analytical approaches that are becoming more prevalent in UAS operations. It is important to note that these results are for spatially aggregated UAS data and may not extend directly to the native resolution of the sensors though, which could impact some of transferability to these advanced operations. With the capabilities of UASs rapidly developing and becoming more cost efficient, ecological monitoring networks could leverage these tools to better understand ecosystem processes spanning large spatiotemporal scales or those in remote regions of the Earth that are understudied or difficult to assess.
Supplementary Materials
The following supporting information can be downloaded at: https://www.mdpi.com/article/10.3390/rs18213733/s1, Table S1: Table of regression statistics for reflectance values from the MicaSense and the MicaSense resampled NIS values for the 5 Micasesne measurement bands: (a)—band 1[blue]; (b)—band 2[green]; (c)—band 3[red]; (d)—band 4[LIR]; (e)—band 5[NIR].; Table S2: Table of regression statistics for reflectance values from the SlantRange and the SlantRange resampled NIS values for the 4 SlantRange measurement bands: (a)—band 1[green]; (b)—band 2[red]; (c)—band 3[LIR]; (d)—band 4[NIR].; Figure S1. Mean reflectance difference (%) as a function of distance from image edge for the Blue, Green, Red, Red Edge, and Near-Infrared (NIR) bands along NIS Line 2. Circular markers represent measurements from the MicaSense sensor, while square markers represent measurements from the SlantRange sensor. The dashed horizontal line indicates zero reflectance difference.; Figure S2. Mean reflectance difference (%) as a function of distance from image edge for the Blue, Green, Red, Red Edge, and Near-Infrared (NIR) bands along NIS Line 3. Circular markers represent measurements from the MicaSense sensor, while square markers represent measurements from the SlantRange sensor. The dashed horizontal line indicates zero reflectance difference.; Figure S3. Mean reflectance difference (%) between the MicaSense sensor and the hyperspectral reference sensor stratified by NDVI classes derived from the hyperspectral imagery. Points represent the mean reflectance difference for each spectral band within an NDVI bin, and error bars indicate ±1 standard deviation.
Author Contributions
Conceptualization, D.J.D.; methodology, D.J.D., J.R. and T.G.; software, D.J.D. and T.G.; validation, D.J.D., T.G. and J.R.; formal analysis, D.J.D. and T.G.; investigation, D.J.D. and T.G.; resources, D.J.D.; data curation, D.J.D. and T.G.; writing—original draft preparation, D.J.D. and J.R.; writing—review and editing, D.J.D., T.G., M.S., C.J.H., M.W., J.A. and J.R.; visualization, D.J.D., T.G. and J.R.; supervision, D.J.D. and M.S.; project administration, D.J.D. and C.J.H.; funding acquisition, D.J.D., J.R., C.J.H. and M.S. All authors have read and agreed to the published version of the manuscript.
Funding
This study was supported by Battelle Memorial Institute through research and development funding.
Data Availability Statement
The datasets utilized and generated during this study are openly accessible through Zenodo at https://doi.org/10.5281/zenodo.20721271.
Acknowledgments
This material is based, in part, upon work supported by the National Ecological Observatory Network (NEON), a program sponsored by the U.S. National Science Foundation (NSF) and operated under cooperative agreement by Battelle. GenAI (ChatGPT, Claude, and CoPilot) was employed to assist in refining the wording of the manuscript and in the generation of the graphical abstract; the authors take full responsibility for the content.
Conflicts of Interest
The authors declare no conflicts of interest.
Abbreviations
The following abbreviations are used in this manuscript:
| UAS | Uncrewed Aerial System |
| NDVI | Normalized Difference Vegetation Index |
| NIS | NEON Imaging Spectrometer |
| BRDF | Bidirectional Reflectance Distribution Function |
| UAV | Uncrewed Aerial Vehicle |
| EO | Earth Observing |
| GSD | Ground Sampling Distance |
| ASPIS | Advanced Spectroscopic Imaging System |
| AOP | NEON Airborne Observation Platform |
| NEON | National Ecological Observatory Network |
| SWIR | Short-Wave Infrared |
| ASD | Analytical Spectral Device |
| LIR | Leading Infrared |
| JPL | Jet Propulsion Laboratory |
| AVIRIS | Airborne Visible–Infrared Imaging Spectrometer |
| FOV | Field of View |
| NIR | Near-Infrared |
| DLS | Downwelling Light Sensor |
| VTOL | Vertical Takeoff and Landing |
| GPS | Global Positioning System |
| CRP | Calibration Reflectance Panel |
| ATCOR | Atmospheric and Topographic Correction |
| AOT | Aerosol Optical Thickness |
| AC | Angstrom Coefficient |
References
- Watts, A.C.; Ambrosia, V.G.; Hinkley, E.A. Unmanned aircraft systems in remote sensing and scientific research: Classification and considerations of use. Remote Sens. 2012, 4, 1671–1692. [Google Scholar] [CrossRef] [Scilit]
- Herwitz, S.R.; Johnson, L.F.; Dunagan, S.E.; Higgins, R.G.; Sullivan, D.V.; Zheng, J.; Lobitz, B.M.; Leung, J.G.; Gallmeyer, B.A.; Aoyagi, M.; et al. Imaging from an unmanned aerial vehicle: Agricultural surveillance and decision support. Comput. Electron. Agric. 2004, 44, 49–61. [Google Scholar] [CrossRef] [Scilit]
- Rango, A.; Laliberte, A.; Herrick, J.E.; Winters, C.; Havstad, K.; Steele, C.; Browning, D. Unmanned aerial vehicle-based remote sensing for rangeland assessment, monitoring, and management. J. Appl. Remote Sens. 2009, 3, 033542. [Google Scholar] [CrossRef] [Scilit]
- Anderson, K.; Gaston, J.K. Lightweight unmanned aerial vehicles will revolutionize spatial ecology. Front. Ecol. Environ. 2013, 11, 138–146. [Google Scholar] [CrossRef] [Scilit]
- Zhang, D.; Zhou, X.; Zhang, J.; Lan, Y.; Xu, C.; Liang, D. Detection of rice sheath blight using an unmanned aerial system with high-resolution color and multispectral imaging. PLoS ONE 2018, 13, e0187470. [Google Scholar] [CrossRef] [Scilit]
- Jannoura, R.; Brinkmann, K.; Uteau, D.; Bruns, C.; Joergensen, R.G. Monitoring of crop biomass using true colour aerial photographs taken from a remote controlled hexacopter. Biosyst. Eng. 2015, 129, 341–351. [Google Scholar] [CrossRef] [Scilit]
- Di Gennaro, S.F.; Toscano, P.; Gatti, M.; Poni, S.; Berton, A.; Matese, A. Spectral Comparison of UAV-Based Hyper and Multispectral Cameras for Precision Viticulture. Remote Sens. 2022, 14, 449. [Google Scholar] [CrossRef] [Scilit]
- Chen, D.; Chen, Y.; Zhang, H.; Liu, J.; Cheng, Q.; Duan, F.; Kuang, X.; Fu, W.; Liu, J.; Chen, Z. Diagnosis of nitrogen nutrition in winter wheat across years based on multi-source remote sensing data from unmanned aerial vehicles. Smart Agric. Technol. 2025, 12, 101481. [Google Scholar] [CrossRef] [Scilit]
- Han, S.; Zhao, Y.; Cheng, J.; Zhao, F.; Yang, H.; Feng, H.; Li, Z.; Ma, X.; Zhao, C.; Yang, G. Monitoring Key Wheat Growth Variables by Integrating Phenology and UAV Multispectral Imagery Data into Random Forest Model. Remote Sens. 2022, 14, 3723. [Google Scholar] [CrossRef] [Scilit]
- Turner, D.; Lucieer, A.; Malenovský, Z.; King, D.; Robinson, S.A. Assessment of Antarctic moss health from multi-sensor UAS imagery with Random Forest modelling. Int. J. Appl. Earth Obs. Geoinf. 2018, 68, 168–179. [Google Scholar] [CrossRef] [Scilit]
- Matese, A.; Toscano, P.; Di Gennaro, S.; Genesio, L.; Vaccari, F.; Primicerio, J.; Gioli, B. Intercomparison of UAV, aircraft and satellite remote sensing platforms for precision viticulture. Remote Sens. 2015, 7, 2971–2990. [Google Scholar] [CrossRef] [Scilit]
- Berni, J.A.; Zarco-Tejada, P.J.; Suárez, L.; González-Dugo, V.; Fereres, E. Remote sensing of vegetation from UAV platforms using lightweight multispectral and thermal imaging sensors. Int. Arch. Photogramm. Remote Sens. Spatial Inf. Sci. 2009, 38, 6. [Google Scholar]
- Shrestha, M.; Scholl, V.; Sampath, A.; Irwin, J.; Kropuenske, T.; Adams, J.; Burgess, M.; Brady, L. Absolute Radiometric Calibration Evaluation of Uncrewed Aerial System (UAS) Headwall and MicaSense Sensors and Improving Data Quality Using the Empirical Line Method. Remote Sens. 2025, 17, 3738. [Google Scholar] [CrossRef] [Scilit]
- Fawcett, D.; Panigada, C.; Tagliabue, G.; Boschetti, M.; Celesti, M.; Evdokimov, A.; Biriukova, K.; Colombo, R.; Miglietta, F.; Rascher, U.; et al. Multi-Scale Evaluation of Drone-Based Multispectral Surface Reflectance and Vegetation Indices in Operational Conditions. Remote Sens. 2020, 12, 514. [Google Scholar] [CrossRef] [Scilit]
- National Ecological Observatory Network (NEON). NEON.DOC.001210. NEON Imaging Spectrometer Level 1B Calibrated Radiance. 2014. Available online: https://data.neonscience.org/documents (accessed on 24 September 2025).
- MicaSense Inc. MicaSense RedEdge-M Multispectral Camera User’s Manual. 2017. Available online: https://support.MicaSense.com/hc/en-us/articles/115003537673-RedEdge-M-User-Manual-PDF- (accessed on 24 September 2025).
- SlantRange Inc. Integration Guide; SlantRange: San Diego, CA, USA, 2017. [Google Scholar]
- Assmann, J.J.; Kerby, J.T.; Cunliffe, A.M.; Myers-Smith, I.H. Vegetation monitoring using multispectral sensors—Best practices and lessons learned from high latitudes. J. Unmanned Veh. Syst. 2018, 7, 54–75. [Google Scholar] [CrossRef] [Scilit]
- National Oceanic and Atmospheric Administration (NOAA). Solar Calculator. 2005. Available online: https://www.esrl.noaa.gov/gmd/grad/solcalc/ (accessed on 24 September 2025).
- Gallery, W.; Leisso, N. NEON Algorithm Theoretical Basis Document: NEON Imaging Spectrometer Level 1B Calibrated Radiance–RevA. National Ecological Observatory Network. 2014. Available online: https://data.neonscience.org/documents (accessed on 19 October 2026).
- Kampe, T.; Gallery, W.; Goulden, T.; Leisso, N.; Krause, K. NEON Imaging Spectrometer Geolocation Processing Algorithm Theoretical Basis Document–RevC. National Ecological Observatory Network. 2016. Available online: https://data.neonscience.org/documents (accessed on 19 October 2026).
- Boulder Creek Critical Zone Observatory. August 2010 LiDAR Survey. Distributed by OpenTopography; Boulder Creek CZO, INSTAAR, University of Colorado at Boulder: Boulder, CO, USA, 2012. [Google Scholar] [CrossRef]
- Richter, R.; Schläpfer, D. ATCOR4 Manual. ReSe Applications. Available online: https://www.rese-apps.com/pdf/atcor4_manual.pdf (accessed on 1 March 2018).
- Wilson, R.T.; Milton, E.J.; Nield, J.M. Are visibility-derived AOT estimates suitable for parameterizing satellite data atmospheric correction algorithms? Int. J. Remote Sens. 2015, 36, 1675–1688. [Google Scholar] [CrossRef] [Scilit]
- Carlson, T.N.; Ripley, D.A. On the relation between NDVI, fractional vegetation cover, and leaf area index. Remote Sens. Environ. 1997, 62, 241–252. [Google Scholar] [CrossRef] [Scilit]
- Mahajan, U.; Bundel, B.R. Drones for Normalized Difference Vegetation Index (NDVI), to estimate crop health for precision agriculture: A cheaper alternative for spatial satellite sensors. In Proceedings of the International Conference on Innovative Research in Agriculture, Food Science, Forestry, Horticulture, Aquaculture, Animal Sciences, Biodiversity, Ecological Sciences and Climate Change (AFHABEC-2016); Jawaharlal Nehru University: New Delhi, India, 2017. [Google Scholar]
- Petracca, I.; Latini, D.; Di Giacomo, M.; Niro, F.; Bonafoni, S.; Del Frate, F.; Schiavon, G. BRDF Computation and Modeling Through the Use of UAS. In Proceedings of the IGARSS 2024–2024 IEEE International Geoscience and Remote Sensing Symposium, Athens, Greece, 7–12 July 2024; pp. 6566–6571. [Google Scholar] [CrossRef] [Scilit]
- Qin, Z.; Dai, C.; Wang, M.; Li, X. Multi-Angular Reflectance Anisotropy Observed from UAV Multispectral Imagery. arXiv 2026, arXiv:2606.10350. [Google Scholar] [CrossRef] [Scilit]
- Ahn, H.; Kim, C.; Lim, S.; Jin, C.; Kim, J.; Choi, C. Minimizing Seam Lines in UAV Multispectral Image Mosaics Utilizing Irradiance, Vignette, and BRDF. Remote Sens. 2025, 17, 151. [Google Scholar] [CrossRef] [Scilit]
- Mamaghani, B.; Salvaggio, C. Multispectral Sensor Calibration and Characterization for sUAS Remote Sensing. Sensors 2019, 19, 4453. [Google Scholar] [CrossRef] [Scilit]
- Tanre, D.; Deschamps, P.Y.; Duhaut, P.; Herman, M. Adjacency Effect Produced by the Atmospheric Scattering in Thematic Mapper Data. J. Geophys. Res. Atmos. 1987, 92, 12000–12006. [Google Scholar] [CrossRef] [Scilit]

Disclaimer/Publisher’s Note: The statements, opinions and data contained in all publications are solely those of the individual author(s) and contributor(s) and not of MDPI and/or the editor(s). MDPI and/or the editor(s) disclaim responsibility for any injury to people or property resulting from any ideas, methods, instructions or products referred to in the content. |
© 2026 by the authors. Licensee MDPI, Basel, Switzerland. This article is an open access article distributed under the terms and conditions of the Creative Commons Attribution (CC BY) license.