


Highlights
What are the main findings?
- All-sky GIIRS-retrieved profile assimilation appears to be a more robust choice for typhoon track, intensity, and precipitation forecasts, whereas assimilating clear-sky or cloudy-sky profiles alone can be adverse.
- Vortex relocation experiments show that track forecast failure for the strong typhoon (No. 2504) is mainly due to dynamic–thermal inconsistency between the vortex and environment, while weak typhoon (Nos. 2507 and 2508) track errors are mainly caused by environmental field errors.
What are the implications of the main findings?
- All-sky assimilation of GIIRS-retrieved profiles is recommended for operational typhoon forecasting, as it increases the heavy rain and torrential rain threat scores by 0.04 and 0.09, respectively, over the control assimilation.
- For strong typhoons, improving the background error covariance matrix to better coordinate vortex–environment interactions is necessary to further enhance track forecasts.
Abstract
Assimilating satellite-retrieved profiles is an important approach to improving a numerical model’s initial conditions and typhoon forecasting skill. This study uses temperature and humidity retrieved profile products from the Geostationary Interferometric Infrared Sounder (GIIRS) onboard Fengyun-4B for three typhoons that affected Zhejiang Province in July 2025 with different track types. Sensitivity experiments are conducted under clear-sky, cloudy-sky, and all-sky conditions. Vortex relocation experiments are designed to separate the contributions of typhoon vortex structure and environmental field to track forecasts. Results show that assimilation systematically adjusts temperature and humidity in the typhoon inner core, rainband, and outer environment. All schemes produce lower–middle tropospheric warming and upper tropospheric cooling. Humidity decreases in the low-level outer environment but increases around the typhoon vortex and along the Western Pacific Subtropical High edge. For the three typhoon cases examined in this study, all-sky assimilation is optimal for track forecasts, whereas clear-sky or cloudy-sky assimilation alone can be adverse. For the 24 h accumulated precipitation during the period of severe typhoon impact on Zhejiang, all-sky assimilation increases the threat scores for heavy rain and torrential rain by 0.04 and 0.09, respectively, relative to the control experiment, and increases the extreme torrential rain threat score by 0.09 relative to cloudy-sky assimilation. For the three typhoon cases examined in this study, all-sky GIIRS profile assimilation shows clear advantages for typhoon forecasting and highlights the potential for the operational application of GIIRS-retrieved temperature and humidity profiles.
1. Introduction
Zhejiang Province is located in the central part of the southeastern coast of China and is one of the provinces most frequently and severely affected by typhoons. Accurate forecasting of typhoon track, intensity, and associated wind and rain remains a major challenge in numerical weather prediction (NWP). Typhoon forecasting depends heavily on the accuracy of the dynamic and thermal structures of both the typhoon itself and its environment in the model’s initial field. However, conventional radiosonde observations over the western North Pacific and adjacent seas off China are very sparse, which has become a key factor limiting the quality of a typhoon’s initial conditions and further affecting forecast performance [1,2].
Satellite remote sensing observations can compensate for the lack of conventional observations over the ocean; therefore, assimilating satellite data is one of the core technologies for improving NWP skill [3,4]. Infrared hyperspectral atmospheric vertical sounders can provide high-vertical-resolution atmospheric sounding data with thousands of narrow spectral channels. However, these instruments are mainly onboard polar-orbiting satellites [5,6,7,8], which can observe the same region only about twice per day, making it difficult to continuously capture the rapid evolution of mesoscale weather systems such as typhoons.
China’s Fengyun-4B (FY-4B) satellite carries the Geostationary Interferometric Infrared Sounder (GIIRS), which enables high-frequency sounding of the atmosphere over the same region [9,10]. The nadir spatial resolution of FY-4B/GIIRS is 12 km, the spectral resolution is 0.625 cm−1, and the spectral range is 680–2250 cm−1. It can complete a scan of the entire national region in about 2 h [1]. Compared with polar-orbiting sounders, the “high frequency, wide coverage, and multi-band” capability of GIIRS provides extremely favorable conditions for tracking the evolution of the thermal structure of severe weather systems [11]. For example, Maier et al. [12] fused GIIRS data with polar-orbiting hyperspectral sounder data and surface observations and captured the rapid evolution of convective instability in Hong Kong.
Direct assimilation of GIIRS radiance data into NWP is currently the mainstream approach and has achieved valuable results. Chen et al. [13] jointly assimilated all-sky FY-4B AGRI (Advanced Geostationary Radiation Imager) and clear-sky GIIRS radiances, combining GIIRS’s temperature profiling with AGRI’s humidity advantages to improve typhoon track, intensity, and precipitation forecasts. Zhang et al. [1] improved the track forecast of Typhoon In-Fa (2021) by assimilating GIIRS longwave channel data, and the simulations of the typhoon’s warm core, vortex structure, and spiral rainbands were more reasonable.
Indirect assimilation refers to the assimilation of retrieved products from satellite radiance data, such as temperature and humidity profiles, into numerical models. Compared with direct radiance assimilation, indirect assimilation offers three advantages under certain conditions: (1) the observation operator is merely spatial interpolation rather than a radiative transfer model, which substantially lowers the technical threshold and computational cost for applying satellite data assimilation in operational regional mesoscale NWP systems [14]; (2) quality control of retrieved profiles is generally easier, since such products usually include quality flags [15]; and (3) the observation error characteristics of retrieved profiles are easier to quantify through independent comparisons with radiosondes or reanalysis [15,16].
It should be noted, however, that direct assimilation is not free of challenges, since it also relies on radiative transfer, cloud detection, and bias correction, and the treatment of cloud-affected radiances remains imperfect. The key question for indirect assimilation is therefore not whether it is inherently superior, but whether the retrieved profiles are sufficiently accurate and whether their observation errors can be reliably quantified. The higher the retrieval accuracy, the more effective information is provided to the assimilation system, and a reasonable specification of observation errors can effectively suppress erroneous information from being absorbed into the analysis. If the two are appropriately matched, assimilating retrieved profiles is a rational and cost-effective choice, especially for regional operational systems where building and maintaining a full radiative transfer and bias-correction infrastructure requires substantial resources.
With advances in retrieval technology, the accuracy of retrieved products has markedly improved, making indirect assimilation an important research direction. Song et al. [16] conducted a detailed study on the reliability of mainstream satellite-retrieved profiles and pointed out that the root-mean-square error (RMSE) of temperature profiles ranges from 0.75 to 2.68 K, and the relative error of humidity profiles ranges from 13.72% to 24.73% regardless of cloud conditions. Many valuable results have also been produced in GIIRS retrieval algorithms. Cai et al. [17] used an artificial neural network to retrieve clear-sky humidity profiles with a relative error of about 6% in the troposphere. Huang et al. [18,19] combined neural network and 1D-variational methods to markedly improve the accuracy of clear-sky GIIRS-retrieved temperature and humidity profiles, with an average temperature error of less than 2 K and a humidity RMSE of less than 8.2% between 250 and 600 hPa. Hao et al. [20] used a radial basis function neural network to retrieve GIIRS temperature and humidity profiles, reducing their RMSE relative to the background field by approximately 39% and 22.3% under clear-sky conditions and by 38.5% and 15.3% under cloudy conditions, respectively. The accuracy of the GIIRS-retrieved profiles used in this study is described in detail in Section 2.1.
Many studies have been carried out on assimilating GIIRS-retrieved profiles. Smith et al. [21] jointly assimilated polar-orbiting hyperspectral and GIIRS-retrieved profiles, and markedly improved precipitation and tornado forecasts for severe convective weather. Yang et al. [2] assimilated GIIRS-retrieved temperature and humidity profiles, and reduced the average track error of Typhoons Chaba and Ma-on (2022) by about 13.87%, with improvements in typhoon intensity and precipitation forecasts. Zhang et al. [22] showed that assimilating GIIRS-retrieved humidity profiles can increase the average threat score (TS) of moderate and above precipitation by 44%.
Infrared radiation cannot penetrate clouds; therefore, retrieval accuracy is relatively high under clear-sky conditions and above the cloud top in cloudy regions, but the retrieved data below the cloud top are less reliable [23]. Consequently, the feasibility of integrating clear-sky and cloudy-sky retrieved profiles for assimilation needs to be tested. To date, the assimilation effects of GIIRS-retrieved profiles under different cloud conditions and their respective contributions to typhoon track, intensity, and precipitation forecasts still lack verification.
In July 2025, Typhoon Danas (No. 2504), Typhoon Francisco (No. 2507), and Typhoon Co-may (No. 2508) directly affected Zhejiang successively. Their track patterns, intensity evolutions, and wind and rain impacts were clearly different. Danas was strong (maximum wind of up to 45 m/s, central pressure of about 950 hPa) and made landfall along the southeastern coast of Zhejiang with a large-angle turning track. Francisco had a westward track, weakened near the coast of Zhejiang, and mainly affected the central and southern coasts of Zhejiang. Co-may had a northwestward track and made landfall in Zhejiang as a severe tropical storm (maximum wind speed of about 25–28 m/s), bringing widespread heavy rain to northeastern Zhejiang.
The three typhoon cases described above are typical and diverse, providing a good basis for systematically conducting assimilation and sensitivity experiments. On this basis, this study uses the FY-4B/GIIRS-retrieved temperature and humidity profile products provided by the China Meteorological Administration (CMA) to conduct experiments, focusing on the effects of assimilating retrieved profiles under clear-sky, cloudy-sky, and all-sky conditions on the errors of the typhoon vortex and environmental field, as well as on typhoon track, intensity, and precipitation forecasts, so as to provide a scientific reference for the application of GIIRS-retrieved profile products in operational typhoon forecasting.
The remainder of this paper is organized as follows: Section 2 introduces the data, numerical model, assimilation system, and methods. Section 3.1 analyzes the statistical characteristics of O − B and O − A. Section 3.2 analyzes the effects of assimilating GIIRS-retrieved profiles on the typhoon vortex and environmental field. Section 3.3 analyzes the effects of assimilating GIIRS-retrieved profiles on typhoon intensity, track, and precipitation forecasts. Section 4 presents the discussion, and Section 5 gives the conclusions.
2. Materials and Methods
2.1. GIIRS-Retrieved Temperature and Humidity Profiles
The temperature and humidity profiles used in this study are retrieved from FY-4B/GIIRS by the CMA using the Dual-Regression (DR) algorithm [23]. The DR algorithm runs clear-trained and cloud-trained regressions simultaneously for the same observation and combines them at the thermal cloud top. The cloud-trained regression is performed separately for eight cloud-height classes, each producing a cloud-height estimate and a profile; the two classes whose cloud-height estimates are closest to their class medians are combined into a representative cloud-trained profile. The thermal cloud top is then determined by comparing the clear-trained and cloud-trained temperature retrievals. The clear-trained result is used above the thermal cloud top, and the cloud-trained result below it. For the GIIRS operational product, only retrievals above the thermal cloud top are retained under cloudy conditions, since no observational information is available below opaque clouds [24]. Only profiles with quality flags of “very good” and “good” are used in this study.
The spatial resolution of the GIIRS-retrieved profiles is about 12 km, with 101 pressure levels in the vertical direction. According to Zhu et al. [15], using ERA5 (the fifth-generation European Centre for Medium-Range Weather Forecasts atmospheric reanalysis) as a reference, the RMSE of GIIRS-retrieved temperature profiles under clear-sky conditions is mostly below 1.6 K, and that under cloudy conditions is about 1.6–2.4 K. The all-sky specific humidity bias is mainly −0.8 to −0.4 g kg−1 below 500 hPa, with underestimation under cloudy conditions, and the RMSE increases with decreasing height.
It should be noted that “all-sky” in this study denotes the combined assimilation of GIIRS-retrieved clear-sky profiles and cloudy-sky profiles above the thermal cloud top. This is conceptually different from all-sky radiance assimilation, in which cloud-affected radiances are directly assimilated using a radiative transfer model.
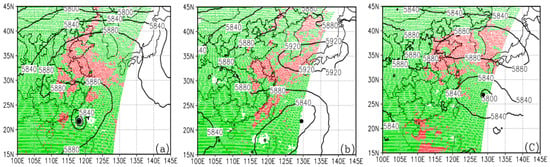
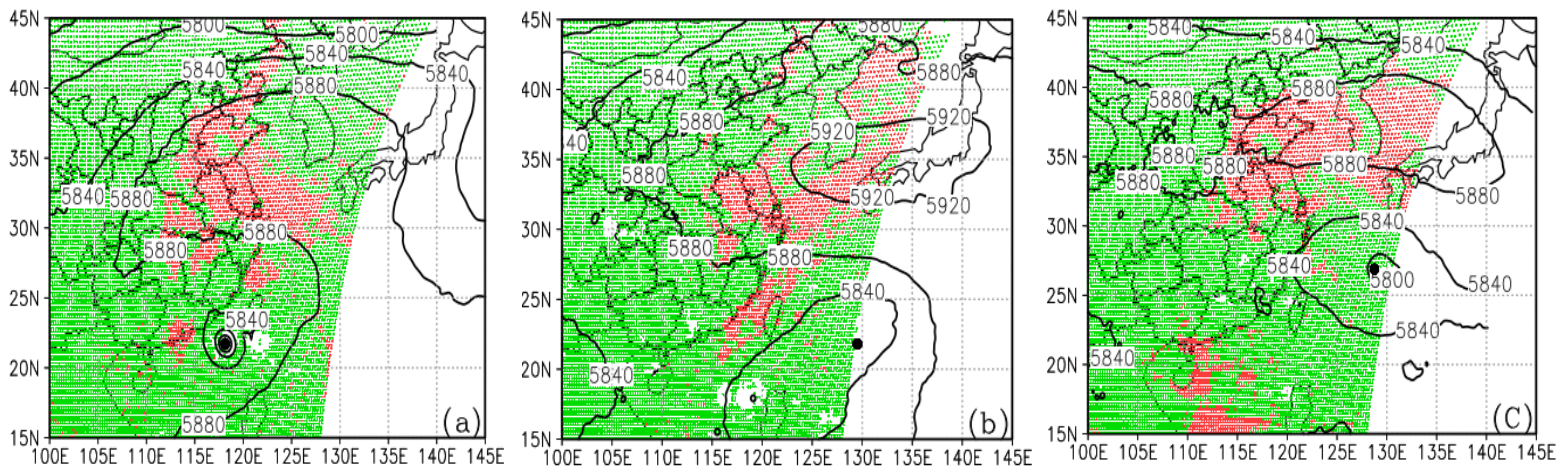
The initial simulation times of Typhoons 2504, 2507, and 2508 are 0000 UTC 6 July, 1200 UTC 23 July, and 1200 UTC 27 July 2025, respectively, and the corresponding spatial distributions of clear-sky and cloudy-sky retrieved profiles within the assimilation time windows are shown in Figure 1. The clear-sky retrieved profiles are mainly distributed inside the Western Pacific Subtropical High (WPSH), and their number is much smaller than that of cloudy-sky retrieved profiles. Typhoon 2504 is relatively strong, with a small number of clear-sky retrieved profiles nearby; Typhoons 2507 and 2508 are weaker and located at the boundary of the retrieved profile region. There are also relatively large areas of cloudy-sky retrieved profiles inside the 5880 gpm contour, indicating that assimilating cloudy-sky profiles may directly affect the WPSH.
Figure 1.
Spatial distributions of clear-sky (red dots) and cloudy-sky (green dots) GIIRS-retrieved profiles within ±1 h of the initial times of Typhoons 2504 (a), 2507 (b), and 2508 (c), together with the 500 hPa geopotential height (units: gpm) of the control experiment. The black dots denote the typhoon positions.
2.2. Typhoon and Precipitation Observations
The data used for verifying typhoon track and intensity forecasts in this study are from the western North Pacific tropical cyclone best track dataset [25] released by the Shanghai Typhoon Institute of the China Meteorological Administration. This dataset is one of the data sources for the International Best Track Archive for Climate Stewardship. The data periods used in this study are 72 h from the respective initial simulation times.
The precipitation observations used for verification are the hourly precipitation data from the China surface automatic weather station dataset developed by the National Meteorological Information Center. The observation stations cover the whole of Zhejiang Province, with an average spacing of about 5 km. All precipitation observation data have undergone strict quality control, ensuring the reliability and accuracy of the data [26].
A total of 7666 surface stations were used for precipitation verification within the region of 27.0–31.5°N, 117.5–123.0°E, covering Zhejiang Province and its adjacent areas. The 24 h accumulated precipitation was selected for each typhoon during the period when it most severely affected Zhejiang Province. These periods covered the times when each typhoon approached the Zhejiang coast and made landfall. The selected periods are 0000 UTC 8 July to 0000 UTC 9 July, 0000 UTC 25 July to 0000 UTC 26 July, and 1200 UTC 29 July to 1200 UTC 30 July, corresponding to forecast lead times of 72 h, 60 h, and 72 h, respectively.
2.3. Initial Field Data, Numerical Model, and Assimilation System
The initial and boundary conditions for the control experiment are derived from the NCEP GDAS/FNL 0.25° global tropospheric analyses and forecast grids. This reanalysis system does not assimilate radiance observations from China’s FY-4B GIIRS, ensuring that the control experiment remains independent of the GIIRS observations evaluated in this study.
The numerical model used is the Weather Research and Forecasting (WRF) Model Version 4.1, whose main configuration is summarized in Appendix A. A two-way interactive moving nested grid technique is adopted, consisting of a 9 km parent domain and a 3 km child domain that follows the typhoon vortex. Different tracking pressure levels are used for typhoons of different intensities: 850 hPa for the relatively strong Typhoon 2504, which passes over Taiwan Island with a deep structure, and 985 hPa and 950 hPa for the weaker Typhoons 2507 and 2508, respectively.
For data assimilation, we use the Gridpoint Statistical Interpolation (GSI) assimilation system developed by NCEP, with its main configuration summarized in Appendix A. The background error covariance matrix (B matrix) is the default generic matrix of GSI. Constructing a typhoon-specific B matrix is a complex and systematic task that is beyond the core objective of this study. Therefore, using the widely tested and operationally verified generic B matrix as the basic configuration for evaluating the impact of GIIRS-retrieved profile assimilation on typhoon forecasts is a reasonable and robust choice.
In addition, since the 12 km GIIRS-retrieved profiles are finer than the ~25 km NCEP background field, thinning was not applied so as to retain their higher-resolution information for the 9 km outer domain of the WRF model used in this study.
2.4. Observation Errors of GIIRS-Retrieved Profiles
In addition to the quality control performed using the quality flags attached to the GIIRS-retrieved profiles, further quality control is carried out by the “obsproc” module of the WRF model in the same manner as for conventional radiosonde data, but with different observation error values. The reasonable specification of observation errors is one of the key factors determining the effectiveness of assimilating GIIRS-retrieved profiles. In this study, drawing on the Desroziers method [27], the observation errors were estimated iteratively as follows:
where O − B and O − A are the observation-minus-background and observation-minus-analysis produced by the assimilation system, respectively; ‖∙‖2 is the Euclidean norm; and n is the number of samples. The initial observation errors were set to 1.0 K for temperature and 10.0% for relative humidity. Table 1 presents the observation errors of the retrieved profiles obtained by this method.
Table 1.
Observation errors of GIIRS-retrieved profiles.
Equation (1) follows the Desroziers relation but geometrically neglects the cosine of the angle between the O − B and O − A vectors; it therefore provides a conservative upper bound of the strict Desroziers estimate, because this estimate is derived under the assumptions of linear estimation theory and of uncorrelated observation and background errors, which are not strictly satisfied for the retrieved profiles, whose errors may be correlated with the background field.
It should be noted that the observation errors of the GIIRS-retrieved profiles presented above are obtained without distinguishing land and ocean samples. However, the preliminary results of this experiment indicate that, in the near-surface layer (1000–800 hPa for temperature and 1000–900 hPa for humidity), the temperature observation errors over land are slightly larger than those over ocean (by 0.06–0.09 K for clear sky and 0.15–0.29 K for cloudy sky), whereas the humidity observation errors are slightly larger over ocean (by 0.6–1.0% for clear sky and 1.1–1.2% for cloudy sky, relative to the saturation specific humidity). These differences are generally modest relative to the total observation errors. A detailed study of the land–ocean difference in the observation errors of the retrieved profiles will be carried out in future work.
2.5. Design of Sensitivity Experiments and Vortex Relocation Method
To investigate the impact of assimilating GIIRS-retrieved profiles on the typhoon vortex and environmental field, and to identify the main sources of errors affecting typhoon track, intensity, and precipitation, we designed the following sensitivity experiments. Scheme 1: Three forecast experiments using the initial fields obtained from clear-sky, cloudy-sky, and all-sky GIIRS-retrieved profile assimilation, respectively; these experiments are hereafter referred to as Clear1, Cloudy1, and All-sky1. Scheme 2: Three experiments in which the typhoon vortex in the control experiment’s initial field is replaced by the typhoon vortex from each of the three assimilation initial fields, respectively; these experiments are hereafter referred to as Clear2, Cloudy2, and All-sky2. Scheme 3: Three experiments in which the typhoon vortex in each of the three assimilation initial fields is replaced by that from the control experiment’s initial field; these experiments are hereafter referred to as Clear3, Cloudy3, and All-sky3. Schemes 2 and 3 are sensitivity experiments based on vortex relocation. They have two objectives: (1) to determine whether assimilating GIIRS-retrieved profiles improves the typhoon structure and the large-scale environmental field, and (2) to attribute typhoon track forecast errors to typhoon versus environmental field errors.
The typhoon vortex is defined as the region within a radius of 8 × RMW centered on the typhoon eye [28,29], where RMW is the radius of maximum wind of the typhoon. A total of 16 variables are replaced: 3D mass-grid variables (T, QVAPOR, P, PB, QCLOUD, QRAIN, QICE, QSNOW, QGRAUP), 2D mass-grid variables (MU, MUB, PSFC), and staggered variables (U, V, PH, W). Blending is applied only in a 15-grid-point buffer zone, and the blended value is computed by Equation (2). No explicit balance adjustment is applied because both donor and host fields are already dynamically balanced; sensitivity tests with buffer widths of 10–15 grid points confirm no significant relocation artifacts and little impact on forecast results.
where d is the distance (in grid points) from the grid point to the edge of the core region, and D is the buffer width (set to 15 grid points in this study). ϕdonor is the variable from the donor experiment that provides the typhoon vortex, and ϕhost is the variable from the host experiment that provides the large-scale environment.
2.6. Precipitation Verification Methods
To quantitatively evaluate the impact of GIIRS-retrieved profile assimilation on 24 h accumulated precipitation forecasts of typhoons, the threat score (TS) and bias score (BS) are used and defined as follows:
where H is the number of hits (events correctly forecast and observed), F is the number of false alarms (events forecast but not observed), and M is the number of misses (events observed but not forecast).
3. Results
3.1. Statistical Analysis of O − B and O − A
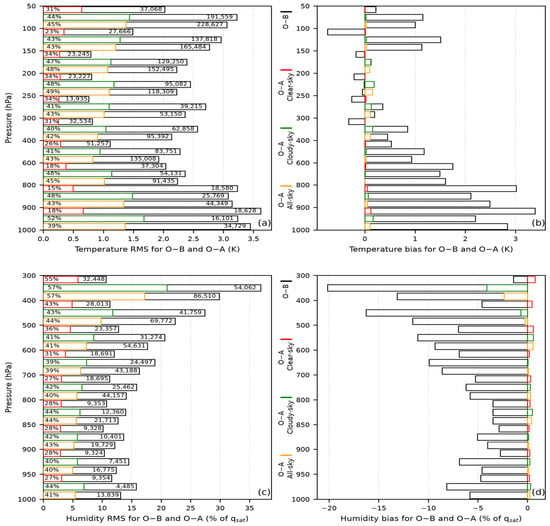
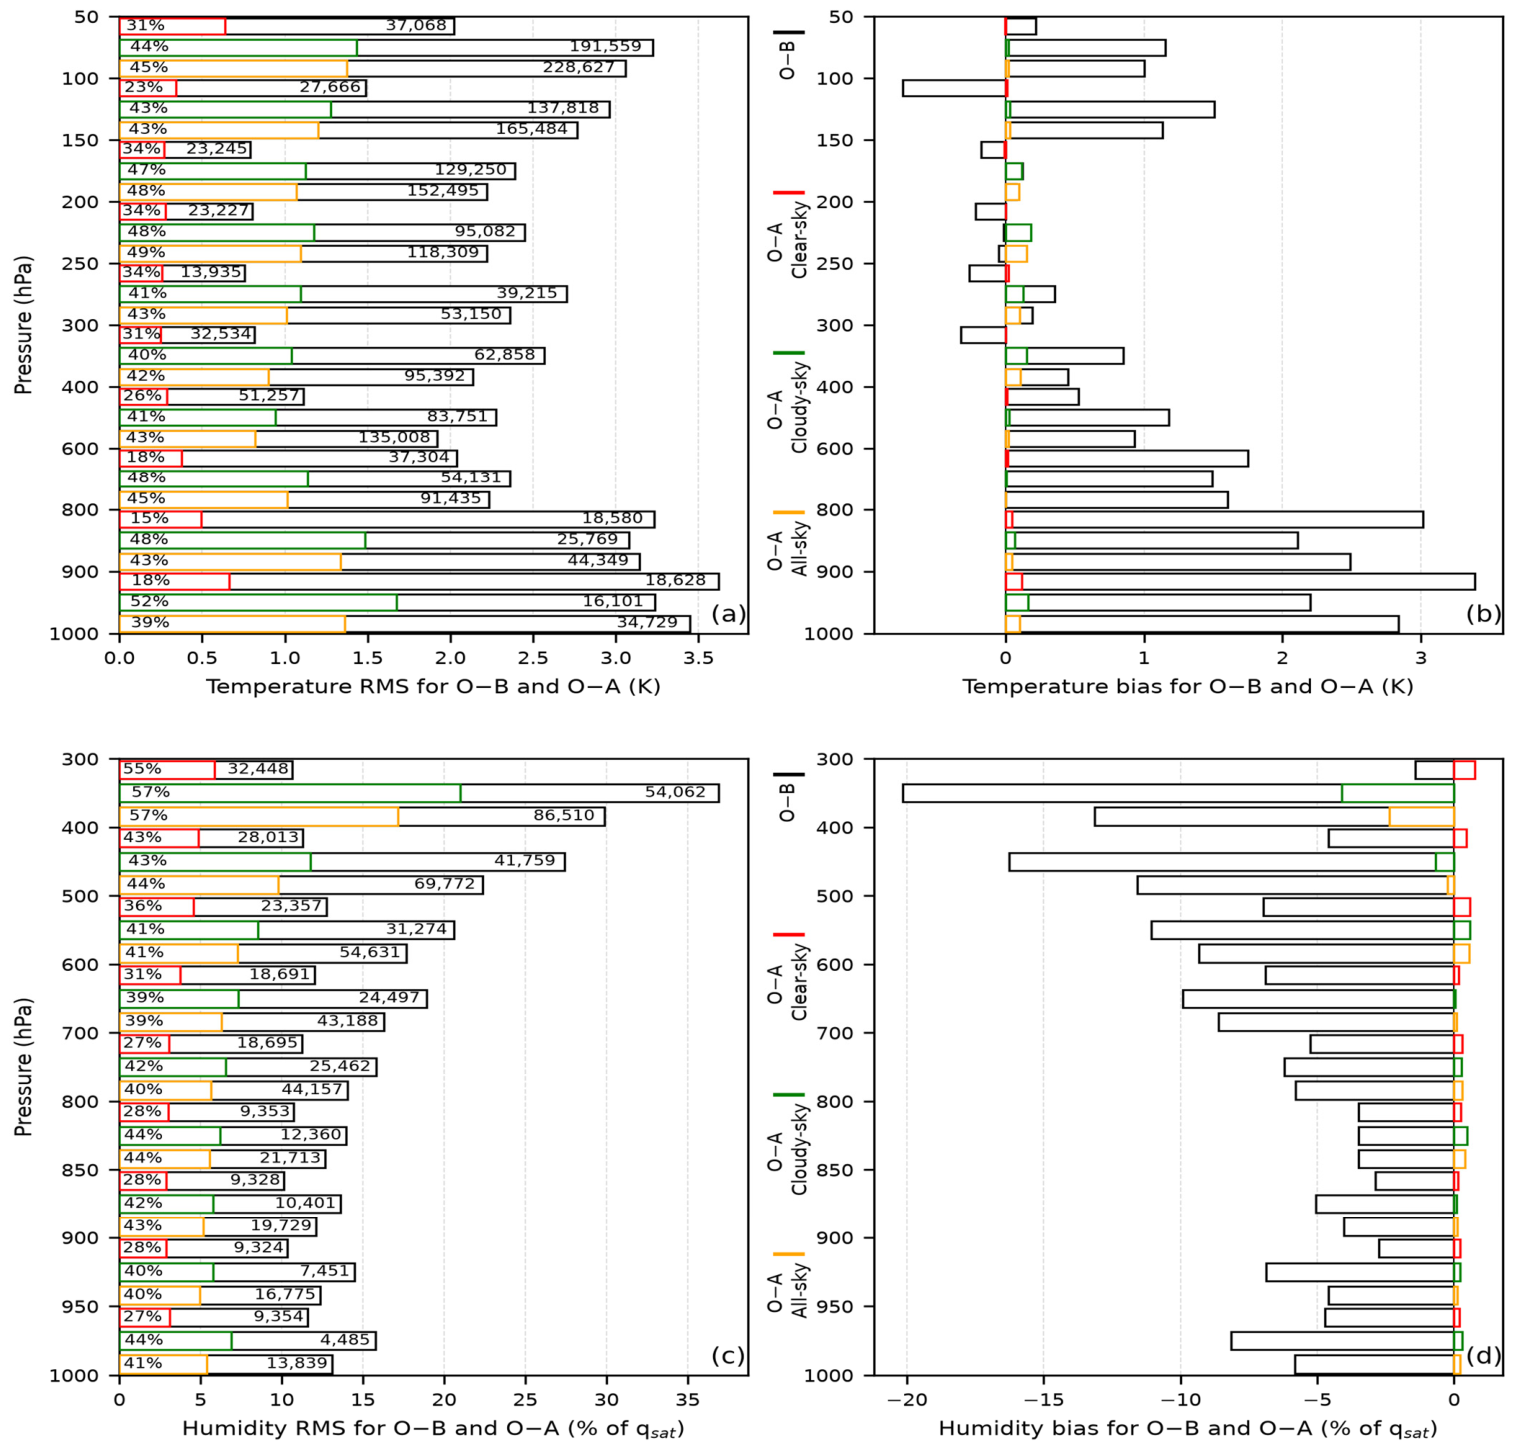
To quantitatively evaluate the absorption of GIIRS-retrieved profiles by the GSI assimilation system, the O − B and O − A statistics from the three typhoon experiments are merged for temperature and humidity, as shown in Figure 2.
Figure 2.
RMS and bias of O − B and O − A, merged from the three typhoon cases. (a,b) Temperature and (c,d) humidity over 10 and 9 pressure intervals, respectively. Humidity O − B and O − A are normalized by the background saturation specific humidity (qsat) following the GSI convention. In each O − B bar, the right-hand number is the sample count and the percentage near the y-axis is the O − A/O − B RMS ratio. Colored edges denote the three assimilation types.
Figure 2a shows that the temperature RMS of O − B is relatively small between 600 and 150 hPa; Figure 2b shows that the temperature O − B bias in this layer is both positive and negative. Below 600 hPa and above 150 hPa, the RMS of O − B is noticeably larger, and the O − B bias is predominantly positive, indicating that the background temperature is lower than that of the retrieved profiles. In addition, the O − B RMS for clear-sky retrieved profiles above 600 hPa is relatively small, indicating that their temperatures are closer to the background. After profile assimilation, the RMS of O − A is markedly smaller than that of O − B. After assimilating clear-sky, cloudy-sky, and all-sky profiles, the RMS ratios of O − A to O − B are 15–34%, 40–52%, and 39–48%, respectively, and the bias approaches zero, indicating that a large amount of temperature information from the retrieved profiles has been incorporated into the analysis field.
Figure 2c shows that below 600 hPa, the normalized humidity RMS of O − B is about 15%; Figure 2d shows that the O − B bias is negative at all pressure levels, indicating a wetter background than the retrieved profiles. After assimilation, the humidity O − A bias approaches 0% in all pressure intervals, and the O − A-to-O − B RMS ratios for the three types of retrieved profiles are 27–55%, 39–57%, and 39–57%, respectively, indicating that a large amount of humidity information, including that from cloudy-sky retrieved profiles, has been incorporated into the analysis field.
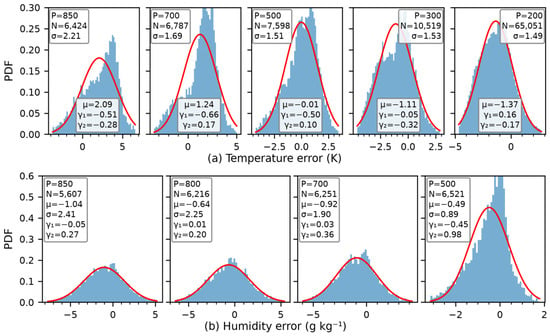
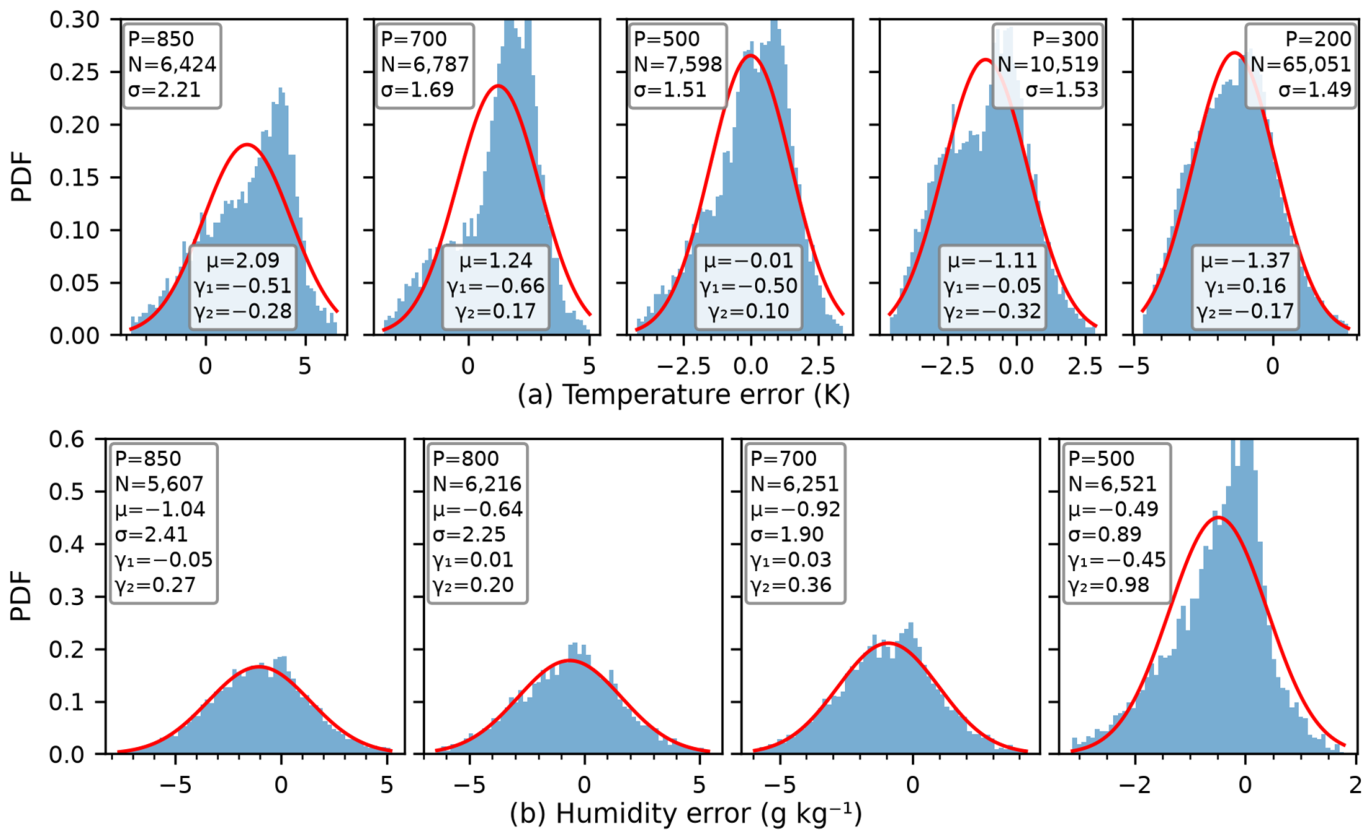
Clouds, especially heavy clouds, severely degrade the accuracy of the retrieved profiles; it is therefore necessary to understand the error structure of the GIIRS-retrieved profiles in cloudy regions. Using the ERA5 as a reference, this study examines the errors of the GIIRS-retrieved profiles under heavy-cloud conditions as an example. Figure 3 presents the probability density functions (PDFs) of the observation errors (GIIRS − ERA5) of temperature and humidity, integrated over the three typhoons. The distributions are approximately Gaussian, with moderate skewness (|γ1| ≤ 0.66 for temperature and ≤0.45 for humidity) and the excess kurtosis (γ2) close to zero for temperature and below unity for humidity. The temperature bias is vertically structured, being warm below 700 hPa (+1.2 to +2.1 K), nearly unbiased at 500 hPa, and cold at 300–200 hPa (−1.1 to −1.4 K). By contrast, the humidity is systematically drier (−0.5 to −1.0 g kg−1). These biases remain within about one observation error (Table 1), similar to conventional radiosonde observations. Notably, at 500 hPa the retrievals are nearly unbiased against ERA5 (Figure 3, μ ≈ −0.01 K), whereas the mean innovation (O − B) is about +1.2 K (Figure 2), implying that the background is about 1.2 K colder than ERA5 and that the GIIRS profiles act to correct the background cold bias in the mid-troposphere. In addition, because the observation errors of the retrieved profiles are conservatively estimated, the retrieved profile biases are not explicitly corrected.
Figure 3.
Probability density functions (PDFs) of the observation errors (GIIRS − ERA5) of (a) temperature and (b) humidity under heavy-cloud conditions, integrated over the three typhoons. The red curve is the Gaussian fit with the same mean and standard deviation. P, N, μ, σ, γ1, and γ2 denote the pressure, sample size, mean, standard deviation, skewness, and excess kurtosis, respectively.
3.2. Impact of Assimilating GIIRS-Retrieved Profiles on the Model Initial Field
3.2.1. Impact of Assimilating GIIRS-Retrieved Profiles on the Typhoon Temperature Field
To understand the impact of assimilating GIIRS-retrieved profiles on the temperature and humidity structures of typhoons, we follow the methods of Wang et al. [28] and Deng et al. [29] and statistically analyze the temperature and humidity increments in the typhoon inner-core region (0–2 RMW), rainband region (2–4 RMW), and outer-environment region (4–8 RMW) of the initial field.
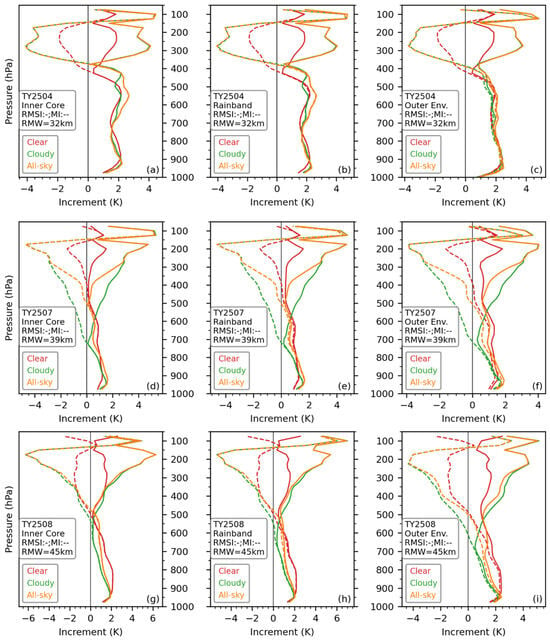
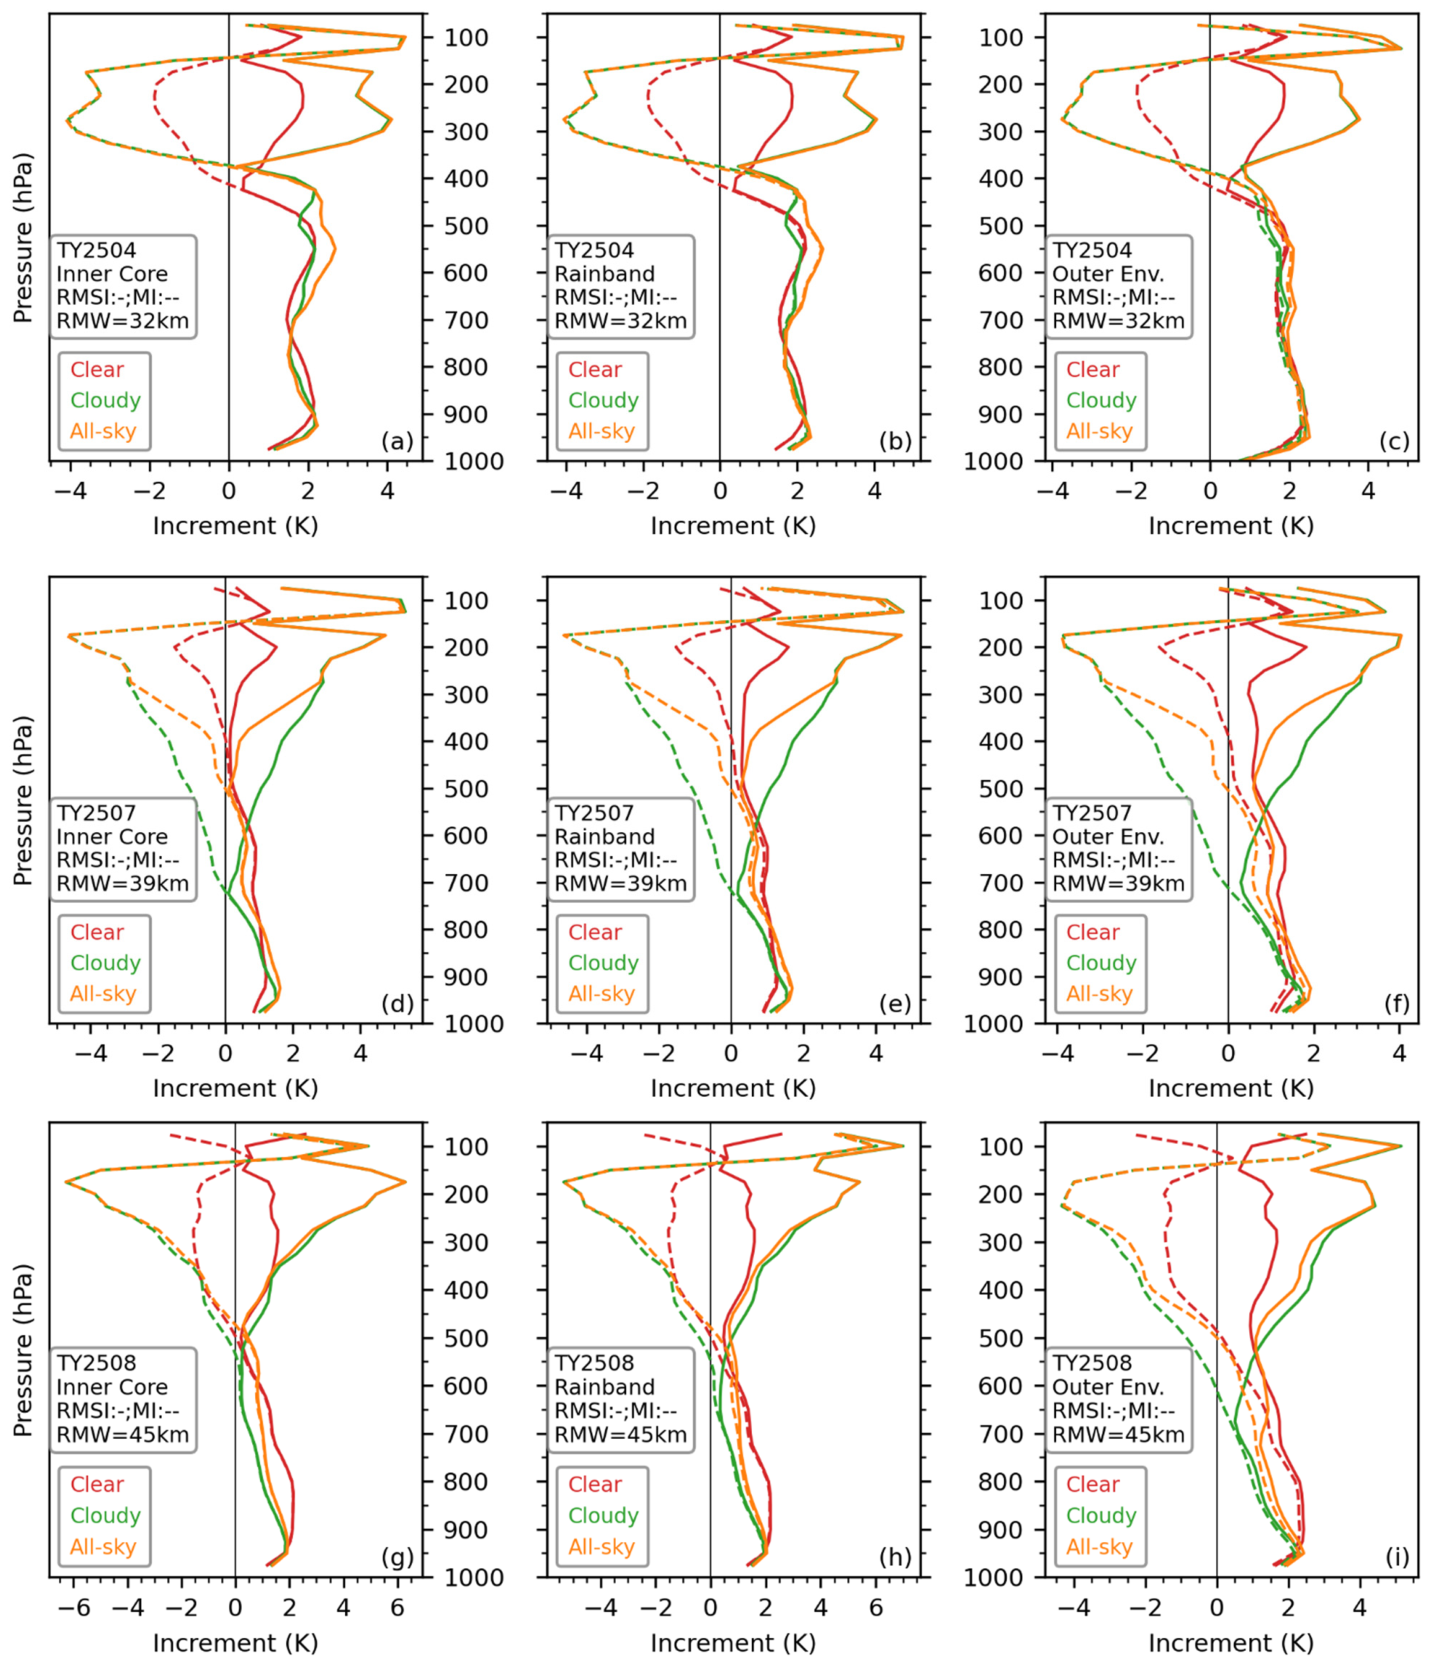
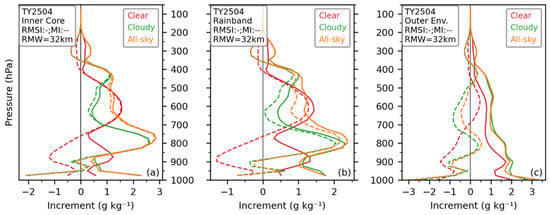
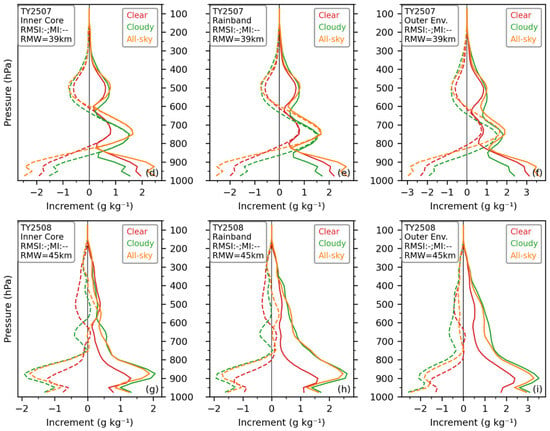
Although GIIRS-retrieved clear-sky profiles are mainly distributed inside the WPSH, they can still produce marked indirect thermal responses in the typhoon inner-core region through the horizontal correlation of the B matrix in the GSI system [13]. For Typhoons 2504 and 2508, the root-mean-square increment (RMSI) and mean increment (MI) of temperature for each profile type exhibit relatively consistent structures in the inner core, rainband, and outer environment (Figure 4). With 400 hPa and 500 hPa as dividing levels, cooling occurs above and warming below. The cooling magnitude is larger and increases first and then decreases with height. For the cloudy-sky assimilation of Typhoon 2507, 700 hPa is the dividing level for warming and cooling, while for the clear-sky and all-sky assimilation, 500 hPa is the dividing level (Figure 4d–f).
Figure 4.
Root-mean-square increment (RMSI, solid lines) and mean temperature increment (MI, dashed lines) produced by assimilating clear-sky, cloudy-sky, and all-sky retrieved profiles in the typhoon inner-core (a,d,g), rainband (b,e,h), and outer-environment (c,f,i) regions.
A notable feature is that, regardless of the inner-core, rainband, or outer-environment region, the temperature RMSI and MI produced by assimilating the three types of profiles are nearly equal in magnitude. This indicates systematic warming and cooling at different pressure levels of the typhoon. In terms of temperature RMSI, the cooling magnitude produced by clear-sky assimilation in the middle and upper troposphere is similar to the warming magnitude in the lower and middle troposphere. In contrast, the cooling magnitude produced by cloudy-sky and all-sky assimilation in the middle and upper troposphere is almost twice the warming magnitude in the lower and middle troposphere.
In addition, the effects of all-sky and cloudy-sky assimilation on the temperature field above 300 hPa are almost identical. Clear-sky data are mainly distributed inside the WPSH and can only affect the typhoon temperature and humidity structures through the B matrix, whereas cloudy-sky GIIRS-retrieved profiles provide a large amount of temperature and humidity information above the typhoon cloud top for the assimilation system. This is why the temperature RMSI and MI differ greatly between the middle–upper and lower–middle troposphere.
Another notable feature is that, for the same type of retrieved profile, the RMSI and MI in the inner-core, rainband, and outer-environment regions are very similar, indicating that the temperature adjustment from assimilating GIIRS-retrieved profiles exhibits systematic characteristics and is not affected by local structural differences in the typhoon.
3.2.2. Impact of Assimilating GIIRS-Retrieved Profiles on the Typhoon Humidity Field
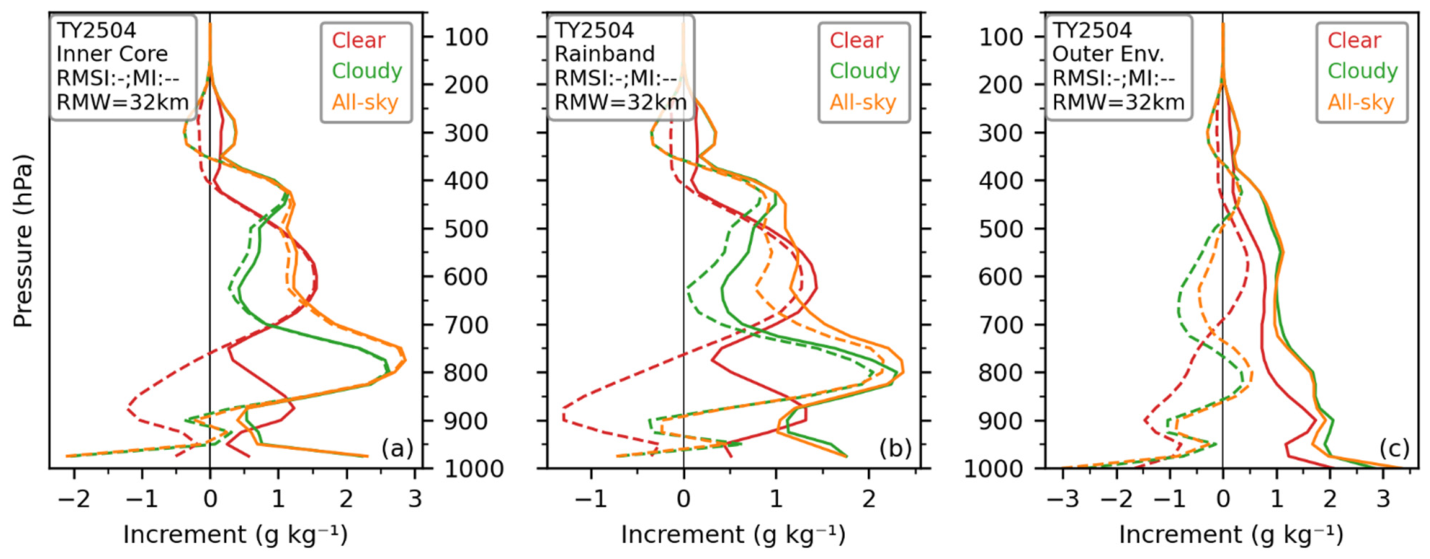
Figure 5 shows that assimilating GIIRS-retrieved profiles has a very marked impact on the humidity structure of the three typhoons. For Typhoon 2504, a notable feature is that between 400 and 900 hPa, the RMSI and MI of cloudy-sky and all-sky assimilation almost coincide, with a peak near 800 hPa (Figure 5a,b), indicating that moisture in this deep layer, especially at 800 hPa, is markedly increased. The RMSI and MI of clear-sky assimilation also almost coincide between 400 and 750 hPa, but the peak is about 1.5 g kg−1, which is markedly weaker than the moistening effect produced by cloudy-sky and all-sky assimilation.
Figure 5.
Root-mean-square increment (RMSI, solid lines) and mean humidity increment (MI, dashed lines) produced by assimilating clear-sky, cloudy-sky, and all-sky retrieved profiles in the typhoon inner-core (a,d,g), rainband (b,e,h), and outer-environment (c,f,i) regions.
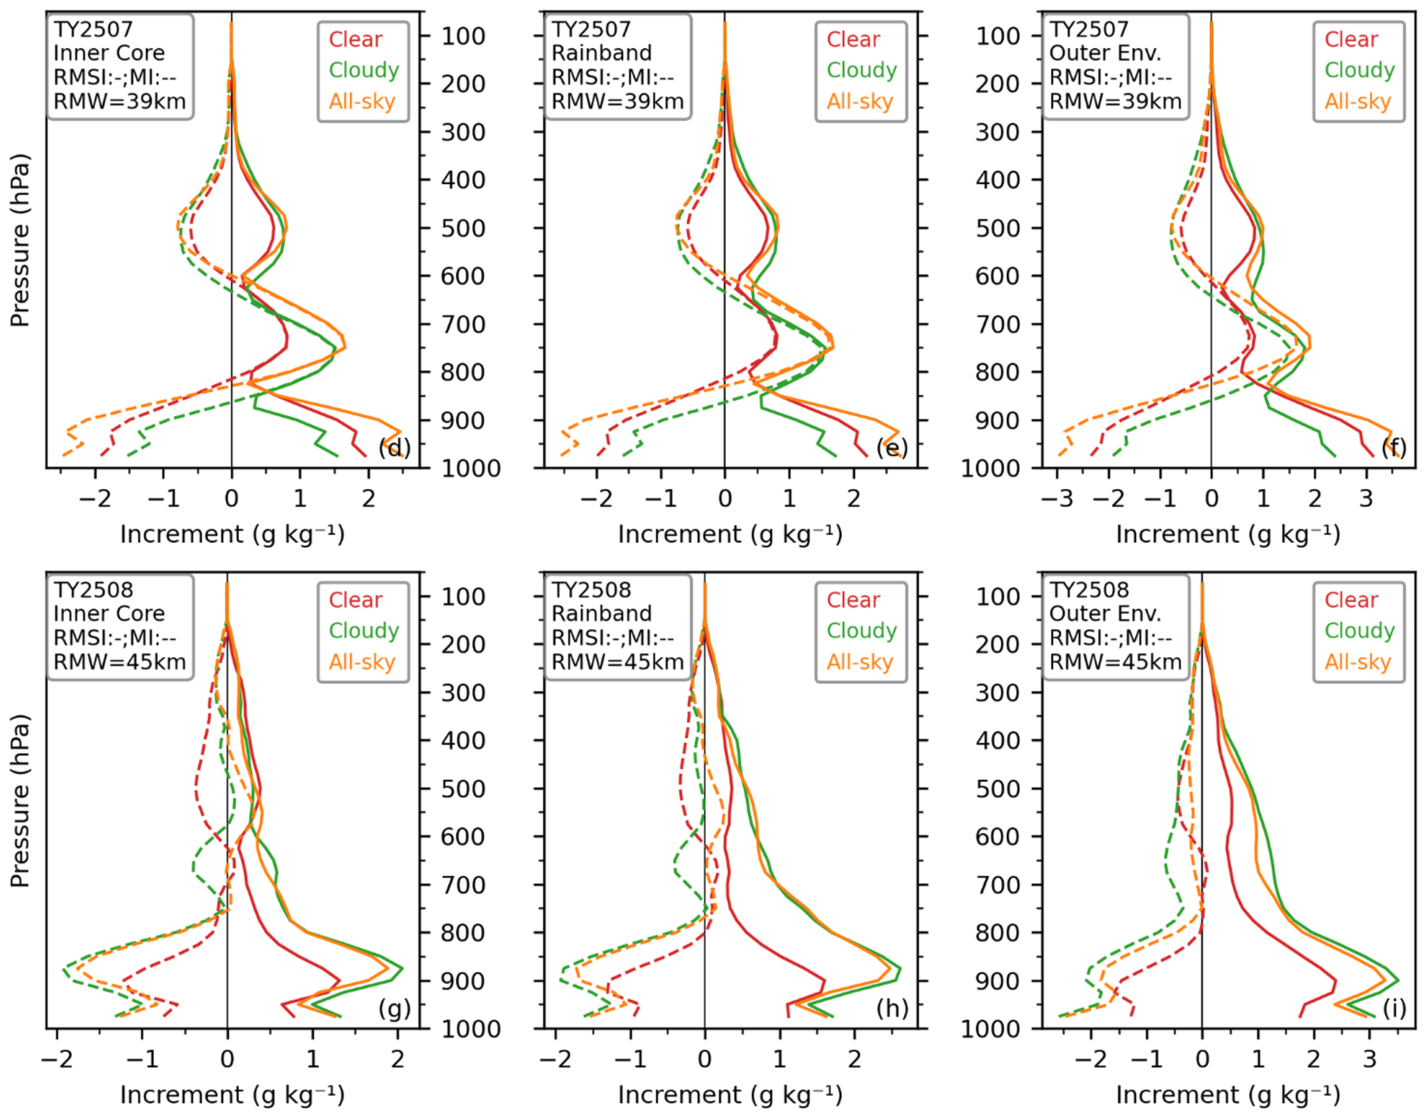
For Typhoon 2507, there is a positive peak region between 600 and 800 hPa where the RMSI and MI curves coincide (Figure 5d–f), with a maximum of about 1.5 g kg−1, indicating a marked increase in moisture in this layer. At other levels, MI is negative, especially in the lower layer, indicating the largest decrease in low-level moisture. Figure 5g–i show that for Typhoon 2508, the three MI curves are near 0 g kg−1 above 700 hPa and become more negative below 700 hPa, and are basically symmetric with the RMSI, indicating that moisture below 700 hPa decreases.
Similar to the temperature RMSI and MI patterns of the three typhoons, regardless of the inner-core, rainband, or outer-environment region, the humidity RMSI and MI produced by assimilating the three types of profiles are also very close in magnitude, indicating that assimilation produces systematic moistening and drying at different pressure levels of the typhoon. Another notable feature is that all three types of profile assimilation reduce moisture below 900 hPa, and the moisture in the typhoon outer environment is generally reduced (Figure 5c,f,i), with the largest reduction in the low layer.
The lower and middle troposphere is the key layer for moisture transport. Figure 5 shows that in the typhoon inner core and rainband, the RMSI of cloudy-sky and all-sky assimilation has moistening peaks in the middle and lower layers for Typhoons 2504 and 2507 and drying peaks for Typhoon 2508, indicating that assimilating moisture profiles above the cloud top still has a marked impact on lower and middle tropospheric moisture.
3.2.3. Impact of Assimilating GIIRS-Retrieved Profiles on the WPSH
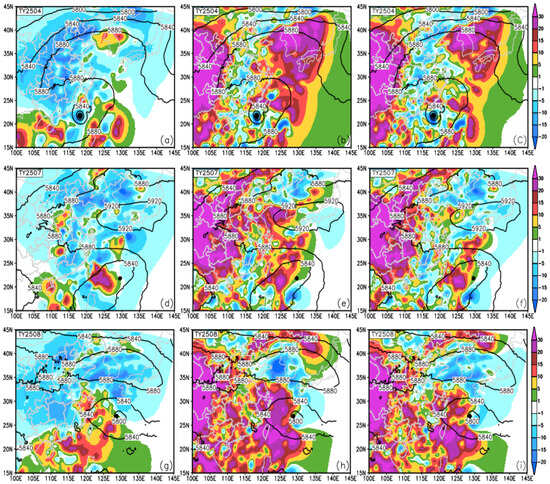
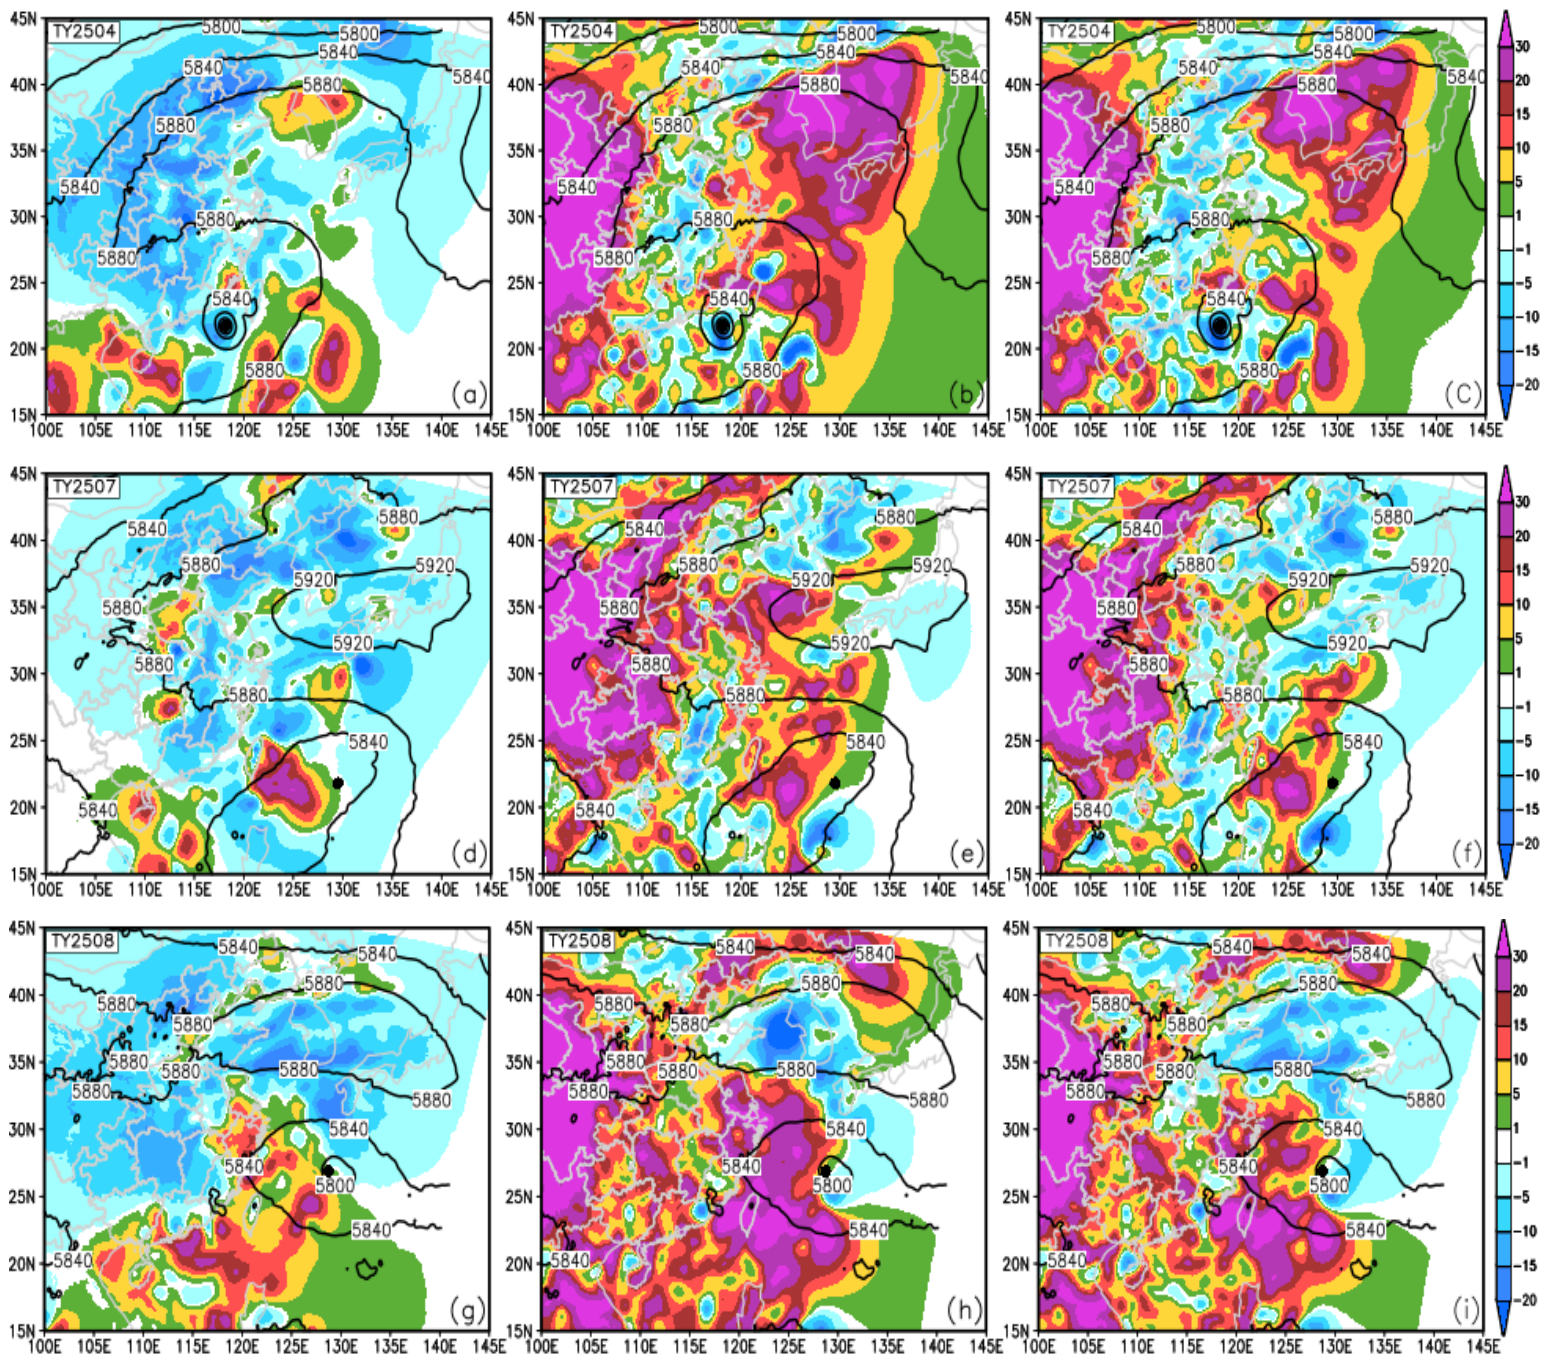
The Western Pacific Subtropical High (WPSH) is a key weather system affecting typhoon motion. Inside the 5880 gpm contour, the number of clear-sky retrieved profiles is somewhat larger than that of cloudy-sky retrieved profiles (Figure 1). Assimilation of both types of data has a marked impact on the WPSH. Overall, clear-sky assimilation slightly weakens the WPSH (Figure 6a,d,g), with a small area of increased height at the edge of the 5880 gpm contour. Cloudy-sky assimilation has a greater impact on the WPSH than clear-sky assimilation. It markedly strengthens the WPSH for Typhoon 2504 (Figure 6b,c), weakens the northern side of the WPSH for Typhoon 2507 with the ridge line extending westward to the west of 100°E (Figure 6e,f), and causes westward extension and reduced central intensity of the WPSH for Typhoon 2508. In addition, because the number of cloudy-sky retrieved profiles is relatively large, the height increments of all-sky assimilation and cloudy-sky assimilation are relatively similar.
Figure 6.
Background 500 hPa geopotential height (units: gpm) and height increments (shaded) from assimilating GIIRS-retrieved clear-sky (a,d,g), cloudy-sky (b,e,h), and all-sky (c,f,i) profiles. Typhoon numbers are marked in the upper-left corner of each panel; the black dot denotes the typhoon center.
3.2.4. Impact of Assimilating GIIRS-Retrieved Profiles on 850 hPa Moisture
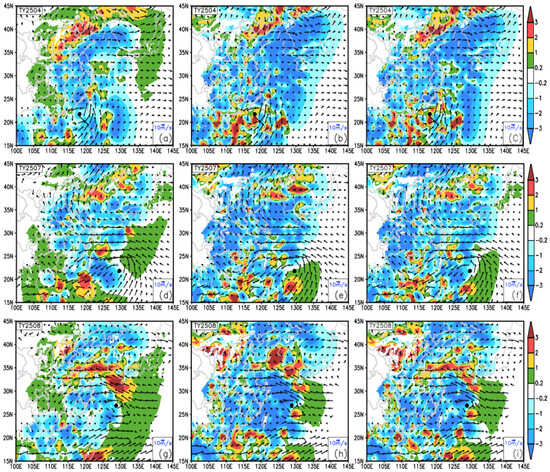
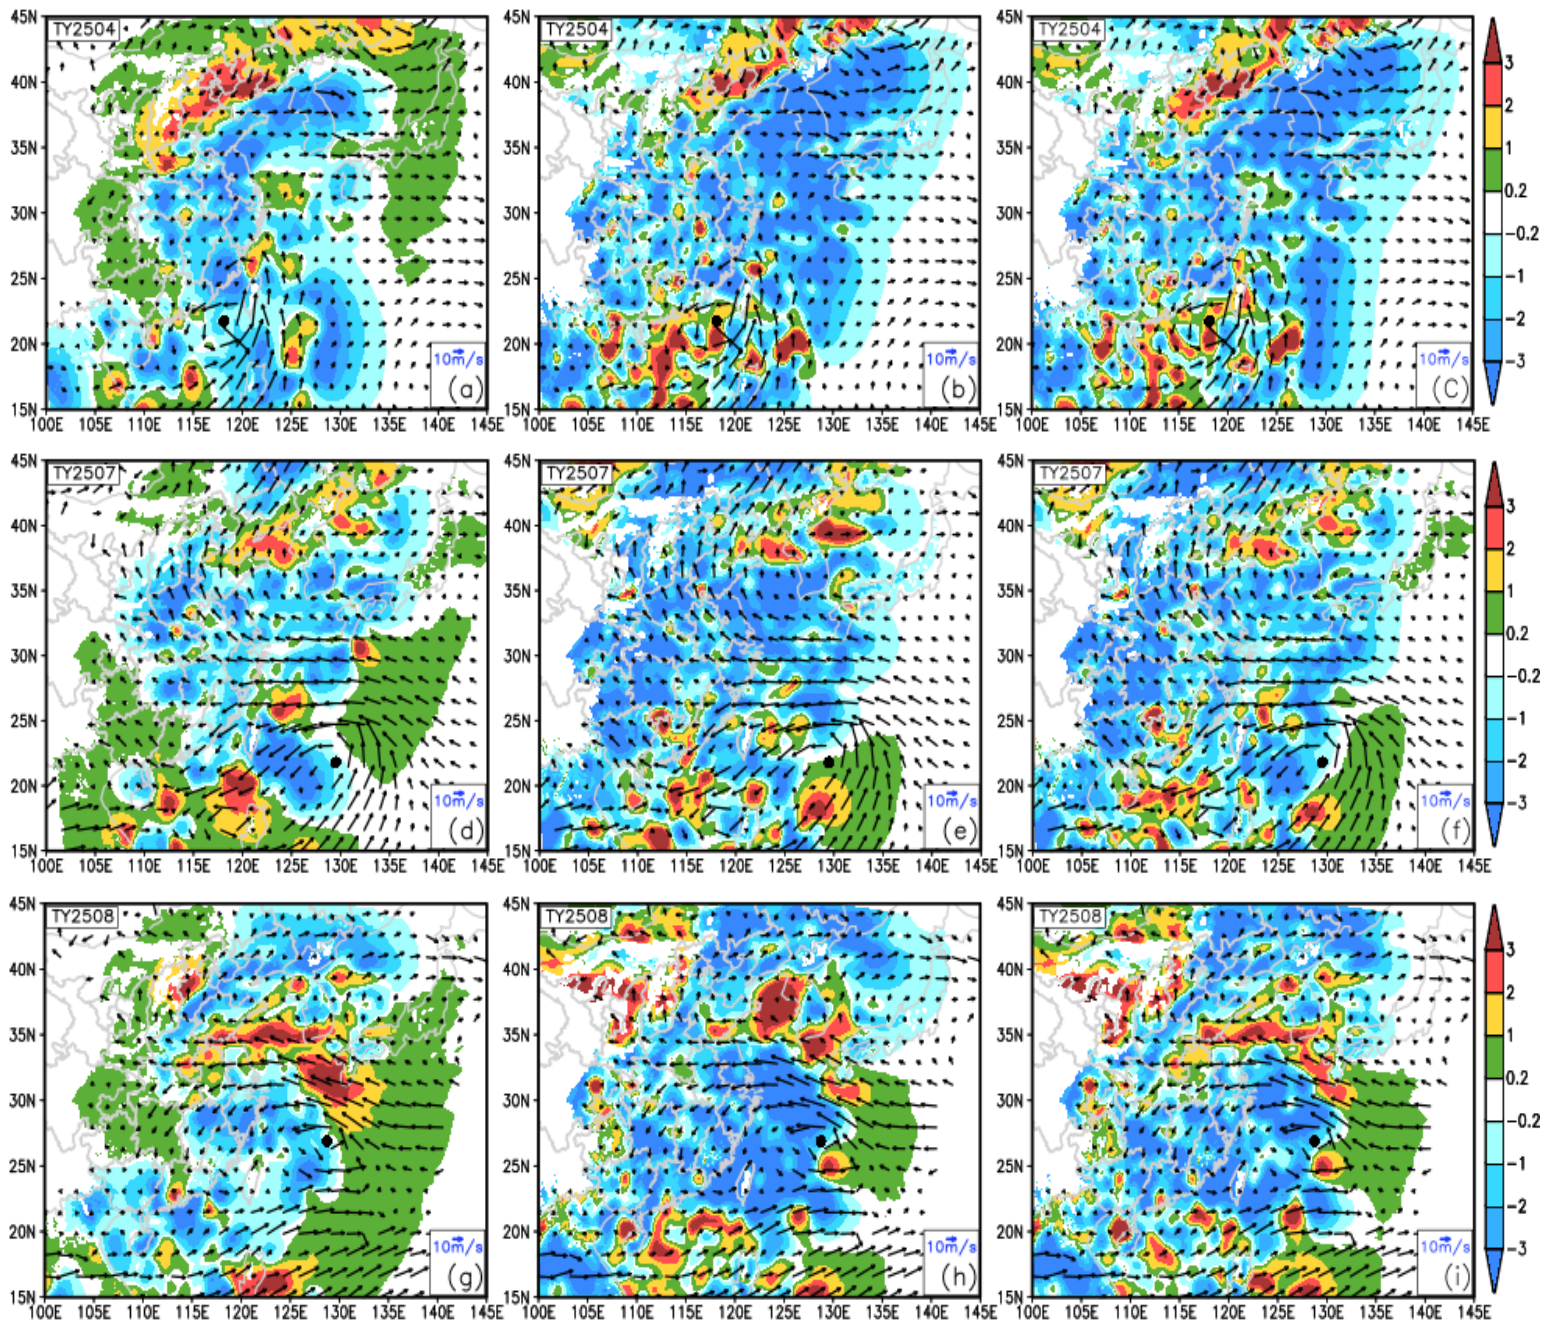
Assimilating GIIRS-retrieved profiles has a very marked impact on 850 hPa moisture. Because most clear-sky profiles are far from the typhoon, the moisture increments near the typhoon are relatively smooth. The environment around Typhoon 2504 becomes drier (Figure 7a). For Typhoons 2507 and 2508, the downstream (western) side becomes drier and the upstream (eastern) side becomes moister (Figure 7d,g). For Typhoons 2507 and 2508, the western (downstream) side dries while the eastern (upstream) side moistens (Figure 7d,g), favoring typhoon maintenance. Because the 12 km GIIRS profiles resolve small- and mesoscale convective systems better than the 0.25° NCEP reanalysis, cloudy-sky and all-sky assimilation generate patchy moistening around all three typhoons, most prominently around Typhoon 2504 (Figure 7b,c).
Figure 7.
The 850 hPa moisture increments (shaded, units: g kg−1) produced by assimilating GIIRS-retrieved clear-sky (a,d,g), cloudy-sky (b,e,h), and all-sky (c,f,i) profiles, and the 850 hPa background wind vectors (arrows). Typhoon numbers are marked in the upper-left corner of each panel; the black dot denotes the typhoon center.
The edge of the WPSH is also a frequent area for small- and mesoscale convective systems. For Typhoon 2504, a substantial moistening belt with a maximum above 3 g kg−1 appears at the intersection of the WPSH and the anticyclonic circulation to its north (Figure 7a–c). For Typhoon 2507, all three schemes produce comparable moistening at the northern WPSH edge (Figure 7d–f). For Typhoon 2508, all three schemes moisten the moisture transport belt along the southern edge of the WPSH, but the moistening produced by all-sky assimilation is markedly weaker than that of clear-sky and cloudy-sky assimilation (Figure 7g–i), indicating that all-sky assimilation is not a linear superposition of clear-sky and cloudy-sky assimilation results but involves complex mutual constraints.
3.3. Impact of Assimilating GIIRS-Retrieved Temperature and Humidity Profiles on Typhoon Forecasts
3.3.1. Impact of Assimilating GIIRS-Retrieved Profiles on Typhoon Intensity Forecasts
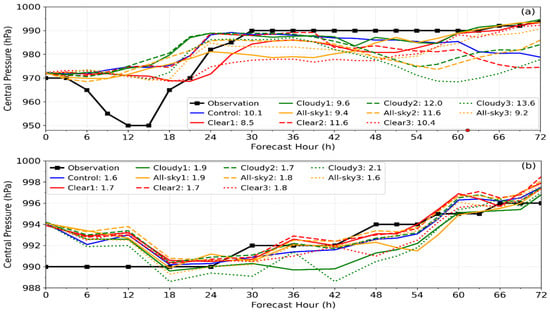
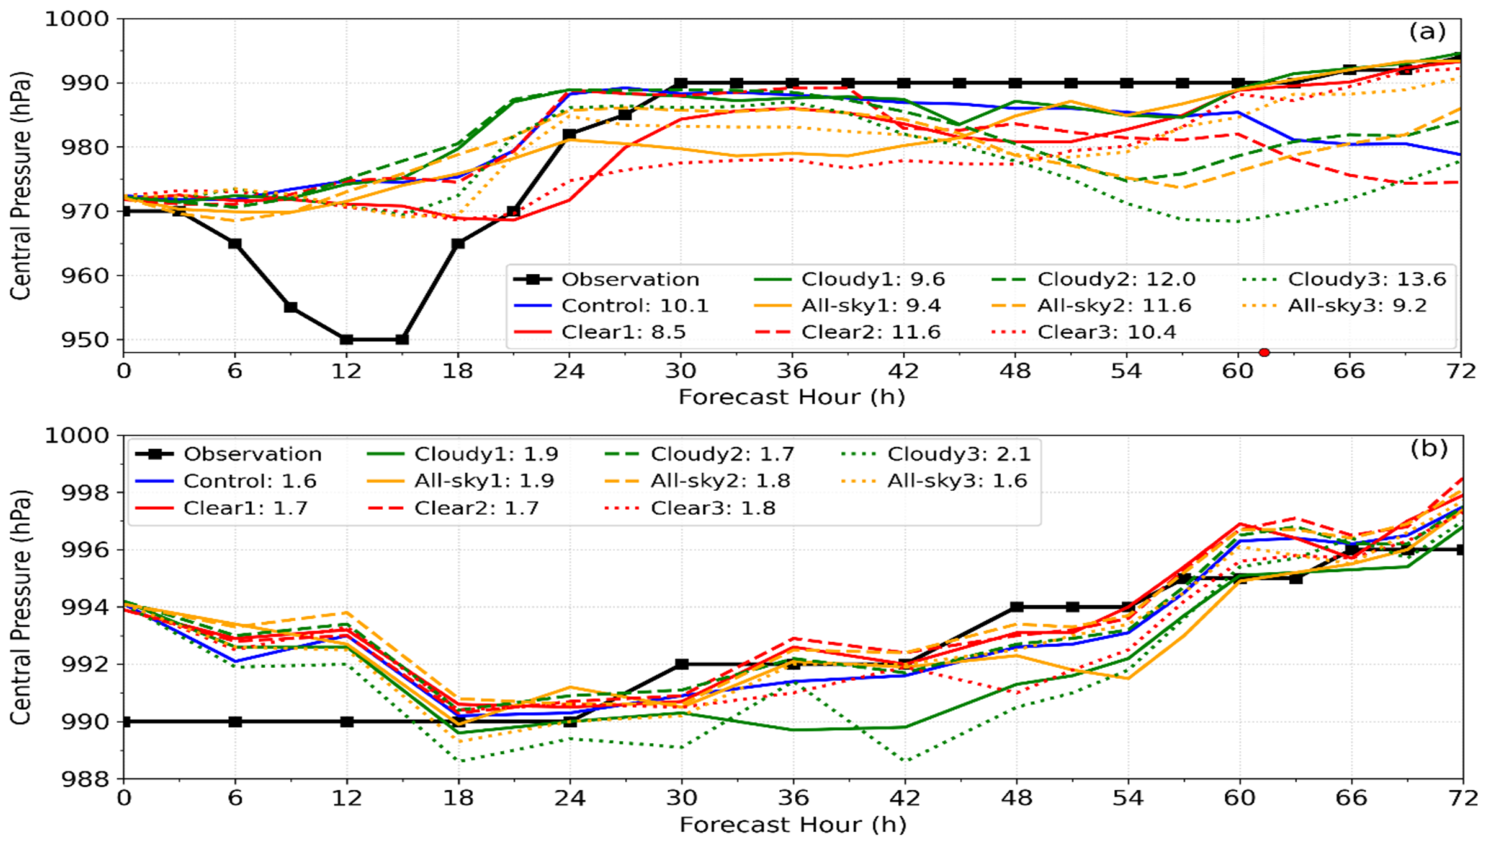
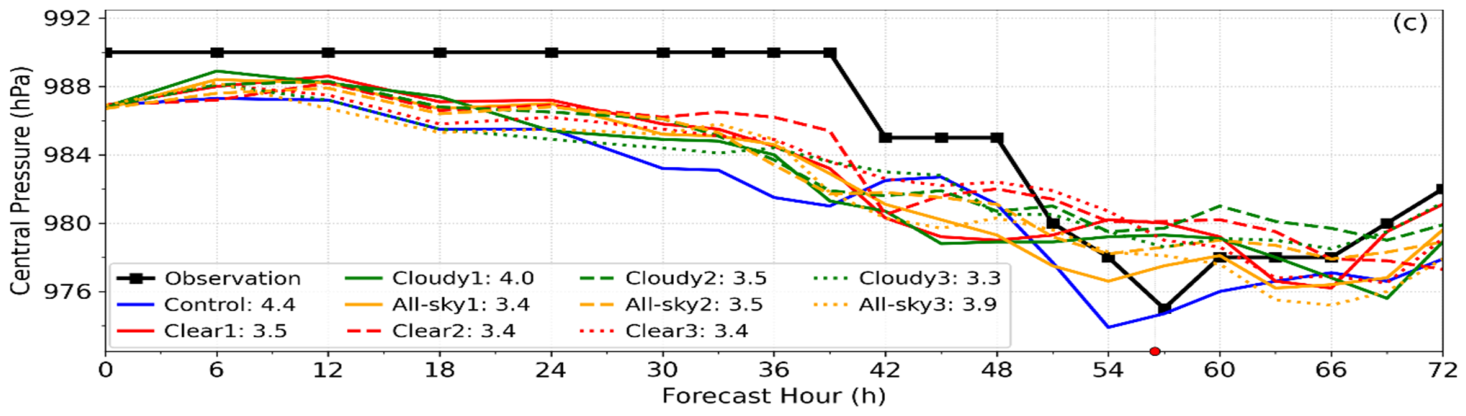
Figure 8 shows that assimilating the three types of profiles has no marked impact on the initial typhoon intensity. This may be because clear-sky profiles are mainly distributed inside the WPSH and cloudy-sky profiles are only valid above the cloud top; neither type of data can directly adjust the typhoon central pressure.
Figure 8.
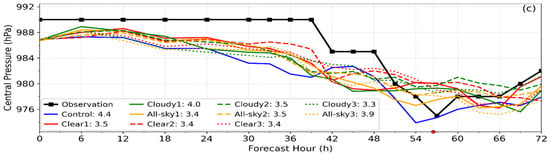
Observed (black lines) and forecast (colored lines) central pressure for Typhoons 2504 (a), 2507 (b), and 2508 (c). “Control” denotes the control experiment; “Clear”, “Cloudy”, and “All-sky” denote the assimilation of GIIRS-retrieved clear-sky, cloudy-sky, and all-sky profiles, respectively; and the numbers 1, 2, and 3 denote Schemes 1, 2, and 3, respectively. The number after “:” denotes the 72 h RMSE of central pressure. Red dots on the time axis denote typhoon landfall times.
Typhoon 2504 underwent a rapid intensification process in the initial stage (central pressure reaching 950 hPa), but the control experiment failed to forecast it. All-sky1 and the three Scheme 2 experiments improved this to some extent. The temperature and humidity increments in the inner core and rainband (Figure 4a,b and Figure 5a,b) show a peak moistening at 850 hPa (RMSI of about 2.8 g kg−1) together with marked warming (RMSI of about 2 K), providing more favorable initial conditions for intensification, consistent with the increased moisture around the typhoon at 850 hPa. Therefore, assimilating GIIRS cloudy-sky retrieved profiles positively improves the intensity of Typhoon 2504.
The initial intensity of Typhoon 2507 is 4 hPa weaker than the observed value but it is corrected after 18 h; all experiments simulate similar intensities (RMSE of 1.6–2.1 hPa). For Typhoon 2508, the control experiment consistently overestimates intensity, whereas all assimilation experiments perform better. The temperature and humidity increments in the inner core and rainband (Figure 4g,h and Figure 5g,h) show that 850 hPa is the peak moisture-decrease region (RMSI of about 2 g kg−1 in the inner core and rainband and about 3 g kg−1 in the outer environment), despite low-level warming. This low-level drying suppresses the overly strong boundary-layer moisture supply, reduces latent heat release, and weakens the simulated typhoon toward the observed intensity. Therefore, the improved Typhoon 2508 intensity is mainly attributed to the debiasing correction of the low-level moisture field rather than a simple thermal adjustment.
3.3.2. Impact of Assimilating GIIRS-Retrieved Profiles on Typhoon Track Forecasts
- Track Forecast Analysis for Typhoon Danas (No. 2504)
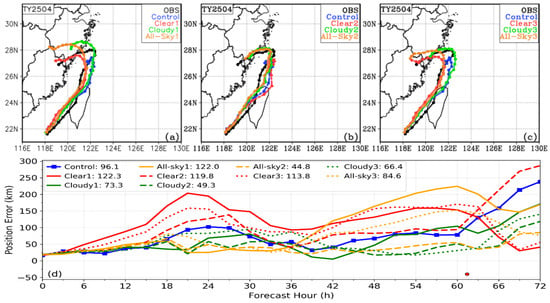
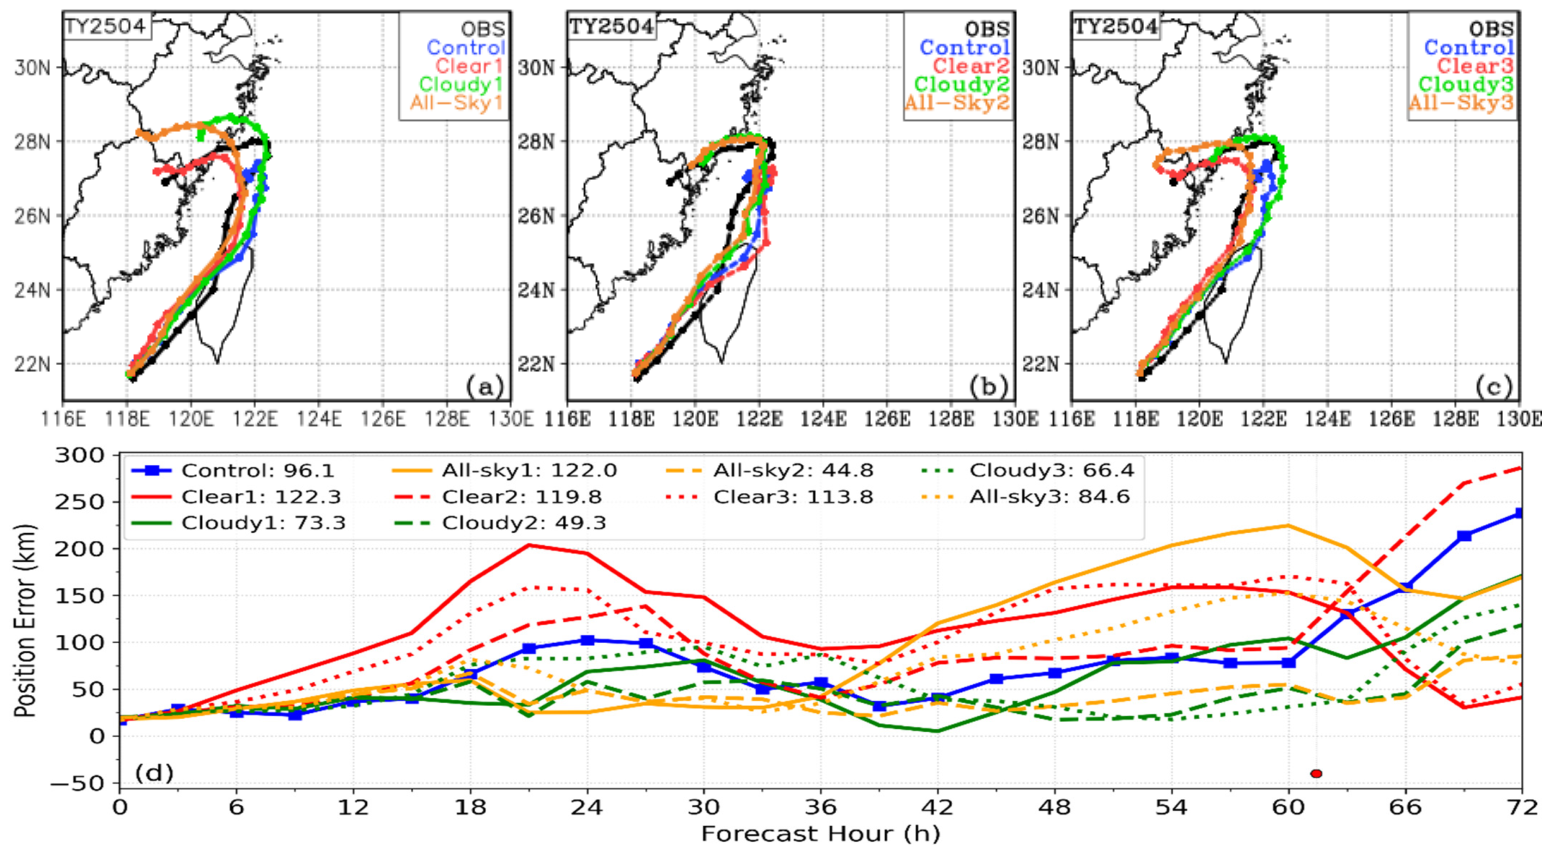
The track of Typhoon 2504 is a large-angle turning track. Figure 9 shows that the control experiment failed to forecast the typhoon turning southwestward and making landfall. The three Scheme 1 experiments are clearly better than the control (Figure 9a); among them, Cloudy1 has the closest turning position to the observation, with position errors generally lower than the control and the smallest RMSE in Scheme 1 (Figure 9d).
Figure 9.
Tracks of Typhoon 2504 forecast by Scheme 1 (a), Scheme 2 (b), and Scheme 3 (c), and the time evolution of typhoon position errors (d). In the legend, “Control” denotes the control experiment; “Clear”, “Cloudy”, and “All-sky” denote the assimilation of GIIRS-retrieved clear-sky, cloudy-sky, and all-sky profiles, respectively; and the numbers 1, 2, and 3 denote Schemes 1, 2, and 3, respectively. The number after “:” is the 72 h RMSE of the typhoon position; the red dot denotes the observed typhoon landfall time.
The three Scheme 3 experiments, together with Cloudy2 and All-sky2 of Scheme 2, clearly improve the track forecast, indicating that the control failure is not caused solely by vortex or environmental field error. The vortex and the large-scale environment are therefore physically inconsistent. Since Cloudy2 and All-sky2 have the smallest position RMSE, the vortex error in the control has the greatest impact on the track forecast. GIIRS clear-sky retrieved profiles are mainly distributed inside the WPSH (Figure 1a), so assimilating clear-sky retrieved profiles improves the vortex less but affects the WPSH more. This is why Clear2 does not improve the typhoon track, while Clear1 and Clear3 both forecast the typhoon turning and making landfall with very similar tracks and errors (Figure 9d).
The landfall location and post-turning track of Scheme 1 are inferior to those of the other two schemes, indicating that although data assimilation improves both the environmental field and the typhoon vortex, their inconsistent relationship has not been completely eliminated. For a special weather system such as a typhoon, its error characteristics differ greatly from those of the environmental field, and the generic B matrix used here in this experiment cannot fully coordinate the dynamic and thermal relationship between the typhoon vortex and the environmental field. Therefore, Scheme 1 performs worse than Schemes 2 and 3, although this conclusion requires more detailed verification.
- Track Forecast Analysis for Typhoon Francisco (No. 2507)
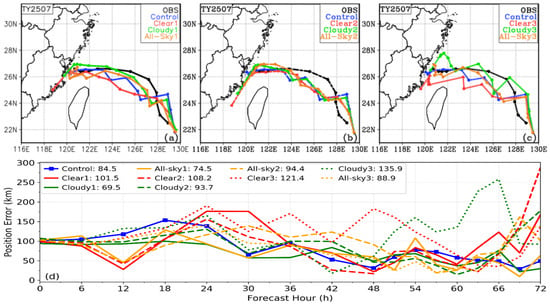
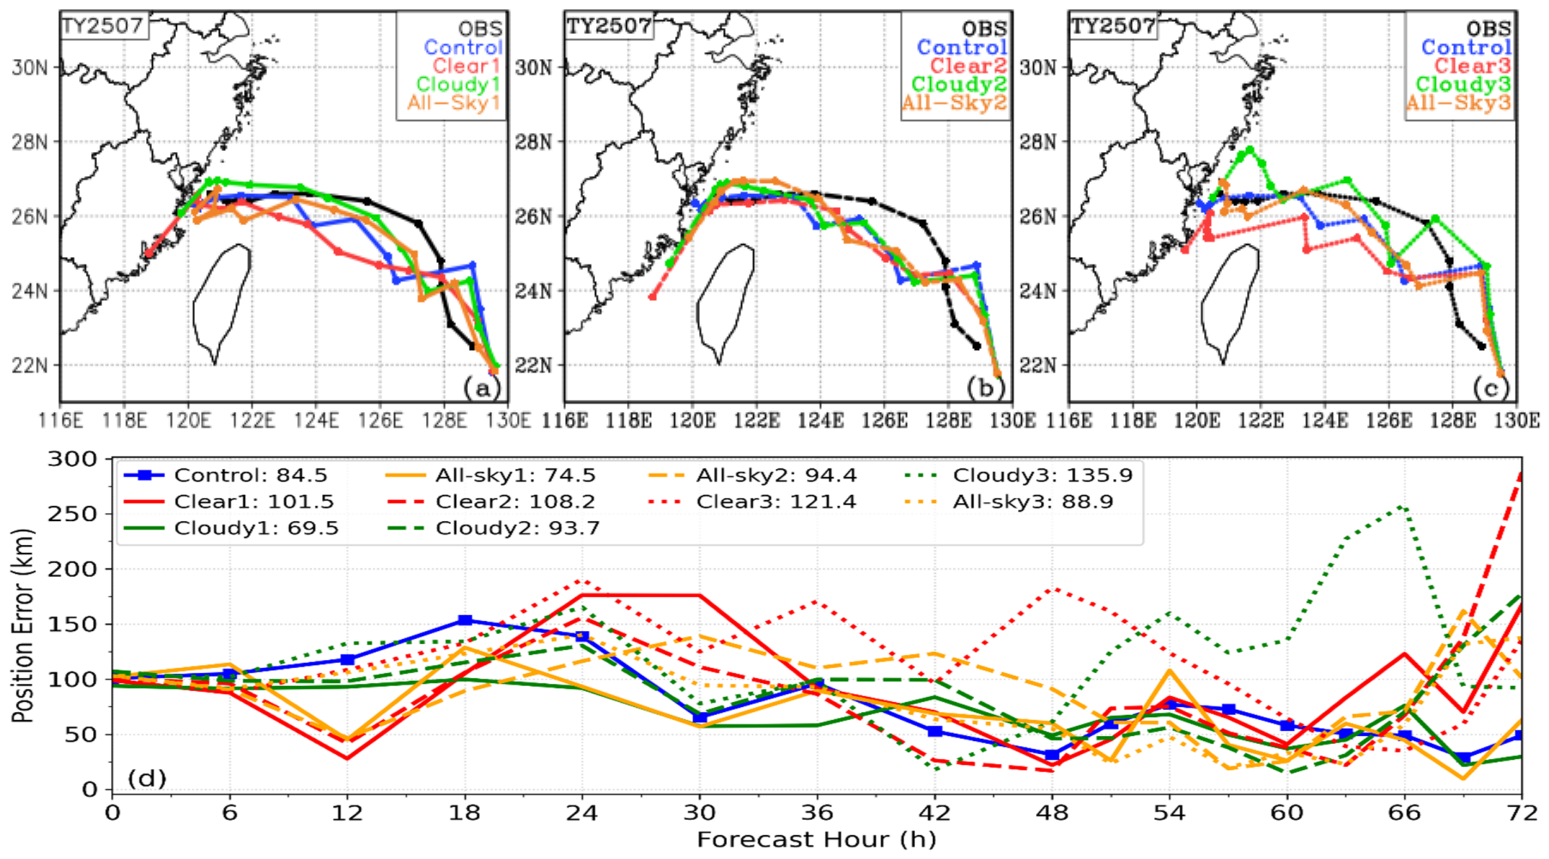
Typhoon 2507 is a westward-moving typhoon with weak intensity (Figure 8b). Its thermal and dynamic structure has little impact on the track, so the Scheme 2 track is close to that of the control experiment (Figure 10b), but in the later stage, the position error increases markedly because the moving speed is too fast. The control and Scheme 3 experiment forecast tracks with multiple large-angle turns, possibly due to the thermal–dynamic inconsistency between the typhoon vortex and the environmental field. This is markedly improved in Scheme 1.
Figure 10.
Tracks of Typhoon 2507 forecast by Scheme 1 (a), Scheme 2 (b), and Scheme 3 (c), and the time evolution of typhoon position errors (d). In the legend, “Control” denotes the control experiment; “Clear”, “Cloudy”, and “All-sky” denote assimilation of clear-sky, cloudy-sky and all-sky GIIRS-retrieved profiles, respectively; and the numbers 1, 2, and 3 denote Schemes 1, 2, and 3, respectively. The number after “:” is the RMSE of typhoon position.
Because Typhoon 2507 is very weak with indistinct typhoon characteristics, the B matrix can better coordinate the vortex–environmental thermal–dynamic relationship. Thus Scheme 1 outperforms the other two schemes (Figure 10d). The position errors of Cloudy1 and All-sky1 are lower than the control experiment at almost all times, with RMSEs differing by only 3.2 km, indicating a clear positive effect of assimilating GIIRS cloudy-sky retrieved profiles on the track forecast.
Assimilating GIIRS-retrieved clear-sky and cloudy-sky profiles has very different impacts on the typhoon vortex and environmental field of Typhoon 2507. For example, warming and cooling occur in the 400–700 hPa layer of the typhoon vortex (Figure 4d,e), and the 500 hPa height field is markedly decreased and increased (Figure 6d,e); which result is more reasonable needs verification. First, under the same environmental field conditions, although the position RMSEs of Clear2 and Cloudy2 are both higher than the control experiment, Cloudy2 is slightly lower. Second, the position RMSE of Cloudy1 is 15 km lower than the control experiment and 65.9 km lower than Cloudy3. These two advantages indicate that assimilating cloudy-sky retrieved profiles improves the temperature and humidity structure of Typhoon 2507 more reasonably.
- Track Forecast Analysis for Typhoon Co-may (No. 2508)
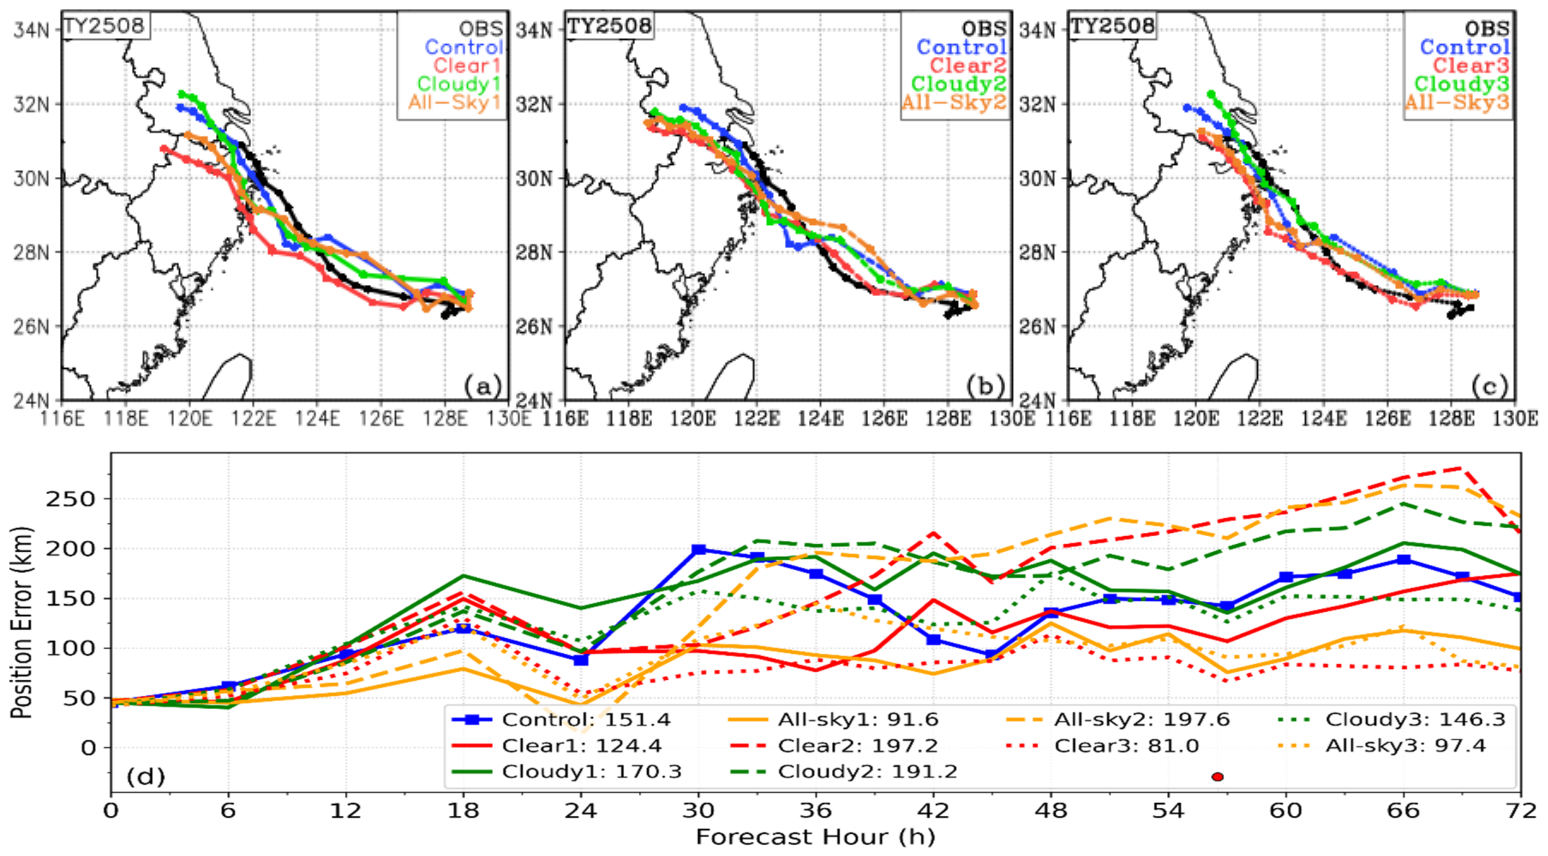
Typhoon 2508 is a northwestward-moving typhoon, with an initial intensity slightly stronger than that of Typhoon 2507. Figure 11 shows that the Scheme 2 typhoon moves too fast, reaching near 118.5°E at 72 h with an error exceeding 200 km. Scheme 3 has a clearly smaller position error than Scheme 2, indicating that environmental field error is the main cause of track error.
Figure 11.
Tracks of Typhoon 2508 forecast by Scheme 1 (a), Scheme 2 (b), and Scheme 3 (c), and the time evolution of typhoon position errors (d). In the legend, “Control” denotes the control experiment; “Clear”, “Cloudy”, and “All-sky” denote the assimilation of GIIRS-retrieved clear-sky, cloudy-sky, and all-sky profiles, respectively; and the numbers 1, 2, and 3 denote Schemes 1, 2, and 3, respectively. The number after “:” is the RMSE of the typhoon position; red dots denote the observed typhoon landfall time.
The position error evolution of Scheme 1 (Figure 11d) shows that Cloudy1, which only assimilates cloudy-sky retrieved profiles, does not improve the track error. After adding clear-sky profiles, however, all-sky1 has a position RMSE only 10.6 km higher than Clear3 but clearly better than all other experiments (24 h error less than 50 km; 48 and 72 h errors about 100 km), indicating that the assimilation system resolves the fusion of clear-sky and cloudy-sky retrieved profiles well.
GIIRS clear-sky retrieved profiles are mainly distributed inside the WPSH, while cloudy-sky profiles are mainly outside. Fusion assimilation of the two can more comprehensively improve the initial field. Taking the 500 hPa height increment field in Figure 6g–i as an example, the WPSH in All-sky1 is more similar to that in Clear1, while the height increments outside the WPSH are more similar to those in Cloudy1. In addition, Clear3 has slightly lower track error than All-sky1, indicating that the improvement in the WPSH has the greatest impact on the track of Typhoon 2508.
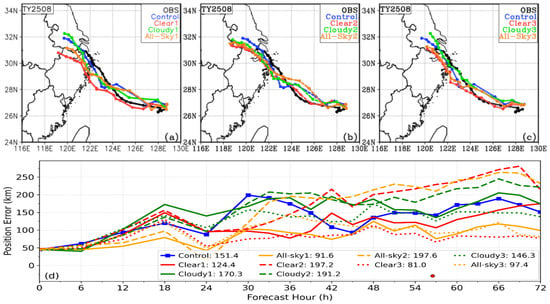
Based on the track sensitivity experiment for the three typhoons, GIIRS-retrieved all-sky profile assimilation is the optimal scheme, with All-sky3 for Typhoon 2504 and All-sky1 for Typhoons 2507 and 2508. Assimilating clear-sky or cloudy-sky retrieval profiles alone can degrade forecast skill, as seen in Clear1 for Typhoon 2507 and Cloudy1 for Typhoon 2508. For stronger typhoons, the assimilation system should also handle vortex–environment interaction properly; for example, All-sky2 and All-sky3 for Typhoon 2504 have clearly lower RMSEs than All-sky1.
3.3.3. Impact of Assimilating GIIRS-Retrieved Temperature and Humidity Profiles on Typhoon Precipitation Forecasts
Schemes 2 and 3 are designed to diagnose the contributions of typhoon vortex and environmental field to typhoon track forecasts, not for operational application. Therefore, the following analysis focuses on the results of Scheme 1.
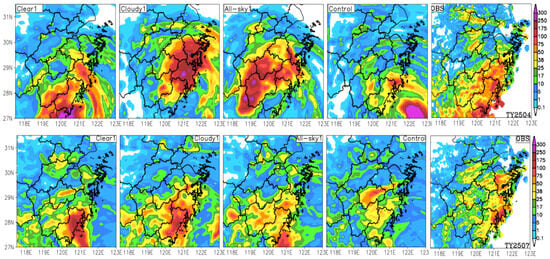
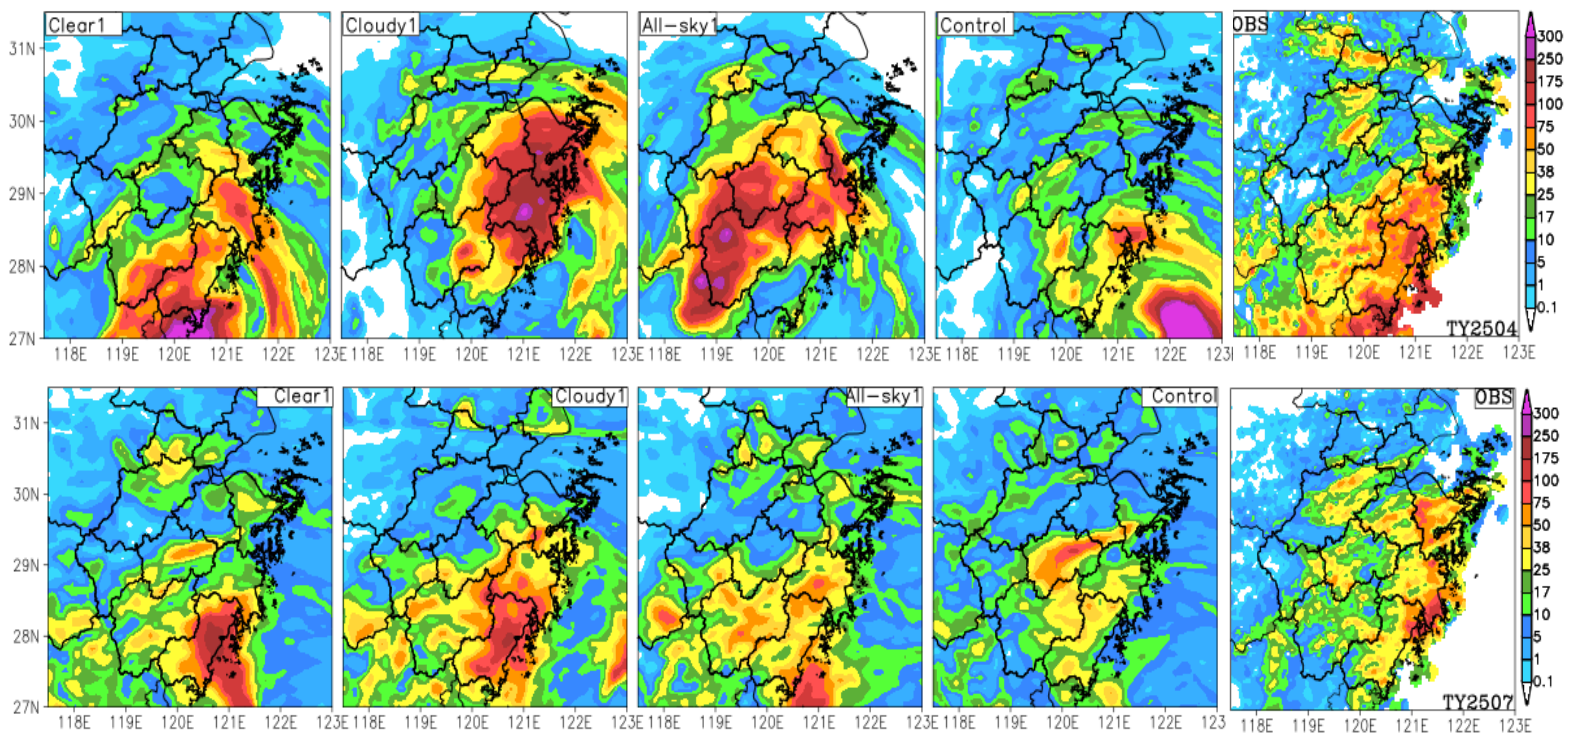
The 24 h rain area distribution of the three typhoons is closely related to the typhoon track (Figure 12). For Typhoon 2504, the observed 24 h precipitation is mainly distributed along the central and southern coasts of Zhejiang. The control forecasts the worst rain area position, while Cloudy1 and All-sky1 underforecast markedly along the southern coast. Due to the track deviation, All-sky1 shifts the rain area westward considerably. Clear1 forecasts the rain area position and magnitude closest to the observation, because its post-turning and landfall track basically match the observation (Figure 9a). Although Clear1 forecasts precipitation well before and after landfall, the 72 h position RMSE is comparable to the control experiment and 50 km larger than Cloudy1; Cloudy1 is slightly superior when both precipitation and typhoon track errors are considered.
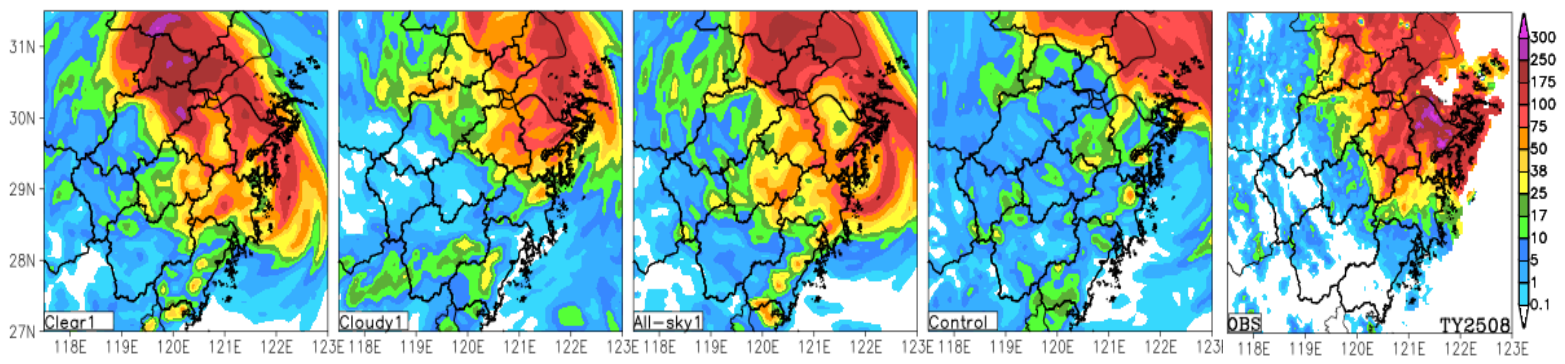
Figure 12.
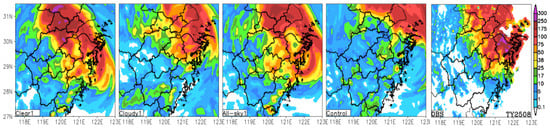
Observed 24 h accumulated precipitation (OBS), control experiment (Control), and 24 h accumulated precipitation forecasts from the three assimilation experiments of Scheme 1 over Zhejiang Province for the three typhoons. The first to third rows are for Typhoons 2504, 2507, and 2508, respectively.
As noted in the track analysis of Typhoon 2504, both the background field and the assimilation field suffer from vortex–environment inconsistency caused by errors. If the assimilation system can resolve this problem, the All-sky1 should be the best choice.
For Typhoon 2507, the observed 24 h precipitation is mainly along the eastern coast, with two heavy rain centers in northern Ningbo and the central coast (the border of Taizhou and Wenzhou). In terms of precipitation area and amount, all three assimilation experiments outperform the control. Combined with the typhoon position error, the Clear1 typhoon moves too fast in the last 12 h, with the position error exceeding 150 km at 72 h, shifting the heavy rain area southward. This indicates a large difference between the sources of observed and forecast precipitation. The position error evolutions of Cloudy1 and All-sky1 are very close, with RMSEs of 69.5 km and 72.7 km, respectively, and their forecast precipitation sources are more credible than Clear1. Although All-sky1 only forecasts the central-coast heavy rain center, Cloudy1 has obvious large-scale false alarms at both heavy rain centers. Considering the typhoon track, rainfall area, and rainfall amount, Cloudy1 and All-sky1 are comparable.
For Typhoon 2508, the observed 24 h precipitation is mainly in northeastern Zhejiang. The control experiment forecasts too little rainfall, with the rain area shifting northeastward. The post-landfall position errors of the control and Cloudy1 experiment are very close, so the rain area distributions are similar. Clear1 and All-sky1 forecast post-landfall tracks south of the best track, which corrects the large-area underforecasting of the control experiment. After typhoon landfall, the average position errors of the control experiment and Cloudy1 exceed 150 km, while those of Clear1 and All-sky1 are about 125 km and 100 km, respectively. This indicates large differences between the sources of observed precipitation and those of the four experiments, but All-sky1 is slightly better. All-sky1 underforecasts torrential rain, while Clear1 produces false alarms. Considering that All-sky1 has a position RMSE about 33 km lower than Clear1, All-sky1 is slightly superior for Typhoon 2508.
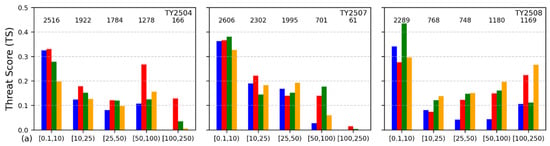
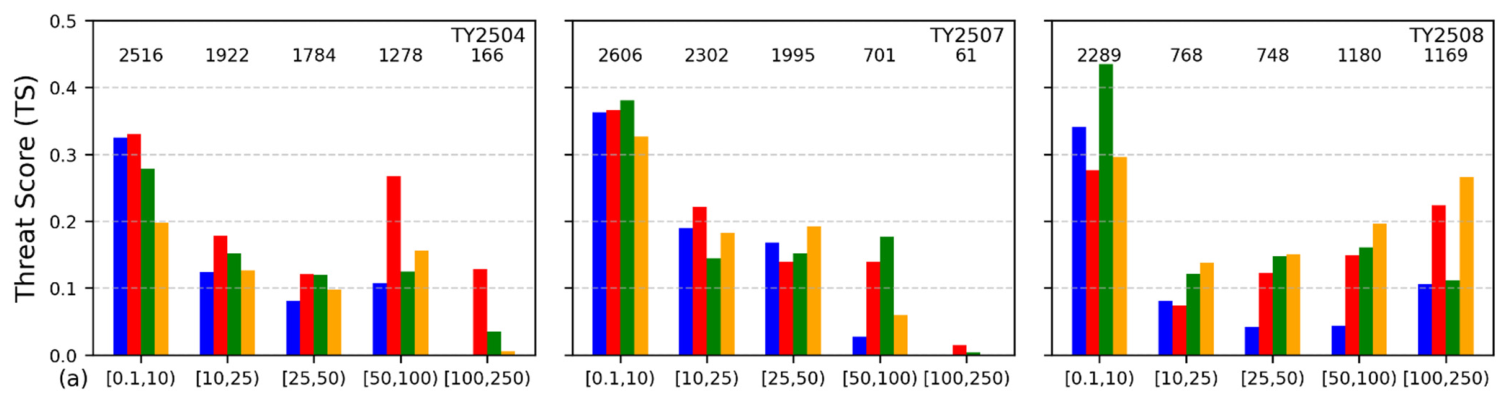
Figure 13a shows the precipitation TSs for the three typhoons. The control experiment yields the highest score in none of the five precipitation categories, especially for heavy rain and above. For Typhoon 2504, Clear-sky1 has a relatively large track error, but a post-landfall track close to observations, giving a higher torrential rain TS. For moderate rain and below, Cloudy-sky1 slightly outperforms All-sky1, but All-sky1 has a higher torrential rain TS. The extreme torrential rain category has only 166 stations, so its TS should be interpreted with caution. For Typhoon 2507, All-sky1 slightly outperforms Cloudy-sky1 in light and moderate rain, but its torrential rain TS is poorer. For Typhoon 2508, All-sky1 has a higher TS for moderate rain and above than the other three experiments. The large number of stations across all five categories, especially the 1169 stations for extreme torrential rain, gives the TS scores higher statistical robustness than the other two cases.
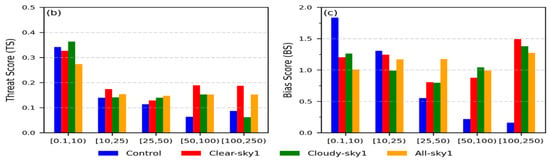
Figure 13.
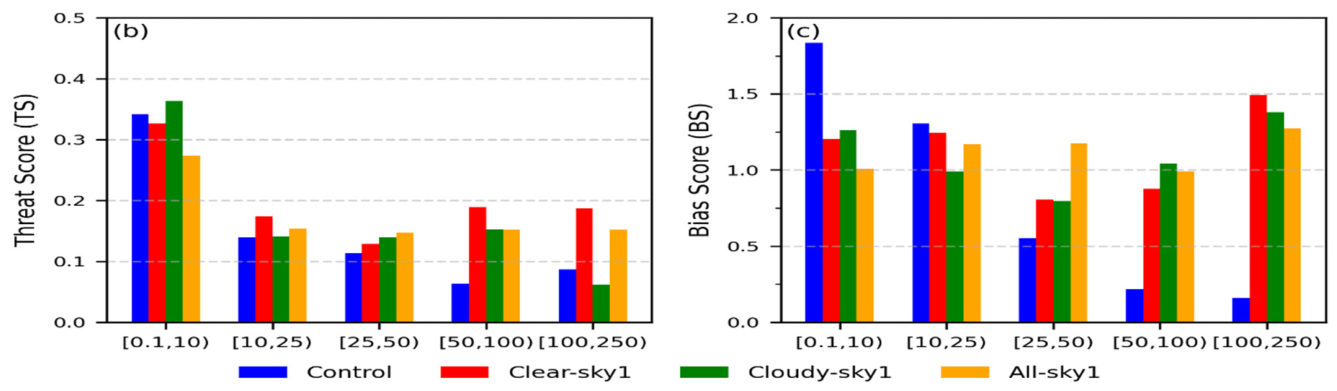
The 24 h accumulated precipitation TSs for the control and the GIIRS-retrieved profile assimilation experiments for the three typhoons (a). The numbers at the top of panel (a) indicate the number of observation stations for each precipitation category. Panels (b) and (c) show the TSs and BSs, respectively, after merging the precipitation data from the three typhoons. The x-axis categories are defined by half-open intervals, corresponding to light, moderate, heavy, torrential, and extreme torrential rain, respectively.
To evaluate the precipitation forecast quality of the three assimilation experiments more completely, we combine the precipitation samples of the three typhoons. Figure 13b,c show that although Clear1 has the highest TS for heavy rain and torrential rain, its track errors for Typhoons 2507 and 2508 are relatively large, and the sources of observed and forecast precipitation differ greatly; its BS of Clear1 for extreme torrential rain is also seriously overestimated. For light rain and above, All-sky1 has a higher TS than the control and Cloudy1 experiment, with the extreme torrential rain TS being 0.09 higher than Cloudy1’s. Moreover, All-sky1 has the best BS for heavy rain and above. Considering both the TS and BS results, All-sky1 performs best in precipitation forecasting.
4. Discussion
4.1. Physical Interpretation of the Initial Field Adjustments
Assimilating GIIRS-retrieved profiles systematically adjusts the typhoon temperature and humidity fields, with little difference among the inner-core, rainband, and outer-environment regions. All three schemes produce lower–middle tropospheric warming and upper tropospheric cooling, with the cooling for cloudy-sky and all-sky assimilation about twice the low-level warming. This reflects that cloudy-sky retrieved profiles are valid only above the cloud top and are generally colder than the NCEP background field, whereas the low-level adjustment is achieved mainly through B matrix correlations. Thus, clear-sky profiles, although located mainly within the WPSH, can still indirectly modify the typhoon inner core through the B matrix [13].
For humidity, cloudy-sky and all-sky assimilation moisten the middle layer (600–800 hPa) of the typhoon inner core and rainband substantially, whereas clear-sky retrieved profiles have a weaker effect on the typhoon vortex humidity because they are mainly within the WPSH. All three schemes reduce low-level moisture in the typhoon outer environment, possibly reflecting a systematic wet bias in the NCEP background around typhoons in the East Asian region. At 850 hPa, all three schemes moisten the typhoon vortex region and the moisture transport belt along the WPSH edge. These systematic moistening and drying effects are consistent with the track, intensity, and precipitation forecast improvements, suggesting that the assimilation adjustments are physically reasonable.
4.2. Comparison with Previous Studies
Previous studies have demonstrated the potential of GIIRS data assimilation but have mostly focused on clear-sky radiances or retrieved profiles under a single cloud condition [1,2,22]. Chen et al. [13] reported complementary temperature and humidity adjustments from joint AGRI all-sky and GIIRS clear-sky assimilation. However, the relative impacts of clear-sky, cloudy-sky, all-sky GIIRS-retrieved profiles, and the separation of vortex and environmental field contributions, remain insufficiently quantified. This study addresses these gaps through sensitivity and vortex relocation experiments.
Our results support the complementary nature of clear-sky and cloudy-sky information reported by Chen et al. [13], but further suggest that all-sky assimilation may be a more robust option for the three cases examined here. More importantly, the vortex relocation experiments quantify the relative contributions of the typhoon vortex and the environmental field to track forecasts. The dominant error source depends on typhoon intensity and structure: vortex–environment inconsistency dominates for the strong Typhoon 2504, whereas environmental field errors dominate for the weak Typhoons 2507 and 2508. These findings provide a more process-oriented understanding of how GIIRS-retrieved profile assimilation affects typhoon forecasts.
4.3. Implications for Typhoon Track, Intensity, and Precipitation Forecasts
All-sky GIIRS-retrieved profile assimilation is the best choice for the three typhoons, with All-sky3 for Typhoon 2504 and All-sky1 for Typhoons 2507 and 2508. Assimilating clear-sky or cloudy-sky profiles alone may increase typhoon position errors, as most typically shown for Typhoon 2507. Within the WPSH-controlled region, both clear sky and cloudy sky are abundant. Clear-sky assimilation slightly weakens the WPSH, whereas cloudy-sky assimilation can either strengthen or weaken it. Only by combining both can the temperature and humidity structures of the WPSH and the typhoon vortex be better represented, which explains why all-sky assimilation provides a more balanced analysis and the smallest track errors.
For intensity forecasts, the direct impact on initial typhoon intensity is limited because cloudy-sky profiles are valid only above the cloud top and clear-sky profiles are mainly within the WPSH. Assimilation can nevertheless affect typhoon intensity development indirectly by adjusting the temperature and humidity structures of the inner core, rainband, and outer environment. For Typhoon 2504, the synergistic warming and moistening at 850 hPa favored rapid intensification. For Typhoon 2508, the substantial low-level drying suppressed the overly strong boundary-layer moisture supply, reducing latent heat release and weakening the predicted intensity toward the observed value.
For precipitation, assimilating the GIIRS-retrieved clear-sky, cloudy-sky, and all-sky profiles can markedly improve the rainfall area and amount forecasts. Clear-sky assimilation can cause relatively large position errors and a large difference between the sources of observed and forecast precipitation; thus, although Clear1 has a relatively high heavy rain TS, its credibility is low. Based on the combined TS and BS of the three typhoons, all-sky assimilation is superior to the control at all precipitation thresholds, with the torrential rain TS increased by 0.09 compared with cloudy-sky assimilation, confirming its comprehensive advantage for typhoon precipitation forecasting.
4.4. Limitations and Uncertainties
Several limitations should be acknowledged. First, only three typhoon cases are examined, limiting statistical robustness and generality. Second, the default static GSI B matrix may not fully represent the flow-dependent error characteristics of typhoons over the western North Pacific. Third, only GIIRS-retrieved profiles are assimilated, leaving the potential of all-sky GIIRS radiance assimilation unexplored.
4.5. Future Research Directions
Future work will focus on three aspects: constructing a region-specific B matrix for the western North Pacific typhoon region, or adopting a hybrid 3DEnVar approach to introduce flow-dependent background error covariance; exploring all-sky GIIRS radiance assimilation to further exploit the hyperspectral information in cloud regions; and including more typhoon cases and seasons to enhance the generality of the conclusions.
5. Conclusions
This study evaluates the impact of assimilating FY-4B/GIIRS Level-2 temperature and humidity retrieved profiles on typhoon forecasting through sensitivity experiments for three typhoons that affected Zhejiang Province in July 2025 with different track types. Clear-sky, cloudy-sky, and all-sky assimilation schemes are compared, and vortex relocation experiments are used to separate the contributions of typhoon vortex structure and environmental field to track forecasts.
Assimilating GIIRS-retrieved profiles systematically adjusts the temperature and humidity structures of the typhoon vortex. All three schemes produce lower–middle tropospheric warming and upper tropospheric cooling for the typhoon vortex, with the cooling for cloudy-sky and all-sky assimilation about twice the low-level warming. Cloudy-sky and all-sky assimilation moisten the 600–800 hPa layer of the inner core and rainband substantially, while all schemes reduce low-level moisture in the outer environment of typhoons and moisten the moisture transport belt along the WPSH edge.
For track forecasts, all-sky assimilation is optimal among the three typhoon cases examined, with All-sky3 for Typhoon 2504 and All-sky1 for Typhoons 2507 and 2508; assimilating clear-sky or cloudy-sky profiles alone can be adverse. Vortex relocation experiments show that the track failure for the strong Typhoon 2504 is primarily associated with vortex–environment inconsistency, whereas environmental field errors dominate the weak Typhoons 2507 and 2508.
For precipitation, although clear-sky assimilation has a relatively high heavy rain TS, its credibility is low. All-sky assimilation outperforms the control at all thresholds, with the heavy rain and torrential rain TS increased by 0.04 and 0.09, respectively.
These results reveal the comprehensive advantage of all-sky GIIRS-retrieved profile assimilation for the three typhoon cases examined and highlight its potential for the operational application of GIIRS Level-2 products. Future work will focus on constructing a region-specific background error covariance matrix and exploring all-sky GIIRS radiance assimilation.
Author Contributions
Conceptualization, S.H.; methodology, S.H., Z.Y., S.Y. and Z.J.; software, S.H.; validation, Z.Y. and Z.J.; formal analysis, Z.Y.; investigation, S.H.; resources, Z.J. and Z.Y.; data curation, Z.J.; writing—original draft preparation, S.H.; writing—review and editing, S.Y., Z.Y. and Z.J.; visualization, S.H.; supervision, S.H.; project administration, S.H.; funding acquisition, S.H. All authors have read and agreed to the published version of the manuscript.
Funding
This research was supported by the Joint Funds of the Zhejiang Provincial Natural Science Foundation of China (LZJMZ23D050005), the “Leading Geese + X” R&D Program of Zhejiang Province (2024C03255), the National Natural Science Foundation of China (U2342202) and the Meteorological Science and Technology Planning Program of Zhejiang (2023ZD14 and 2024ZDZL07).
Data Availability Statement
The NCEP reanalysis data used in this study are publicly available from the National Center for Atmospheric Research at https://rda.ucar.edu/datasets/d083003/ (accessed on 20 May 2026). The automatic weather station hourly precipitation data were provided by the Zhejiang Meteorological Bureau, and the FY-4B/GIIRS Level-2 retrieved temperature and humidity profiles were provided by the China Meteorological Administration. Both datasets are included in the article. Further inquiries can be directed to the corresponding author.
Acknowledgments
During the preparation of this manuscript, the authors used DeepSeek-V4.1-Flash for language polishing. The authors have reviewed and edited all AI-generated content and take full responsibility for the final version of this publication. The authors thank the staff of the Zhejiang Meteorological Observatory for their administrative and technical support. We also acknowledge the National Centers for Environmental Prediction for providing the reanalysis data, and the Zhejiang Meteorological Bureau for providing the hourly automatic weather station precipitation data for verification.
Conflicts of Interest
The authors declare no conflicts of interest.
Abbreviations
The following abbreviations are used in this manuscript:
| BS | Bias Score |
| B Matrix | Background Error Covariance Matrix |
| ERA5 | The Fifth-Generation European Centre for Medium-Range Weather Forecasts Atmospheric Reanalysis |
| FY-4B | Fengyun-4B Satellite |
| GIIRS | Geostationary Interferometric Infrared Sounder |
| MI | Mean Increment |
| O − B | Observation-Minus-Background |
| O − A | Observation-Minus-Analysis |
| RMS | Root Mean Square |
| RMSE | Root-Mean-Square Error |
| RMSI | Root-Mean-Square Increment |
| RMW | Radius of Maximum Wind |
| TS | Threat Score |
| WPSH | Western Pacific Subtropical High |
Appendix A
Table A1.
WRF model configuration and GSI assimilation settings.
References
- Zhang, L.; Niu, Z.; Weng, F.; Han, W.; Yang, G.; Yin, R. Impacts of Direct Assimilation of the FY-4A/GIIRS Long-Wave Temperature Sounding Channel Data on Forecasting Typhoon In-Fa (2021). Remote Sens. 2023, 15, 355. [Google Scholar] [CrossRef] [Scilit]
- Yang, W.; Chen, Y.; Bai, W.; Yan, X.; Meng, D.; Zhang, Y.; Xia, Y.; Ma, G.; Li, J. Evaluation of Temperature and Humidity Profiles Retrieved from Fengyun-4B and Implications for Typhoon Assimilation and Forecasting. Remote Sens. 2023, 15, 5339. [Google Scholar] [CrossRef] [Scilit]
- ECMWF. Fact Sheet: ECMWF’s Use of Satellite Observations. 2020. Available online: https://www.ecmwf.int/en/about/media-centre/focus/2020/fact-sheet-ecmwfs-use-satellite-observations (accessed on 1 September 2026).
- Bauer, P.; Thorpe, A.; Brunet, G. The Quiet Revolution of Numerical Weather Prediction. Nature 2015, 525, 47–55. [Google Scholar] [CrossRef] [Scilit] [PubMed]
- Aumann, H.H.; Chahine, M.T.; Gautier, C.; Goldberg, M.D.; Kalnay, E.; McMillin, L.M.; Revercomb, H.; Rosenkranz, P.W.; Smith, W.L.; Staelin, D.H.; et al. AIRS/AMSU/HSB on the Aqua Mission: Design, Science Objectives, Data Products, and Processing Systems. IEEE Trans. Geosci. Remote Sens. 2003, 41, 253–264. [Google Scholar] [CrossRef] [Scilit]
- Chalon, G.; Cayla, F.; Diebel, D. IASI: An Advanced Sounder for Operational Meteorology. In Proceedings of the 52nd International Astronautical Congress, Toulouse, France, 1–5 October 2001. [Google Scholar]
- Bloom, H.J. The Cross-Track Infrared Sounder (CrIS): A Sensor for Operational Meteorological Remote Sensing. Proc. SPIE 2001, 4483, 1341–1343. [Google Scholar] [CrossRef] [Scilit]
- Zhang, P.; Hu, X.; Lu, Q.; Zhu, A.; Lin, M.; Sun, L.; Chen, L.; Xu, N. FY-3E: The First Operational Meteorological Satellite Mission in an Early Morning Orbit. Adv. Atmos. Sci. 2022, 39, 1–8. [Google Scholar] [CrossRef] [Scilit]
- Yang, J.; Zhang, Z.; Wei, C.; Lu, F.; Guo, Q. Introducing the New Generation of Chinese Geostationary Weather Satellites, Fengyun-4. Bull. Am. Meteorol. Soc. 2017, 98, 1637–1658. [Google Scholar] [CrossRef] [Scilit]
- Schmetz, J. Good Things Need Time: Progress with the First Hyperspectral Sounder in Geostationary Orbit. Geophys. Res. Lett. 2021, 48, e2021GL096207. [Google Scholar] [CrossRef] [Scilit]
- Wang, F.; Li, J.; Schmit, T.J.; Ackerman, S.A. Trade-Off Studies of a Hyperspectral Infrared Sounder on a Geostationary Satellite. Appl. Opt. 2007, 46, 200–209. [Google Scholar] [CrossRef] [Scilit] [PubMed]
- Maier, J.; Knuteson, R. Data Fusion of GEO FY-4A GIIRS and LEO Hyperspectral Infrared Sounders with Surface Observations: A Hong Kong Case Study. J. Atmos. Ocean. Technol. 2022, 39, 259–270. [Google Scholar] [CrossRef] [Scilit]
- Chen, Y.; Chen, Y.; Yan, Y.; Tao, S.; Yang, W.; Zhang, Y.; Wang, Y.; Ma, G.; Li, J. Joint Assimilation of FY-4B AGRI and GIIRS Infrared Radiance and Its Effects on Typhoon Prediction. J. Meteorol. Res. 2026, 40, 1–16. [Google Scholar] [CrossRef]
- Migliorini, S. On the Equivalence between Radiance and Retrieval Assimilation. Mon. Weather Rev. 2012, 140, 258–265. [Google Scholar] [CrossRef] [Scilit]
- Zhu, Z.; Gu, J.; Yuan, F.; Shi, C. Quality Assessment of Operational Fengyun-4B/GIIRS Atmospheric Temperature and Humidity Profile Products. Remote Sens. 2025, 17, 1353. [Google Scholar] [CrossRef] [Scilit]
- Song, Z.; Bai, W.; Zhang, Y.; Wang, J.; Wang, C.; Du, M.; Chen, Y.; Zhang, P. Evaluation of Satellite-Derived Atmospheric Temperature and Humidity Profiles and Their Application as Precursors to Severe Convective Precipitation. Remote Sens. 2024, 16, 4638. [Google Scholar] [CrossRef] [Scilit]
- Cai, X.; Bao, Y.; Petropoulos, G.P.; Lu, F.; Han, W.; Zhu, L.; Li, J. Temperature and Humidity Profile Retrieval from FY4-GIIRS Hyperspectral Data Using Artificial Neural Networks. Remote Sens. 2020, 12, 1872. [Google Scholar] [CrossRef] [Scilit]
- Huang, P.; Guo, Q.; Han, C.; Zhang, Y.; Wu, J. An Improved Method Combining ANN and 1D-Var for the Retrieval of Atmospheric Temperature Profiles from FY-4A/GIIRS Hyperspectral Data. Remote Sens. 2021, 13, 481. [Google Scholar] [CrossRef] [Scilit]
- Huang, P.; Guo, Q.; Han, C.; Zhang, Y.; Wu, J. An Improved Method Combining CNN and 1D-Var for the Retrieval of Atmospheric Humidity Profiles from FY-4A/GIIRS Hyperspectral Data. Remote Sens. 2021, 13, 4737. [Google Scholar] [CrossRef] [Scilit]
- Hao, S.; Yu, Z.; Jin, Z. Retrieval of Atmospheric Temperature and Humidity Profiles from FY-GIIRS Hyperspectral Data Using RBF Neural Network. Remote Sens. 2026, 18, 1174. [Google Scholar] [CrossRef] [Scilit]
- Smith, W.L.; Zhang, Q.; Shao, M.; Weisz, E. Improved Severe Weather Forecasts Using LEO and GEO Satellite Soundings. J. Atmos. Ocean. Technol. 2020, 37, 1203–1218. [Google Scholar] [CrossRef] [Scilit]
- Zhang, H.; Han, W.; Luo, L.; Kong, S.; Chen, F.; Shen, H. Thermodynamic Diagnosis and Humidity Assimilation Using FY-4B GIIRS-retrieved Temperature and Humidity Profiles for Early Warning and Forecasting of a Summer Thermal Convection Event. J. Meteorol. Res. 2026, 40, 1517–1531. [Google Scholar] [CrossRef] [Scilit]
- Smith, W.L., Sr.; Weisz, E.; Kireev, S.V.; Zhou, D.K.; Li, Z.; Borbas, E.E. Dual-regression retrieval algorithm for real-time processing of satellite ultraspectral radiances. J. Appl. Meteorol. Climatol. 2012, 51, 1455–1476. [Google Scholar] [CrossRef] [Scilit]
- Liu, H.; Bai, W.; Ma, G.; Wang, G.; Zhang, P.; Zhang, W.; Li, J.; Wang, X.; Ao, Y.; Shen, Q. Neural Network Temperature and Moisture Retrieval Technique for Real-Time Processing of FengYun-4B/GIIRS Hyperspectral Radiances. Meteorol. Atmos. Phys. 2024, 136, 36. [Google Scholar] [CrossRef] [Scilit]
- Lu, X.; Yu, H.; Ying, M.; Zhao, B.; Zhang, S.; Lin, L.; Bai, L.; Wan, R. Western North Pacific Tropical Cyclone Database Created by the China Meteorological Administration. Adv. Atmos. Sci. 2021, 38, 690–699. [Google Scholar] [CrossRef] [Scilit]
- Zhu, Y.; Yang, S.; Zhang, Z.; Qu, J.; Sun, H.; Shi, J.; Tian, Y.; Yao, R. Quality Control Method for Land Surface Hourly Precipitation Data in China. J. Appl. Meteorol. Sci. 2024, 35, 680–691. [Google Scholar] [CrossRef]
- Desroziers, G.; Berre, L.; Chapnik, B.; Poli, P. Diagnosis of observation, background and analysis-error statistics in observation space. Q. J. R. Meteorol. Soc. 2005, 131, 3385–3396. [Google Scholar] [CrossRef] [Scilit]
- Wang, Y. How Do Outer Spiral Rainbands Affect Tropical Cyclone Structure and Intensity? J. Atmos. Sci. 2009, 66, 1250–1273. [Google Scholar] [CrossRef] [Scilit]
- Deng, D.; Ritchie, E. The Inner-Core Structure and Evolution Prior to and During Rapid Intensification of Tropical Cyclone Debbie (2017). In Proceedings of the Australian Meteorological and Oceanographic Society (AMOS) Annual Conference, Darwin, Australia, 10 June 2019. [Google Scholar]

Disclaimer/Publisher’s Note: The statements, opinions and data contained in all publications are solely those of the individual author(s) and contributor(s) and not of MDPI and/or the editor(s). MDPI and/or the editor(s) disclaim responsibility for any injury to people or property resulting from any ideas, methods, instructions or products referred to in the content. |
© 2026 by the authors. Licensee MDPI, Basel, Switzerland. This article is an open access article distributed under the terms and conditions of the Creative Commons Attribution (CC BY) license.