


Highlights
What are the main findings?
- Surface deformation in the Golmud River Basin is jointly controlled by river dynamics, mineral extraction, and urbanization, forming a spatial pattern of river corridor zones and mining-related patches.
- Groundwater in the Golmud River Basin experienced a rapid increase during 2017 to 2019, which is driven by increased precipitation and lower temperatures associated with a La Niña event.
What are the implications of the main findings?
- Multi-source geodetic inversion using Interferometric Synthetic Aperture Radar (InSAR), Global Navigation Satellite System (GNSS), and satellite gravimetry helps refine groundwater monitoring at the tens-of-kilometers scale.
- Regulated by extreme climate events, groundwater dynamics in the Golmud River Basin offer critical scientific insights for arid basin water resource management.
Abstract
The Golmud River Basin is a typical inland arid river basin in the Qaidam Basin, and the dynamics of its groundwater storage are of great importance for regional ecological security and water resources management. To address the limited spatial representativeness of traditional hydrological station networks and the relatively low spatial resolution of satellite gravimetry such as the Gravity Recovery and Climate Experiment (GRACE), this study develops a multi-source geodetic inversion framework for groundwater estimation by using Interferometric Synthetic Aperture Radar (InSAR), Global Navigation Satellite System (GNSS), and GRACE satellite gravimetry. Surface deformation with high spatial resolution over the Golmud River Basin is derived from Sentinel-1 SAR images from 2017 to 2021. After correcting for modeled non-hydrological loading effects and screening observations to reduce the influence of potential non-hydrological signals, groundwater spatiotemporal variations are inverted based on elastic loading theory. The results show that from 2017 to 2021, surface deformation in the Golmud River Basin is jointly controlled by river dynamics, mineral extraction, and urbanization, forming a spatial pattern of river corridor zones and mining-related patches. Groundwater storage shows an overall increasing trend during the study period, with a particularly significant increase in the southwestern region, reaching more than 20 mm/a. A synthetic experiment demonstrates that the proposed method can recover prescribed groundwater signals at a spatial resolution of approximately 40 km under the tested conditions. Compared with the InSAR-derived estimates, GRACE-derived groundwater variations exhibit a smaller seasonal amplitude, potentially reflecting the effects of limited spatial resolution and spatial signal smoothing. The WaterGAP Global Hydrology Model (WGHM) estimates are substantially smaller in magnitude than those derived from InSAR and GRACE, highlighting the uncertainties associated with model-based groundwater estimates in this high-altitude basin. Groundwater in the Golmud River Basin experienced a rapid increase during 2017 to 2019, which is likely driven by increased precipitation and lower temperatures associated with a La Niña event, indicating a teleconnection between global climate variability and regional water resource changes. This study provides a technical reference for refined groundwater monitoring at a tens-of-kilometers scale in small and medium-scale arid basin systems.
1. Introduction
The Golmud River originates in the Kunlun Mountains and flows along the southern margin of the Qaidam Basin. It is a typical inland arid river system [1]. The Golmud River Basin is characterized by a plateau continental climate with dry and low precipitation conditions, large diurnal temperature variations, abundant sunshine, strong evaporation, and high wind intensity [2,3]. Extensive piedmont gravel plains in the basin have developed thick Quaternary unconsolidated sand, gravel, and cobble deposits, forming a well-developed porous aquifer system with strong hydraulic connectivity between groundwater and surface water [4,5]. In recent years, with the rapid socio-economic development of Golmud City, the intensity of regional water resource exploitation has continuously increased, leading to increasingly prominent contradictions between water supply and demand. Groundwater levels have continued to decline, spring discharge has decreased, and wetland shrinkage and other ecological and environmental problems have gradually emerged [6,7]. Against this background, accurately characterizing the spatiotemporal variations in groundwater storage has become an important prerequisite for scientifically assessing water resource carrying capacity, optimizing resource allocation, and conducting ecological risk early warning [8,9,10]. However, traditional terrestrial water monitoring mainly relies on hydrological well networks, which are limited by sparse station distribution, high construction and maintenance costs, and insufficient spatial representativeness, making it difficult to fully capture groundwater dynamics at the basin scale [11]. The development of modern space geodetic techniques, including satellite gravimetry and surface deformation observations, has provided new perspectives for monitoring terrestrial water storage changes [12,13,14].
From a physical mechanism perspective, terrestrial water storage changes are accompanied by mass redistribution, and therefore can be directly detected by gravity measurements [12,15]. At present, satellite gravimetry missions represented by Gravity Recovery and Climate Experiment (GRACE) and its Follow-On mission (FO) (noted as GRACE hereafter, unless FO is specifically used), due to their global coverage and continuous observations, have become an effective tool for monitoring global and regional terrestrial water variations [16,17]. However, their coarse spatial resolution of about 300 km limits their ability to resolve groundwater variation details at small and medium basin scales [18,19]. On the other hand, changes in terrestrial water storage can induce crustal deformation through elastic loading effects. Based on elastic loading theory, an increase in hydrological load causes crustal subsidence, while a decrease leads to elastic rebound. The relationship between elastic deformation and hydrological loading can be quantitatively described using Green’s functions, providing a feasible approach for indirectly observing and quantitatively inverting groundwater variations using space geodetic deformation measurements [20,21,22,23]. At present, space geodetic deformation observation techniques represented by Global Navigation Satellite System (GNSS) and Interferometric Synthetic Aperture Radar (InSAR) have become effective tools for monitoring crustal deformation due to their millimeter-level accuracy. Among them, InSAR provides high spatial resolution, wide area coverage, and does not require ground-based instruments. It can acquire continuous surface deformation information at kilometer-scale spatial resolution [24,25], and can effectively identify local deformation patterns and their spatial boundaries caused by groundwater extraction or recharge. This provides reliable observations and a data basis for fine-scale monitoring and deformation-based inversion of groundwater variations [26,27,28].
This study addresses the insufficient monitoring capability of existing groundwater variation observations in the Golmud River Basin and develops a multi-source geodetic inversion method for groundwater estimation by integrating InSAR, GNSS, and GRACE. High-resolution surface deformation fields derived from InSAR after calibration with GNSS observations are used to characterize the spatial distribution of groundwater variations, while GRACE satellite gravimetry data are used to constrain basin-scale total groundwater storage variations. The objective of this study is to leverage multi-source geodetic observations to effectively overcome the limitations of satellite gravimetry in spatial resolution, the lack of temporal continuity in InSAR observations, and the coupling of surface processes. This enables refined inversion of groundwater storage changes in the Golmud River Basin and reveals groundwater dynamic evolution processes from the basin scale to the tens-of-kilometers scale, providing scientific support for small-scale arid basin water resource management.
2. Data and Methods
2.1. InSAR-Based Land Water Inversion
2.1.1. Selection of InSAR Imagery
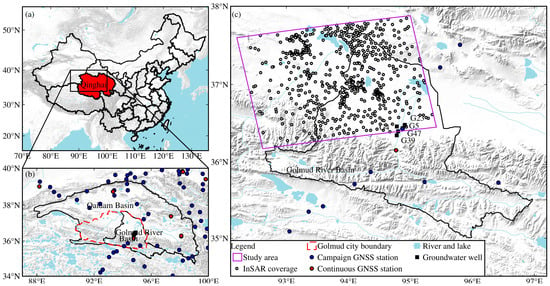
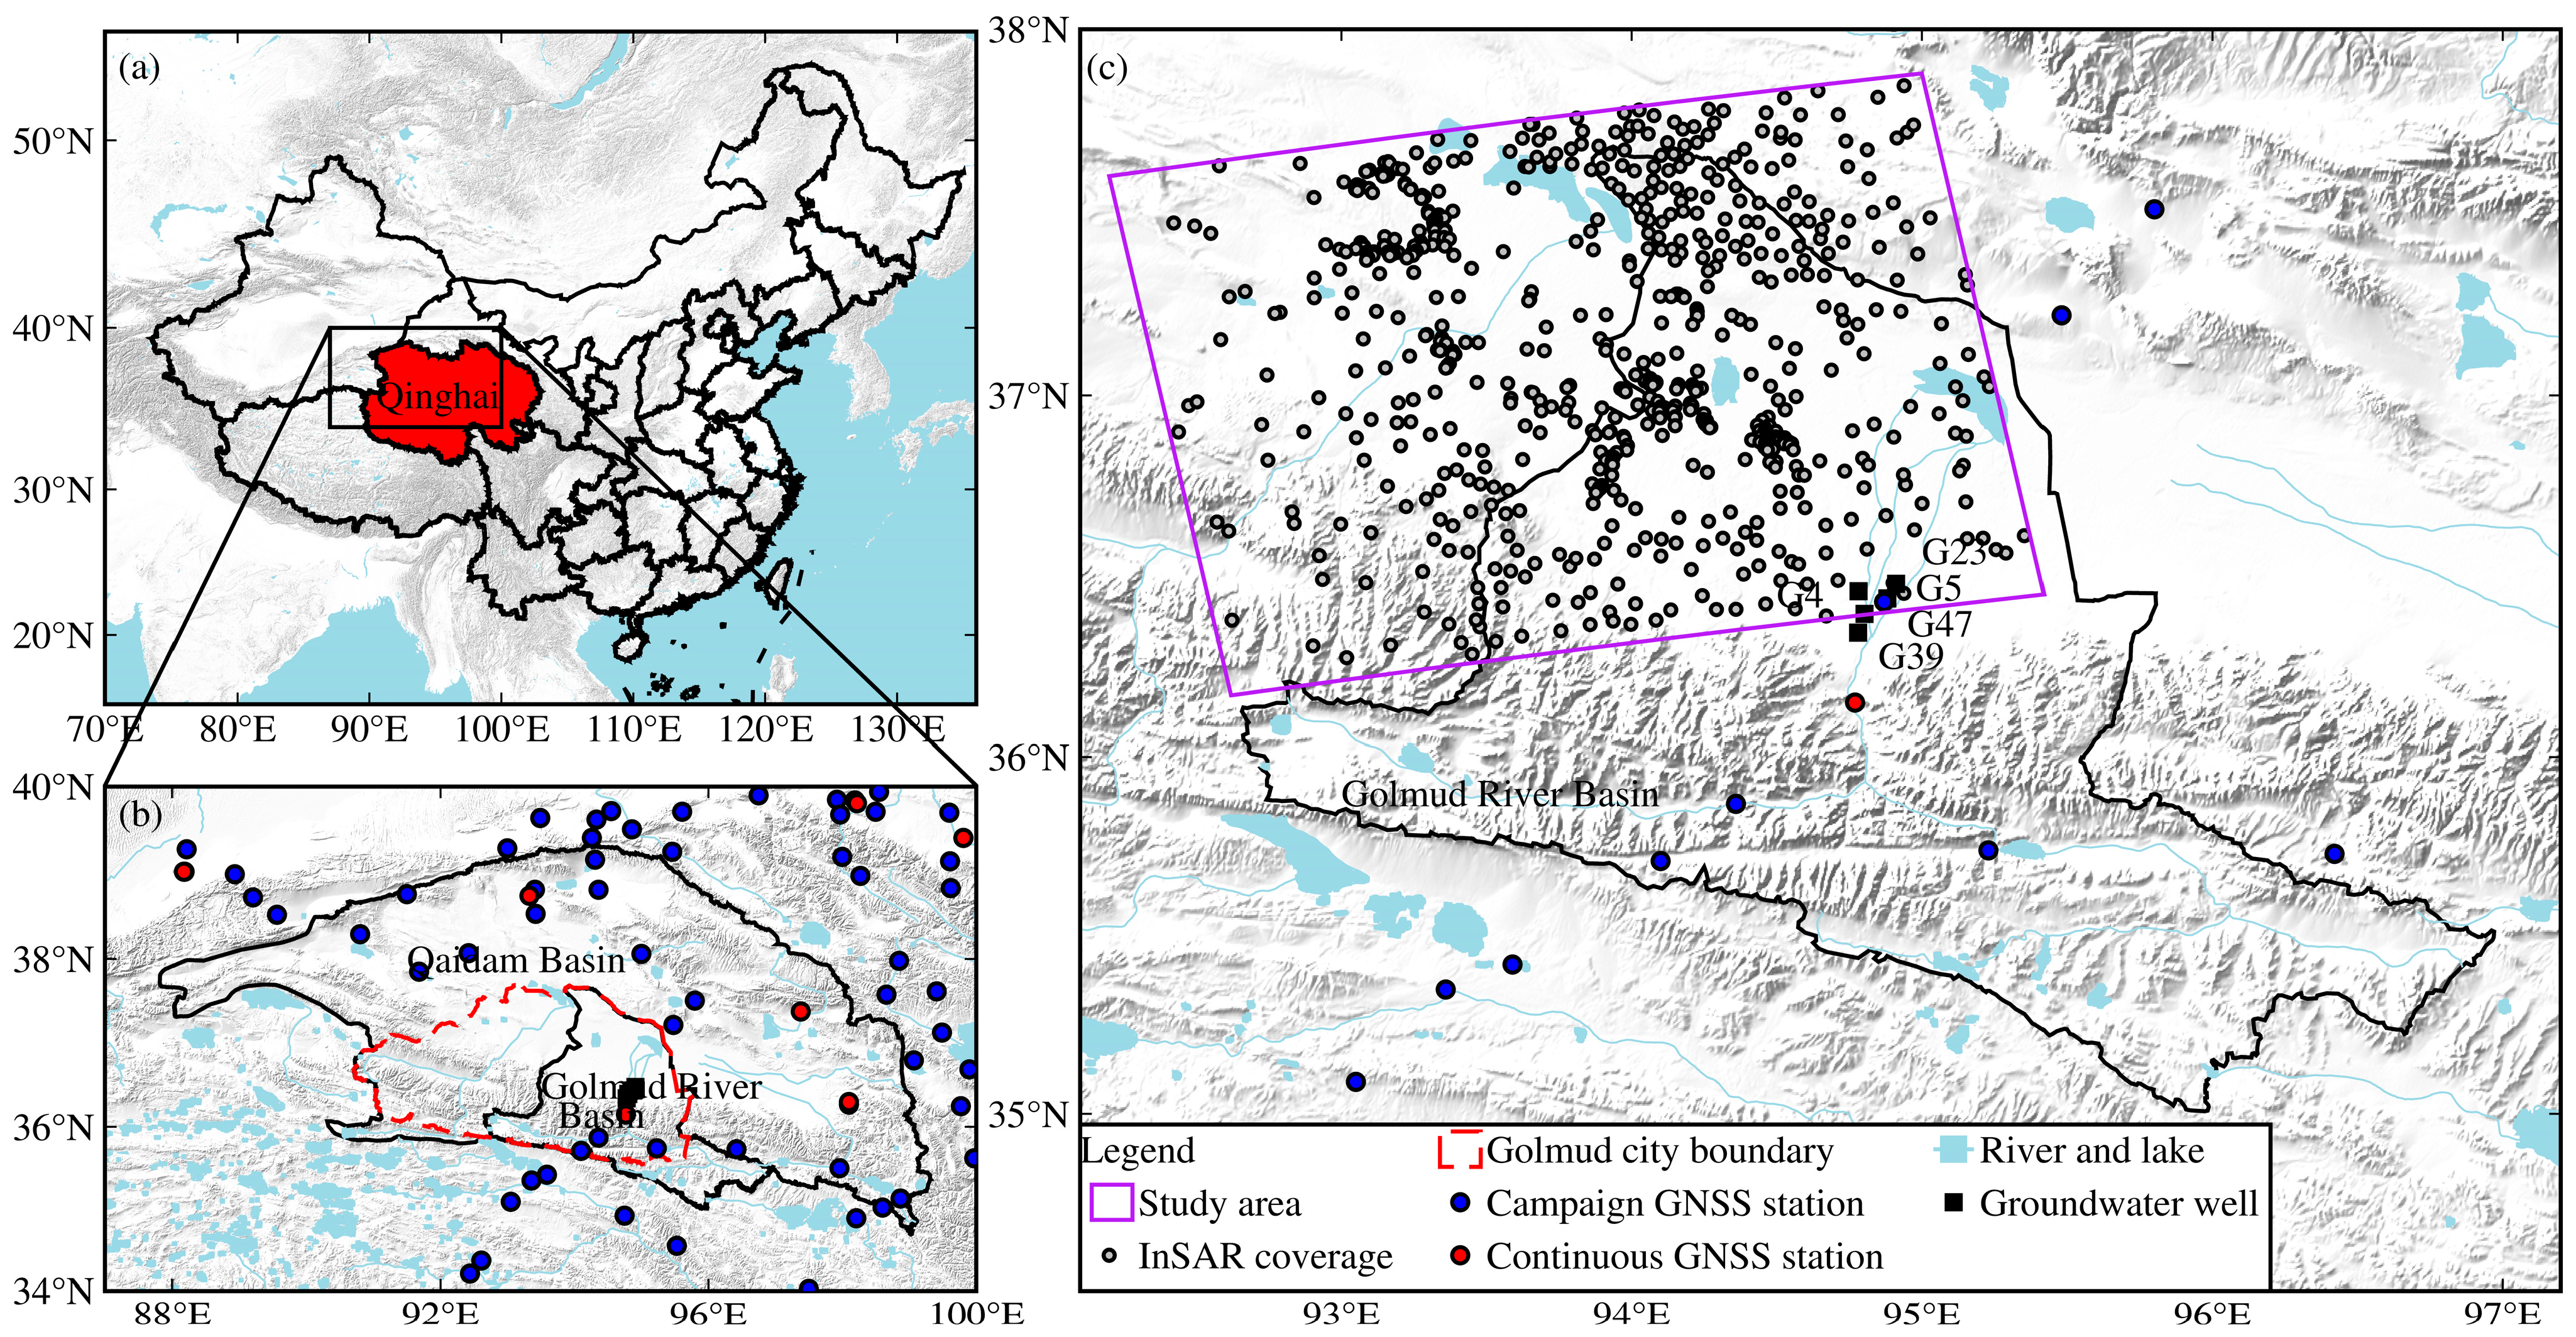
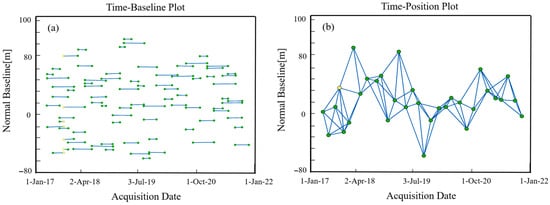
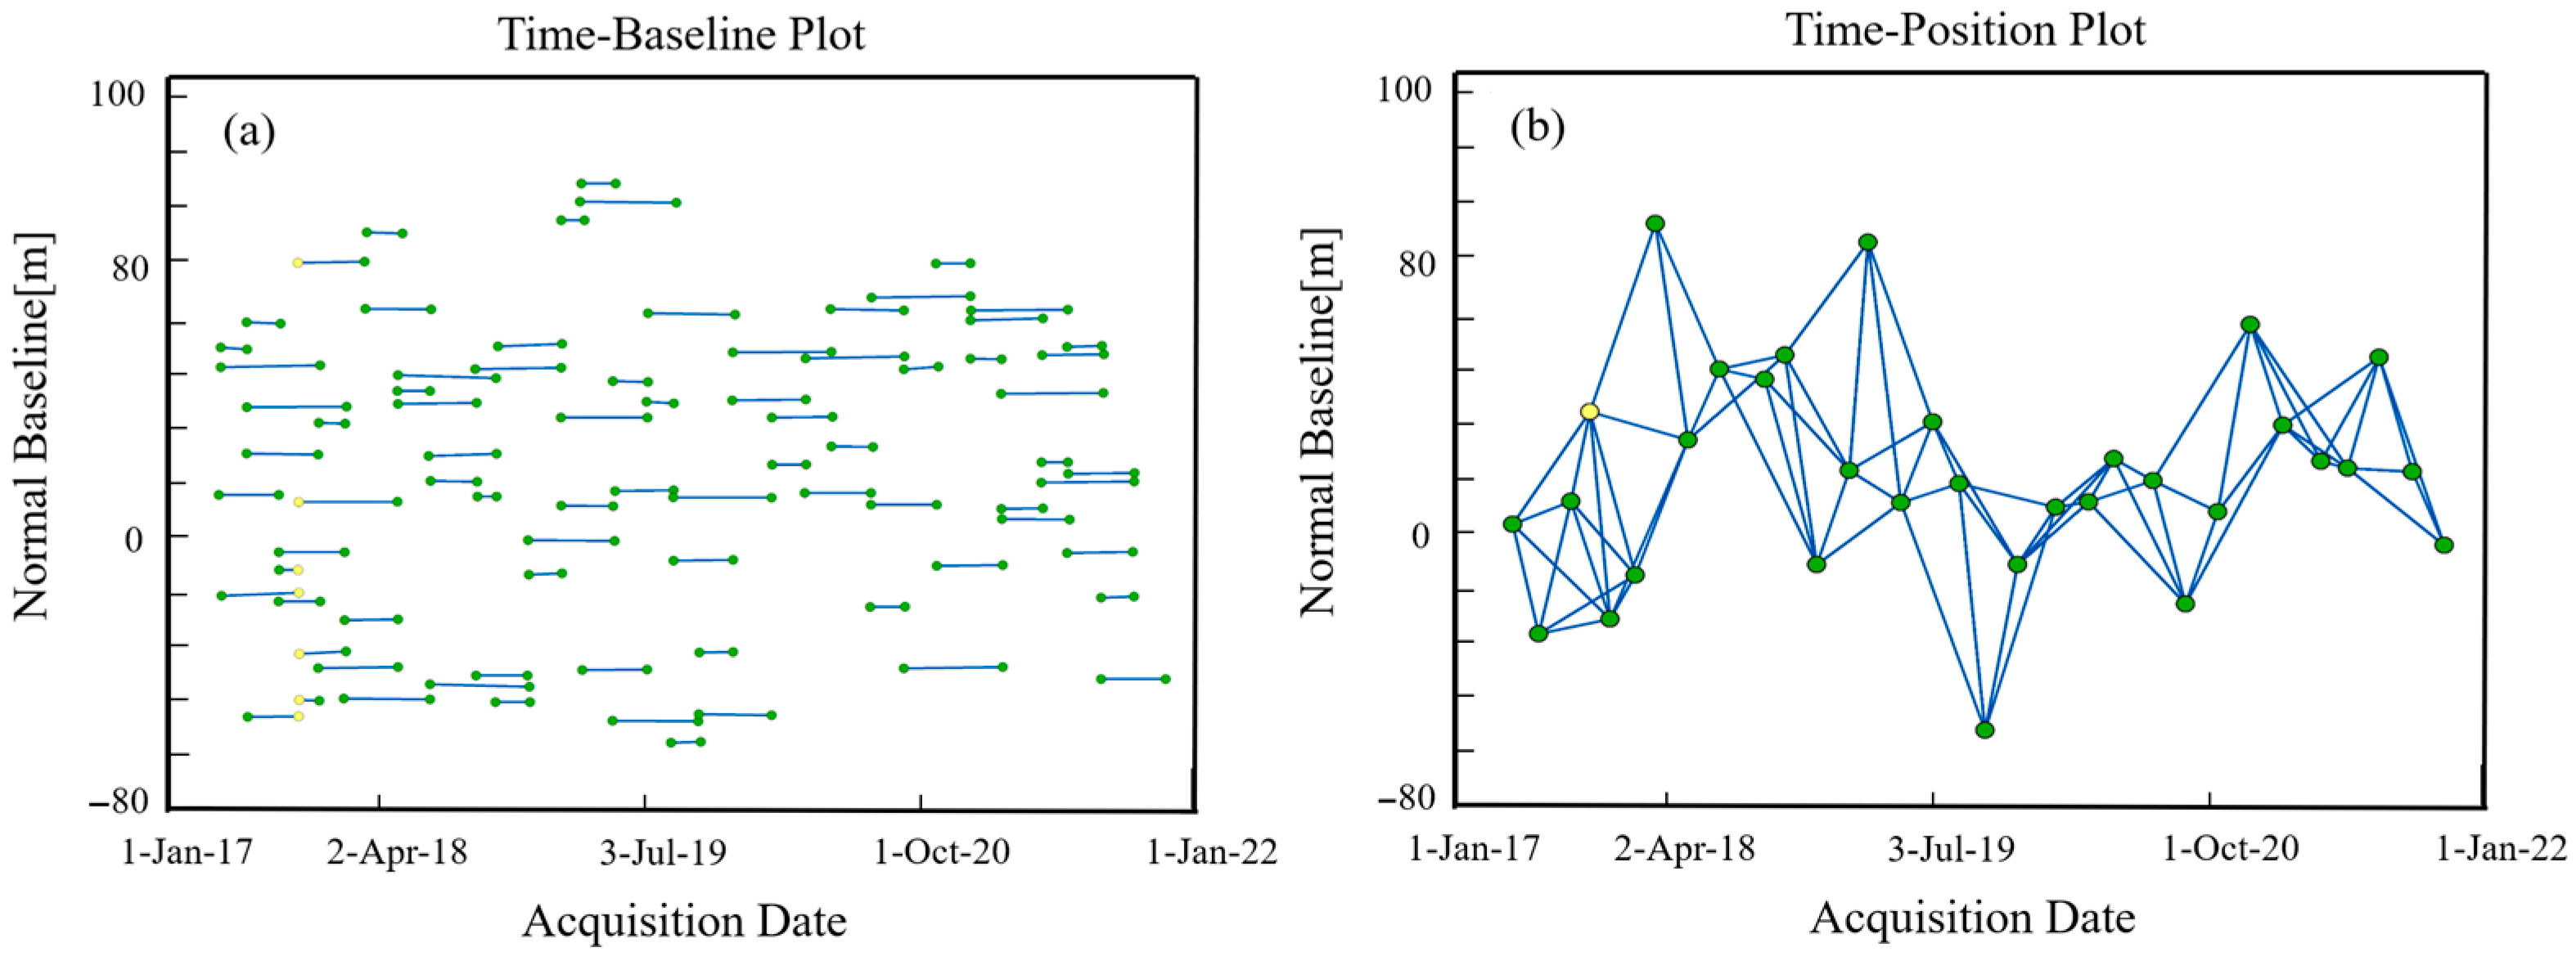
The topography of the Golmud River Basin and the distribution of various observation data are shown in Figure 1. The radar data and precise orbit data used in this study are obtained from the Sentinel-1 satellite imagery provided by the Copernicus Open Access Hub of the European Space Agency Copernicus Data Space Ecosystem. The InSAR dataset covers the period from March 2017 to December 2021, as shown in Table 1. A total of 32 single-look complex (SLC) images covering the study area were acquired, and the baseline connections between the images are shown in Figure 2. The imaging mode is Interferometric Wide Swath (IWS) mode, with a swath width of approximately 250 km and a spatial resolution of about 5 m × 20 m. The orbit direction is ascending, and the polarization mode is VV polarization. Compared with Ground Range Detected (GRD) data, SLC data retain both amplitude and phase information, making them more suitable for interferometric processing and deformation monitoring [29].
Figure 1.
Topography of the Golmud River Basin and distribution of observation data. (a) Location of Qinghai Province within China; (b) Location of the Golmud River Basin within the Qaidam Basin; (c) Topographic map of the study area, showing the coverage of multi-source observations.
Table 1.
Basic information of InSAR data.
Figure 2.
Temporal baseline (a) and spatial baseline (b) of InSAR images. Yellow dots denote master images, and green dots represent secondary images.
2.1.2. InSAR Deformation Estimation Method
Small Baseline Subset Interferometric Synthetic Aperture Radar (SBAS-InSAR) is an advanced surface deformation monitoring technique based on the principle of radar interferometry. Its basic principle is to use SAR images from different acquisition times for interferometric processing and extract phase difference information, thereby inverting centimeter-level and even millimeter-level surface deformation results [30]. Compared with traditional ground-based monitoring methods, SBAS InSAR not only enables large-scale coverage and high-precision measurement, but also has unique advantages such as long-term continuous observation, all-day and all-weather imaging. Therefore, it has been widely applied in fields such as geohazard monitoring and urban subsidence studies [31].
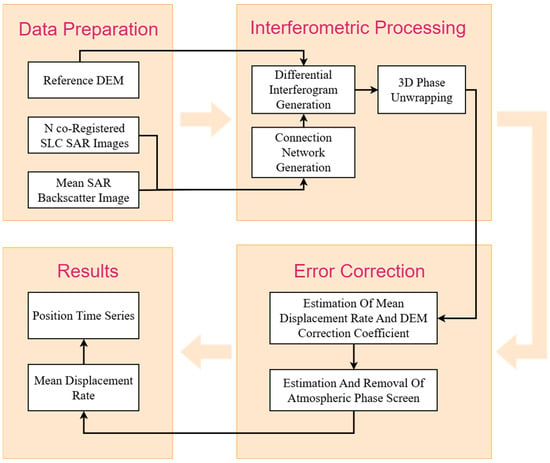
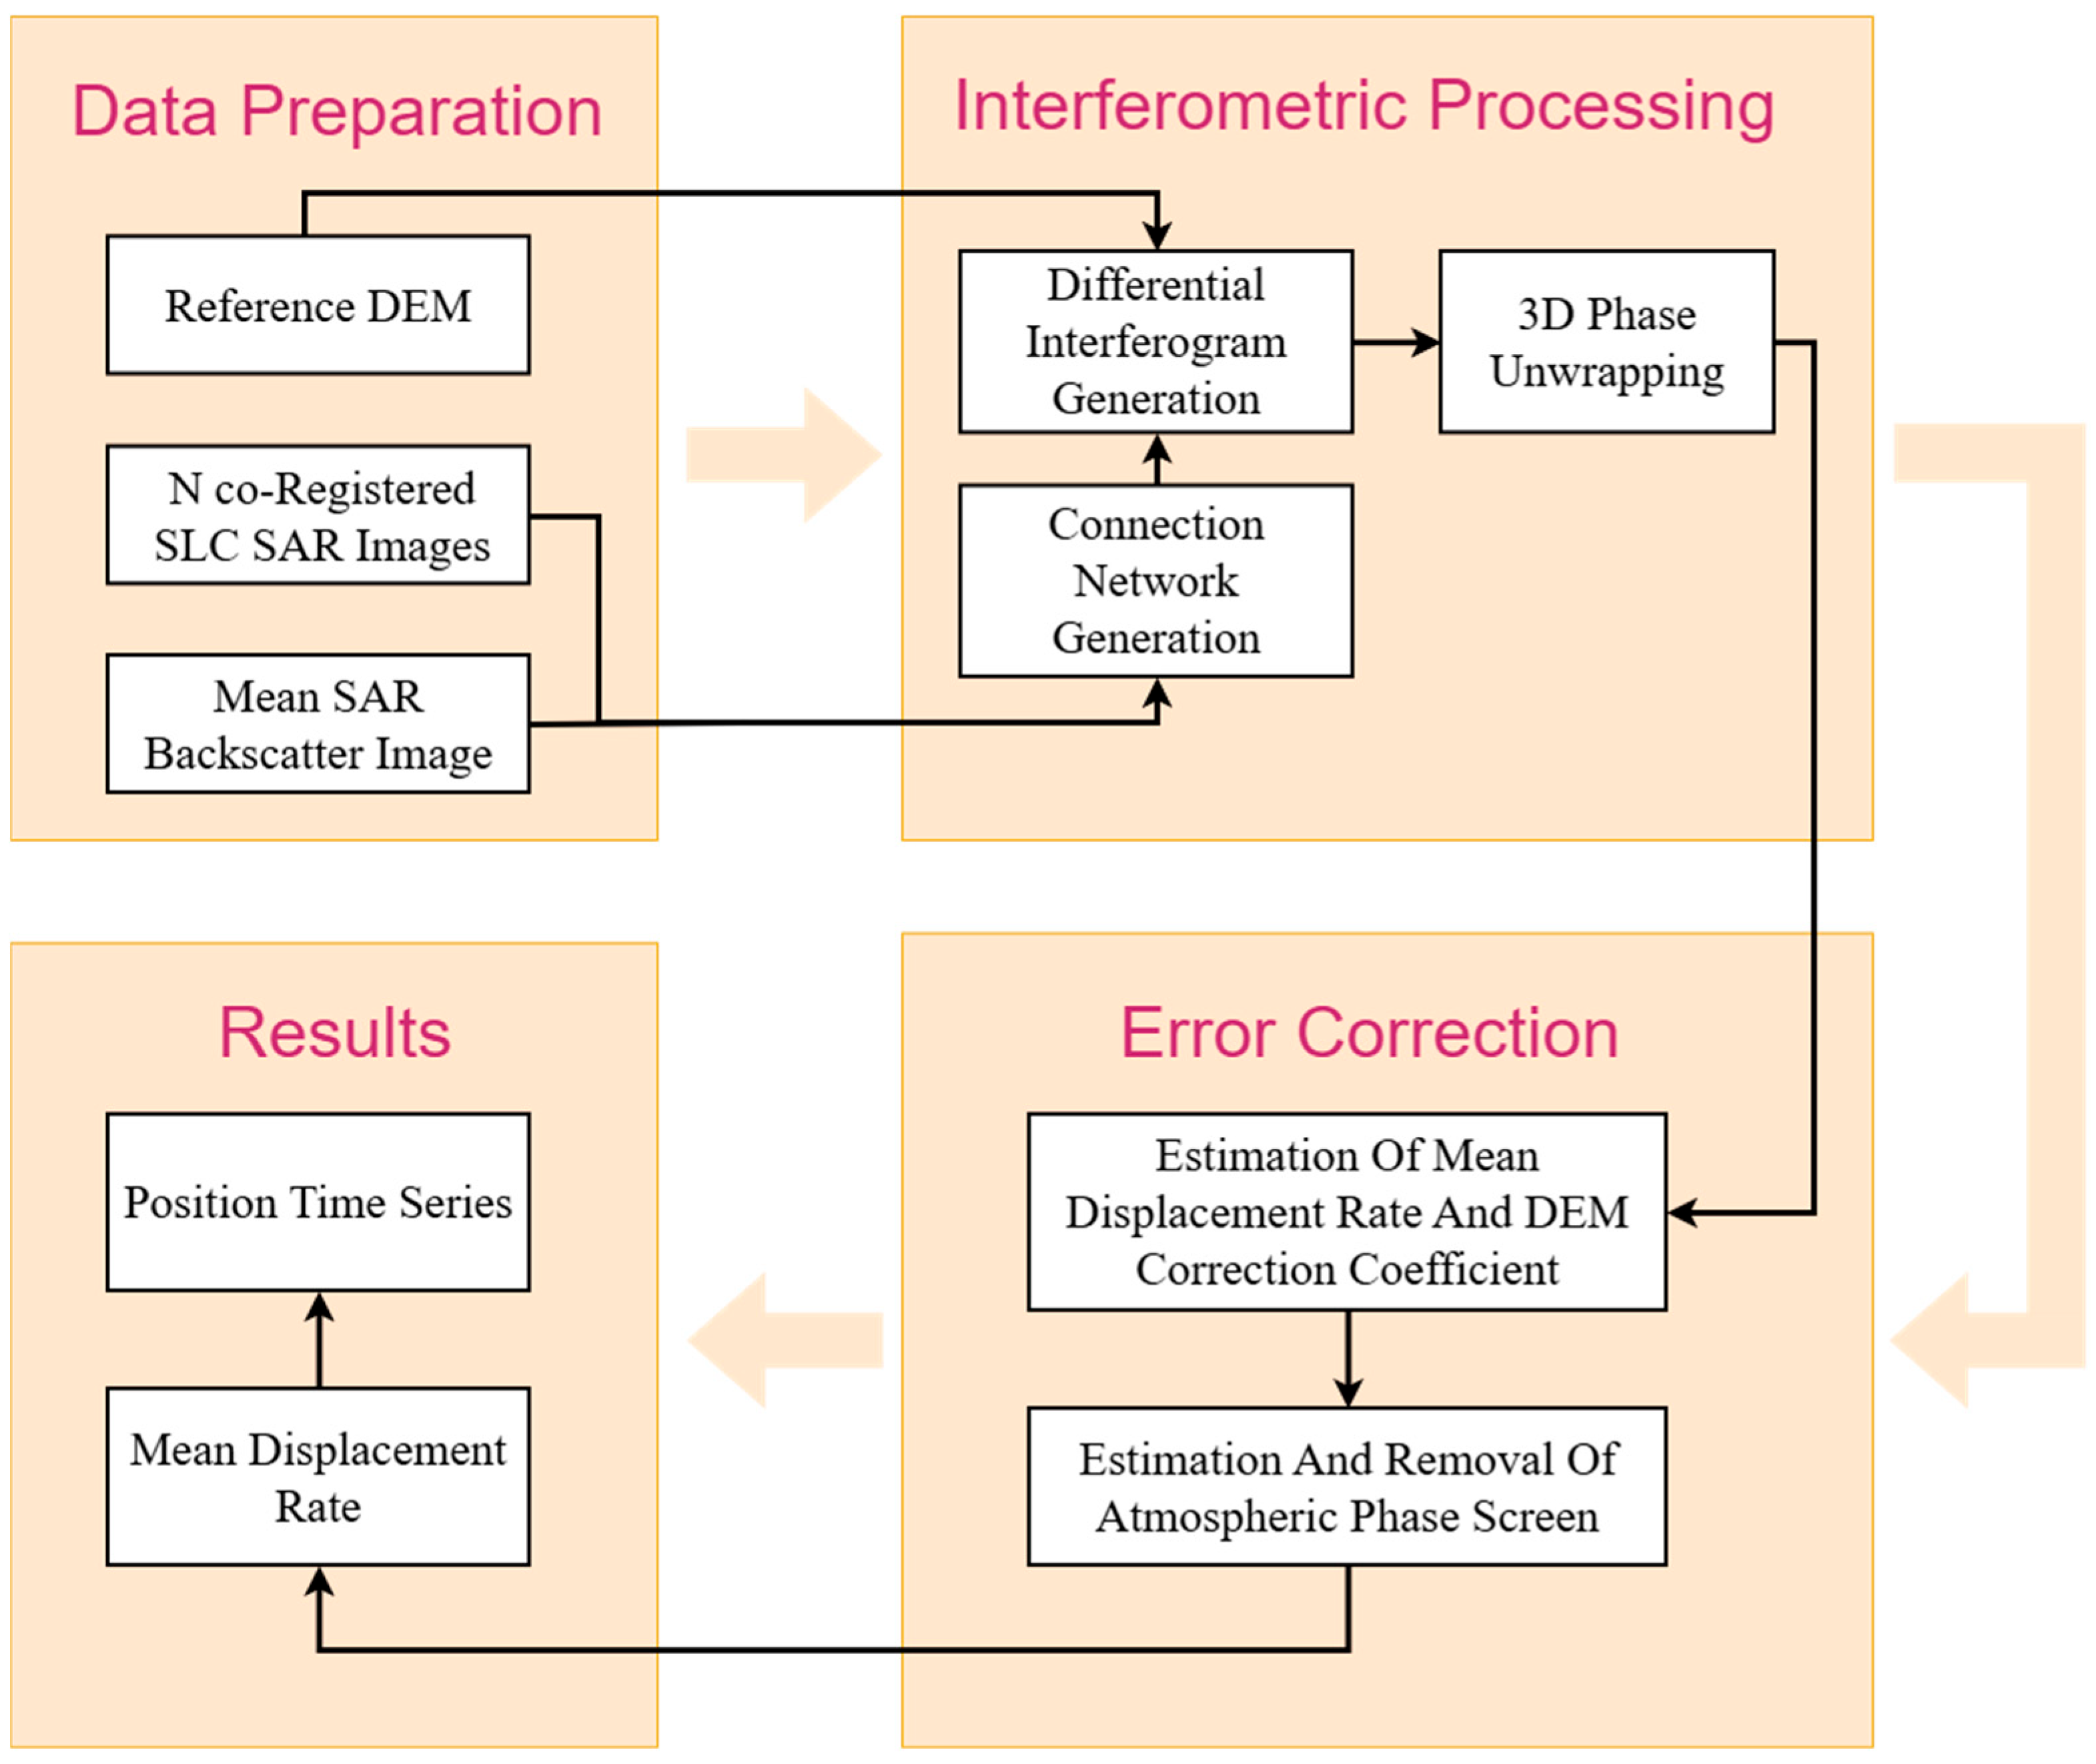
To assess the surface subsidence risk in the Golmud River Basin and to analyze the role of the river in the subsidence evolution process, this study uses Sentinel-1 satellite data and applies SBAS-InSAR technology to monitor and analyze surface deformation in the Golmud River Basin, investigating the spatiotemporal characteristics and patterns of subsidence evolution from 2017 to 2021 in the study area. The SBAS-InSAR processing chain mainly includes interferogram generation, denoising and filtering, phase unwrapping, and time series inversion steps (Figure 3) [32]. In the SBAS-InSAR data processing, interferometric pairs that do not satisfy the spatiotemporal baseline thresholds are first removed to construct a connected network. After Goldstein filtering for noise reduction, three-dimensional phase unwrapping is performed using the minimum cost flow method [33]. Atmospheric phase errors are corrected based on the model from the Generic Atmospheric Correction Online Service (GACOS), followed by orbit refinement and DEM error correction [34,35]. The outputs are then projected into the WGS-84 geographic coordinate system with a spatial resolution of 30 m, and converted into line-of-sight (LOS) deformation, yielding surface deformation time series.
Figure 3.
SBAS-InSAR technical flowchart.
The relationship between InSAR LOS deformation and the three-dimensional surface deformation can be expressed as follows:
where dE and dN represent the eastward and northward horizontal deformations (positive eastward and northward), respectively, and dU is the vertical deformation (positive upward); θ is the radar incidence angle, ranging from 31° to 41° (with an average value of approximately 36°) across the study area; α is the azimuth of the LOS vector. The ascending Sentinel-1 orbit adopted in this study has a satellite heading of approximately 349° (11° west of north). Since Sentinel-1 operates in the right-looking imaging mode, the radar LOS direction is perpendicular to the orbit heading and points to the right side of the flight direction, yielding a corresponding LOS azimuth angle of approximately 79°. Based on Equation (1), the average projection weights for vertical, eastward, and northward displacements along the LOS direction are about 0.81, 0.58, and 0.11, respectively. In our study, the potential contribution of horizontal tectonic deformation to the LOS signal is neglected, and the LOS deformation is converted to vertical deformation via .
dLOS = dEsinθsinα + dNsinθcosα + dUcosθ
2.1.3. Principle of Land-Water Storage Inversion Based on Surface Deformation
The study area is first divided into a series of grid cells, and these grid cells are replaced by disk elements. The radius of each disk is then calculated such that its area is equal to that of the corresponding grid cell. The vertical displacement of the Earth’s surface induced by a load disk, with upward positive, can be expressed as [20]:
where hn represents the load Love numbers for vertical and horizontal loading [36], G is the gravitational constant; R is the Earth’s radius, g is the gravitational acceleration, Pn is the Legendre polynomial, and θ is the angular distance. The specific form of Γn is given as follows:
In regional surface mass change studies, the mass variation within each grid cell induces vertical elastic deformation of the crust at surrounding observation stations. This relationship can be expressed as follows:
where is the vertical deformation observation vector. Gn×m is the Green’s function matrix used to establish the relationship between grid cells and observations, which is calculated from Equation (1). represents the terrestrial water storage change at grid points in the study area, expressed as equivalent water column height. is the observation residual vector.
u = Gh + ε
Considering the smoothness and continuity of terrestrial water storage distribution, the Laplacian operator [37] is adopted in this study as the regularization matrix to construct the following least squares inversion model:
where f(h) is the objective function, λ is the regularization parameter, and L is the Laplacian constraint matrix:
f(h) = ‖Gh − u‖2 + λ2‖Lh‖2 → min
Finally, the expression for retrieving terrestrial water storage changes (expressed as equivalent water column height) based on crustal deformation is given as follows:
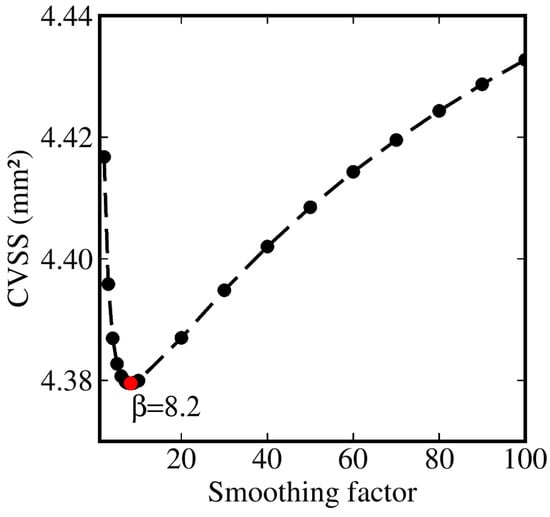
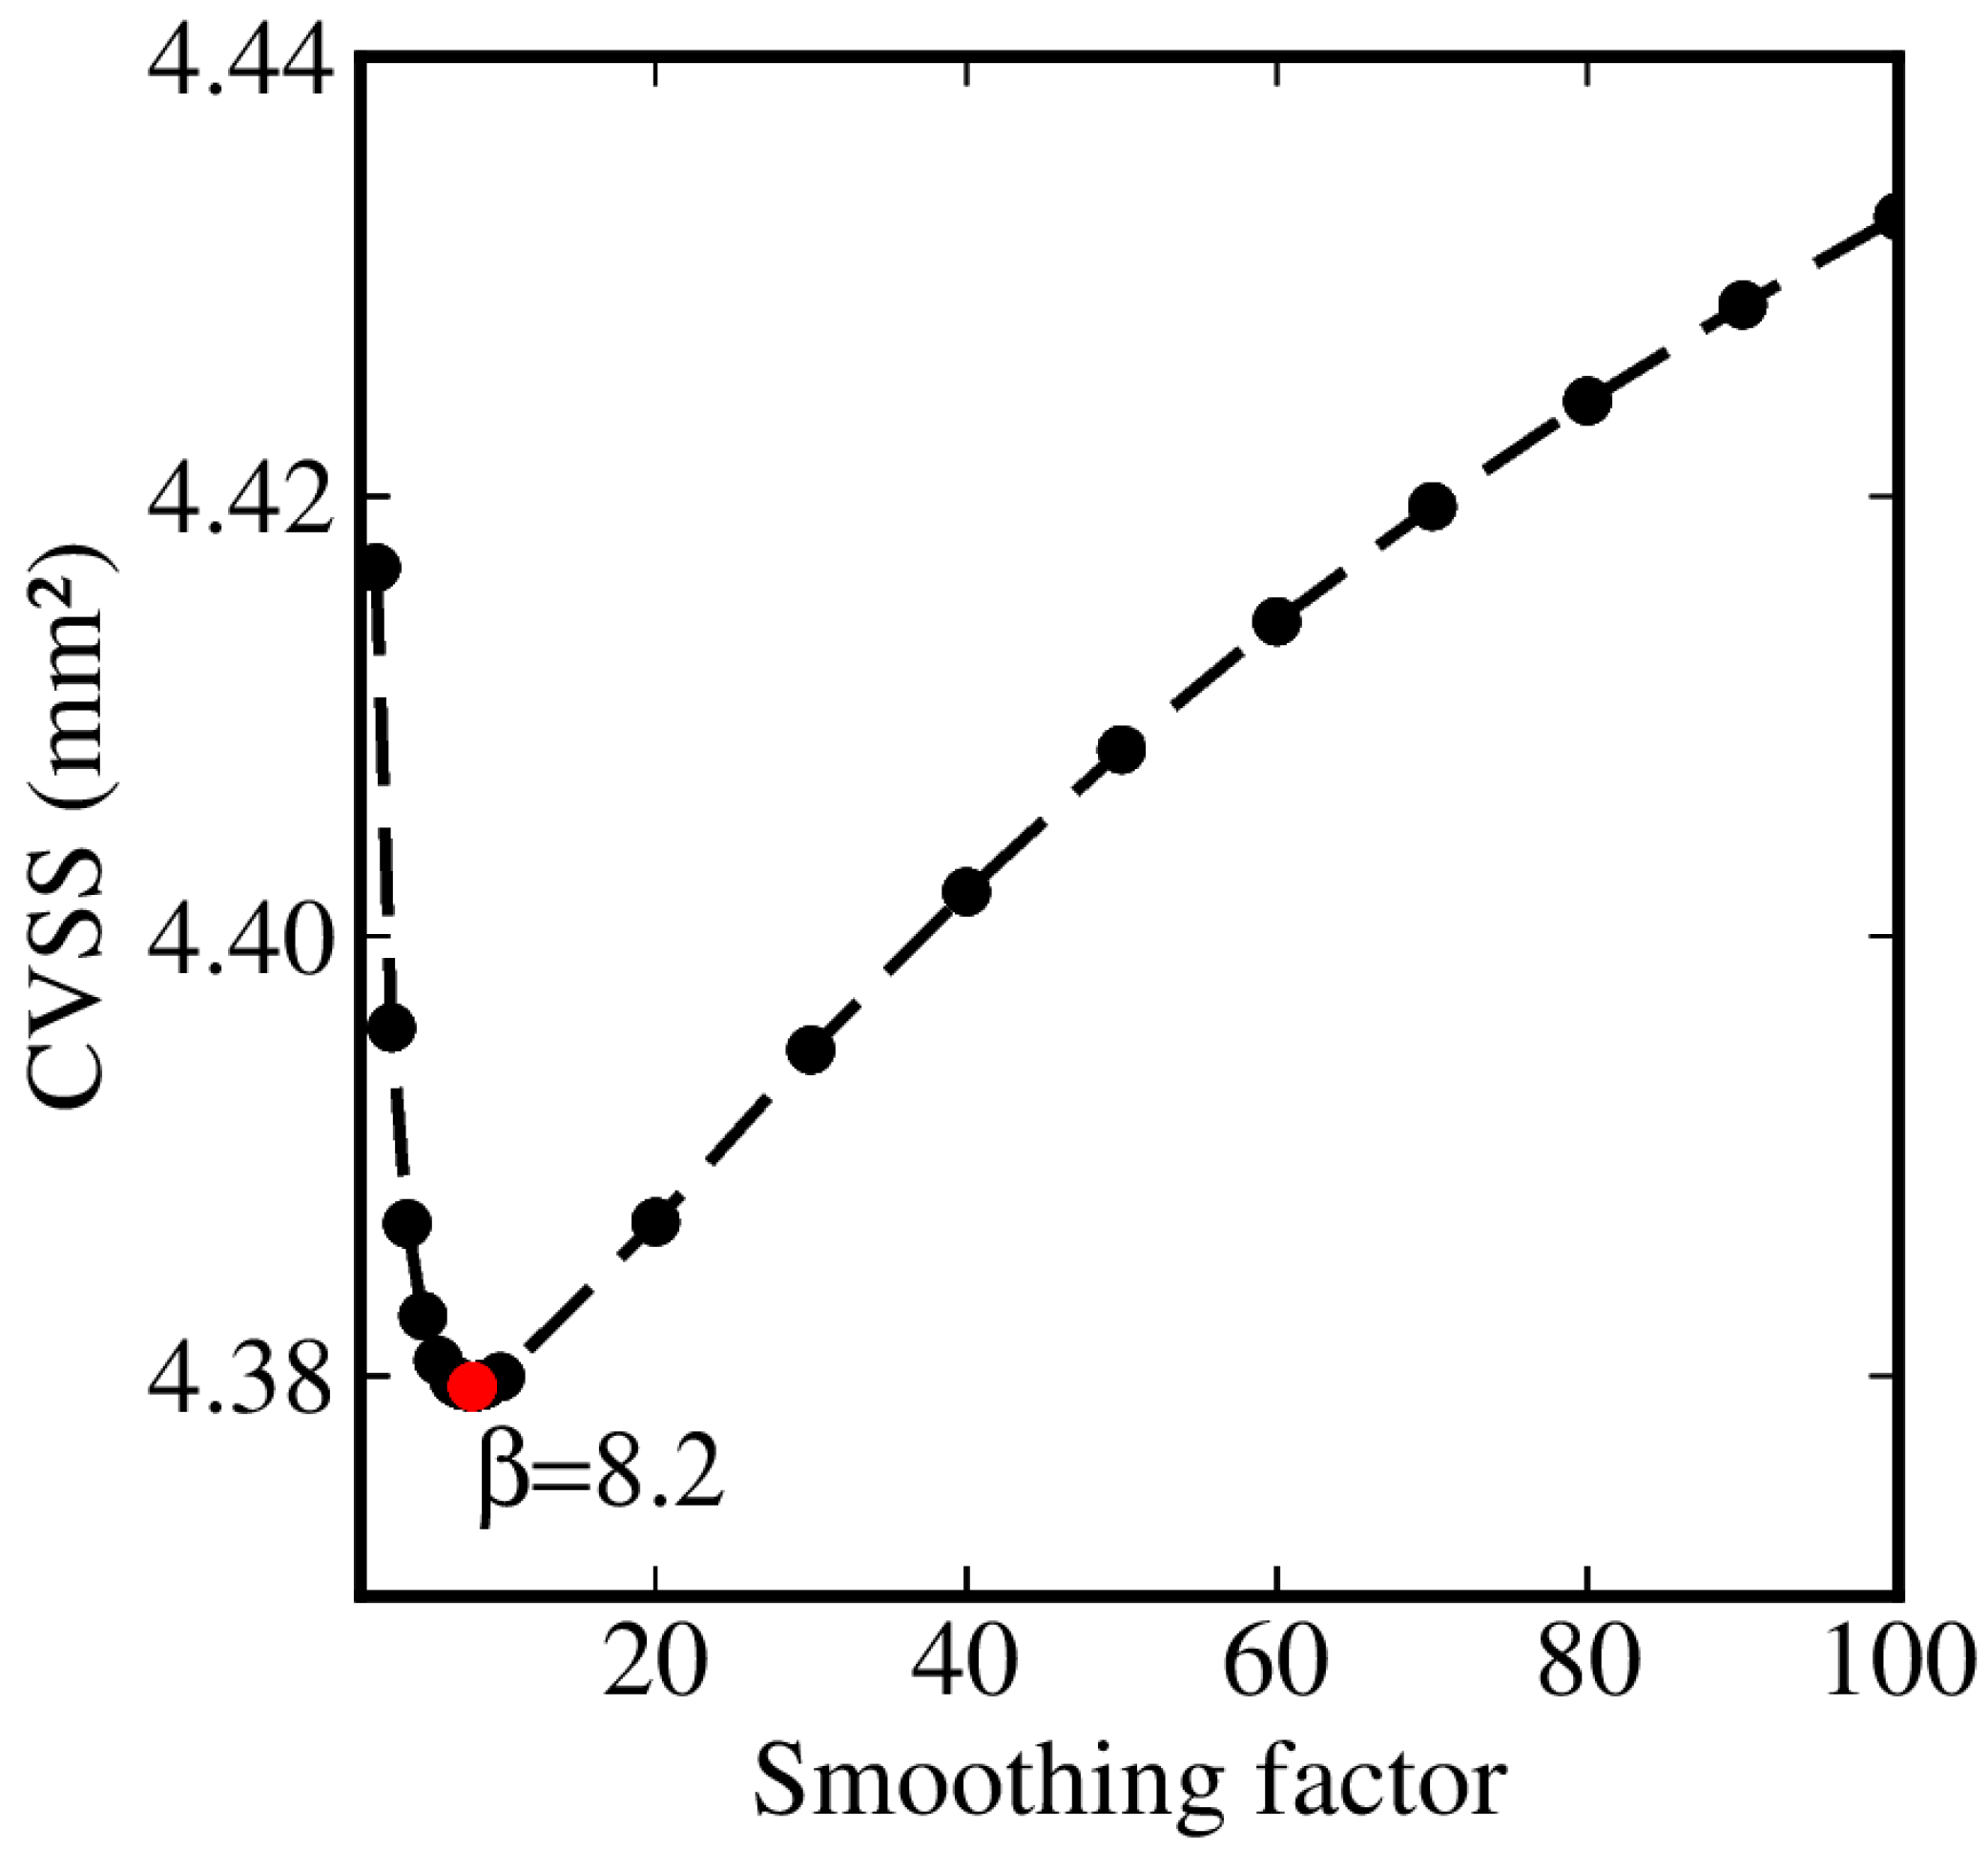
Spatial block cross-validation [38] was adopted to account for the potential spatial correlation among neighboring InSAR observations and to provide a more realistic assessment of the spatial generalization of the inversion. The 795 InSAR observations were sorted according to longitude and divided into four spatially contiguous blocks with approximately equal numbers of observations (198–199 observations per block). In each fold, one block was withheld for validation, while the remaining three blocks were used to estimate the equivalent water height (EWH) distribution. The vertical displacements at the withheld observations were then predicted using forward modeling. A series of smoothing factors was tested, and the cross-validation sum of squares (CVSS) of the differences between the observed and predicted displacements was calculated for each factor. The smoothing factor corresponding to the minimum CVSS was selected for the final inversion. The resulting optimal smoothing factor is 8.2, corresponding to the minimum CVSS shown in Figure 4.
Figure 4.
Spatial block cross-validation sum of squares (CVSS) as a function of the smoothing factor.
2.2. Satellite Gravimetry Mass Field
This study uses the GRACE satellite gravimetry RL06.3 Mascon product released by the Center for Space Research (CSR), University of Texas at Austin, to estimate land water storage change time series. The CSR RL06.3 Mascon product is a monthly mass field model with a grid resolution of 0.25° × 0.25°. During product generation, standard preprocessing of spherical harmonic coefficients has been applied, including replacement of the C20 and C30 terms, addition of degree-1 terms, removal of glacial isostatic adjustment (GIA) effects, and ellipsoidal corrections (https://www2.csr.utexas.edu/grace/, accessed on 11 October 2026). The Mascon product provides the global mass field in the form of EWH and generally does not require further processing, making it directly applicable for analyzing global or regional terrestrial water storage variations [39].
2.3. Groundwater Signal Separation Method
Based on the water balance principle, terrestrial water storage anomalies (TWSA) in the study area are primarily composed of groundwater storage anomalies (GWSA), soil moisture storage anomalies (SMSA), and snow water equivalent anomalies (SWEA). Other water storage components, mainly associated with lake storage in the study area, are neglected because their temporal variations are negligible compared with the regional TWSA and GWSA variations. Therefore, GWSA can be derived by isolating SMSA and SWEA from the TWSA, i.e., GWSA = TWSA − SMSA − SWEA [40].
The SMSA and SWEA data used in this study are derived from the following two land surface data assimilation models. The first dataset is the GLDAS_NOAH monthly product at 0.25° × 0.25° spatial resolution, based on the Noah land surface model within the Global Land Data Assimilation System (GLDAS). The second dataset is the ERA5-Land monthly averaged product, which is a land surface component product of the fifth-generation reanalysis system ERA5 produced by the European Centre for Medium-Range Weather Forecasts (ECMWF), with a spatial resolution of 0.1° × 0.1°. For the InSAR-based terrestrial water storage inversion results (0.4° × 0.4°), the spatial resolution of the two land surface models is unified to a 0.4° grid using bilinear interpolation and spatial aggregation. For the GRACE gravimetry-based terrestrial water storage inversion results (0.25° × 0.25°), the ERA5-Land model is resampled to a 0.25° grid through spatial aggregation to match the grid resolution of the CSR Mascon product.
2.4. Auxiliary Data
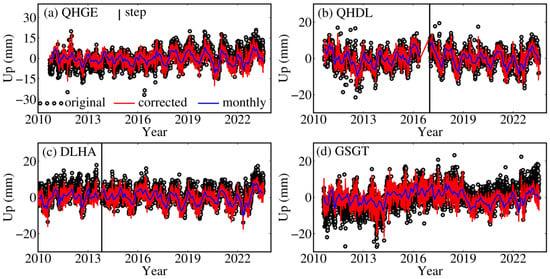
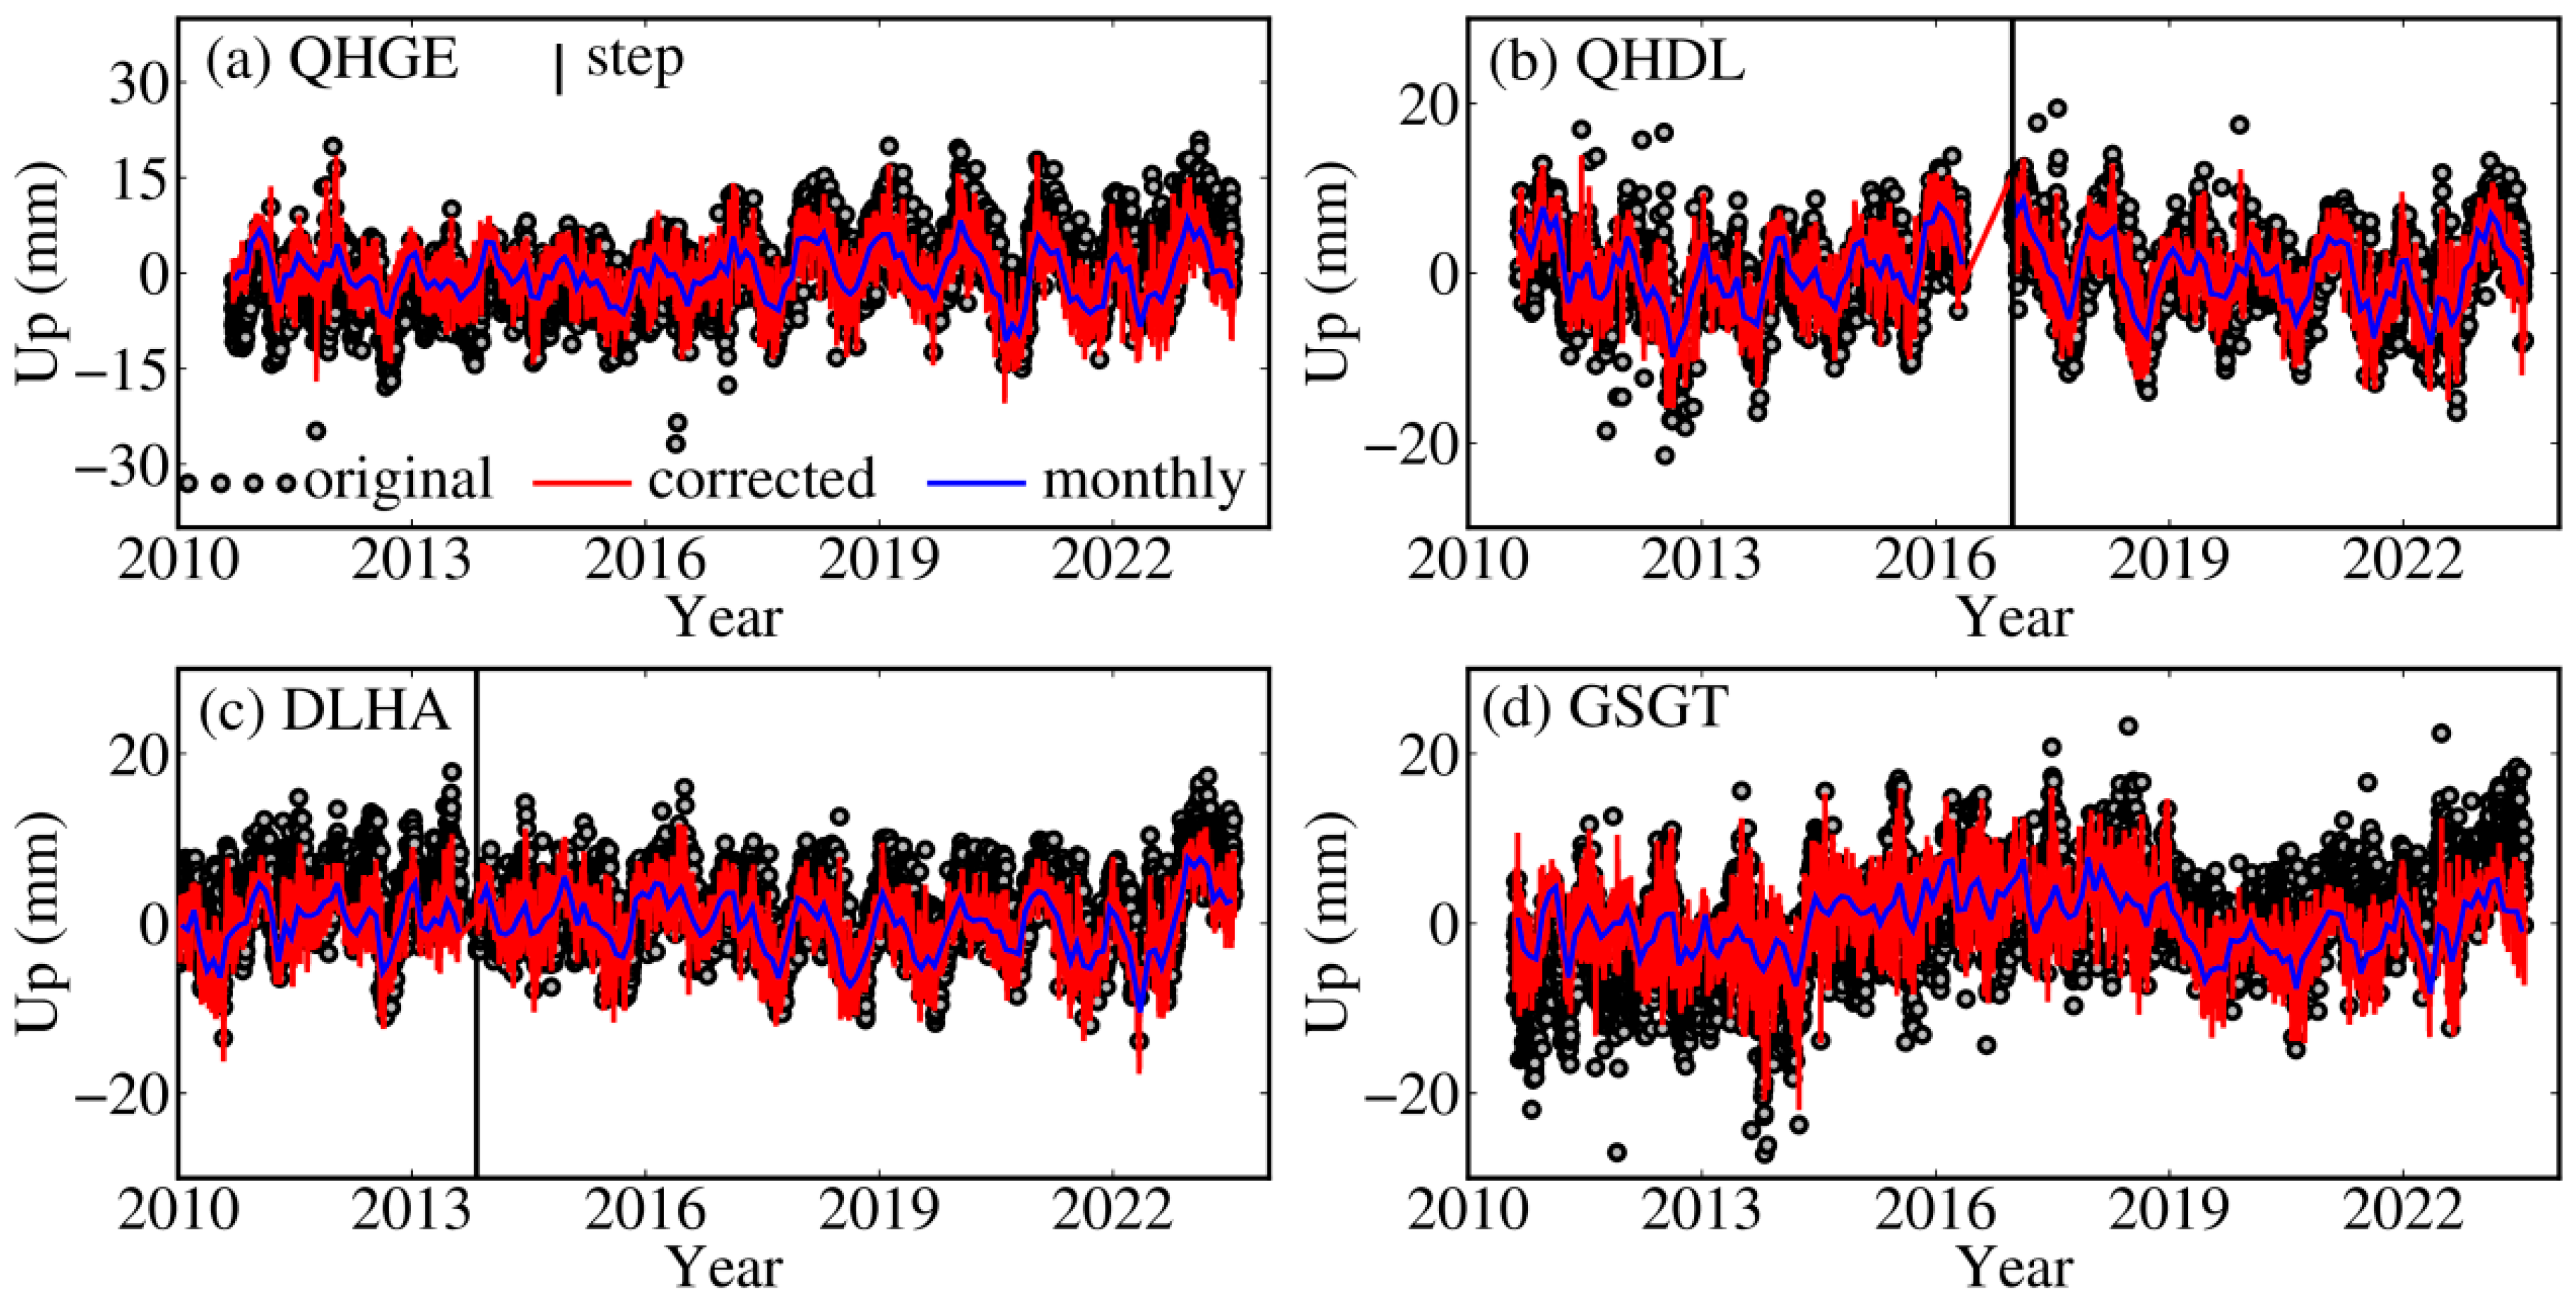
For GNSS data, the three-dimensional displacement time series products of the Crustal Movement Observation Network of China (CMONOC) are used, released by the National Earthquake Data Center/Eastern Deformation Data Center. In this study, vertical displacement time series from four GNSS stations located within the Golmud River Basin and the surrounding Qaidam Basin (Figure 5) are selected as calibration points for the InSAR-derived deformation results. The preprocessing of GNSS time series includes the following: (i) corrections for GIA and non-tidal atmospheric loading and non-tidal ocean loading; (ii) construction of a time series functional model to correct step offsets in the GNSS time series caused by instrument changes and coseismic deformation, as well as post-seismic relaxation signals [41,42]. In addition, considering that the study area is located on the southeastern margin of the Tibetan Plateau where present-day tectonic uplift is significant, the mean value of the linear trend fitted over a 13-year span from the four GNSS vertical displacement series is used as the tectonic background field and is removed from the InSAR-derived deformation field. The vertical deformation trends and uncertainties of the four GNSS stations are 0.74 ± 0.02 mm/a at QHGE, 0.12 ± 0.03 mm/a at QHDL, 0.24 ± 0.02 mm/a at DLHA, and 0.86 ± 0.02 mm/a at GSGT, respectively, and the tectonic background field is estimated to be 0.49 mm/a.
Figure 5.
Vertical displacement time series of GNSS continuous stations in the Golmud River Basin and the Qaidam Basin. (a) Station QHGE; (b) Station QHDL; (c) Station DLHA; (d) Station GSGT.
As external validation data for the groundwater inversion results, we collected published in situ groundwater well level time series [2]. A total of five groundwater level time series are available, with the wells located in the central part of the Golmud River Basin. In addition, groundwater estimates from the WaterGAP Hydrology Model (WGHM) are used for comparative time series analysis. WGHM is a global water resources assessment and forecasting model developed by Goethe University Frankfurt, Germany [43], with a spatial resolution of 0.5° × 0.5° and temporal resolutions of 1 day and 1 month.
Non-tidal atmospheric and ocean loading effects, as well as GIA, can also induce crustal deformation and therefore act as interfering signals that must be removed from geodetic deformation observations prior to terrestrial water storage inversion. For the former, corrections are applied using the Earth System Modeling Group of GeoForschungsZentrum Potsdam (ESMGFZ) non-tidal atmospheric and ocean loading model provided by GFZ [44]. For the latter, to maintain consistency with the GRACE Mascon product, the ICE-6G_D GIA model is adopted for correction [45].
To investigate the causes of groundwater anomalies, precipitation, air temperature, and climate index data are also analyzed in this study. Precipitation estimates are derived from the average of two reanalysis datasets, ERA5-Land and the Global Precipitation Climatology Centre (GPCC) dataset. Air temperature estimates are obtained from the average of the ERA5-Land and the Global Historical Climatology Network and Climate Anomaly Monitoring System (GHCN_CAMS) datasets. The climate index used is the Multivariate El Niño–Southern Oscillation Index (MEI).
All the datasets used in this paper are summarized in Table 2 with specific information on the source, variable, and contribution.
Table 2.
Data summary.
3. Results
3.1. InSAR Surface Deformation
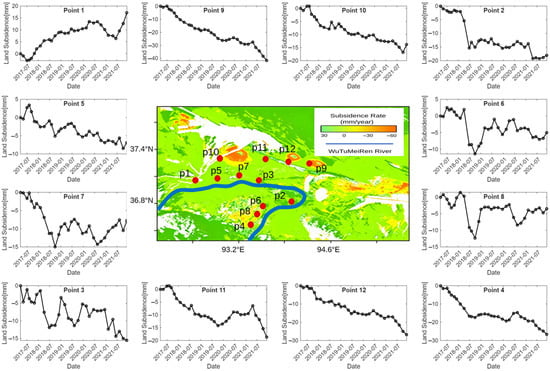
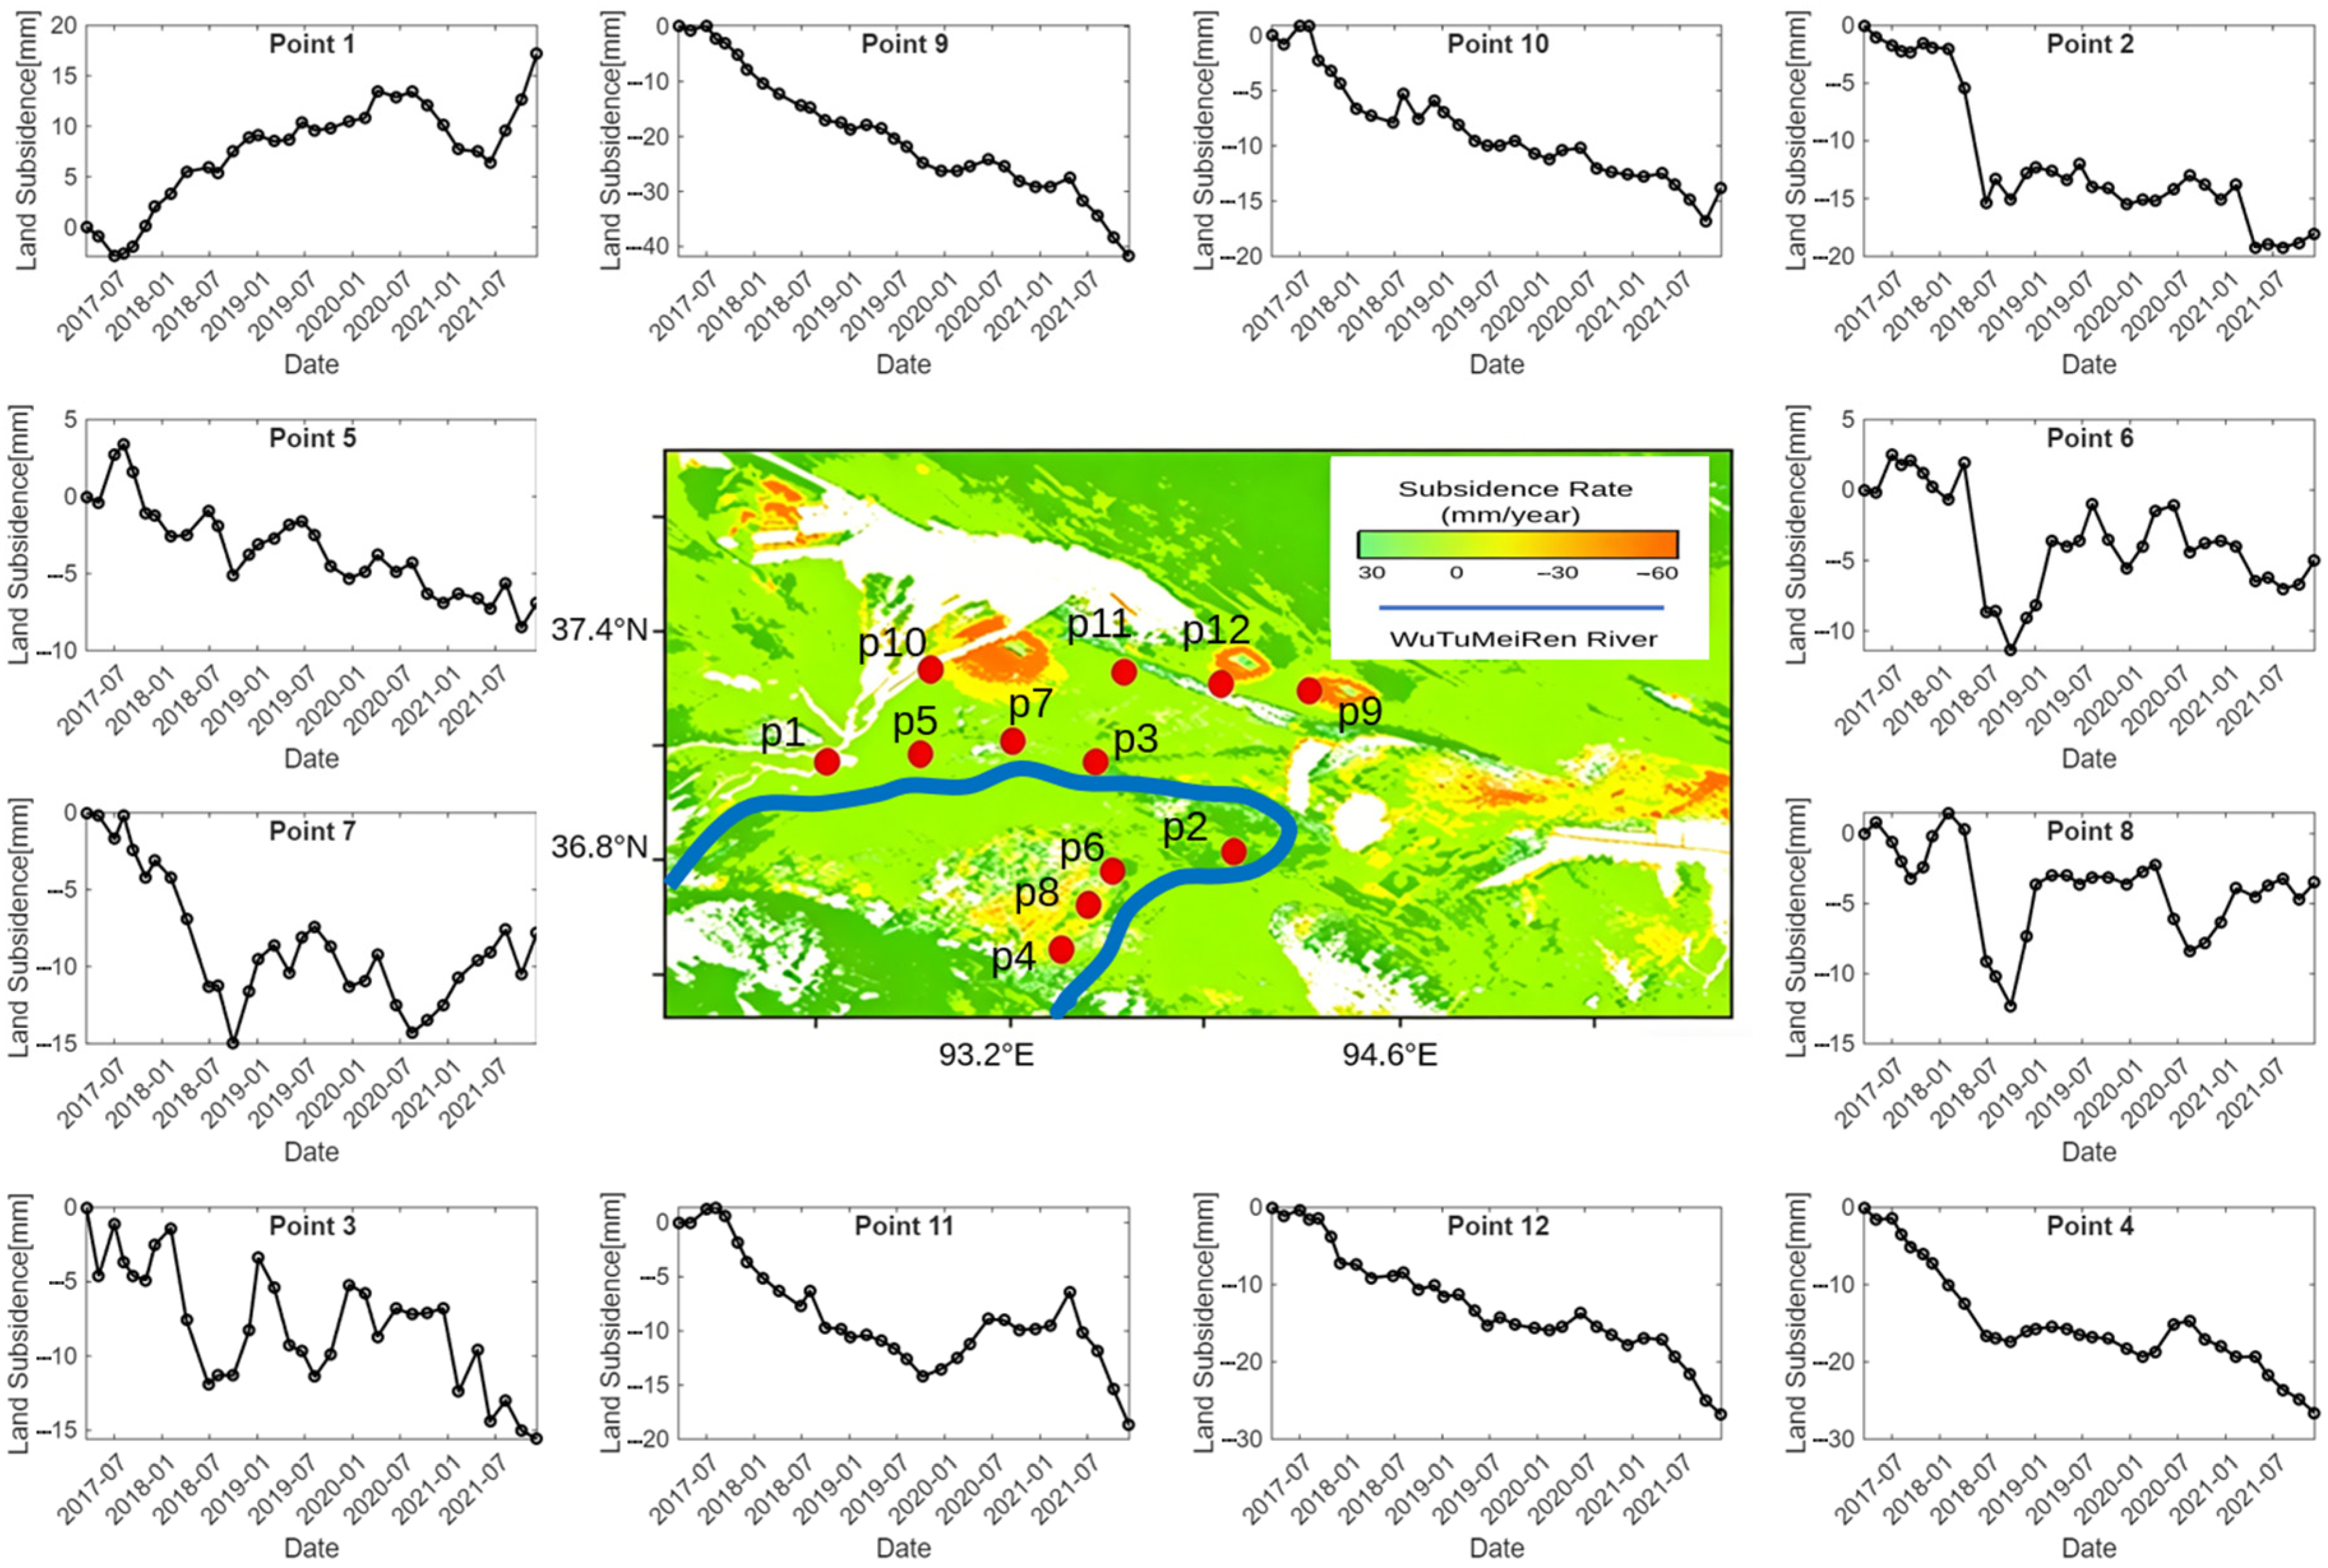
As shown in Figure 6, the annual surface deformation rates in the Golmud River Basin during 2017–2021 ranged from −60 mm/a to 6 mm/a. Subsidence (negative values) was the dominant deformation pattern, whereas uplift (positive values) occurred only in a few localized areas. Overall, the cumulative surface deformation exhibited a complex spatiotemporal pattern characterized by “dual-river belts, mining-related patches, and relatively stable urban areas”. Surface deformation was jointly controlled by fluvial processes, coal mining activities, and urban development, resulting in pronounced spatial heterogeneity.
Figure 6.
Spatial distribution of InSAR-derived surface deformation rates and deformation time series at selected locations in the Golmud River Basin.
From the spatial distribution perspective, four major deformation zones can be identified. The first is the Utu Meiren River deformation belt, which is distributed along both sides of the river. The main deformation is concentrated within 1 km of the riverbanks, while deformation in the outer areas is relatively subdued. The second is the Dazaohuo River deformation belt, which extends along the river and forms a broad deformation zone. This is the most intensely deformed belt in the basin, with significant deformation occurring within 2 km of both riverbanks. The third is the coal mining subsidence area in the northeastern part of the basin, where three isolated subsidence patches are observed. These subsidence zones exhibit well-defined boundaries and relatively uniform deformation within their interiors. The fourth is the area surrounding Golmud City in the southeastern part of the basin, where cumulative deformation is generally small. Only slight subsidence is observed in a few areas near the urban fringe, and no concentrated subsidence features have developed.
In terms of deformation rates, areas of high subsidence (red and orange zones, rates < −10 mm/a) are concentrated in two regions. The first is the coal mining subsidence area in the northeastern part of the basin (around Points 9–12), which appears as distinct orange patches with deformation rates ranging from −60 to −10 mm/a, consistent with localized subsidence induced by coal mining activities. The second is located along the Wutumeiren River (around Points 1–8), where orange and yellow zones extend along the river course and deformation rates also exceed −10 mm/a, reflecting the combined influence of hydrological processes and human activities. Areas of moderate subsidence (yellow zones, rates between −10 and −6 mm/a) are mainly distributed around the high-subsidence regions, including the expanded areas along both sides of the Wutumeiren River (around Points 6–8), covering a relatively large area. Areas characterized by low deformation or slight uplift (green zones, rates between −6 and 6 mm/a) occupy most of the basin, particularly in the desert regions far from the rivers and coal mining areas, as well as in the vicinity of Golmud City.
3.2. Groundwater Inversion from InSAR-Derived Deformation
3.2.1. Removal of Non-Hydrological Signals
The original InSAR-derived crustal deformation observations represent a composite geophysical signal affected by the coupling of multiple signal sources, including not only terrestrial hydrological signals but also non-hydrological signals associated with solid Earth dynamics and human activities. For hydrological loading studies, the major effects that need to be removed include poroelastic effects, anthropogenic surface deformation, atmospheric and ocean loading effects, and GIA effects.
Prior to the screening procedure, the InSAR vertical displacement time series were first referenced and calibrated using the GNSS observations, and the modeled non-tidal atmospheric loading (NTAL), non-tidal ocean loading (NTOL), and glacial isostatic adjustment (GIA) signals were removed from the InSAR observations. Thus, the subsequent screening was performed using the InSAR deformation time series after GNSS referencing/calibration and NTAL, NTOL, and GIA corrections. The observed and modeled deformation quantities used in the screening were therefore expressed in a consistent spatial reference and correction state.
For poroelastic effects, this study identifies and removes the corresponding signals based on the seasonal deformation characteristics and deformation magnitudes. We calculated the theoretical vertical deformation using a point-mass forward model on a 0.05° grid with the GRACE mass field. The modeled deformation rates range from −0.32 to −0.13 mm/a, while the annual deformation amplitudes range from 1.34 to 1.99 mm. Considering the additional uncertainties and localized signals in the InSAR observations, twice the maximum modeled magnitudes were adopted as practical screening thresholds, corresponding to −0.65 mm/a for the deformation rate and 4.0 mm for the annual amplitude. Accordingly, deformation rates outside the range of −0.65 to 0 mm/a were used to identify observations for exclusion. A targeted sensitivity test was conducted by relaxing the upper deformation-rate threshold from 0 to +0.50 mm/a while retaining all other screening criteria. This added 142 observations, increasing the total from 795 to 937. Although the two solutions showed quantitative differences in basin-average groundwater trends and annual amplitudes, their overall spatial patterns and temporal characteristics remained broadly consistent. The original screening criterion was therefore retained for the final inversion. Detailed numerical comparisons and spatial analyses are provided in the Supplementary Materials (Text S1 and Figures S1–S3). To further reduce spatial redundancy and improve data consistency, the observation points are spatially downsampled. Within a predefined neighborhood, observations with similar deformation characteristics are selectively subsampled to reduce spatial redundancy while maintaining adequate spatial coverage. In addition, the annual phase of each observation point is compared with those of neighboring points, and anomalous points with phases inconsistent with the surrounding observations are excluded.
For anthropogenic effects, deformation signals associated with intensive human activities, such as coal mining, are removed based on the spatial correspondence between the surface deformation pattern and areas of human activity. After the screening process, a total of 795 valid InSAR observation points are retained for the subsequent terrestrial water storage inversion analysis.
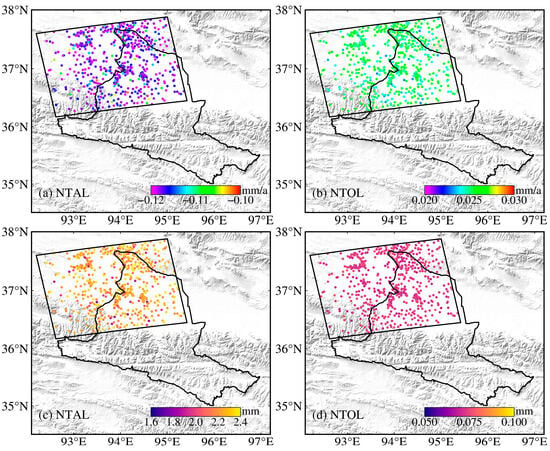
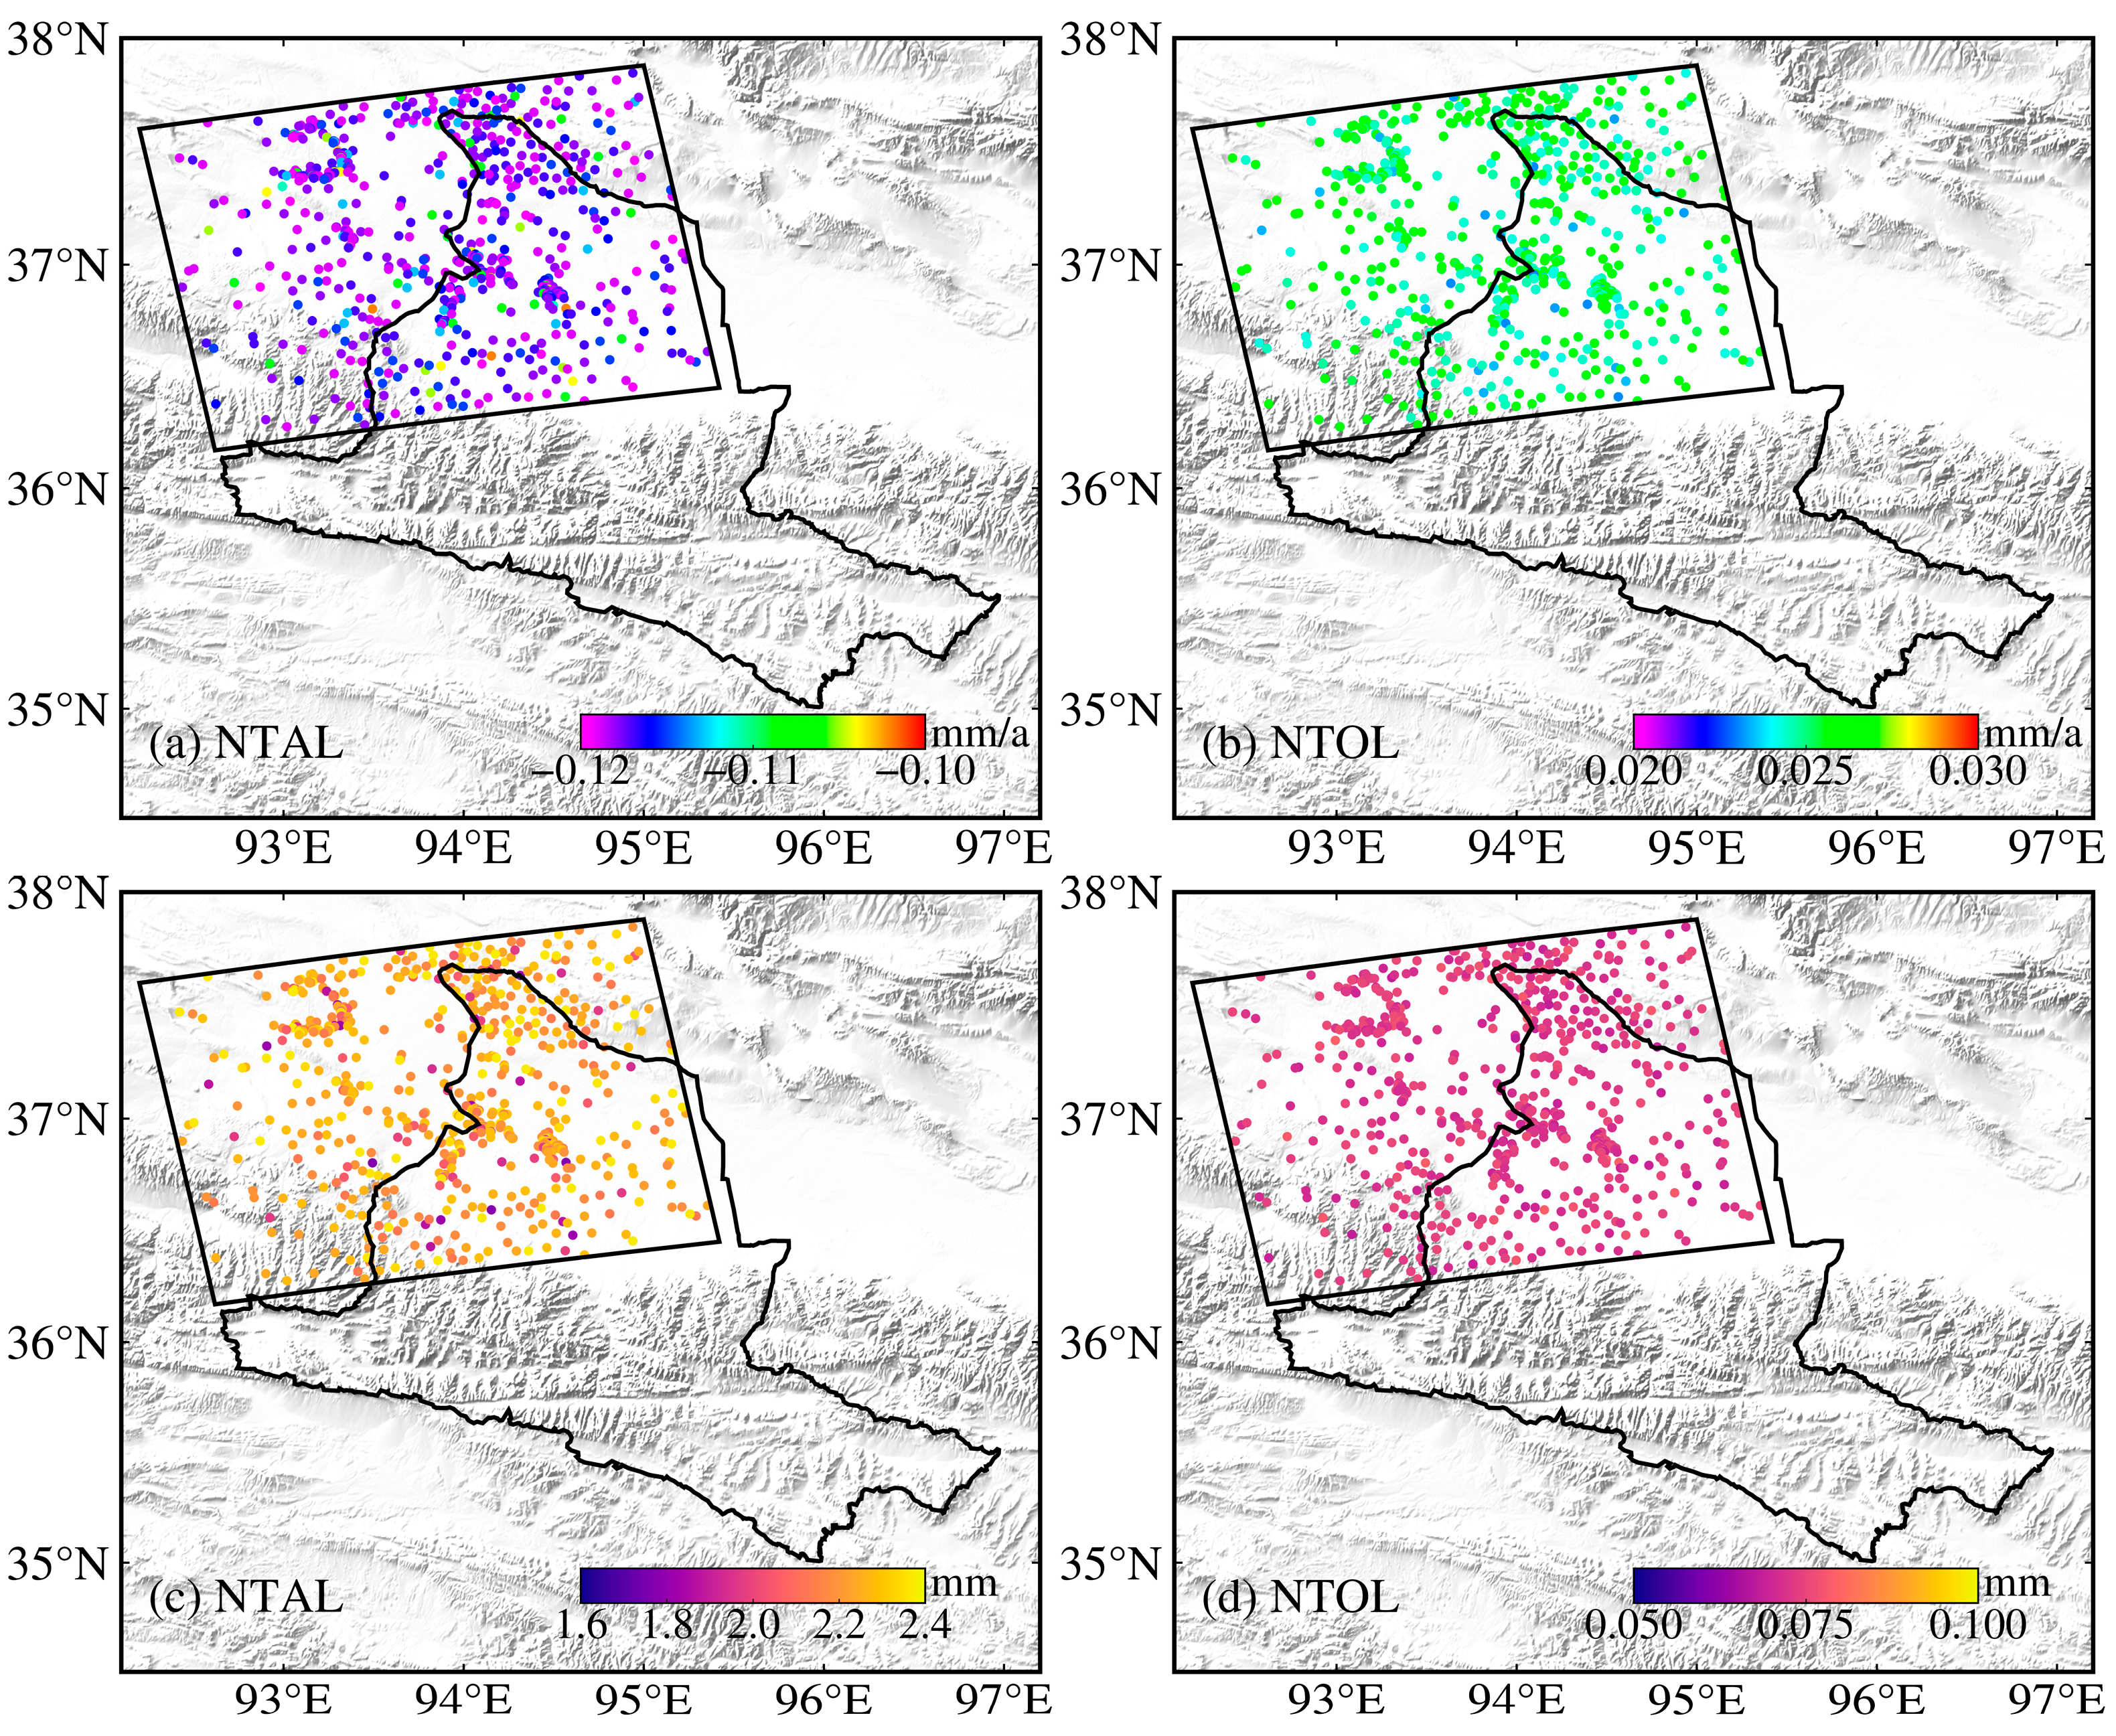
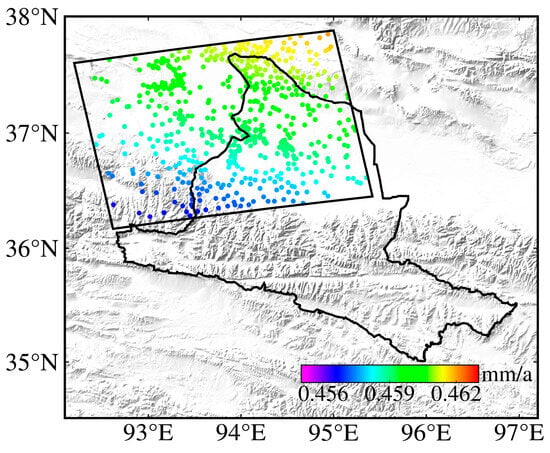
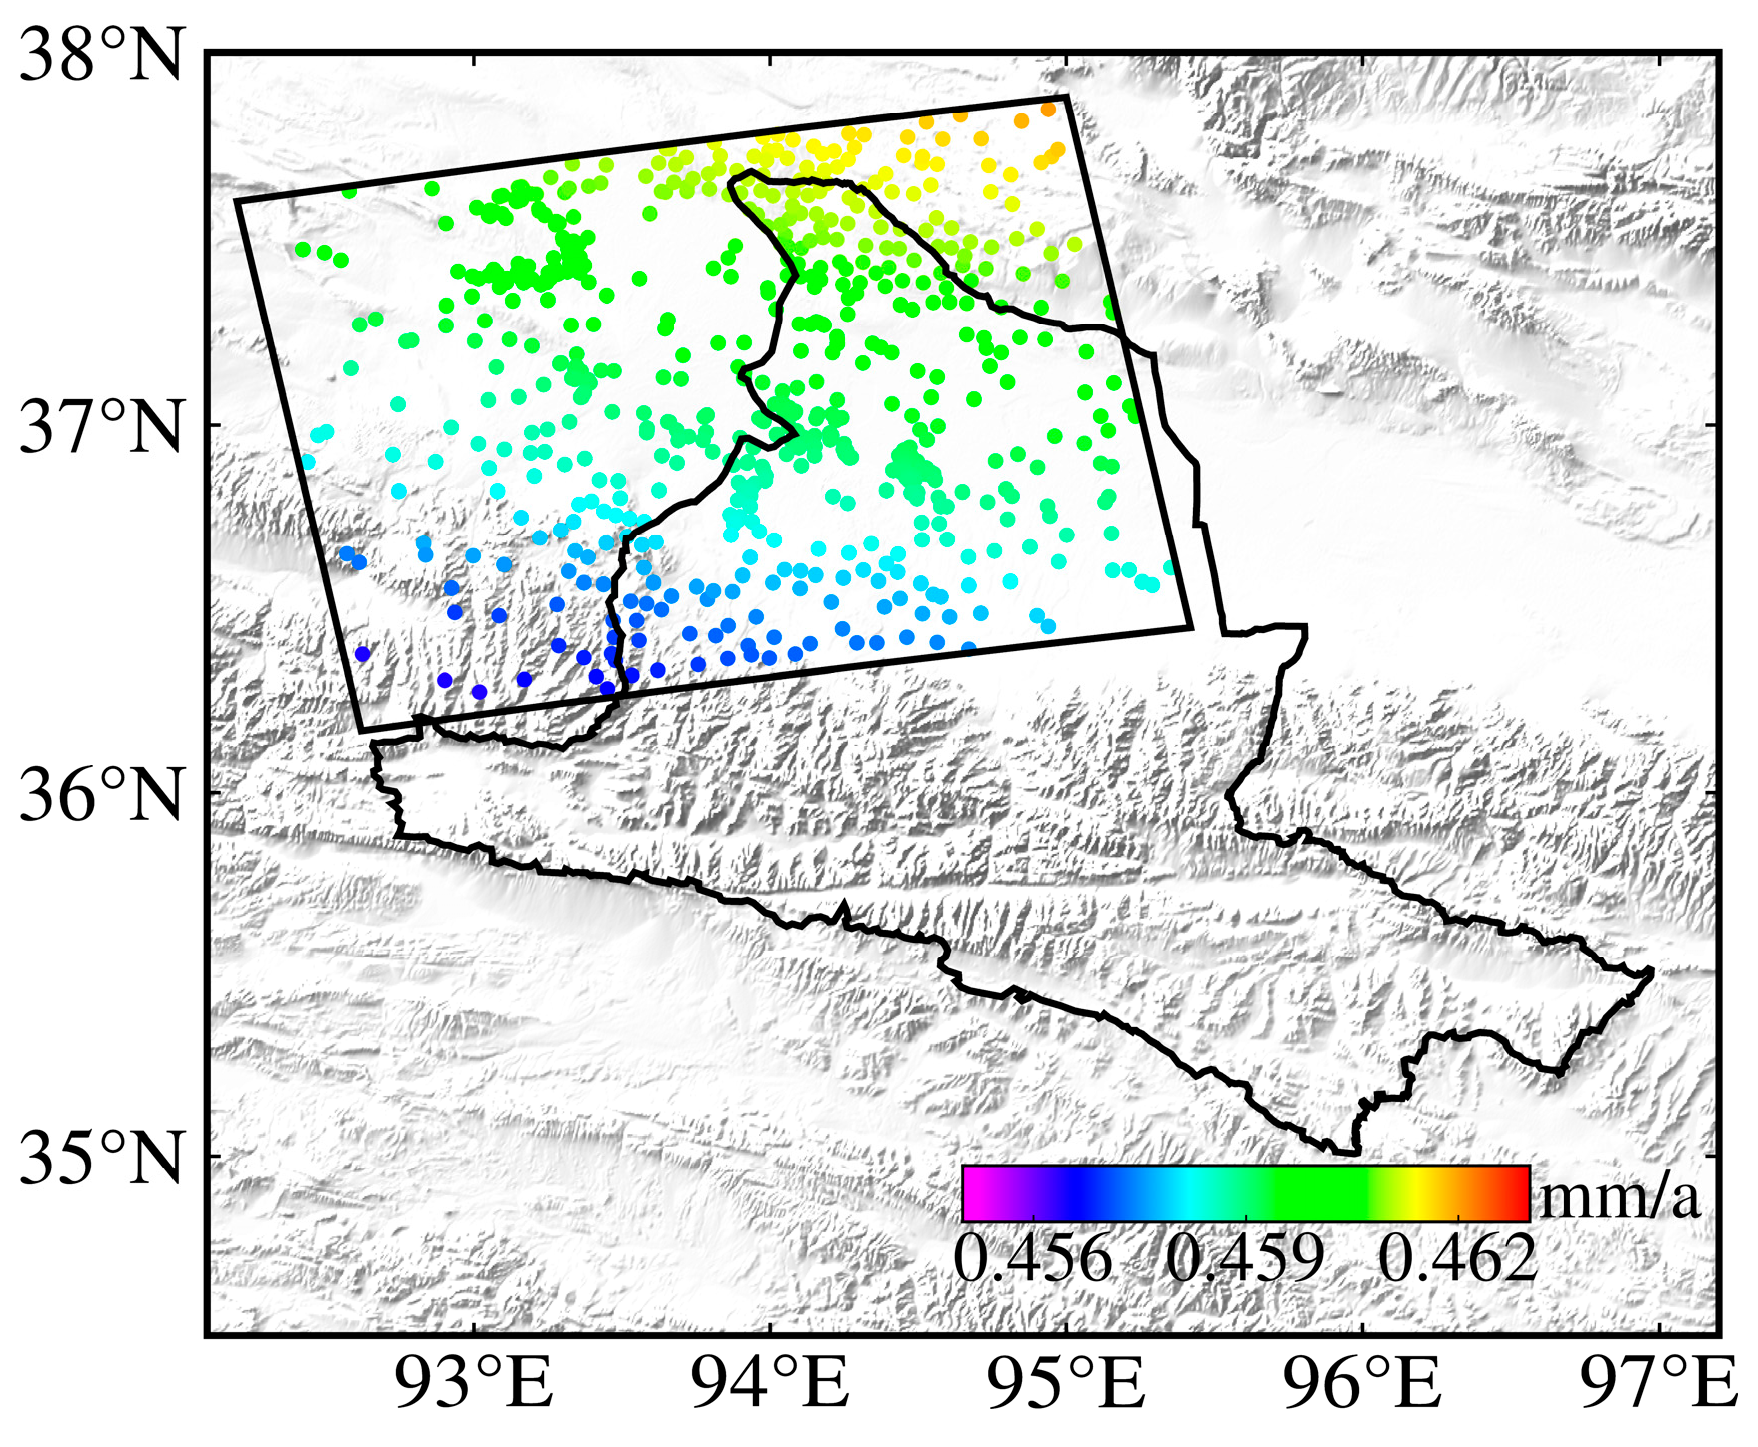
The spatial characteristics of the applied NTAL, NTOL, and GIA corrections at the retained 795 observation points are shown in Figure 7 and Figure 8. As shown in Figure 7, non-tidal atmospheric loading makes a significant contribution to seasonal surface deformation, with amplitudes exceeding 2 mm in some areas (Figure 7c). In contrast, the effect of non-tidal ocean loading is approximately one order of magnitude smaller, with annual amplitudes ranging from 0.05 to 0.10 mm (Figure 7d). In terms of long-term trends, non-tidal atmospheric loading induces crustal subsidence across the study area, with deformation rates ranging from −0.12 to −0.11 mm/a (Figure 7a), whereas non-tidal ocean loading causes crustal uplift, although the associated rates are relatively low and generally less than 0.03 mm/a (Figure 7b). On decadal timescales, the GIA effect manifests as a stable linear trend, producing an average uplift rate of approximately 0.45 mm/a across the study area (Figure 8). The modeled GIA rate varies from 0.456 to 0.463 mm/a across the study area, corresponding to a total spatial variation of only 0.007 mm/a, and exhibits a very smooth spatial pattern. Given the relative nature of InSAR measurements, this small spatial variation represents the relevant differential GIA contribution to the InSAR observations and is negligible compared with the deformation signals considered in the screening.
Figure 7.
Surface deformation trends (a,b) and annual amplitudes (c,d) induced by non-tidal atmospheric loading (NTAL) and non-tidal ocean loading (NTOL).
Figure 8.
Surface deformation rates induced by GIA.
3.2.2. Synthetic Experiment
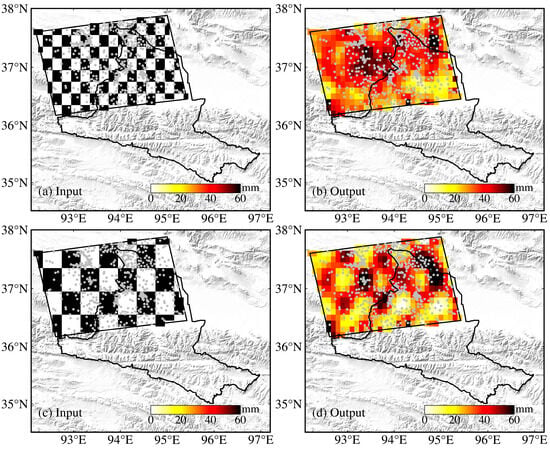
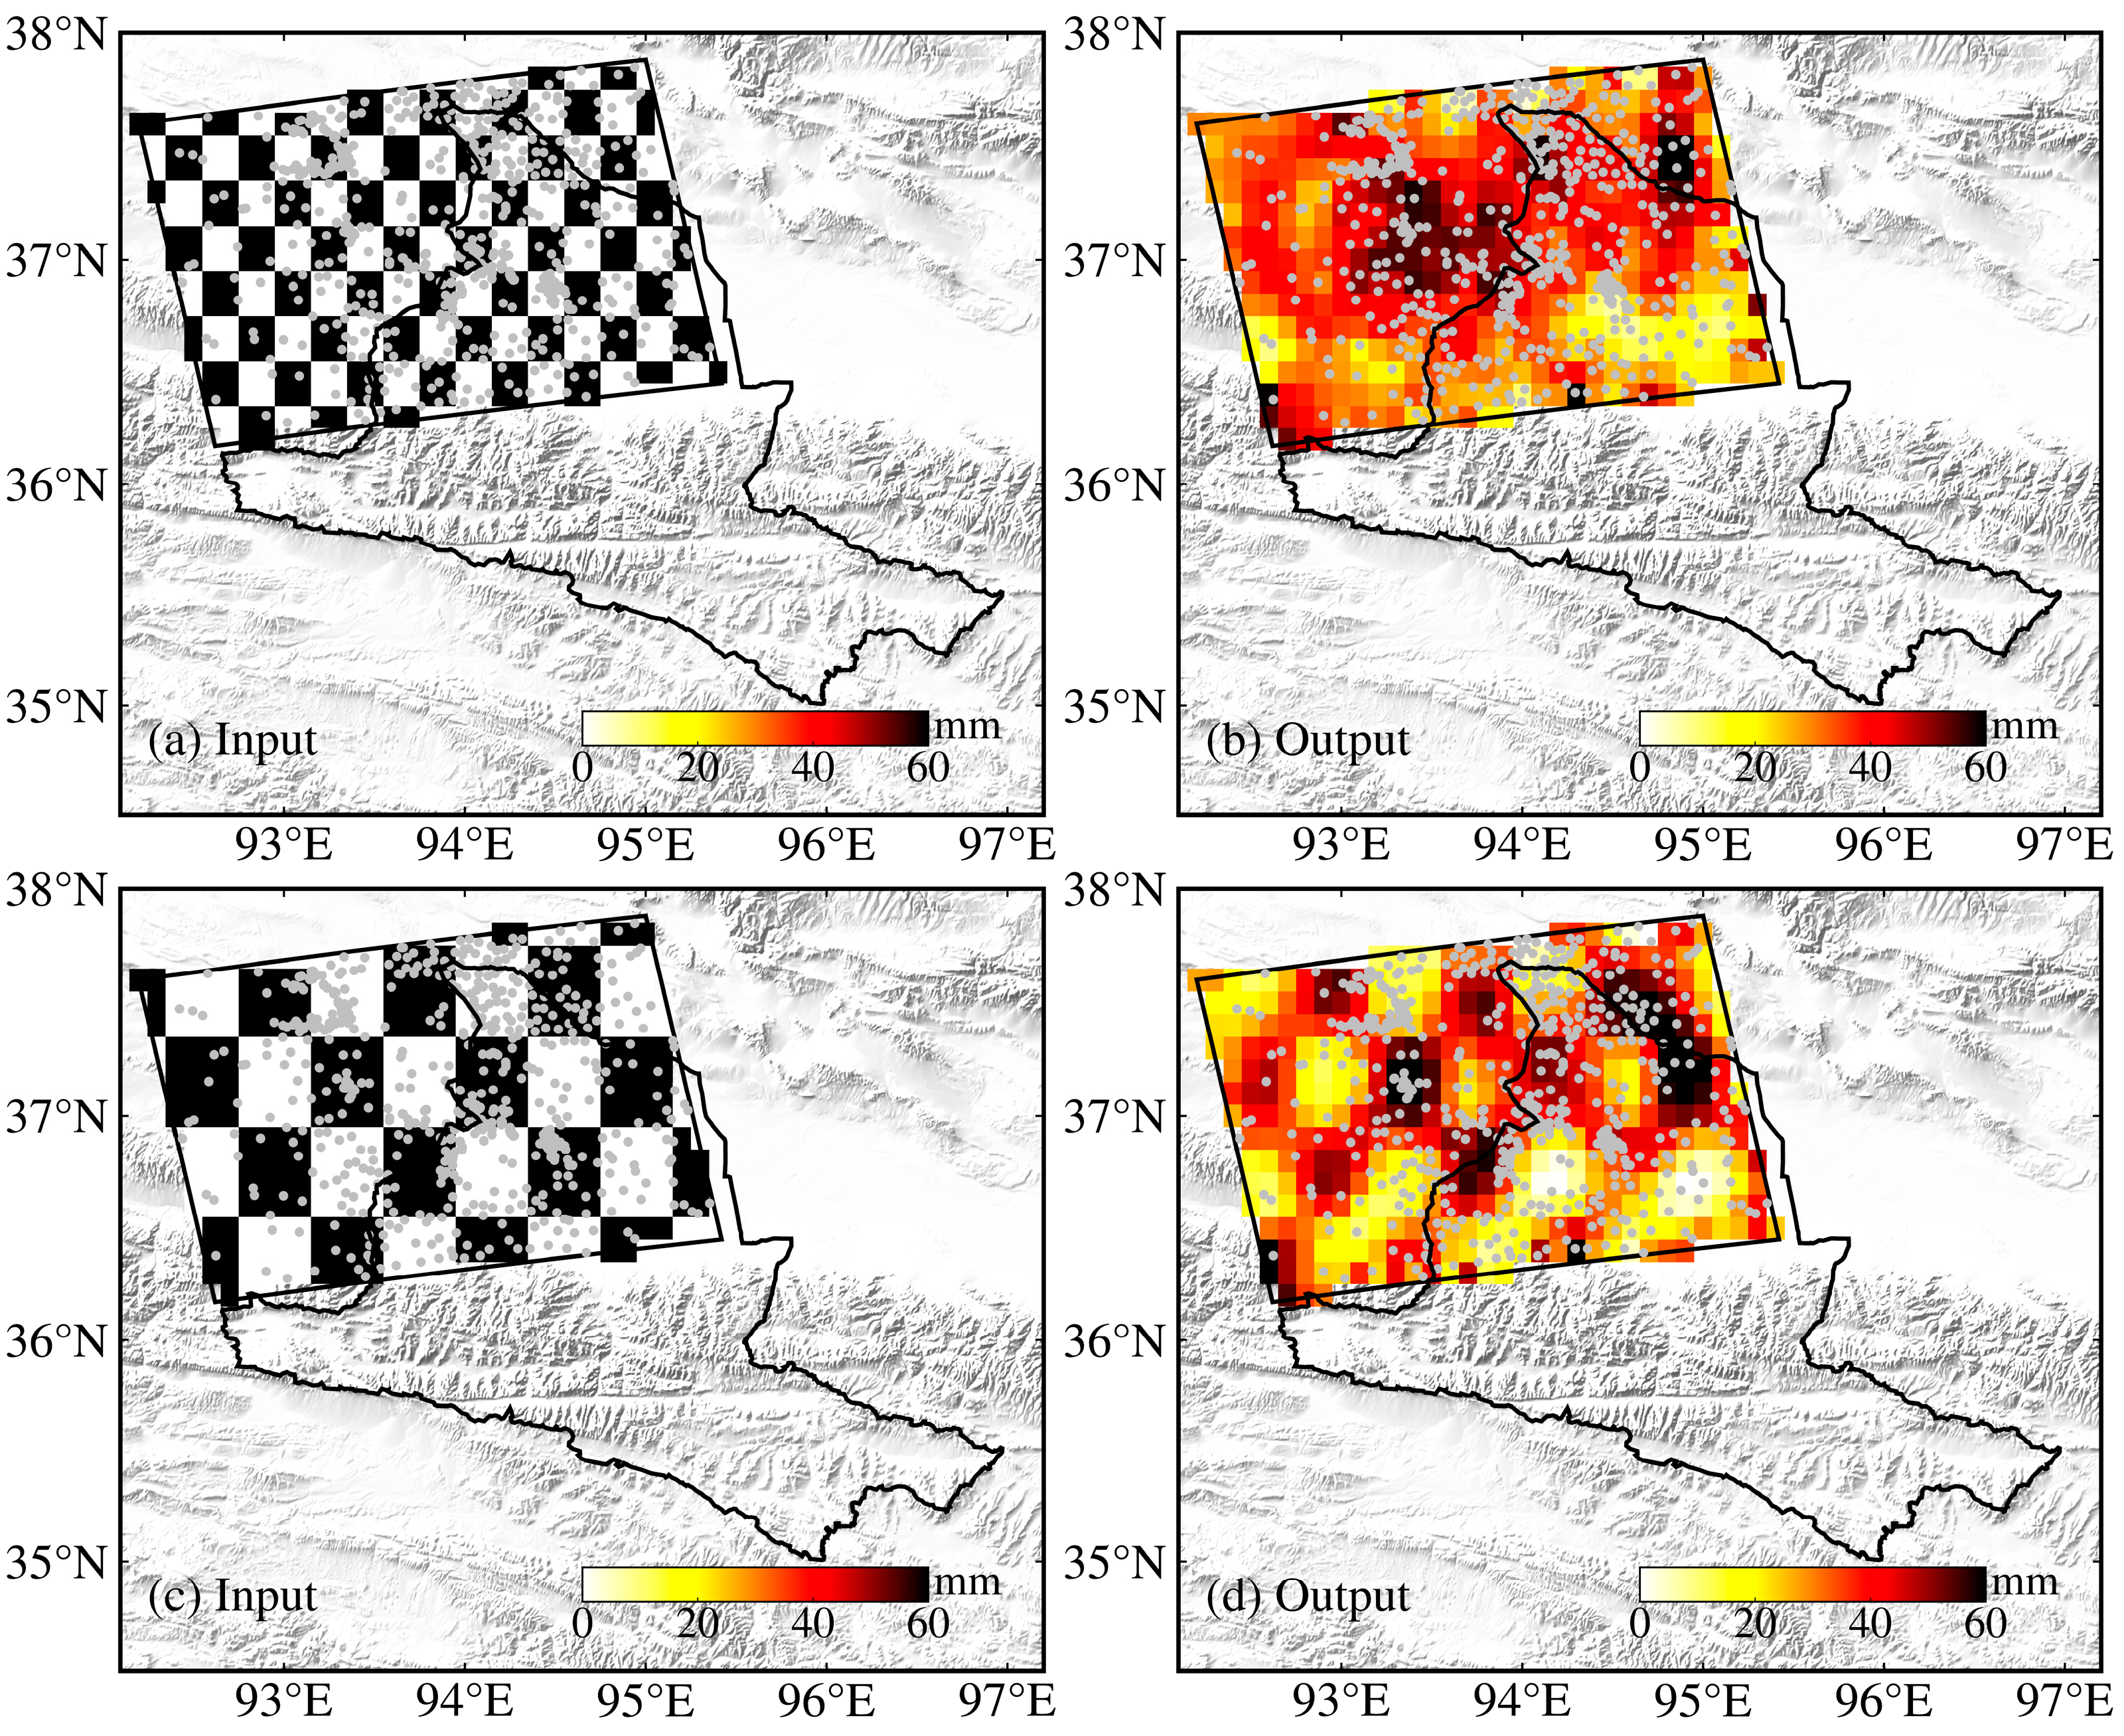
The sensitivity and robustness of the inversion method are evaluated through a synthetic checkerboard test. In this test, the vertical surface displacements simulated from the synthetic EWH field are used to recover the prescribed EWH distribution. The white and black checkerboard cells represent EWH signals of 0 mm and 60 mm, respectively. First, the theoretical elastic vertical deformation field of the study area is forward-modeled based on the predefined EWH mass distribution, which represents the simulated InSAR deformation observations. Spatially correlated Gaussian noise with a standard deviation of 0.1 mm and an assumed correlation length of 100 km is then added to the simulated deformation observations. Subsequently, the EWH mass field is inverted from the simulated deformation observations. The performance of the inversion method is evaluated by comparing the differences between the predefined EWH field and the inverted EWH field.
The terrestrial water inversion performance is evaluated at spatial resolutions of 20 km and 40 km, respectively. The results show that the main spatial characteristics of the prescribed EWH patterns can be recovered at both spatial resolutions, although the recovery of the finer 20 km pattern is less complete than that of the 40 km pattern (Figure 9). In areas with dense deformation observations, the prescribed spatial patterns are better recovered, whereas in regions with relatively sparse data coverage, the recovered EWH field exhibits greater spatial smoothing and deviation from the prescribed pattern. The spatial resolution of terrestrial water inversion is constrained by the distribution of surface deformation observations. Under the current deformation observation configuration, it is difficult to achieve meaningful inversion results at a spatial resolution of 20 km (Figure 9a,b).
Figure 9.
Synthetic checkerboard test of inversion performance at different spatial resolutions. (a,b) show the prescribed and inverted EWH fields at a spatial resolution of 0.2° × 0.2° (approximately 20 km), respectively; (c,d) show the prescribed and inverted EWH fields at a spatial resolution of 0.4° × 0.4° (approximately 40 km), respectively.
3.2.3. InSAR Groundwater Inversion
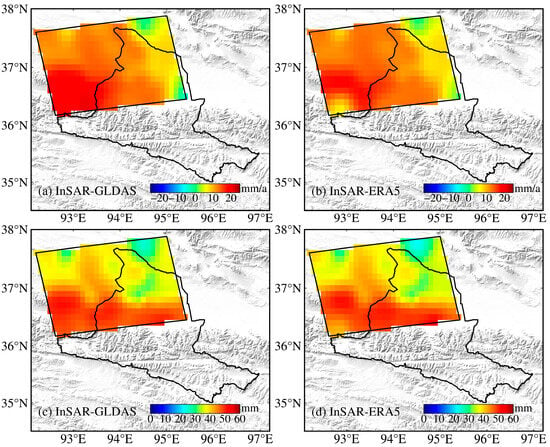
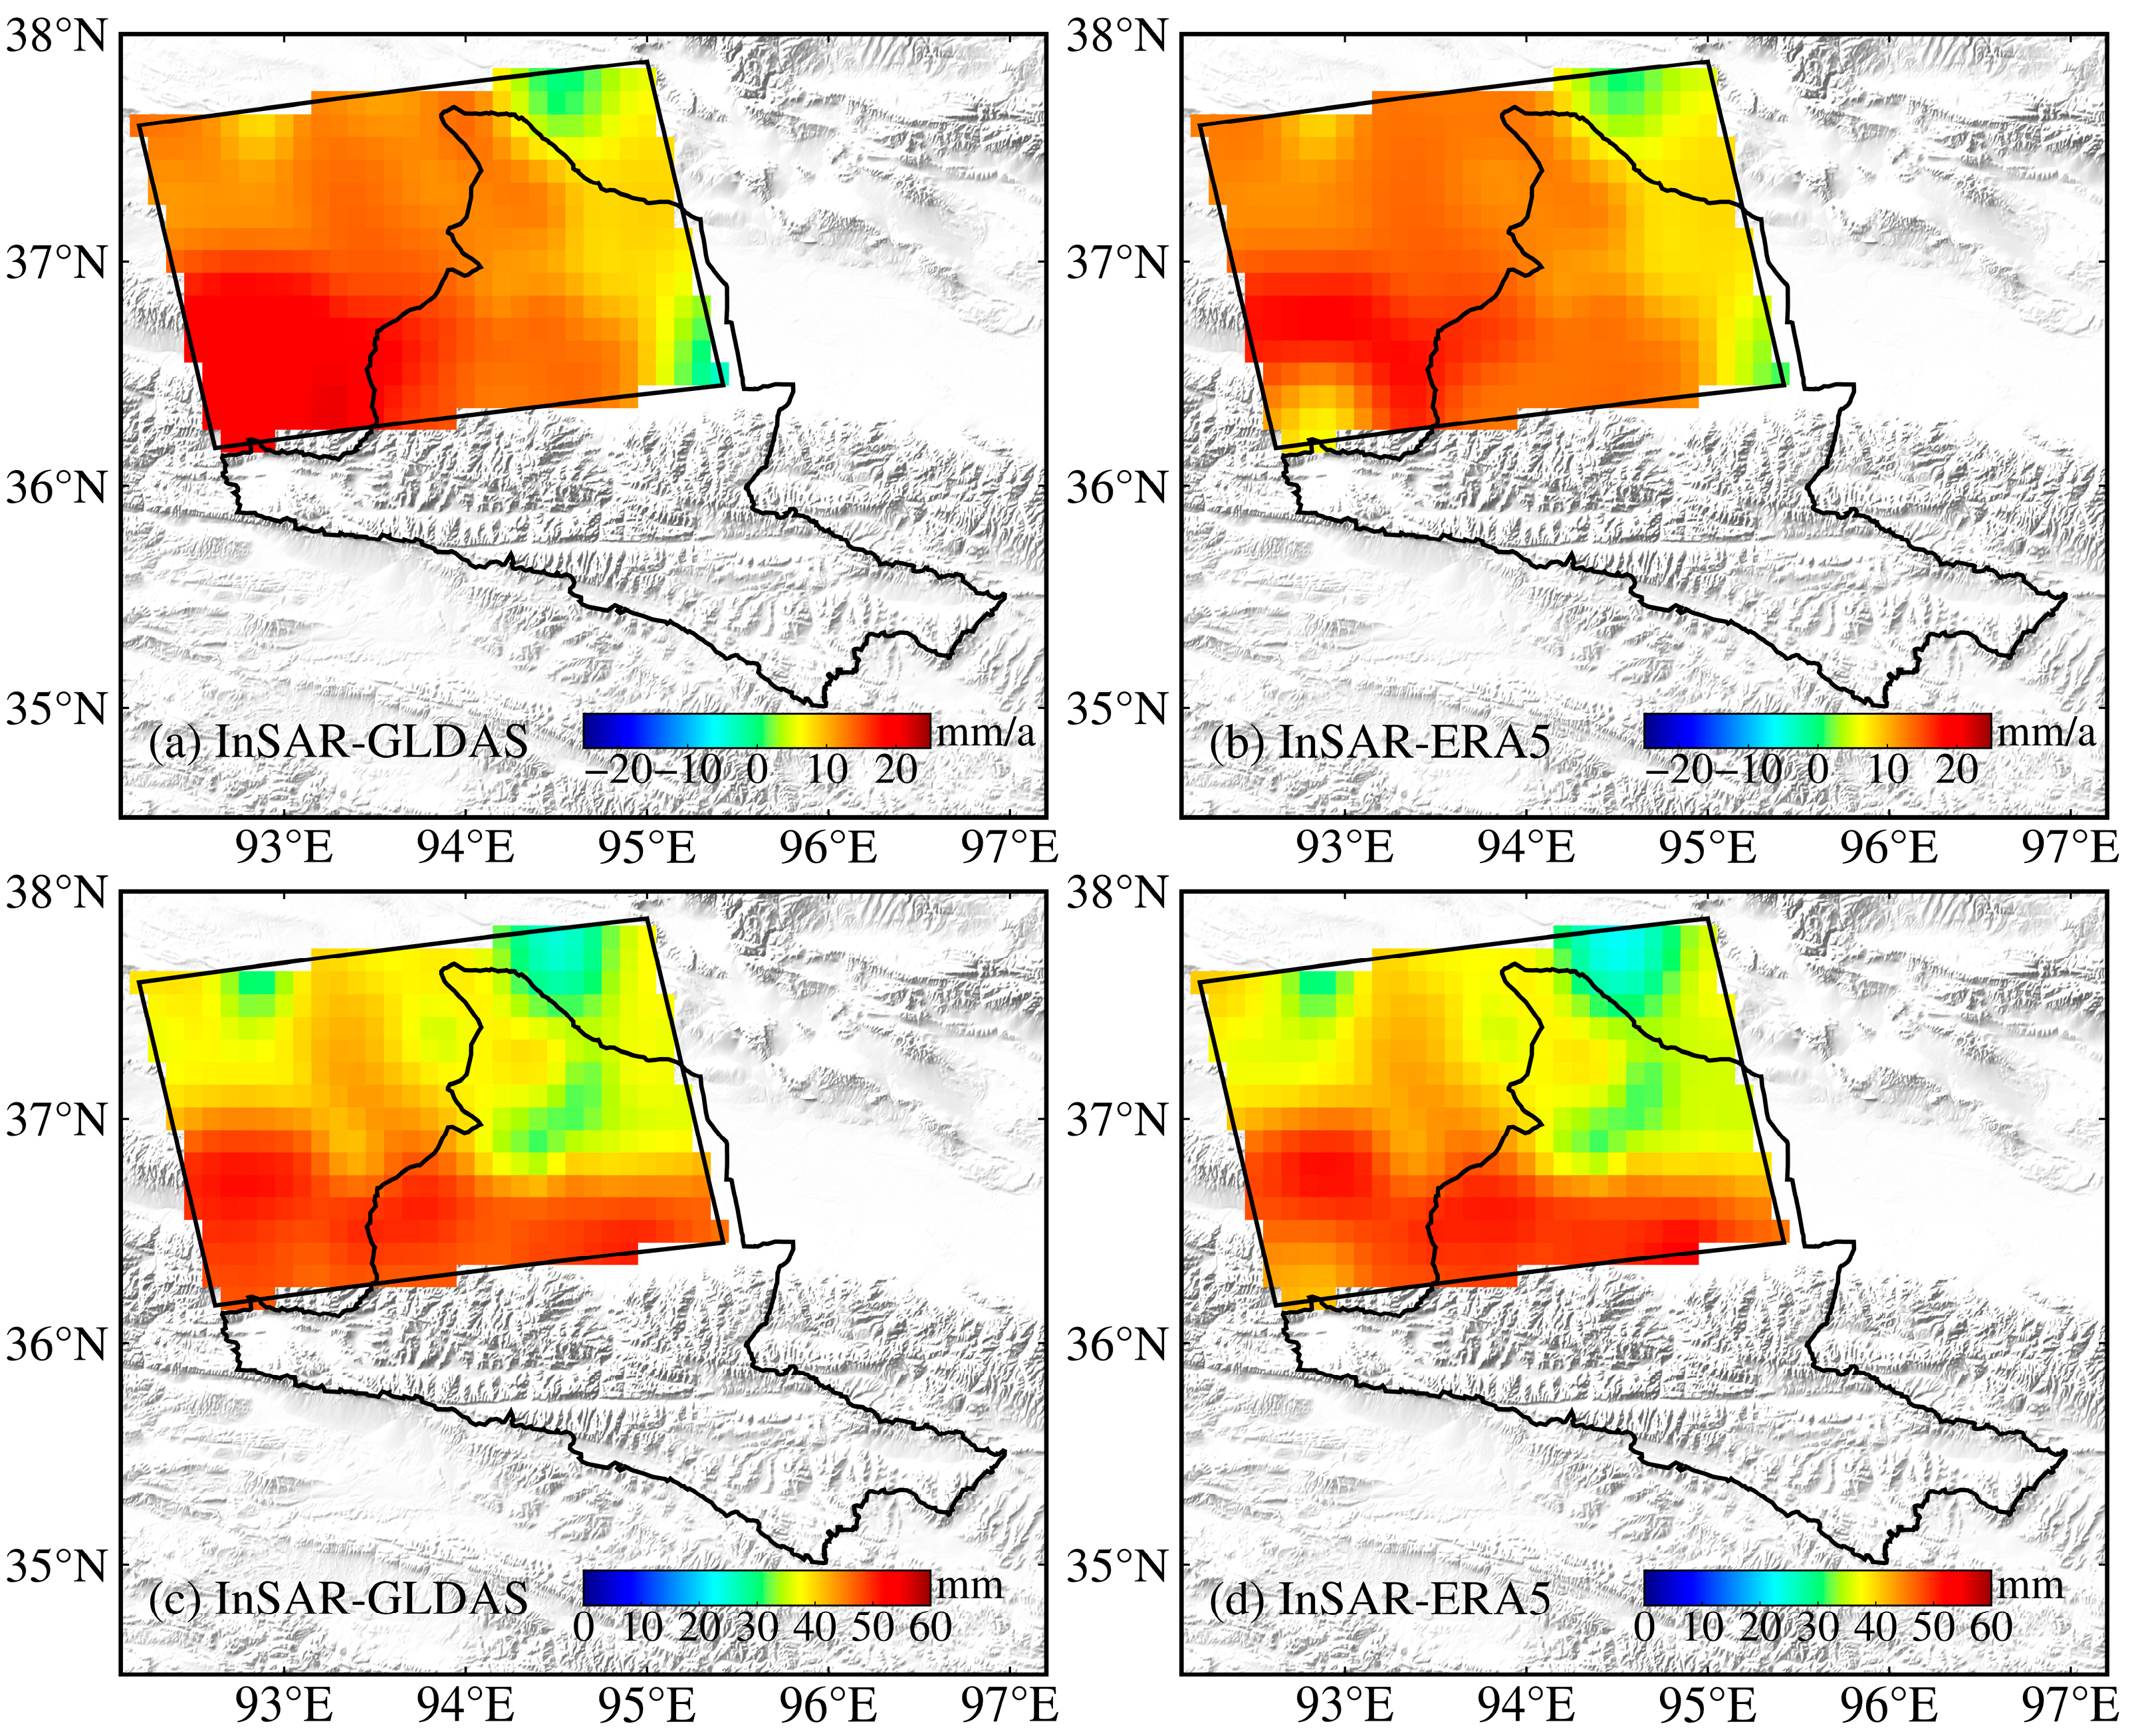
Based on the inversion parameters optimized through the synthetic experiments in Section 3.2.2, we applied the corrected InSAR deformation observations to perform the actual inversion of groundwater variations, and the results are presented in Figure 10. We further compared the results obtained using two different land surface models, GLDAS and ERA5-Land, for removing the surface water contribution. The two sets of results show good consistency, indicating that terrestrial water variations in the study area are dominated by groundwater changes. The discrepancies between the two land surface models are mainly located in the southwestern part of the study area (Figure 10a,b), suggesting increased uncertainty of land surface model estimates in regions adjacent to mountainous areas. Overall, groundwater in the Golmud River Basin exhibited an increasing trend during 2017–2021. The increasing rate was more pronounced in the western part than in the eastern part, with the maximum increase exceeding 20 mm/a in the southwestern region. Meanwhile, two relatively stable regions with near-zero groundwater change rates were identified in the northeastern and southeastern parts of the basin (Figure 10). We further calculated the annual amplitude of groundwater variations, which represents the intensity of seasonal fluctuations. The results show that the regions with rapid groundwater increases in the south are accompanied by stronger seasonal variations, whereas groundwater seasonality is much weaker in the northeastern region, where the long-term trend is also relatively stable. The choice of different land surface models for surface water correction has little impact on the overall groundwater trend, with the main discrepancies concentrated in the southwestern part of the study area.
Figure 10.
InSAR-derived groundwater variations in the Golmud River Basin during 2017–2021 using two different surface water correction models. (a,b) Groundwater change rates; (c,d) annual amplitudes of groundwater variations.
4. Discussion
4.1. Groundwater Estimates from GRACE and WGHM
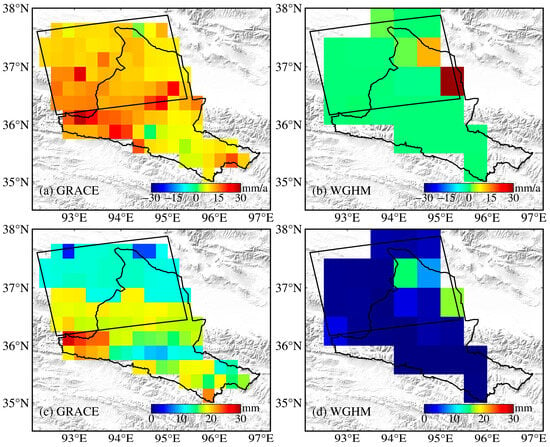
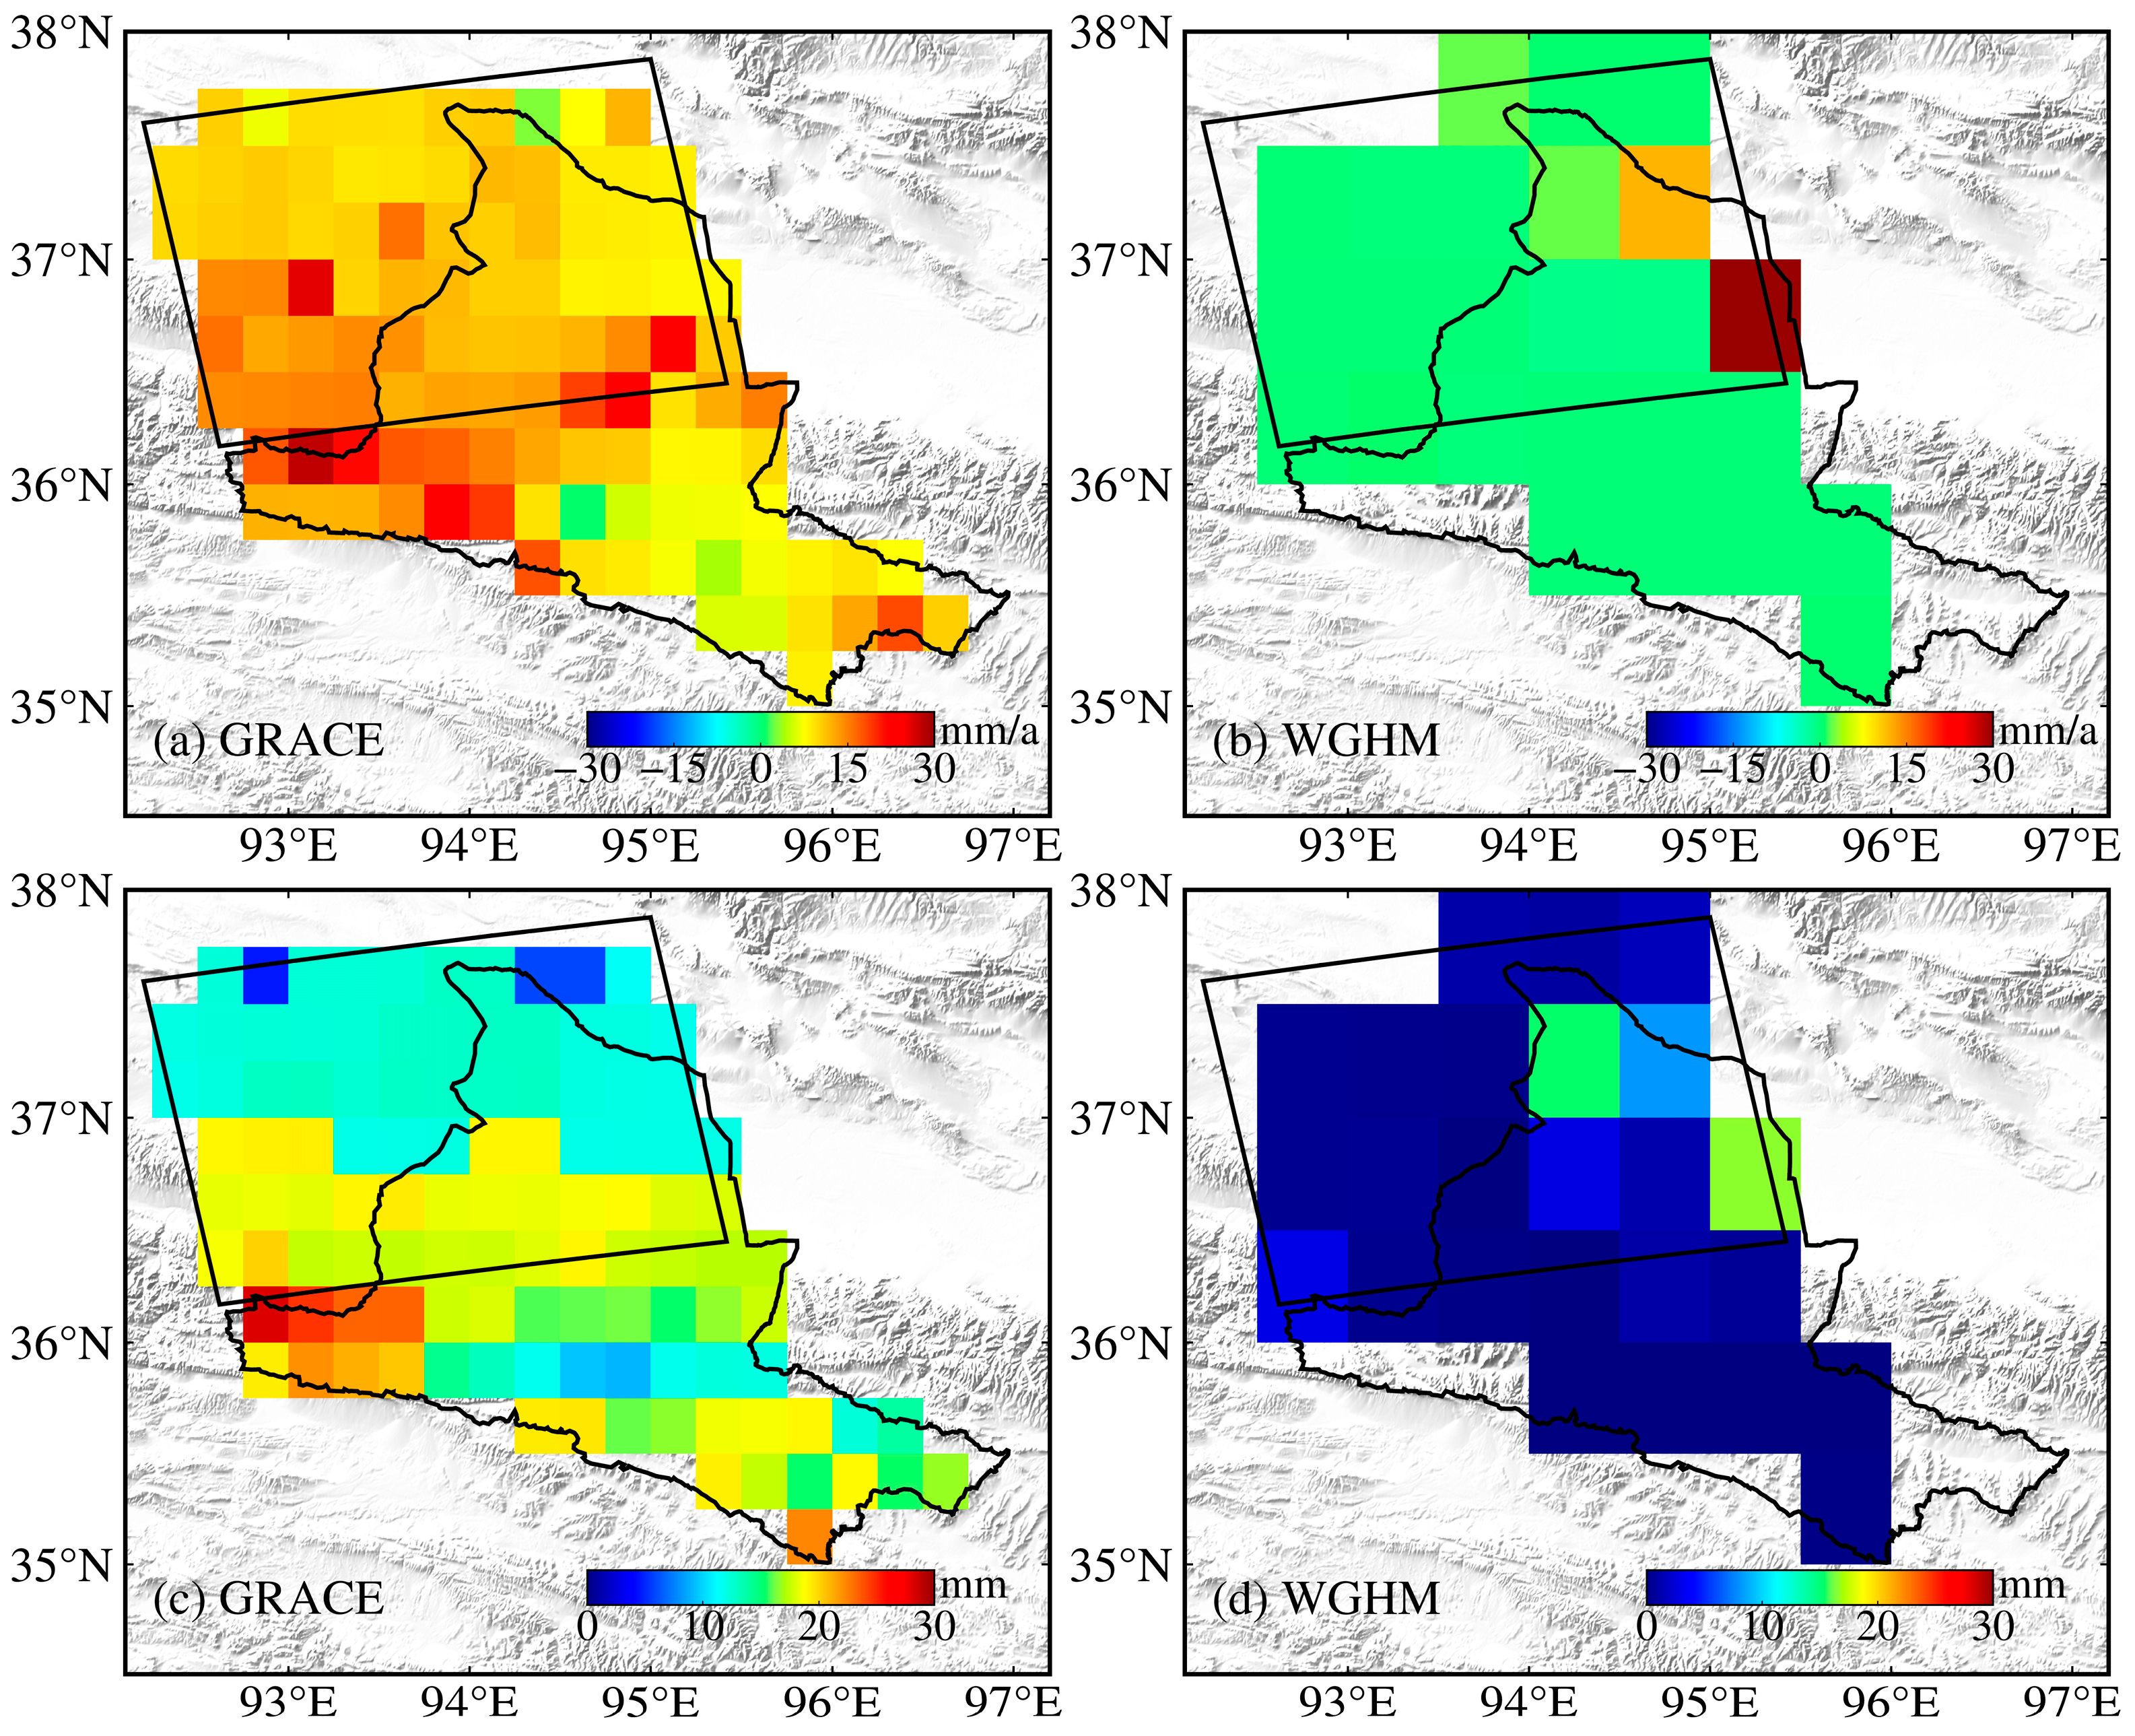
The groundwater change trends derived from GRACE satellite gravimetry over a larger spatial scale reveal that significant groundwater variations in the Golmud River Basin are mainly concentrated in the northern part of the basin (Figure 11a). The InSAR-derived groundwater mass change fields also capture the large-scale groundwater gain and reveal more spatially detailed variations within the basin (Figure 10a,b), consistent with the higher spatial resolution of the InSAR observations. A comparison of the basin-averaged annual amplitudes shows that the GRACE-derived amplitude is approximately half that of the InSAR-derived estimate (Table 3). This difference may partly reflect the limited spatial resolution of satellite gravimetry and the associated spatial smoothing of signals. In contrast, the higher spatial resolution of InSAR provides greater potential to resolve spatially heterogeneous groundwater variations at scales finer than those typically resolved by GRACE. The differences in annual amplitude between the two estimates may reflect the combined effects of spatial resolution, signal smoothing, the inversion procedure, residual non-hydrological signals, and the surface-water correction model. Furthermore, we compared the geodetic inversion results with the WGHM groundwater model. The results indicate that WGHM substantially underestimates the actual groundwater storage variations in the Golmud River Basin. Both the trend component and basin-scale averaged annual amplitude obtained from WGHM are approximately one order of magnitude smaller than those derived from InSAR and GRACE (Figure 11b,d; Table 3). These differences suggest that WGHM may not fully capture the magnitude of groundwater variations in the Golmud River Basin, highlighting the need for caution when interpreting model-based groundwater estimates in high-altitude regions with limited in situ observations.
Figure 11.
Estimates of groundwater variations in the Golmud River Basin derived from GRACE (2017–2021) and WGHM (2017–2019). (a,b) Groundwater change rates; (c,d) annual amplitudes of groundwater variations. The black parallelogram indicates the coverage area of the InSAR data.
Table 3.
Comparison of groundwater storage change rates and annual amplitudes in the Golmud River Basin derived from different monitoring approaches.
4.2. Comparison and Consistency Check of Inversion Results
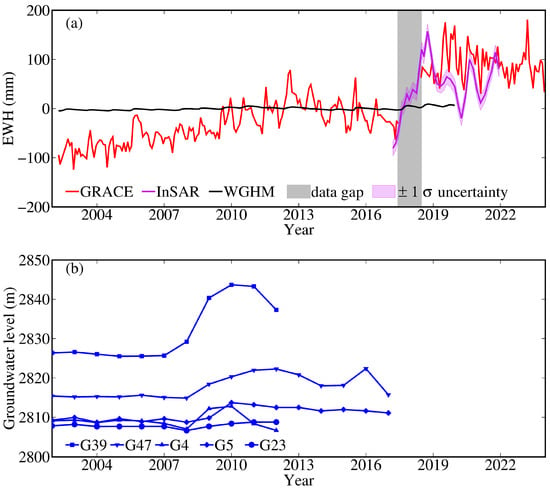
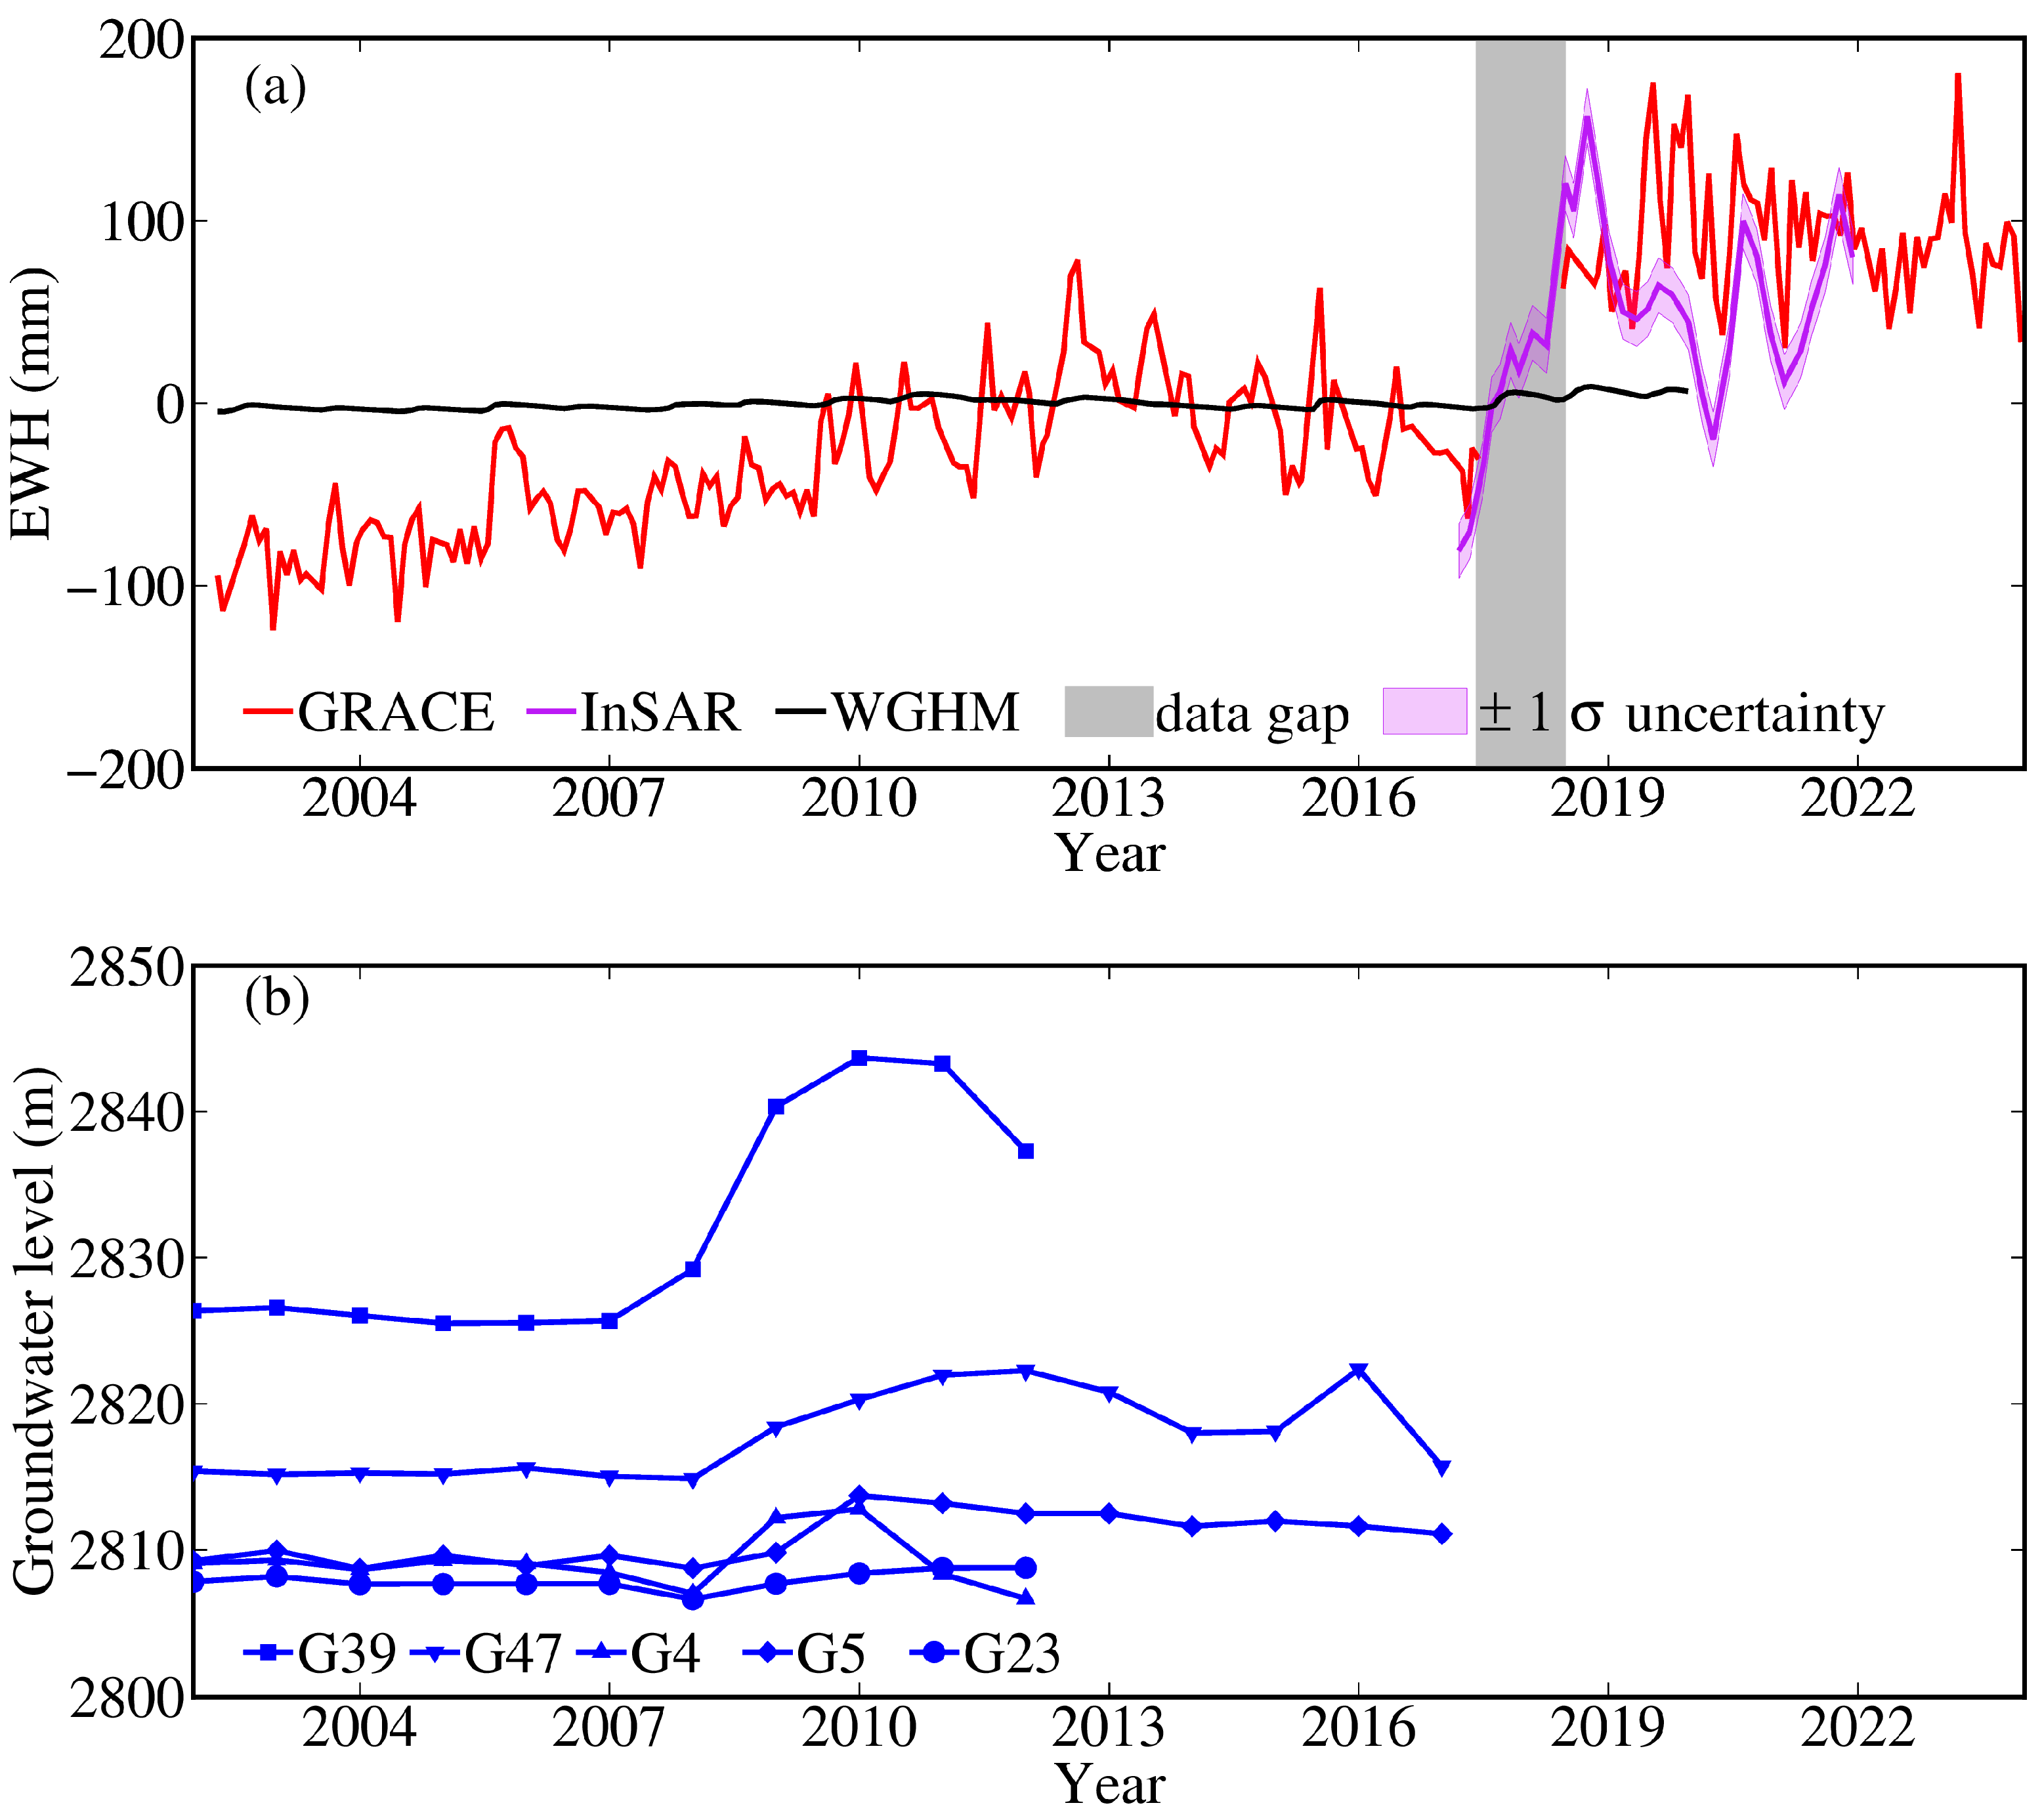
We compared the InSAR-derived, the GRACE satellite gravimetry-derived, the WGHM hydrological model-estimated, and the in situ well-observed groundwater change time series (Figure 12). The results show the following: (1) Both satellite gravimetry and in situ well observations detected an increasing trend in groundwater storage beginning around 2008. In particular, the groundwater level variations observed at the G4 well station exhibit strong similarity with the satellite gravimetry results in terms of interannual variations (Figure 12b). Although the distances between different groundwater observation wells are all within 100 km, significant differences exist in the observed increasing amplitudes among these sites, indicating that well observations are highly sensitive to spatial variability. This suggests that considerable uncertainties may exist when groundwater storage changes are evaluated using individual well observations without point-wise accurate hydraulic parameters. (2) The InSAR-derived results show good consistency with satellite gravimetry in terms of long-term trends, and both approaches captured the rapid groundwater increase occurring around 2018. However, the seasonal variation amplitude derived from InSAR is larger than that from satellite gravimetry, which may reflect differences in spatial resolution, signal smoothing, and sensitivity to spatially heterogeneous groundwater variations (Figure 12a). To characterize the uncertainty of the InSAR-derived groundwater storage estimates under the adopted residual-based perturbation model, a Monte Carlo analysis was performed based on the statistical characteristics of the inversion residuals. The complete inversion procedure was repeated for 1000 realizations by introducing random perturbations to the InSAR observations according to the residual statistics. The standard deviation of the resulting groundwater storage ensemble at each epoch was taken as the 1σ uncertainty under this perturbation model. The corresponding 1σ uncertainty envelope is shown as the shaded area in Figure 12a. This uncertainty estimate represents the variability captured by the adopted residual-based perturbation model. (3) Compared with InSAR and GRACE, the groundwater estimates from the WGHM model are substantially smaller in magnitude and fail to capture the observed strong trend shift. This indicates that, in high-altitude basins, WGHM-derived groundwater estimates still contain considerable uncertainties in both seasonal and long-term components. (4) Overall, from a qualitative perspective, the different observation approaches consistently capture the major anomalous groundwater variation trends, while showing differences in their seasonal and long-term characteristics. The agreement between the InSAR- and GRACE-derived groundwater storage variations provides a useful consistency check at the basin scale. However, because GRACE-derived information was used in the observation-selection procedure, this comparison is not fully independent. Compared with well observations and hydrological models, the geodetic inversion results provide spatially integrated estimates of groundwater storage variations, while the different observation and modeling approaches provide complementary information on the temporal and spatial characteristics of groundwater changes. The high spatial resolution of InSAR allows spatially heterogeneous groundwater-related deformation to be resolved, whereas the temporal continuity and basin-scale sensitivity of GRACE satellite gravimetry facilitate the analysis of interannual variation characteristics.
Figure 12.
Comparison of groundwater variation time series obtained from different approaches. (a) GRACE, InSAR, and WGHM results, where the equivalent water height values represent the mean variations within the parallelogram area shown in Figure 1c; (b) groundwater well observations.
4.3. Association Analysis of the Rapid Groundwater Increase During 2017–2019
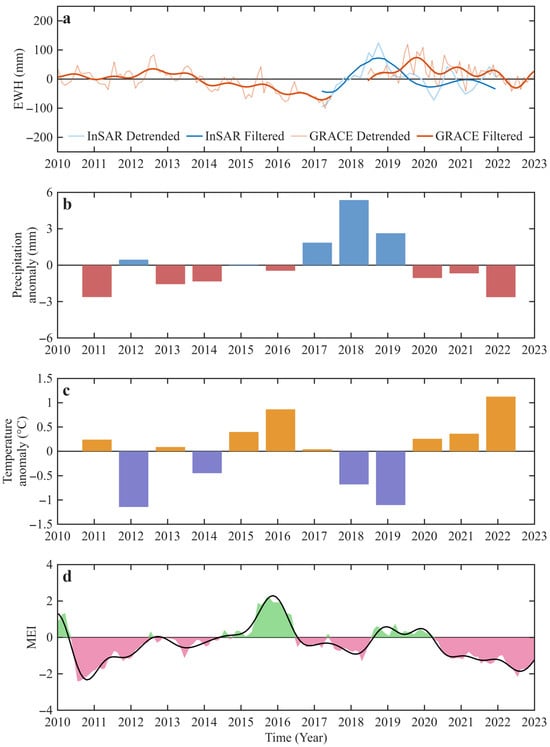
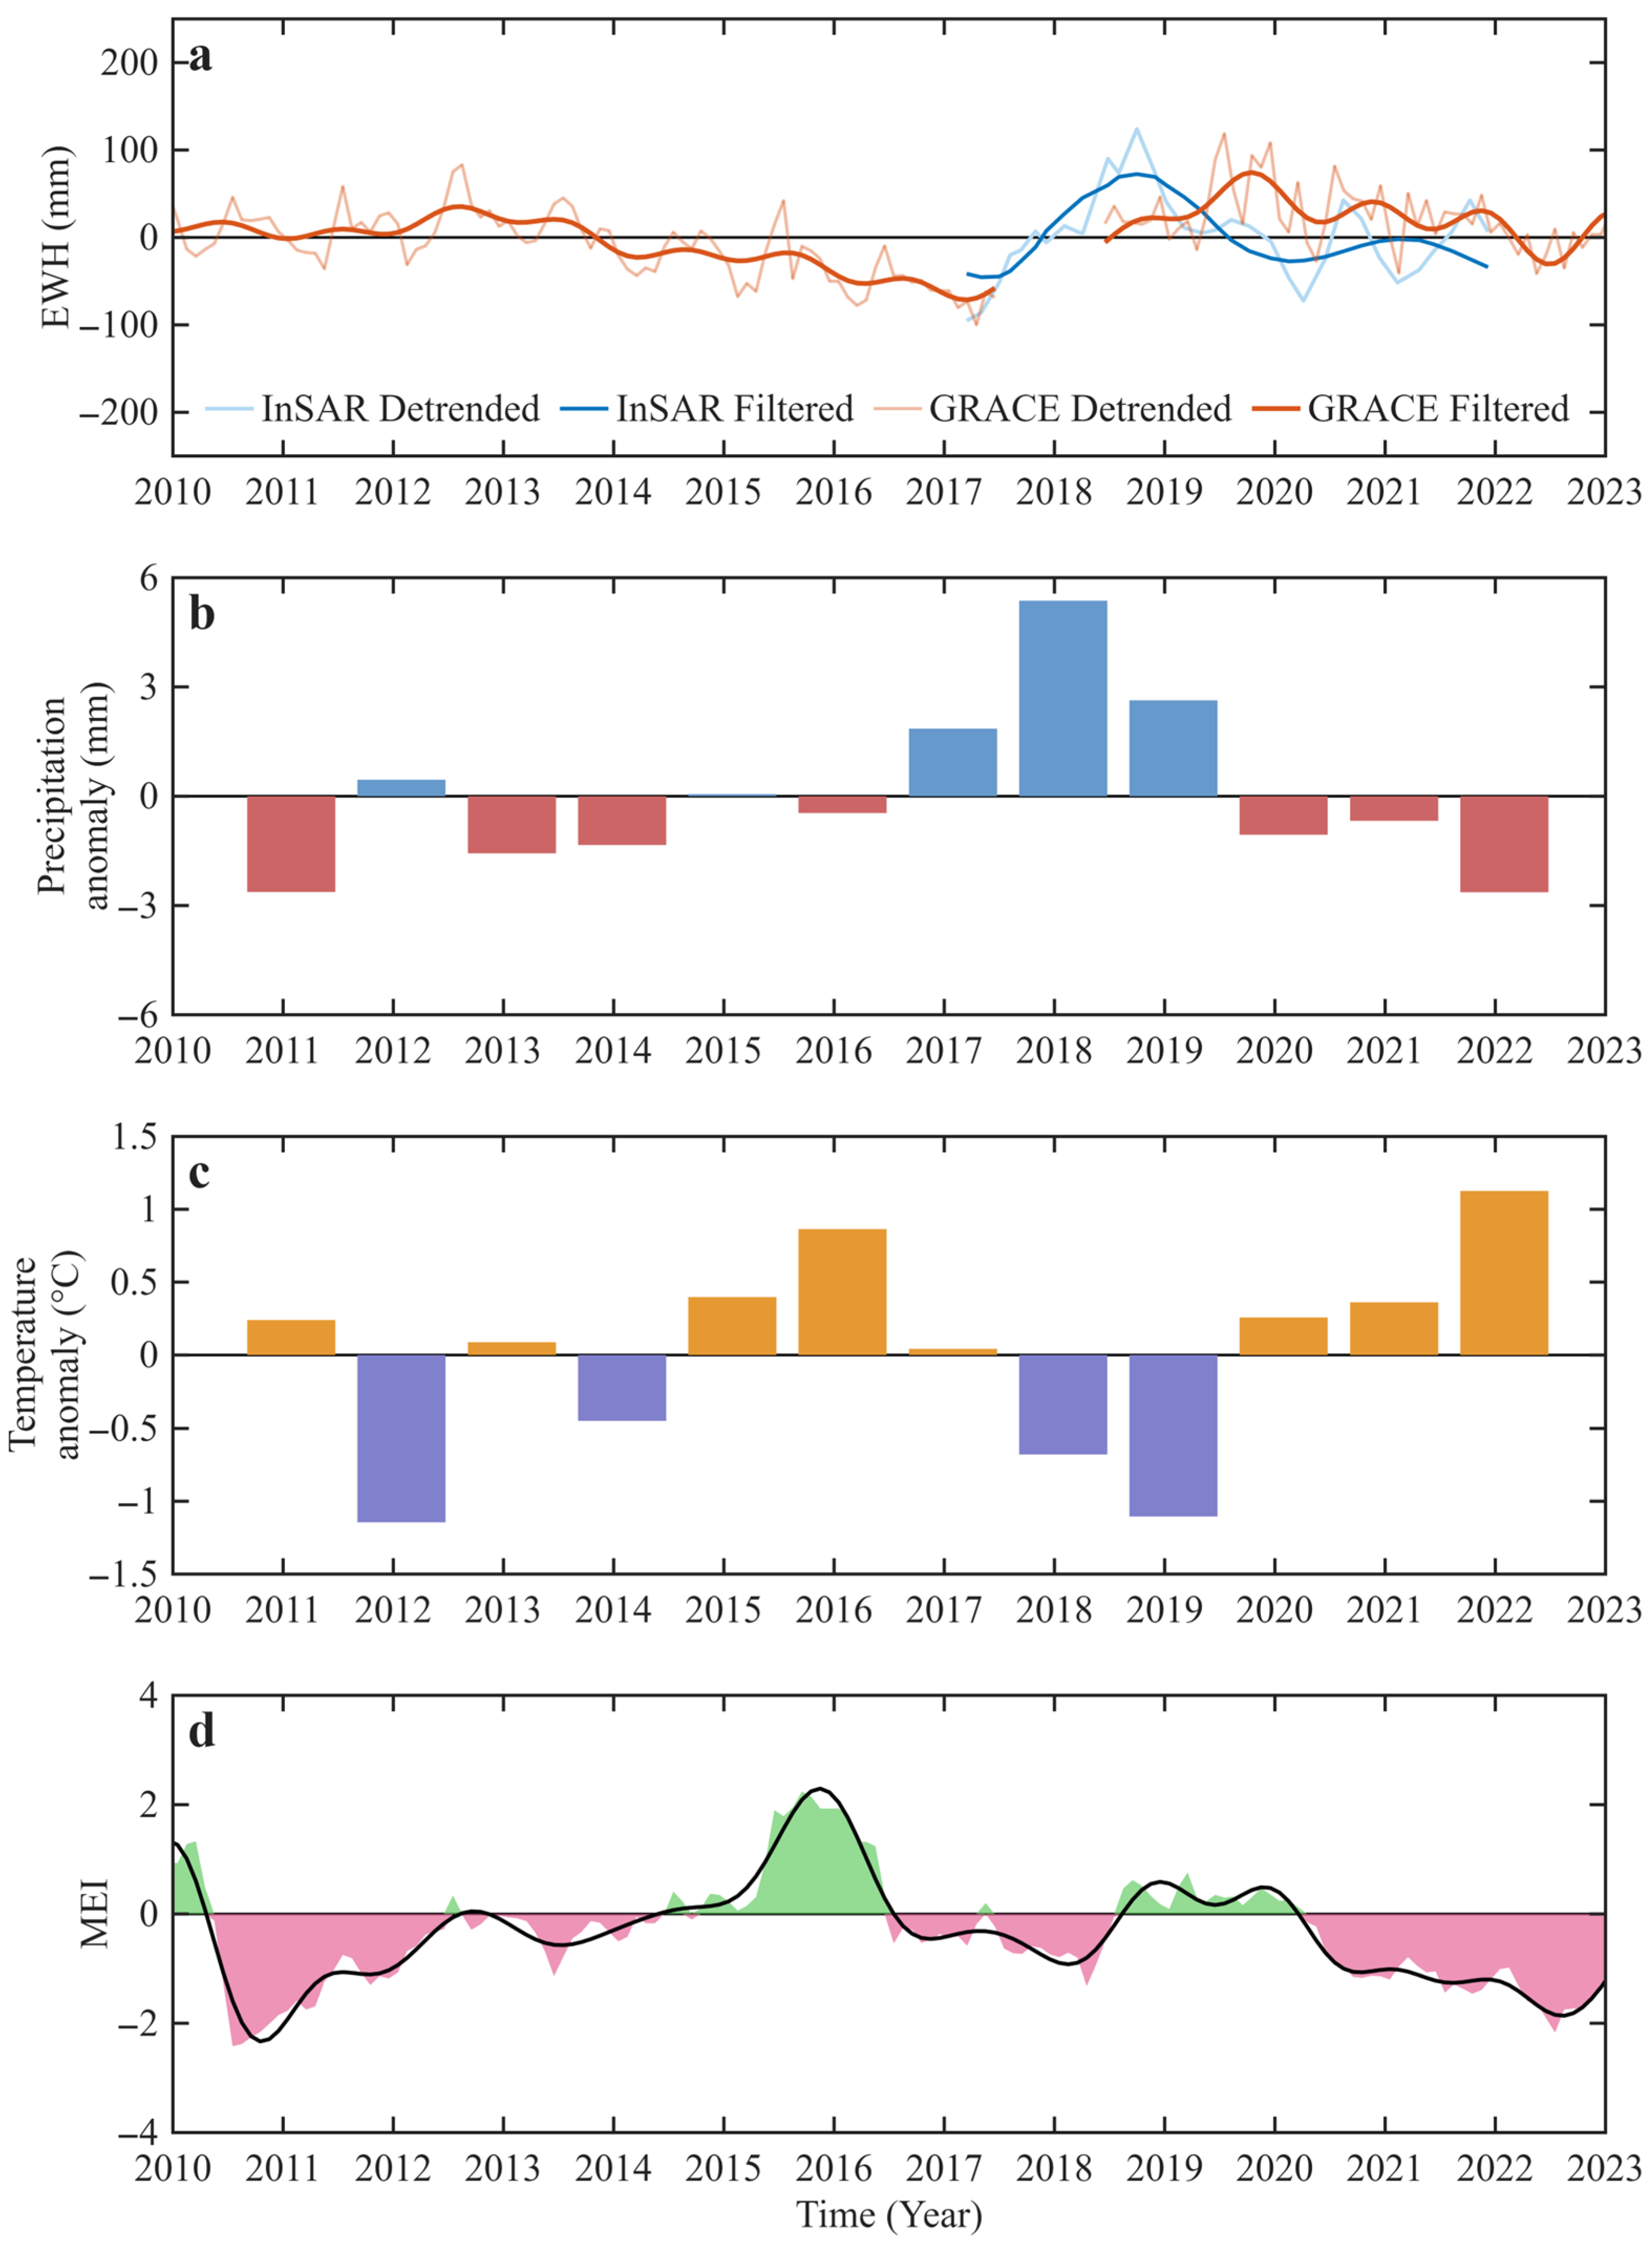
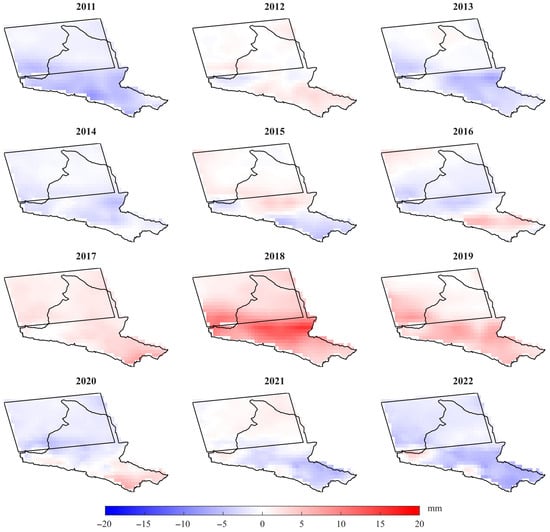
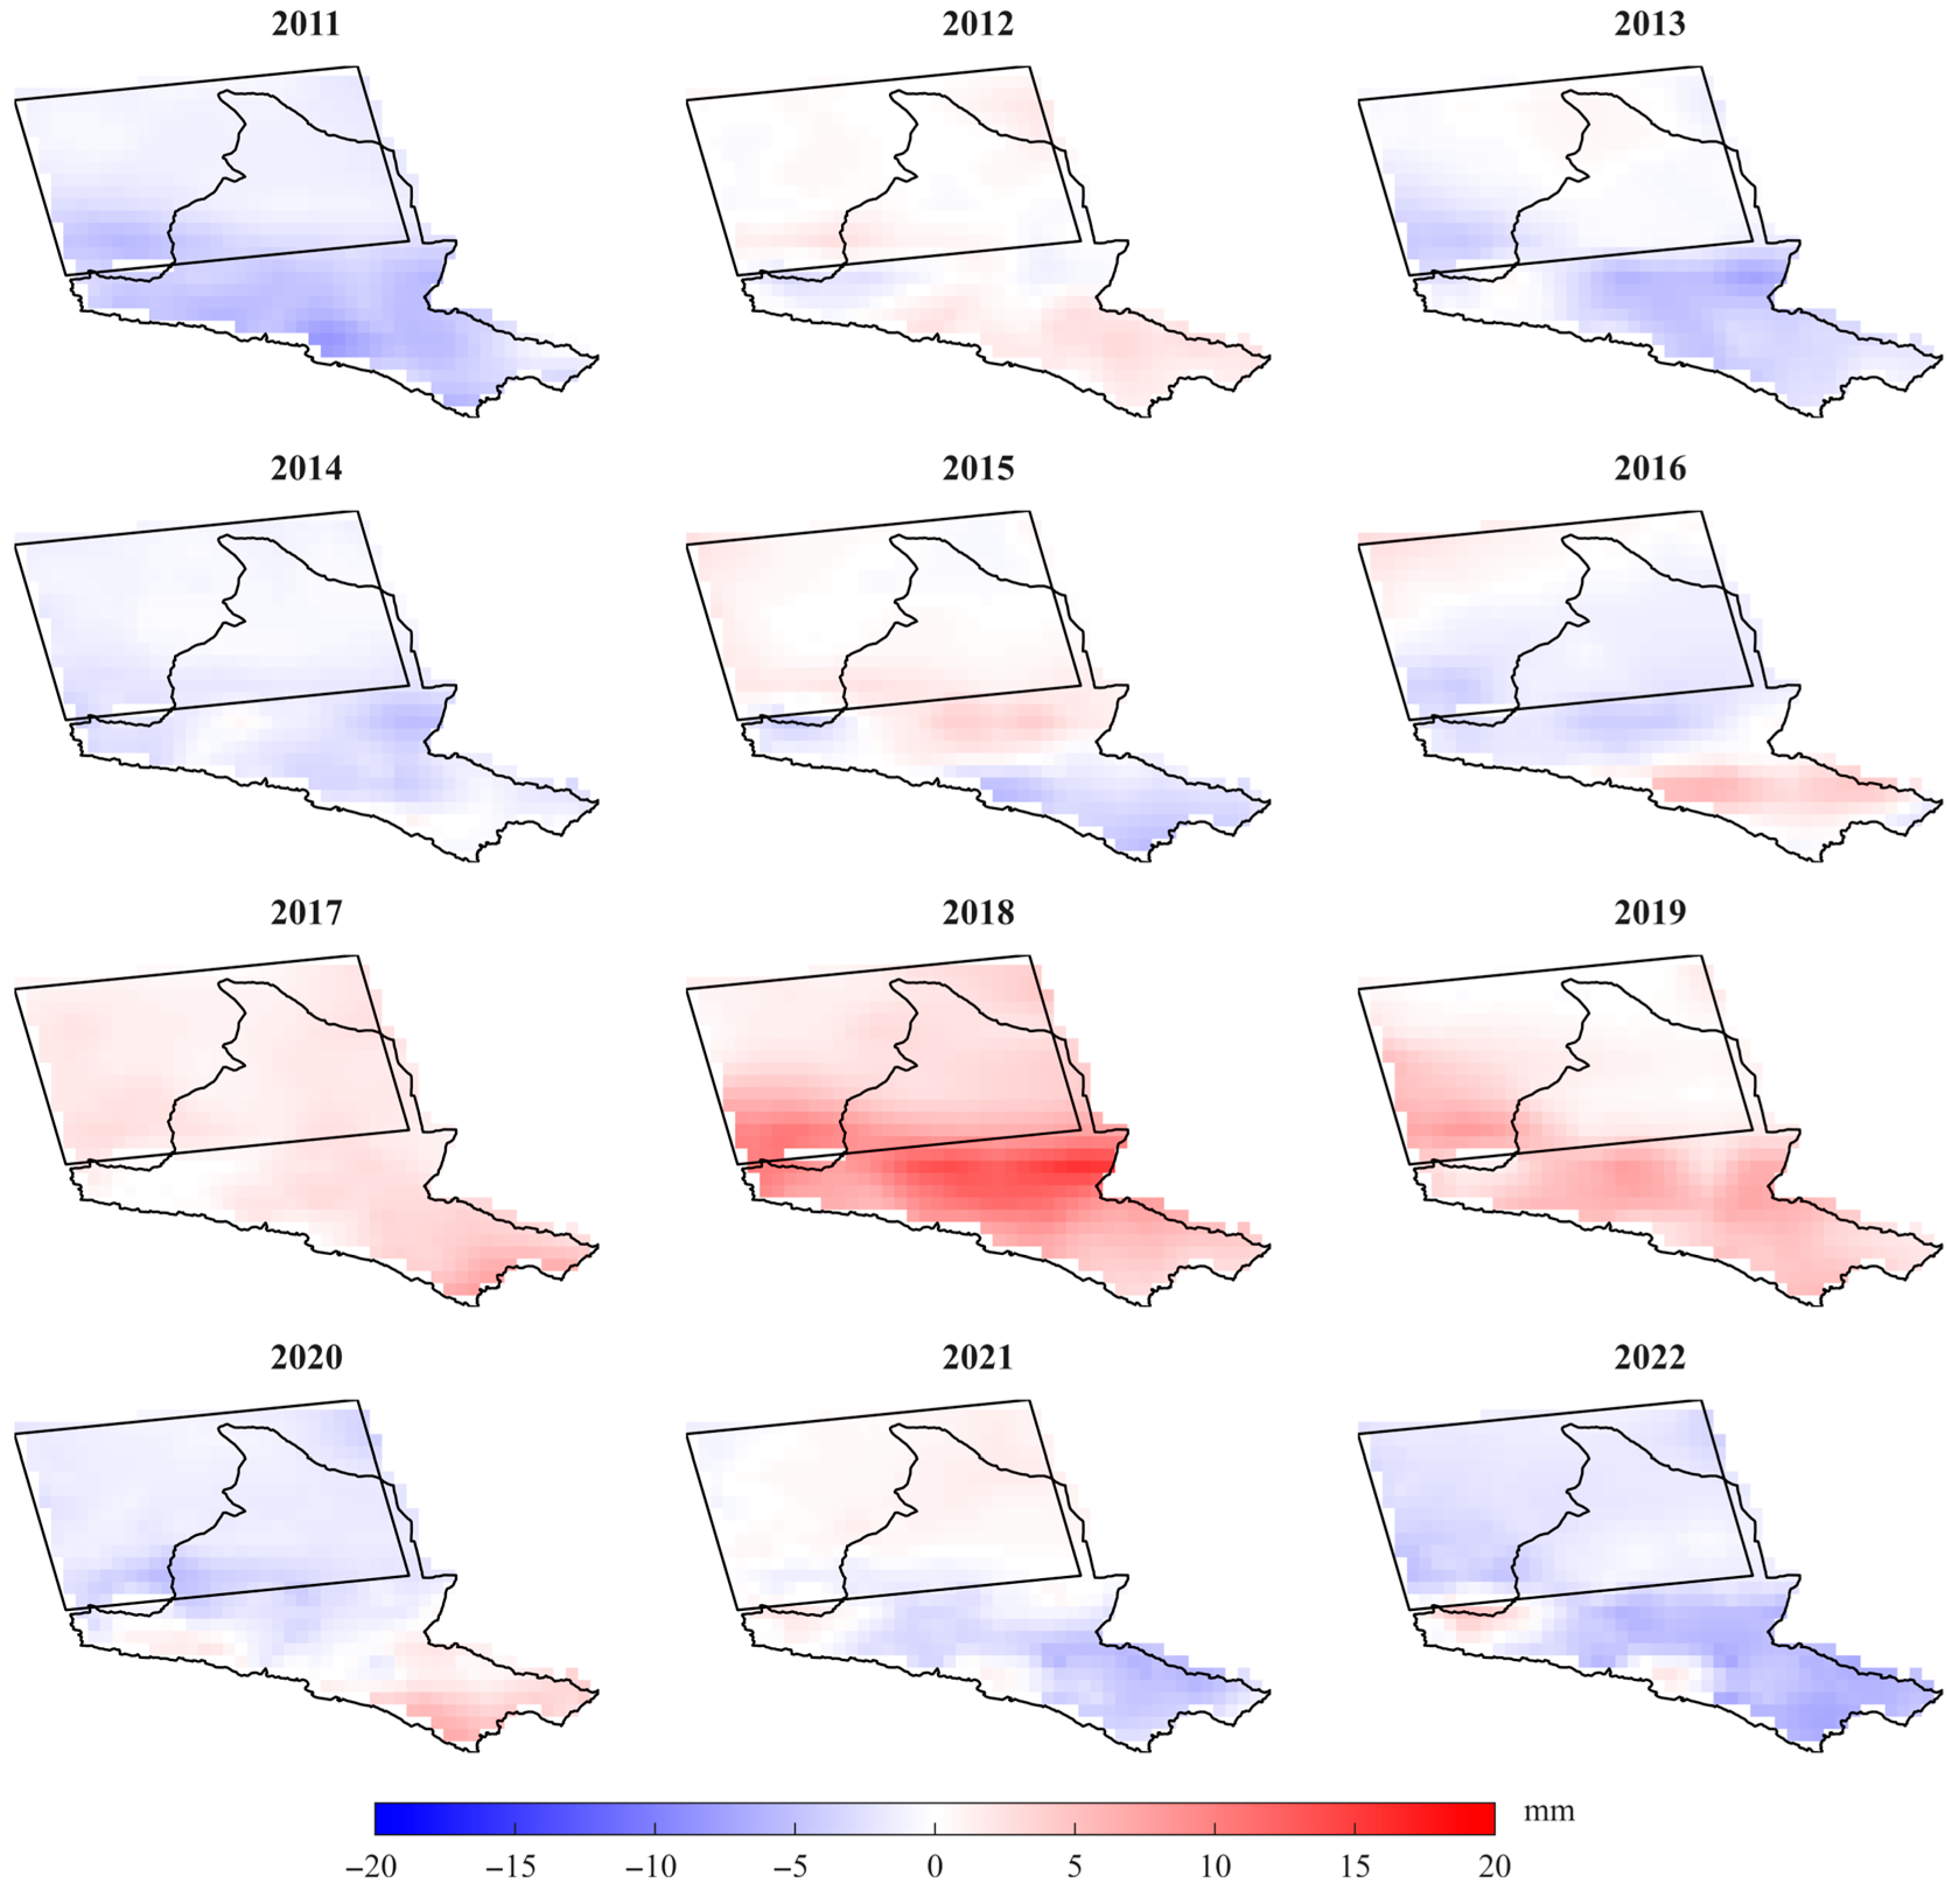
The InSAR and GRACE inversion results both reveal a rapid groundwater increase in the Golmud River Basin around 2018. By applying a low-pass filter to the detrended time series, the period of significant positive groundwater anomaly was identified as 2017–2019 (Figure 13a). To investigate the underlying climatic conditions, we examined the annual precipitation anomalies, annual temperature anomalies, and the Multivariate ENSO Index (MEI) variations in the study area during 2010–2021. The results show that 2017–2019 were the three wettest years in the past decade in the Golmud River Basin (Figure 13b). The spatial distribution of precipitation anomalies indicates that the entire basin experienced significant positive precipitation anomalies during this period. The precipitation anomaly began in 2017, propagated from north to south, and gradually weakened after reaching its maximum in 2018 (Figure 14). Meanwhile, when using a three-year period as the statistical window, 2017–2019 also represents the consecutive three-year period with the lowest average temperature during the past decade (Figure 13c). The enhanced precipitation during this period increased groundwater recharge, while the relatively low temperature suppressed evapotranspiration and reduced groundwater loss, thereby promoting the sustained and rapid accumulation of groundwater. Analysis of the MEI time series indicates that a La Niña event occurred during 2017–2018 (Figure 13d). The associated teleconnection effects may have driven the concurrent precipitation and temperature anomalies in the Golmud River Basin during this period, ultimately contributing to the observed anomalous groundwater increase.
Figure 13.
Comparison between groundwater variations and meteorological factors during 2010–2022. (a) 2010–2022 groundwater variation time series and low-pass filtered results; (b) 2011–2022 annual precipitation anomalies; (c) 2011–2022 annual temperature anomalies; (d) 2010–2022 multivariate ENSO Index (MEI), with positive values indicating El Niño events and negative values indicating La Niña events.
Figure 14.
Spatial distribution of annual precipitation anomalies in the study area during 2011–2022.
5. Conclusions
This study employed multi-source space geodetic techniques to achieve refined groundwater inversion and relevant mechanism analysis in the Golmud River Basin. The main conclusions are summarized as follows:
- (1)
- The annual mean deformation rates in the Golmud River Basin during 2017–2021 ranged from −60 mm/a to 6 mm/a. Controlled by the combined effects of river dynamics, mining activities, and urban development, the spatial distribution of cumulative surface deformation exhibited significant heterogeneity. Distinct linear subsidence zones developed along the Utu Meiren River and Dazaohuo River, whereas the northeastern coal mining area showed spatially concentrated block-like subsidence with clear boundaries. Overall, the deformation pattern exhibited a composite structure characterized by dual-river belts, mining-related patches, and relatively stable urban areas.
- (2)
- By screening observations affected by significant anthropogenic disturbances and correcting for modeled non-tidal atmospheric and oceanic loading and GIA effects, we reduced the influence of major non-hydrological signals on the geodetic deformation observations. Synthetic checkerboard tests further demonstrated that the proposed geodetic inversion framework could recover prescribed groundwater signals at a spatial resolution of approximately 40 km under the tested conditions, indicating its groundwater monitoring potential for small- and medium-scale basins.
- (3)
- Groundwater in the Golmud River Basin exhibited an overall increasing trend with fluctuations during 2017–2021. Spatially, the groundwater increase center was located in the southwestern region, and the annual amplitude exhibited a seasonal variability pattern characterized by stronger fluctuations in the south and weaker fluctuations in the north. The annual amplitude derived from GRACE was approximately half that derived from InSAR, while WGHM yielded substantially smaller groundwater variations than the two geodetic estimates. These differences may reflect the effects of spatial resolution, signal smoothing, and methodological uncertainties. The results demonstrate the potential of InSAR to characterize and refine spatially heterogeneous groundwater variations.
- (4)
- The rapid groundwater accumulation observed in the Golmud River Basin during 2017–2019 was highly consistent with the concurrent occurrence of above-normal precipitation and below-normal temperature anomalies. Association analysis indicates that sustained recharge from positive precipitation anomalies and reduced evapotranspiration caused by lower temperatures jointly created favorable conditions for groundwater accumulation. Analysis of climate teleconnection indices suggests that a La Niña event occurring contemporaneously may have been a key climatic driver of precipitation and temperature anomalies. These findings suggest that groundwater evolution in the Golmud River Basin is regulated by extreme climate events and provide scientific support for arid basin water resource management.
Supplementary Materials
The following supporting information can be downloaded at: https://www.mdpi.com/article/10.3390/rs18203502/s1, Text S1: Sensitivity of groundwater inversion results to the deformation-rate screening criterion; Figure S1: Spatial distribution of the original and additionally retained InSAR observations after relaxing the deformation-rate screening criterion; Figure S2: Comparison of groundwater variation time series obtained from different approaches based on the expanded set of 937 InSAR observations. (a) GRACE, InSAR, and WGHM results, where the equivalent water height values represent the mean variations within the parallelogram area shown in Figure 1c; (b) groundwater well observations; Figure S3: InSAR-derived groundwater variations in the Golmud River Basin during 2017–2021 based on the expanded set of 937 InSAR observations retained after relaxing the deformation-rate screening criterion, using two different surface water correction models. (a–b) Groundwater change rates; (c–d) annual amplitudes of groundwater variations.
Author Contributions
Conceptualization, J.J.; Methodology, J.J. and W.B.; Software, J.J. and W.B.; Validation, G.W.; Formal analysis, W.B., Z.X., D.Z., G.W., C.W., Y.H. (Yan Huang), Y.H. (Yujuan Huan) and J.J.; Investigation, W.B., Z.X., D.Z., G.W., C.W., Y.H. (Yan Huang), Y.H. (Yujuan Huan) and J.J.; Resources, W.B., Z.X., D.Z., C.W. and Y.H. (Yujuan Huan); Writing—original draft, W.B. and J.J.; Writing—review and editing, Z.X., G.W. and J.J.; Supervision, J.J.; Project administration, W.B. and J.J.; Funding acquisition, W.B. and J.J. All authors have read and agreed to the published version of the manuscript.
Funding
This research was funded by the National Natural Science Foundation of China, grant number 42304020, and the Kunlun Talents Program for Leading Scientific and Technological Talents of Qinghai Province.
Data Availability Statement
The datasets used in this study are publicly available from the following repositories. The CSR GRACE/FO RL06.3 Mascon Solutions (RL0603) data were obtained from the Center for Space Research (CSR), University of Texas at Austin, and are available at https://download.csr.utexas.edu/outgoing/grace/RL0603_mascons/CSR_GRACE_GRACE-FO_RL0603_Mascons_all-corrections.nc (accessed on 1 May 2026). The ICE-6G_D model is available at http://www.atmosp.physics.utoronto.ca/~peltier/data.php (accessed on 1 May 2026). The GLDAS Noah Land Surface Model L4 monthly data with 0.25° spatial resolution (GLDAS_NOAH 0.25° monthly) were provided by NASA and are available at https://ldas.gsfc.nasa.gov/gldas/ (accessed on 1 May 2026). The ERA5-Land monthly averaged reanalysis data from 1950 to the present were obtained from the Copernicus Climate Change Service (C3S) and are available at https://cds.climate.copernicus.eu/datasets/reanalysis-era5-land-monthly-means?tab=overview (accessed on 1 May 2026). GPCC dataset is available at https://www.dwd.de/DE/Home/home_node.html (accessed on 1 May 2026). GHCN_CAMS dataset is available at https://psl.noaa.gov/data/gridded/data.ghcncams.html (accessed on 1 May 2026). The MEI climate index used is available at https://climatedataguide.ucar.edu/climate-data/multivariate-enso-index (accessed on 1 May 2026). The WaterGAP Global Hydrology Model (WGHM) data were obtained from PANGAEA Data Publisher for Earth & Environmental Science and are available at https://doi.pangaea.de/10.1594/PANGAEA.948461 (accessed on 1 May 2026). The in situ groundwater well level time series is available at http://chinageology.cgs.cn/article/doi/10.31035/cg2021064?pageType=en (accessed on 1 May 2026). The non-tidal atmospheric and oceanic loading products (NTAL/NTOL) were provided by the German Research Centre for Geosciences (GFZ) and are available at https://rz-vm480.gfz.de/repository (accessed on 1 May 2026). The Sentinel-1 SAR data used for InSAR processing were obtained from the Copernicus Data Space Ecosystem and are available at https://dataspace.copernicus.eu/ (accessed on 1 May 2026). The GNSS displacement time series products are available at https://www.eqdsc.com/index.html (accessed on 1 May 2026). All datasets used in this study are publicly accessible through the above repositories (accessed on 1 May 2026).
Conflicts of Interest
Author Wenhong Bai was employed by the company Qinghai 906 Engineering Survey and Design Institute. Author Yujuan Huan was employed by the company Qinghai Provincial Center for Farmland Construction and Land Consolidation. The remaining authors declare that the research was conducted in the absence of any commercial or financial relationships that could be construed as a potential conflict of interest.
References
- Chen, Y.; Li, Y.; Zhang, Y.; Zhang, M.; Zhang, J.; Yi, C.; Liu, G. Late quaternary deposition and incision sequences of the Golmud River and their environmental implications. Quat. Int. 2011, 236, 48–56. [Google Scholar] [CrossRef] [Scilit]
- Wang, J.; Huang, J.; Fang, T.; Song, G.; Sun, F. Relationship of underground water level and climate in northwest China’s inland basins under the global climate change: Taking the Golmud River catchment as an example. China Geol. 2021, 4, 402–409. [Google Scholar] [CrossRef] [Scilit]
- Xiao, Y.; Shao, J.; Frape, S.K.; Cui, Y.; Dang, X.; Wang, S.; Ji, Y. Groundwater origin, flow regime and geochemical evolution in arid endorheic watersheds: A case study from the Qaidam Basin, northwestern China. Hydrol. Earth Syst. Sci. 2018, 22, 4381–4400. [Google Scholar] [CrossRef] [Scilit]
- Zhang, X.; Zhang, C.; Feng, W.; Zhu, R.; Xu, Q. Application of remote sensing in the description of fluvial system in dryland: A case study of Golmud distributive fluvial system, Qaidam Basin, NW China. J. Palaeogeogr. 2022, 11, 601–617. [Google Scholar] [CrossRef] [Scilit]
- Guo, L.; Ding, Y.; Fang, H.; An, C.; Wang, G.; Mao, H.; Yang, N. Regional variations and hydrochemical evolution in Golmud River watershed (Qaidam Basin, China): An integration of self-organizing maps and multi-statistic approaches. Environ. Earth Sci. 2025, 84, 143. [Google Scholar] [CrossRef] [Scilit]
- Hou, W.; Li, X.; Yang, L.; Ta, W.; Jia, X. Carrying capacity of water resources for renewable energy development in arid regions in northwest China: A case study of Golmud, Qinghai. Front. Environ. Sci. 2022, 10, 892414. [Google Scholar] [CrossRef] [Scilit]
- Xiao, Y.; Liu, K.; Zhang, Y.; Yang, H.; Wang, S.; Qi, Z.; Hao, Q.; Wang, L.; Luo, Y.; Yin, S. Numerical investigation of groundwater flow systems and their evolution due to climate change in the arid Golmud River watershed on the Tibetan Plateau. Front. Earth Sci. 2022, 10, 943075. [Google Scholar] [CrossRef] [Scilit]
- Famiglietti, J.S. The global groundwater crisis. Nat. Clim. Change 2014, 4, 945–948. [Google Scholar] [CrossRef] [Scilit]
- Feng, W.; Shum, C.; Zhong, M.; Pan, Y. Groundwater storage changes in China from satellite gravity: An overview. Remote Sens. 2018, 10, 674. [Google Scholar] [CrossRef] [Scilit]
- Scanlon, B.R.; Fakhreddine, S.; Rateb, A.; de Graaf, I.; Famiglietti, J.; Gleeson, T.; Grafton, R.Q.; Jobbagy, E.; Kebede, S.; Kolusu, S.R.; et al. Global water resources and the role of groundwater in a resilient water future. Nat. Rev. Earth Environ. 2023, 4, 87–101. [Google Scholar] [CrossRef] [Scilit]
- Wei, L.; Jiang, S.; Ren, L.; Tan, H.; Ta, W.; Liu, Y.; Yang, X.; Zhang, L.; Duan, Z. Spatiotemporal changes of terrestrial water storage and possible causes in the closed Qaidam Basin, China using GRACE and GRACE Follow-On data. J. Hydrol. 2021, 598, 126274. [Google Scholar] [CrossRef] [Scilit]
- Tapley, B.D.; Watkins, M.M.; Flechtner, F.; Reigber, C.; Bettadpur, S.; Rodell, M.; Sasgen, I.; Famiglietti, J.S.; Landerer, F.W.; Chambers, D.P.; et al. Contributions of GRACE to understanding climate change. Nat. Clim. Change 2019, 9, 358–369. [Google Scholar] [CrossRef] [Scilit] [PubMed]
- Carlson, G.; Werth, S.; Shirzaei, M. Joint inversion of GNSS and GRACE for terrestrial water storage change in California. J. Geophys. Res. Solid Earth 2022, 127, e2021JB023135. [Google Scholar] [CrossRef] [Scilit] [PubMed]
- Clayton, N.; Knappe, E.; White, A.M.; Martens, H.R.; Argus, D.F.; Lau, N.; Borsa, A.A.; Bendick, R.; Payton Gardner, W. Elastic deformation as a tool to investigate watershed storage connectivity. Commun. Earth Environ. 2024, 5, 110. [Google Scholar] [CrossRef] [Scilit]
- Wahr, J.; Molenaar, M.; Bryan, F. Time variability of the Earth’s gravity field: Hydrological and oceanic effects and their possible detection using GRACE. J. Geophys. Res. Solid Earth 1998, 103, 30205–30229. [Google Scholar] [CrossRef] [Scilit]
- Humphrey, V.; Rodell, M.; Eicker, A. Using satellite-based terrestrial water storage data: A review. Surv. Geophys. 2023, 44, 1489–1517. [Google Scholar] [CrossRef] [Scilit] [PubMed]
- Karki, J.; Hu, J.; Zhu, Y.; Afzal, M.M.; Xie, F.; Liu, S. Advances in GRACE satellite studies on terrestrial water storage: A comprehensive review. Geocarto Int. 2025, 40, 2482706. [Google Scholar] [CrossRef] [Scilit]
- Xiong, Y.; Feng, W.; Bai, H.; Chen, W.; Jiang, Z.; Zhong, M. High-resolution terrestrial water storage anomalies and components in China from GRACE/GFO via joint inversion downscaling. Water Resour. Res. 2025, 61, e2024WR038996. [Google Scholar] [CrossRef] [Scilit]
- Springer, A.; De Lannoy, G.; Rodell, M.; Ewerdwalbesloh, Y.; Gerdener, H.; Khaki, M.; Li, B.; Li, F.; Schumacher, M.; Tangdamrongsub, N.; et al. A review of current best practices and future directions in assimilating GRACE/-FO terrestrial water storage data into numerical models. Hydrol. Earth Syst. Sci. 2026, 30, 985–1022. [Google Scholar] [CrossRef] [Scilit]
- Farrell, W.E. Deformation of the Earth by surface loads. Rev. Geophys. 1972, 10, 761. [Google Scholar] [CrossRef] [Scilit]
- Argus, D.F.; Landerer, F.W.; Wiese, D.N.; Martens, H.R.; Fu, Y.; Famiglietti, J.S.; Thomas, B.F.; Farr, T.G.; Moore, A.W.; Watkins, M.M. Sustained water loss in California’s mountain ranges during severe drought from 2012 to 2015 inferred from GPS. J. Geophys. Res. Solid Earth 2017, 122, 10559–10585. [Google Scholar] [CrossRef] [Scilit]
- White, A.M.; Gardner, W.P.; Borsa, A.A.; Argus, D.F.; Martens, H.R. A review of GNSS/GPS in hydrogeodesy: Hydrologic loading applications and their implications for water resource research. Water Resour. Res. 2022, 58, e2022WR032078. [Google Scholar] [CrossRef] [Scilit] [PubMed]
- Yin, P.; Mu, D.; Xu, T. Water storage variations recovered from Global Navigation Satellite System network using spatial constraints: A case study of the contiguous United States. Remote Sens. 2023, 15, 5753. [Google Scholar] [CrossRef] [Scilit]
- Elliott, J.R.; Walters, R.J.; Wright, T.J. The role of space-based observation in understanding and responding to active tectonics and earthquakes. Nat. Commun. 2016, 7, 13844. [Google Scholar] [CrossRef] [Scilit] [PubMed]
- Liu, C.; Ji, L.; Zhu, L.; Xu, C.; Zhao, C.; Lu, Z.; Wang, Q. Kilometer-resolution three-dimensional crustal deformation of Tibetan Plateau from InSAR and GNSS. Sci. China Earth Sci. 2024, 67, 1818–1835. [Google Scholar] [CrossRef] [Scilit]
- Jiang, L.; Bai, L.; Zhao, Y.; Cao, G.; Wang, H.; Sun, Q. Combining InSAR and hydraulic head measurements to estimate aquifer parameters and storage variations of confined aquifer system in Cangzhou, North China Plain. Water Resour. Res. 2018, 54, 8234–8252. [Google Scholar] [CrossRef] [Scilit]
- Khorrami, M.; Shirzaei, M.; Ghobadi-Far, K.; Werth, S.; Carlson, G.; Zhai, G. Groundwater volume loss in Mexico City constrained by InSAR and GRACE observations and mechanical models. Geophys. Res. Lett. 2023, 50, e2022GL101962. [Google Scholar] [CrossRef] [Scilit]
- Carlson, G.; Werth, S.; Shirzaei, M. A novel hybrid GNSS, GRACE, and InSAR joint inversion approach to constrain water loss during a record-setting drought in California. Remote Sens. Environ. 2024, 311, 114303. [Google Scholar] [CrossRef] [Scilit]
- Verma, A.; Bhattacharya, A.; Marino, A.; Dey, S.; Gamba, P. An unsupervised clustering technique for dual-pol Sentinel-1 SLC and GRD SAR data. IEEE Trans. Geosci. Remote Sens. 2025, 63, 5215917. [Google Scholar] [CrossRef] [Scilit]
- Li, S.; Xu, W.; Li, Z. Review of the SBAS InSAR time-series algorithms, applications, and challenges. Geod. Geodyn. 2022, 13, 114–126. [Google Scholar] [CrossRef] [Scilit]
- Chen, Y.; Yu, S.; Tao, Q.; Liu, G.; Wang, L.; Wang, F. Accuracy verification and correction of D-InSAR and SBAS-InSAR in monitoring mining surface subsidence. Remote Sens. 2021, 13, 4365. [Google Scholar] [CrossRef] [Scilit]
- Wang, B.; Zhao, C.; Zhang, Q.; Lu, Z.; Li, Z.; Liu, Y. Sequential estimation of dynamic deformation parameters for SBAS-InSAR. IEEE Geosci. Remote Sens. Lett. 2019, 17, 1017–1021. [Google Scholar] [CrossRef] [Scilit]
- Goldstein, R.M.; Zebker, H.A.; Werner, C.L. Satellite radar interferometry: Two-dimensional phase unwrapping. Radio Sci. 1988, 23, 713–720. [Google Scholar] [CrossRef] [Scilit]
- Farr, T.G.; Rosen, P.A.; Caro, E.; Crippen, R.; Duren, R.; Hensley, S.; Kobrick, M.; Paller, M.; Rodriguez, E.; Roth, L.; et al. The shuttle radar topography mission. Rev. Geophys. 2007, 45, RG2004. [Google Scholar] [CrossRef] [Scilit]
- Yu, C.; Li, Z.; Bai, L.; Müller, J.; Zhang, J.; Zeng, Q. Successful applications of generic atmospheric correction online service for InSAR (GACOS) to the reduction of atmospheric effects on InSAR observations. J. Geod. Geoinf. Sci. 2021, 4, 109–115. [Google Scholar]
- Wang, H.; Xiang, L.; Jia, L.; Jiang, L.; Wang, Z.; Hu, B.; Feng, Y. Load Love numbers and Green’s functions for elastic Earth models PREM, iasp91, ak135, and modified models with refined crustal structure from Crust 2.0. Comput. Geosci. 2012, 49, 190–199. [Google Scholar] [CrossRef] [Scilit]
- Segall, P.; Harris, R. Slip deficit on the San Andreas fault at Parkfield, California, as revealed by inversion of geodetic data. Science 1986, 233, 1409–1413. [Google Scholar] [CrossRef] [Scilit] [PubMed]
- Golub, G.H.; Heath, M.; Wahba, G. Generalized cross-validation as a method for choosing a good ridge parameter. Technometrics 1979, 21, 215–223. [Google Scholar] [CrossRef]
- Jiao, J.; Pan, Y.; Zhang, X.; Shum, C.K.; Zhang, Y.; Ding, H. Spatially heterogeneous nonlinear signal in Antarctic ice-sheet mass loss revealed by GRACE and GPS. Geophys. J. Int. 2022, 233, 826–838. [Google Scholar] [CrossRef] [Scilit]
- Jiao, J.; Pan, Y.; Cui, X.; Mohasseb, H.A.; Ding, H. Evaluation of runoff variability in transboundary basins over High Mountain Asia: Multi-dataset merging based on satellite gravimetry constraint. Remote Sens. Environ. 2025, 316, 114493. [Google Scholar] [CrossRef] [Scilit]
- Pan, Y.; Jiang, W.; Ding, H.; Shum, C.K.; Jiao, J.; Li, J. Intradecadal fluctuations and three-dimensional crustal kinematic deformation of the Tianshan and Pamir derived from multi-geodetic imaging. J. Geophys. Res. Solid Earth 2023, 128, e2022JB025325. [Google Scholar] [CrossRef] [Scilit]
- Jiao, J.; Pan, Y.; Ren, D.; Zhang, X. Present-day three-dimensional crustal deformation velocity of the Tibetan Plateau due to multi-component land water loading. Geophys. Res. Lett. 2024, 51, e2024GL108684. [Google Scholar] [CrossRef] [Scilit]
- Müller Schmied, H.; Cáceres, D.; Eisner, S.; Flörke, M.; Herbert, C.; Niemann, C.; Peiris, T.A.; Popat, E.; Portmann, F.T.; Reinecke, R.; et al. The global water resources and use model WaterGAP v2.2d: Model description and evaluation. Geosci. Model Dev. 2021, 14, 1037–1079. [Google Scholar] [CrossRef] [Scilit]
- Dill, R.; Dobslaw, H. Numerical simulations of global-scale high-resolution hydrological crustal deformations. J. Geophys. Res. Solid Earth 2013, 118, 5008–5017. [Google Scholar] [CrossRef] [Scilit]
- Peltier, W.R.; Argus, D.F.; Drummond, R. Comment on “An assessment of the ICE-6G_C (VM5a) glacial isostatic adjustment model” by Purcell et al. J. Geophys. Res. Solid Earth 2018, 123, 2019–2028. [Google Scholar] [CrossRef] [Scilit]

Disclaimer/Publisher’s Note: The statements, opinions and data contained in all publications are solely those of the individual author(s) and contributor(s) and not of MDPI and/or the editor(s). MDPI and/or the editor(s) disclaim responsibility for any injury to people or property resulting from any ideas, methods, instructions or products referred to in the content. |
© 2026 by the authors. Licensee MDPI, Basel, Switzerland. This article is an open access article distributed under the terms and conditions of the Creative Commons Attribution (CC BY) license.