


Highlights
What are the main findings?
- Consecutive drone surveys with offset flight paths can increase the availability of individuals for detection compared to standard single-observer drone surveys.
- Both occlusion structure and the orientation of the secondary flight path relative to the primary flight path affect improvements in detectability.
What are the implications of the main findings?
- Implementing repeat drone flights, with correction based on double-observer detection probability, can improve the accuracy of wildlife abundance estimates, particularly in highly occluded or densely vegetated habitats.
Abstract
Drones are increasingly used to conduct wildlife surveys in complex environments as they can be used in inaccessible areas, quickly survey large areas, and surveys can be reviewed post hoc, often leveraging AI technology. Double-observer methods applied to drone surveys, such as post-survey double-observer review of footage, improve inferences from drone-based wildlife surveys by correcting for individual perceptibility biases of observers. However, occlusion still affects the availability of individuals for detection, especially in complex environments. We explore the possibility that the availability of individuals may be increased by conducting a consecutive repeat survey with a parallel or rotated flight path in a double-observer survey design where individuals are largely stationary. We hypothesized that running this secondary flight would increase the availability of individuals for detection, thereby improving count accuracy, with the most prominent improvement in most complex (e.g., highly vegetated) environments. We explored this using (1) an in-field test of object detectability in environments with differing vegetation, and (2) a simulation of drone wildlife surveys in different levels of occlusion. In both trials, we tested a double-observer detectability estimator tool to correct survey counts. In the field, conducting a secondary flight from a different angle resulted in more accurate counts, with a post-count correction further increasing accuracy. The simulation highlighted detectability benefits from the secondary observer in nearly all trials (99%), and these benefits were generally greater in environments with denser canopies, and from flights paths rotated 90° compared to parallel paths.
1. Introduction
Uncrewed aerial vehicles (UAVs), or drones, are increasingly used in wildlife research due to their ability to efficiently survey large, remote, or densely vegetated areas where traditional ground methods are limited. Their use is associated with higher detection rates of target species, while also reducing disturbance compared to traditional on-ground survey methods [1,2]. Drone imagery can be reviewed post hoc, supporting verification, reducing observer error, and enabling automated or semi-automated detection using machine learning tools [3,4,5]. Together, these benefits make drones a powerful tool for improving the accuracy, consistency, and scalability of wildlife surveys, especially for cryptic or low-density species.
While drone-based surveys offer lower effort and higher detectability than traditional methods, they still require careful planning to ensure efficiency and accuracy. Field deployment involves logistical challenges such as transporting equipment to remote sites, staffing, vehicle use, and navigating airspace regulations [6,7]. Environmental conditions also impose narrow survey windows, especially for thermal imaging, which depends on optimal temperature differentials [5,8]. Additionally, wildlife behavior and phenology can limit detection opportunities [9,10]. These constraints highlight the need for survey designs that maximize data quality while minimizing resource demands.
Improving the efficiency of drone-based wildlife surveys relies on maximizing detectability—the accurate identification and counting of individuals present in the survey area [11]. Increasingly, this process involves automated methods using machine learning and computer vision to process large volumes of imagery [12,13]. To enhance detectability, it is crucial to reduce the following two main sources of error: false negatives (missed detections) and false positives (incorrect detections) [11,14]. False negatives result from issues of availability and perceptibility. When animals are present but not visible due to vegetation, terrain, or behavior (e.g., denning), this is an issue of availability [15]. When animals are visible, but observers or algorithms fail to recognize them, this is an issue of perceptibility, often occurring because targets are partially obscured or briefly visible [16,17]. In machine learning-assisted counts, detection accuracy depends on how long and clearly animals appear in the imagery, and how well algorithms handle occlusion or variability in appearance [13,18,19]. Although advances in sensor resolution and machine learning continue to improve perceptibility [20,21], availability remains a limiting factor.
Occlusion, when an animal is partially or fully hidden from view, poses a major challenge to detecting wildlife in drone imagery, and can affect both the availability and perceptibility of targets. In the context of terrestrial wildlife surveys, vegetation is often the primary source of occlusion. Occlusion from vegetation can be highly variable, as vegetation structure can vary widely in height, density, and layering. This can then obstruct the line of sight between the drone and the target [9,22,23,24]. Additionally, vegetation can reduce or block thermal radiation being emitted by wildlife, causing the temperature recorded by the thermal infrared sensor to be a mixture of the individual’s heat signature and that of the surrounding vegetation [25]. The angle of observation plays a critical role in the following scenarios: a target obscured from one aerial perspective may become visible from another due to gaps in the canopy or changes in vegetation cover. For example, positioning the camera at an oblique angle can improve detection of riverine rabbits resting beneath small dense shrubbery compared to a nadir (top-down) angle [25]. Similarly, adjusting the drone’s position to achieve a different viewing angle can improve visibility of partially obscured animals.
One strategy to improve detection in wildlife surveys is double-observer survey designs, traditionally involving two observers surveying the same area independently to reduce individual-level detection error [26]. This method is dependent on the ability to link detections of targets between the observer’s surveys to produce a detection history for each target, meaning targets need to be individually identifiable through traits or other identifiable data, such as location if the species is unlikely to move during the survey period. Typically, double-observer detection histories capture whether each target was seen by only observer A, only observer B, or by both observers. Such information enables estimation of detection probability, which can be estimated using:
where and are the detection probabilities for each observer, which are calculated using the observation histories of targets [26]. This helps distinguish between availability and perceptibility errors by revealing which detections are consistent and which are missed across observers, as consistent availability is generally assumed. In the context of drone-based wildlife surveys, this concept can be applied through repeated flights or post hoc double-observer methods of single flights, with multiple humans or algorithms serving as different observers to review imagery to search for targets, where perceptibility may result in different wildlife counts from the same imagery [27,28]. However, given the increasing sophistication of automated detection models [20,21], it stands to reason that the detectability improvements from such approaches may become more trivial as models become less affected by inconsistencies in perceptibility, and that availability of individuals may be the more significant issue for detectability.
To address the challenge of occlusion and the effect it has on availability, optimizing the angle and perspective of drone flight paths offers a promising approach to improving detectability in complex habitats. Due to the complex 3D structure of habitats, such as uneven canopy layers or dense undergrowth, changes in viewpoint may alter the availability of individuals by reducing occlusion from certain angles [29]. As a result, flight paths that are offset or rotated could provide slightly different perspectives of the same scene—potentially revealing individuals that were previously occluded. In this sense, a second flight can act as an independent observer, sampling the population from a different angle. Thus, the flight path itself becomes a critical component of detectability due to differing availability. Using strategically offset or rotated survey routes may enhance detection through increased visibility of otherwise hidden individuals, meaning that if the individuals are stationary or uniquely identifiable (through markings, tags, etc.), multiple drone flights of different angles may give a more accurate count of individuals. Extending on this idea, if perceptibility is consistent between observers (as may be the case with algorithms as observers), then the double-observer probability estimator could correct for differences in availability opposed to perceptibility. Given a probability of detection, the probability of missed detections can be used as a heuristic to correct wildlife counts.
This study aimed to evaluate whether a repeated flights with offset paths approach in drone-based wildlife surveys can enhance the detectability of target species, particularly in environmentally complex habitats. Specifically, we aimed to
- ○
- Assess whether repeated drone surveys using flights with offset paths in a double-observer design improve detection accuracy by reducing the number of missed individuals during wildlife counts.
- ○
- Trial whether the double-observer detection probability can be used as a tool to further correct counts to improve accuracy.
- ○
- Compare the effectiveness of parallel versus rotated flight path configurations in enhancing individual detection during drone-based surveys.
- ○
- Evaluate how improvements in detection accuracy vary across habitats with differing levels of environmental complexity and visual occlusion.
To explore this, both field-based and simulated approaches were used. We hypothesized that implementing a double-observer style approach in repeated drone surveys would significantly enhance wildlife detectability. We further anticipated that the magnitude of improvement would depend on environmental complexity, with greater gains observed in more structurally complex or visually occluded habitats. In contrast, we expected that the orientation of the repeated survey path (parallel vs. rotated) would not significantly affect overall detection rates.
2. Materials and Methods
2.1. Field Experiments
To assess how repeated and alternative drone flight paths affect wildlife detectability, we conducted field tests in locations with differing occlusion profiles using ground control points (GCPs) as proxies for individual animals. These tests examined how flight path configuration and environmental complexity influence the visibility—and thus the detectability—of individuals during drone surveys.
2.1.1. Study Location
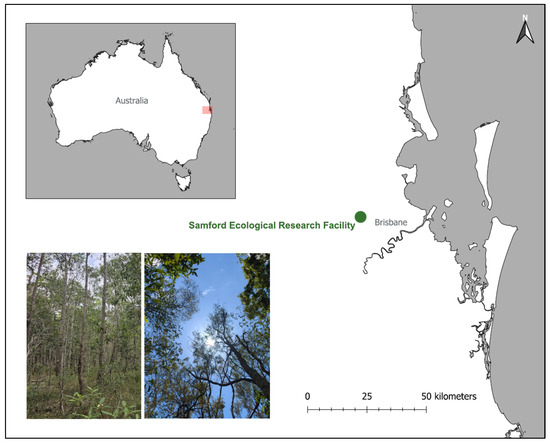
Samford Ecological Research Facility (SERF) is located in the peri-urban Samford Valley, approximately 24 km northwest of Brisbane, Australia (27.37985°S, 152.87694°E; Figure 1). The vegetation at the site consists of remnant dry sclerophyll eucalypt open forest to woodland, predominantly featuring Eucalyptus melanophloia and Eucalyptus crebra.
Figure 1.
Location and overview of the study site at Samford Ecological Research Facility (SERF), Brisbane, Queensland. The inset at the top left shows Brisbane’s location within Australia in the red rectangle. The embedded images at the bottom left show the appearance of the vegetation in the field plot looking across the landscape and up into the canopy.
2.1.2. Experimental Design
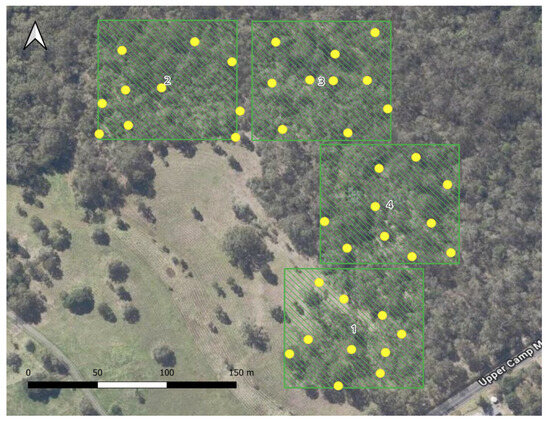
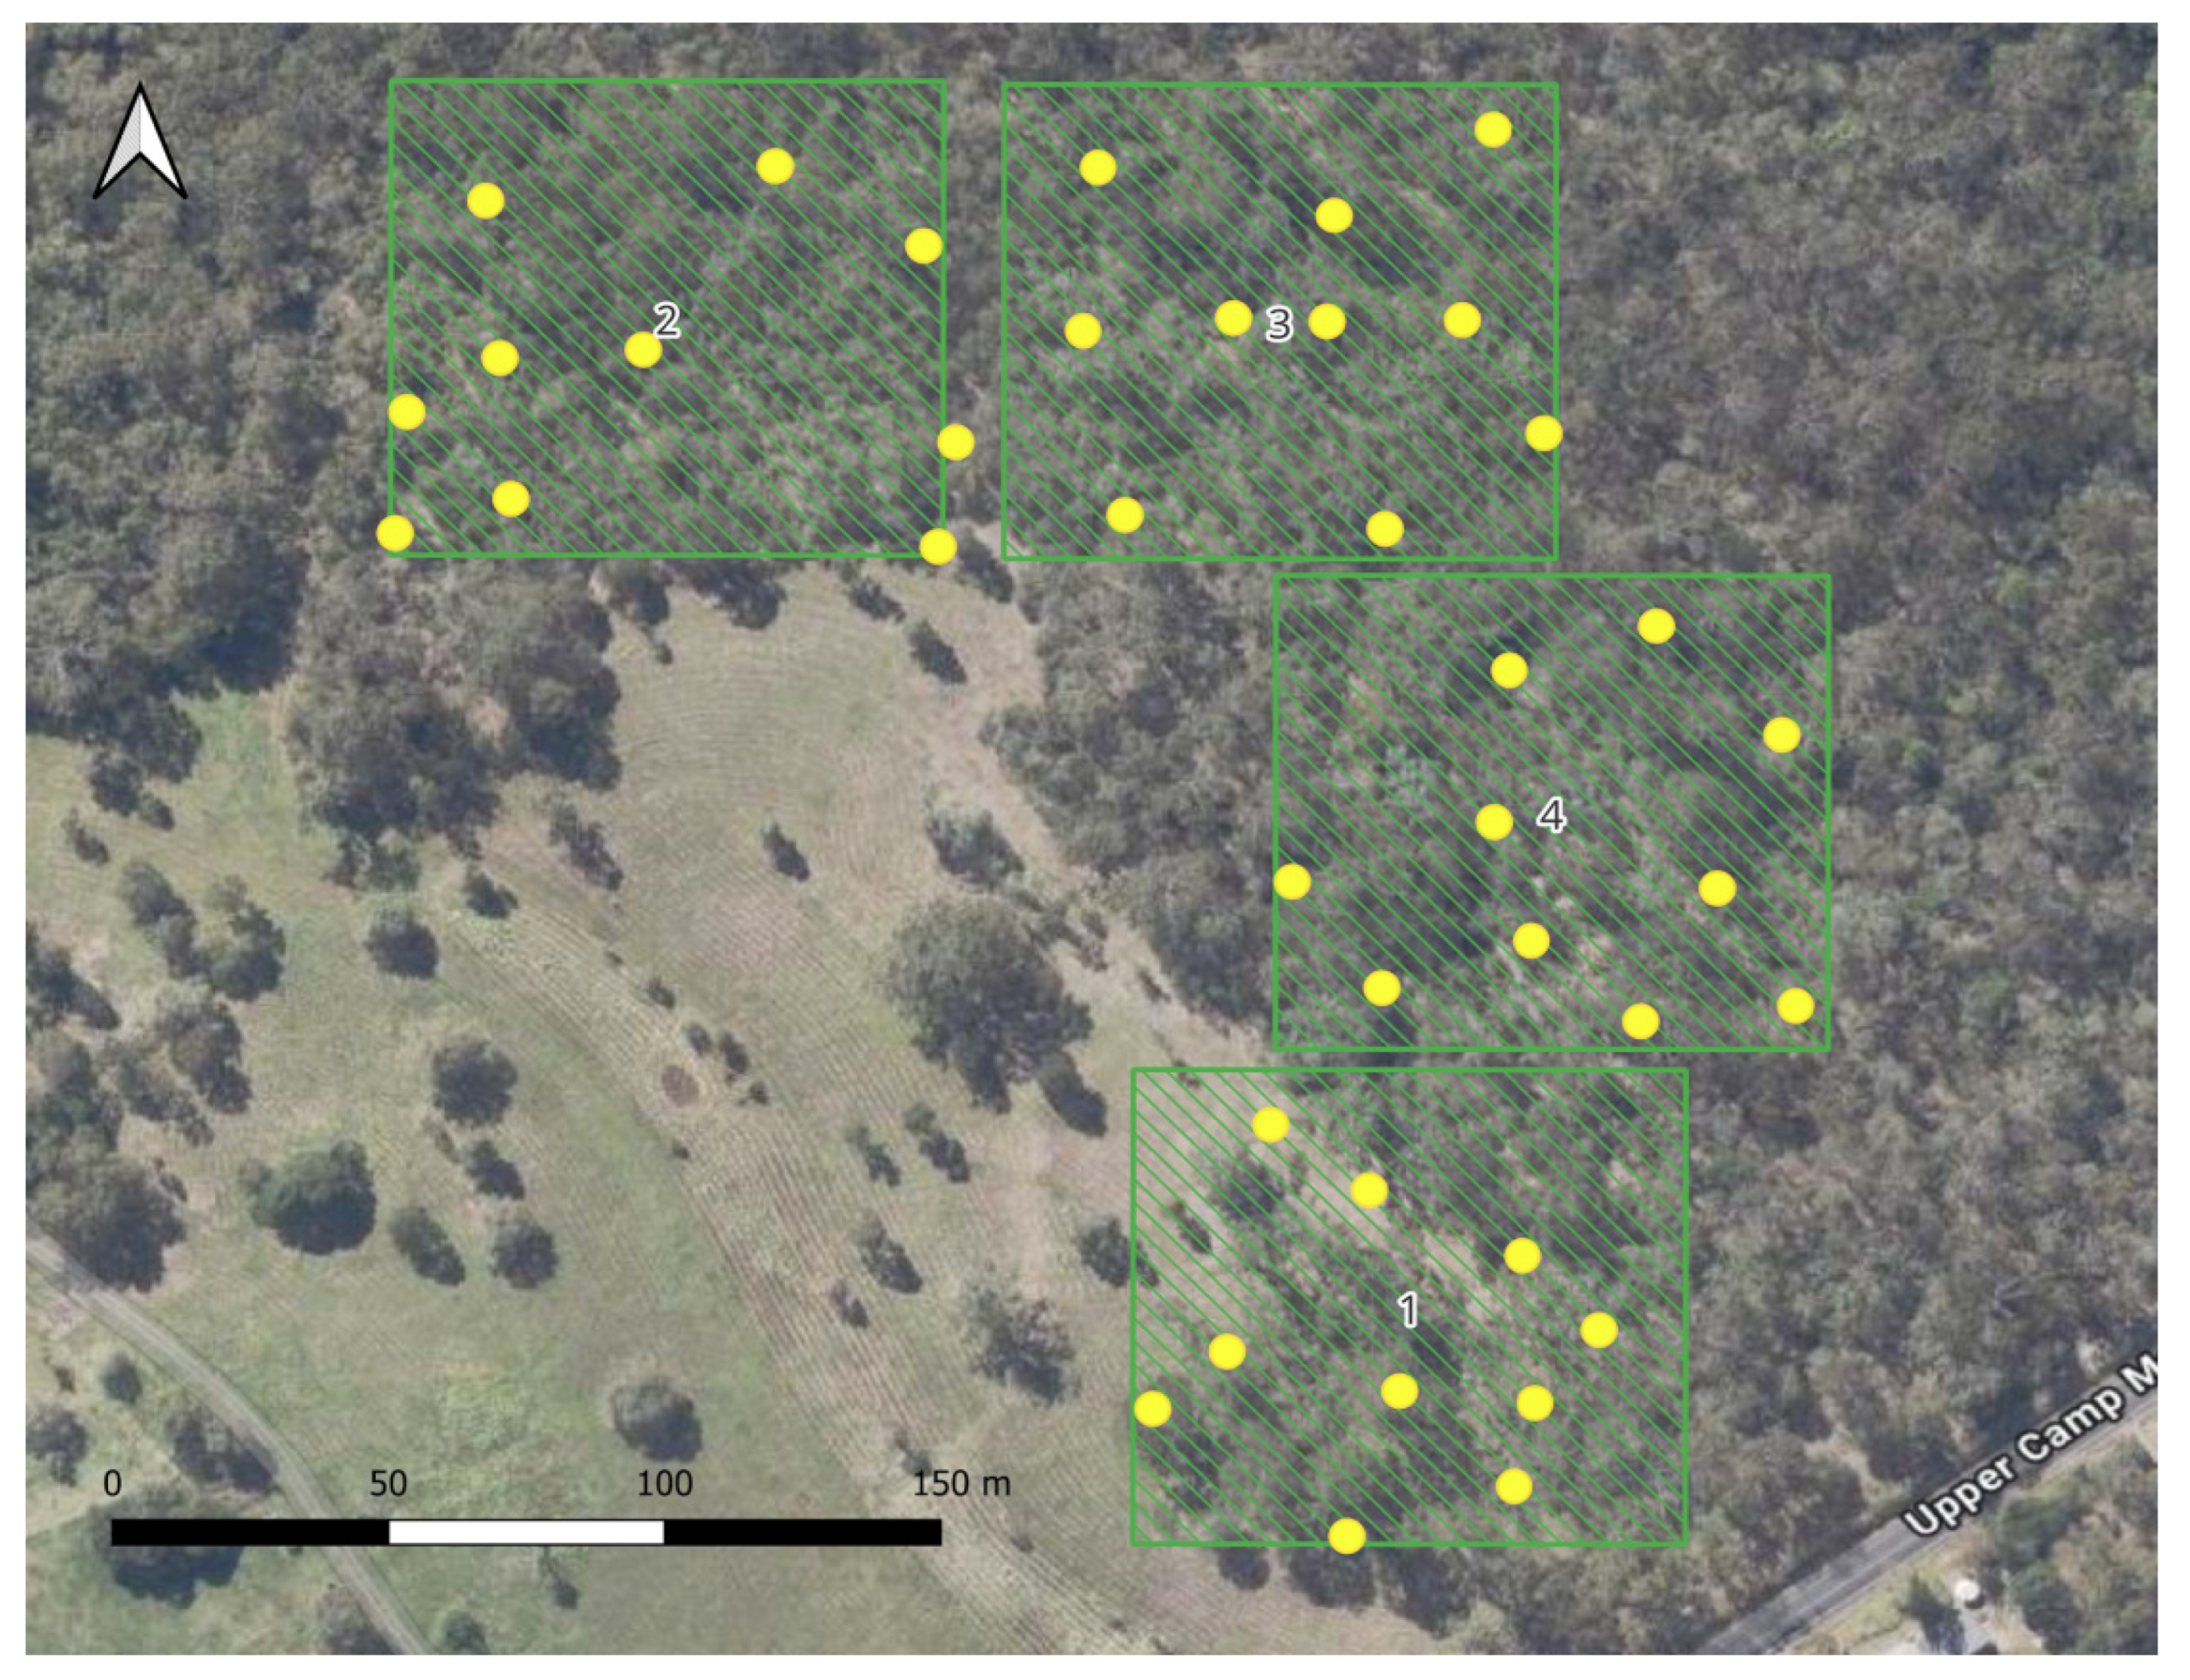
Four sites, each 100 m by 100 m, were manually selected to capture a variety of vegetation densities and heights within proximity to a suitable drone launch point. These sites were nominally assigned a description based on field and satellite-based observations (Table 1). Within each site, ten randomly generated coordinates with at least 20 m between each point were produced using QGIS v3.26.3 (Figure 2), each representing a hypothetical individual animal. Ground control points (GCPs) were placed at each of these locations in the field.
Table 1.
Site characteristics measured via LiDAR and via field categorization.
Figure 2.
Drone survey locations (green squares with site IDs indicated) and individuals within each location (yellow dots).
Drone surveys were undertaken on 25 October 2024 and 27 November 2024 using a DJI Mavic 2 Enterprise Advanced quadcopter (DJI, Shenzhen, China) equipped with an integrated 48-megapixel RGB camera. Flights were conducted in the middle of the day on days with minimal cloud cover to reduce the impact of shadow. Two flights were conducted at each site, with one following an east-to-west (E–W) lawnmower pattern and the other a north-to-south (N–S) pattern. Flight paths were planned using the DJI Pilot app (Android) on a DJI Smart Controller, adopting standard flight parameters commonly used in koala surveys in eucalypt forests [30]. The drone was programmed to fly at a speed of 4 m per second and an altitude of 60 m above ground level, automatically capturing images at regular intervals to achieve a front overlap of 90% and a side overlap of 75%.
2.1.3. Vegetation Structure and Cover Data
LiDAR remote sensing data were acquired at SERF on 18 and 25 August 2020. As the study area is remnant eucalypt forest, the canopy cover and height are relatively stable, so this sample date was still considered contemporary for the purposes of this study. Baseline airborne and ground-based LiDAR datasets were collected by the QUT Research Engineering Facility under clear sky conditions and light winds (below 3 m per second). The sensor platform was the Emesent Hovermap HVM100 (Emesent Pty Ltd., Brisbane, Australia), equipped with a Velodyne VLP-16 “Lite Puck” (Velodyne Lidar, San Jose, CA, USA) sensor with 360° horizontal and vertical field of view (FOV) and a maximum range of 100 m. The Hovermap payload in airborne configuration was integrated with a DJI Matrice 600 Pro UAV (DJI Technology Co., Ltd., Shenzhen, China) featuring GNSS and an inertial measurement unit. The survey flight lasted approximately 26 min and followed a perpendicular grid flight path with 30 m line spacing, programmed using Dronelink (v1.7.0) flight planning software. This 90° rotated flight grid improves canopy penetration and minimizes occlusion through cross-angled scanning, increasing spatial connectivity. The UAV flew at consistent 55 m above ground level (AGL), covering approximately 8.5 hectares. In addition, multiple ground-based LiDAR Hovermap scans were conducted on site with durations of 24 and 44 min.
Post-processing of LiDAR data to registered and aligned point clouds were completed in Emesent Software (v1.4.0) utilizing Wildcat SLAM algorithm (v1.2.0-1441). The point clouds were then analyzed and processed using CloudCompare software (v2.12). From the point clouds, a ground mesh was generated; then, a digital terrain model was used to separate ground points from off-ground points. Off-ground points were visually inspected to check for any non-vegetation points. Vegetation coverage was derived from a rasterized version of the off-ground points. Vegetation density was considered via a voxel-based approach to align with the simulated approach, with the presence of vegetation points in a 2.5 m by 2.5 m cube considered to be a “layer” of vegetation. The first layer of vegetation starts from 2.5 m high to exclude ground cover. Vegetation height was extracted as points and rasterized. Average values for each vegetation parameter were calculated at the site-level and in a 5 m by 5 m neighborhood around the GCP.
2.1.4. Identification of Individuals
Each image frame was manually reviewed to identify all visible GCPs representing individual targets. Because both the GCPs and image frames were georeferenced, the location of each individual within each frame was known in advance. This ensured that perceptibility was maximized, as the approximate known location of the object could be thoroughly checked in frame. Detections were recorded on a frame-by-frame basis for each survey pass.
There were still some potential perceptibility issues where the object was possibly present, but so thoroughly obscured that it was difficult to be certain if it was the object, especially when only a small portion of the black parts of the GCP were visible in a frame. In reality, when observers or algorithms are reviewing footage, the context in the sequence of frames is what allows confidence in detection. In this case, we generally needed a couple of frames to be confident that it was the object and not a shadow. To confidently avoid false positives (i.e., saying that an individual was available for detection when it was not), individuals were considered detected only if they appeared in three or more sequential image frames. This threshold was selected to ensure there were no false positives from transient visual noise and to reflect the temporal persistence typically required for reliable identification by either manual annotation or object detection algorithms [31]. Both flights had the same rules applied, meaning that perceptibility should be consistent between flights.
2.1.5. Applying Double-Observer Protocol
To estimate detection probability, we applied the double-observer detection probability estimator using the formula:
where is the probability of detection for observer 1 and is the probability of detection for observer 2 [26]. The probability values for observers were calculated using the counts of individuals in the observation history classes; , where the individual is detected by both observers, , where the individual is detected only by observer 1, and , where the individual is only detected by observer 2 [32]. The detection probabilities of observers 1 and 2 can then be calculated using the formulae:
This resultant probability, p, was used as a heuristic to correct counts, whereby the corrected count was calculated as:
where was the raw count of individuals.
In the context of drone-based surveys, each flight was treated as an independent observer under the assumption that differing flight paths could sample individuals differently due to variation in occlusion caused by vegetation structure.
2.1.6. Environmental Predictors of Detection
Linear regression models and negative binomial generalized linear models (GLMs) were used to investigate which environmental variables affected the detection characteristics of individuals, namely the total number of frames in which the individual was visible, the difference between observers in the number of frames for each individual, and the difference between observers in the maximum track length for each individual. Negative binomial GLMs were selected due to overdispersion in the data. These models were run using the MASS package (v7.3.61) [33] in R (v4.4.2) [34]. Mixed models with site as a random effect were also trialed; however, they were less parsimonious in all cases. Models were built from global models with vegetation height in meters (from LiDAR), vegetation cover as a percentage (from LiDAR), and distance of the individual to the site edge in meters. Number of layers (voxels) was removed from analyses due to collinearity with other vegetation characteristics. All predictor variables were scaled.
Model selection was conducted using Akaike’s Information Criterion (AIC) to select the model with the most parsimonious set of variables. Competing models were ranked by AIC. Model averaging was implemented using the MuMIn package (v1.48.11) [35] in R and included only models within the ΔAIC < 2 threshold. Estimates reported are from the conditional average of the models. Relative variable importance was assessed based on the summed Akaike weights across the top models. AIC tables are provided in the Supplementary Material File S1.
2.2. Simulated Drone Surveys
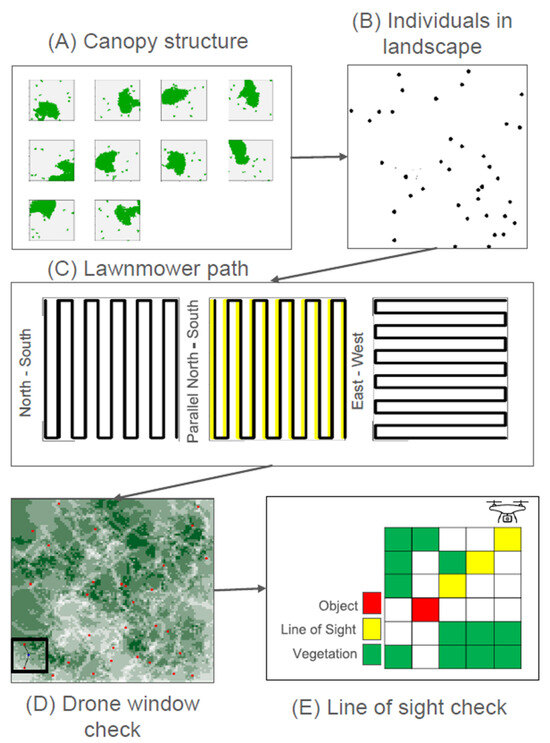
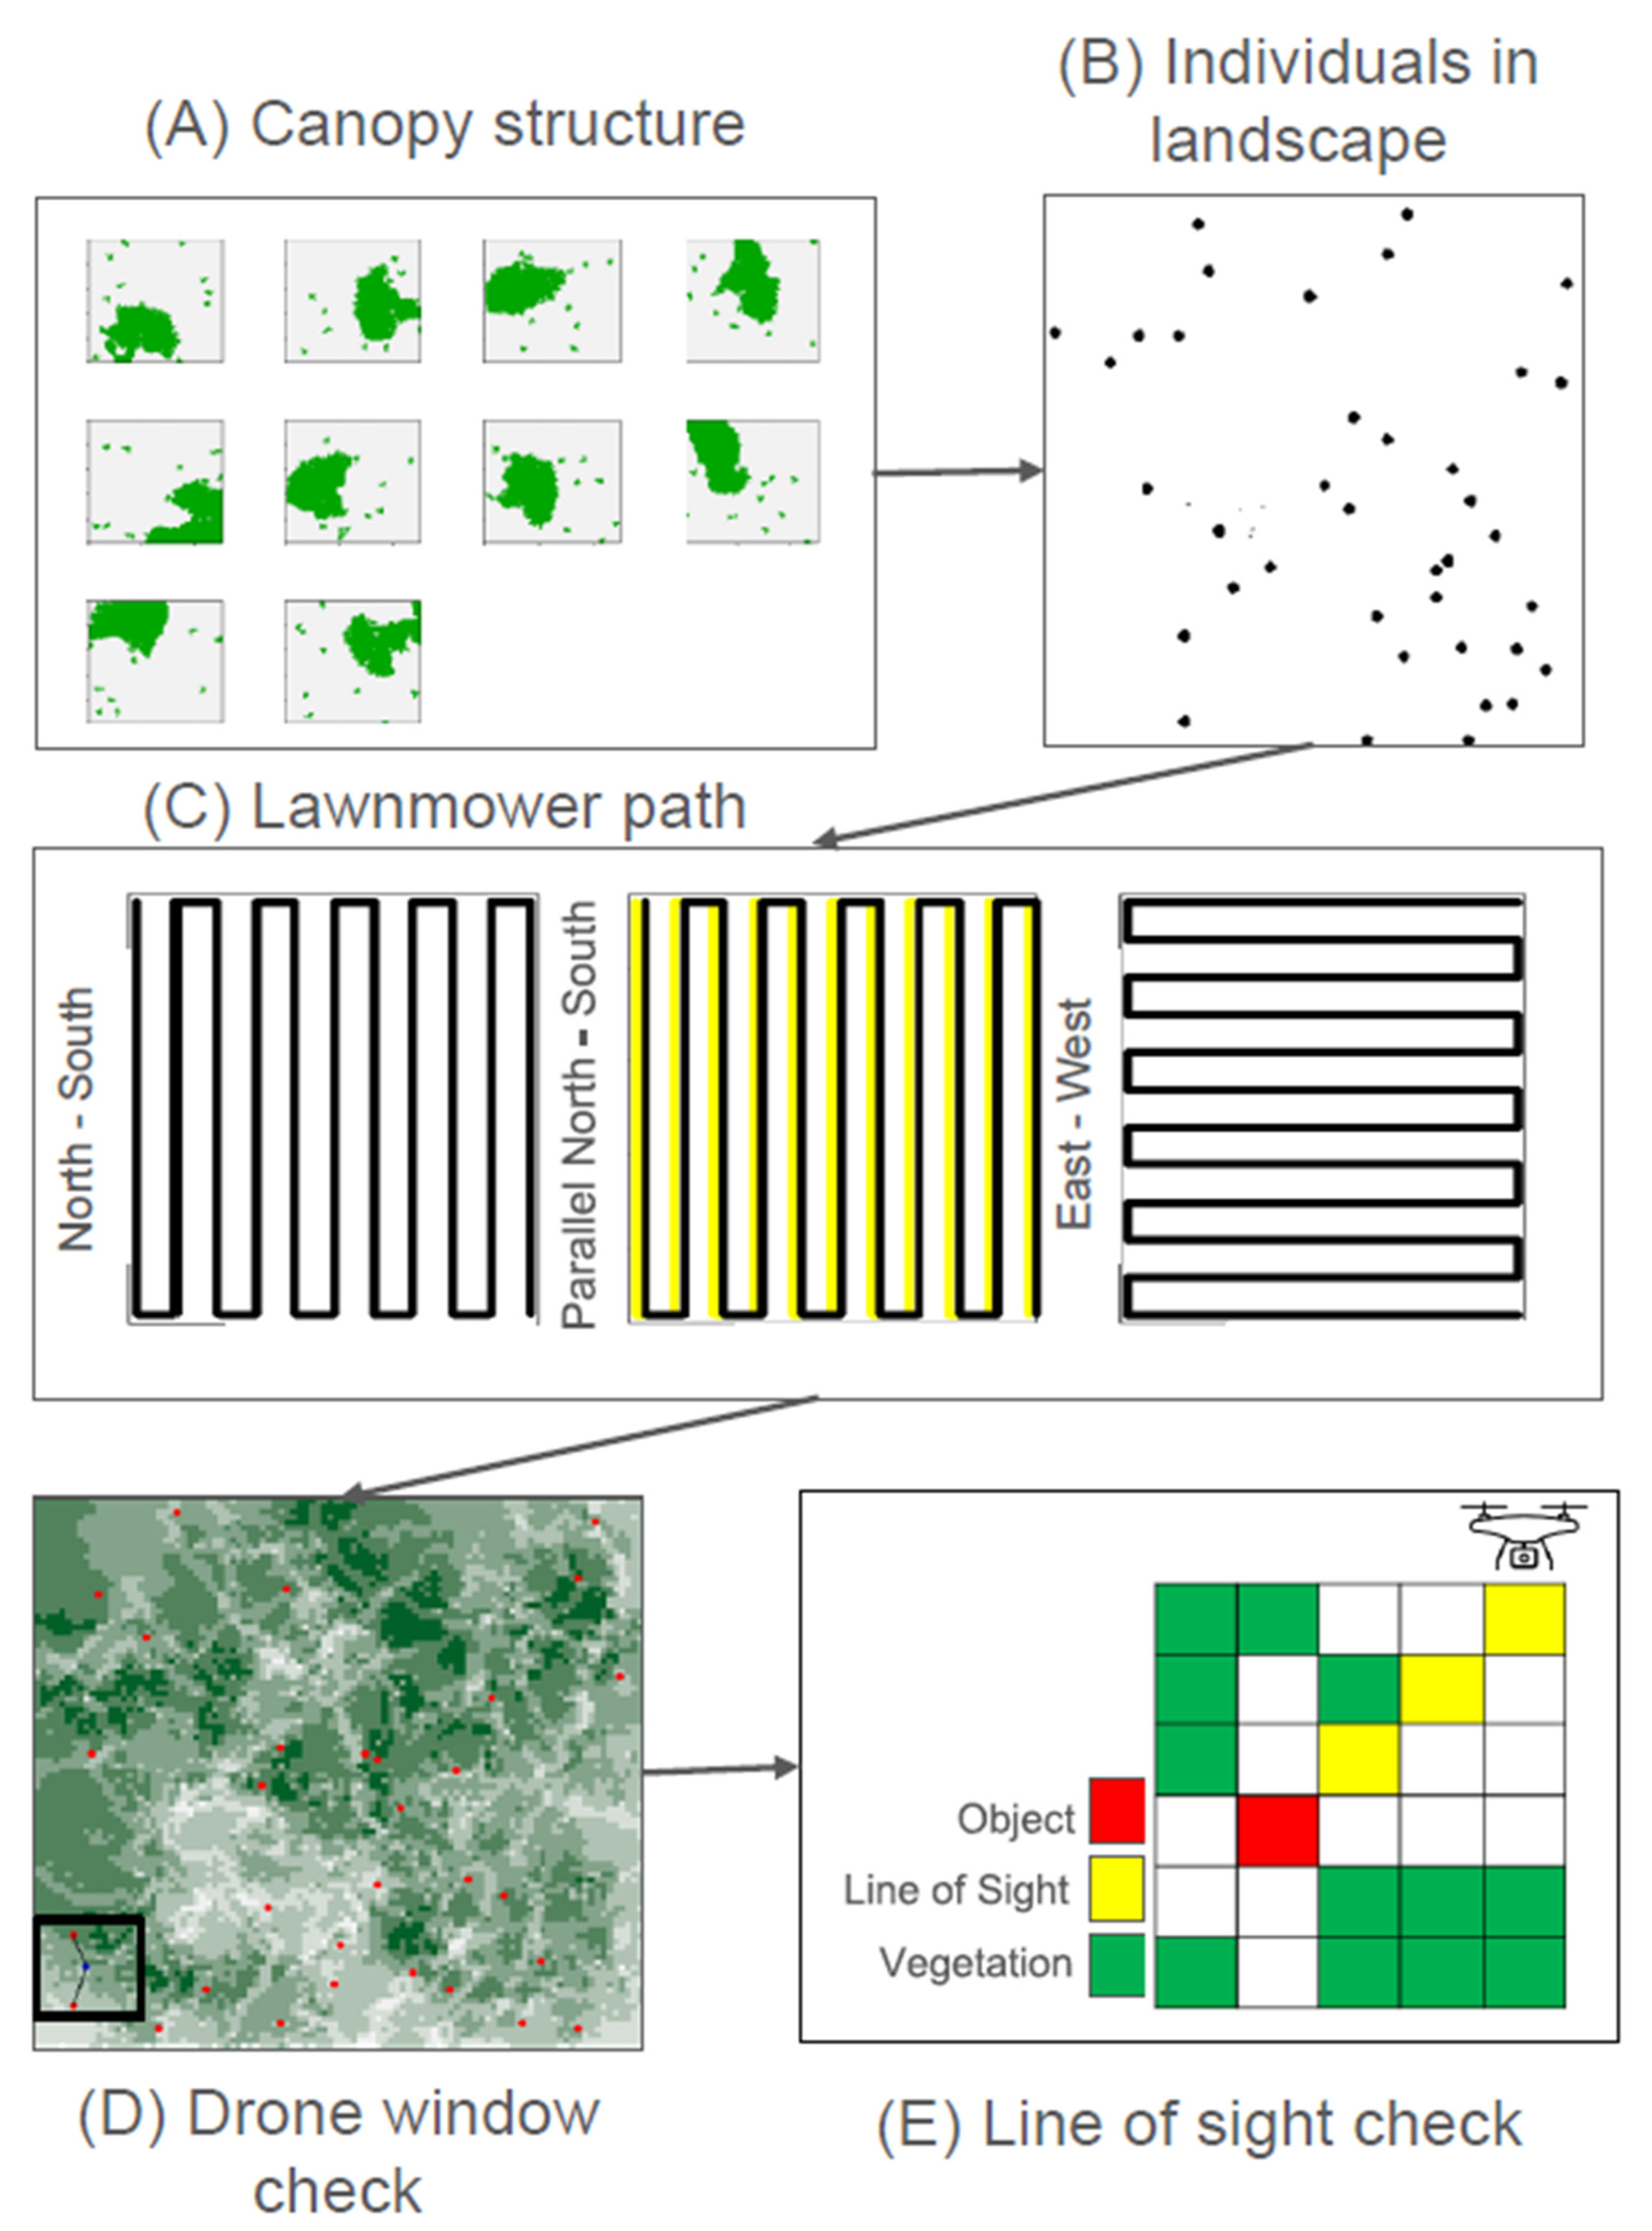
Simulated drone surveys were used to explore a greater variety of conditions compared to the field surveys. Multiple simulated components made up this analysis, including occlusion layers (mimicking vegetation), “target wildlife” point locations (with X, Y, and Z coordinates), and simulated drone flights. The components of the simulated drone surveys can be visualized in Figure 3 and will be subsequently described in further detail.
Figure 3.
Simulated drone detection workflow.
The simulated landscapes were 100 by 100 pixels. To simulate the occluding effects of vegetation on detectability, a simplified 3D canopy structure was represented using stacked 2D spatial layers within the landscape area, conceptually analogous to vertical vegetation voxels. These layers were generated using the R package rflsgen (v1.2.2) [36], which produces randomized landscape patterns based on user-defined spatial parameters, and is particularly good for generating patchy vegetation approximations. Each layer represented a horizontal slice of canopy at a specific height, allowing for the approximation of vertical structural complexity. To control habitat complexity, simulations constrained both the number of vegetation patches (between 10 and 500) and patch size (50 to 1000 pixels), enabling consistent variation across simulated environments. This voxel-based approach provided a scalable and reproducible framework for evaluating how vegetation occlusion affects the availability of individuals from different aerial viewpoints. The number of individuals for each iteration was randomly sampled between 20 and 100. The locations of individuals in the landscape were generated randomly. Individuals were also randomly assigned a z value, which indicated how many layers deep within the vegetation they were located.
Simulated drone transects were generated through the landscape, including a base (N–S), parallel, and rotated path (E–S) to vary viewing angles. The drone FOV was simulated as an 18 by 18-pixel square, with the drone location being the point in the middle of the square. The gap in the lawnmower pattern, representing the spacing between consecutive transects, was designated to be 12 pixels, resulting in a ⅓ overlap between frames. The origin of the drone flight in the base flight was (13,9) to allow the entire drone FOV to remain in the landscape and facilitate the inclusion of an X-axis shifted path (known as the “offset path”), which was shifted by four pixels. The drone “captured” a frame every two steps, in which it was tested whether any individuals within the drone FOV could be observed. The drone changed direction when the FOV reached the edge of the landscape and then moved the length of the gap between the transects, continuing to the next transect. This resulted in a total of 320 frames for each flight path. To get a sense of how this might translate to real-world survey parameters, if a drone’s FOV is 80 m by 80 m at a 60 m AGL flight height, then each pixel would represent ~4.5 m, making the entire survey area approximately 20 hectares. The drone simulation has been designed to accept customizable parameters to produce simulations that mimic different real-world survey designs.
The observation of an individual was evaluated based on a direct line of sight through the 3D vegetation structure between the drone and the individual. Visibility was determined by checking occlusion along a cross-sectional path through the canopy layers (Figure 3E). We assumed that different types of vegetation could have different occlusion profiles, even if they had similar voxel representations based on factors such as leaf area and density. As such, we trialed different occlusion thresholds, which represent the number of voxels that need to have vegetation present in the line of sight of the drone before the individual is occluded. The settings used across the simulations are presented in Table 2.
Table 2.
Settings and rules applied to the detection simulation.
3. Results
3.1. Field Experiments
Different counts of individuals were detected by different flights at sites 3 and 4. Despite having the same individual count at sites 1 and 2, these detections were not the same set of individuals (Table 3). Across all sites, the double-observer survey count was higher than the count of either singular observer. Applying the double-observer detection probability formula showed the lowest detection probability at site 4, which was the site with the tallest and densest canopy. Using the detection probability as a count correction factor resulted in more accurate estimates of abundance for all sites except for site 4, which went from an underestimation of one to an overestimation of one.
Table 3.
Number of individuals detected by site in the field experiment. The true number of individuals per site was 10.
Wilcoxon signed-rank tests revealed no significant differences in frame counts with presences between flight paths at sites 1 (median frame count difference = 3.5, Z = −1.485, and p = 0.138), 2 (median frame count difference = 2, Z = 1.411, and p = 0.158), and 4 (median frame count difference = 2.5, Z = 0.566, and p = 0.572). A significant difference between the flight paths was detected at site 3 (median frame count difference = 3, Z = −2.035, and p = 0.042).
The total number of frames an individual was detected in was negatively affected by vegetation coverage (estimate = −4.679, SE = 1.266, z = 3.578, and p < 0.05), with distance to the edge of the site a non-significant predictor, suggesting that higher percentage coverage of vegetation reduced the availability of individuals.
The averaged negative binomial models for difference in the number of frames and maximum track length in the two flights per individual had no significant predictors and included the null model as one of the most parsimonious models. The model for the difference in frame count was an average between three models, with vegetation cover having a non-significant negative effect on the difference between observers (estimate = −0.101, SE = 0.130, z = 0.754, and p = 0.451) and distance to edge having a non-significant positive effect (estimate = 0.097, SE = 0.134, z = 0.704, and p = 0.482). The model for the difference in maximum track length was an average between three models, with vegetation height having a non-significant positive effect on the difference between observers (estimate = 0.103, SE = 0.138, z = 0.142, and p = 0.468) and vegetation cover having a non-significant negative effect (estimate = −0.125, SE = 0.124, z = 0.971, and p = 0.332)
3.2. Simulated Drone Surveys
Simulation results demonstrated that detectability of individuals varied with drone flight path angle, with both offset and rotated flight paths yielding different detection outcomes. Application of the double-observer protocol (combining detections from both flight paths) improved overall detection rates across nearly all trials (99%, Table 4). The highest detection rate was most commonly achieved through a double-observer design with the double-observer correction, specifically with the rotated flight path for the second observer.
Table 4.
The number of simulations for each observer type where that observer type resulted in the highest detection rate. “N–S”—baseline north–south flight path with single observer, “Parallel N–S”—offset N–S path (relative to N–S baseline) with single observer, “E–W”—east–west, perpendicular to baseline flight path, “N–S and Parallel N–S” and “N–S and E–W”—double-observer design, and “PC N–S and E–W” and “PC N–S and Parallel N–S”—double-observer design with double-observer probability correction (PC).
Mean detection improvements from double-observer surveys (with or without correction) were calculated relative to the lowest-performing single observer (Table 5). Gains were generally greater under higher vegetation cover or density, though the scenario with maximal canopy cover spread over the lower number of layers, with the highest occlusion factor, showed the smallest improvement under double-observer methods, likely due to overall low detectability of individuals resulting in little difference between observers. There were fourteen instances where the double-observer method with the probability correction applied resulted in an overestimation of individuals, though the overestimation was modest, with an average 1.2% and a maximum of 2.6%. Most of the cases (13/14) of overestimation occurred when the double-observer design without the probability correction resulted in detection of all individuals.
Table 5.
Mean percentage increase in detection from the double-observer method across vegetation categories and occlusion factors. Vegetation categories are expressed as percentage cover and number of layers (e.g., 50_10 = 50% cover, 10 layers).
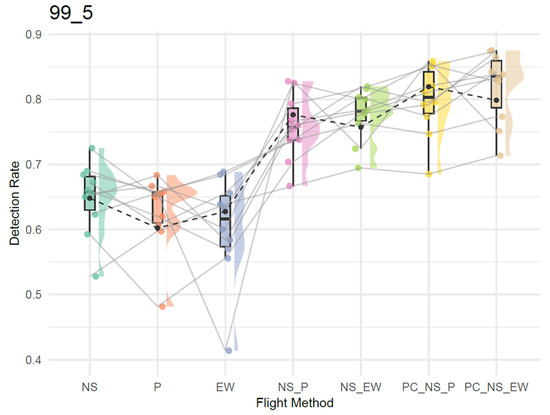
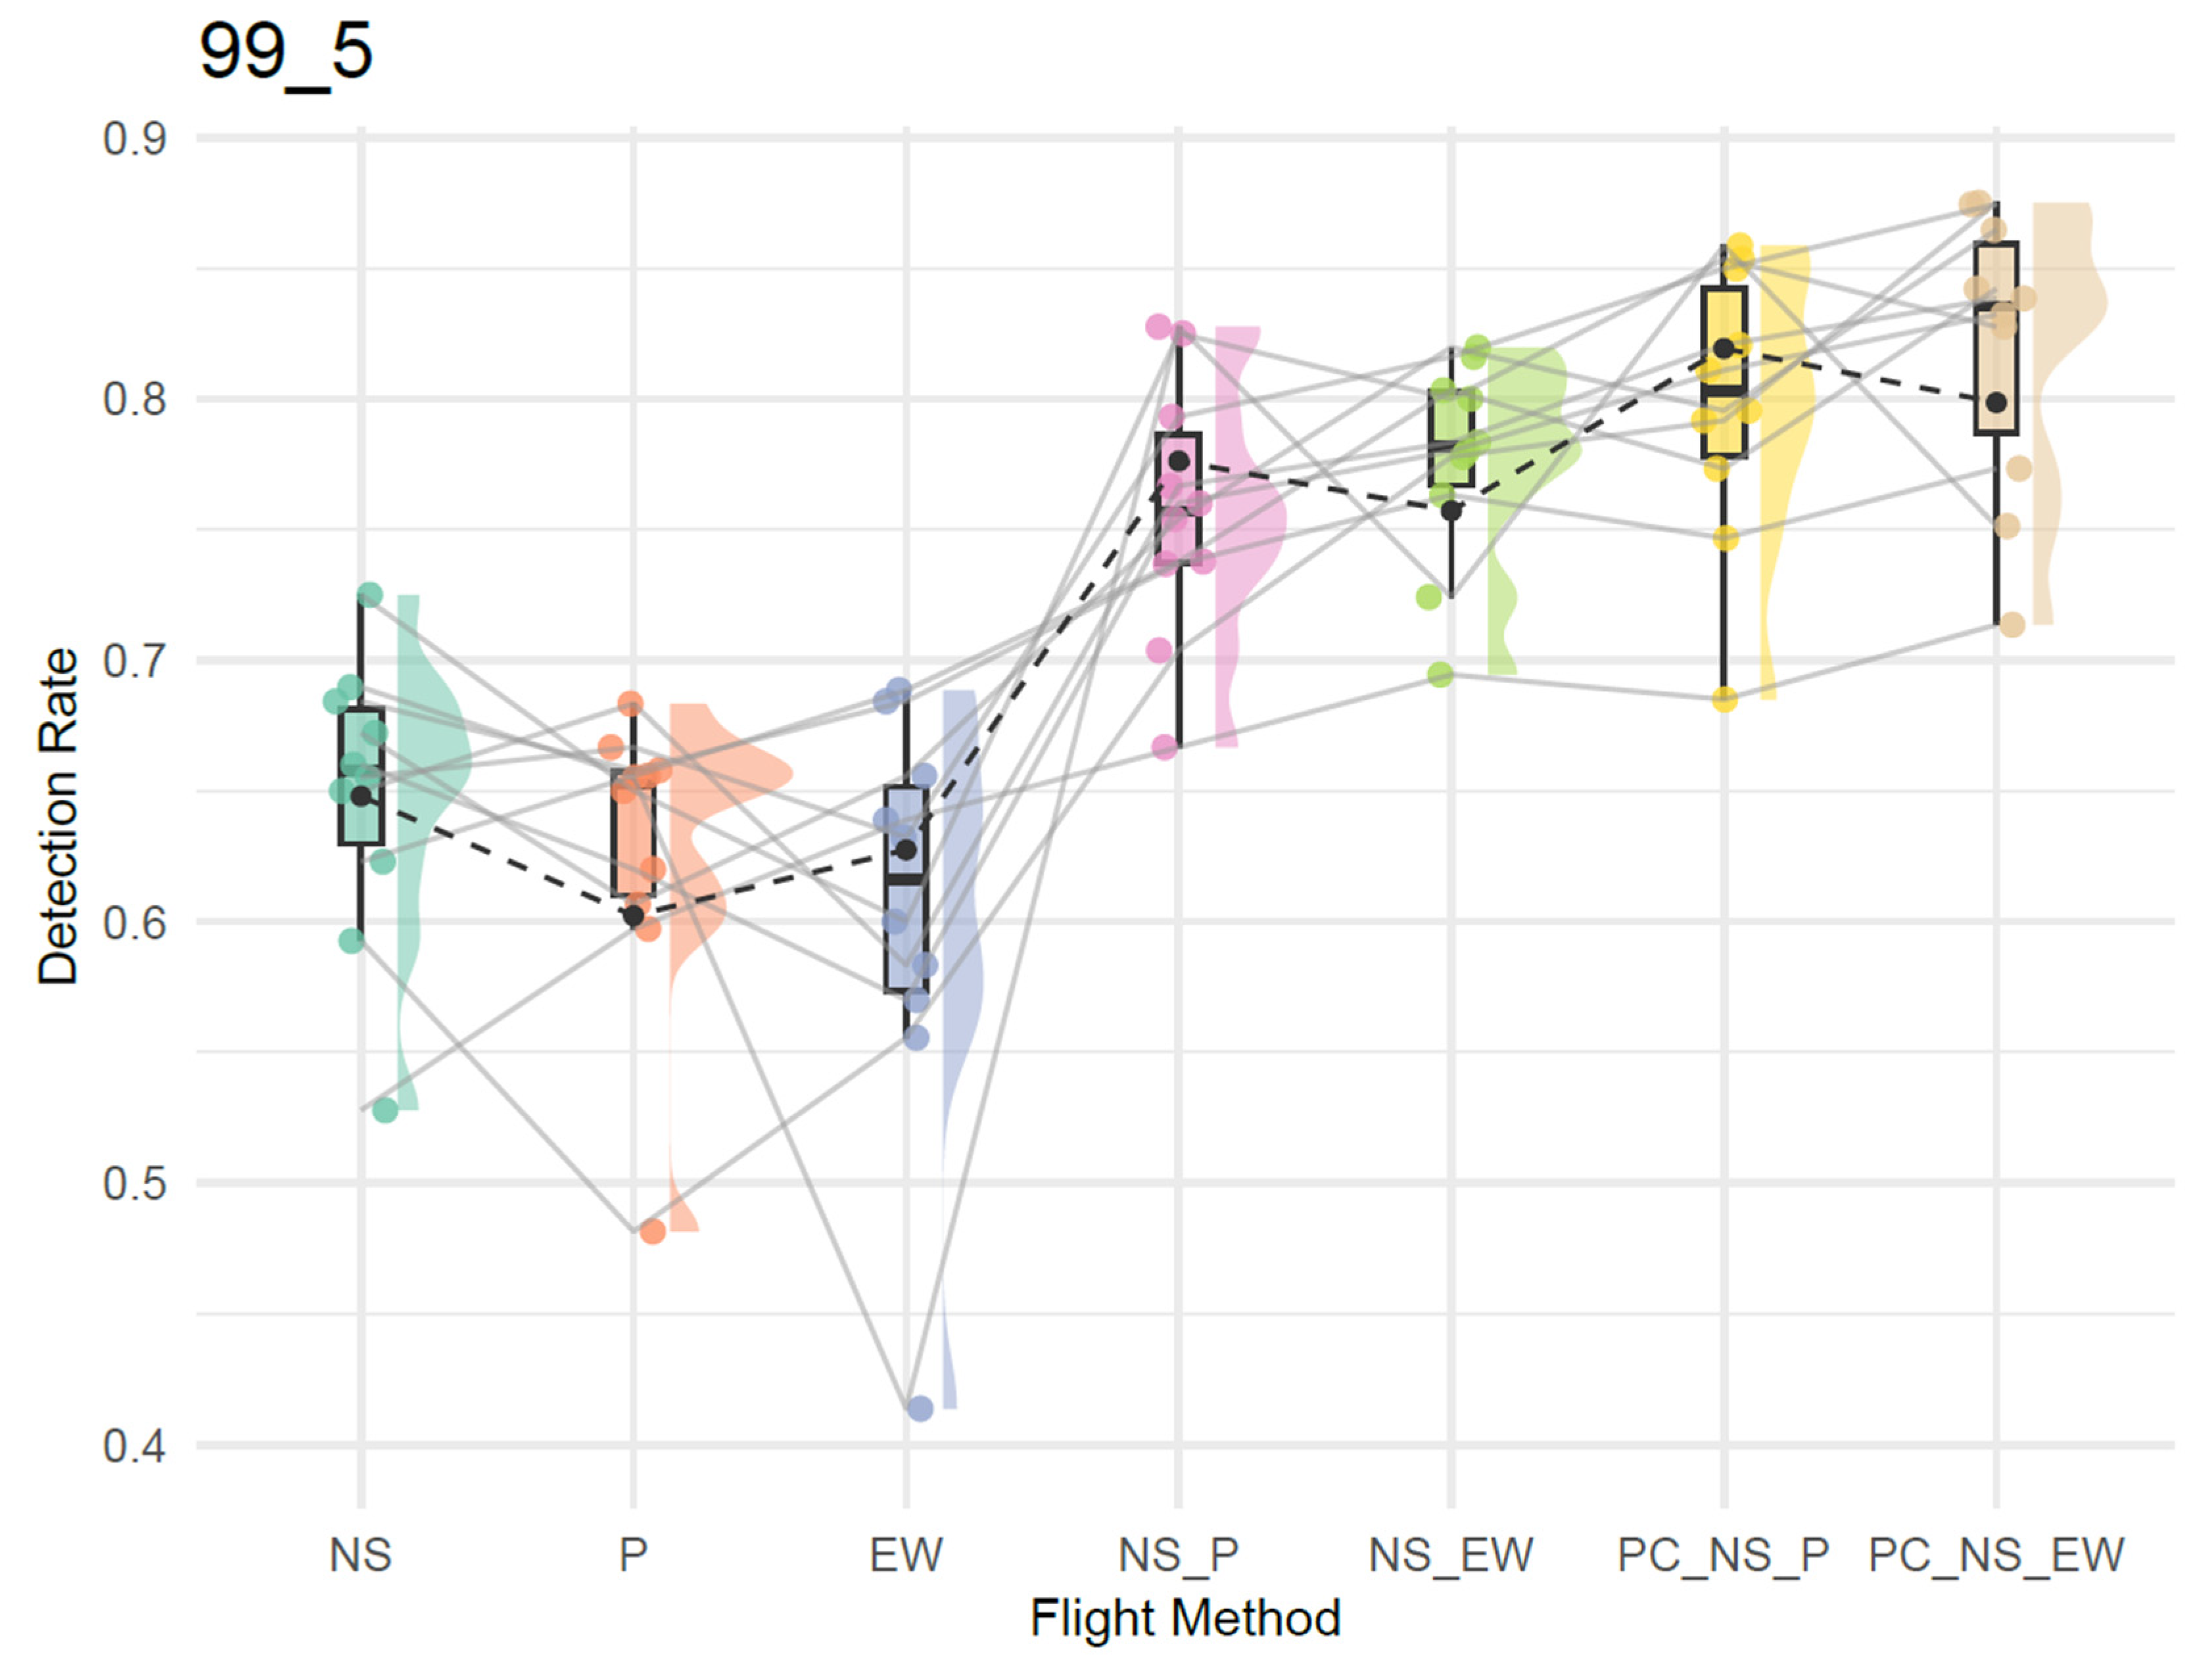
There was variability within each treatment group stemming from the nature of the randomization built into the simulation, with some simulation iterations having configurations of vegetation and individuals less likely to be detected (Figure 4). Following the connections between points in the raincloud plots shows that even in these more “challenging” landscapes for the detection, the double-observer design and the corrected counts generally provided more accurate counts of the number of individuals present. Overall, these findings suggest that incorporating varied flight perspectives can enhance individual availability, particularly in structurally complex habitats.
Figure 4.
Raincloud plot showing site-linked (N = 10) flight detection probabilities across seven experimental methods where the occlusion factor was set at 0.25, vegetation coverage at 99%, and number of canopy layers was set to 5. N–S—baseline north–south flight path with single observer, P—parallel N–S path (relative to N–S baseline) with single observer, E–W—east–west, perpendicular to baseline flight path, N–S_P and N–S_E–W—double-observer design, and PC_N–S_P and PC_N–S_E–W—double-observer design with double-observer probability correction (PC). Each raincloud displays the distribution of detection probability across permutations. Lines connecting points represent repeated measurements from the same site across treatments (flight methods). The plot illustrates variability caused by differences in sites and shows overall distributional differences in detection performance between flight configurations. The black points represent the mean, with the dashed line representing the mean across the flight configurations.
4. Discussion
The study aimed to evaluate whether repeated drone surveys with modified flight paths in a double-observer style design improved detectability of wildlife, particularly in complex environments. The study also tested whether using double-observer detection probability as a count correction could be used as a heuristic to improve accuracy of wildlife counts. The results from both field trials and simulations demonstrate that detection rates are influenced by flight path configuration and vegetation structure, supporting the hypothesis that repeated surveys from differing viewpoints can enhance availability for detection, resulting in more accurate wildlife counts. Using the probability of missed detections to adjust counts resulted in further improvements to accuracy, though it does come with a risk of overestimating abundance. In the field experiment, repeated flights led to a higher cumulative detection count than individual flights. Detection probabilities derived from the double-observer probability correction also yielded more accurate abundance estimates at most sites.
The simulation tool was used to explore how detection probability is affected by a broader range of conditions and utilized various parameters including structural vegetation complexity, flight path, and occlusion thresholds. Across the simulation runs, detection was consistently influenced by the interaction of canopy cover, vertical structure, and occlusion thresholds. In most cases, rotated secondary flights had greater detectability benefits than offset parallel paths, with the corrected double-observer counts with a rotated design as the best-performing model in more than five times as many cases as the same treatment with a parallel second-observer path (Table 4). This is likely due to a larger difference in the perspective offered by approaching an object from a perpendicular angle opposed to a parallel viewpoint. While field results also reflected the influence of environmental complexity, the controlled simulation allowed us to isolate its effect on detection availability, offering insights difficult to obtain through the field experiment alone.
Both approaches highlighted that canopy structure and flight path angle significantly affect individual visibility. While this finding may seem intuitive, to date few studies have assessed these relationships empirically. Hambrecht et al. (2019) demonstrated that canopy density significantly influences detection probability for both thermal and optical (RGB) cameras [23]. Research into different camera tilt angles versus planar to the ground orientations shows that angled cameras can improve visibility between tree branches and other vegetation [25,37]. Alternative drone flight paths achieve a similar outcome by observing the individual from multiple viewpoints. Simulations also reinforced that the benefit of a second observer (or flight) is not uniform—it increases with occlusion complexity. There does seem to be a point, however, where the benefits lessen with increasing complexity. In particular, when the amount of coverage per layer is high (e.g., cases where the cover is ≥90%, spread over five layers of canopy opposed to ten) and the occlusion factor is high, individuals become much more difficult to detect. This is reflected in the more modest gains of the treatment with 99% cover, five vegetation layers, and with an occlusion factor of one. Likewise, in areas with sparse canopy cover, detectability is already relatively high, and therefore gains are minimal.
The findings suggest that implementing a repeated design involving modified flight paths can be valuable in habitats with moderate to high vegetation complexity. In more open environments or extremely densely vegetated areas, the benefit may be minimal, and the additional resource investment may not be justified. Nevertheless, even modest gains in detectability can be meaningful, especially for elusive or threatened species where undercounting can have significant conservation implications. The impact of non-detections on inferences about threatened species is well-documented [38,39,40,41]. Rare species have inherently low detectability as they often occur at low densities, occupy narrow or patchy geographical ranges, and exhibit cryptic behaviors or morphology [42,43]. To minimize uncertainty about species presence, it is thus important to utilize sampling strategies that maximize detectability. Optimizing survey strategies to maximize detectability of rare species leads to more reliable presence–absence data and improved conservation outcomes [44,45,46,47]. Traditional ground-based double-observer protocols have proven effective for increasing detection probability for elusive species [48,49,50]. Our findings indicate that repeated flights provide similar benefits while enhancing efficiency through the use of drone technology. Survey planners should consider structural vegetation metrics when deciding on flight configurations, particularly for studies targeting cryptic or low-density species.
While some alternative drone flight plans have been evaluated [7,51,52], little attention has been paid to drone-based double-observer protocols; to our knowledge, it has only been applied in image review [27,28,53]. A double-observer approach using paired bat echolocation recorders [54] and camera traps [55] has been tested and could potentially be adapted for use with two drones. While current drone rules and regulations may limit the feasibility of this method, it warrants further investigation. This study applied the double-observer estimator in a novel way, where availability is the factor affecting the different detection probabilities of observers. This heuristic resulted in wildlife counts closer to the true counts of individuals present. This did have the effect of overestimating the number of individuals present in some cases, which is important to be aware of if employing this method. These overestimations generally occurred when the double-observer count pre-correction had detected all present individuals (i.e., cases where availability is perfect when using the two observers). Based on the promising results of this trial, there would be value in further exploring the use of double-observer estimators when availability is modified, particularly incorporating the substantial existing research into maximum likelihood frameworks for improving estimates.
We have tested a set of parameters with this tool; however, the simulation framework allows a wide range of environmental and methodological variables to be explored. There is therefore potential for further refinement and application to other scenarios, including different sensor types, species behavior, and various flight parameters such as transect overlap. This study has also raised additional important questions that this tool can assist to address, particularly the cost–benefit trade-offs of improving detectability in landscapes with varying vegetation complexity. We therefore see great value in making the simulation tool publicly available to support methodological planning and cross-study comparisons.
The field experiment served as a proof-of-concept study to validate the feasibility of the proposed double-observer protocol in real-world conditions and was thus limited in scope. Drone flights were conducted in environments with relatively modest vegetation complexity; future work should test these methods in more structurally diverse habitats such as tropical forests and shrublands. The limited number of samples likely affected the ability to model vegetation predictors. Future work could also consider testing different flight parameters and drone platforms. Further validation of the simulation tool with additional empirical datasets is also warranted.
While the simulation framework has been developed to reflect real-world conditions as closely as practicable, two important assumptions should be noted when using the tool. First, it is assumed that individuals are static for the duration of the surveys. Caution should be exercised when applying the tool to mobile species that are likely to move across the landscape during the survey period, as this has important implications for detectability. This may be effective in cases where species are mobile but uniquely identifiable, as individual observation histories could still be ascertained in that case. The benefit of repeated flights from different angles is likely to differ in these cases, which is another topic warranting further investigation. Other simulation studies have shown that flight pattern, animal movement pattern, and animal speed can all affect drone counts [56], highlighting the importance of accounting for wildlife behavior when planning surveys. Future iterations of the simulation tool could integrate movement strategies. Second and relatedly, the assumption of constant detectability may not fully capture the dynamic nature of wildlife behavior. This includes avoidance behaviors exhibited in response to the presence of drones [57].
5. Conclusions
This study provides evidence that repeated drone surveys with modified flight paths can improve wildlife detectability by increasing availability through alternative viewing angles. Count accuracy can be further improved using a count correction based on double-observer detection probability in most cases. While the improvements were moderate, they are likely meaningful in conservation and ecological monitoring contexts where accuracy is critical. Optimizing survey designs to maximize detectability can lead to improved monitoring outcomes and therefore even minor improvements should be sought where feasible under the inevitable resource constraints. Our simulation framework offers a valuable resource for advancing drone-based survey methodology and improving survey design in complex environments. To this end, we are making the code for the simulation available for others to use and encourage the uptake of such planning.
Supplementary Materials
The following supporting information can be downloaded at https://www.mdpi.com/article/10.3390/rs18020327/s1, File S1: AIC tables for models.
Author Contributions
Conceptualization, C.C. and G.H.; Methodology, C.C., P.W. and G.H.; Formal analysis, C.C., P.W. and D.B.; Investigation, C.C., P.W. and D.B.; Resources, D.B. and G.H.; Writing—original draft, C.C. and P.W.; Writing—review & editing, C.C., P.W., D.B. and G.H.; Visualization, C.C.; Supervision, G.H.; Project administration, G.H. All authors have read and agreed to the published version of the manuscript.
Funding
The authors declare that no funds, grants, or other support were received during the preparation of this manuscript.
Data Availability Statement
The data and code for performing the simulation have been deposited in a Zenodo repository.
Acknowledgments
Thanks to the QUT Research Engineering Facility and Samford Ecological Research Facility for the provision of expertise and research infrastructure in enablement of this project.
Conflicts of Interest
The authors have no relevant financial or non-financial interests to disclose.
References
- Hodgson, J.C.; Mott, R.; Baylis, S.M.; Pham, T.T.; Wotherspoon, S.; Kilpatrick, A.D.; Raja Segaran, R.; Reid, I.; Terauds, A.; Koh, L.P. Drones Count Wildlife More Accurately and Precisely than Humans. Methods Ecol. Evol. 2018, 9, 1160–1167. [Google Scholar] [CrossRef] [Scilit]
- Schad, L.; Fischer, J. Opportunities and Risks in the Use of Drones for Studying Animal Behaviour. Methods Ecol. Evol. 2023, 14, 1864–1872. [Google Scholar] [CrossRef] [Scilit]
- Chrétien, L.-P.; Théau, J.; Ménard, P. Wildlife Multispecies Sensing Using Visible and Infrared Imagery Acquired from an Unmanned Aerial Vehicle (UAV). Int. Arch. Photogramm. Remote Sens. Spat. Inf. Sci. 2015, 40, 241–248. [Google Scholar] [CrossRef] [Scilit]
- Corcoran, E.; Winsen, M.; Sudholz, A.; Hamilton, G. Automated Detection of Wildlife Using Drones: Synthesis, Opportunities and Constraints. Methods Ecol. Evol. 2021, 12, 1103–1114. [Google Scholar] [CrossRef] [Scilit]
- Seymour, A.C.; Dale, J.; Hammill, M.; Halpin, P.N.; Johnston, D.W. Automated Detection and Enumeration of Marine Wildlife Using Unmanned Aircraft Systems (UAS) and Thermal Imagery. Sci. Rep. 2017, 7, 45127. [Google Scholar] [CrossRef] [Scilit]
- Chabot, D.; Bird, D.M. Wildlife Research and Management Methods in the 21st Century: Where Do Unmanned Aircraft Fit in? J. Unmanned Veh. Sys. 2015, 3, 137–155. [Google Scholar] [CrossRef] [Scilit]
- Linchant, J.; Lisein, J.; Semeki, J.; Lejeune, P.; Vermeulen, C. Are Unmanned Aircraft Systems (UASs) the Future of Wildlife Monitoring? A Review of Accomplishments and Challenges. Mammal. Rev. 2015, 45, 239–252. [Google Scholar] [CrossRef] [Scilit]
- Kays, R.; Sheppard, J.; Mclean, K.; Welch, C.; Paunescu, C.; Wang, V.; Kravit, G.; Crofoot, M. Hot Monkey, Cold Reality: Surveying Rainforest Canopy Mammals Using Drone-Mounted Thermal Infrared Sensors. Int. J. Remote Sens. 2019, 40, 407–419. [Google Scholar] [CrossRef] [Scilit]
- Barr, J.R.; Green, M.C.; DeMaso, S.J.; Hardy, T.B. Detectability and Visibility Biases Associated with Using a Consumer-Grade Unmanned Aircraft to Survey Nesting Colonial Waterbirds. J. Field Ornithol. 2018, 89, 242–257. [Google Scholar] [CrossRef] [Scilit]
- Schlossberg, S.; Chase, M.J.; Griffin, C.R. Using Species Traits to Predict Detectability of Animals on Aerial Surveys. Ecol. Appl. 2018, 28, 106–118. [Google Scholar] [CrossRef] [Scilit]
- Brack, I.V.; Kindel, A.; Oliveira, L.F.B. Detection Errors in Wildlife Abundance Estimates from Unmanned Aerial Systems (UAS) Surveys: Synthesis, Solutions, and Challenges. Methods Ecol. Evol. 2018, 9, 1864–1873. [Google Scholar] [CrossRef] [Scilit]
- Christin, S.; Hervet, É.; Lecomte, N. Applications for Deep Learning in Ecology. Methods Ecol. Evol. 2019, 10, 1632–1644. [Google Scholar] [CrossRef] [Scilit]
- Dujon, A.M.; Schofield, G. Importance of Machine Learning for Enhancing Ecological Studies Using Information-Rich Imagery. Endanger. Species Res. 2019, 39, 91–104. [Google Scholar] [CrossRef] [Scilit]
- Kéry, M.; Schmidt, B.R. Imperfect Detection and Its Consequences for Monitoring for Conservation. Community Ecol. 2008, 9, 207–216. [Google Scholar] [CrossRef] [Scilit]
- Dénes, F.V.; Silveira, L.F.; Beissinger, S.R. Estimating Abundance of Unmarked Animal Populations: Accounting for Imperfect Detection and Other Sources of Zero Inflation. Methods Ecol. Evol. 2015, 6, 543–556. [Google Scholar] [CrossRef] [Scilit]
- Davis, K.L.; Silverman, E.D.; Sussman, A.L.; Wilson, R.R.; Zipkin, E.F. Errors in Aerial Survey Count Data: Identifying Pitfalls and Solutions. Ecol. Evol. 2022, 12, e8733. [Google Scholar] [CrossRef] [Scilit]
- Schmidt, B.R.; Cruickshank, S.S.; Bühler, C.; Bergamini, A. Observers Are a Key Source of Detection Heterogeneity and Biased Occupancy Estimates in Species Monitoring. Biol. Conserv. 2023, 283, 110102. [Google Scholar] [CrossRef] [Scilit]
- Kellenberger, B.; Marcos, D.; Tuia, D. Detecting Mammals in UAV Images: Best Practices to Address a Substantially Imbalanced Dataset with Deep Learning. Remote Sens. Environ. 2018, 216, 139–153. [Google Scholar] [CrossRef] [Scilit]
- Sudholz, A.; Denman, S.; Pople, A.; Brennan, M.; Amos, M.; Hamilton, G. A Comparison of Manual and Automated Detection of Rusa Deer (Rusa timorensis) from RPAS-Derived Thermal Imagery. Wildl. Res. 2021, 49, 46–53. [Google Scholar] [CrossRef] [Scilit]
- Lahoz-Monfort, J.J.; Magrath, M.J.L. A Comprehensive Overview of Technologies for Species and Habitat Monitoring and Conservation. BioScience 2021, 71, 1038–1062. [Google Scholar] [CrossRef] [Scilit]
- Tuia, D.; Kellenberger, B.; Beery, S.; Costelloe, B.R.; Zuffi, S.; Risse, B.; Mathis, A.; Mathis, M.W.; van Langevelde, F.; Burghardt, T.; et al. Perspectives in Machine Learning for Wildlife Conservation. Nat. Commun. 2022, 13, 792. [Google Scholar] [CrossRef] [Scilit] [PubMed]
- Gooday, O.J.; Key, N.; Goldstien, S.; Zawar-Reza, P. An Assessment of Thermal-Image Acquisition with an Unmanned Aerial Vehicle (UAV) for Direct Counts of Coastal Marine Mammals Ashore. J. Unmanned Veh. Sys. 2018, 6, 100–108. [Google Scholar] [CrossRef] [Scilit]
- Hambrecht, L.; Brown, R.P.; Piel, A.K.; Wich, S.A. Detecting ‘Poachers’ with Drones: Factors Influencing the Probability of Detection with TIR and RGB Imaging in Miombo Woodlands, Tanzania. Biol. Conserv. 2019, 233, 109–117. [Google Scholar] [CrossRef] [Scilit]
- Hvala, A.; Rogers, R.M.; Alazab, M.; Campbell, H.A. Supplementing Aerial Drone Surveys with Biotelemetry Data Validates Wildlife Detection Probabilities. Front. Conserv. Sci. 2023, 4, 1203736. [Google Scholar] [CrossRef] [Scilit]
- Burke, C.; Rashman, M.; Wich, S.; Symons, A.; Theron, C.; Longmore, S. Optimizing Observing Strategies for Monitoring Animals Using Drone-Mounted Thermal Infrared Cameras. Int. J. Remote Sens. 2019, 40, 439–467. [Google Scholar] [CrossRef] [Scilit]
- Nichols, J.D.; Hines, J.E.; Sauer, J.R.; Fallon, F.W.; Fallon, J.E.; Heglund, P.J. A Double-Observer Approach for Estimating Detection Probability and Abundance from Point Counts. Auk 2000, 117, 393–408. [Google Scholar] [CrossRef]
- Brack, I.V.; Kindel, A.; de Oliveira, L.F.B.; Lahoz-Monfort, J.J. Optimally Designing Drone-Based Surveys for Wildlife Abundance Estimation with N-Mixture Models. Methods Ecol. Evol. 2023, 14, 898–910. [Google Scholar] [CrossRef] [Scilit]
- Pfeffer, D.G.; Foster, J.A.; Kinsey, J.C. Using Unmanned Aerial Vehicles Equipped with Thermal Cameras to Survey a Known Population of White-Tailed Deer. J. Fish. Wildl. Manag. 2024, 15, 283–288. [Google Scholar] [CrossRef] [Scilit]
- Stein, R.M.; Lecigne, B.; Eitel, J.U.H.; Johnson, T.R.; McGowan, C.; Rachlow, J.L. Vegetation and Vantage Point Influence Visibility across Diverse Ecosystems: Implications for Animal Ecology. Front. Ecol. Evol. 2022, 10, 911051. [Google Scholar] [CrossRef] [Scilit]
- Corcoran, E.; Denman, S.; Hanger, J.; Wilson, B.; Hamilton, G. Automated Detection of Koalas Using Low-Level Aerial Surveillance and Machine Learning. Sci. Rep. 2019, 9, 3208. [Google Scholar] [CrossRef] [Scilit]
- Jenkins, M.; Franklin, K.A.; Nicoll, M.A.C.; Cole, N.C.; Ruhomaun, K.; Tatayah, V.; Mackiewicz, M. Improving Object Detection for Time-Lapse Imagery Using Temporal Features in Wildlife Monitoring. Sensors 2024, 24, 8002. [Google Scholar] [CrossRef] [Scilit]
- Fletcher, R.J., Jr.; Hutto, R.L. Estimating Detection Probablities of River Birds Using Double Surveys. Auk 2006, 123, 695–707. [Google Scholar] [CrossRef]
- Venables, W.N.; Ripley, B.D. Modern Applied Statistics with S. In Statistics and Computing; Springer: New York, NY, USA, 2002; ISBN 978-1-4419-3008-8. [Google Scholar]
- R Core Team. R: A Language and Environment for Statistical Computing; R Foundation for Statistical Computing: Vienna, Austria, 2024. [Google Scholar]
- Bartoń, K. MuMIn: Multi-Model Inference, version 1.48.11. 2025. Available online: https://cran.r-project.org/web/packages/MuMIn/index.html (accessed on 12 November 2025).
- Justeau-Allaire, D.; Blanchard, G.; Ibanez, T.; Lorca, X.; Vieilledent, G.; Birnbaum, P. Fragmented Landscape Generator (Flsgen): A Neutral Landscape Generator with Control of Landscape Structure and Fragmentation Indices. Methods Ecol. Evol. 2022, 13, 1412–1420. [Google Scholar] [CrossRef] [Scilit]
- Reinegger, R.D.; Bissessur, P.; Meereechpersad, I.; Bhanda, G.; Gazagne, E.; Jones, G. Improving Primate Detection Using Thermal Infrared Imaging: Availability and Observer Errors in Drone Surveys of Mixed Tropical Forests. Int. J. Remote Sens. 2025, 46, 4345–4373. [Google Scholar] [CrossRef] [Scilit]
- Bennett, J.R.; Edwards, B.P.; Bergman, J.N.; Binley, A.D.; Buxton, R.T.; Hanna, D.E.; Hanson, J.O.; Hudgins, E.J.; Karimi, S.; Raymond, C.V.; et al. How Ignoring Detection Probability Hurts Biodiversity Conservation. Front. Ecol. Environ. 2024, 22, e2782. [Google Scholar] [CrossRef] [Scilit]
- Gu, W.; Swihart, R.K. Absent or Undetected? Effects of Non-Detection of Species Occurrence on Wildlife–Habitat Models. Biol. Conserv. 2004, 116, 195–203. [Google Scholar] [CrossRef] [Scilit]
- Reid, N.; Lundy, M.G.; Hayden, B.; Lynn, D.; Marnell, F.; McDonald, R.A.; Montgomery, W.I. Detecting Detectability: Identifying and Correcting Bias in Binary Wildlife Surveys Demonstrates Their Potential Impact on Conservation Assessments. Eur. J. Wildl. Res. 2013, 59, 869–879. [Google Scholar] [CrossRef] [Scilit]
- Tyre, A.J.; Tenhumberg, B.; Field, S.A.; Niejalke, D.; Parris, K.; Possingham, H.P. Improving Precision and Reducing Bias in Biological Surveys: Estimating False-Negative Error Rates. Ecol. Appl. 2003, 13, 1790–1801. [Google Scholar] [CrossRef] [Scilit]
- Jeliazkov, A.; Gavish, Y.; Marsh, C.J.; Geschke, J.; Brummitt, N.; Rocchini, D.; Haase, P.; Kunin, W.E.; Henle, K. Sampling and Modelling Rare Species: Conceptual Guidelines for the Neglected Majority. Glob. Change Biol. 2022, 28, 3754–3777. [Google Scholar] [CrossRef] [Scilit]
- McCarthy, M.A.; Moore, J.L.; Morris, W.K.; Parris, K.M.; Garrard, G.E.; Vesk, P.A.; Rumpff, L.; Giljohann, K.M.; Camac, J.S.; Bau, S.S.; et al. The Influence of Abundance on Detectability. Oikos 2013, 122, 717–726. [Google Scholar] [CrossRef] [Scilit]
- Barata, I.M.; Griffiths, R.A.; Ridout, M.S. The Power of Monitoring: Optimizing Survey Designs to Detect Occupancy Changes in a Rare Amphibian Population. Sci. Rep. 2017, 7, 16491. [Google Scholar] [CrossRef] [Scilit]
- Burns, P.A.; McCall, C.; Rowe, K.C.; Parrott, M.L.; Phillips, B.L. Accounting for Detectability and Abundance in Survey Design for a Declining Species. Divers. Distrib. 2019, 25, 1655–1665. [Google Scholar] [CrossRef] [Scilit]
- Field, S.A.; Tyre, A.J.; Thorn, K.H.; O’Connor, P.J.; Possingham, H.P. Improving the Efficiency of Wildlife Monitoring by Estimating Detectability: A Case Study of Foxes (Vulpes vulpes) on the Eyre Peninsula, South Australia. Wildl. Res. 2005, 32, 253–258. [Google Scholar] [CrossRef] [Scilit]
- McMahon, M.C.; Ditmer, M.A.; Isaac, E.J.; Moore, S.A.; Forester, J.D. Evaluating Unmanned Aerial Systems for the Detection and Monitoring of Moose in Northeastern Minnesota. Wildl. Soc. Bull. 2021, 45, 312–324. [Google Scholar] [CrossRef] [Scilit]
- Cripps, J.K.; Nelson, J.L.; Scroggie, M.P.; Durkin, L.K.; Ramsey, D.S.L.; Lumsden, L.F. Double-Observer Distance Sampling Improves the Accuracy of Density Estimates for a Threatened Arboreal Mammal. Wildl. Res. 2021, 48, 756–768. [Google Scholar] [CrossRef] [Scilit]
- Henry, E.H.; Anderson, C.T. Abundance Estimates to Inform Butterfly Management: Double-Observer versus Distance Sampling. J. Insect Conserv. 2016, 20, 505–514. [Google Scholar] [CrossRef] [Scilit]
- Romano, A.; Roner, L.; Costa, A.; Salvidio, S.; Trenti, M.; Pedrini, P. When No Color Pattern Is Available: Application of Double Observer Methods to Estimate Population Size of the Alpine Salamander. Arct. Antarct. Alp. Res. 2021, 53, 300–308. [Google Scholar] [CrossRef] [Scilit]
- Baxter, P.W.J.; Hamilton, G. Learning to Fly: Integrating Spatial Ecology with Unmanned Aerial Vehicle Surveys. Ecosphere 2018, 9, e02194. [Google Scholar] [CrossRef] [Scilit]
- Witczuk, J.; Pagacz, S. Evaluating Alternative Flight Plans in Thermal Drone Wildlife Surveys—Simulation Study. Remote Sens. 2021, 13, 1102. [Google Scholar] [CrossRef] [Scilit]
- Brack, I.V.; Kindel, A.; Berto, D.O.; Cordeiro, J.L.P.; Coelho, I.P.; Lahoz-Monfort, J.J.; de Oliveira, L.F.B. Spatial Variation on the Abundance of a Threatened South American Large Herbivore Using Spatiotemporally Replicated Drone Surveys. Biodivers. Conserv. 2023, 32, 1291–1308. [Google Scholar] [CrossRef] [Scilit]
- Duchamp, J.E.; Yates, M.; Muzika, R.-M.; Swihart, R.K. Estimating Probabilities of Detection for Bat Echolocation Calls: An Application of the Double-Observer Method. Wildl. Soc. Bull. 2006, 34, 408–412. [Google Scholar] [CrossRef] [Scilit]
- Nakashima, Y.; Hongo, S.; Mizuno, K.; Yajima, G.; Dzefck, Z.C.B. Double-Observer Approach with Camera Traps Can Correct Imperfect Detection and Improve the Accuracy of Density Estimation of Unmarked Animal Populations. Sci. Rep. 2022, 12, 2011. [Google Scholar] [CrossRef] [Scilit]
- Schultz, E.A.; Ellison-Neary, N.; Boudreau, M.R.; Street, G.M.; Jones, L.R.; Evans, K.O.; Iglay, R.B. On the Move: Influence of Animal Movements on Count Error during Drone Surveys. Ecol. Evol. 2024, 14, e70287. [Google Scholar] [CrossRef] [Scilit]
- Christie, K.S.; Gilbert, S.L.; Brown, C.L.; Hatfield, M.; Hanson, L. Unmanned Aircraft Systems in Wildlife Research: Current and Future Applications of a Transformative Technology. Front. Ecol. Environ. 2016, 14, 241–251. [Google Scholar] [CrossRef] [Scilit]

Disclaimer/Publisher’s Note: The statements, opinions and data contained in all publications are solely those of the individual author(s) and contributor(s) and not of MDPI and/or the editor(s). MDPI and/or the editor(s) disclaim responsibility for any injury to people or property resulting from any ideas, methods, instructions or products referred to in the content. |
© 2026 by the authors. Licensee MDPI, Basel, Switzerland. This article is an open access article distributed under the terms and conditions of the Creative Commons Attribution (CC BY) license.