


Highlights
What are the main findings?
- WSSO-DETR combines oriented object reference point generation, a point set-based oriented object decoder, and scaled self-supervision for weakly supervised slender object detection.
- WSSO-DETR achieves competitive or superior performance relative to the evaluated weakly supervised oriented object detectors and outperforms some rotated box-based supervised methods on Fishing Detect, DOTA-v1.0, and Slender COCO.
What are the implications of the main findings?
- WSSO-DETR can be trained using only horizontal-box annotations to predict the oriented bounding boxes of fishing rods, thereby reducing the reliance on costly rotated box annotations and lowering annotation costs.
- WSSO-DETR is not only applicable to fishing rod detection tasks involving UAV imagery, but also demonstrates a certain degree of generalizability for detecting slender objects in remote sensing and natural images.
Abstract
The timely detection of fishing activities supports the protection of water resources and aids law enforcement in fishing ban and shoreline inspection scenarios. Fishing rods are highly discriminative objects for identifying such activities; however, their slender shapes and varying orientations make feature extraction and precise localization difficult to achieve. The existing slender object detectors typically require oriented bounding-box supervision, resulting in high annotation costs and unstable angle regression. To address these issues, we propose a weakly supervised slender object detection network (WSSO-DETR) with a low annotation cost. It employs horizontal-box supervision and exploits angle relation consistency and scale invariance across multiview transformations, reducing the need for oriented box annotations. The scale and orientation estimated by the horizontal box branch are used to construct a long-axis prior, based on which an oriented object reference point generation module (OORPG) is designed. We further introduce a point set-based oriented decoder (PSOD) and an encoder–decoder feature fusion-based prediction head (E-DFFPH) to model the interactions among object-related point sets and attain improved localization performance. Experiments show that WSSO-DETR improves the mAP50 metric by 2.5–15.3% on Slender COCO, by 1.1–4.8% on Fishing Detect, and by 1.7–4.9% on DOTA-v1.0, demonstrating its effectiveness and generalizability.
1. Introduction
Unmanned aerial vehicle (UAV) remote sensing imagery has been widely used in river and lake inspection, water area supervision, and ecological monitoring scenarios because of its flexible acquisition process, high spatial resolution, and wide coverage. In fishing ban enforcement and shoreline inspection cases, the timely detection of fishing activities is important for aquatic resource protection and law enforcement operations. As some of the most discriminative fishing behavior-related targets, fishing rods provide an important basis for the subsequent behavior identification process through their accurate recognition and localization [1]. However, in UAV imagery, fishing rods usually appear as slender objects with small scales, large aspect ratios, significant orientation variations, and strong background interference, making their detection more challenging than that of regular objects.
Most existing object detection models localize objects using horizontal bounding boxes [2,3,4,5,6,7], which are less suitable for arbitrarily oriented slender objects. Several studies [8,9,10] have enhanced object representation in complex remote sensing scenes by effectively integrating spatial structural information, spectral characteristics, and local contextual cues. However, hyperspectral information generally relies on specialized sensors for acquisition, which entails relatively high data-collection and processing costs. For slender objects such as fishing rods, spatial geometric structure and orientation information are likewise critical for accurately characterizing their appearance and improving detection performance. Oriented object detection predicts both object location and orientation, allowing bounding boxes to fit object contours more tightly and reduce background interference. Existing oriented object detection methods can be broadly divided into rotated-box-based [11,12,13,14,15,16,17], point-set-based [18,19], and point-axis-based methods [20]. However, rotated-box methods suffer from angle discontinuity, point-set methods do not explicitly model principal orientation, and point-axis methods remain sensitive to the initialization and number of reference points.
For slender objects, detection difficulties arise not only from their small scales but also from their high aspect ratios, large orientation variations, and limited effective textures. The existing studies on slender object detection remain limited and focus mainly on natural images. Wan et al. [21] classified oriented objects by their aspect ratios into regular objects (less than 3:1), slender objects (between 3:1 and 5:1), and extra-slender objects (greater than 5:1) and proposed a feature adaptation strategy to improve the slender object detection process. Wen et al. [22] proposed DFAM-DETR to address the limited receptive fields of conventional convolutions. The network adaptively adjusts its feature sampling positions according to the morphology of the object and was validated on slender object categories in MS-COCO 2017. However, because it does not exploit explicit positional priors, its initial sampling points remain evenly distributed and rely on a subsequent offset learning procedure, leading to relatively slow convergence. Moreover, the aforementioned studies mainly used horizontal bounding boxes to localize slender objects, resulting in a limited ability to represent object shapes. With respect to oriented slender object detection, Zhong and Yang [23] introduced an aspect ratio-based priority factor by jointly considering the aspect ratios and angles of objects to reduce the effect of the substantial difference between the decay rates of the long and short sides during slender bounding-box regression. Xie et al. [24] incorporated deformable convolutions into a YOLO-series model to adapt feature extraction regions to object shapes and integrated an aspect ratio-based parameter into the oriented object regression loss to increase the sensitivity of the model to object slenderness. Zhang et al. [25] proposed a slenderness attention module (SAM) by combining spatial and channel attention mechanisms for detecting metal interconnects in integrated circuits and used a multistage feature refinement strategy to alleviate the misalignment of high-aspect-ratio bounding boxes. Although these methods improve the slender object detection process through feature extraction, attention modeling, and bounding-box regression, they still rely on rotated bounding boxes and are affected by angle regression instability.
Most oriented object detection methods require accurate rotated bounding-box annotations, whose labeling costs are much higher than those of horizontal boxes because the boundaries, side lengths, and orientations of the target objects must be determined. In UAV-based inspection scenarios with large image volumes, small objects, and complex backgrounds, constructing large-scale rotated annotations is a costly process. To reduce annotation cost, weakly supervised oriented object detection methods use incomplete annotations to automatically learn oriented localizations. The existing methods mainly adopt point labels or horizontal bounding boxes. Point-supervised methods [26,27,28,29,30,31] have low annotation costs but limited accuracy because of their weak supervision. Horizontal box-based methods use horizontal bounding boxes instead of accurate rotated bounding boxes for supervision purposes, establish multiview inputs through incremental image transformations, and exploit the angular relationships and scale invariance across different views to conduct weakly supervised learning. Thus, they indirectly obtain the orientation and scale information of oriented objects without requiring object orientation or rotated boundary annotations [32,33,34]. Among these techniques, H2RBox-v1 contains a weakly supervised branch and a self-supervised branch. The weakly supervised branch takes a center-region crop of the original image as its input and predicts the category of the object, its center point, and an oriented bounding box in the corresponding view. It indirectly supervises the scale of the object by constraining the difference between the horizontal bounding-box label and the minimum enclosing horizontal bounding box of the predicted oriented bounding box [32]. The self-supervised branch takes a randomly rotated image as its input and achieves self-supervision of the principal object orientation by constraining the consistency of the oriented bounding boxes predicted by the two branches in terms of their scales and spatial positions. H2RBox-v2 further introduced a self-supervised branch based on object symmetry to attain improved angle prediction accuracy [33]. On this basis, ABBSPO introduced an adaptive horizontal-box label scaling module that combines object categories with angle predictions to form scale factors and adjust the scales of horizontal-box labels, thereby strengthening the scale supervision paradigm [34]. However, when slender objects are tilted, deviations often occur between their actual rotated bounding boxes and horizontal box labels. Therefore, the existing horizontal box-based weakly supervised methods are susceptible to such scale inconsistencies, resulting in reduced detection accuracy. It is therefore necessary to further exploit the orientation and scale information obtained under weak supervision and transform it into geometric priors that are suitable for slender object detection tasks.
To address the unstable angle regression process, the high annotation costs of rotated boxes, and the insufficient scale supervision provided for slender objects such as fishing rods in UAV images, WSSO-DETR, a weakly supervised slender object detection network, is proposed in this paper. WSSO-DETR uses horizontal bounding boxes instead of rotated bounding boxes as supervision, avoiding the additional annotation of object orientations and rotated boundaries and thereby reducing data annotation costs. Moreover, it weakly learns the orientation and scale information of slender objects by exploiting the consistency of the angular relationships and scale invariance among the object predictions produced under multiview transformations. On this basis, the model constructs long-axis priors from the object orientation and scale estimated by the horizontal-box detection branch and uses these priors to guide the generation of oriented object reference point sets. This enables the feature sampling positions to better conform to the geometric structures of slender objects, thereby enhancing the object feature extraction and oriented localization procedures. In addition, a scale consistency constraint is introduced to alleviate the training bias caused by differences between various annotation forms and improve the localization accuracy and detection stability of slender objects. With the detection of fishing rods in UAV-based river and lake inspection imagery as the main application scenario, we further conduct experiments on slender object datasets derived from remote sensing and natural images to verify the effectiveness and generalization ability of the proposed method. The main contributions are as follows.
(1) An oriented object reference point set generation module and a corresponding feature processing module are designed for slender objects. The reference point set generation module uses long-axis priors constructed from the object orientation and scale predicted by the horizontal-box detection branch and generates oriented object reference point sets along the object long axis, providing geometry-aware reference positions for the subsequent decoding stage. This reduces the probability that the feature sampling procedure will fall into background regions, improves the feature extraction and localization accuracy attained for slender objects, and accelerates the model convergence process. Furthermore, a point set-based oriented object decoder and a detection head are proposed. By modeling the relationships among the internal object points, center points, and key feature points and fusing the features yielded by the encoder and decoder, these components perform object classification and position regression.
(2) A scaled self-supervised loss function is proposed for conducting horizontal box-based weakly supervised oriented object detection to alleviate the adverse effects of the scale discrepancies between the horizontal box labels of slender objects and the minimum enclosing horizontal boxes of oriented bounding boxes on the model training and scale prediction processes. This function exploits the scale consistency of oriented bounding-box predictions in flipped and rotated views to provide auxiliary supervision for the oriented bounding-box predictions produced in the original view, thereby alleviating the insufficient supervision caused by label scale biases and improving the scale prediction ability of the model.
2. Related Work
Compared with horizontal bounding boxes, rotated bounding boxes can describe the length, width, and orientation information of slender objects in a more accurate manner, but they usually require additional object rotation angle annotations, resulting in high annotation costs. In terms of whether rotated bounding-box annotations are used during training, the existing oriented object detection methods can be divided into fully supervised oriented object detection and weakly supervised oriented object detection models.
2.1. Fully Supervised Oriented Object Detection
The initial oriented object detection networks used the center coordinates (x, y), width (w), height (h), and angle (θ) to represent the oriented object region [11,12,13,14]. These methods were developed on the basis of horizontal bounding box object detection networks by adding an angle prediction branch and converting the angle regression task into a classification task. By predicting the center point, size, and angle of the rectangular region containing the object, its oriented bounding box can ultimately be regressed. However, because the angle function is periodic, the angle loss function may fluctuate abnormally when the angle predicted by the model approaches the boundary angle, resulting in degraded model performance. To address this issue, some studies have used the center coordinates (x, y), width (w), and height (h) of the minimum enclosing horizontal bounding box of the oriented bounding box, together with the offsets (l1, l2, l3, l4) between the four corners of the oriented bounding box and those of its minimum enclosing horizontal bounding box, to represent the oriented object region [15,16,17]. Although this approach can represent oriented bounding boxes in a more flexible manner, when the orientation of the oriented bounding box is close to the horizontal direction, the four coordinate offsets may not be readily matched one-to-one with the four vertices of the minimum enclosing horizontal bounding box. To address the vertex regression ordering problem posed by oriented bounding boxes, some studies have used point sets to represent oriented object regions. The points contained in a point set are distributed along the object boundary, and the minimum enclosing rectangle of these points serves as the oriented bounding box for localizing the object. Point set-based oriented object detection methods alleviate the potential discontinuity that may be exhibited by the loss during angle regression, but they depend on the quality and number of predicted points and pay insufficient attention to the principal orientation of the object [18,19]. Therefore, it is difficult to ensure accurate orientation prediction when detecting objects with complex shapes. To address these issues, oriented DETR utilizes an oriented object region representation that combines point sets and axes [20]. In this method, the last point contained in the point set corresponding to each object is defined as the center point of the object, while the remaining points serve as boundary points of the object. An axis is also used to represent the principal orientation of the object. This approach jointly considers the boundary and principal orientation of the object, compensating for the limitations of point set-based oriented bounding-box representations. However, the final detection results remain affected by the number of points included in the point set.
2.2. Weakly Supervised Oriented Object Detection
Weakly supervised oriented object detection is aimed at learning the rotated locations and orientations of slender objects by using low-cost supervisory information, such as horizontal bounding boxes and point annotations, thereby reducing the complexity of annotating rotated bounding boxes. In terms of the type of supervision used, the existing methods can be divided into horizontal box-supervised oriented object detection and point-supervised oriented object detection techniques.
2.2.1. Horizontal Box-Supervised Oriented Object Detection
Horizontal box-based weakly supervised oriented object detection methods use horizontal bounding boxes as supervisory information and perform angle self-supervision by exploiting the invariance relationships of angle labels and angle prediction across multiple views. The H2RBox-v1 network contains a weakly supervised branch and a self-supervised branch. The weakly supervised branch takes an image obtained by cropping the center region of the original image as its input [32]. It uses a classification subnetwork and a regression subnetwork to predict the category and center point of the object, respectively, as well as the oriented bounding box in the corresponding view. By calculating the loss between the horizontal bounding box label and the minimum enclosing horizontal bounding box of the predicted oriented bounding box, it indirectly supervises the object scale. The self-supervised branch takes a randomly rotated image as its input and uses the regression subnetwork to predict the corresponding oriented bounding box in the view. It achieves self-supervision of the principal orientation of the object by learning the consistency of the oriented bounding boxes that are output by the two branches in terms of their scales and spatial positions. Based on the network architecture of H2RBox-v1, H2RBox-v2 utilizes a self-supervised branch that can assist with learning the principal orientation of the object according to object symmetry, thereby improving the accuracy of its angle prediction results [33]. During training, the H2RBox series of networks indirectly supervises the object scale by calculating the loss between the horizontal bounding box label and the minimum enclosing horizontal bounding box of the predicted oriented bounding box. However, these two horizontal bounding boxes possess inconsistent sizes in most cases, making it difficult for the oriented bounding box detected by the model to accurately localize the object of interest. To address this issue, the ABBSPO network introduces a horizontal bounding box label-adaptive scaling module [34]. However, adjusting the label according to the object category to match the prediction may destroy the size information contained in the label itself, making it difficult to provide effective supervision for oriented bounding box regression.
2.2.2. Point-Supervised Oriented Object Detection
Point-based weakly supervised oriented object detection methods use the center point of the object as label information and mainly include the PointOBB and Point2RBox series of models. In the PointOBB series, PointOBB-v1 [26] is based mainly on a multi-instance learning framework, and it uses multiview data augmentation and self-supervised learning mechanisms to achieve weakly supervised scale detection and self-supervised angle prediction for oriented objects. To address the slow inference speed of PointOBB-v1, which is caused by its multiple network branches, PointOBB-v2 [27] uses nonuniform positive and negative sample sampling methods and principal component analysis to extract object contour information and estimate object orientations and boundaries, thereby simplifying the model structure and accelerating the module inference procedure. PointOBB-v3 [28] introduces a scale-sensitive feature fusion (SSFF) module based on PointOBB-v1 to enhance the ability of the network to estimate object scales. It also adopts a symmetry-based self-supervised learning method to effectively achieve improved angle prediction accuracy. In the Point2RBox series, Point2RBox-v1 [29] utilizes a synthetic pattern knowledge fusion module. Based on the feature information of an object, such as its size and orientation around the annotated point, this module generates synthetic pattern data that closely resemble real objects and uses these synthetic data as pseudo-samples, thereby reducing the dependence of the model on annotated data. Building upon Point2RBox-v1, Point2RBox-v2 [30] further considers the spatial layout among objects. During the model training procedure, the Gaussian overlap loss and Voronoi loss are used to impose precise and effective constraints according to the spatial relationships among objects. Point2RBox-v3 [31] improves the Voronoi loss in Point2RBox-v2 and develops the prior-guided dynamic mask loss (PGDM-Loss), enhancing the stability of the model in sparse and dense scenes. Although point-based weakly supervised oriented object detection methods have relatively low annotation costs, the supervision information that they provide is limited, making them unsuitable for detecting objects with weak visual information.
3. Methods
WSSO-DETR integrates oriented DETR with the weakly supervised strategy of H2RBox-v2. It inherits the point-axis representation and point-based decoding mechanism of the oriented DETR to model center–internal point relationships while redesigning these modules for handling slender objects with small scales, large aspect ratios, and large orientation variations. To reduce annotation cost, horizontal boxes are used as weak supervision, and orientations are learned from the multiview angle consistency of H2RBox-v2. Since horizontal labels may bias the scale learning process for tilted slender objects, an oriented object-scaled self-supervised loss is introduced to enhance the scale supervision method.
3.1. Model Framework
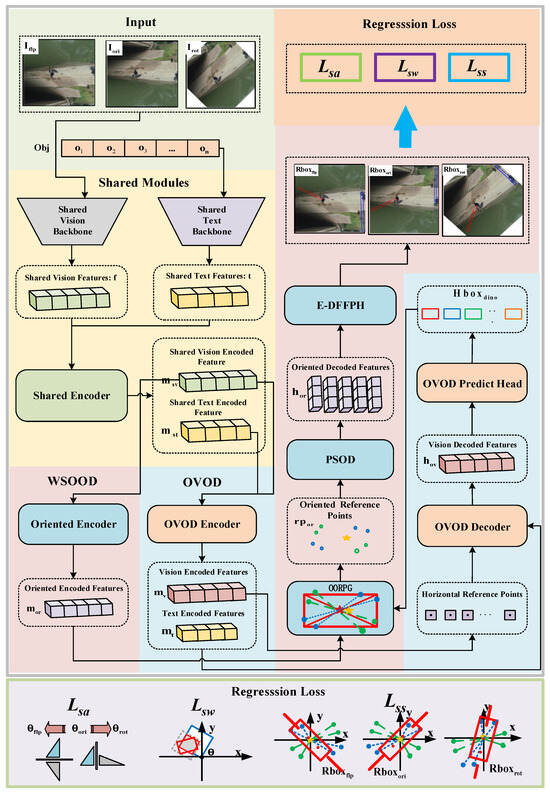
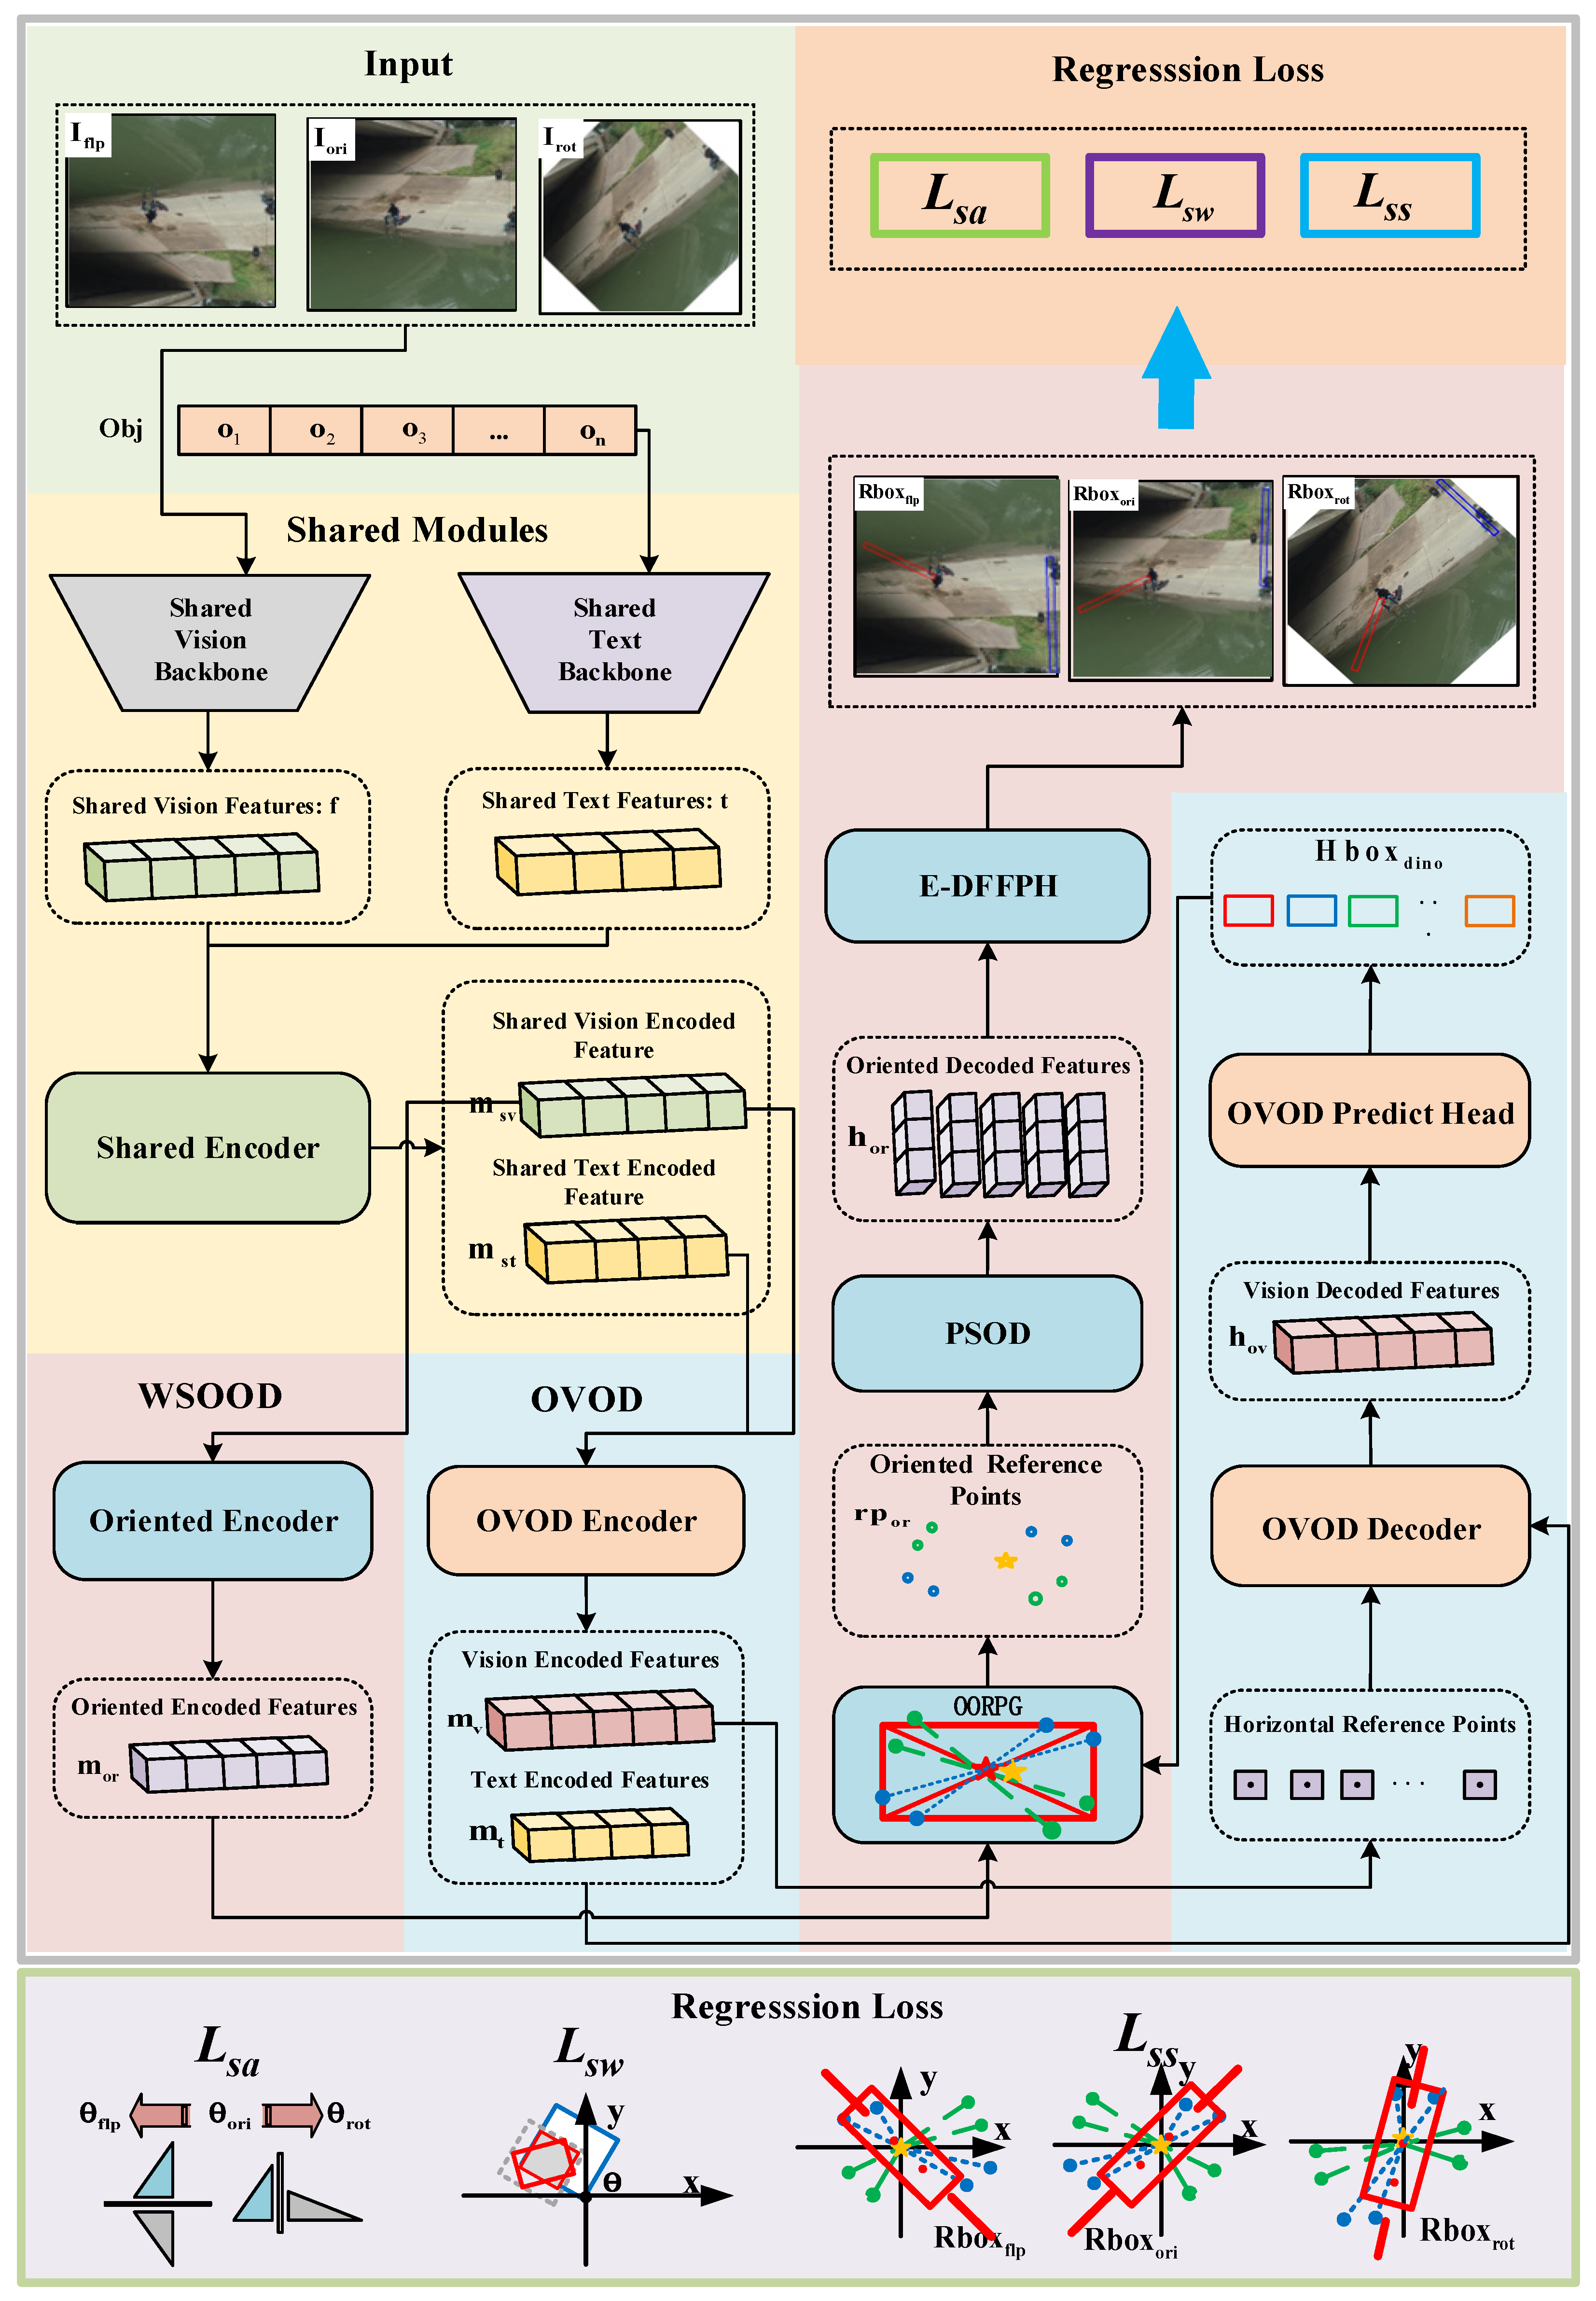
WSSO-DETR consists of three shared modules, namely, a shared vision backbone, a shared text backbone, and a shared encoder, and two task branches: weakly supervised oriented object detection (WSOOD) and open-vocabulary object detection (OVOD) branches based on horizontal bounding boxes. The shared modules follow Grounding DINO. During training and testing, WSSO-DETR takes multiview images (Iori, Irot, and Iflp) and single-view images (Iori) as its inputs. The architecture and data flow of WSSO-DETR are shown in Figure 1.
Figure 1.
Network architecture of WSSO-DETR.
During the feature extraction process, multilevel visual features are extracted from Iori, Irot, and Iflp by the shared vision backbone, whereas text features t are extracted from the object prompts Obj by the shared text backbone. Each xl is channel-compressed and converted into a one-dimensional feature f through flattening and concatenation. The shared encoder then aggregates the visual and textual information derived from f and t, producing msv and mst, respectively.
To mitigate the feature coupling between branches, a dedicated encoder is employed for each branch. The OVOD branch feeds msv and mst into the OVOD encoder to aggregate the global image features and obtain mov. The horizontal reference points generated from mov guide the OVOD decoder to sample and aggregate features into hov. The OVOD prediction head then outputs horizontal bounding boxes Hboxdino.
The WSOOD branch takes msv as its input. The oriented encoder extracts the long-range scale- and orientation-related features of slender objects and outputs mor. The oriented object reference point set generation (OORPG) module predicts positional offsets relative to Hboxdino on the basis of mor, which are combined with the spatial information of Hboxdino to generate an oriented reference point set rpor.
The point set-based oriented decoder (PSOD) uses the center point of each object contained in rpor as the reference point, samples features from mor at the corresponding reference positions, aggregates intraobject information and interobject information, and outputs hor.
The encoder–decoder feature fusion-based prediction head (E-DFFPH) separately generates predictions from mor and hor and then fuses them as the final outputs, including object categories Cls, orientations Ang, and oriented bounding boxes Rbox.
For loss calculation purposes, the angle self-supervision loss Lsa and scale-based weak supervision loss Lsw follow H2RBox-v2. The scaled self-supervision Lss enforces scale consistency among the oriented boxes produced from multiview data. OORPG, the PSOD, the E-DFFPH, and Lss are detailed in Section 3.2, Section 3.3, Section 3.4 and Section 3.5.
3.2. OORPG
The OORPG module takes oriented object point queries Qor and the corresponding set of horizontal bounding boxes Hboxdino as its inputs. It generates oriented object reference point sets rpor by applying corresponding offsets to some of the positional information contained in Hboxdino. Assume that represents the reference point set of the i-th oriented object in rpor and that denotes the i-th horizontal bounding box in Hboxdino. K points are included in , with the K-th point representing the central reference point. is obtained by applying a certain offset based on the center point of .
where and represent the horizontal and vertical coordinates, respectively, of the center point of ; . ∆xi and ∆yi denote the offsets in the horizontal and vertical directions, respectively, and their calculation methods are shown in Equation (2). Cxy denotes the spatial positional constraint function for xy coordinates. represents the i-th object point query. MLPc is composed of three linear layers, and this component is used to map the last dimensionality of from d to 2.
The remaining K − 1 points in represent the set of edge reference points , which are distributed around . In the polar coordinate system with (, ) as the pole, the relative positional relationship between each edge reference point and the pole can be intuitively represented using the polar radius and polar angle. Taking (, ) as the reference, considering the relative offset of each edge reference point with this coordinate, the actual coordinates of the reference points can be obtained. For the k-th edge reference point , the generation method is as follows:
where li,k and θi,k represent the polar radius and polar angle, respectively, corresponding to in the polar coordinate system with (, ) as the pole. li,k∙cos θi,k and li,k∙sin θi,k represent the offsets of the edge reference point relative to the pole (, ) in the horizontal and vertical directions, respectively; li,k,θi,k ∈ ℝ, li,k∙cos θi,k and li,k∙sin θi,k are both scalars, and after being mapped by Cxy, they jointly form a two-dimensional coordinate offset vector.
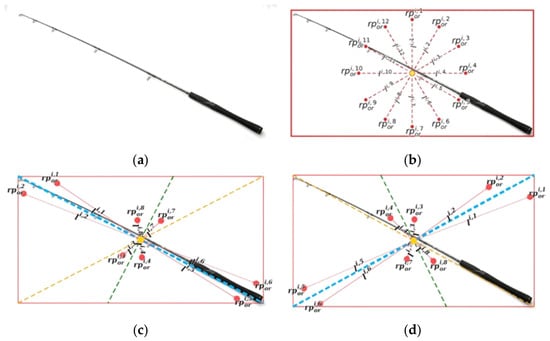
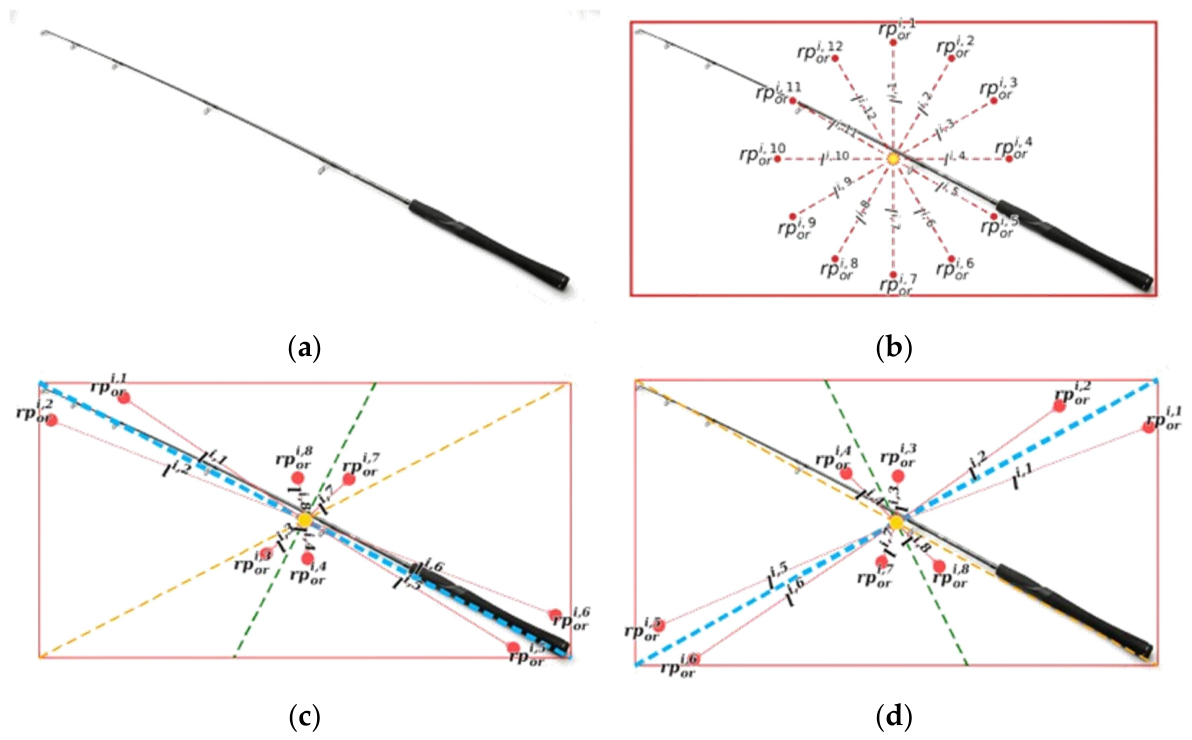
The object-to-point set query transformation method in the oriented DETR generates the point set shown in Figure 2b. Among these points, denotes the center point, while the remaining edge points are uniformly distributed around (, ) at equal angular intervals of 30°. For slender objects, such as fishing rods, some points fall into the background region, making it difficult for queries based on these points to aggregate effective feature information.
Figure 2.
Schematic illustration of the OORPG module and the object-to-point set query transformation process. (a) is the original image. (b) is the point set generated by the object-to-point set query transformation method in the oriented DETR. (c) is the point set generated by OORPG using the diagonal close to the fishing rod as the reference. (d) is the point set generated by OORPG using the other diagonal as the reference.
Since slender objects usually have clear long-axis directions, the diagonal of the horizontal bounding box provides an approximate scale and direction prior for the object when only horizontal annotations are available. The long-axis length of an object is generally close to the diagonal length of its horizontal box, whereas its principal direction tends to align with that of one of the two diagonals. Thus, diagonal-based reference points provide effective initial constraints for generating edge point sets under weak supervision, where rotated boxes or angle annotations are unavailable. OORPG exploits the scale and diagonal directions that are encoded in the horizontal box and separately learns radial and angular offsets to generate a point set describing the edge structure of the object. The scale and direction references derived from the horizontal box are termed the reference length and reference angle for the radial and polar coordinates, respectively. To this end, we designed a dedicated method for computing li,k and θi,k.
As shown in Figure 2c, the fishing rod lies close to the blue diagonal of the red horizontal bounding box. From the center of the box, four reference vectors are constructed along the blue diagonal and its perpendicular direction toward both ends, whose magnitudes and directions serve as the reference lengths for the radial coordinate and the reference angles for the polar angle, respectively. For the current edge point , the magnitude of the nearest reference vector is selected according to its index k as the radial reference length , as formulated in Equation (4):
where represents the reference length of the polar radius; and represent the width and height of , respectively; ; k denotes the index of the currently processed point; 1 ≤ k ≤ K − 1; and K denotes the number of points contained in the point set. Since the point set contains K − 1 edge points and one center point, the edge points are divided into four directional groups by qk. According to the direction group to which each point belongs, half of the diagonal length or half of the short-side length of the horizontal box is alternately selected as the reference length for the radial coordinate to adapt to the scale differences exhibited by slender objects along the long-axis and short-axis directions.
Since a horizontal bounding box contains two candidate diagonals, whereas the main structure of a slender object is usually closer to only one of them, generating offset reference points from both diagonals would introduce many invalid points that are inconsistent with the main orientation of the object. Such points increase the decoding cost incurred and provide limited effective geometric information for predicting object scales and orientations. Therefore, the object point query is mapped to a two-dimensional output through a multilayer perceptron, whose two dimensions represent the confidence scores employed for selecting the two candidate diagonals as the reference directions. The diagonal with the higher score is selected as the baseline direction for the angular offset. Once the reference diagonal is determined, the current edge point selects the direction of its nearest principal direction axis according to its index as the reference angle for the polar angle, as formulated in Equation (5):
where denotes the reference angle of the polar angle corresponding to the k-th edge point; denotes the diagonal in whose angle is smaller than ; and ; the specific calculation process of , is shown in Equation (7). is fed into the multilayer perceptron , which maps the last dimensionality of from 256 to 2. In accordance with the relative magnitudes of the two feature values and in this dimension, the diagonal angle to be used as the reference for the offset is selected. When , the reference angles for the polar angle are determined according to Figure 2c; otherwise, they are determined according to Figure 2d.
By applying offsets to the reference length of the polar radius and the reference angle of the polar direction described above, relatively accurate polar radii and polar angles can be obtained. Therefore, for , the calculation processes employed for its corresponding polar radius li,k and polar angle θi,k are as shown in Equation (8) and Equation (10), respectively.
where ∆li,k represents the offset length of li,k relative to , which is calculated as shown in Equation (9); Cl denotes the spatial positional constraint function of the polar radius; and MLPl is composed of three linear layers, where this component is used to map the last dimensionality of from 256 to K − 1. These K − 1 values correspond to the offsets of the polar radii relative to the reference length.
where ∆θi,k represents the offset angle of θi,k relative to , which is calculated as shown in Equation (11); Cθ denotes the spatial positional constraint function of the polar angle; and MLPθ is composed of three linear layers, where this component is used to map the last dimensionality of from 256 to K − 1. These K − 1 values correspond to the offsets of the polar angles relative to the reference angle.
3.3. PSOD
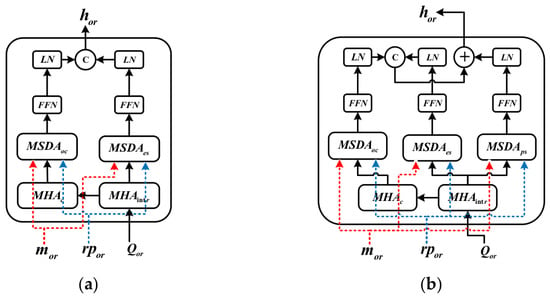
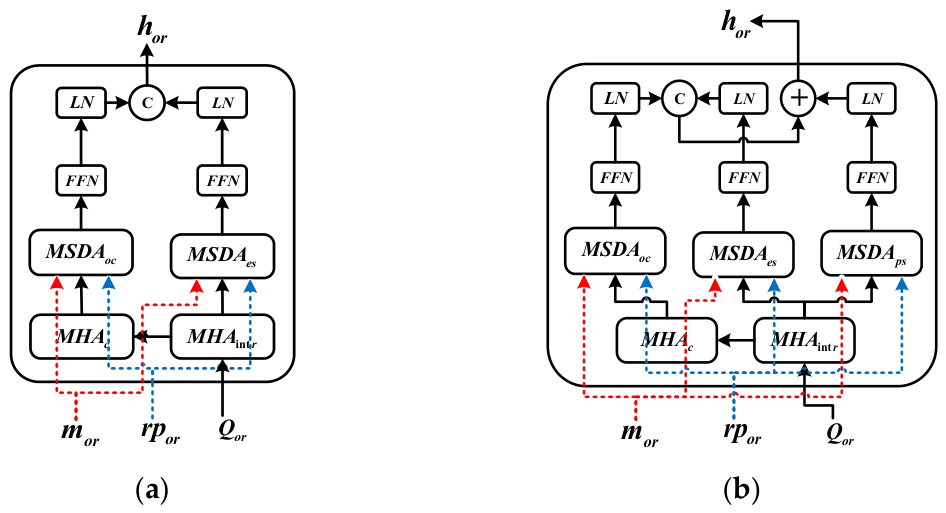
As illustrated in Figure 3a, the point detection decoder layer contained in the oriented DETR model is designed specifically for point queries. The point detection decoder takes the encoded oriented object feature mor, the reference point sets of the oriented object rpor, and the point queries Qor as its inputs. It processes the center point queries and the edge point queries through two separate branches and then concatenates the corresponding features to form decoded features. If the oriented DETR model is applied to slender object detection tasks, the large distances between endpoints along the principal orientation direction can cause the edge points to be misassigned to incorrect object point sets.
Figure 3.
Structure of the decoder layer. (a) is the point detection-based decoder layer in the oriented DETR, and (b) is the point set-based oriented decoder (PSOD) layer.
The two left branches of the PSOD layer designed in this study are consistent with the original structure of the point detection-based decoder layer, while the rightmost branch employs a standalone multiscale deformable attention module (MSDAps), a feedforward network (FFN), and a layer normalization (LN) module to process point queries containing central points. The output of the added branch in the PSOD layer is fused with the output of the point detection-based decoder layer via elementwise addition, yielding the final decoded feature hor. This decoding approach reduces the probability of edge-point misassignments during point set prediction and improves the scale detection accuracy achieved for slender objects.
3.4. E-DFFPH
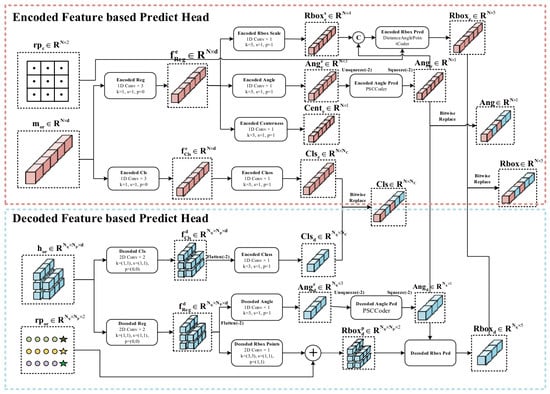
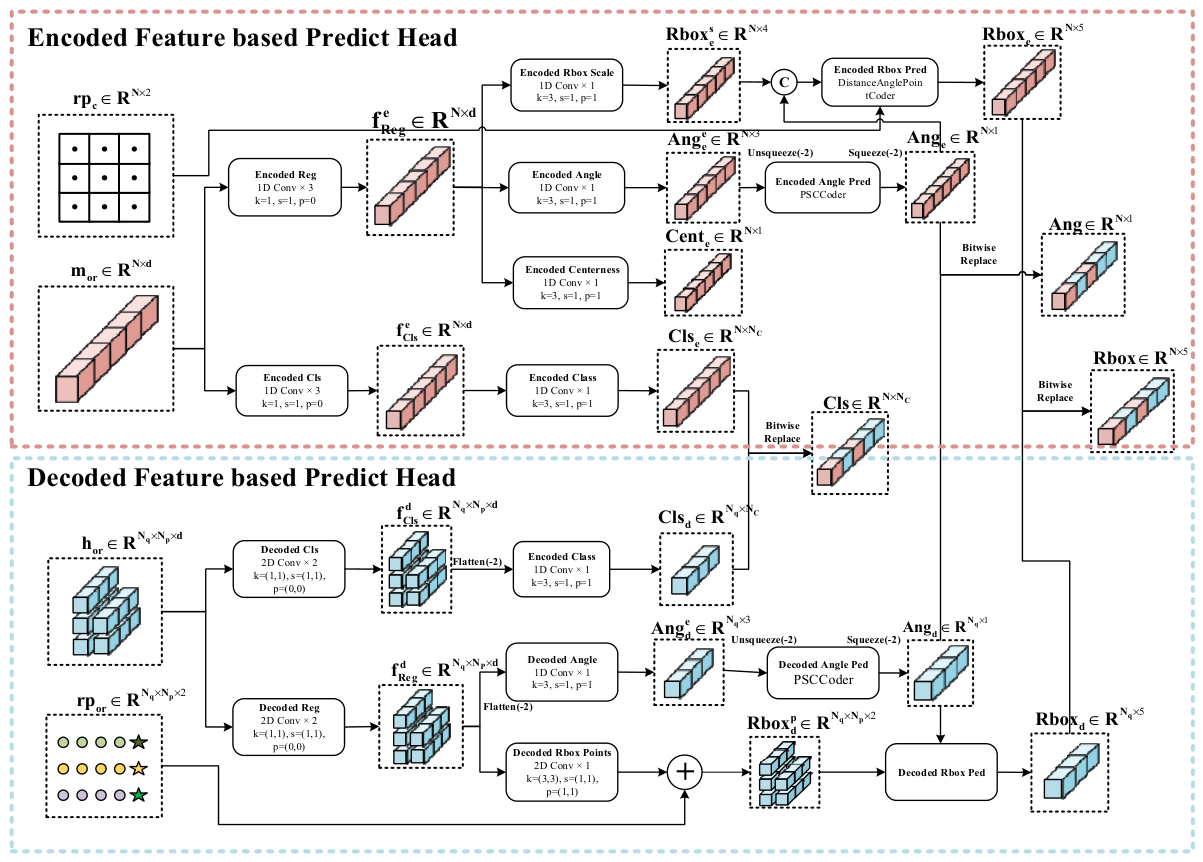
For slender object detection tasks, the employed model should be sensitive to local details while incorporating constraints derived from the global context. The E-DFFPH separately predicts the categories, scales, and orientations of objects from their encoded and decoded features and then fuses the predictions to produce the final detection results. As illustrated in Figure 4, the E-DFFPH adopts a global-local collaborative architecture to exploit complementary feature information and attain improved detection accuracy.
Figure 4.
Encoder–decoder feature fusion-based prediction head (E-DFFPH) for oriented object detection tasks.
The encoded feature-based prediction head (EFPH) takes the encoded oriented object feature mor and the center reference point set rpc corresponding to the multilevel visual features as its inputs. The EFPH consists of a classification branch and a regression branch. The classification branch performs feature refinement and outputs a classification prediction Clse. The regression branch predicts the centerness, angle, and scale of the object from the refined features . An encoded feature-based object box prediction Rboxe is then generated by a distance-angle point encoder using the predicted angle Ange, scale , and center reference point set rpc.
Unlike the existing DETR networks that generate decoded features from object queries, WSOOD obtains the decoded feature hor using point queries. Thus, a decoded feature-based prediction head (DFPH) is designed for point features, taking the decoded oriented object feature hor and reference point set rpor as its inputs. Category and angle branches flatten the corresponding point features before conducting prediction to ensure a one-to-one correspondence between each object and its category or angle. The operations for the other prediction tasks follow those of the corresponding branches in the EFPH. The object point set prediction branch predicts offsets relative to rpor from the regression feature and adds them to rpor to obtain the actual oriented object point set .
The fusion of the predictions derived from the encoded and decoded features updates the decoded feature-based results to the corresponding positions in the encoded feature-based results according to object centerness, similar to a bitwise replacement operation. Since the regression branches of the EFPH and DFPH output bounding boxes and point sets, respectively, their prediction formats differ significantly. To fuse them, the oriented object point set is first projected onto the principal direction determined by the angle prediction Angd to obtain object scale information. This scale information is then combined with Angd to generate the decoded feature-based object bounding-box regression result Rboxd.
3.5. Loss Function
During the training process of WSSO-DETR, the OVOD branch directly generates horizontal bounding boxes using weights trained on massive datasets, and these predicted horizontal bounding boxes do not participate in the loss calculation. For the predicted oriented object category, centerness, angle, and scale output from the WSOOD branch, the corresponding comprehensive loss Ltotal is calculated as follows:
where Lcls, Lcn, Lsa, and Lsw represent the oriented object classification loss, centerness loss, angle loss, and weakly supervised scale loss, respectively. These losses are calculated according to the corresponding loss functions contained in H2RBox-v2. Additionally, λcls, λcn, λang, and λreg represent the weight coefficients corresponding to the oriented object classification loss, centerness loss, angle loss, and weakly supervised scale loss, respectively. Lss represents the self-supervised loss for the oriented object scale. Lsw is the loss calculated based on the predicted results in the form of bounding boxes, whereas Lss is the loss computed using the predicted results in the form of point sets. The calculation process of Lss is as follows:
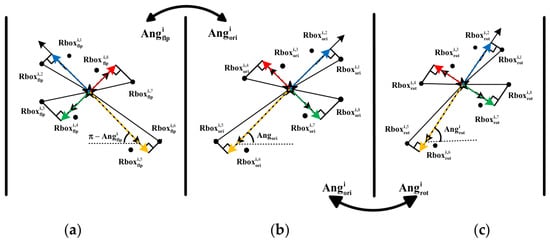
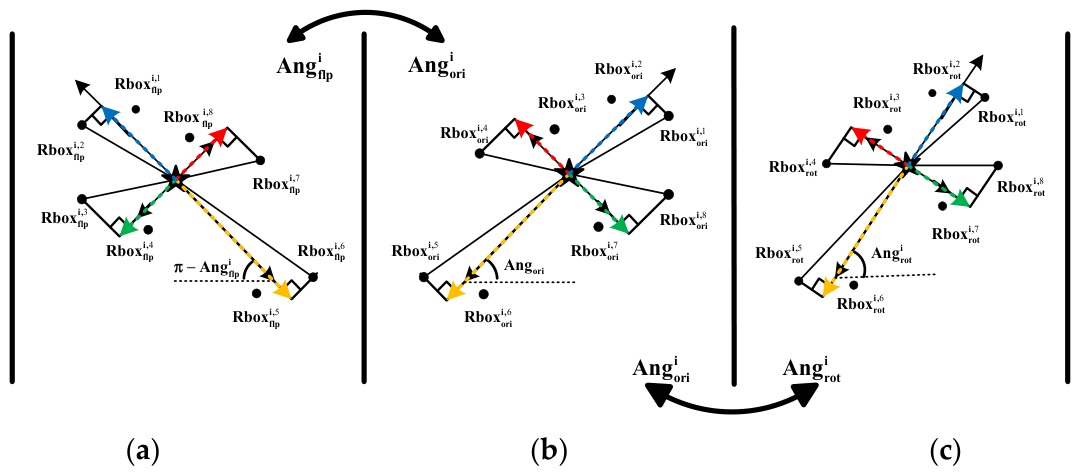
where represents the self-supervised scale loss between the original and rotated views and denotes the self-supervised scale loss between the original and flipped views. The calculation processes of and are shown in Equations (14) and (15), respectively. L1 denotes the sum of the absolute differences between the corresponding elements in the two sets. For the i-th oriented object prediction in the original view, a vector set is formed by taking its center point as the starting point and the edge points as its endpoints. represents the maximum projection values of these vectors onto each principal direction axis. The principal direction axes correspond to the four colored dashed lines in Figure 5b. Similarly, and represent the maximum projection values of the vector sets derived from the prediction results of the rotated and flipped views, respectively, projected onto each principal direction axis. These principal direction axes correspond to the four colored dashed lines in Figure 5a and Figure 5c, respectively. , , and are calculated as shown in Equations (16), (17), and (18), respectively:
where , , and denote the k-th edge point of the i-th oriented object prediction in the original, rotated, and flipped views, respectively; , , and denote the corresponding center points. vo(θ) denotes the unit vector at an angle of θ, and the projection of a vector onto direction θ is computed as its dot product with vo(θ).
Ltotal = λclsLcls + λcnLcn + λangLsa + λreg(Lsw + Lss)
Figure 5.
Schematic illustration of the scaled self-supervision method for oriented objects. (a–c) show the prediction results obtained for the flipped, original, and rotated views, respectively.
4. Experiments
4.1. Datasets
To verify the effectiveness of the proposed method for detecting fishing rods in UAV-based river and lake inspection scenarios and to further evaluate its generalization ability in slender object detection tasks involving remote sensing images and natural images, comparative experiments were conducted on three datasets: the self-constructed Fishing Detect dataset, DOTA-v1.0 [35], and Slender COCO.
4.1.1. Fishing Detect
Fishing Detect is a self-constructed image dataset for fishing behavior detection tasks. The video data contained in this dataset were captured through drone-based patrol inspections. To reduce the degree of video frame redundancy, we uniformly sampled frames from the original videos at 2-s intervals and manually removed images that did not contain targets that were related to fishing behaviors, ultimately yielding 6056 images. The image scenes cover eight typical environments surrounding rivers and lakes, including wetland reserves, parks, subway stations, residential communities, hotels, schools, amusement parks, and farmland. The dataset includes annotations for seven common target categories in river and lake scenes, including fishing rod (FR), river (RI), building (BU), person (PE), bridge (BR), guardrail (GR), and grassland (GL) annotations. The number of instances in the different categories were 11,555, 9106, 3741, 12,101, 695, 3663, and 2037, respectively. To reflect the shape characteristics of different target categories, we calculated the average aspect ratio of the oriented bounding boxes for each category, which was defined as the ratio of the long side to the short side of the corresponding oriented bounding box. The average aspect ratios of the seven target categories were 23.47, 3.68, 1.79, 1.82, 4.62, 6.31, and 2.40, respectively. It can be observed that fishing rods and guardrails have relatively pronounced elongated shapes; therefore, using oriented bounding boxes for annotation purposes can more accurately describe their spatial extents.
During the annotation process, a semiautomatic annotation procedure was designed to reduce the cost of manual annotation and provide improved annotation efficiency. First, SAM3 was used to segment the targets in the images and generate the corresponding multiclass candidate masks. Afterward, the masks of each category were binarized. For the binary masks, postprocessing was performed based on the results of connected-component labeling to remove small noise regions in the foreground and fill small background holes inside the targets. The contours of each valid connected component were subsequently extracted, and the corresponding minimum-area oriented bounding boxes were generated, from which the coordinates of the four vertices of each oriented bounding box were obtained. Finally, each target was stored in a .txt annotation file in the format of category + four-vertex coordinates. To ensure high annotation quality, all automatically generated labels were individually checked and corrected manually. Through the combination of semiautomatic generation, manual verification, and correction, the accuracy of the annotation results was ensured to the greatest extent possible.
With respect to data splitting, considering that video frames may exhibit strong temporal correlations, we attempted to perform splitting at the video source or drone inspection route level whenever possible, thereby reducing the probability that adjacent frames would simultaneously appear in different subsets. The number of images contained in the training and validation sets were 5305 and 751, respectively. Moreover, to test the generalizability of the developed model in independent scenes and facilitate external visual presentations, we additionally collected video through drone inspections and constructed 751 independent test images using the same uniform time interval-based frame sampling and manual screening procedures. During the splitting process, a stratified sampling strategy was adopted to keep the distributions of instances derived from different categories in each subset as consistent as possible.
4.1.2. DOTA-v1.0
DOTA-v1.0 is a large-scale aerial image benchmark that is widely used for oriented object detection tasks. The dataset is composed of 2806 high-resolution remote sensing images, with a total of 188,282 annotated instances covering 15 object categories: plane (PL), baseball diamond (BD), bridge (BR), ground track field (GTF), small vehicle (SV), large vehicle (LV), ship (SH), tennis court (TC), basketball court (BC), storage tank (ST), soccer ball field (SBF), roundabout (RA), harbor (HA), swimming pool (SP), and helicopter (HC) categories. Following the official split, the training and validation sets contained 1411 and 458 images, respectively.
4.1.3. Slender COCO
The Slender COCO dataset was built from COCO2017 [36] by extracting objects with aspect ratios greater than 4.5, including skis, knives, baseball bats, snowboards, forks, spoons, and toothbrushes. Since COCO2017 lacks oriented bounding-box annotations, Slender COCO was formed by generating oriented boxes from object masks and further including ski rods, resulting in eight categories. The extracted data were split into training, validation, and test sets with 16,321, 5199, and 5000 images, respectively.
4.2. Implementation Details
The weakly supervised oriented object detection network (WSSO-DETR) proposed in this study, which is tailored for slender objects, accepts input images with resolutions of 1024 × 1024. During the feature extraction phase, ResNet50-FPN is employed as the shared vision backbone, and a BERT model is employed as the shared text backbone. The initial learning rate and number of training epochs were set to 1 × 10⁻⁴ and 12, respectively.
With respect to the number of training epochs, the learning rate, and the corresponding decay strategy used to train the comparison methods on the DOTA-v1.0 dataset, we followed the relevant settings in their official codes. However, to ensure a fair comparison between the methods to the greatest extent possible, we uniformly set the input image size for all the methods to 1024 × 1024. Since the processing procedures and annotation formats used for constructing the Fishing Detect and Slender COCO datasets were based on those of the DOTA-v1.0 dataset, when training the comparison methods on these two datasets, we followed the parameter settings used for training them on the DOTA-v1.0 dataset. The experiments were conducted in an Ubuntu 24.04 LTS operating system environment, utilizing the PyTorch 1.12 deep learning framework (accelerated by CUDA 11.3) and an NVIDIA RTX 3090 GPU.
4.3. Ablation Experiments
To verify the effectiveness of the modules and loss function contained in WSSO-DETR, a baseline network, denoted as Baseline, was constructed by combining the backbone and encoder of Grounding DINO with the decoder and detection head of Oriented DETR. Baseline adopts the loss adopted in H2RBox-v2 as its loss function, and both the encoder and decoder contain six layers. The corresponding modules or loss function in Baseline were then replaced according to the proposed improvements, resulting in the following five model variants.
(1) Since OORPG requires the horizontal bounding box of each object as its input, the network must include both the OVOD and WSOOD branches. Keeping the encoding–decoding structures and layer numbers consistent with those of Baseline, we redesigned the sequential stacked architecture in Baseline as a multitask parallel structure with shared modules and task-specific branches. The backbone and first four encoder layers were unchanged: the backbone and first two encoder layers serve as shared modules, while the last two layers form the OVOD encoder. The OVOD branch uses three decoder layers and the detection head derived from Grounding DINO. The WSOOD branch retains the encoder, decoder, and detection head of Baseline (with two encoder layers and three decoder layers) but replaces the point set generation method with OORPG and reduces the number of points per instance-specific point set from 13 to 9. This model is denoted as Baseline-OORPG.
(2) Replacing only the decoder in Baseline with the PSOD yields Baseline-PSOD.
(3) Replacing only the detection head in Baseline with the E-DFFPH yields Baseline-E-DFFPH.
(4) Replacing only the loss function in Baseline with while keeping the other modules unchanged yields Baseline-. Here, denotes the loss obtained by introducing Lss on the basis of .
(5) Replacing the point set generation module, decoder, detection head, and loss function in Baseline with OORPG, the PSOD, the E-DFFPH, and , respectively, while keeping the other modules unchanged yields Baseline-(OORPG + PSOD + E-DFFPH + ).
Table 1 presents the results obtained in ablation experiments concerning the different modules of WSSO-DETR conducted on the Slender COCO and Fishing Detect datasets. Columns 1 to 5 record the combinations of modules and loss functions employed in the model variants. Columns 6 and 7 report two accuracy metrics, i.e., mAP50 and mAP75, respectively. Since the ablation experiments were conducted separately on the Slender COCO and Fishing Detect datasets, the values obtained for the same metric on the two datasets are separated by “/”. Columns 8 to 10 report the number of parameters (Parameters), number of floating-point operations (FLOPs), and inference speed (FPS), respectively.
Table 1.
Ablation experiments on each module in WSSO-DETR.
A comparison between the data in rows 2 and 3 of Table 1 reveals that the mAP50 values achieved by Baseline-OORPG on the Slender COCO and Fishing Detect datasets were 0.9% and 0.7% greater than those of Baseline, respectively, while its mAP75 values were 1.2% and 0.9% greater, respectively. This is because OORPG uses the positional information contained in the horizontal bounding boxes output by the Dino branch as a reference and combines it with the offsets generated from the encoded features, thereby obtaining a set of oriented target reference points that better conforms to the spatial distributions of slender objects, which improves the accuracy of the model. Moreover, the number of parameters and FLOPs required by Baseline-OORPG were 7.6 M and 59.3 G lower than those of Baseline, respectively, and its FPS was 2.6 higher. Therefore, compared with Baseline, Baseline-OORPG is more lightweight and has a faster inference speed. This is because, with comparable numbers of encoder and decoder layers relative to Baseline, Baseline-OORPG adopts a multibranch parallel architecture, whereas Baseline processes images in a serial layer-by-layer manner. In addition, the number of points contained in the point set during the decoding process is 9 for Baseline-OORPG and 13 for Baseline, which reduces the computational cost of the decoding process.
A comparison between the data in rows 2 and 4 of Table 1 reveals that the mAP50 values achieved by Baseline-PSOD on the Slender COCO and Fishing Detect datasets were 1.3% and 1.0% greater than those of Baseline, respectively, while its mAP75 values were 2.1% and 1.4% greater, respectively. This is because during the decoding process, the PSOD not only establishes interaction information among the feature points within an object and among the centers of multiple objects but also aggregates the long-range dependencies among all feature points of an object, thereby improving the size prediction accuracy attained for oriented objects. However, because the PSOD needs to add an additional branch to the decoding layer used by Baseline to obtain the relationships among all feature points of an object, the numbers of parameters and FLOPs required by Baseline-PSOD were 7.7 M and 25.9 G higher than those of Baseline, respectively, while its FPS was 0.7 lower.
A comparison between the data in rows 2 and 5 of Table 1 reveals that the mAP50 values achieved by Baseline-E-DFFPH on the Slender COCO and Fishing Detect datasets were 0.5% and 0.4% greater than those of Baseline, respectively, while its mAP75 values were 1.5% and 0.8% greater, respectively. This is because the E-DFFPH combines the prediction results obtained based on the encoded and decoded features, achieving the complementarity of global and local feature information and thereby improving the detection accuracy of the model. In terms of the number of model parameters and inference speed, Baseline-E-DFFPH is comparable to Baseline. Its FLOPs were equal to those of Baseline, its parameters were 0.2 M higher than those of Baseline, and its FPS was 0.2 lower.
A comparison between the data in rows 2 and 6 of Table 1 reveals that the mAP50 values achieved by Baseline- on the Slender COCO and Fishing Detect datasets were 1.1% and 1.6% greater than those of Baseline, respectively, while its mAP75 values were 2.5% and 2.3% greater, respectively. This is because mutual supervision among the prediction results derived from multiple views reduces the adverse impacts on model training caused by the inconsistency between the size of the horizontal bounding-box labels and that of the minimum enclosing horizontal boxes of the oriented object bounding-box labels. In terms of the number of model parameters and inference speed, the FLOPs, parameters, and FPS of Baseline- were the same as those of Baseline.
A comparison between the data in row 7 with those in the other rows of Table 1 reveals that the mAP50 values achieved by Baseline- on the Slender COCO and Fishing Detect datasets were 2.9–3.7% and 1.8–3.0% greater than those of Baseline and the combinations with the other individual modules, respectively, while its mAP75 values were 3.5–4.8% and 2.7–4.2% greater, respectively. This finding indicates that the combination of the modules proposed in this paper contributes more to improving the detection accuracy of the model than the individual modules do. Moreover, the FLOPs and parameters of Baseline- were 48.2 G and 3.5 M lower than those of Baseline, respectively, while its FPS was 1.2 higher.
4.4. Comparative Experiments with Other Methods
We selected several representative state-of-the-art methods from among the current mainstream oriented object detection approaches and conducted comparative experiments with WSSO-DETR to validate its performance advantages. Among the compared methods, those based on rotated bounding-box labels include dynamic coarse-to-fine learning (DCFL) [13], double horizontal rectangles (DHRec) [15], Oriented RepPoints [18], an Oriented R-CNN [14], an Oriented DETR [20], and O2DFINE [37]. Methods based on single-point supervision include PointOBB-v2 [27], Point2RBox-v2 [30], and Point2RBox-v3 [31]. Methods based on horizontal bounding-box supervision include H2RBox-v1 [32], H2RBox-v2 [33], and ABBSPO [34].
For a comparison with methods based on rotated bounding-box supervision, the oriented bounding-box regression loss contained in WSSO-DETR was replaced with that used in the Oriented DETR. In the comparative experiments involving fully supervised oriented object detection methods, WSSO-DETR (FS) was compared with DCFL, Oriented RepPoints, the Oriented R-CNN, and the Oriented DETR on the Fishing Detect dataset, achieving improvements of 4.0%, 5.7%, 5.4%, and 3.2%, respectively, in terms of mAP50. On the Slender COCO dataset, compared with DCFL, Oriented RepPoints, the Oriented R-CNN, and the Oriented DETR, WSSO-DETR (FS) improved the mAP50 values by 2.7%, 3.2%, 8.1%, and 6.4%, respectively. On the DOTA-v1.0 dataset, WSSO-DETR (FS) was compared with DHRec, Oriented RepPoints, the Oriented R-CNN, the Oriented DETR, and O2DFINE, achieving improvements of 5.1%, 10.6%, 8.4%, 1.4%, and 2.8%, respectively, in terms of mAP50.
In the Fishing Detect dataset, fishing rods and guardrails are classified as slender objects. As shown in Table 2, compared with four other rotated bounding box-supervised oriented object detectors (DCFL, Oriented RepPoints, the Oriented R-CNN, and the Oriented DETR), WSSO-DETR (FS) achieved 2.8–10.8% and 3.8–8.2% higher mAP50 values for these two categories, respectively. In the DOTA-v1.0 dataset, the BR, LV, and HA items are categorized as slender objects. As shown in Table 3, compared with four other rotated bounding box-supervised oriented object detectors (DHRec, Oriented RepPoints, the Oriented R-CNN, and the Oriented DETR), WSSO-DETR (FS) achieved 6.1–13.3%, 1.4–7.2%, and 3.1–8.8% higher mAP50 values for these three categories, respectively. In the Slender COCO dataset, skis, ski rods, baseball bats, and forks represent four slender object categories. As shown in Table 4, compared with four other rotated bounding box-supervised oriented object detectors (DCFL, Oriented RepPoints, the Oriented R-CNN, and the Oriented DETR), WSSO-DETR (FS) achieved 1.1–6.6%, 2.8–7.4%, 1.6–12.3%, and 4.5–13.2% higher mAP50 values for these four categories, respectively.
Table 2.
Comparative experiments on Fishing Detect.
Table 3.
Comparative experiments on DOTA-v1.0.
Table 4.
Comparative experiments on Slender COCO.
For a comparison with methods based on horizontal bounding-box supervision, the oriented bounding-box regression loss in WSSO-DETR mainly consisted of the object bounding box angle-based self-supervised loss and the object bounding box scale-based weakly supervised loss used in H2RBox-v2. In addition, the object bounding box scale-based self-supervised loss proposed in this study was incorporated, forming WSSO-DETR (WS), which is supervised by horizontal bounding-box labels. In comparative experiments involving horizontal box-supervised oriented object detection methods, WSSO-DETR (WS) was compared with H2RBox-v1, H2RBox-v2, and ABBSPO on the Fishing Detect dataset, achieving improvements of 4.8%, 1.7%, and 1.1%, respectively, in terms of mAP50. On the Slender COCO dataset, compared with H2RBox-v1, H2RBox-v2, and ABBSPO, WSSO-DETR (WS) improved the mAP50 metric by 15.3%, 2.5%, and 3.3%, respectively. On the DOTA-v1.0 dataset, WSSO-DETR (WS) was compared with H2RBox-v1, H2RBox-v2, and ABBSPO, achieving improvements of 4.9%, 3.3%, and 1.7%, respectively, in terms of mAP50.
With respect to the slender objects contained in the Fishing Detect dataset, namely, fishing rods and guardrails, WSSO-DETR (WS) achieved 3.4–7.8% and 0.7–3.8% higher mAP50 values than H2RBox-v1, H2RBox-v2, and ABBSPO, respectively. For the slender objects contained in the DOTA-v1.0 dataset, namely, BR, LV, and HA, WSSO-DETR (WS) achieved 5.4–15.5%, 2.9–4.1%, and 4.3–15.3% higher mAP50 values than H2RBox-v1, H2RBox-v2, and ABBSPO, respectively. The Slender COCO dataset was constructed by selecting eight categories of objects with aspect ratios greater than 4.5 from the COCO2017 dataset. These eight categories, arranged in descending aspect ratio order, were ski rods, skis, knives, baseball bats, snowboards, forks, spoons, and toothbrushes. Compared with H2RBox-v1, H2RBox-v2, and ABBSPO, WSSO-DETR (WS) improved the mAP50 values attained for the above eight categories of slender objects by 2.0–15.7%, 1.2–9.3%, 2.4–12.9%, 1.4–22.4%, 1.3–9.6%, 1.6–11.8%, −0.1–25.3%, and −2.4–15.4%, respectively. These findings indicate that compared with the other three horizontal box-supervised oriented object detection methods, the WSSO-DETR (WS) method achieved higher accuracy when detecting the six object categories with higher aspect ratios, namely, ski rods, skis, knives, baseball bats, snowboards, and forks, but it did not achieve the highest accuracy when detecting the two categories with lower aspect ratios, namely, spoons and toothbrushes. When detecting spoons, the mAP50 of WSSO-DETR (WS) was 0.1% lower than that of ABBSPO; for toothbrushes, the mAP50 of WSSO-DETR (WS) was 2.4% lower than that of H2RBox-v2.
WSSO-DETR achieved a performance comparable to or even better than some of the fully supervised oriented object detectors on certain extremely slender object categories, mainly because of the strong geometric priors of slender objects, especially their relatively stable long-axis orientations. Although horizontal bounding boxes do not directly provide rotated boxes or angle annotations, their diagonals can still provide approximate object scale and orientation constraints. Accordingly, the proposed OORPG module generates reference points from these diagonals, offering effective initial geometric guidance for constructing object edge point sets under weak supervision and improving the oriented localization process for extremely slender objects. In contrast, fully supervised methods, despite relying on oriented bounding-box annotations, may still suffer from annotation noise, unstable angle regression processes, and feature alignment difficulties caused by extreme aspect ratios; thus, fully supervised methods do not necessarily outperform weakly supervised methods across all slender object categories.
4.5. Visualization Results
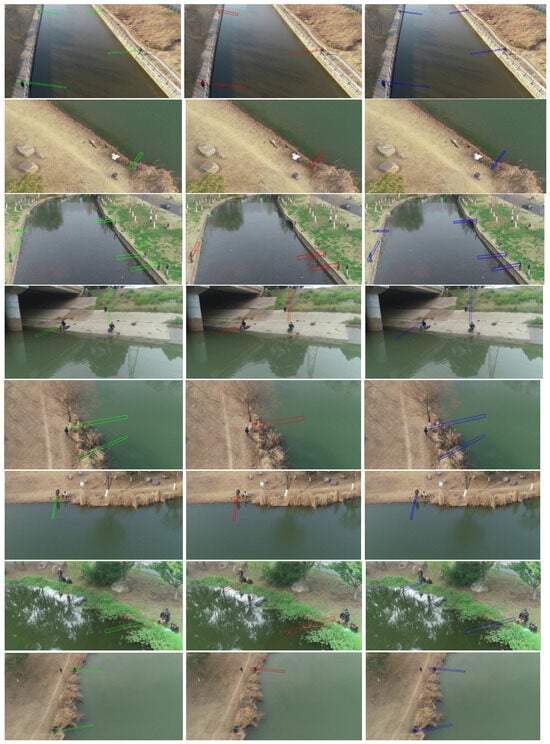
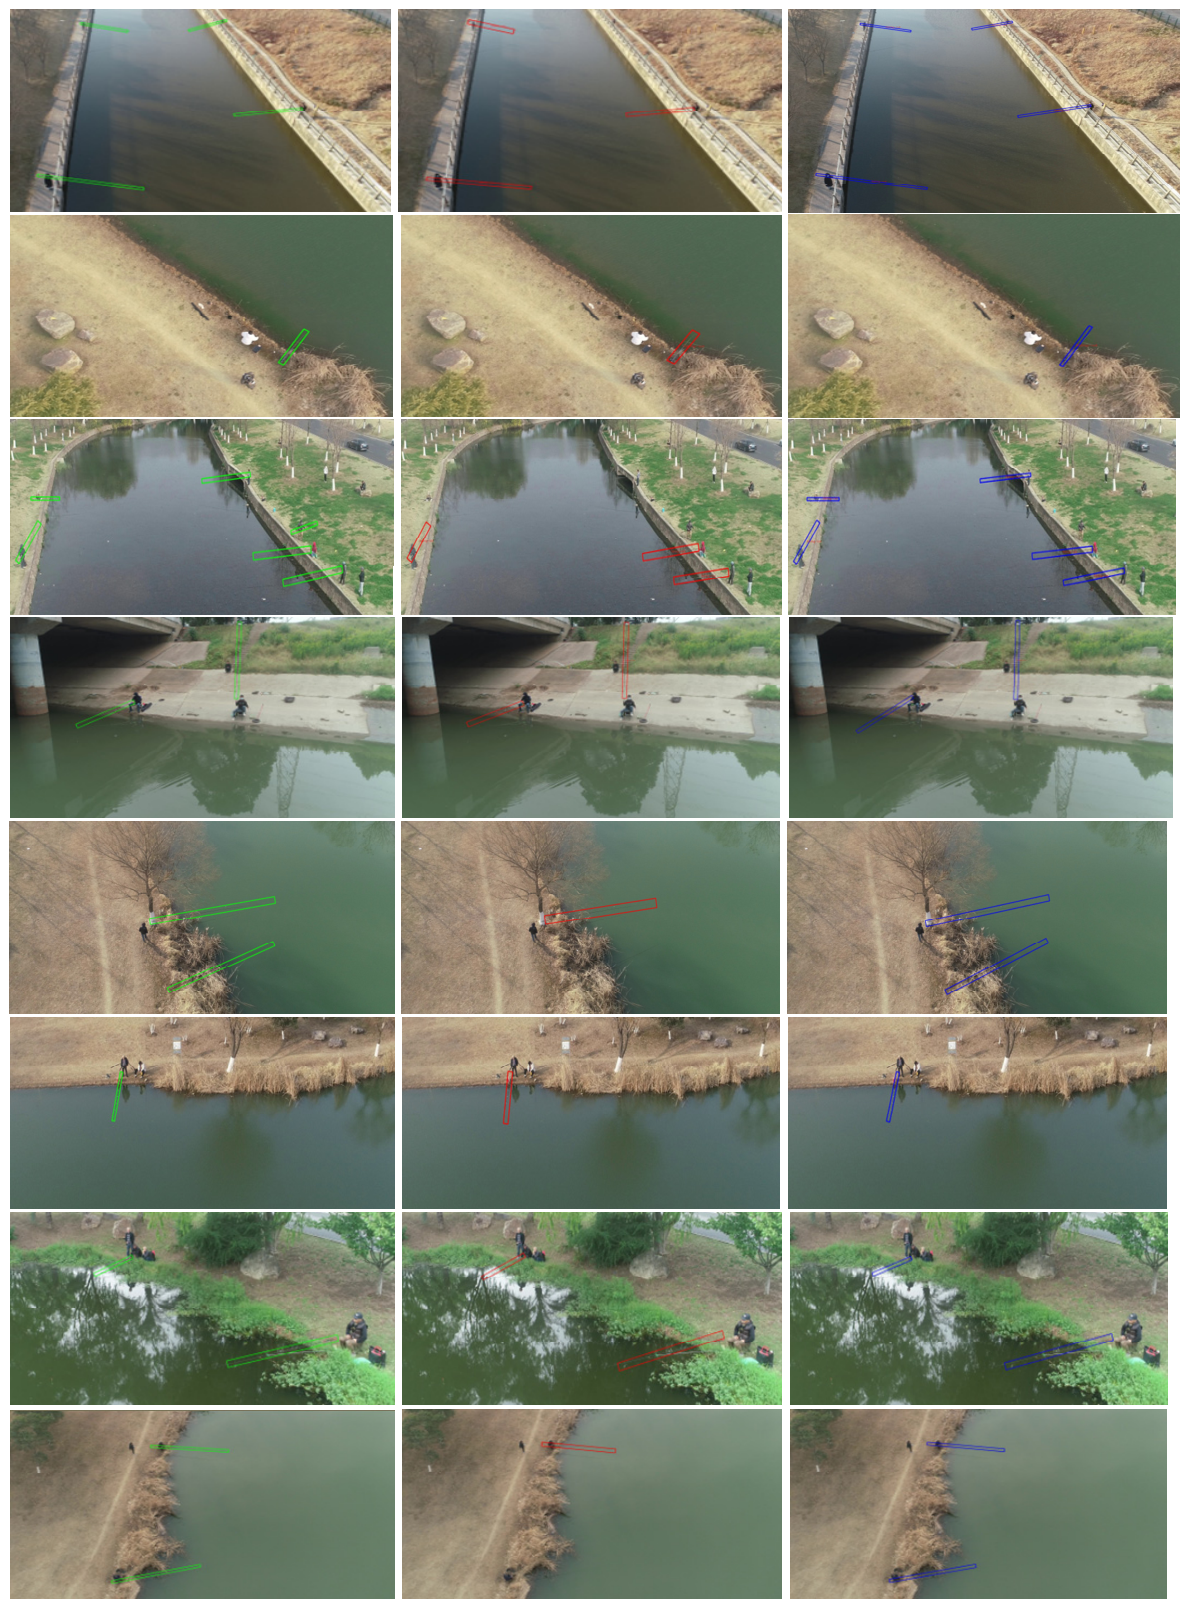
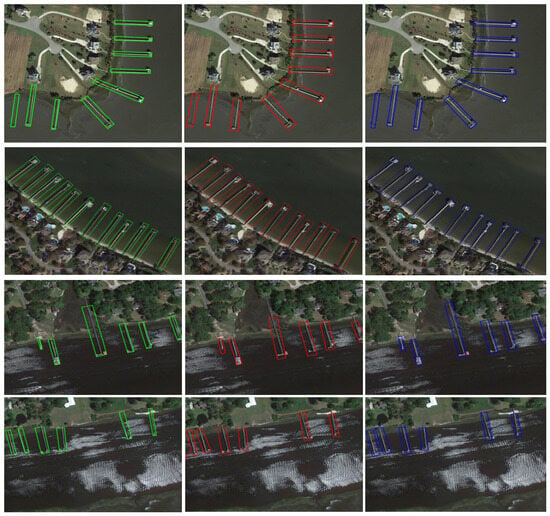
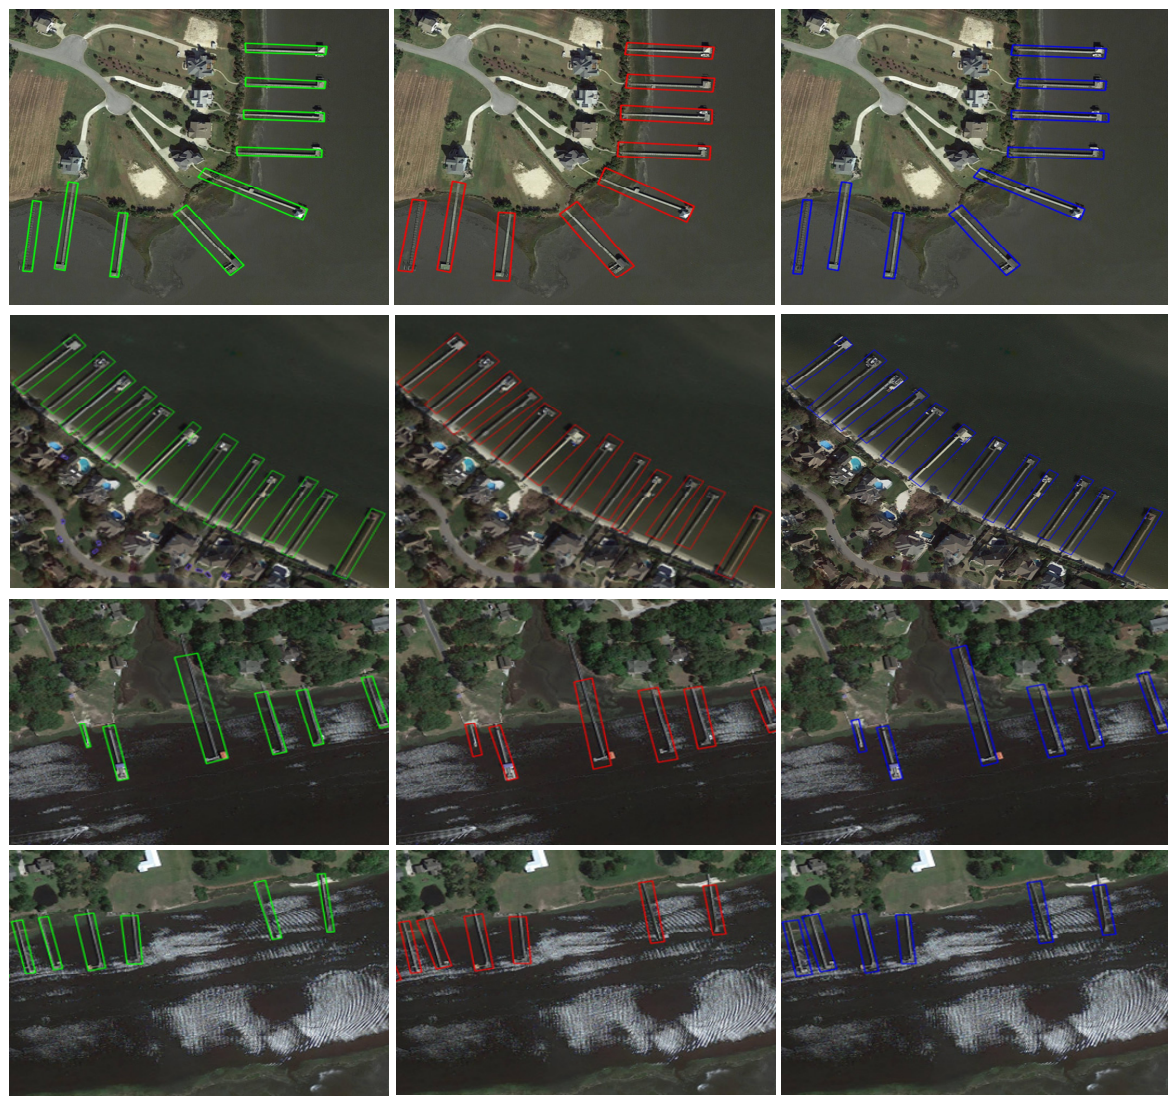
In Figure 6, the first to third columns show the labels, the results of H2RBox-v2, and the results of WSSO-DETR, respectively. Comparing the visualization results of fishing rods shown in Figure 6, WSSO-DETR exhibited a lower missed detection rate than H2RBox-v2. Specifically, in the first, third, fourth, and eighth rows of Figure 6, H2RBox-v2 missed 1, 3, 1, and 1 fishing rods, respectively, while the detection results of WSSO-DETR were more consistent with the labels. Moreover, WSSO-DETR outperformed H2RBox-v2 in predicting both the scale and orientation of fishing rods.
Figure 6.
Visualization results of fishing rods.
Comparing the visualization results for harbor in Figure 7, it can be observed that neither WSSO-DETR nor H2RBox-v2 produced missed or false detections. However, compared with H2RBox-v2, the oriented bounding boxes generated by WSSO-DETR fit the actual shapes of the harbors more closely. Specifically, these include the fourth and fifth harbors from left to right in the first-row image, the second and third harbors from right to left in the second-row image, and the third and fourth harbors from left to right in the third-row image.
Figure 7.
Visualization of harbor detection results on the DOTA-v1.0 dataset.
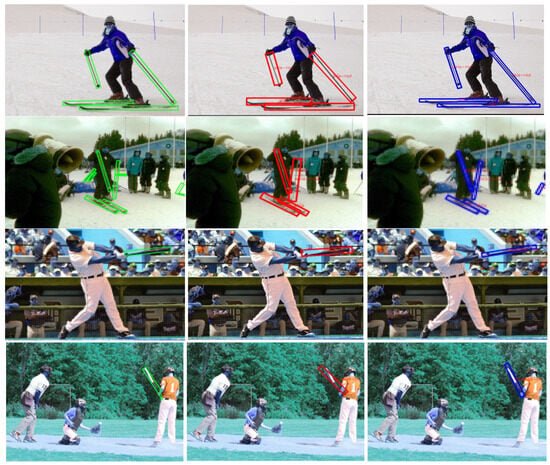
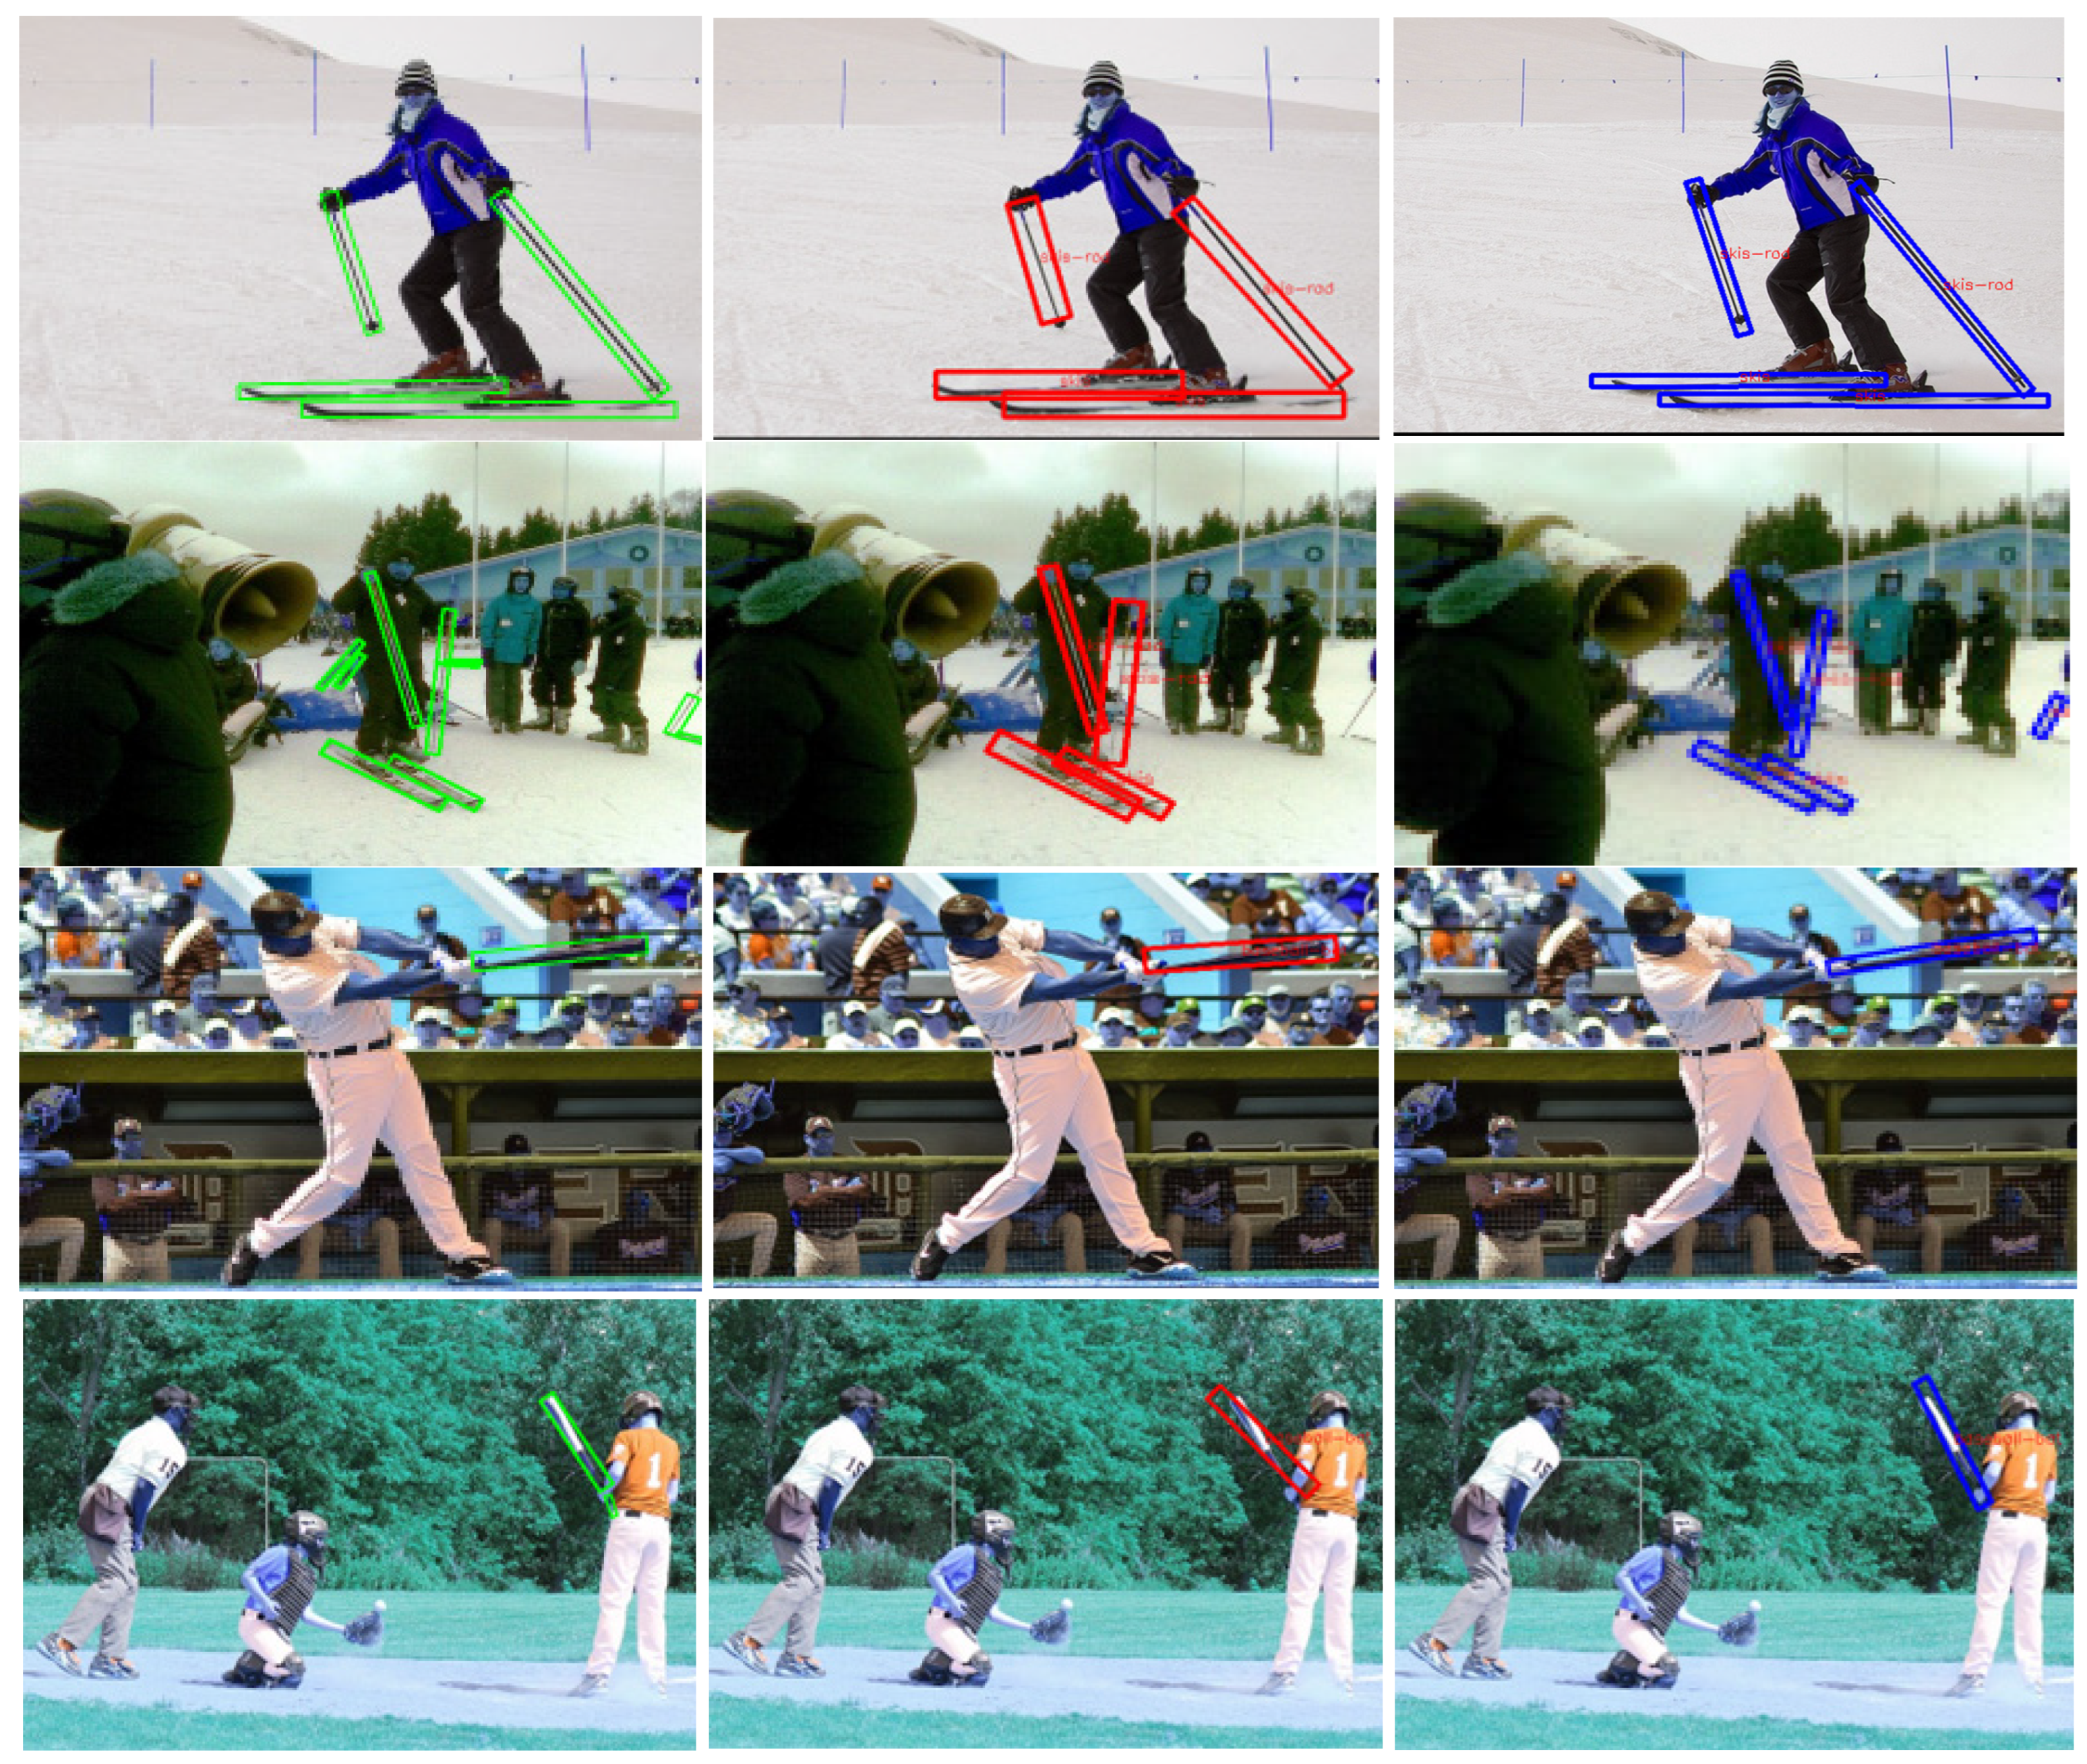
Comparing the visualization results for skis, ski rods, and baseball bats in Figure 8, it can be observed that H2RBox-v2 missed the rightmost ski rod in the second-row image. Moreover, compared with H2RBox-v2, WSSO-DETR predicted the scale and orientation of slender objects more accurately. For example, for the ski rod held in the person’s right hand in the first-row image, the ski rod held in the person’s right hand in the second-row image, and the baseball bats held by the people in the third- and fourth-row images, the scales and orientations of the oriented bounding boxes generated by H2RBox-v2 deviated from those of the slender objects. In contrast, the oriented bounding boxes generated by WSSO-DETR more closely matched the actual shapes and orientations of these rod-like objects.
Figure 8.
Visualization of detection results for rod-shaped objects on the Slender COCO dataset.
5. Conclusions
In this study, an oriented object reference point set generation (OORPG) module and an oriented object scaled self-supervised loss were proposed, which together form WSSO-DETR. Comparative experiments conducted on three datasets show that WSSO-DETR has an accuracy advantage in terms of detecting slender objects. The proposed method approximates the overall principal direction of a fishing rod using the diagonal of its horizontal bounding box. It is therefore more suitable for targets with elongated shapes and clear orientations and maintains a certain degree of adaptability to slight and moderate bending. However, under severe bending or deformation conditions, the diagonal may fail to accurately represent the actual long axis of the fishing rod, resulting in localization errors and unstable direction estimates. Future work will incorporate methods such as instance segmentation, keypoint detection, or centerline modeling to improve the ability of the model to handle severely deformed fishing rods.
Author Contributions
Conceptualization, R.Y.; investigation, R.Y.; formal analysis, H.Z., X.R., S.L. and S.T.; writing—original draft, R.Y.; writing—review and editing, M.W.; supervision, M.W. All authors have read and agreed to the published version of the manuscript.
Funding
This work was supported by the National Natural Science Foundation of China under grant no. 42071301.
Data Availability Statement
The data that support the findings of this research are available from the corresponding author upon reasonable request.
Acknowledgments
During the preparation of this manuscript, the authors used ChatGPT-5.6-sol for the purposes of polishing academic language, improving sentence structure, and correcting grammatical errors. The authors have reviewed and edited the output and take full responsibility for the content of this publication.
Conflicts of Interest
The authors declare no conflicts of interest.
References
- Luo, T.; Guan, S.S.-U.; Yang, R.; Smith, J.S. From Detection to Understanding: A Survey on Representation Learning for Human-Object Interaction. Neurocomputing 2023, 543, 126243. [Google Scholar] [CrossRef] [Scilit]
- Bist, R.B.; Chai, L.; Subedi, S.; Tian, Y.; Wang, D. Enhancing Poultry Multi-Behavior Detection with Semi-Supervised Auto-Labeling and Prompt-Driven Zero-Shot Recognition. Comput. Electron. Agric. 2026, 240, 111178. [Google Scholar] [CrossRef] [Scilit]
- Wang, Z.; Li, L.; Zeng, C.; Dong, S.; Sun, J. SLBDetection-Net: Towards Closed-Set and Open-Set Student Learning Behavior Detection in Smart Classroom of K-12 Education. Expert Syst. Appl. 2025, 260, 125392. [Google Scholar] [CrossRef] [Scilit]
- Chen, Z.; Jiang, Z.; Guan, Q.; Ma, X. End-to-End Motion Detection via Multi-Scale Spatial-Temporal Feature Fusion for Dual-View 3D Macaque Behavior Quantification. Expert Syst. Appl. 2026, 299, 129765. [Google Scholar] [CrossRef] [Scilit]
- Chen, J.; He, J.; Wang, Y.; Lu, P.; Li, H. MRU-YOLO: Marginal-Utility-Guided Selective Local Re-Observation for Small-Object Detection in UAV Imagery. Remote Sens. 2026, 18, 2680. [Google Scholar] [CrossRef] [Scilit]
- Zou, R.; Guo, J.; Liang, J.; Che, K.; Deng, Y.; Chen, B. CDF-DETR: Cross-Stage Attention and Dual-Scale Feature Calibration for Small-Object Detection in UAV Remote Sensing Imagery. Remote Sens. 2026, 18, 2793. [Google Scholar] [CrossRef] [Scilit]
- Hussain, S.; Mumtaz, I.; Ahmad, U.; Li, L.; Jia, Z.; Lv, M.; Zhao, X.; Ma, H.; Wang, C. CGWT-DETR: Context-Guided Wavelet Transform DETR for Small Object Detection in Aerial RGB and Thermal Infrared Imagery. Remote Sens. 2026, 18, 2715. [Google Scholar] [CrossRef] [Scilit]
- Zhang, H.; Sun, H.; Sun, X.; Gao, H.; Yu, H.; Zhang, B. SPG-OD: Spectral-Prior-Guided Object Detection for Hyperspectral Remote Sensing Images. IEEE Trans. Geosci. Remote Sens. 2026, 64, 5523115. [Google Scholar] [CrossRef] [Scilit]
- Zhang, H.; Sun, H.; Gao, H.; Gao, L.; Zhang, B. Hyperspectral Remote Sensing Object Detection via Cross-Domain Learning From Visible Images. IEEE Trans. Geosci. Remote Sens. 2026, 64, 5510518. [Google Scholar] [CrossRef] [Scilit]
- Wang, D.; Zhuang, L.; Gao, L.; Sun, X.; Zhao, X.; Plaza, A. Sliding Dual-Window-Inspired Reconstruction Network for Hyperspectral Anomaly Detection. IEEE Trans. Geosci. Remote Sens. 2024, 62, 5504115. [Google Scholar] [CrossRef] [Scilit]
- Yang, X.; Zhou, Y.; Zhang, G.; Yang, J.; Wang, W.; Yan, J.; Zhang, X.; Tian, Q. The KFIoU Loss for Rotated Object Detection. In Proceedings of the International Conference on Learning Representations, Kigali, Rwanda, 1–5 May 2023. [Google Scholar]
- Yu, Y.; Da, F. Phase-Shifting Coder: Predicting Accurate Orientation in Oriented Object Detection. In Proceedings of the IEEE/CVF Conference on Computer Vision and Pattern Recognition, Vancouver, BC, Canada, 18–22 June 2023; pp. 13354–13363. [Google Scholar]
- Xu, C.; Ding, J.; Wang, J.; Yang, W.; Yu, H.; Yu, L.; Xia, G.-S. Dynamic Coarse-to-Fine Learning for Oriented Tiny Object Detection. In Proceedings of the IEEE/CVF Conference on Computer Vision and Pattern Recognition, Vancouver, BC, Canada, 18–22 June 2023; pp. 7318–7328. [Google Scholar]
- Xie, X.; Cheng, G.; Wang, J.; Yao, X.; Han, J. Oriented R-CNN for Object Detection. In Proceedings of the IEEE/CVF International Conference on Computer Vision, Virtual, 11–17 October 2021; pp. 3500–3509. [Google Scholar]
- Nie, G.; Huang, H. Multi-Oriented Object Detection in Aerial Images with Double Horizontal Rectangles. IEEE Trans. Pattern Anal. Mach. Intell. 2023, 45, 4932–4944. [Google Scholar] [CrossRef] [Scilit] [PubMed]
- Qian, W.; Yang, X.; Peng, S.; Yan, J.; Guo, Y. Learning Modulated Loss for Rotated Object Detection. In Proceedings of the AAAI Conference on Artificial Intelligence, Virtual, 2–9 February 2021; pp. 2458–2466. [Google Scholar]
- Ming, Q.; Miao, L.; Zhou, Z.; Yang, X.; Dong, Y. Optimization for Arbitrary-Oriented Object Detection via Representation Invariance Loss. IEEE Geosci. Remote Sens. Lett. 2022, 19, 1–5. [Google Scholar] [CrossRef] [Scilit]
- Li, W.; Chen, Y.; Hu, K.; Zhu, J. Oriented RepPoints for Aerial Object Detection. In Proceedings of the IEEE/CVF Conference on Computer Vision and Pattern Recognition, New Orleans, LA, USA, 19–24 June 2022; pp. 1819–1828. [Google Scholar]
- Chen, Y.; Zhang, Z.; Cao, Y.; Wang, L.; Lin, S.; Hu, H. RepPoints v2: Verification Meets Regression for Object Detection. In Proceedings of the Advances in Neural Information Processing Systems, Virtual, 6–12 December 2020. [Google Scholar]
- Zhao, Z.; Xue, Q.; He, Y.; Bai, Y.; Wei, X.; Gong, Y. Projecting Points to Axes: Oriented Object Detection via Point-Axis Representation. In Proceedings of the European Conference on Computer Vision, Milan, Italy, 29 September–4 October 2024; pp. 161–179. [Google Scholar]
- Wan, Z.; Chen, Y.; Deng, S.; Yao, C.; Luo, J. Slender Object Detection: Diagnoses and Improvements. arXiv 2020, arXiv:2011.08529. [Google Scholar]
- Wen, F.; Wang, M.; Hu, X. DFAM-DETR: Deformable Feature Based Attention Mechanism DETR on Slender Object Detection. IEICE Trans. Inf. Syst. 2023, 106, 401–409. [Google Scholar] [CrossRef] [Scilit]
- Zhong, B.; Yang, L. Improved YOLOv5 in Remote Sensing Slender and Rotating Target Detection. In Proceedings of the IEEE International Conference on Electrical Engineering, Big Data and Algorithms, Changchun, China, 25–27 February 2022; pp. 918–923. [Google Scholar]
- Xie, H.-G.; Yang, M.; Yan, B.-L.; Hou, K.-Y.; Jiang, D. SRPAR: Anchor-Free Detector with Aspect Ratio Priority for Slender Objects. J. Electron. Imaging 2022, 31, 043001. [Google Scholar] [CrossRef] [Scilit]
- Zhang, Y.; Pu, C.; Niu, M.; Wu, Q.; Sun, W.; Wang, J. Gold Wire Bonding Quality Inspection of Integrated Circuit Based on Slenderness-Rotated Object Detection. IEEE Trans. Instrum. Meas. 2025, 74, 1–16. [Google Scholar] [CrossRef] [Scilit]
- Luo, J.; Yang, X.; Yu, Y.; Li, Q.; Yan, J.; Li, Y. PointOBB: Learning Oriented Object Detection via Single Point Supervision. In Proceedings of the IEEE/CVF Conference on Computer Vision and Pattern Recognition, Seattle, WA, USA, 17–21 June 2024; pp. 16730–16740. [Google Scholar]
- Ren, B.; Yang, X.; Yu, Y.; Luo, J.; Deng, Z. PointOBB-v2: Towards Simpler, Faster, and Stronger Single Point Supervised Oriented Object Detection. In Proceedings of the International Conference on Learning Representations, Singapore, 24–28 April 2025. [Google Scholar]
- Zhang, P.; Luo, J.; Yang, X.; Yu, Y.; Li, Q.; Zhou, Y.; Jia, X.; Lu, X.; Chen, J.; Li, X.; et al. PointOBB-v3: Expanding Performance Boundaries of Single Point-Supervised Oriented Object Detection. Int. J. Comput. Vis. 2025, 133, 6108–6128. [Google Scholar] [CrossRef] [Scilit]
- Yu, Y.; Yang, X.; Li, Q.; Da, F.; Dai, J.; Qiao, Y.; Yan, J. Point2RBox: Combine Knowledge from Synthetic Visual Patterns for End-to-End Oriented Object Detection with Single Point Supervision. In Proceedings of the IEEE/CVF Conference on Computer Vision and Pattern Recognition, Seattle, WA, USA, 17–21 June 2024; pp. 16783–16793. [Google Scholar]
- Yu, Y.; Ren, B.; Zhang, P.; Liu, M.; Luo, J.; Zhang, S.; Da, F.; Yan, J.; Yang, X. Point2RBox-v2: Rethinking Point-Supervised Oriented Object Detection with Spatial Layout Among Instances. In Proceedings of the IEEE/CVF Conference on Computer Vision and Pattern Recognition, Nashville, TN, USA, 10–17 June 2025; pp. 19283–19293. [Google Scholar]
- Zhang, T.; Fan, Z.; Liu, M.; Zhang, X.; Lu, X.; Li, W.; Zhou, Y.; Yu, Y.; Li, X.; Yan, J.; et al. Point2RBox-v3: Self-Bootstrapping from Point Annotations via Integrated Pseudo-Label Refinement and Utilization. arXiv 2025, arXiv:2509.26281. [Google Scholar]
- Yang, X.; Zhang, G.; Li, W.; Zhou, Y.; Wang, X.; Yan, J. H2RBox: Horizontal Box Annotation Is All You Need for Oriented Object Detection. In Proceedings of the International Conference on Learning Representations, Kigali, Rwanda, 1–5 May 2023. [Google Scholar]
- Yu, Y.; Yang, X.; Li, Q.; Zhou, Y.; Da, F.; Yan, J. H2RBox-v2: Incorporating Symmetry for Boosting Horizontal Box Supervised Oriented Object Detection. In Proceedings of the Advances in Neural Information Processing Systems, New Orleans, LA, USA, 10–16 December 2023. [Google Scholar]
- Lee, W.; Chang, H.; Moon, J.; Lee, J.; Kim, M. ABBSPO: Adaptive Bounding Box Scaling and Symmetric Prior Based Orientation Prediction for Detecting Aerial Image Objects. In Proceedings of the IEEE/CVF Conference on Computer Vision and Pattern Recognition, Nashville, TN, USA, 10–17 June 2025; pp. 8848–8858. [Google Scholar]
- Xia, G.-S.; Bai, X.; Ding, J.; Zhu, Z.; Belongie, S.J.; Luo, J.; Datcu, M.; Pelillo, M.; Zhang, L. DOTA: A Large-Scale Dataset for Object Detection in Aerial Images. In Proceedings of the IEEE/CVF Conference on Computer Vision and Pattern Recognition, Salt Lake City, UT, USA, 18–22 June 2018; pp. 3974–3983. [Google Scholar]
- Lin, T.-Y.; Maire, M.; Belongie, S.J.; Hays, J.; Perona, P.; Ramanan, D.; Dollár, P.; Zitnick, C.L. Microsoft COCO: Common Objects in Context. In Proceedings of the European Conference on Computer Vision, Zurich, Switzerland, 6–12 September 2014; pp. 740–755. [Google Scholar]
- Ding, Z.; Zhou, Y.; Zhao, J.; Du, W.-L.; Li, X.; Yao, R.; El Saddik, A. Real-Time Oriented Object Detection Transformer in Remote Sensing Images. IEEE Trans. Geosci. Remote Sens. 2026, 64, 1–14. [Google Scholar] [CrossRef] [Scilit]

Disclaimer/Publisher’s Note: The statements, opinions and data contained in all publications are solely those of the individual author(s) and contributor(s) and not of MDPI and/or the editor(s). MDPI and/or the editor(s) disclaim responsibility for any injury to people or property resulting from any ideas, methods, instructions or products referred to in the content. |
© 2026 by the authors. Licensee MDPI, Basel, Switzerland. This article is an open access article distributed under the terms and conditions of the Creative Commons Attribution (CC BY) license.