


Highlights
What are the main findings?
- Over 1980–2025, Central Asian summer precipitation shows a significant decreasing trend of −0.376 mm/season per year (p = 0.031), with a statistically significant change point in 2006; the regional mean declined by 15.75% after the change point (from 102.86 to 86.66 mm/season).
- VIF and LASSO screening identify four candidate variables for summer precipitation: PDO, ONI, TNI, and TSA. The OLS model explains 34.8% of the variance (R2 = 0.348), with standardized coefficients ranking ONI > PDO > TSA > TNI. Partial-correlation analysis shows that PDO, ONI, and TNI attain statistically significant values (FDR q < 0.05), whereas TSA is not significant following FDR correction (q = 0.061).
What are the implications of the main findings?
- The ocean–atmosphere physical linkage governing precipitation variability over arid Central Asia is clarified from a circulation perspective.
- Findings support climate risk assessment and transboundary water management in water-stressed Central Asia.
Abstract
Central Asia, as a typical arid and semi-arid region, experiences precipitation variability that critically influences water security and ecological balance. Based on ERA5-Land reanalysis data and 14 large-scale climate indices from 1980 to 2025, this study investigates the spatiotemporal evolution of summer precipitation and its physical attribution by employing the Mann–Kendall trend test, Pettitt change-point detection, variance inflation factor (VIF), least absolute shrinkage and selection operator (LASSO), partial correlation analysis, multiple linear regression, and composite analysis. Summer precipitation shows a statistically significant decreasing trend of −0.376 mm/season per year (p = 0.031), with a significant change point in 2006; the regional mean declined by 15.75% after the change point. VIF and LASSO screening identify four candidate variables: the Pacific Decadal Oscillation (PDO), the Oceanic Niño Index (ONI), the Trans-Niño Index (TNI), and the Tropical Southern Atlantic Index (TSA). The multiple linear regression model explains 34.8% of the variance in summer precipitation (R2 = 0.348, p = 0.0013), ranking ONI > PDO > TSA > TNI based on absolute standardized coefficients. PDO is positively correlated with summer precipitation, whereas ONI, TNI, and TSA are negatively correlated. PDO, ONI, and TNI are statistically significant after FDR correction (q < 0.05), while TSA is not significant (q = 0.061). Composite analysis reveals distinct 500 hPa circulation anomalies during positive and negative phases of ONI, PDO, and TNI over Central Asia, providing a circulation-based interpretation of their influence on summer precipitation. This study identifies PDO, ENSO-related Pacific SST modes (ONI and TNI), and TSA as variables linked to summer precipitation in Central Asia, providing scientific support for regional climate monitoring and water resource management.
1. Introduction
Central Asia is one of the largest inland arid and semi-arid systems in the world, and its hydrological cycle is highly sensitive to large-scale climate forcing [1]. Stretching from Kazakhstan to the western part of Xinjiang, China, the region is characterised by severe water scarcity [2]. It has been well established that its agricultural irrigation and ecological maintenance rely heavily on atmospheric precipitation [3,4]. In recent years, competition for water resources in transboundary rivers, such as the Syr Darya and Amu Darya, has intensified among Central Asian countries. There is growing evidence that water scarcity has become a key factor affecting regional geopolitical stability and socio-economic development [5]. Against this background, a precise understanding of the long-term evolution of summer precipitation in Central Asia and its underlying physical mechanisms is of significant scientific value. It is also practically important for safeguarding regional food security, mitigating water resource conflicts, and formulating policies to adapt to climate change.
Many studies, based on weather stations, reanalysis products and satellite data, have examined precipitation changes in Central Asia [1]. These studies have revealed clear spatiotemporal differences in precipitation trends. For example, previous research has suggested that annual precipitation over Central Asia has followed a weakly increasing trend during the late 20th century, but this trend is not spatially uniform: precipitation increased in the Tien Shan mountains but decreased in the Turan Plain [6,7]. However, early research in this area has largely concentrated on the frequency of extreme precipitation events or the long-term evolution of annual and winter precipitation [8,9], while systematic analysis of summer precipitation remains insufficient. Summer precipitation is one of the main water sources for Central Asian rivers; its amount directly affects glacier melt rates, irrigation scheduling and transboundary water allocation [3]. Therefore, neglecting summer precipitation severely limits our understanding of the regional water balance. Moreover, existing results on precipitation trends are still controversial. Different datasets sometimes give opposite conclusions [10]. This inconsistency originates not only from biases in the data sources themselves but also from the high complexity of regional precipitation changes. These changes are controlled by multiple large-scale circulation systems, and the relative importance of these systems may change over time [11]. Consequently, it is urgent to use longer-term and higher-resolution reanalysis data together with multiple statistical methods. This will allow us to re-evaluate the long-term evolution of summer precipitation in Central Asia and to identify potential change points.
In terms of large-scale circulation attribution, previous studies have shown that the North Atlantic Oscillation (NAO), the Arctic Oscillation (AO) and the subtropical westerly jet have significant impacts on Central Asian precipitation [11,12]. For instance, the NAO can reduce spring precipitation in Central Asia by exciting a Eurasian wave train. The phase shift in the AO is linked to the dry/wet conditions in Central Asian winters. In addition, the decadal shift in the subtropical westerly jet is also considered to be related to precipitation anomalies in Central Asia [13]. However, most of these studies focus on interannual variability or specific seasons, and systematic attribution for summer precipitation is still very limited. More recently, tropical Pacific sea surface temperature (SST) modes, especially the Pacific Decadal Oscillation (PDO) [14], have been identified as an important background field driving Eurasian climate anomalies [1]. For example, the positive phase of the PDO is associated with a deepened East Asian trough and a strengthened Siberian high, leading to autumn cooling over Eurasia [15]. In addition, the Trans-Niño Index (TNI), which describes the zonal gradient of equatorial Pacific SST, has received little attention regarding its influence on summer precipitation in Central Asia.
Regarding research methods, previous attribution analyses have mostly been limited to traditional linear correlation [7]. Such methods have difficulty handling collinearity among climate indices and cannot adequately distinguish the independent contribution of each predictor [16,17]. For summer precipitation in Central Asia, where the sample size is limited and the climate indices are highly intercorrelated [16], a more robust statistical framework is therefore needed. Among the available approaches, the variance inflation factor (VIF) is commonly used to quantify collinearity among predictors, and the least absolute shrinkage and selection operator (LASSO) performs variable selection by shrinking irrelevant coefficients toward zero [16,18]. Partial correlation analysis with effective degrees of freedom, together with false discovery rate (FDR) control, can further assess the independent contribution of each predictor [19,20], while multiple linear regression and blocked cross-validation are widely used for attribution, variable ranking, and temporal robustness assessment [21]. For the physical mechanism, previous studies have been limited to statistical correlations, and a complete dynamic pathway from SST anomalies to regional moisture transport has not been revealed through circulation anomaly composite analysis [22,23,24].
To fill these research gaps, this study uses ERA5-Land precipitation data and ERA5 circulation data, together with 14 large-scale climate indices, for the period 1980–2025. It adopts a framework of “trend and change-point detection–collinearity diagnosis and variable selection–partial correlation and multiple regression–circulation composite analysis”. The core scientific questions are as follows: (1) to determine the long-term trend and change point of summer precipitation in Central Asia; (2) to identify the key circulation factors among the 14 indices and to assess their relative importance using VIF, LASSO, partial correlation, and multiple linear regression; (3) to reveal, through composite analysis, the 500 hPa circulation anomalies associated with these key variables, thereby explaining their physical linkage with summer precipitation. The results of this study will provide a solid physical basis for decadal climate prediction and drought warning in Central Asia.
2. Materials and Methods
2.1. Study Area
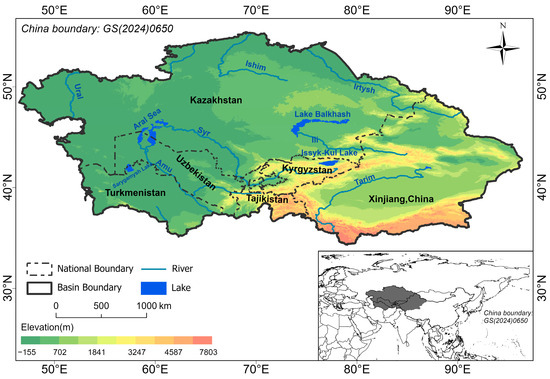
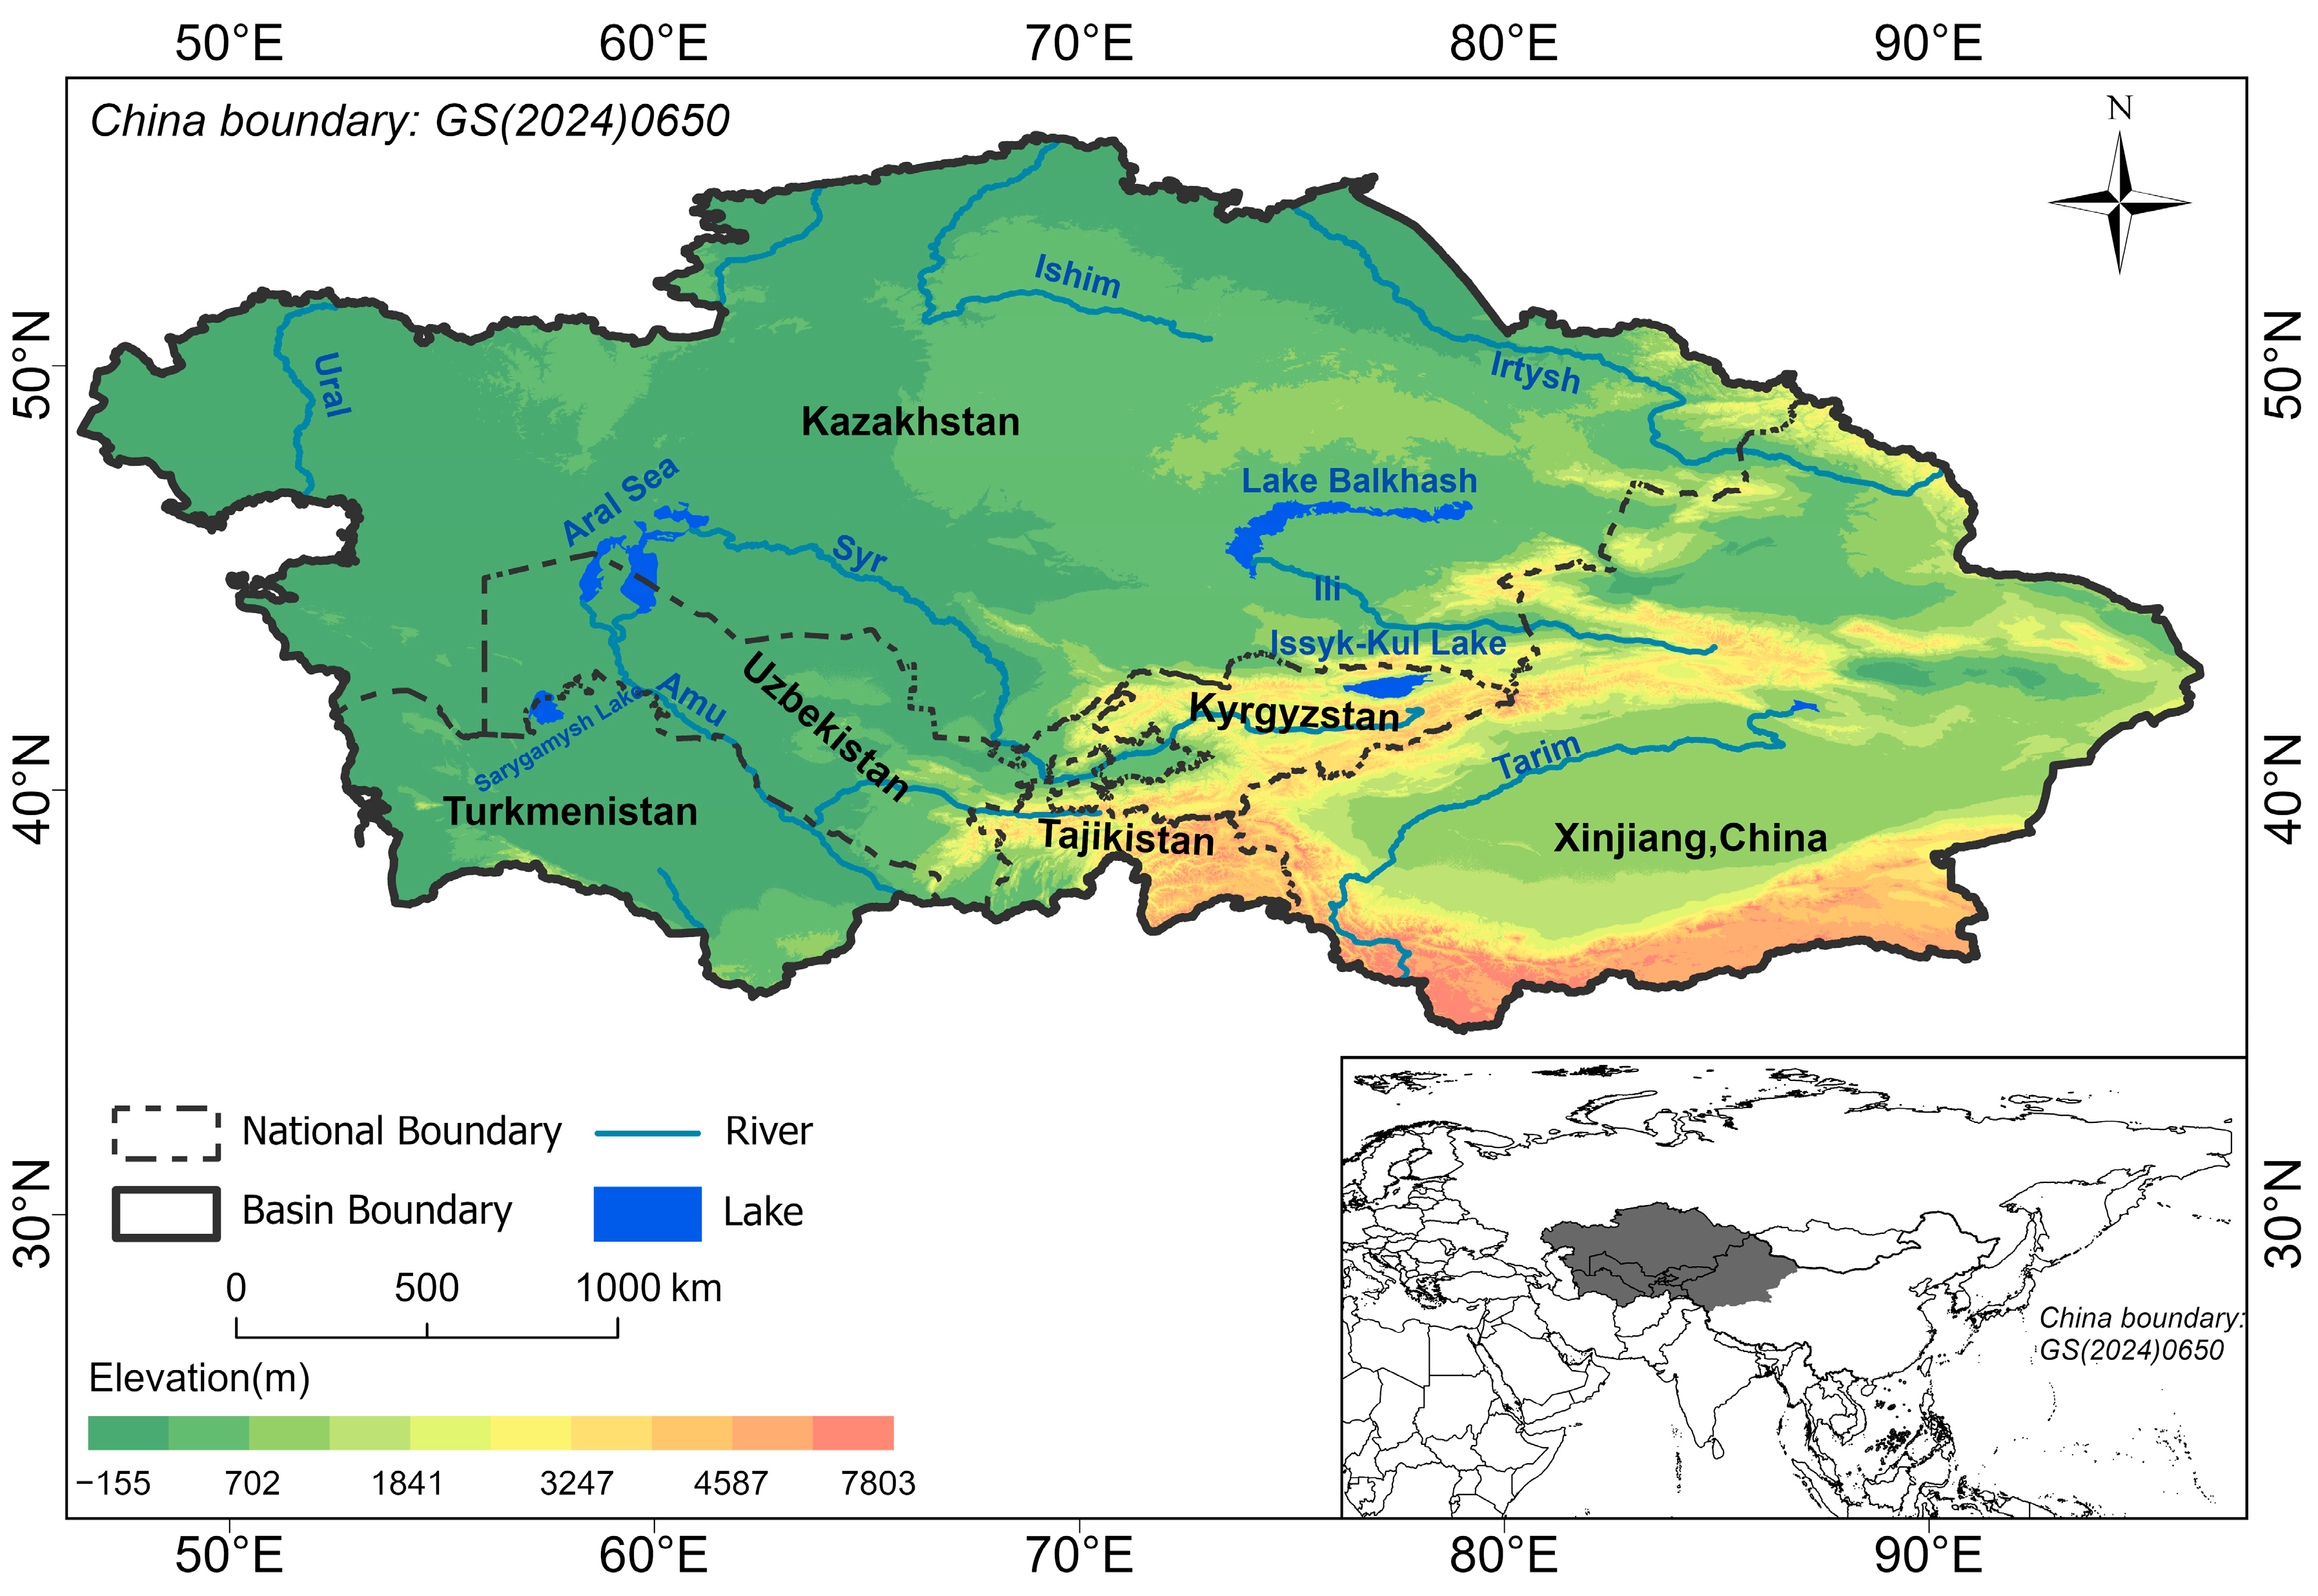
Following the definition of Central Asia adopted by Wei et al. [9], the study area is situated in the heart of the Eurasian continent (35–55°N, 46–96°E), encompassing Kazakhstan, Kyrgyzstan, Tajikistan, Turkmenistan, Uzbekistan, and the western part of Xinjiang, China. Topographically, the region is characterized by rugged relief. The Tien Shan Mountains and the Pamir Plateau, known as the “water tower of Central Asia,” lie in the southeast, with the terrain gradually transitioning westward into the vast Turan Plain and the Caspian Basin [4,25] (Figure 1). Climatically, owing to its inland location and topographic barriers, the region is dominated by the mid-latitude westerlies and exhibits typical arid and semi-arid characteristics, alongside a highly uneven spatial distribution of annual precipitation [26,27]. Moreover, summer precipitation serves as a crucial water source for the region, playing a decisive role in sustaining the fragile oasis agriculture and desert ecosystems [25]. Therefore, understanding the evolution of summer precipitation in this region holds great scientific value for addressing climate change-induced water deficit risks [6,28].
Figure 1.
The study area.
2.2. Datasets
2.2.1. Precipitation Data
The monthly precipitation data used in this study were obtained from the ERA5-Land reanalysis produced by ECMWF [29]. These data were downloaded from the Copernicus Climate Data Store (CDS) at https://cds.climate.copernicus.eu/datasets/reanalysis-era5-land-monthly-means?tab=download (accessed on 1 October 2026) in NetCDF format, with a spatial resolution of 0.1° × 0.1° and temporal coverage from January 1980 to December 2025. Compared to the standard ERA5 product, ERA5-Land offers higher spatial resolution and a more refined representation of land-surface processes, which is advantageous for capturing orographically induced precipitation in the complex terrain of Central Asia [29]. To extract summer precipitation, we selected data for June, July, and August of each year. Monthly precipitation was converted from m/day to mm/day (multiplied by 1000) and then multiplied by the number of days in each month (30 days for June, 31 for July, and 31 for August) to obtain the annual summer total precipitation in mm/season.
The ERA5-Land precipitation was validated against ground-based observations from the Global Historical Climatology Network Daily (GHCN-Daily, GHCNd) dataset provided by the National Centers for Environmental Information (NCEI) of the National Oceanic and Atmospheric Administration (NOAA) (https://www.ncei.noaa.gov/products/land-based-station/global-historical-climatology-network-daily) (accessed on 1 October 2026). Following rigorous quality control, 97 stations were retained. Validation was performed, yielding good agreement with observations (MAE = 14.11 mm, RMSE = 19.50 mm, R2 = 0.573). Detailed validation results by elevation group are provided in the Supplementary Material, Table S1.
2.2.2. Upper-Level Circulation Data
The 500 hPa geopotential height, temperature, and wind (u and v components) data used for the mechanism analysis were obtained from the ERA5 reanalysis dataset [30,31,32]. These data were downloaded from the Copernicus Climate Data Store (CDS) at https://cds.climate.copernicus.eu/datasets/reanalysis-era5-pressure-levels-monthly-means?tab=download (accessed on 1 October 2026) in NetCDF format, with a spatial resolution of 0.25° × 0.25° and monthly temporal resolution, covering the period 1980–2025. For the composite analysis, we selected years in which the index of interest exceeded 0.5 (positive phase) or fell below −0.5 (negative phase), and extracted the corresponding 500 hPa variables for June–August of those years.
2.2.3. Climate Indices
To identify the key large-scale circulation factors influencing summer precipitation in Central Asia, we selected 14 large-scale climate indices provided by the Physical Sciences Laboratory (PSL) of the National Oceanic and Atmospheric Administration (NOAA) (https://psl.noaa.gov/data/climateindices/list/) (accessed on 1 October 2026). These indices include the AAO, AO, EA/WR, MEI, NAO, ONI, PDO, PNA, SOI, TNA, TNI, TSA, WHWP, and WP, covering the main climate modes of the Pacific, Atlantic, and polar regions. Each index was obtained as monthly mean data in plain text format. All 14 indices share a common period of 1980–2025, and the summer (June–August) average of each index was computed to align with the summer precipitation series. The selection of these 14 indices was guided by numerous studies demonstrating their significant associations with the Eurasian climate [7,9,12,33,34]; furthermore, these indices are relatively independent and have clear physical meanings, making them suitable for multi-factor comparison and attribution analysis [17,35]. Detailed information on each index, including its full name and abbreviation, is provided in Table S2 of the Supplementary Material.
2.3. Methods
2.3.1. Trend Analysis
The long-term trend of summer precipitation was estimated using the non-parametric Theil–Sen slope estimator [36], which is robust to outliers and suitable for climate time series. The slope is defined as the median of all pairwise slopes:
where and are summer precipitation values in years and . The statistical significance of the trend was assessed using the Mann–Kendall test [37,38]; the detailed test statistic and its variance are provided in the Supplementary Material (Equations (S1) and (S2)).
2.3.2. Change-Point Detection
A single change point in the summer precipitation series was detected using the Pettitt test, a non-parametric approach based on the Mann–Whitney statistic [39] that does not require any assumption about the data distribution [40]. The test identifies the year where the absolute value of the statistic reaches its maximum, and the corresponding significance level is approximated. When , the change point is considered statistically significant at the 95% confidence level.
2.3.3. Multicollinearity Diagnosis and Variable Selection
To avoid biased attribution caused by collinearity among the climate indices, we first computed the Pearson correlation matrix of all 14 indices as a preliminary collinearity check. The Pearson correlation coefficient is provided in the Supplementary Material (Equation (S3)). We then calculated the VIF for each index [16]:
where is the coefficient of determination obtained by regressing the -th index on all other indices. Indices with were iteratively removed until all remaining indices had .
We then applied the least absolute shrinkage and selection operator LASSO [41] to further select the most important predictors [18]. The LASSO estimate is obtained by minimizing:
where is the sample size, is the number of predictors, is the penalty parameter, and are the regression coefficients. The optimal was determined by 5-fold cross-validation. Variables with non-zero coefficients were retained for subsequent analyses.
2.3.4. Partial Correlation Analysis
To quantify the independent contribution of each retained index to summer precipitation, we calculated partial correlations between each index and precipitation while controlling for the remaining indices. The effective degrees of freedom () were adjusted for -1 autocorrelation following Bretherton et al. [19]. The significance of each partial correlation was assessed using a two-tailed t-test, and the Benjamini–Hochberg FDR procedure [20] was applied to account for multiple testing. The effective degrees of freedom and the t-test are defined in the Supplementary Material (Equations (S4) and (S5)).
2.3.5. Multiple Linear Regression and Blocked Cross-Validation
A multiple linear regression (ordinary least squares, OLS) model was built using the selected indices as predictors and summer precipitation as the response variable [16]. To assess the temporal robustness of the regression model, we performed a time-series blocked cross-validation [21] with an expanding window. Starting with the first 20 years as the initial training set, the model was iteratively retrained by adding one year at a time and used to predict the following year. This procedure yielded 26 out-of-sample predictions (2000–2025). The predictive skill was quantified by and RMSE computed over all validation years. The formulas for and RMSE are provided in the Supplementary Material (Equations (S6) and (S7)). Standardized regression coefficients () were computed by z-score standardizing both predictors and the response to rank the relative importance of each index.
2.3.6. Composite Analysis
To investigate the circulation anomalies associated with each index, we performed composite analysis of 500 hPa geopotential height, temperature, and wind anomalies [24]. Positive (negative) phase years were defined as those in which the summer index exceeded +0.5 (fell below −0.5). For each phase, the mean anomaly was computed as the difference between the phase mean and the 1980–2025 climatological mean. The statistical significance of each composite anomaly was assessed using a two-tailed Student’s t-test. The same procedure was applied to summer precipitation to obtain the composite precipitation anomalies. All statistical analyses were implemented using Python (version 3.11; Python Software Foundation, Beaverton, OR, USA) and MATLAB (version R2026a; MathWorks, Natick, MA, USA).
3. Results
3.1. Spatiotemporal Evolution of Summer Precipitation
3.1.1. Temporal Variation and Change Point
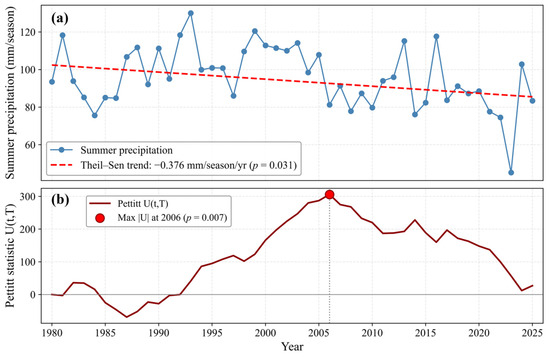
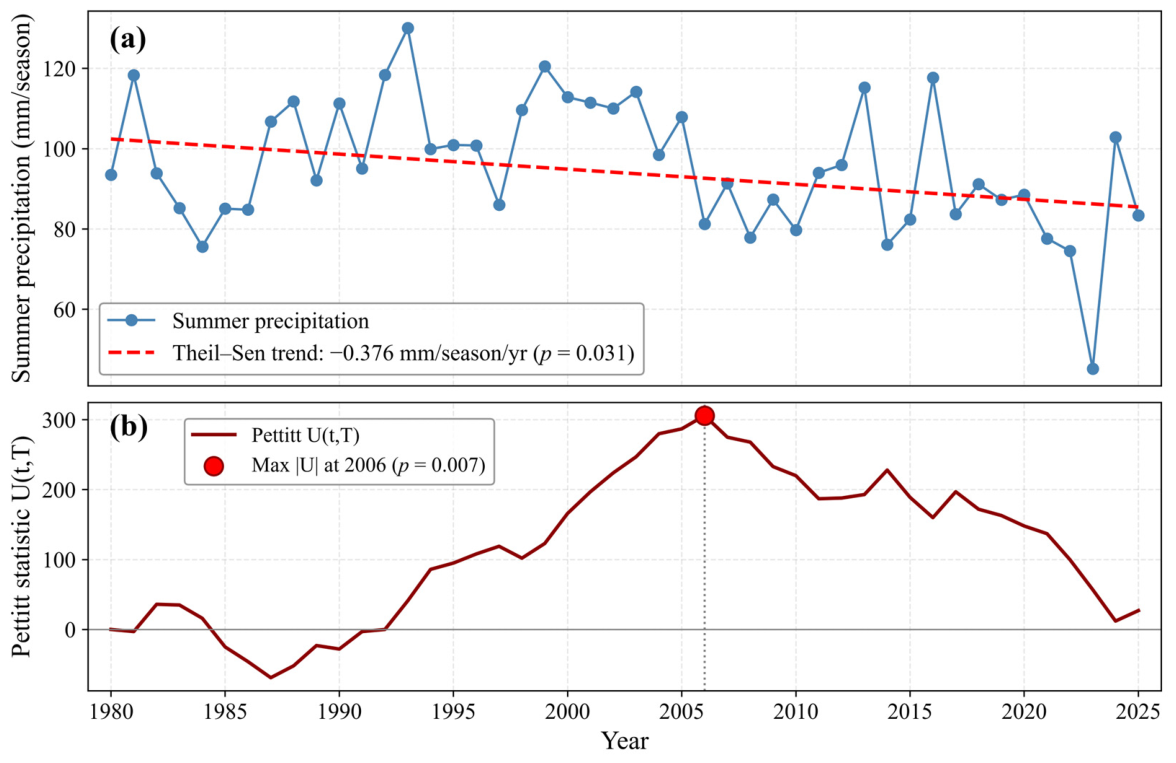
The summer precipitation over Central Asia during 1980–2025 shows a significant decreasing trend, with a Theil–Sen slope of −0.376 mm/season per year (p = 0.031; Figure 2a). Several extreme years are evident in the record. The possible drivers of these extreme years are examined in Section 3.2.
Figure 2.
Summer precipitation in Central Asia (1980–2025): (a) interannual variation and Theil–Sen trend; (b) Pettitt U(t,T) curve indicating the change point in 2006.
The Pettitt test identifies 2006 as the most significant change point (p = 0.007; Figure 2b). Before 2006 (1980–2005), the mean summer precipitation was 102.86 mm/season; after 2006 (2006–2025), it decreased to 86.66 mm/season, a reduction of 16.20 mm/season (15.75%), indicating a decadal shift in Central Asian summer precipitation during the early 21st century.
3.1.2. Spatial Heterogeneity
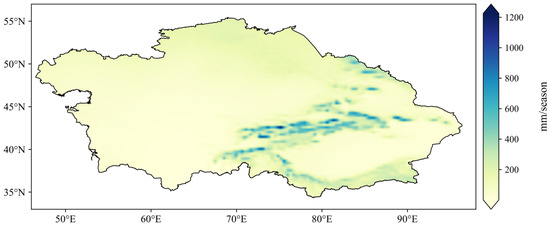
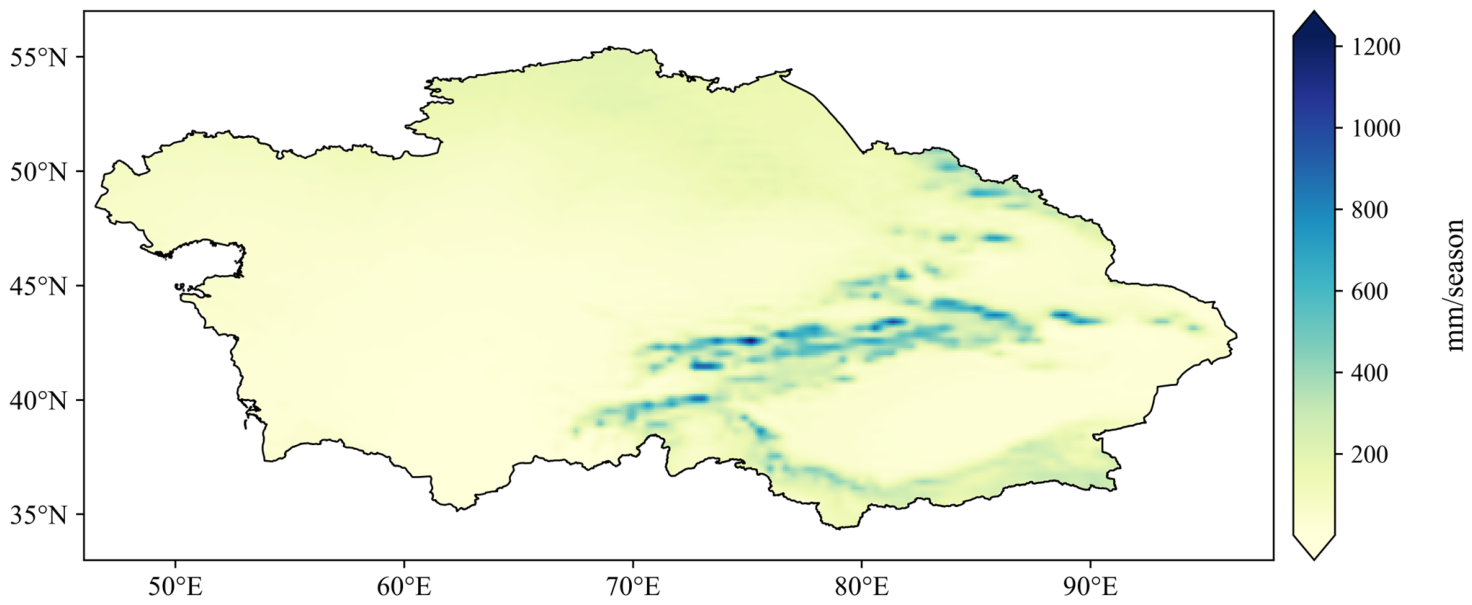
The climatological mean summer precipitation over Central Asia during 1980–2025 exhibits pronounced spatial heterogeneity, closely tied to the region’s complex topography (Figure 3). The most striking feature is a high-precipitation belt extending along the Tien Shan Mountains and the Pamir Plateau in the southeast, where the highest values exceed 600 mm/season and can reach 1000–1200 mm/season on high-elevation windward slopes (Figure 3). The axis of this belt follows the east–west strike of the Tien Shan, indicating that moisture carried by the mid-latitude westerlies is forced to ascend when encountering the mountain barriers, producing frequent orographic precipitation [27]. Secondary high-value centres (300–400 mm/season) appear over the piedmont plains north of the Tien Shan. In contrast, the western and central parts of the study area receive much less precipitation: the Turan Plain, the Caspian Basin, and the surrounding deserts are below 200 mm/season, with the eastern Caspian region even below 100 mm/season. This sharp west–east gradient reflects the combined effects of distance from oceanic moisture sources and topographic blocking.
Figure 3.
Spatial distribution of mean summer precipitation (mm/season) over Central Asia during 1980–2025.
3.2. Identification of Key Circulation Factors
3.2.1. Results of Multicollinearity Diagnosis and Variable Selection
The Pearson correlation matrix of the 14 climate indices reveals strong intercorrelations among several ENSO-related and Pacific–Atlantic indices (Figure S1a). MEI is highly correlated with ONI (r = 0.93) and SOI (r = −0.90), while TSA is correlated with MEI (r = −0.60) and EA/WR (r = −0.54). Such collinearity can bias the importance ranking of predictors in regression models and inflate the variance of estimated coefficients. To address this issue, we first applied VIF to iteratively remove highly collinear indices. Three indices were excluded because their VIF values exceeded the threshold of 5: MEI, WHWP, and SOI (Figure S1b). The remaining 11 indices all had VIF values below 5. We then applied LASSO regression with 5-fold cross-validation to further select the most important predictors. The optimal penalty parameter was = 2.703, which retained four indices with non-zero coefficients: PDO (+2.232), TNI (−1.723), ONI (−1.333), and TSA (−1.239) (Figure S1c). All other coefficients were shrunk to zero. These four indices were used in the subsequent partial correlation and multiple regression analyses.
3.2.2. Results of Partial Correlation Analysis
To quantify the independent contribution of each retained index to summer precipitation, we calculated partial correlations between each index and precipitation while controlling for the remaining three indices (Table 1). The effective degrees of freedom (Neff) were adjusted for lag-1 autocorrelation, and the Benjamini–Hochberg FDR procedure was applied to account for multiple testing. Three of the four indices show statistically significant partial correlations (FDR q < 0.05), while TSA is not significant after FDR correction (q = 0.061). Based on absolute magnitudes, ONI exhibits the strongest partial correlation (r = −0.436), followed by PDO (r = 0.371), TNI (r = −0.366), and TSA (r = −0.329). PDO is positively correlated with summer precipitation, whereas ONI, TNI, and TSA are negatively correlated. Neff ranges from 36 to 46. These results confirm significant partial correlations between PDO, ONI, TNI and summer precipitation, while the partial correlation for TSA is relatively weak. The signs of the partial correlations are consistent with the LASSO coefficients, indicating that the four indices represent distinct and non-redundant variables.
Table 1.
Partial correlations between the four LASSO-selected indices and summer precipitation.
3.2.3. Multiple Linear Regression, Variable Ranking, and Spatial Regression
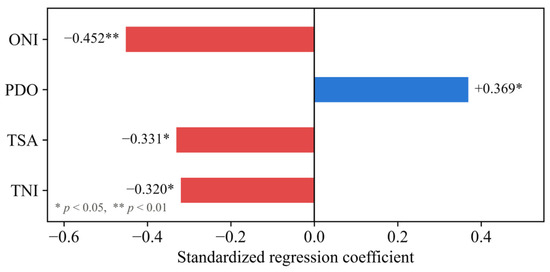
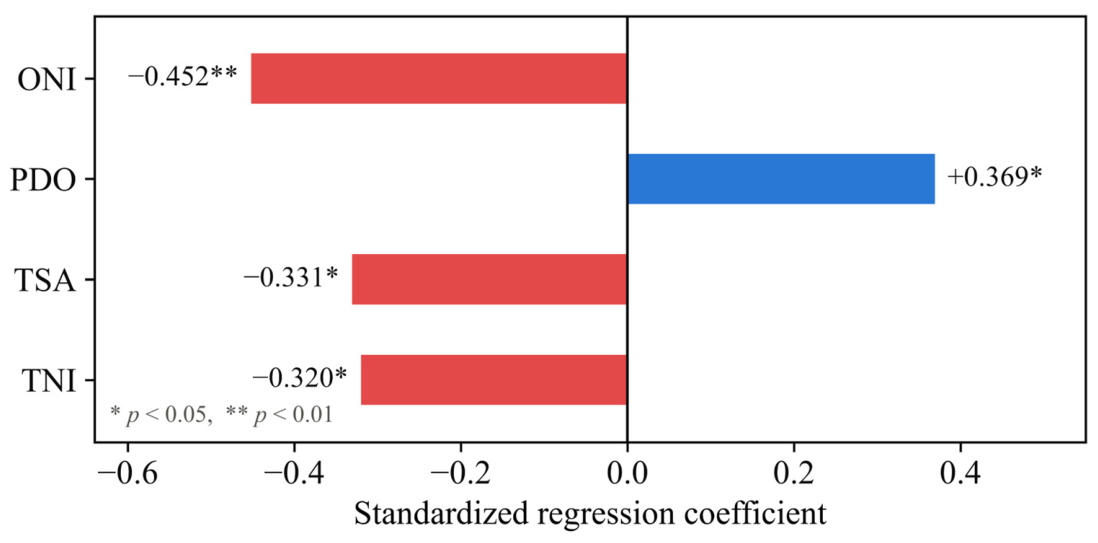
A multiple linear regression model using the four LASSO-selected indices explains 34.8% of the variance in summer precipitation in the full-sample fit (R2 = 0.348, p = 0.0013). To assess out-of-sample predictive skill, we further performed a time-series blocked cross-validation with an expanding window. The model achieves a positive blocked-CV R2 (+0.261, RMSE = 14.07 mm/season), which suggests good predictive ability when tested on unseen data. All four indices are statistically significant in the full-sample OLS model (p < 0.05). Note that TSA is not significant after FDR correction in the partial correlation analysis, but it was retained by LASSO and remains significant in the OLS model. Based on the absolute standardized regression coefficients, the variables rank as ONI (−0.452) > PDO (+0.369) > TSA (−0.331) > TNI (−0.320) (Figure 4). This indicates that ONI, TSA, and TNI are negatively correlated with summer precipitation, whereas PDO shows a positive correlation. ONI emerges as the most influential factor, followed by PDO.
Figure 4.
Standardized regression coefficients (Beta) of the four LASSO-selected indices in the multiple linear regression model.
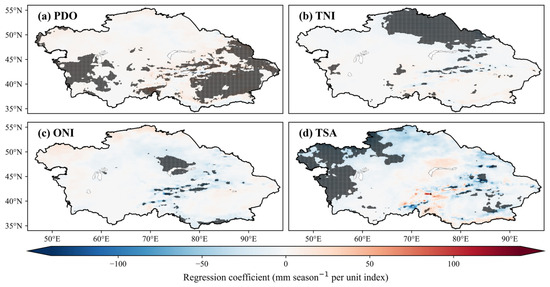
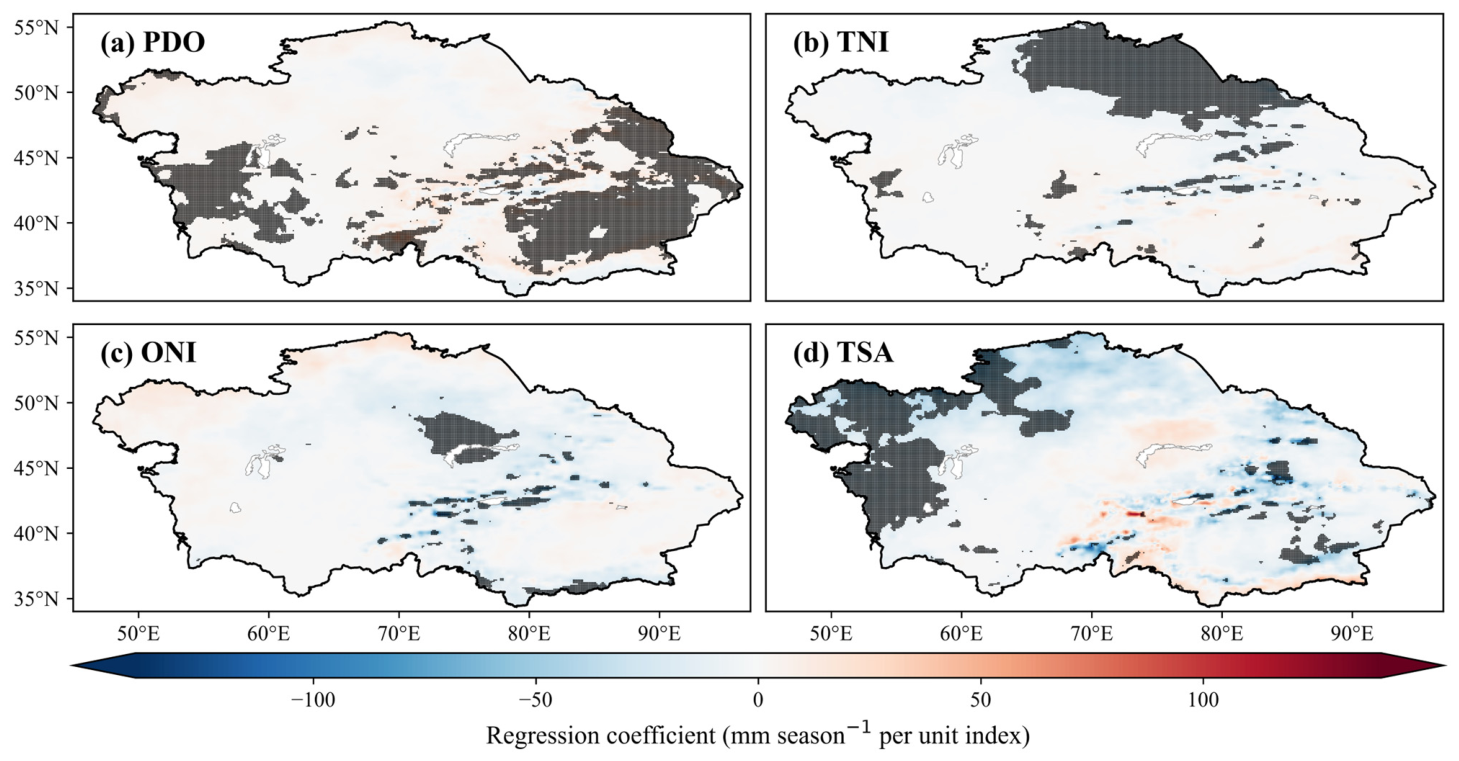
To further examine the spatial pattern of each index’s influence, we computed grid-point multiple regression coefficients after controlling for the other three indices (Figure 5). PDO shows positive coefficients over the eastern Tien Shan and the Kazakh Hills, reaching up to approximately +30 mm/season per unit index, indicating that PDO enhances summer precipitation in these mountainous regions. TNI also shows predominantly negative coefficients, reaching about −20 mm/season per unit index over the northern region. ONI exhibits significant negative coefficients concentrated in the central parts of the study area (down to approximately −20 mm/season per unit index), while the western region remains largely non-significant. TSA displays a clear north–south dipole, with significant negative coefficients in the western and northwestern regions (down to about −30 mm/season per unit index) and weak, non-significant positive coefficients in the south (up to about +20 mm/season per unit index).
Figure 5.
Spatial distribution of multiple regression coefficients between summer precipitation (mm season−1 per unit index) and (a) PDO, (b) TNI, (c) ONI, and (d) TSA over Central Asia during 1980–2025. Black dots indicate grid points with p < 0.05.
The statistical relationships identified above can be further illustrated by examining the most extreme years in the record (Figure 2). The exceptionally wet summer of 1993 coincided with a strongly positive PDO (+2.46), a negative TNI (−0.75), a weakly positive ONI (+0.38), and a weakly negative TSA (−0.24). The positive PDO and negative TNI both favor ascending motion and enhanced precipitation over Central Asia, consistent with the observed wet anomaly. In contrast, the extremely dry summer of 2023 coincided with a strongly negative PDO (−1.81), a strongly positive ONI (+1.11), a positive TNI (+0.78), and a weakly positive TSA (+0.28). These index anomalies are consistent with suppressed precipitation over Central Asia, consistent with the extreme drought in that year. These index-based diagnostics further support the statistical relationships identified in this section.
3.3. Physical Mechanisms: Circulation Pathways of PDO, ONI, and TNI Influences
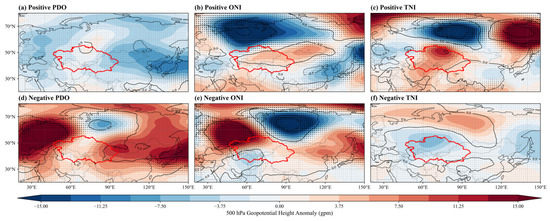
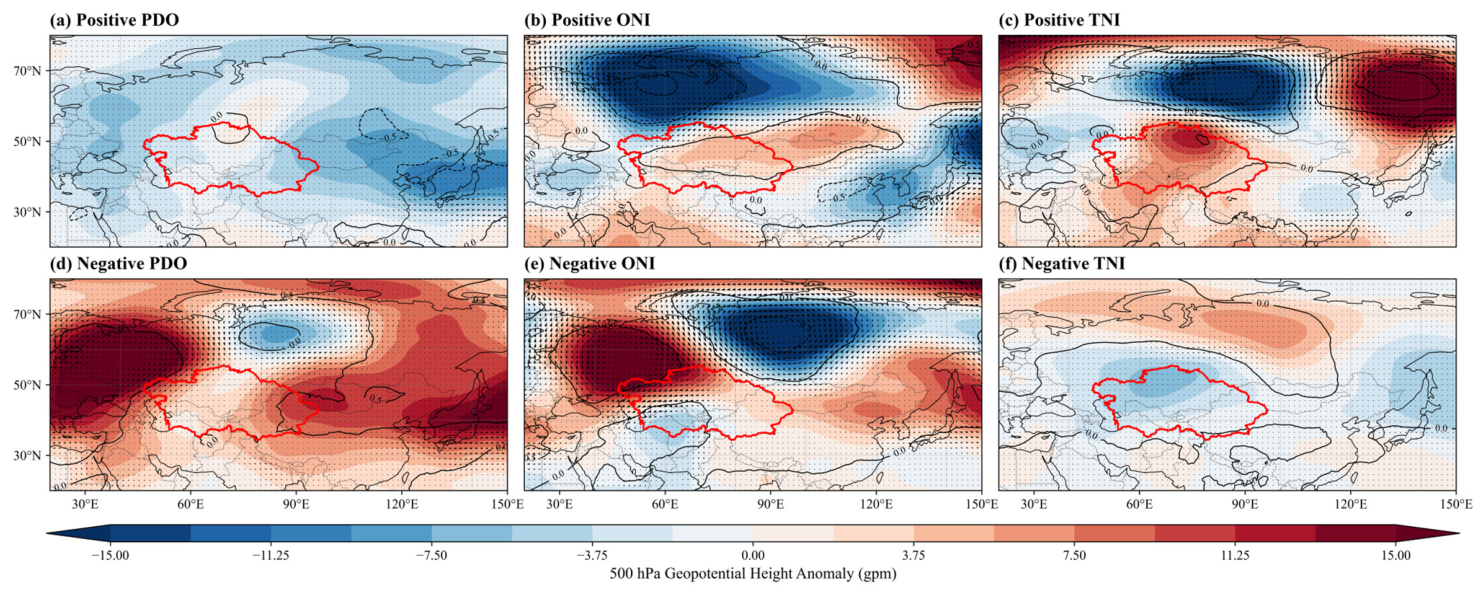
To investigate the physical mechanism through which large-scale SST modes influence summer precipitation in Central Asia, we performed a composite analysis of 500 hPa geopotential height, temperature, and wind anomalies during the positive and negative phases of PDO, ONI, and TNI. The 500 hPa level was chosen because it represents the mid-upper troposphere, where large-scale Rossby wave trains and teleconnection patterns are most clearly expressed. The composites for ONI, PDO, and TNI are presented in Figure 6, while the precipitation composites are provided in the Supplementary Material (Figure S2). A composite analysis for TSA was not performed because of the limited number of extreme years.
Figure 6.
Composite of 500 hPa geopotential height anomalies during (a) positive PDO, (b) positive ONI, (c) positive TNI, (d) negative PDO, (e) negative ONI, and (f) negative TNI phases. Black dots indicate grid points with p < 0.05.
3.3.1. PDO-Related Circulation Anomalies and Precipitation Response
During the positive PDO phase, a weak cyclonic (low-pressure) anomaly appears over Central Asia with slightly below-normal geopotential height (Figure 6a). During the negative PDO phase, a strong blocking high develops over the Ural region and a deepened trough appears near Lake Baikal. Central Asia is mainly dominated by a weak anticyclonic (high-pressure) anomaly, with slightly above-normal geopotential height (Figure 6d).
These circulation anomalies are consistent with the statistical results. PDO is positively correlated with summer precipitation (Table 1). The precipitation composite (Figure S2) confirms that regional mean summer precipitation is above the climatological mean during positive PDO years (+4.98 mm/season) and below it during negative PDO years (−4.19 mm/season). The weak cyclonic (low-pressure) anomaly over Central Asia during the positive phase is consistent with ascending motion and above-average precipitation, whereas the weak anticyclonic (high-pressure) anomaly during the negative phase is consistent with reduced precipitation.
3.3.2. ONI-Related Circulation Anomalies and Precipitation Response
The ONI composite shows a well-organized circulation pattern (Figure 6b,e). During the positive ONI phase (El Niño), a strong negative geopotential height anomaly dominates the North Pacific and East Asia, while a weak anticyclonic (high-pressure) anomaly extends over Central Asia (Figure 6b). The wind field over Central Asia is weak. During the negative ONI phase (La Niña), the pattern reverses: a strong blocking high develops over Europe and western Central Asia, accompanied by a deepened low over the North Pacific (Figure 6e). Central Asia exhibits a north–south dipole, with a weak anticyclonic (high-pressure) anomaly in the north and a weak cyclonic (low-pressure) anomaly in the south.
These circulation anomalies are consistent with the statistical results. ONI is negatively correlated with summer precipitation (Table 1) and is the strongest contributor among the four indices. The precipitation composite (Figure S2) confirms that summer precipitation is below the climatological mean during positive ONI years (−7.34 mm/season) and above it during negative ONI years (+2.36 mm/season). Although these differences are not statistically significant due to the limited sample size, the direction is consistent with the negative ONI–precipitation relationship. During the positive phase, the weak anticyclonic (high-pressure) anomaly over Central Asia is consistent with subsidence and reduced precipitation. During the negative phase, the weak cyclonic (low-pressure) anomaly over the southern part of Central Asia is consistent with ascending motion and above-average precipitation.
3.3.3. TNI-Related Circulation Anomalies
During the positive TNI phase, a strong anticyclonic (high-pressure) anomaly covers Central Asia, accompanied by a deepened low over the North Pacific (Figure 6c). During the negative TNI phase, a weak cyclonic (low-pressure) anomaly appears over Central Asia (Figure 6f). This wave train response resembles that of ONI, although TNI and ONI are nearly uncorrelated (r = 0.013), suggesting that TNI may influence Central Asian precipitation through a partly distinct pathway. These results are consistent with Chen et al. [42], who identified TNI as one of the predominant atmospheric circulation factors driving precipitation trends in the Tianshan Mountains of Central Asia.
TNI is negatively correlated with summer precipitation (Table 1). The precipitation composite (Figure S2) shows that summer precipitation is below the climatological mean during positive TNI years (−12.82 mm/season) and above it during negative TNI years (+4.96 mm/season). Notably, the negative TNI phase is the only case among all six phases where the precipitation anomaly approaches the 0.05 significance level (p = 0.059). The strong high-pressure anomaly over Central Asia during the positive phase is consistent with subsidence and suppressed moisture convergence, consistent with the observed reduction in precipitation.
3.3.4. The Role of TSA
For TSA, a composite analysis was not performed because of the limited number of extreme years. However, previous studies have shown that tropical South Atlantic SST anomalies can influence Central Asian hydroclimate. On interdecadal timescales, the tropical South Atlantic SST is significantly correlated with the amplitude of the forced aridity pattern over Central Asia, possibly by modulating the North Atlantic horseshoe-like dipole, ENSO, and a Eurasian mid-latitude wave train [43]. In this study, TSA was retained by LASSO and remains significant in the OLS model, but its partial correlation is not significant after FDR correction (q = 0.061), indicating a weaker independent contribution. This suggests that TSA acts as a secondary influential factor of summer precipitation variability in Central Asia, possibly through interdecadal processes that are not fully captured by the interannual partial correlation analysis.
4. Discussion
Regarding data sources, the climate indices used in this study were obtained from the NOAA PSL, which provides standard and widely used index definitions. Although this ensures comparability with previous studies, future work could derive these indices directly from ERA5-Land and ERA5 to achieve full consistency with the precipitation and circulation datasets. This would reduce potential systematic biases between different data sources and further strengthen the internal consistency of the attribution analysis.
The multiple linear regression model using the four LASSO-selected indices explains 34.8% of the variance in summer precipitation (R2 = 0.348), leaving approximately 65% unexplained. This residual variance may arise from several factors not included in the present analysis. First, land-surface feedbacks, particularly soil moisture–precipitation coupling, can modulate local precipitation in addition to large-scale circulation [22]. Second, the position and intensity of the subtropical westerly jet are not fully captured by the SST indices used here; variations in the jet can alter moisture transport pathways into Central Asia [13]. Third, other remote forcings such as Arctic sea-ice loss, Eurasian snow cover, and the Atlantic Multidecadal Variability may modulate the westerly jet and interfere non-linearly with Pacific SST signals [44]. In particular, Jiang et al. [1] demonstrated that the Atlantic Multidecadal Variability (AMV) can excite a circumglobal teleconnection pattern that enhances ascending motion and precipitation over Central Asia. Fourth, internal atmospheric variability represents an inherent source of uncertainty at seasonal-to-interannual timescales due to chaotic atmospheric dynamics [45].
The composite precipitation anomalies during positive and negative phases of PDO, ONI, and TNI are consistent in sign with the statistical results but do not reach the 0.05 significance level, primarily due to the limited number of extreme years for some indices. The large interannual variability of summer precipitation further reduces the statistical power to detect the relatively weak SST signal. These results should therefore be interpreted as suggestive rather than definitive. Finally, direct moisture-transport diagnostics, such as integrated water vapor transport (IVT) and moisture-flux convergence, were not performed in this study. Incorporating these diagnostics in future work would help quantify the specific contribution of each SST mode to regional moisture transport.
The study area exhibits strong spatial heterogeneity in summer precipitation, with high values concentrated over the Tien Shan and Pamir mountains and much lower values over the western plains and deserts (Figure 3). This spatial heterogeneity implies that a single regional-average precipitation index may not fully capture the spatially varying response to large-scale circulation. The regression and composite analyses presented here therefore represent regionally averaged signals, while the grid-point regression maps (Figure 5) provide complementary information on spatial patterns. Future work could apply spatial clustering or regionalization approaches to further examine the heterogeneous response of precipitation to these SST modes.
Under global warming, the teleconnection between Pacific and Atlantic SST modes and Central Asian summer precipitation may not remain stationary. For example, the influence of ENSO on Central Asian spring precipitation has experienced significant interdecadal shifts, modulated by North Atlantic SST anomalies and the PDO phase [46]. Changes in background SST, Arctic amplification, and shifts in the subtropical westerly jet could modulate the strength and spatial pattern of these teleconnections [47]. Future studies should investigate how these teleconnections may evolve under different warming scenarios.
5. Conclusions
Based on ERA5-Land reanalysis precipitation data and 14 large-scale climate indices from 1980 to 2025, this study investigated the spatiotemporal variation in summer precipitation in Central Asia and its physical attribution using VIF and LASSO screening, partial correlation analysis, multiple linear regression, blocked cross-validation, and composite analysis. The main conclusions are as follows:
- (1)
- Summer precipitation in Central Asia shows a statistically significant decreasing trend of −0.376 mm/season per year over 1980–2025. A significant change point is detected in 2006, after which the regional mean summer precipitation decreased by 15.75% (from 102.86 to 86.66 mm/season).
- (2)
- VIF and LASSO screening identify four candidate variables for summer precipitation: PDO, ONI, TNI, and TSA. Partial correlation analysis shows that PDO, ONI, and TNI attain statistically significant values (FDR q < 0.05), whereas TSA is not significant following FDR correction (q = 0.061). PDO is positively correlated with summer precipitation, whereas ONI, TNI, and TSA are negatively correlated, with ONI being the strongest negative contributor.
- (3)
- The multiple linear regression model using the four indices explains 34.8% of the variance in summer precipitation. Based on the absolute standardized regression coefficients, the variables rank as ONI > PDO > TSA > TNI. A time-series blocked cross-validation yields a positive blocked-CV R2 (+0.261), which suggests good predictive ability when tested on unseen data.
- (4)
- Composite analysis of 500 hPa circulation anomalies reveals distinct mid-high latitude circulation anomaly patterns over Eurasia during positive and negative phases of ONI, PDO, and TNI. Circulation anomalies over Central Asia during positive and negative phases are consistent with the sign of the statistical relationships, and the composite precipitation anomalies agree in direction with the regression results, supporting the circulation-based interpretation of the Pacific SST influences and the statistical role of TSA on Central Asian summer precipitation.
Overall, this study identifies PDO, ENSO-related Pacific SST modes (ONI and TNI), and TSA as variables linked to summer precipitation in Central Asia. Of these indices, PDO, ONI, and TNI attain significant values, whereas TSA fails to meet the significance threshold after FDR correction. These results provide a circulation-based interpretation of their physical linkage and scientific support for regional climate monitoring and water resource management.
Supplementary Materials
The following supporting information can be downloaded at: https://www.mdpi.com/article/10.3390/rs18193412/s1, Table S1: Validation of ERA5-Land precipitation against GHCNd stations over Central Asia, grouped by elevation; Table S2. Names and abbreviations of the 14 large-scale climate indices used in this study; Supplementary Equations (S1)−(S7); Figure S1: Multicollinearity diagnosis and variable selection. (a) Pearson correlation matrix of the 14 climate indices. (b) VIF of the 14 indices; the three indices removed by VIF screening (MEI, WHWP, SOI) are highlighted in red, and the red dashed line marks the threshold VIF = 5. (c) LASSO coefficients of the 11 retained indices; Figure S2. Composite anomalies of summer precipitation over Central Asia during positive and negative phases of PDO, ONI, and TNI.
Author Contributions
Y.D.: Conceptualization, Methodology, Software, Data Curation, Writing—Review and Editing; H.S.: Conceptualization, Data Curation, Writing—Original Draft Preparation; M.F.: Methodology, Writing—Review and Editing; Y.C.: Investigation, Writing—Review and Editing; X.Y.: Data Curation, Writing—Review and Editing. All authors have read and agreed to the published version of the manuscript.
Funding
This research was funded by the National Natural Science Foundation of China (Grant No. W2412135), the opening Foundation of State Key Laboratory of Desert and Oasis Ecology, Xinjiang Institute of Ecology and Geography, Chinese Academy of Sciences (Grant No. G2024-02-02) and the Natural Science Foundation of Jiangsu Province (Grant No. BK20240710).
Data Availability Statement
The ERA5-Land precipitation data and the 500-hPa geopotential height, temperature, and wind (u and v components) data are publicly available from the Copernicus Climate Data Store (https://cds.climate.copernicus.eu/) (accessed on 1 October 2026). The 14 large-scale climate indices were obtained from the Physical Sciences Laboratory of the National Oceanic and Atmospheric Administration (https://psl.noaa.gov/data/climateindices/list/) (accessed on 1 October 2026). All datasets used in this study are publicly accessible and have been properly cited in the main text.
Conflicts of Interest
The authors declare no conflicts of interest.
References
- Jiang, J.; Zhou, T.; Chen, X.; Wu, B. Central Asian Precipitation Shaped by the Tropical Pacific Decadal Variability and the Atlantic Multidecadal Variability. J. Clim. 2021, 34, 7541–7553. [Google Scholar] [CrossRef] [Scilit]
- Huang, J.; Bashiri, Z.; Disse, M. Climate-Informed Water Allocation in Central Asia: Leveraging Decision Support System. Water 2026, 18, 161. [Google Scholar] [CrossRef] [Scilit]
- Wang, H.; Chen, Y.; Ren, L.; Li, Z.; Li, Y.; Feng, R.; Yang, Y.; Cao, L. Impact of climate change on hydrological processes in data-scarce regions: A case study in Tianshan Mountain, Central Asia. J. Hydrol. Reg. Stud. 2026, 66, 103553. [Google Scholar] [CrossRef] [Scilit]
- Chen, Y.; Li, W.; Deng, H.; Fang, G.; Li, Z. Changes in Central Asia’s Water Tower: Past, Present and Future. Sci. Rep. 2016, 6, 35458. [Google Scholar] [CrossRef] [Scilit] [PubMed]
- Keskinen, M.; Salminen, E.; Haapala, J. Water diplomacy paths—An approach to recognise water diplomacy actions in shared waters. J. Hydrol. 2021, 602, 126737. [Google Scholar] [CrossRef] [Scilit]
- IPCC. Climate Change 2021: The Physical Science Basis; Cambridge University Press: Cambridge, UK, 2021. [Google Scholar] [CrossRef] [Scilit]
- Guan, X.; Yao, J.; Schneider, C. Variability of the precipitation over the Tianshan Mountains, Central Asia. Part II: Multi-decadal precipitation trends and their association with atmospheric circulation in both the winter and summer seasons. Int. J. Climatol. 2022, 42, 139–156. [Google Scholar] [CrossRef] [Scilit]
- Yao, J.; Chen, Y.; Chen, J.; Zhao, Y.; Tuoliewubieke, D.; Li, J.; Yang, L.; Mao, W. Intensification of extreme precipitation in arid Central Asia. J. Hydrol. 2021, 598, 125760. [Google Scholar] [CrossRef] [Scilit]
- Wei, W.; Zou, S.; Duan, W.; Chen, Y.; Li, S.; Zhou, Y. Spatiotemporal variability in extreme precipitation and associated large-scale climate mechanisms in Central Asia from 1950 to 2019. J. Hydrol. 2023, 620, 129417. [Google Scholar] [CrossRef] [Scilit]
- Song, L.; Xu, C.; Long, Y.; Lei, X.; Suo, N.; Cao, L. Performance of Seven Gridded Precipitation Products over Arid Central Asia and Subregions. Remote Sens. 2022, 14, 6039. [Google Scholar] [CrossRef] [Scilit]
- Yang, Y.; Zhao, Y.; Meng, L.; Zhang, R. Interdecadal change in the relationship between the NAO and summer rainfall in Northern Central Asia. Atmos. Res. 2026, 328, 108430. [Google Scholar] [CrossRef] [Scilit]
- Umirbekov, A.; Peña-Guerrero, M.D.; Müller, D. Regionalization of climate teleconnections across Central Asian mountains improves the predictability of seasonal precipitation. Environ. Res. Lett. 2022, 17, 055002. [Google Scholar] [CrossRef] [Scilit]
- Ren, G.; Zhao, Y.; Qiu, S.; Meng, L.; Zhang, R. Historical and Projected Relationships between the Dominant Modes of Summer Subtropical Westerly Jet and Precipitation over Central Asia Based on CMIP6 Models. Theor. Appl. Climatol. 2024, 155, 1201–1215. [Google Scholar] [CrossRef] [Scilit]
- Mantua, N.J.; Hare, S.R.; Zhang, Y.; Wallace, J.M.; Francis, R.C. A Pacific Interdecadal Climate Oscillation with Impacts on Salmon Production. Bull. Am. Meteorol. Soc. 1997, 78, 1069–1079. [Google Scholar] [CrossRef] [Scilit]
- Li, B.; Li, Y.; Chen, Y.; Zhang, B.; Shi, X. Recent Fall Eurasian Cooling Linked to North Pacific Sea Surface Temperatures and a Strengthening Siberian High. Nat. Commun. 2020, 11, 5202. [Google Scholar] [CrossRef] [Scilit] [PubMed]
- Asare, K.; Nyarko, B.K.; Klutse, N.A.B.; Ansah-Narh, T.; Damoah, R.; Koffi, H.A. Quantifying the Influence of Remote Climate Indices on Key Climate Variables in Northern Ghana: A Comprehensive Multivariate Approach. Earth Syst. Environ. 2025, 10, 577–603. [Google Scholar] [CrossRef] [Scilit]
- Nagaraj, M.; Srivastav, R. Spatial multivariate selection of climate indices for precipitation over India. Environ. Res. Lett. 2022, 17, 094014. [Google Scholar] [CrossRef] [Scilit]
- Lee, T.; Kong, Y.; Lee, J.-H.; Yoon, H.-C. Spring precipitation forecasting with exhaustive searching and LASSO using climate teleconnection for drought management. Clim. Dyn. 2024, 62, 1625–1648. [Google Scholar] [CrossRef] [Scilit]
- Bretherton, C.S.; Widmann, M.; Dymnikov, V.P.; Wallace, J.M.; Bladé, I. The Effective Number of Spatial Degrees of Freedom of a Time-Varying Field. J. Clim. 1999, 12, 1990–2009. [Google Scholar] [CrossRef] [Scilit]
- Benjamini, Y.; Hochberg, Y. Controlling the False Discovery Rate: A Practical and Powerful Approach to Multiple Testing. J. R. Stat. Soc. Ser. B 1995, 57, 289–300. [Google Scholar] [CrossRef] [Scilit]
- Roberts, D.R.; Bahn, V.; Ciuti, S.; Boyce, M.S.; Elith, J.; Guillera-Arroita, G.; Hauenstein, S.; Lahoz-Monfort, J.J.; Schröder, B.; Thuiller, W.; et al. Cross-validation strategies for data with temporal, spatial, hierarchical, or phylogenetic structure. Ecography 2017, 40, 913–929. [Google Scholar] [CrossRef] [Scilit]
- Wei, X.; Liu, G.; Nan, S.; Zhang, T.; Mao, X.; Feng, Y.; Zhou, Y. Precursory signals of summer precipitation over southern Central Asia: Combined effect of April soil moisture and sea surface temperature. Int. J. Climatol. 2024, 44, 2246–2264. [Google Scholar] [CrossRef] [Scilit]
- Peng, D.; Zhou, T.; Huang, X.; He, C.; Zhang, L. Dominant Role of Eurasian Evaporation on the Moisture Sources of the Interannual Variations in Central Asian Summer Precipitation. J. Clim. 2024, 37, 4761–4774. [Google Scholar] [CrossRef] [Scilit]
- Lei, H.; Ma, Q.; Chang, Y.; Gu, Y.; Wan, S.; Zhu, Z.; Feng, G. Multiscale Interactions Driving Summer Extreme Precipitation in Central Asia. Geophys. Res. Lett. 2024, 51, e2024GL108882. [Google Scholar] [CrossRef] [Scilit]
- Jin, C.; Wang, B.; Cheng, T.F.; Dai, L.; Wang, T. How much we know about precipitation climatology over Tianshan Mountains—The Central Asian water tower. npj Clim. Atmos. Sci. 2024, 7, 21. [Google Scholar] [CrossRef] [Scilit]
- Yao, J.-Q.; Chen, J.; Zhang, T.-W.; Tuoliewubieke, D.; Mao, W.-Y. Stationarity in the variability of arid precipitation: A case study of arid Central Asia. Adv. Clim. Change Res. 2021, 12, 172–186. [Google Scholar] [CrossRef] [Scilit]
- Zhong, L.; Hua, L.; Gong, Z.; Yao, Y.; Mu, L. Quantifying the Spatial Characteristics of the Moisture Transport Affecting Precipitation Seasonality and Recycling Variability in Central Asia. Adv. Atmos. Sci. 2022, 39, 967–984. [Google Scholar] [CrossRef] [Scilit]
- Zhang, X.; He, M.; Bai, M.; Ge, Q. Meteorological drought and its large-scale climate patterns in each season in Central Asia from 1901 to 2015. Clim. Change 2021, 166, 41. [Google Scholar] [CrossRef] [Scilit]
- Muñoz-Sabater, J.; Dutra, E.; Agustí-Panareda, A.; Albergel, C.; Arduini, G.; Balsamo, G.; Boussetta, S.; Choulga, M.; Harrigan, S.; Hersbach, H.; et al. ERA5-Land: A state-of-the-art global reanalysis dataset for land applications. Earth Syst. Sci. Data 2021, 13, 4349–4383. [Google Scholar] [CrossRef] [Scilit]
- Hersbach, H.; Bell, B.; Berrisford, P.; Hirahara, S.; Horányi, A.; Muñoz-Sabater, J.; Nicolas, J.; Peubey, C.; Radu, R.; Schepers, D.; et al. The ERA5 global reanalysis. Q. J. R. Meteorol. Soc. 2020, 146, 1999–2049. [Google Scholar] [CrossRef] [Scilit]
- Xu, J.; Ma, Z.; Yan, S.; Peng, J. Do ERA5 and ERA5-land precipitation estimates outperform satellite-based precipitation products? A comprehensive comparison between state-of-the-art model-based and satellite-based precipitation products over mainland China. J. Hydrol. 2022, 605, 127353. [Google Scholar] [CrossRef] [Scilit]
- Wu, X.; Su, J.; Ren, W.; Lü, H.; Yuan, F. Statistical comparison and hydrological utility evaluation of ERA5-Land and IMERG precipitation products on the Tibetan Plateau. J. Hydrol. 2023, 620, 129384. [Google Scholar] [CrossRef] [Scilit]
- Kang, Y.; Ni, T.; He, S.; Cao, Z.; Wu, G.; Tong, J.; Ye, Z. Impacts of the Pacific Decadal Oscillation and El Nino-Southern Oscillation on Regional Precipitation Concentration. Int. J. Climatol. 2025, 45, e8789. [Google Scholar] [CrossRef] [Scilit]
- Lu, C.; Ma, L.; Sun, B.; Huang, X.; Liu, T. China’s Seasonal Precipitation: Quantitative Attribution of Ocean-Atmosphere Teleconnections and Near-Surface Forcing. Hydrology 2026, 13, 19. [Google Scholar] [CrossRef] [Scilit]
- Trenberth, K.E.; Stepaniak, D.P. Indices of El Niño Evolution. J. Clim. 2001, 14, 1697–1701. [Google Scholar] [CrossRef] [Scilit]
- Sen, P.K. Estimates of the Regression Coefficient Based on Kendall’s Tau. J. Am. Stat. Assoc. 1968, 63, 1379–1389. [Google Scholar] [CrossRef]
- Mann, H.B. Nonparametric Tests Against Trend. Econometrica 1945, 13, 245–259. [Google Scholar] [CrossRef] [Scilit]
- Hamed, K.H.; Ramachandra Rao, A. A modified Mann-Kendall trend test for autocorrelated data. J. Hydrol. 1998, 204, 182–196. [Google Scholar] [CrossRef] [Scilit]
- Mann, H.B.; Whitney, D.R. On a Test of Whether One of Two Random Variables is Stochastically Larger than the Other. Ann. Math. Stat. 1947, 18, 50–60. [Google Scholar] [CrossRef] [Scilit]
- Pettitt, A.N. A Non-Parametric Approach to the Change-Point Problem. Appl. Stat. 1979, 28, 126–135. [Google Scholar] [CrossRef] [Scilit] [PubMed]
- Tibshirani, R. Regression Shrinkage and Selection Via the Lasso. J. R. Stat. Soc. Ser. B 1996, 58, 267–288. [Google Scholar] [CrossRef] [Scilit]
- Chen, C.; Hu, Y.; Fan, M.; Jia, L.; Zhang, W.; Fan, T. Investigation on the Linkage Between Precipitation Trends and Atmospheric Circulation Factors in the Tianshan Mountains. Water 2025, 17, 726. [Google Scholar] [CrossRef] [Scilit]
- Zhong, L.; Hua, L.; Yao, Y.; Feng, J. Interdecadal Aridity Variations in Central Asia during 1950–2016 Regulated by Oceanic Conditions under the Background of Global Warming. Clim. Dyn. 2021, 56, 3665–3686. [Google Scholar] [CrossRef] [Scilit]
- Zhang, L.; Qiu, W.; Ma, Q.; Chen, L.; Hu, R.; Qian, Z.; Yan, P.; Feng, G. Spring Arctic Sea Ice Decline Exacerbates Summer Extreme Precipitation in Central Asia and Drought in Northeast China. Clim. Dyn. 2026, 64, 69. [Google Scholar] [CrossRef] [Scilit]
- Ren, Y.; Huang, J.; Yu, H.; Fan, X.; Ma, K.; Wang, X.; Gong, Y.; Xu, Y.; Zhang, J. Unprecedented Wetting over Western Central Asia Dominated by Internal Climate Variability. Geophys. Res. Lett. 2026, 53, e2026GL122792. [Google Scholar] [CrossRef] [Scilit]
- Yao, M.; Tang, H.; Huang, G.; Wu, R. Interdecadal Shifts of ENSO Influences on Spring Central Asian Precipitation. npj Clim. Atmos. Sci. 2024, 7, 194. [Google Scholar] [CrossRef] [Scilit]
- Rezaei, A.; Karami, K.; Tilmes, S.; Moore, J.C. Changes in Global Teleconnection Patterns under Global Warming and Stratospheric Aerosol Intervention Scenarios. Atmos. Chem. Phys. 2023, 23, 5835–5850. [Google Scholar] [CrossRef] [Scilit]

Disclaimer/Publisher’s Note: The statements, opinions and data contained in all publications are solely those of the individual author(s) and contributor(s) and not of MDPI and/or the editor(s). MDPI and/or the editor(s) disclaim responsibility for any injury to people or property resulting from any ideas, methods, instructions or products referred to in the content. |
© 2026 by the authors. Licensee MDPI, Basel, Switzerland. This article is an open access article distributed under the terms and conditions of the Creative Commons Attribution (CC BY) license.