


Highlights
What are the main findings?
- DSI captures the intensification of global drought severity, while SSMI reveals an amplification of spatial drying and wetting tendencies.
- Within the CMIP6 modelling framework used here, DSI and SSMI showed more consistent behavior than SPEI and TCI across the regions and scenarios examined.
What are the implications of the main findings?
- High-emission scenarios are projected to produce more extensive and more severe droughts, whereas low-emission scenarios markedly slow drought expansion.
- These findings underscore the value of emission mitigation and may inform index selection for drought assessment within the adopted CMIP6 framework.
Abstract
As climate change intensifies, global droughts are becoming more frequent and severe, making the assessment of future drought trends essential for disaster risk reduction and adaptation. This study examines the spatiotemporal patterns of global drought over the historical period (1850–2014) and under four Shared Socioeconomic Pathway (SSP) scenarios (2015–2100), using a multi-model ensemble of up to sixteen CMIP6 models and four drought indices: the Standardized Precipitation Evapotranspiration Index (SPEI), the Temperature Condition Index (TCI), the Drought Severity Index (DSI), and the Standardized Soil Moisture Index (SSMI). Within the CMIP6 modelling framework and index formulations adopted here, DSI and SSMI showed greater temporal consistency than SPEI-12 and TCI in representing drought evolution. DSI responded more strongly to changes in temperature and precipitation, suggesting its potential usefulness for characterizing short-term dry conditions in temperate and subtropical regions. SSMI, by contrast, responds to soil-moisture variations and shows an amplification of spatial drying and wetting tendencies under higher-emission scenarios. Under high-emission scenarios, extreme drought areas expand rapidly, whereas low-emission scenarios slow their intensification. The complementary information provided by DSI and SSMI may improve our understanding of projected drought conditions within the adopted CMIP6 framework, particularly in southern North America, northern South America, Africa, eastern Australia, and southern China. These findings may inform model-based drought assessment, while implications for operational monitoring require independent evaluation.
1. Introduction
Drought is one of the most destructive climate extremes, with profound impacts on ecosystems, agricultural production, water resources, and socioeconomic development [1,2,3,4,5,6]. With the continued rise in global temperatures and substantial changes in precipitation patterns, the frequency, intensity, and duration of droughts exhibit complex spatiotemporal variations, necessitating systematic assessment and projection [7].
To understand drought dynamics and their potential impacts, researchers have developed a range of drought indices to quantify and monitor drought across different scales and types. Among the most widely applied are the Standardized Precipitation Evapotranspiration Index (SPEI), the Temperature Condition Index (TCI), the Drought Severity Index (DSI), and the Standardized Soil Moisture Index (SSMI). SPEI integrates precipitation and potential evapotranspiration and is therefore sensitive to the effect of temperature change on the water balance [8]. SSMI characterizes soil moisture deficits and is widely used as a key indicator of agricultural drought [9]. TCI uses land surface temperature (LST) to characterize vegetation heat stress, making it well suited to large-scale, high-frequency drought monitoring [10]. DSI provides a more comprehensive representation of hydrological responses during drought events. These indices capture drought occurrence, development, and impacts from different perspectives and are therefore strongly complementary. The four indices can be further distinguished by the number of input variables they require. Single-factor indices, such as TCI and SSMI, rely on a single variable; they are structurally simple, require less data, and support rapid assessment of drought conditions. Multi-factor indices, such as SPEI and DSI, combine several meteorological variables and therefore better capture the complexity of drought, making them more suitable for integrated analysis and long-term trend studies. This study employs SPEI, TCI, DSI, and SSMI, a combination that spans both categories and covers a broad range of drought types.
At the global scale, the Coupled Model Intercomparison Project Phase 6 (CMIP6) provides historical simulations together with future projections under a range of emission scenarios, offering a robust basis for drought research [11,12]. Its historical experiments and four SSP-based scenarios (SSP1-2.6, SSP2-4.5, SSP3-7.0, and SSP5-8.5) support systematic analysis of the spatiotemporal evolution of drought and its relationship with climate change [13]. Unlike gridded observational and reanalysis datasets such as CRU, GPCC, and ERA5, which are restricted to the observed period, CMIP6 enables drought risk to be assessed under alternative climate policy scenarios. CMIP6 provides global coverage at daily to monthly resolution and supplies the key variables required for drought analysis, including precipitation, surface temperature, potential evapotranspiration (PET), and soil moisture. The availability of multiple models and emission scenarios allows for drought risk to be examined consistently across contrasting climate futures.
Accordingly, this study applies SPEI, TCI, DSI, and SSMI jointly to CMIP6 historical simulations and SSP-based future projections, in order to analyze systematically the spatiotemporal characteristics of global drought. The study addresses three objectives: (1) to compare the responses of single- and multi-factor indices across different drought types and climatic conditions; (2) to examine the potential effects of future emission scenarios on drought risk using CMIP6 multi-scenario simulations; and (3) to identify global drought-prone regions under the four SSP scenarios. The regional drought events referred to in this study are used only as references. The analysis is based exclusively on CMIP6 simulations, not on specific observational data.
2. Materials and Methods
2.1. Data Sources
The Coupled Model Intercomparison Project Phase 6 (CMIP6) provides a standardized framework for coordinated climate model experiments and intercomparison. The CMIP6 historical experiments cover the period 1850–2014 and are driven by common forcing datasets that are, as far as possible, based on observations, including greenhouse gas concentrations, emissions of short-lived species, land use, solar forcing, and stratospheric volcanic aerosols. The historical experiments are intended to provide a benchmark for evaluating model performance against observations [14]. Moreover, the use of a common forcing protocol across participating models helps distinguish uncertainty associated with model responses from that arising from differences in imposed external forcing [14]. These features provide a scientific basis for using CMIP6 simulations in climate-related analyses.
The performance of CMIP6 models in reproducing historical climate characteristics has been extensively evaluated in previous studies at global and regional scales [15,16,17,18,19,20,21,22,23,24,25,26,27,28,29,30,31]. These studies have generally demonstrated that CMIP6 simulations are capable of reproducing the major spatial and temporal characteristics of the observed climate system, although systematic biases and inter-model differences remain. Therefore, CMIP6 simulations provide a scientifically established data source for investigating climate variability and change at the global scale. In the present study, CMIP6 data were used as climate-model-based datasets for subsequent analysis, with the inherent uncertainties of climate model simulations taken into consideration.
This study used climate outputs from several CMIP6 models (see Table 1 for details). CMIP6 model selection was conducted separately for each climate variable and was based on data availability and temporal completeness. For each variable, a model was retained only when the corresponding monthly data provided sufficient temporal coverage for the historical experiment and all four SSP scenarios considered in this study. Based on this criterion, 16 models were retained for precipitation, surface temperature, and moisture in the upper portion of the soil column, whereas three models were retained for potential evapotranspiration because of its more limited availability.
Table 1.
Summary of CMIP6 Data Used in This Study.
Each model has its own native spatial resolution. To ensure consistency across datasets, all data were regridded to a common resolution of 0.5° × 0.5° using bilinear interpolation. This standardization allowed for direct comparison and integrated analysis across models. The dataset covers both historical (January 1850–December 2014) and future (January 2015–December 2100) periods, with a monthly temporal resolution. Future projections are based on four SSP scenarios, namely SSP1-2.6, SSP2-4.5, SSP3-7.0 and SSP5-8.5. Each scenario reflects a different climate trajectory under specific socioeconomic and emission conditions. Standardizing spatial resolution across models helped combine different datasets more consistently. This facilitated consistent multi-model analysis and subsequent drought-index calculations.
2.2. Data Preprocessing
In this study, all NetCDF (.nc) files from CMIP6 were first converted to TIFF (.tif) format in batch, which facilitated subsequent visualization and spatial analysis. To ensure consistent spatial coverage and resolution, all data were then resampled to 0.5° × 0.5°, allowing outputs from different sources and models to be integrated effectively. In addition, to ensure temporal consistency, all TIFF images were grouped by year and month, so that outputs from different climate models and scenarios were strictly aligned on a uniform temporal scale.
The multi-model ensemble was then constructed variable by variable. For each climate variable, the ensemble mean was computed independently at every grid cell and for every month as the unweighted arithmetic mean across all models providing a valid value at that cell and month. The drought indices were subsequently derived from these ensemble-mean fields.
To account for differences in the availability of individual variables among CMIP6 models, a minimum number of valid model simulations was required for each grid cell and month. This criterion was applied independently to each climate variable according to the number of models providing the corresponding variable. Precipitation, surface temperature, and moisture in the upper portion of the soil column were available from 16 models; therefore, a grid-cell/month value was retained when at least 8 models provided valid data. Potential evapotranspiration was available from only three CMIP6 models, for which at least two valid model values were required. The models used for each variable are listed in Table 1. Grid cells and months that did not meet the corresponding threshold were assigned NoData (−9999) and excluded from subsequent drought-index calculations.
For the trend analysis, linear regression was performed independently at each grid cell using the monthly index values from January 2025 to December 2100. Time was used as the independent variable, and the regression slope was used to represent the temporal trend. Statistical significance was evaluated using the p-value associated with the regression slope, with p < 0.05 used as the nominal significance threshold. For visualization of spatially coherent significance, the grid-cell results were further summarized into non-overlapping 10 × 10 grid-cell blocks, and a gray dot was plotted at the center of a block when at least 90% of its cells showed significant trends.
2.3. Drought Index Calculation
This study calculated four drought indices, including SPEI, SSMI, TCI, and DSI.
2.3.1. SPEI
The SPEI is a widely used drought index that integrates precipitation and PET to evaluate the water balance over a defined time period.
where S is the water balance value (unit: mm/month), P is the precipitation (unit: mm/month), PET is the potential evapotranspiration (unit: mm/month).
where n represents the time scale (e.g., n = 12 for 12 months), Si is the water balance value for the i-th month (unit: mm/month).
where x is the cumulative water balance value (unit: mm/month), α, β, and γ are the scale, shape, and location parameters, respectively, estimated using the maximum likelihood estimation method.
where F(x) represents the cumulative probability for a given Scumul (dimensionless).
where Φ−1 is the inverse of the standard normal cumulative distribution function (the probit function). SPEI values therefore follow a standard normal distribution with a mean of 0 and a standard deviation of 1. The SPEI values are classified to determine drought or wetness severity based on the thresholds listed in Table 2.
S = P − PET
SPEI = Φ−1(F(x))
Table 2.
Classification of Drought and Wetness Severity Based on SPEI Values.
In this study, SPEI was computed at a twelve-month timescale (SPEI-12), corresponding to n = 12 in Equation (2). The timescale determines which temporal characteristics the index emphasizes: short timescales such as one or three months capture rapid, sub-seasonal fluctuations in the water balance, whereas longer timescales reflect sustained, year-to-year moisture deficits. Because this study focuses on the long-term evolution of drought and on future drought risk across SSP scenarios over the period 1850–2100, the twelve-month scale was adopted to represent persistent, annual-scale water-balance anomalies rather than short-term variability. SPEI-12 also complements the other indices used here, which characterize drought at different temporal scales, providing a multi-scale perspective on drought behavior.
2.3.2. SSMI
Table 3.
Classification of Drought and Wetness Severity Based on SSMI Values.
In this study, SSMI was standardized separately for each SSP at each grid cell. For a given SSP, the time series used for calculating the mean and standard deviation consisted of the historical period (1850–2014) followed by the corresponding SSP projection (2015–2100), resulting in a continuous 1850–2100 series. Thus, the four SSPs were standardized independently, and data from different SSP scenarios were not pooled into a single normalization series.
2.3.3. TCI
TCI, a widely used drought indicator based on land surface temperature (LST), is designed to quantify thermal stress on vegetation in a given region. TCI reflects the relative position of the current surface temperature within its historical range, providing insight into the impact of thermal stress on vegetation. Within the CMIP6-based framework adopted in this study, surface temperature over land is represented by the CMIP6 variable ts (unit: K). Accordingly, ts is used as the model-based surface temperature input corresponding to the LST term in the TCI formulation.
where Ti refers to the LST at time i (unit: K). Tmax is the maximum LST during the study period, and Tmin is the minimum LST during the same period.
The TCI values range from 0% to 100%, providing a direct measure of heat stress on vegetation. High TCI values (TCI > 50%): Indicate that the current temperature is closer to the historical minimum, suggesting low heat stress, which is beneficial for vegetation growth. Low TCI values (TCI < 50%): Indicate that the current temperature is closer to the historical maximum, reflecting severe heat stress that may inhibit vegetation growth.
2.3.4. DSI
The DSI used in this study is calculated from the monthly climatic water balance and follows standardized climatic water-balance and Z-score approaches used in previous drought studies [33,34]. At each monthly time step, climatic water balance is first calculated as
where WB is the water balance value (unit: mm/month), P is the precipitation (unit: mm/month), PET is the potential evapotranspiration (unit: mm/month). This represents the net water available in the system after accounting for losses due to evapotranspiration.
where X is the current value of water balance (unit: mm/month). μ is the long-term mean of the variable (unit: mm/month), and σ is the long-term standard deviation of the variable (unit: mm/month). Table 4 presents the classification of drought and wetness severity based on DSI values.
WB = P − PET
Table 4.
Classification of Drought and Wetness Severity Based on DSI Values.
In this study, DSI was standardized separately for each SSP at each grid cell. For a given SSP, the time series used for calculating the mean and standard deviation consisted of the monthly water-balance values from the historical period (1850–2014) followed by those from the corresponding SSP projection (2015–2100), resulting in a continuous 1850–2100 series. The mean and standard deviation were calculated from all valid monthly values in this pathway-specific series and were applied consistently throughout the series. Thus, the four SSPs were standardized independently.
All data processing and drought index calculations were performed in Python (v3.10.16), using a variety of libraries for data manipulation, analysis, and visualization. Data handling was performed with pandas and NumPy (v2.2.6), while xarray (v2025.6.1) and netCDF4 (v1.7.4) were used to process NetCDF files. Spatial analysis was conducted with rasterio (v1.4.3) and GeoPandas (v1.0.1), and visualization was carried out with Matplotlib (v3.9.4) and seaborn. For statistical analysis, SciPy (v1.15.2) and statsmodels were used. These tools together supported the computation of the drought indices and the scenario-based analyses.
3. Results
3.1. Comparison of Drought Index Behavior Across Documented Drought-Affected Regions
To compare how the four drought indices characterize drought-prone conditions across representative regions, five well-documented recent drought events were selected to identify representative drought-affected regions and their characteristic drought seasons. These include the severe drought in Europe in 2022, the prolonged drought in the Horn of Africa from 2020 to 2023, the “Mega Drought” in central Chile since 2010, the historic drought in the western United States in 2022, and the extreme drought in southern China in 2022. These documented events are used as regional and seasonal references rather than as year-specific validation targets for the free-running CMIP6 simulations. Based on the four SSP scenarios, Table 5 summarizes the drought conditions characterized by SPEI, TCI, DSI, and SSMI across these five representative regions, providing a comparative overview of the responses of the four indices.
Table 5.
Description of Drought Categories Based on Four Drought Indices in August 2022.
3.1.1. Severe European Drought (2022, Europe)
In the summer of 2022, Europe experienced one of the most severe droughts in modern history. According to the European Drought Observatory, nearly two-thirds of the European continent faced drought alerts or warnings by August 2022. This event marked the most severe drought in Europe in the past 500 years [35]. Central and southern Europe suffered from extreme drought, leading to critically low soil moisture and river water levels. This crisis severely affected multiple sectors across numerous countries. The consequences included restrictions on municipal water supply, reduced crop yields, widespread wildfires, decreased hydropower generation, limited river navigation, and compromised dam stability [36]. The EU’s agricultural sector sustained significant production losses, particularly in key crops. Corn yields decreased by 16 percent relative to the five-year average. Similarly, soybean production fell by 15 percent, while sunflower seed output declined by 12 percent [36,37]. In France, for example, hydropower generation decreased due to depleted reservoirs, and several nuclear power plants faced cooling water shortages caused by low river levels. Inland shipping operations faced major disruptions due to falling water levels. The Rhine River’s declining water levels, for example, increased transportation costs and disrupted supplies of critical commodities including coal and oil. The drought caused serious ecological consequences across European waterways. In Italy’s Po River, water levels fell to record lows, exposing historical artifacts that included sunken ships and ancient bridges. The widespread societal impacts of this drought have underscored the urgency of improved water resource management, and the scientific community has begun to document the event in detail [38,39,40]. Figure 1 shows the drought conditions represented by the four indices in this region across the four SSP scenarios.
Figure 1.
Drought Conditions Characterized by the Four Indices in Europe in August 2022.
3.1.2. Persistent Drought in the Horn of Africa (2020–2023, East Africa)
As of February 2022, parts of the Horn of Africa were experiencing a multi-season drought. Rainfall during the 2020 short rains (October to December), the 2021 long rains (March to May), and the 2021 short rains had all fallen below normal levels. This prolonged drought has exacerbated the region’s ongoing food security crisis. The United Nations has described this drought as the worst in 40 years [41,42]. Agricultural systems in Kenya, Ethiopia, and Somalia have nearly collapsed, with sharp declines in food production and severe pasture degradation. Since the onset of the drought in October 2020, at least 36.1 million people have been affected across the region—24.1 million in Ethiopia, 7.8 million in Somalia, and 4.2 million in Kenya [43]. According to the Food Security and Nutrition Working Group, more than 20.5 million people in Ethiopia, Somalia, and Kenya face acute food insecurity and worsening malnutrition. This number was projected to rise to between 23 and 26 million by February 2023. The drought has also caused widespread livestock deaths, while water scarcity has led to the spread of disease and serious public health issues. Ecologically, the region has suffered extensive impacts, including wildlife mortality and grassland degradation. This drought is not only a climate crisis but also a humanitarian catastrophe, forcing millions to migrate to less affected areas [43,44]. Figure 2 shows the drought conditions represented by the four indices in this region across the four SSP scenarios.
Figure 2.
Drought Conditions Characterized by the Four Indices in the Horn of Africa in August 2022.
3.1.3. “Mega Drought” in Central Chile (2010–Present, South America)
Central Chile, where more than 10 million people live, has faced ongoing drought since 2010. The region’s annual average precipitation has dropped by 20% to 40% compared to historical levels. This event, known as the “Mega Drought”, is the longest-lasting drought recorded in the region’s history and is considered extremely rare over the past several millennia. Its impacts have been widespread, severely affecting water supply, causing vegetation degradation, and increasing the frequency and severity of wildfires. Over time, it has evolved into a crisis with profound social and economic consequences [45]. The agricultural and viticultural sectors have been most severely affected. Many orchards and vineyards have experienced total crop failure, and livestock deaths have increased sharply. To deal with the water shortage, the city of Santiago introduced a zone-based water rationing policy. In some remote towns, drinking water had to be delivered by fire trucks. In early 2023, the prolonged drought coincided with extreme heat. This combination led to massive wildfires that swept through the region, burning more than 425,000 hectares of forest. These fires were among the most severe the area has experienced in recent years [46]. Figure 3 shows the drought conditions represented by the four indices in this region across the four SSP scenarios.
Figure 3.
Drought Conditions Characterized by the Four Indices in Central Chile in August 2022.
3.1.4. Historic Drought in Western U.S. (2022, North America)
According to the U.S. Drought Monitor report of 10 June 2022, 88.5% of the land in the western United States was experiencing drought. These conditions extended across California, Nevada, Arizona, New Mexico, Utah, Idaho, Montana, Oregon, and Washington. Of this area, 55% was classified as experiencing “extreme drought.” In Utah alone, about 90% of the land was under extreme drought, and 64% was classified as “exceptional drought,” the most severe level. Arizona (87% in extreme drought), California (85%), and Nevada (76%) reported similarly severe conditions. Drought conditions were expected to persist and intensify through the summer across much of the Southwest, California, and parts of the Pacific Northwest and Missouri River Basin, with severe to exceptional drought anticipated in these areas. More than 58 million people in the region were living under drought conditions [47,48]. In California, major reservoirs were holding only about half of their usual water levels. This situation led states to issue emergency water conservation orders. The drought also caused a sharp drop in water availability across the Colorado River Basin. This reduced hydropower output and increased pressure on the regional energy supply. Figure 4 shows the drought conditions represented by the four indices in the western United States across the four SSP scenarios.
Figure 4.
Drought Conditions Characterized by the Four Indices in the Western U.S. in August 2022.
3.1.5. Extreme Drought in Southern China (2022, Asia)
Southern China has a dense population and a highly developed economy. Over the past few decades, the region has experienced several prolonged droughts, which have had major impacts on economic development [49,50,51,52]. In the summer and autumn of 2022, southern China experienced a record-breaking drought. The areas most affected were those south of the middle and lower reaches of the Yangtze River. Poyang Lake, the largest freshwater lake in China, fell to its lowest water level on record. In Jiangxi Province, a central region of China, a “red alert” for water supply was issued for the first time in history. Normally serving as a major outlet for floodwaters from the Yangtze River—China’s longest river—Poyang Lake had been suffering from drought since June. At a key monitoring point, the water level fell from 19.43 m to just 7.1 m over the span of three months. The drought-affected regions including Chongqing, Sichuan, Jiangxi, and Hunan, damaging a total of 6.09 million hectares of crops and causing direct economic losses of CNY 51.2 billion (approximately USD 7.6 billion) [53]. In addition to agriculture, the drought severely disrupted river navigation, electricity generation, water supply systems, and ecosystems throughout the Yangtze River Basin. Figure 5 shows the drought conditions represented by the four indices in southern China across the four SSP scenarios.
Figure 5.
Drought Conditions Characterized by the Four Indices in Southern China in August 2022.
3.1.6. Seasonal Distribution of Drought Occurrence
To examine how the four indices distribute drought occurrence within the year, this study computed the monthly frequency of drought over the historical period 1985–2014. A grid cell was counted as being in drought when SPEI, DSI, or SSMI fell below −1.0, or when TCI fell below 50%, consistent with the classification thresholds given in Section 2.3. Figure 6 shows the resulting monthly distribution for the five regions, with the months of the documented drought events shaded; Table 6 compares drought frequency inside and outside those months. The documented event months are used here as seasonal references, and the analysis examines whether the climatological seasonal distribution of simulated drought occurrence is concentrated in a similar part of the annual cycle rather than whether the simulations reproduce the specific documented events.
Figure 6.
Seasonality of simulated drought over the five drought-affected regions examined (1985–2014). Letters on the horizontal axis denote the initials of the calendar months, from January (J) to December (D).
Table 6.
Distribution of simulated drought relative to the months of the documented drought event in each region (1985–2014).
Over Europe, central Chile, and the western United States, DSI and SSMI concentrate drought almost entirely within the shaded months, and in all three regions the month of highest drought frequency falls inside the event window. The same tendency appears over southern China, where both indices place drought in late summer and autumn. SPEI shows essentially no change in drought frequency between the event months and the remainder of the year. TCI likewise shows no correspondence with the event months, and its maximum drought frequency generally occurs in winter.
Taken together with the spatial patterns in Figure 1, Figure 2, Figure 3, Figure 4 and Figure 5, these results indicate systematic differences in the behavior of the four indices under the formulations adopted in this study. SPEI was calculated at a 12-month accumulation scale (SPEI-12), which integrates water-balance conditions over the preceding 12 months. Its relatively weak within-year variation is therefore partly associated with this temporal formulation and should not be generalized to SPEI calculated at shorter accumulation scales. TCI is derived from surface temperature and was classified using a binary threshold in this study, resulting in a coarser representation of drought conditions than the multi-level classifications used for the other indices. DSI and SSMI show stronger seasonal concentration in several of the examined regions, although the degree of correspondence varies among regions.
This comparison characterizes differences in the behavior of the indices within the CMIP6 modelling framework adopted here, rather than their accuracy relative to observations; no independent evaluation against observational, reanalysis or other benchmark datasets was undertaken. Within these limits, DSI and SSMI provided the most internally consistent and temporally informative representation among the four indices considered, and the subsequent analysis of future drought evolution is therefore based primarily on these two.
3.2. Trend Analysis of Three Drought Severity Levels
To better understand how future drought severity may change under different climate scenarios, this study carried out a spatial analysis. The extent of moderate, severe, and extreme drought was calculated using the two indices identified above, DSI and SSMI. For each month, a grid cell was counted as affected at a given severity level when the index value I (DSI or SSMI) fell within the corresponding range defined in Table 2 and Table 3: moderate drought for −1.5 ≤ I < −1.0, severe drought for −2.0 ≤ I < −1.5, and extreme drought for I < −2.0. These calculations were conducted across the four SSP scenarios, allowing a comparative assessment of projected drought area changes. Table 7 presents the rates of change in drought-affected areas for different severity levels and under the four SSP scenarios. Figure 7 further illustrates these trends, showing the temporal evolution of drought-affected areas from 1850 to 2100.
Table 7.
Drought Area Change Rates (km2/year) Across SSPs and Periods.
Figure 7.
Area Change Trend of Three Drought Severity Levels.
3.2.1. Analysis and Description of Drought Severity Changes Under Different Indices (DSI and SSMI) and SSPs
Figure 7 shows that DSI exhibits distinct patterns of drought severity change across the four SSP scenarios. Under the low-emission scenario (SSP1-2.6), the increase in drought area is limited, and the severe and extreme drought areas show little further growth toward the end of the century. However, under the high-emission scenario (SSP5-8.5), the severe and extreme drought areas increase markedly after 2015, while the moderate drought area remains close to its earlier level. The rise is especially sharp for extreme drought. This indicates that high-emission pathways are associated with a shift toward more intense drought rather than a uniform expansion of drought area.
SSMI exhibits a smoother trend than DSI across the four SSP scenarios. However, severe and extreme drought areas generally show more pronounced growth under higher-emission scenarios, particularly SSP5-8.5. Under the adopted standardization, this suggests a greater expansion of areas classified as severe or extreme soil-moisture drought, with potential implications for agricultural and ecological stress.
The trend analysis of the three drought severity levels shows differences in their behavior. Moderate drought (yellow line) covers the largest area for most of the period, but changes little over time. In contrast, the severe and extreme drought areas increase steadily, and under high-emission scenarios the extreme drought area increases most rapidly. This suggests that future droughts are projected to become more intense.
3.2.2. Analysis of Drought Change Patterns and Implications Across Different SSPs
Under the adopted pathway-specific standardization, SSP5-8.5 shows the highest rate of increase in extreme drought area for both DSI and SSMI over the future period (2015–2100), indicating a marked expansion of this category relative to the reference distribution used for that pathway. In contrast, SSP1-2.6 shows lower rates of increase in severe and extreme drought areas for both indices than the other three scenarios. Under the intermediate scenarios (SSP2-4.5 and SSP3-7.0), the extreme drought area growth rates for both indices fall between those of SSP1-2.6 and SSP5-8.5. These contrasts describe differences in the evolution of relative drought conditions under the adopted pathway-specific standardization. Because the reference distributions differ across pathways, the contrasts cannot be attributed solely to differences in emissions or used on their own to quantify the drought-reduction benefits of mitigation. The implications for cross-scenario comparability are discussed in Section 4.4.
3.2.3. Comparison of Temporal Sensitivity and Stability Between DSI and SSMI
A comparison of the drought area changes indicated by DSI and SSMI reveals clear differences between the two indices. DSI shows larger variations, particularly under the higher-emission scenarios, whereas SSMI varies more smoothly and follows a comparatively more stable temporal pattern. These differences are particularly evident in the severe and extreme drought categories, for which the affected area increases more markedly toward the end of the century. DSI and SSMI therefore exhibit contrasting temporal variability in projected drought-affected area. Used together, the two indices provide complementary perspectives on drought evolution from climatic water-balance and soil-moisture perspectives, which is relevant for interpreting future changes in drought conditions.
3.3. Global Drought Trend Analysis
In 2025, the drought distribution indicated by DSI in Figure 8 shows that the most severely affected regions include the southwestern United States, northern South America (e.g., near Venezuela), southern Africa, the Mediterranean, Southeast Asia, parts of East Asia, and eastern Australia. SSMI indicates a broader extent, with the greatest drought impacts across much of North and South America, northern and southern Africa, the Mediterranean, parts of Europe, East Asia, and parts of Australia. Differences among the four SSP scenarios are also apparent in Figure 8.
Figure 8.
Global Drought Distribution in 2025.
Within the adopted CMIP6 framework, DSI tracks monthly changes in precipitation and potential evapotranspiration; this monthly response suggests potential value for characterizing short-term dry conditions in temperate and subtropical regions. In 2025, DSI shows stronger drought signals in South America, eastern Australia, and Southeast Asia, and this pattern appears consistently across all four SSP scenarios. In contrast, SSMI reflects medium- to long-term soil-moisture dynamics and indicates water deficits in arid and semi-arid regions. In areas such as North Africa, Mongolia, and the Middle East, SSMI shows marked soil moisture depletion across all four scenarios. This spatial consistency suggests potential value for model-based drought assessment in these regions, although its suitability for long-term drought monitoring remains to be evaluated independently.
Figure 9 traces how the two indices evolve from 2025 to 2100 across the emission pathways. For DSI, drought stays mild and limited in extent under SSP1-2.6. As greenhouse gas concentrations rise under SSP2-4.5, the affected areas widen and drought intensity increases, and under SSP3-7.0 conditions worsen and spread further. The SSP5-8.5 panel shows the largest drought extent of the four, with intense and widespread conditions across much of the world; southern North America, northern South America, Africa, East Asia, Southeast Asia, and eastern Australia show markedly greater extent and intensity than under the lower-emission pathways.
Figure 9.
Global Drought Trend Analysis from 2025 to 2100 (Trend: month−1). Gray dots indicate 10 × 10 grid-cell blocks where at least 90% of cells show significant trends (p < 0.05).
The SSMI results follow a similar gradient. Under SSP1-2.6, the drought-affected areas stay relatively stable and center on eastern North America, North Africa, parts of Asia, and eastern Australia; although soil moisture declines there, the overall impact remains contained. The loss deepens under SSP2-4.5 and raises drought pressure in several regions, then continues to grow under SSP3-7.0 alongside rising water resource stress. The SSP5-8.5 panel shows the greatest soil moisture loss, concentrated over eastern and southern North America, northern South America, North Africa, northern Asia, East Asia, and parts of Australia. These regions face more severe water shortages, and the loss of soil moisture adds to the pressure on agriculture. As greenhouse gas concentrations continue to rise, regions exhibiting drying trends generally show stronger drying under the higher-emission pathways, while some regions exhibiting wetting trends also show enhanced wetting.
Under the SSP3-7.0 and SSP5-8.5 scenarios, drought conditions are markedly more severe than under SSP1-2.6 and SSP2-4.5. As greenhouse gas concentrations continue to rise, global drought conditions are projected to worsen, particularly in South America, Africa, Australia, and parts of Asia. Many areas already experiencing severe drought in 2025 are projected to become substantially drier by 2100, and these regions also show the greatest increase in drought over the period. This spatial persistence suggests that present-day drought patterns may provide a useful indication of where future risk will concentrate. By 2100, southern North America, northern South America, Africa, eastern Australia, and parts of Asia, including southern China and Southeast Asia, emerge as the principal projected drought hotspots under the CMIP6 ensemble framework. As drought becomes more widespread and intense, the associated impacts are likely to be substantial. Water resources may become scarce, agriculture may face greater stress, and ecosystems may become more vulnerable to damage. As climate change intensifies, drought in these regions is likely to have serious consequences, particularly for agriculture and water resource management. These areas are emerging as key regions of high drought sensitivity globally.
The results presented in this section are based on the multi-model ensemble mean, in which the fields from individual CMIP6 models are averaged at each grid cell before the drought indices are computed. This approach combines information from the available models, but the spatial patterns in Figure 8 and Figure 9 do not establish the extent of model agreement. The nominal statistical significance shown in Figure 9 should not be interpreted as evidence of such agreement. Ensemble averaging can smooth temporal fluctuations and spatial contrasts that differ among models, although its effect on the magnitude of the resulting drought changes has not been assessed here. Inter-model uncertainty was not quantified in this study, and a more detailed assessment remains a useful direction for further work. The implications of these limitations are discussed in Section 4.4.
4. Discussion
4.1. Consistency of the Present Findings with Previous Studies
With the continued intensification of climate change, global drought conditions are becoming increasingly severe. Observational records of precipitation, runoff, and drought indices show a clear trend. Since the 1950s, droughts have become more severe in most land areas. Looking ahead, drought risk is expected to increase further over the 21st century. Various climate models project that many regions will experience more severe and widespread droughts in the next 30 to 90 years.
Against the backdrop of climate change, global warming is expected to substantially increase drought hazard in regions that frequently experience drought. These risks include longer durations and greater intensity of drought events. Moreover, droughts are expected to cover larger areas in the future. Regions that are already warm and dry, such as southern Africa and the Mediterranean, may become even hotter and drier [54,55,56,57]. Existing research has identified several high-risk drought regions, including the Mediterranean, Central America, and southern Africa [58], the Amazon Basin [59], the southwestern United States [56,60], as well as parts of East Asia, West Asia, and Australia [61]. These areas are already experiencing frequent drought events, along with persistent aridity and marked soil moisture deficits. The future drought projections in this study support the findings of earlier research. They are also consistent with the spatial patterns of drought risk identified previously. The results of this study indicate that, under high-emission scenarios, drought conditions are projected to intensify across regions including South America, Africa, northern and southern Asia, eastern Australia, and the southern United States. In these areas, the extent and severity of drought are expected to intensify further. This consistency indicates that the projected spatial patterns are broadly aligned with those reported in previous studies. These corresponding areas should thus be prioritized in future adaptation planning and drought risk management strategies.
4.2. Climate Warming as a Core Driver of Global Change and Its Impact on Drought
Climate warming is a major driving force behind global change. It can exacerbate drought severity and accelerate drought development [62]. This is mainly due to the combined effects of reduced precipitation, increased evapotranspiration, or both [55].
Specifically, climate warming influences drought in several key ways. As global temperatures continue to rise, evaporation rates increase sharply. This effect is especially strong in arid and semi-arid regions. In these areas, water quickly evaporates from soils and water bodies, making water scarcity even worse. In addition, higher temperatures raise atmospheric water vapor levels, resulting in more intense precipitation events. However, this type of precipitation is often unevenly distributed. It usually comes as heavy rainfall over a short period. As a result, it does not effectively recharge groundwater and can even lead to flooding.
Beyond the direct increase in temperatures, climate warming has also substantially altered global and regional precipitation patterns. Many regions are experiencing declining precipitation trends, particularly in tropical and subtropical areas. Climate change has caused precipitation to become more seasonal and less stable across regions. This shift has led to more frequent and longer-lasting drought events. At the same time, climate warming has altered atmospheric circulation patterns. These changes affect moisture transport between wet and dry regions. As a result, areas that are already vulnerable become more likely to experience drought. In particular, under high-emission scenarios, climate warming exerts a stronger influence on the hydrological cycle, leading to increased drought risks globally.
The impact of drought also varies substantially under different global greenhouse gas emission scenarios. According to the IPCC Sixth Assessment Report, under SSP5-8.5, global temperature is projected to increase by over 4 °C by the end of this century, which would profoundly affect drought occurrence. Climate models project that under SSP5-8.5, the world will experience more frequent and severe extreme drought events, especially in tropical and subtropical regions. These regions are already at high drought risk, and the combination of higher temperatures and intensified evaporation will further exacerbate water crises. In contrast, low-emission scenarios such as SSP1-2.6 are associated with a smaller rise in global temperatures. Although drought risks from climate change will still exist, the severity and frequency will be relatively lower. Under low-emission scenarios, reducing greenhouse gas emissions can slow global warming. This provides valuable time to develop and implement future climate adaptation strategies [63]. Therefore, controlling greenhouse gas emissions not only helps mitigate climate warming trends but also effectively reduces the risk of drought, supporting the sustainable use of water resources.
4.3. Human Influences, Drought Risk and Implications for Adaptation
The results should also be interpreted in the context of human influences on the hydrological cycle. Previous studies have shown that human water use, reservoir regulation, land-use change and agricultural irrigation can substantially modify runoff and soil moisture processes, and thereby affect the timing, duration and severity of hydrological drought [64,65]. Across much of Asia, the Middle East and the Mediterranean, the relative contribution of human activity to changes in drought severity has been reported to approach 100% [65], while reservoirs can alleviate drought by storing water during wet seasons and increasing availability during dry seasons, an effect that is particularly evident over large parts of Europe and North America [65]. Conversely, excessive land reclamation and unsustainable land use have led to soil degradation. At the same time, over-extraction of water resources has caused groundwater levels to decline. These problems make water scarcity even more serious. In some arid regions, agriculture depends heavily on irrigation. When this irrigation relies on groundwater, it accelerates the depletion of water resources.
The present study is confined to the climatic component: the indices used here are derived entirely from CMIP6 output and represent drought arising from the atmospheric water balance, land surface temperature and soil moisture, without accounting for direct human intervention in the water cycle. The conditions projected here should therefore be understood as the climate-driven component, which may be amplified or offset by water management at the regional scale. Incorporating the interaction between climate change and human water use is therefore a necessary step in future drought projection.
It should further be noted that an increase in future drought hazard does not necessarily imply the same level of drought risk across regions. Studies have shown that if current warming trends continue, the gap between water supply and demand could increase fivefold in large parts of Africa, Australia, southern Europe, the southern and central United States, Central America, the Caribbean, northwestern China, and parts of South America. Previous research has shown that future drought risk depends not only on changes in drought frequency and severity but also on changes in population exposure and socioeconomic vulnerability [66]. Regions with lower levels of human development generally have lower adaptive capacity and may therefore experience more severe socioeconomic impacts under comparable levels of hazard; sub-Saharan Africa and South Asia in particular face the most severe future drought risk precisely because hazard, exposure and vulnerability coincide there [66].
The drought hotspots identified in this study should therefore be regarded not only as regions of increasing climatic drought hazard, but also as areas requiring particular attention in water resource management, agricultural adaptation and ecosystem protection. For example, optimizing the allocation and use of water resources, adopting water-saving agricultural technologies, and enhancing the drought resistance of urban water systems can all help mitigate the impacts of drought [67,68]. Integrating drought hazard with population exposure and socioeconomic vulnerability, so as to extend the assessment from hazard towards comprehensive drought risk, is a useful direction for further work.
4.4. Methodological Limitations and Uncertainty
Several methodological considerations should be taken into account when interpreting the present results. The regional drought events referred to in this study are used only as regional and seasonal references rather than as observational validation targets, and the analysis itself is based on CMIP6 simulations. In addition, the specific multi-model ensemble fields used in this study were not independently evaluated against observational or reanalysis datasets. Previous evaluations of CMIP6 models provide useful general context, but they do not constitute a direct validation of the particular ensemble constructed here. Accordingly, the results should primarily be interpreted as a comparative assessment within the CMIP6-based framework. Similarly, agreement between the projected drought-prone regions identified here and those reported in previous studies is treated as a qualitative consistency check rather than as an independent assessment of robustness.
An additional source of uncertainty arises from the variable-specific composition of the multi-model ensemble. Precipitation, surface temperature, and moisture in the upper portion of the soil column are represented by a larger set of CMIP6 models than potential evapotranspiration. SPEI and DSI should therefore be interpreted as ensemble-level diagnostics within the adopted framework rather than as ensemble means of water-balance estimates calculated independently for the same set of individual models. The limited availability of PET simulations should consequently be considered when interpreting the magnitude and long-term evolution of these indices. Precipitation, surface temperature, and moisture in the upper portion of the soil column are represented by sixteen CMIP6 models, whereas potential evapotranspiration is represented by three. Consequently, the water-balance component used in SPEI and DSI combines ensemble-mean precipitation and PET fields derived from different model populations. This approach retains the available information for each input variable, but it does not preserve a one-to-one model correspondence between precipitation and PET. Differences between these model populations may affect the resulting water balance. The comparisons involving SPEI and DSI in Section 3.1 may therefore reflect differences in input-model composition as well as index formulation, and these contributions cannot be separated in the present analysis. Likewise, the DSI drought areas and trends reported in Section 3.2 are conditional on this combination of precipitation and PET ensembles.
SSMI and TCI do not involve this particular cross-variable matching issue, although all four indices remain affected by the use of averaged inputs before index calculation. Ensemble averaging can smooth temporal fluctuations and spatial contrasts that differ among models, so the resulting fields do not retain the full range of conditions simulated by individual models. For the index comparisons in Section 3.1, standardization parameters depend on the input series used, and SPEI additionally involves distribution fitting; computing indices from ensemble-mean inputs is therefore not generally equivalent to averaging individual-model indices. For the DSI and SSMI analyses in Section 3.2, drought areas and their trends derived from ensemble-mean inputs are not generally equivalent to the averages of the corresponding results calculated separately for individual models. These effects do not establish whether the reported drought changes are systematically underestimated or overestimated. Moreover, the ensemble-derived results do not show the spread among models or how many models support a particular regional pattern or trend direction. The reported drought-area changes and projected regional patterns should therefore be interpreted as characteristics of the constructed ensemble fields; inter-model uncertainty was not quantified in this study and their consistency across individual models remains unassessed. Assessing this uncertainty and the sensitivity to ensemble construction would require model-by-model calculations using the necessary inputs, with matched precipitation and PET inputs for SPEI and DSI, potentially involving additional data collection.
The four drought indices differ in their effective temporal formulation. Although all four indices yield monthly values, SPEI was calculated at a 12-month accumulation scale (SPEI-12), so each monthly SPEI value integrates climatic water-balance conditions over the preceding 12 months. In contrast, TCI, DSI, and SSMI are calculated from monthly input fields without a comparable 12-month accumulation. Differences among the indices may therefore partly reflect their distinct temporal formulations as well as the climatic variables represented by each index. The comparison should consequently be interpreted as a comparison of index behavior under the adopted formulations rather than as a strictly scale-matched evaluation.
Pathway-specific standardization introduces a further consideration when interpreting Figure 7 and Table 7. DSI and SSMI were standardized separately for each SSP using the concatenated historical simulation (1850–2014) and the corresponding future projection (2015–2100). This procedure expresses water-balance and soil-moisture conditions relative to the mean and variability of each pathway’s full historical–future series, rather than relative to a fixed historical baseline. Although the historical input fields are identical across pathways, differences in the future projections can produce different reference means and standard deviations. Consequently, the same historical input can yield different standardized index values, and fixed drought-category thresholds can correspond to different ranges of the underlying variables. This explains the differences in historical drought-area levels in Figure 7 and historical drought-area trends in Table 7. These differences arise from pathway-specific standardization and subsequent drought classification, rather than from differences in the simulated historical climate.
Within each pathway, the historical and future periods share the same standardization parameters, allowing their relative evolution to be examined against a common pathway-specific reference. Across pathways, however, the reference distributions differ. The greater increases in extreme-drought area under higher-emission pathways shown in Figure 7 and Table 7 should therefore be interpreted as results under the adopted standardization. Cross-pathway contrasts may reflect both differences in projected climate and differences in the standardization reference; the contribution of the latter to their magnitude and ordering has not been assessed. Accordingly, the cross-scenario comparisons in Section 3.2 should not be attributed solely to differences in emissions or used on their own to quantify the drought-reduction benefits of mitigation. Using a fixed historical baseline shared by all pathways would remove the historical differences attributable to pathway-specific standardization and provide a common reference for cross-pathway comparisons. Evaluating the sensitivity of the findings to this alternative remains a direction for future work.
5. Conclusions
This study compares the behavior of different drought indices under the four SSP scenarios and explores the influence of climate change on future global drought trends. Within the adopted CMIP6 framework and index formulations, DSI and SSMI appeared to characterize drought more consistently than SPEI-12 and TCI in the regions examined, both in their seasonal correspondence with the reference drought windows and in the spatial structure of the simulated drought fields, suggesting their complementary value for characterizing drought dynamics in these simulations. A comparison of DSI and SSMI trends shows that DSI reflects variations in climatic water balance associated with precipitation and potential evapotranspiration and exhibits larger variations in drought-affected area, whereas SSMI reflects soil moisture variations and shows a comparatively smoother temporal response. These differences suggest that DSI may provide useful information on climatic water balance variations in temperate and subtropical regions, whereas SSMI may provide complementary information on soil moisture deficits in arid and semi-arid areas. Notably, SSMI indicates an amplification of spatial drying and wetting tendencies under higher-emission scenarios, highlighting increasing spatial differentiation in projected soil moisture conditions. Meanwhile, DSI more directly reflects the overall increasing tendency of drought conditions globally. The complementary temporal and spatial characteristics of these two indices make their joint consideration useful for characterizing future drought evolution within the framework of this study.
Future droughts are expected to become more severe and widespread, particularly in regions such as southern North America, northern South America, Africa, eastern Australia, and parts of Asia (e.g., southern China and Southeast Asia). Under high-emission scenarios, these areas are expected to experience a larger extent of severe and extreme drought. Reduced precipitation and higher evapotranspiration make them major global drought risk regions. Under the high-emission scenario SSP5-8.5, extreme drought areas expand rapidly, and drought severity increases markedly. This suggests that without effective emission controls, the global population would face more serious drought challenges in the future. In contrast, the low-emission scenario SSP1-2.6 shows a slower increase in drought-affected areas. It is also associated with fewer extreme droughts, highlighting the important role of mitigation strategies in lowering future drought risks. Moderate-emission scenarios such as SSP2-4.5 and SSP3-7.0 may not completely prevent further deterioration. However, they can slow its development, showing that even partial mitigation efforts are valuable.
The combined use of DSI and SSMI provides complementary information for assessing future drought conditions and may improve the characterization of their spatial and temporal evolution within the adopted CMIP6 framework; this potential benefit remains to be evaluated independently. These results highlight the importance of carefully selecting and interpreting drought indices under climate change. As global warming continues, drought conditions are likely to pose increasing challenges to water resources, agriculture, and ecosystems. The differences among the SSP scenarios further indicate the potential importance of coordinated mitigation and adaptation strategies for reducing future drought-related impacts.
Author Contributions
Writing—original draft, software, visualization, validation, investigation, formal analysis, and data curation, J.C.; writing—review and editing, supervision, project administration, methodology, funding acquisition, and conceptualization, Y.L. All authors have read and agreed to the published version of the manuscript.
Funding
This research was funded by the National Natural Science Foundation of China (grant number 42101475); the Youth Talent Program of the State Key Laboratory of Resources and Environmental Information System (grant number YKPI502); and the Tibet Autonomous Region Key R&D Science and Technology Program Project: Research and Development of Key Technologies for Resource Exploration and Industrial Value Enhancement of “Tibet Good Water”.
Data Availability Statement
The data used in this study were obtained from multiple sources. Monthly precipitation, volumetric soil moisture in the upper soil layer, and surface temperature were retrieved from CMIP6 outputs via the Copernicus Climate Data Store (CDS): https://cds.climate.copernicus.eu/ (accessed on 25 November 2024). Potential evapotranspiration (PET) data were acquired from CMIP6 models through the ESGF Data Portal: https://esgf-node.llnl.gov/projects/cmip6/ (accessed on 25 November 2024). The Global Multi-Resolution Terrain Elevation Data 2010 (GMTED2010) dataset was obtained from the United States Geological Survey (USGS): https://earthexplorer.usgs.gov/ (accessed on 29 September 2026). Data will be made available on request.
Acknowledgments
The authors thank the reviewers and editors for their constructive comments and suggestions, which helped improve the manuscript. The authors are also grateful to Qian Song for her encouragement and assistance during the research.
Conflicts of Interest
The authors declare no conflicts of interest.
Abbreviations
The following abbreviations are used in this manuscript:
| SPEI | Standardized Precipitation Evapotranspiration Index |
| TCI | Temperature Condition Index |
| SSMI | Standardized Soil Moisture Index |
| DSI | Drought Severity Index |
| CMIP6 | Coupled Model Intercomparison Project Phase 6 |
| SSP | Shared Socioeconomic Pathway |
| LST | Land Surface Temperature |
| PET | Potential Evapotranspiration |
References
- Allen, C.D.; Macalady, A.K.; Chenchouni, H.; Bachelet, D.; McDowell, N.; Vennetier, M.; Kitzberger, T.; Rigling, A.; Breshears, D.D.; Hogg, E.H.; et al. A Global Overview of Drought and Heat-Induced Tree Mortality Reveals Emerging Climate Change Risks for Forests. For. Ecol. Manag. 2010, 259, 660–684. [Google Scholar] [CrossRef] [Scilit]
- He, X.; Pan, M.; Wei, Z.; Wood, E.F.; Sheffield, J. A Global Drought and Flood Catalogue from 1950 to 2016. Bull. Am. Meteorol. Soc. 2020, 101, E508–E535. [Google Scholar] [CrossRef] [Scilit]
- Herrera-Estrada, J.E.; Satoh, Y.; Sheffield, J. Spatiotemporal Dynamics of Global Drought. Geophys. Res. Lett. 2017, 44, 2254–2263. [Google Scholar] [CrossRef] [Scilit]
- Lesk, C.; Rowhani, P.; Ramankutty, N. Influence of Extreme Weather Disasters on Global Crop Production. Nature 2016, 529, 84–87. [Google Scholar] [CrossRef] [Scilit] [PubMed]
- Van Loon, A.F. Hydrological Drought Explained. WIREs Water 2015, 2, 359–392. [Google Scholar] [CrossRef] [Scilit]
- Wilhite, D.A.; Sivakumar, M.V.K.; Pulwarty, R. Managing Drought Risk in a Changing Climate: The Role of National Drought Policy. Weather Clim. Extrem. 2014, 3, 4–13. [Google Scholar] [CrossRef] [Scilit]
- Wang, L.; Chen, W.; Fu, Q.; Huang, G.; Wang, Q.; Chotamonsak, C.; Limsakul, A. Super Droughts over East Asia since 1960 under the Impacts of Global Warming and Decadal Variability. Int. J. Climatol. 2021, 42, 4508–4521. [Google Scholar] [CrossRef] [Scilit]
- Vicente-Serrano, S.M.; Quiring, S.M.; Peña-Gallardo, M.; Yuan, S.; Domínguez-Castro, F. A Review of Environmental Droughts: Increased Risk under Global Warming? Earth Sci. Rev. 2020, 201, 102953. [Google Scholar] [CrossRef] [Scilit]
- Wang, W.; Wang, P.; Cui, W. Comparative Analysis of Terrestrial Water Storage and Multi-Source Hydrological Data in the Yangtze River Basin. Adv. Water Sci. 2015, 26, 759–768. [Google Scholar] [CrossRef]
- Kogan, F.N. Droughts of the Late 1980s in the United States as Derived from NOAA Polar-Orbiting Satellite Data. Bull. Am. Meteorol. Soc. 1995, 76, 655–668. [Google Scholar] [CrossRef]
- Eyring, V.; Gillett, N.P.; Achutarao, K.M.; Barimalala, R.; Barreiro Parrillo, M.; Bellouin, N.; Cassou, C.; Durack, P.J.; Kosaka, Y.; McGregor, S.; et al. Human Influence on the Climate System. In Climate Change 2021: The Physical Science Basis. Contribution of Working Group I to the Sixth Assessment Report of the Intergovernmental Panel on Climate Change; Masson-Delmotte, V., Zhai, P., Pirani, A., Connors, S.L., Péan, C., Berger, S., Caud, N., Chen, Y., Goldfarb, L., Gomis, M.I., et al., Eds.; Cambridge University Press: Cambridge, UK; New York, NY, USA, 2021; pp. 423–552. [Google Scholar]
- Tokarska, K.B.; Stolpe, M.B.; Sippel, S.; Fischer, E.M.; Smith, C.J.; Lehner, F.; Knutti, R. Past Warming Trend Constrains Future Warming in CMIP6 Models. Sci. Adv. 2020, 6, eaaz9549. [Google Scholar] [CrossRef] [Scilit] [PubMed]
- Behrenfeld, M.J.; O’Malley, R.T.; Siegel, D.A.; McClain, C.R.; Sarmiento, J.L.; Feldman, G.C.; Milligan, A.J.; Falkowski, P.G.; Letelier, R.M.; Boss, E.S. Climate-Driven Trends in Contemporary Ocean Productivity. Nature 2006, 444, 752–755. [Google Scholar] [CrossRef] [Scilit] [PubMed]
- Eyring, V.; Bony, S.; Meehl, G.A.; Senior, C.A.; Stevens, B.; Stouffer, R.J.; Taylor, K.E. Overview of the Coupled Model Intercomparison Project Phase 6 (CMIP6) Experimental Design and Organization. Geosci. Model Dev. 2016, 9, 1937–1958. [Google Scholar] [CrossRef] [Scilit]
- Byun, Y.-H.; Lim, Y.-J.; Sung, H.M.; Kim, J.; Sun, M.; Kim, B.-H. NIMS-KMA KACE1.0-G Model Output Prepared for CMIP6 CMIP; World Data Center for Climate (WDCC) at DKRZ: Hamburg, Germany, 2019. [Google Scholar]
- Müller, W.A.; Jungclaus, J.H.; Mauritsen, T.; Baehr, J.; Bittner, M.; Budich, R.; Bunzel, F.; Esch, M.; Ghosh, R.; Haak, H.; et al. A Higher-Resolution Version of the Max Planck Institute Earth System Model (MPI-ESM1.2-HR). J. Adv. Model. Earth Syst. 2018, 10, 1383–1413. [Google Scholar] [CrossRef] [Scilit]
- Rong, X. CAMS CAMS_CSM1.0 Model Output Prepared for CMIP6 CMIP Historical; World Data Center for Climate (WDCC) at DKRZ: Hamburg, Germany, 2019. [Google Scholar]
- Bi, D.; Dix, M.; Marsland, S.; O’Farrell, S.; Sullivan, A.; Bodman, R.; Law, R.; Harman, I.; Srbinovsky, J.; Rashid, H.A.; et al. Configuration and spin-up of ACCESS-CM2, the new generation Australian Community Climate and Earth System Simulator Coupled Model. J. South. Hemisph. Earth Syst. Sci. 2020, 70, 225–251. [Google Scholar] [CrossRef] [Scilit]
- Séférian, R.; Nabat, P.; Michou, M.; Saint-Martin, D.; Voldoire, A.; Colin, J.; Decharme, B.; Delire, C.; Berthet, S.; Chevallier, M.; et al. Evaluation of CNRM Earth System Model, CNRM-ESM2-1: Role of Earth System Processes in Present-Day and Future Climate. J. Adv. Model. Earth Syst. 2019, 11, 4182–4227. [Google Scholar] [CrossRef] [Scilit]
- Cherchi, A.; Fogli, P.G.; Lovato, T.; Peano, D.; Iovino, D.; Gualdi, S.; Masina, S.; Scoccimarro, E.; Materia, S.; Bellucci, A.; et al. Global Mean Climate and Main Patterns of Variability in the CMCC-CM2 Coupled Model. J. Adv. Model. Earth Syst. 2019, 11, 185–209. [Google Scholar] [CrossRef] [Scilit]
- Seland, Ø.; Bentsen, M.; Olivié, D.; Toniazzo, T.; Gjermundsen, A.; Graff, L.S.; Debernard, J.B.; Gupta, A.K.; He, Y.-C.; Kirkevåg, A.; et al. Overview of the Norwegian Earth System Model (NorESM2) and Key Climate Response of CMIP6 DECK, Historical, and Scenario Simulations. Geosci. Model Dev. 2020, 13, 6165–6200. [Google Scholar] [CrossRef] [Scilit]
- Wu, T.; Lu, Y.; Fang, Y.; Xin, X.; Li, L.; Li, W.; Jie, W.; Zhang, J.; Liu, Y.; Zhang, L.; et al. The Beijing Climate Center Climate System Model (BCC-CSM): The Main Progress from CMIP5 to CMIP6. Geosci. Model Dev. 2019, 12, 1573. [Google Scholar] [CrossRef] [Scilit]
- Swart, N.C.; Cole, J.N.S.; Kharin, V.V.; Lazare, M.; Scinocca, J.F.; Gillett, N.P.; Anstey, J.; Arora, V.; Christian, J.R.; Hanna, S.; et al. The Canadian Earth System Model Version 5 (CanESM5.0.3). Geosci. Model Dev. 2019, 12, 4823–4873. [Google Scholar] [CrossRef] [Scilit]
- Danabasoglu, G.; Lamarque, J.-F.; Bacmeister, J.; Bailey, D.A.; DuVivier, A.K.; Edwards, J.; Emmons, L.K.; Fasullo, J.; Garcia, R.; Gettelman, A.; et al. The Community Earth System Model Version 2 (CESM2). J. Adv. Model. Earth Syst. 2020, 12, e2019MS001916. [Google Scholar] [CrossRef] [Scilit]
- Saint-Martin, D.; Geoffroy, O.; Voldoire, A.; Cattiaux, J.; Brient, F.; Chauvin, F.; Chevallier, M.; Colin, J.; Decharme, B.; Delire, C.; et al. Tracking Changes in Climate Sensitivity in CNRM Climate Models. J. Adv. Model. Earth Syst. 2021, 13, e2020MS002190. [Google Scholar] [CrossRef] [Scilit]
- Wang, Y.-C.; Hsu, H.-H.; Chen, C.-A.; Tseng, W.-L.; Hsu, P.-C.; Lin, C.-W.; Chen, Y.-L.; Jiang, L.-C.; Lee, Y.-C.; Liang, H.-C.; et al. Performance of the Taiwan Earth System Model in Simulating Climate Variability Compared with Observations and CMIP6 Model Simulations. J. Adv. Model. Earth Syst. 2021, 13, e2020MS002353. [Google Scholar] [CrossRef] [Scilit]
- Voldoire, A.; Saint-Martin, D.; Sénési, S.; Decharme, B.; Alias, A.; Chevallier, M.; Colin, J.; Guérémy, J.F.; Michou, M.; Moine, M.P.; et al. Evaluation of CMIP6 DECK Experiments with CNRM-CM6-1. J. Adv. Model. Earth Syst. 2019, 11, 2177–2213. [Google Scholar] [CrossRef] [Scilit]
- Hajima, T.; Watanabe, M.; Yamamoto, A.; Tatebe, H.; Noguchi, M.A.; Abe, M.; Ohgaito, R.; Ito, A.; Yamazaki, D.; Okajima, H.; et al. Development of the MIROC-ES2L Earth System Model and the Evaluation of Biogeochemical Processes and Feedbacks. Geosci. Model Dev. 2020, 13, 2197–2244. [Google Scholar] [CrossRef] [Scilit]
- Boucher, O.; Servonnat, J.; Albright, A.L.; Aumont, O.; Balkanski, Y.; Bastrikov, V.; Bekki, S.; Bonnet, R.; Bony, S.; Bopp, L.; et al. Presentation and Evaluation of the IPSL-CM6A-LR Climate Model. J. Adv. Model. Earth Syst. 2020, 12, e2019MS002010. [Google Scholar] [CrossRef] [Scilit]
- Yukimoto, S.; Kawai, H.; Koshiro, T.; Oshima, N.; Yoshida, K.; Urakawa, S.; Tsujino, H.; Deushi, M.; Tanaka, T.; Hosaka, M.; et al. The Meteorological Research Institute Earth System Model Version 2.0, MRI-ESM2.0: Description and Basic Evaluation of the Physical Component. J. Meteorol. Soc. Jpn. 2019, 97, 931–965. [Google Scholar] [CrossRef] [Scilit]
- MOHC UKESM1.0-LL Model Output Prepared for CMIP6 ScenarioMIP Ssp585—ScienceOpen. Available online: https://www.scienceopen.com/document?vid=1a6da3eb-d45e-44ec-8d21-49f018937206 (accessed on 27 August 2026).
- Tatebe, H.; Ogura, T.; Nitta, T.; Komuro, Y.; Ogochi, K.; Takemura, T.; Sudo, K.; Sekiguchi, M.; Abe, M.; Saito, F.; et al. Description and Basic Evaluation of Simulated Mean State, Internal Variability, and Climate Sensitivity in MIROC6. Geosci. Model Dev. 2019, 12, 2727–2765. [Google Scholar] [CrossRef] [Scilit]
- Netzel, P.; Cywicka, D. Standardized Climatic Water Balance for Poland (1951–2023) Supporting Forestry and Drought Monitoring. Sci. Data 2025, 12, 1915. [Google Scholar] [CrossRef] [Scilit] [PubMed]
- Martins Careto, J.A.; Cardoso, R.M.; Russo, A.; André Lima, D.C.; Matos Soares, P.M. Generalised Drought Index: A Novel Multi-Scale Daily Approach for Drought Assessment. Geosci. Model Dev. 2024, 17, 8115–8139. [Google Scholar] [CrossRef] [Scilit]
- Biella, R.; Shyrokaya, A.; Ionita, M.; Vignola, R.; Sutanto, S.; Todorovic, A.; Teutschbein, C.; Cid, D.; Llasat, M.C.; Alencar, P.; et al. The 2022 Drought Needs to Be a Turning Point for European Drought Risk Management. Egusphere 2024, 25, 4475–4501. [Google Scholar] [CrossRef] [Scilit]
- Bevacqua, E.; Rakovec, O.; Schumacher, D.L.; Kumar, R.; Thober, S.; Samaniego, L.; Seneviratne, S.I.; Zscheischler, J. Direct and Lagged Climate Change Effects Intensified the 2022 European Drought. Nat. Geosci. 2024, 17, 1100–1107. [Google Scholar] [CrossRef] [Scilit]
- Department of Agriculture—Crop Explorer. Available online: http://catalog.data.gov/dataset/crop-explorer (accessed on 28 August 2026).
- Schumacher, D.L.; Zachariah, M.; Otto, F.; Barnes, C.; Philip, S.; Kew, S.; Vahlberg, M.; Singh, R.; Heinrich, D.; Arrighi, J.; et al. Detecting the Human Fingerprint in the Summer 2022 Western–Central European Soil Drought. Earth Syst. Dyn. 2024, 15, 131–154. [Google Scholar] [CrossRef] [Scilit]
- Faranda, D.; Pascale, S.; Bulut, B. Persistent Anticyclonic Conditions and Climate Change Exacerbated the Exceptional 2022 European-Mediterranean Drought. Environ. Res. Lett. 2023, 18, 34030. [Google Scholar] [CrossRef] [Scilit]
- Bonaldo, D.; Bellafiore, D.; Ferrarin, C.; Ferretti, R.; Ricchi, A.; Sangelantoni, L.; Vitelletti, M.L. The Summer 2022 Drought: A Taste of Future Climate for the Po Valley (Italy)? Reg. Environ. Change 2023, 23, 1, Correction in Reg. Environ. Change 2023, 23, 140. https://doi.org/10.1007/s10113-023-02149-5. [Google Scholar] [CrossRef] [Scilit]
- Anderson, W.; Cook, B.I.; Slinski, K.; Schwarzwald, K.; McNally, A.; Funk, C. Multiyear La Niña Events and Multiseason Drought in the Horn of Africa. J. Hydrometeorol. 2023, 24, 119–131. [Google Scholar] [CrossRef] [Scilit]
- Shukla, S.; Husak, G.; Turner, W.; Davenport, F.; Funk, C.; Harrison, L.; Krell, N. A Slow Rainy Season Onset Is a Reliable Harbinger of Drought in Most Food Insecure Regions in Sub-Saharan Africa. PLoS ONE 2021, 16, e0242883. [Google Scholar] [CrossRef] [Scilit] [PubMed]
- Horn of Africa Drought: Regional Humanitarian Overview & Call to Action (Revised 24 August 2022)—Ethiopia|ReliefWeb. Available online: https://reliefweb.int/report/ethiopia/horn-africa-drought-regional-humanitarian-overview-call-action-revised-24-august-2022 (accessed on 3 June 2025).
- Abbonizio, A.; Symington, A. Horn of Africa Hunger Crisis Pushes Millions to the Brink. Available online: https://www.wfp.org/stories/horn-africa-hunger-crisis-pushes-millions-brink (accessed on 3 June 2025).
- Garreaud, R.D.; Boisier, J.P.; Rondanelli, R.; Montecinos, A.; Sepúlveda, H.H.; Veloso-Aguila, D. The Central Chile Mega Drought (2010–2018): A Climate Dynamics Perspective. Int. J. Climatol. 2020, 40, 421–439. [Google Scholar] [CrossRef] [Scilit]
- Delano, S. More Than a Decade of Megadrought Brought a Summer of Megafires to Chile. Inside Climate News, 9 April 2023. Available online: https://insideclimatenews.org/news/09042023/chile-megadrought-megafires/ (accessed on 29 August 2026).
- NASA Earth Observatory. Western Soils and Plants Are Parched. 2021. Available online: https://science.nasa.gov/earth/earth-observatory/western-soils-and-plants-are-parched-148419/ (accessed on 29 August 2026).
- U.S. Department of the Interior. Western U.S. Drought. Available online: https://www.doi.gov/node/41541 (accessed on 29 August 2026).
- Chen, L.; Li, Y.; Ge, Z.-A.; Lu, B.; Wang, L.; Wei, X.; Sun, M.; Wang, Z.; Li, T.; Luo, J.-J. Causes of the Extreme Drought in Late Summer–Autumn 2019 in Eastern China and Its Future Risk. J. Clim. 2023, 36, 1085–1104. [Google Scholar] [CrossRef] [Scilit]
- Ma, S.; Zhu, C.; Liu, J. Combined Impacts of Warm Central Equatorial Pacific Sea Surface Temperatures and Anthropogenic Warming on the 2019 Severe Drought in East China. Adv. Atmos. Sci. 2020, 37, 1149–1163. [Google Scholar] [CrossRef] [Scilit]
- Sun, B.; Wang, H.; Li, H.; Zhou, B.; Duan, M.; Li, H. A Long-lasting Precipitation Deficit in South China during Autumn-winter 2020/2021: Combined Effect of ENSO and Arctic Sea Ice. J. Geophys. Res. Atmos. 2022, 127, e2021JD035584. [Google Scholar] [CrossRef] [Scilit]
- Sun, C.; Yang, S. Persistent Severe Drought in Southern China during Winter–Spring 2011: Large-Scale Circulation Patterns and Possible Impacting Factors. J. Geophys. Res. Atmos. 2012, 117, D10112. [Google Scholar] [CrossRef] [Scilit]
- Hu, Y.; Zhou, B.; Wang, H.; Zhang, D. Record-Breaking Summer-Autumn Drought in Southern China in 2022: Roles of Tropical Sea Surface Temperature and Eurasian Warming. Sci. China Earth Sci. 2024, 67, 420–431. [Google Scholar] [CrossRef] [Scilit]
- Liu, W.; Sun, F.; Lim, W.H.; Zhang, J.; Wang, H.; Shiogama, H.; Zhang, Y. Global Drought and Severe Drought-Affected Populations in 1.5 and 2 °C Warmer Worlds. Earth Syst. Dyn. 2018, 9, 267–283. [Google Scholar] [CrossRef] [Scilit]
- Dai, A. Increasing Drought under Global Warming in Observations and Models. Nat. Clim. Change 2013, 3, 52–58, Erratum in Nat. Clim. Change 2013, 3, 171. https://doi.org/10.1038/nclimate1811. [Google Scholar] [CrossRef] [Scilit]
- Ault, T.R.; Mankin, J.S.; Cook, B.I.; Smerdon, J.E. Relative Impacts of Mitigation, Temperature, and Precipitation on 21st-Century Megadrought Risk in the American Southwest. Sci. Adv. 2016, 2, e1600873. [Google Scholar] [CrossRef] [Scilit] [PubMed]
- Fu, Q.; Feng, S. Responses of Terrestrial Aridity to Global Warming. J. Geophys. Res. Atmos. 2014, 119, 7863–7875. [Google Scholar] [CrossRef] [Scilit]
- Hoerling, M.; Hurrell, J.; Eischeid, J.; Phillips, A. Detection and Attribution of Twentieth-Century Northern and Southern African Rainfall Change. J. Clim. 2006, 19, 3989–4008. [Google Scholar] [CrossRef] [Scilit]
- Cook, B.I.; Smerdon, J.E.; Seager, R.; Coats, S. Global Warming and 21st Century Drying. Clim. Dyn. 2014, 43, 2607–2627. [Google Scholar] [CrossRef] [Scilit]
- Seager, R.; Ting, M.; Held, I.; Kushnir, Y.; Lu, J.; Vecchi, G.; Huang, H.-P.; Harnik, N.; Leetmaa, A.; Lau, N.-C.; et al. Model Projections of an Imminent Transition to a More Arid Climate in Southwestern North America. Science 2007, 316, 1181–1184. [Google Scholar] [CrossRef] [Scilit] [PubMed]
- Zhao, T.; Dai, A. The Magnitude and Causes of Global Drought Changes in the Twenty-First Century under a Low–Moderate Emissions Scenario. J. Clim. 2015, 28, 4490–4512. [Google Scholar] [CrossRef] [Scilit]
- Trenberth, K.E.; Dai, A.; van der Schrier, G.; Jones, P.D.; Barichivich, J.; Briffa, K.R.; Sheffield, J. Global Warming and Changes in Drought. Nat. Clim. Chang. 2014, 4, 17–22. [Google Scholar] [CrossRef] [Scilit]
- Vicente-Serrano, S.M.; Peña-Angulo, D.; Beguería, S.; Domínguez-Castro, F.; Tomás-Burguera, M.; Noguera, I.; Gimeno-Sotelo, L.; El Kenawy, A. Global Drought Trends and Future Projections. Philos. Trans. R. Soc. A Math. Phys. Eng. Sci. 2022, 380, 20210285. [Google Scholar] [CrossRef] [Scilit] [PubMed]
- Javadinejad, S.; Hannah, D.; Ostad-Ali-Askari, K.; Krause, S.; Zalewski, M.; Boogaard, F. The Impact of Future Climate Change and Human Activities on Hydro-Climatological Drought, Analysis and Projections: Using CMIP5 Climate Model Simulations. Water Conserv. Sci. Eng. 2019, 4, 71–88. [Google Scholar] [CrossRef] [Scilit]
- Wanders, N.; Wada, Y. Human and Climate Impacts on the 21st Century Hydrological Drought. J. Hydrol. 2015, 526, 208–220. [Google Scholar] [CrossRef] [Scilit]
- Elkouk, A.; Pokhrel, Y.; Satoh, Y.; Bouchaou, L. Implications of Changes in Climate and Human Development on 21st-Century Global Drought Risk. J. Environ. Manag. 2022, 317, 115378. [Google Scholar] [CrossRef] [Scilit] [PubMed]
- Pokhrel, Y.; Felfelani, F.; Satoh, Y.; Boulange, J.; Burek, P.; Gädeke, A.; Gerten, D.; Gosling, S.N.; Grillakis, M.; Gudmundsson, L.; et al. Global Terrestrial Water Storage and Drought Severity under Climate Change. Nat. Clim. Change 2021, 11, 226–233. [Google Scholar] [CrossRef] [Scilit]
- Stakhiv, E.Z. Policy Implications of Climate Change Impacts on Water Resources Management. Water Policy 1998, 1, 159–175. [Google Scholar] [CrossRef] [Scilit]
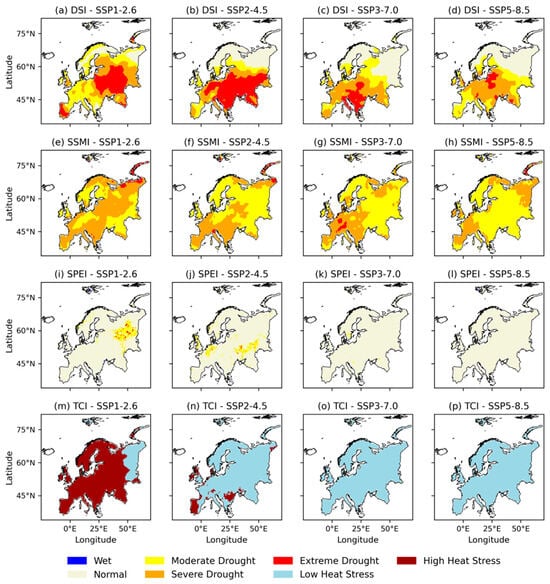
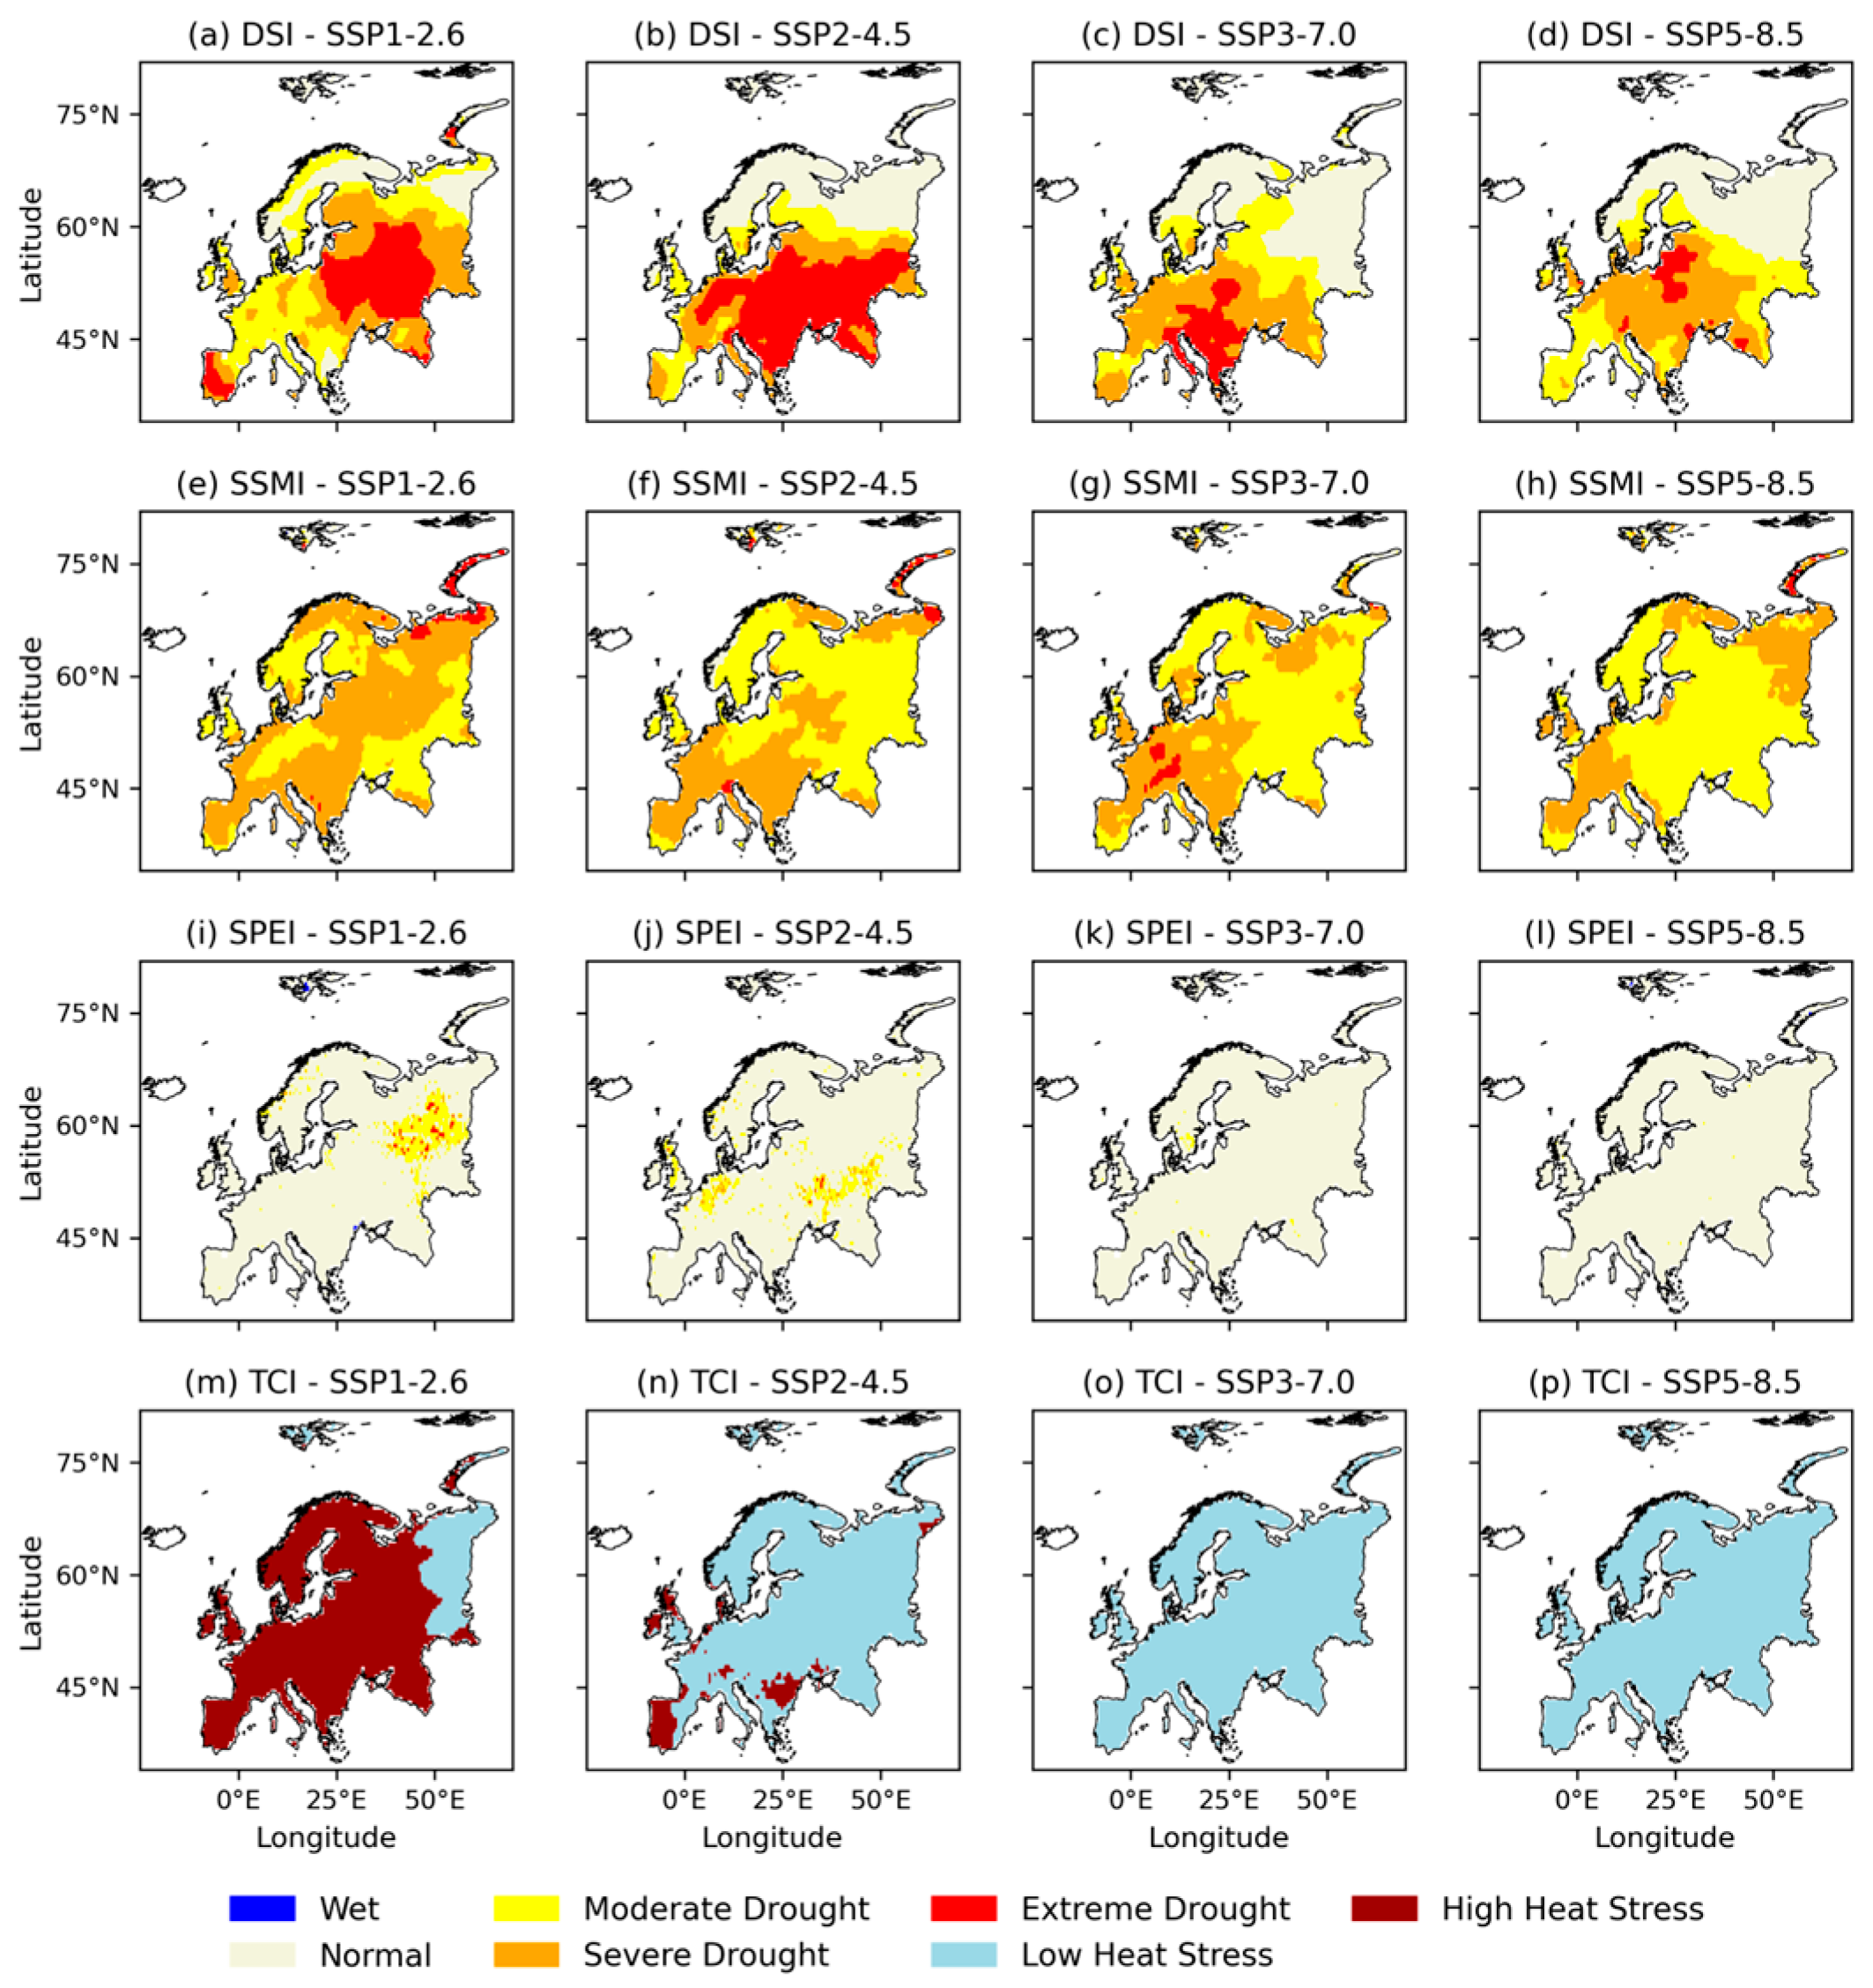
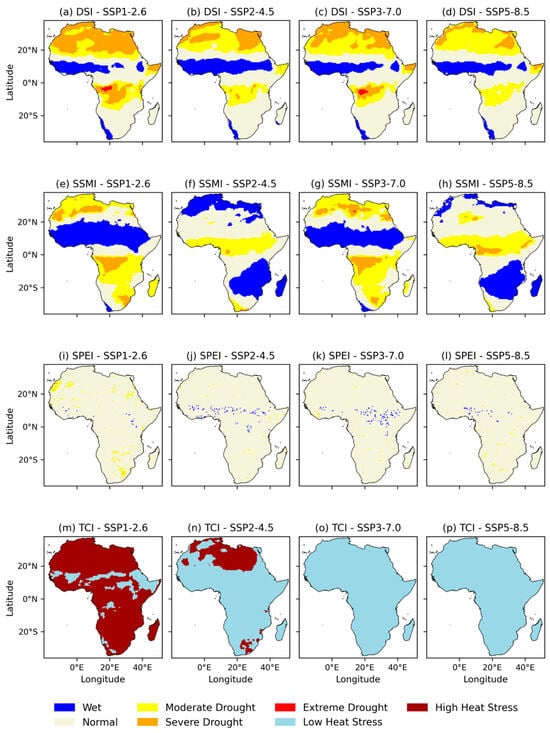
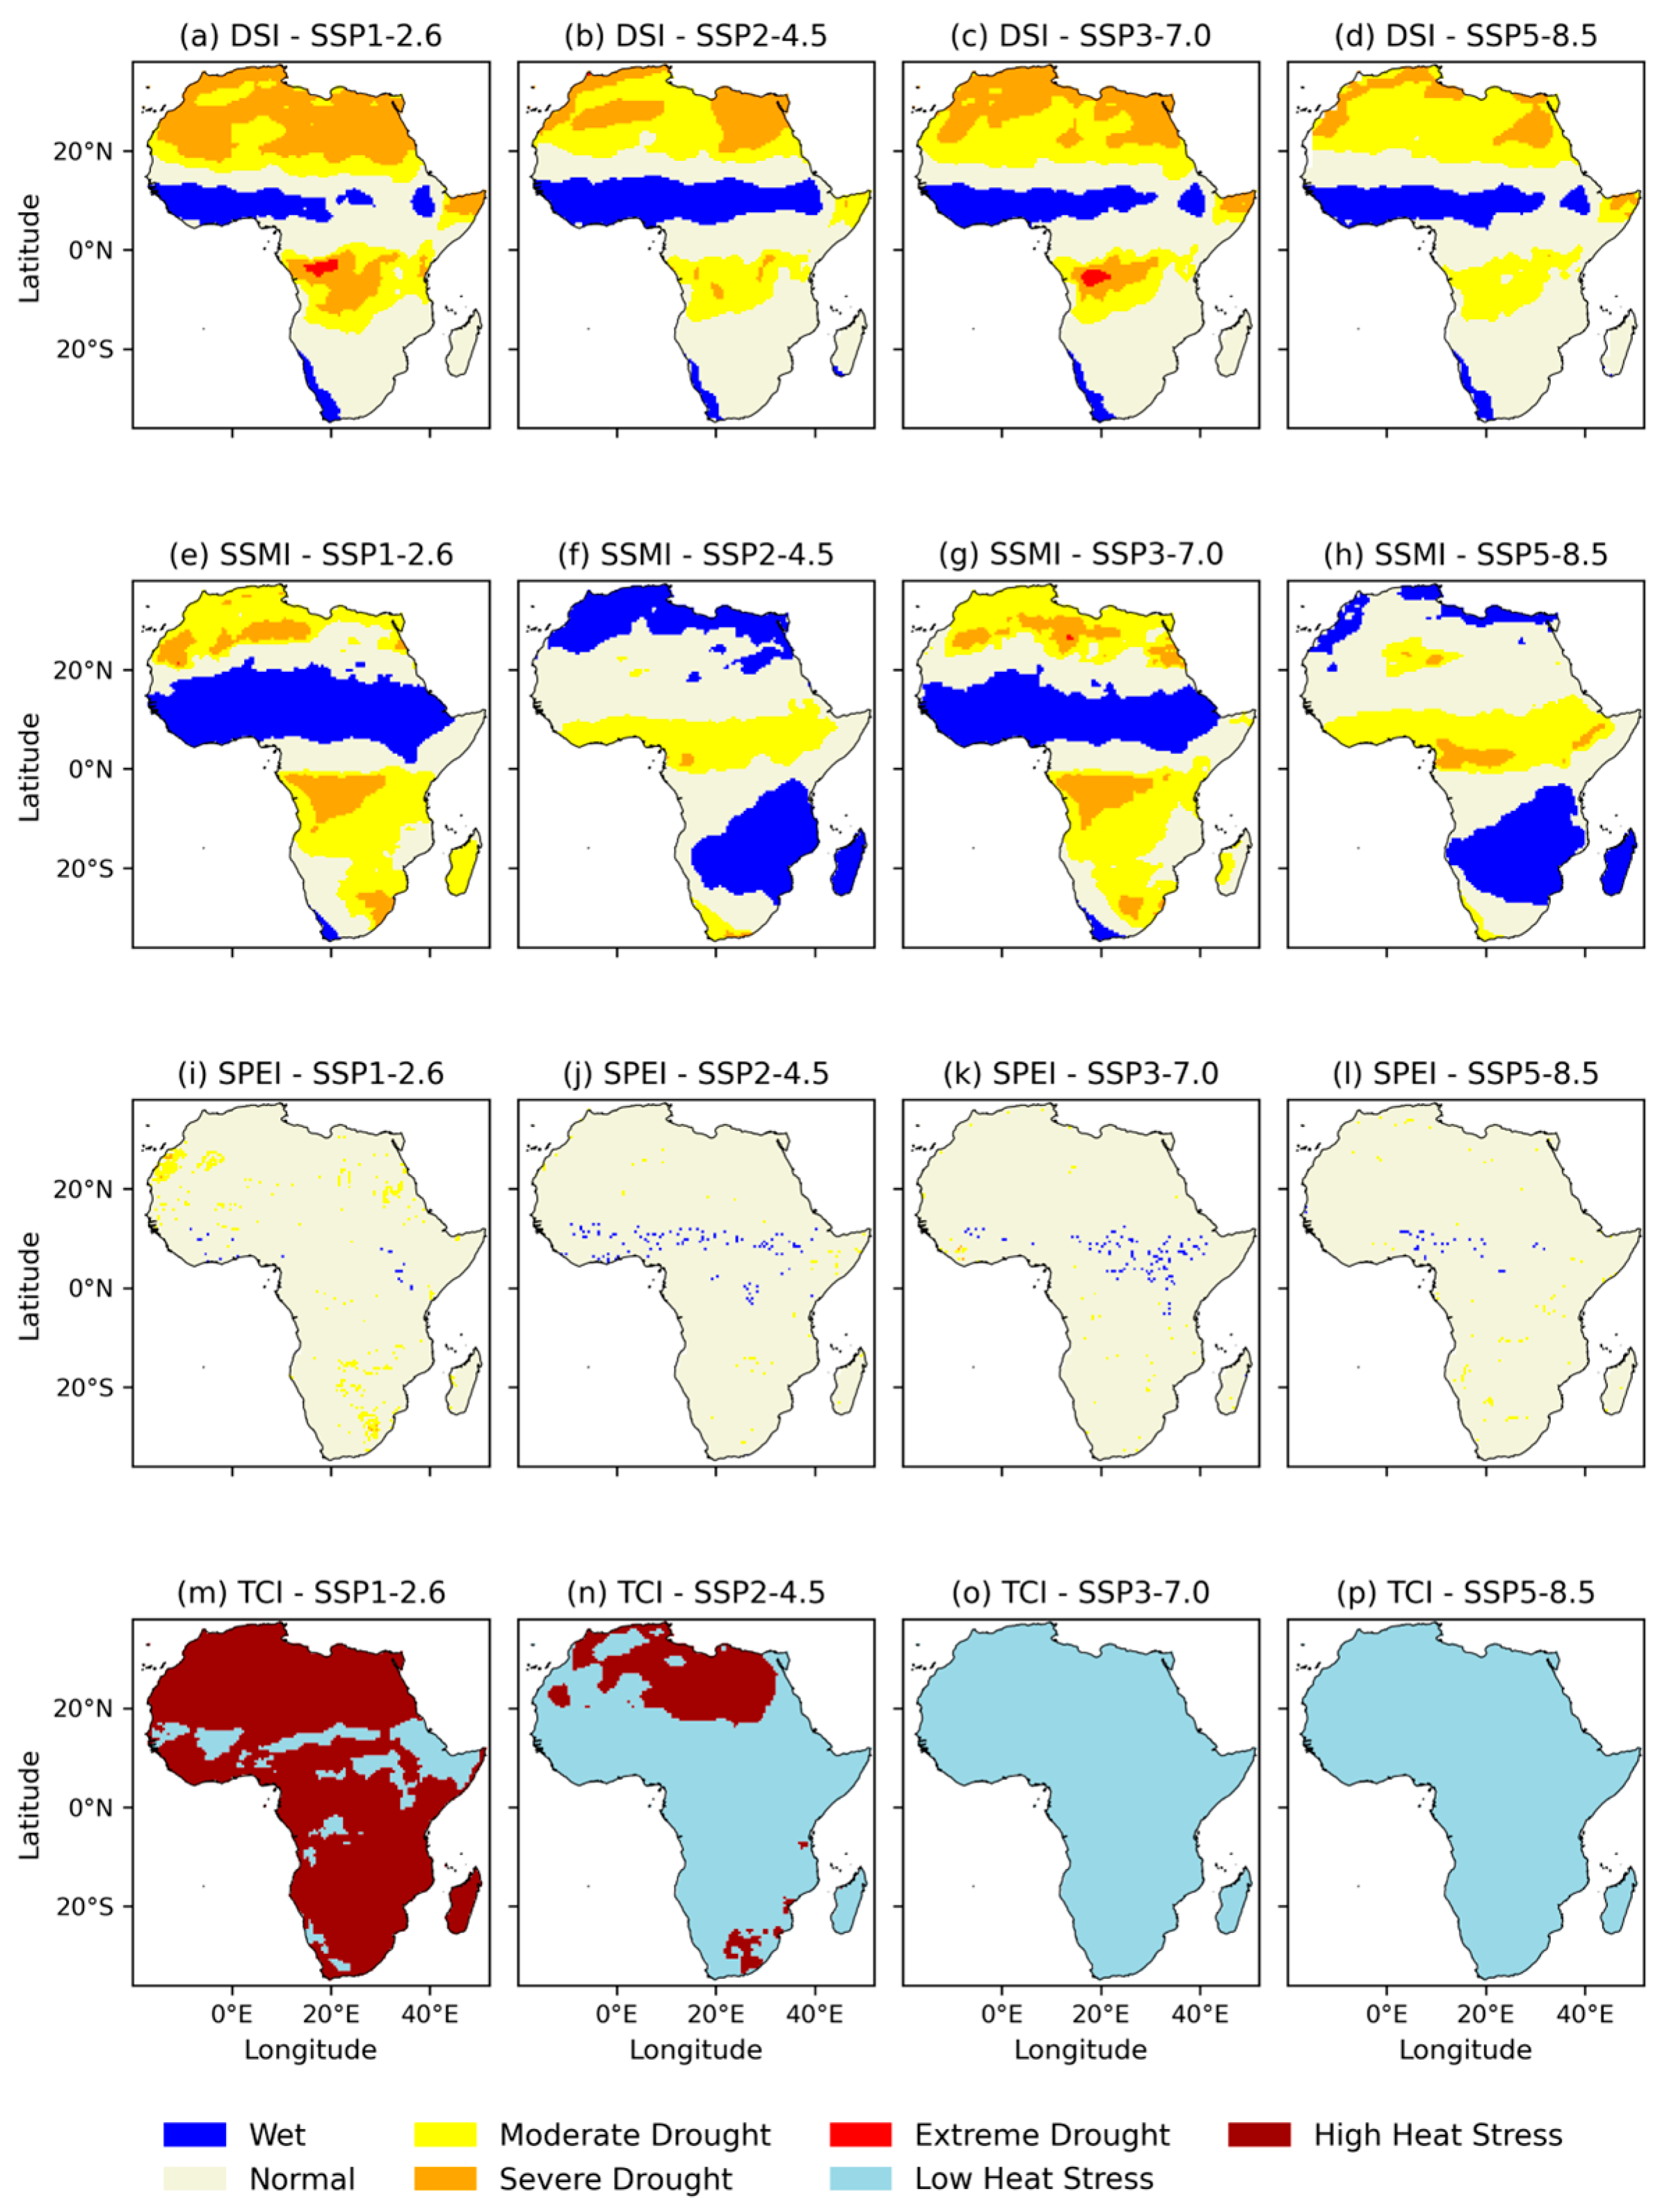
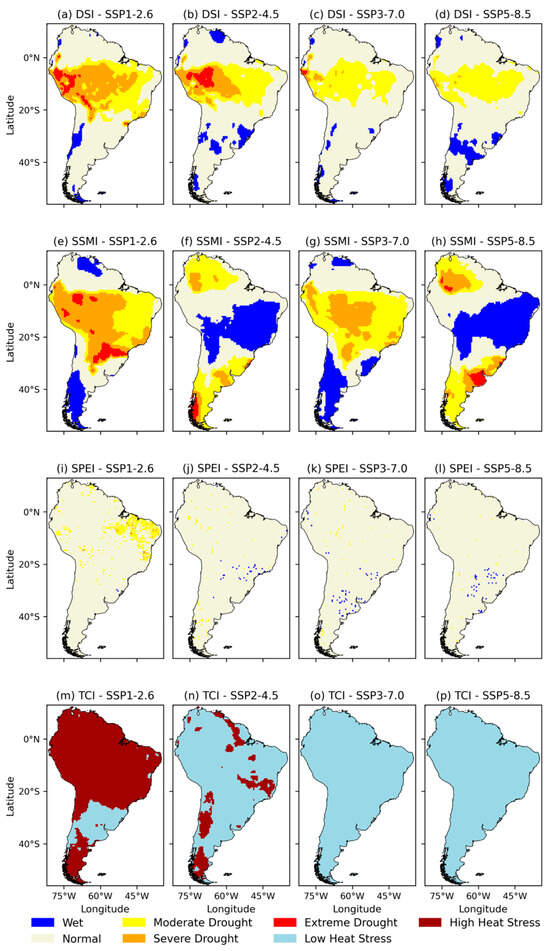
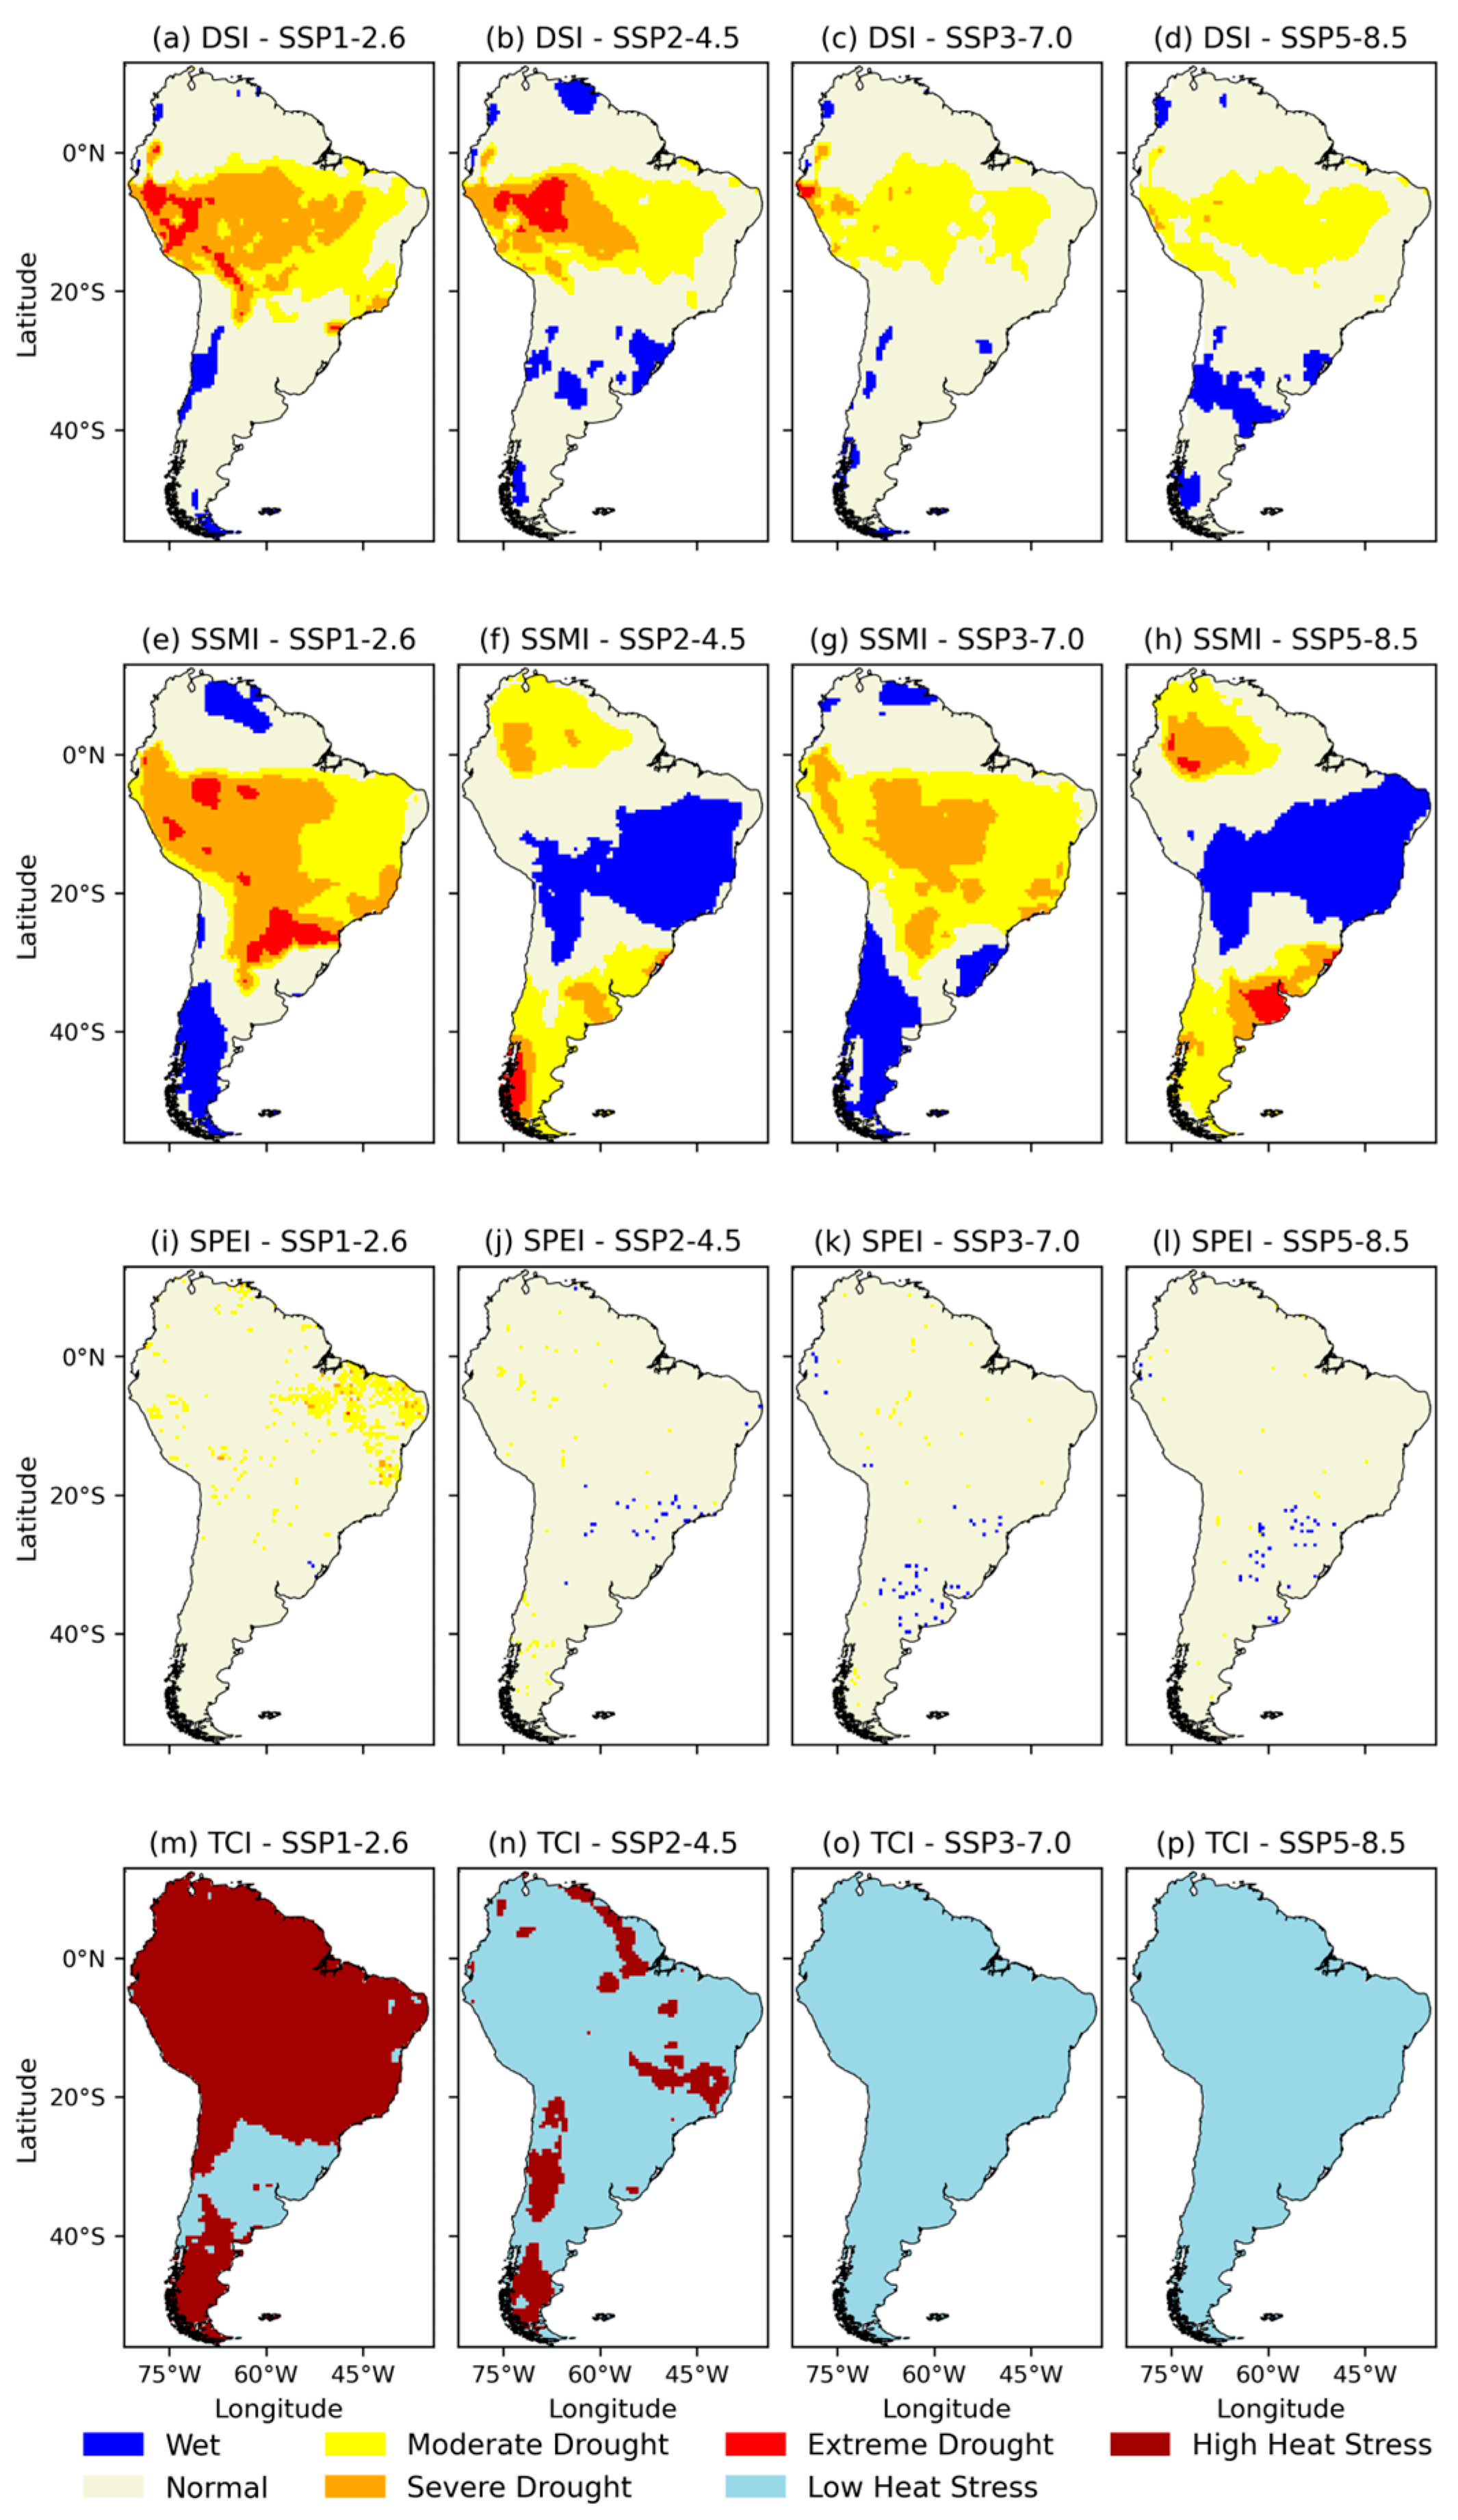
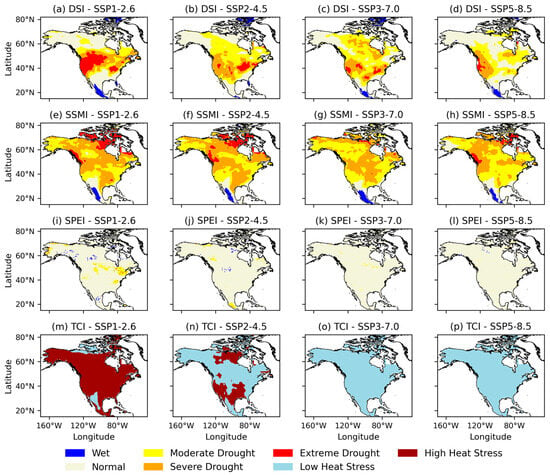
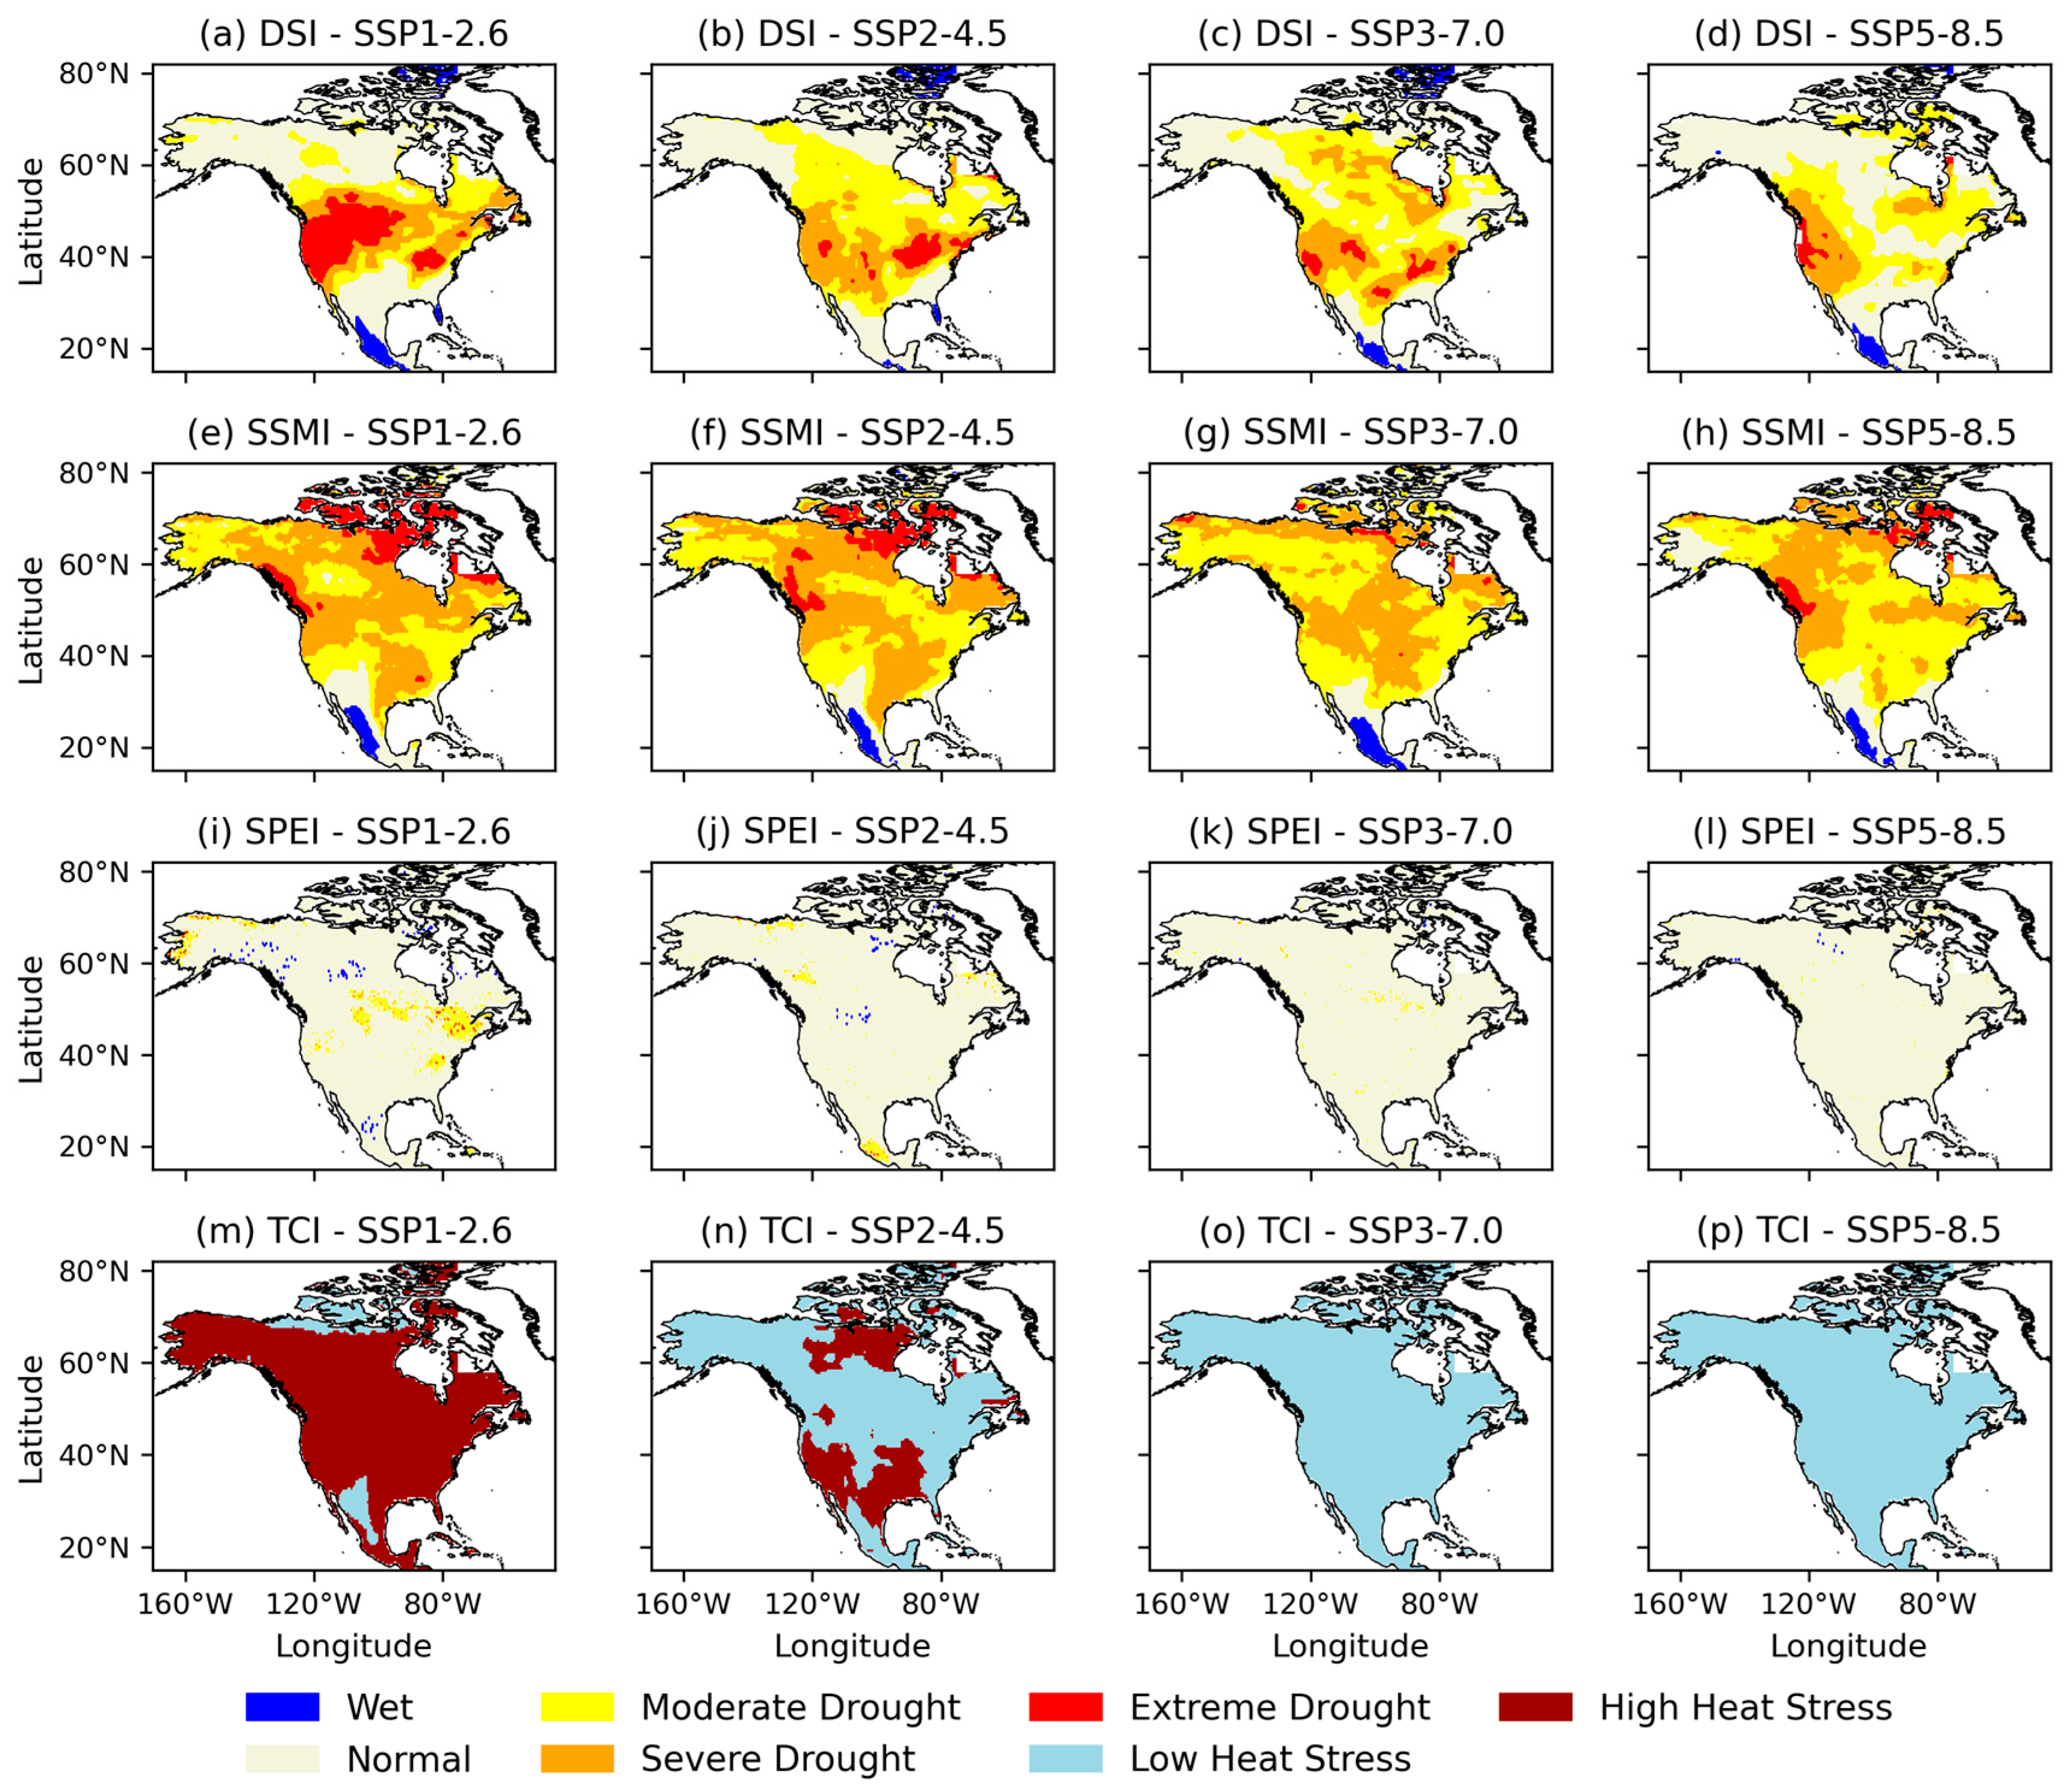
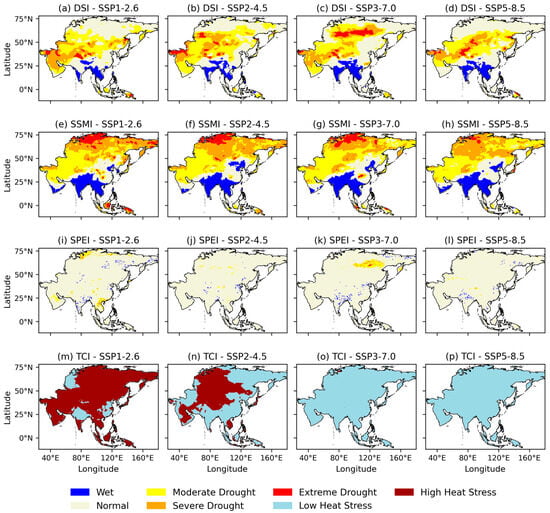
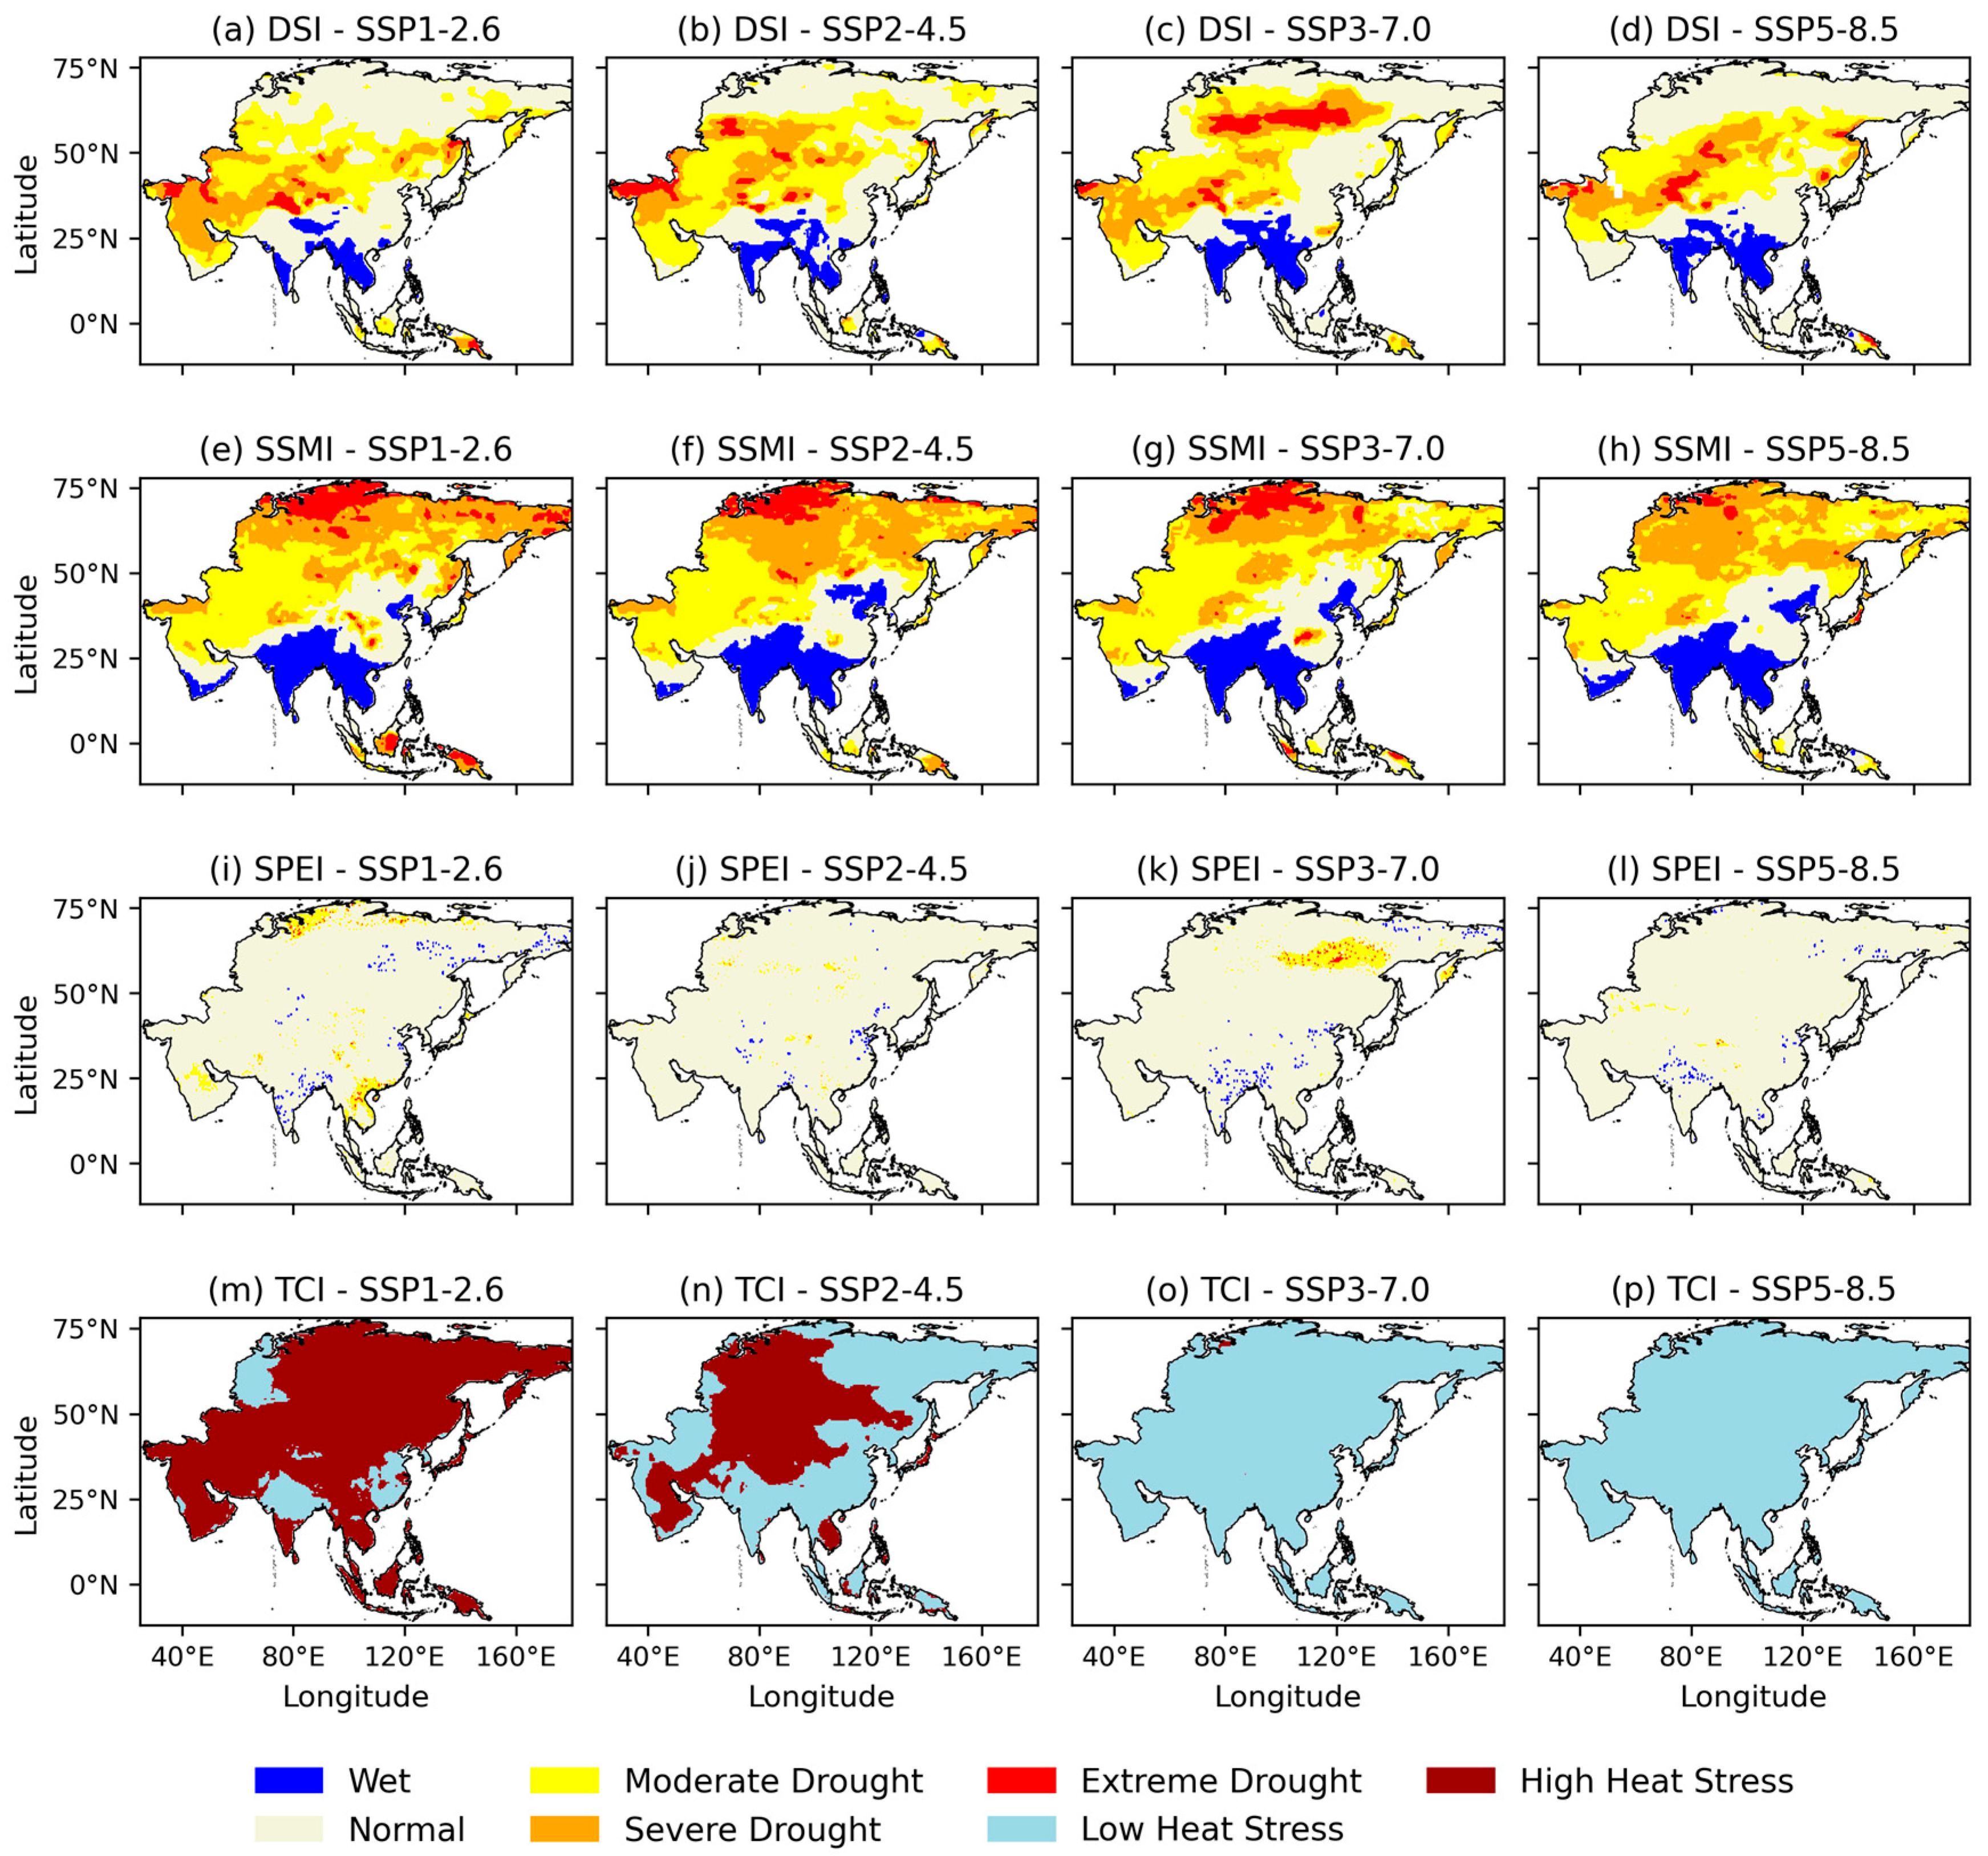
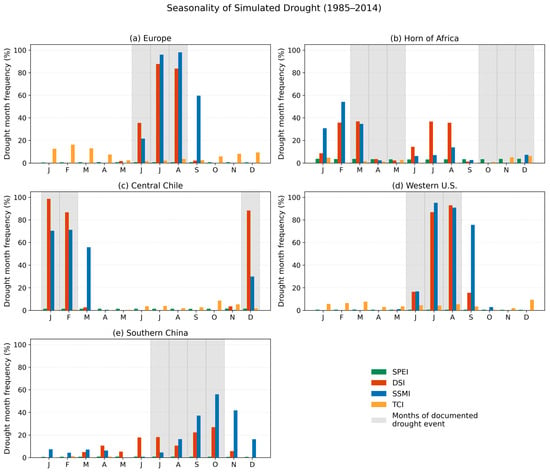
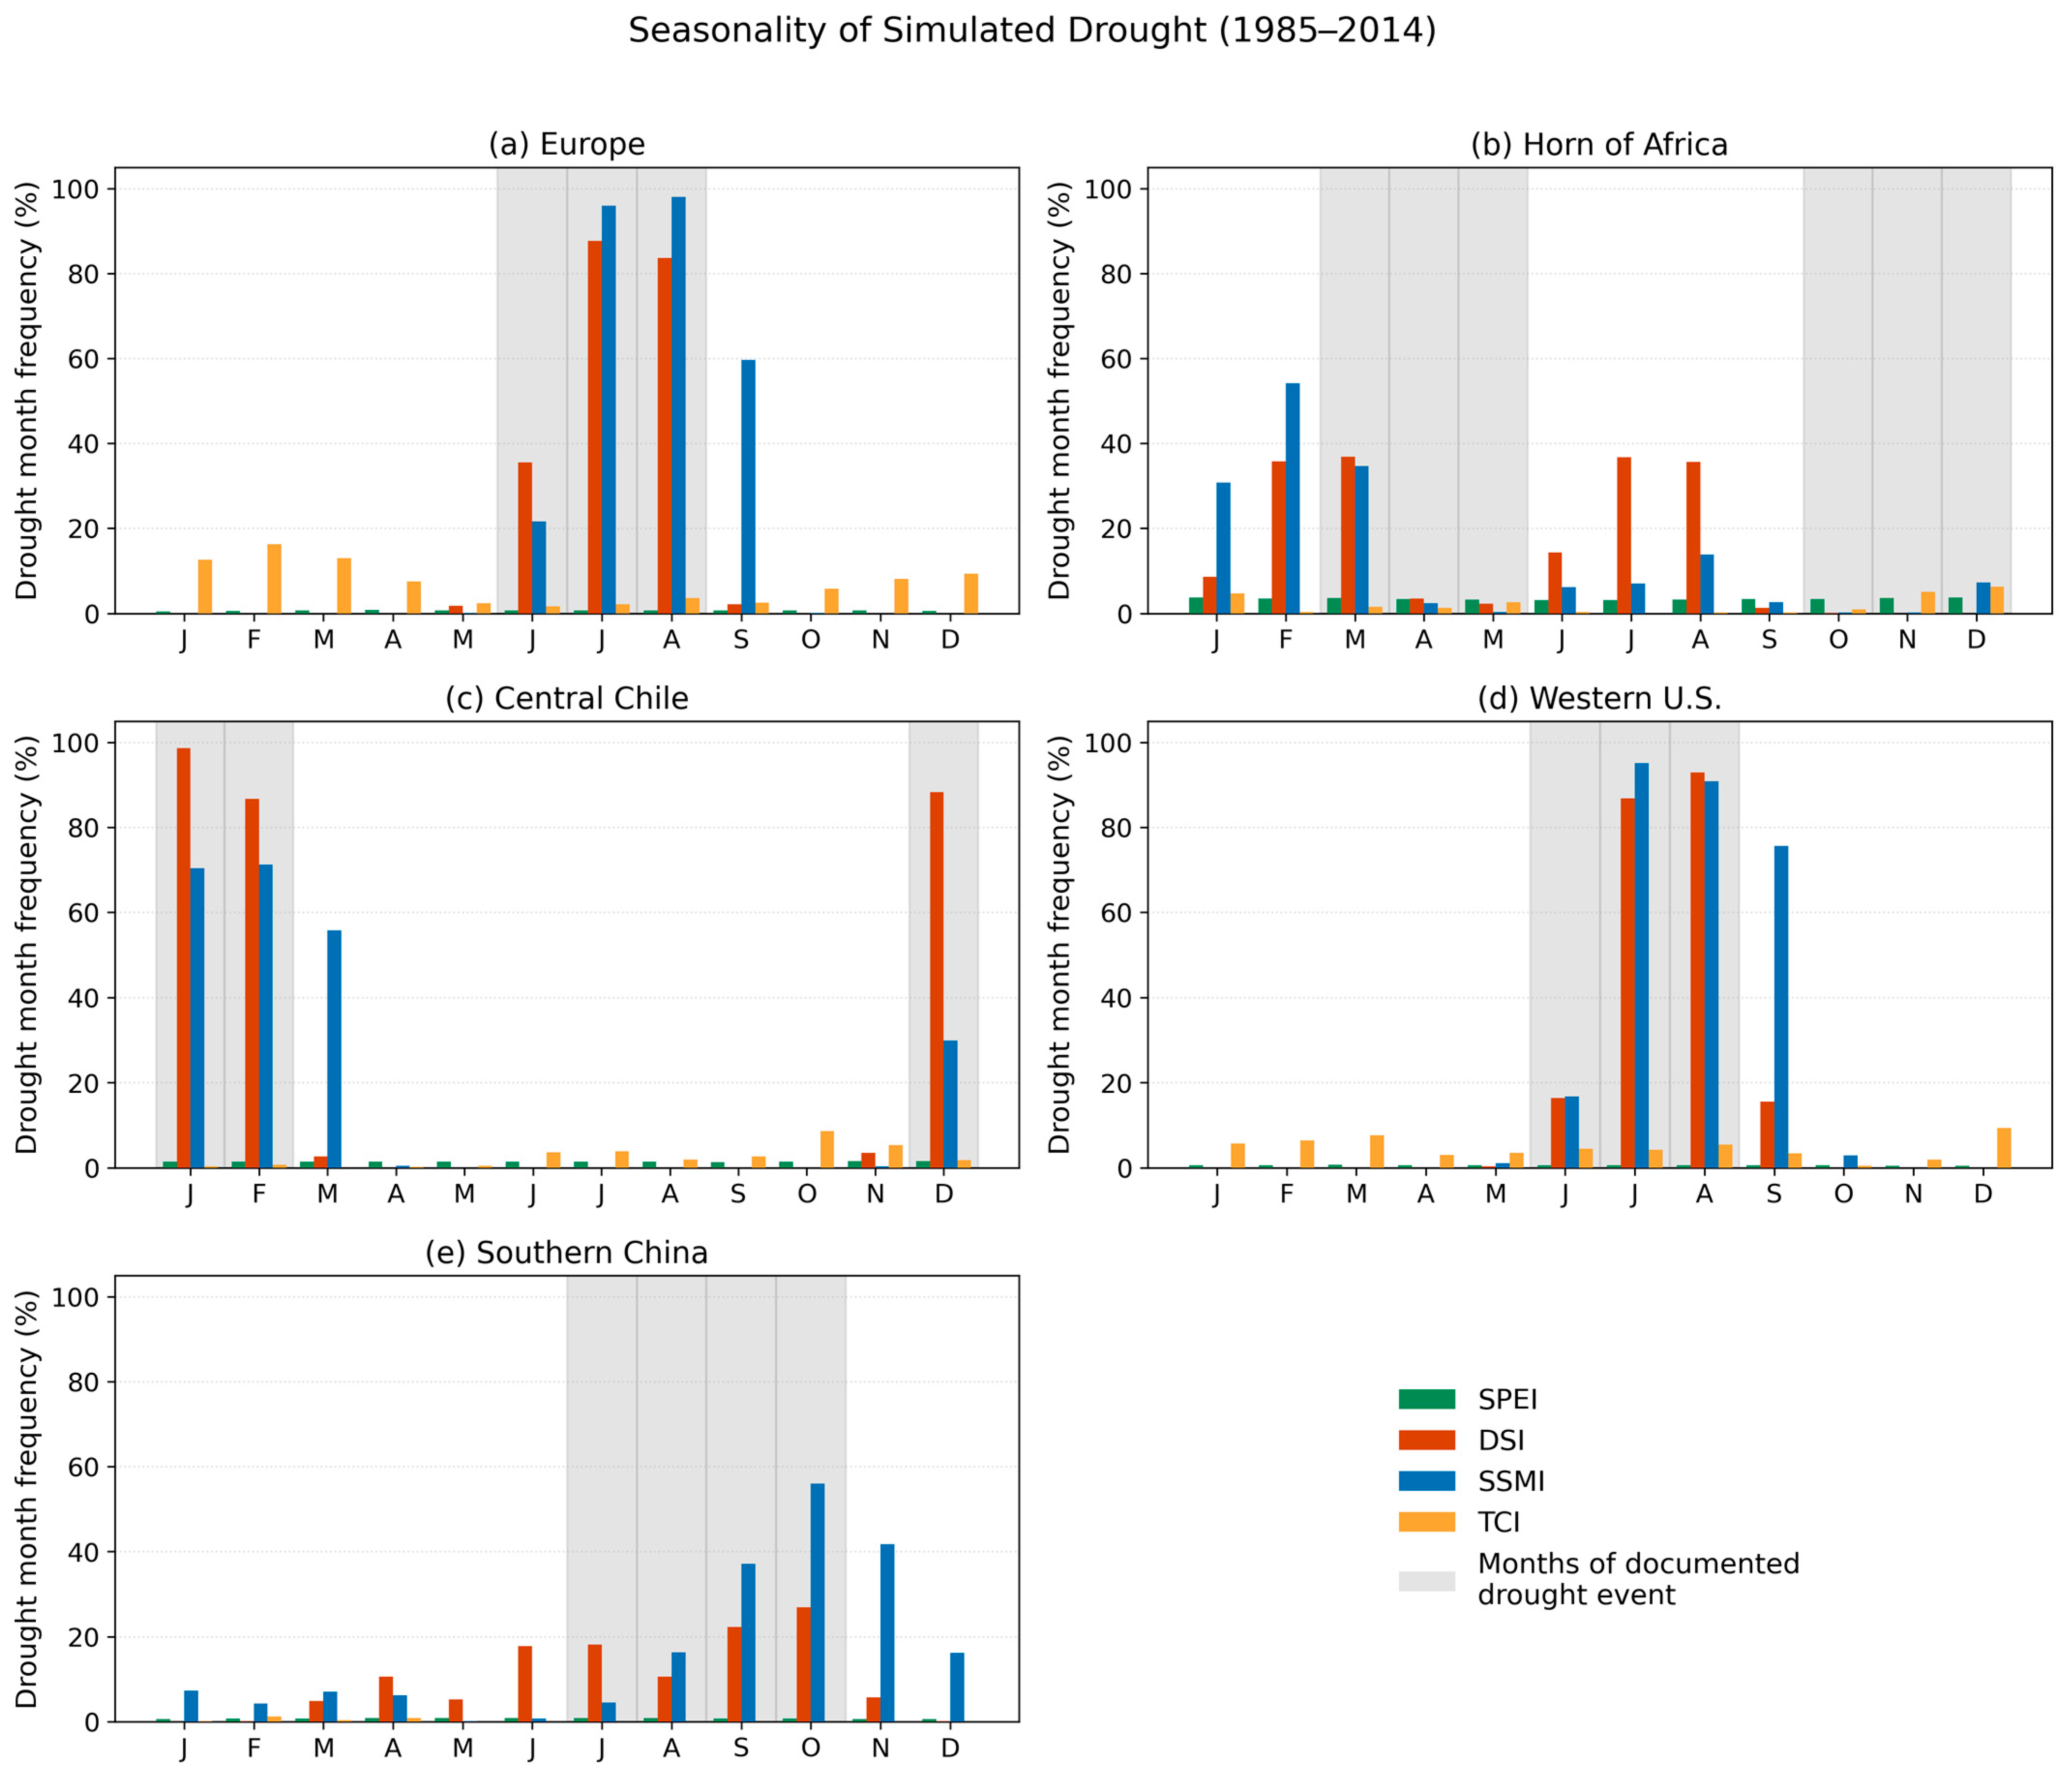
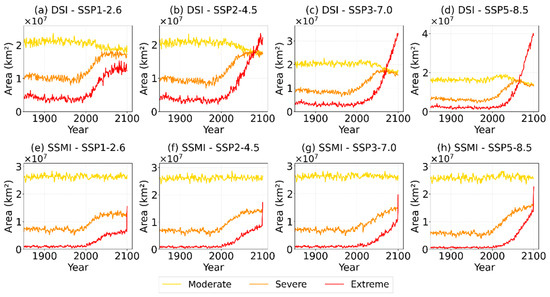
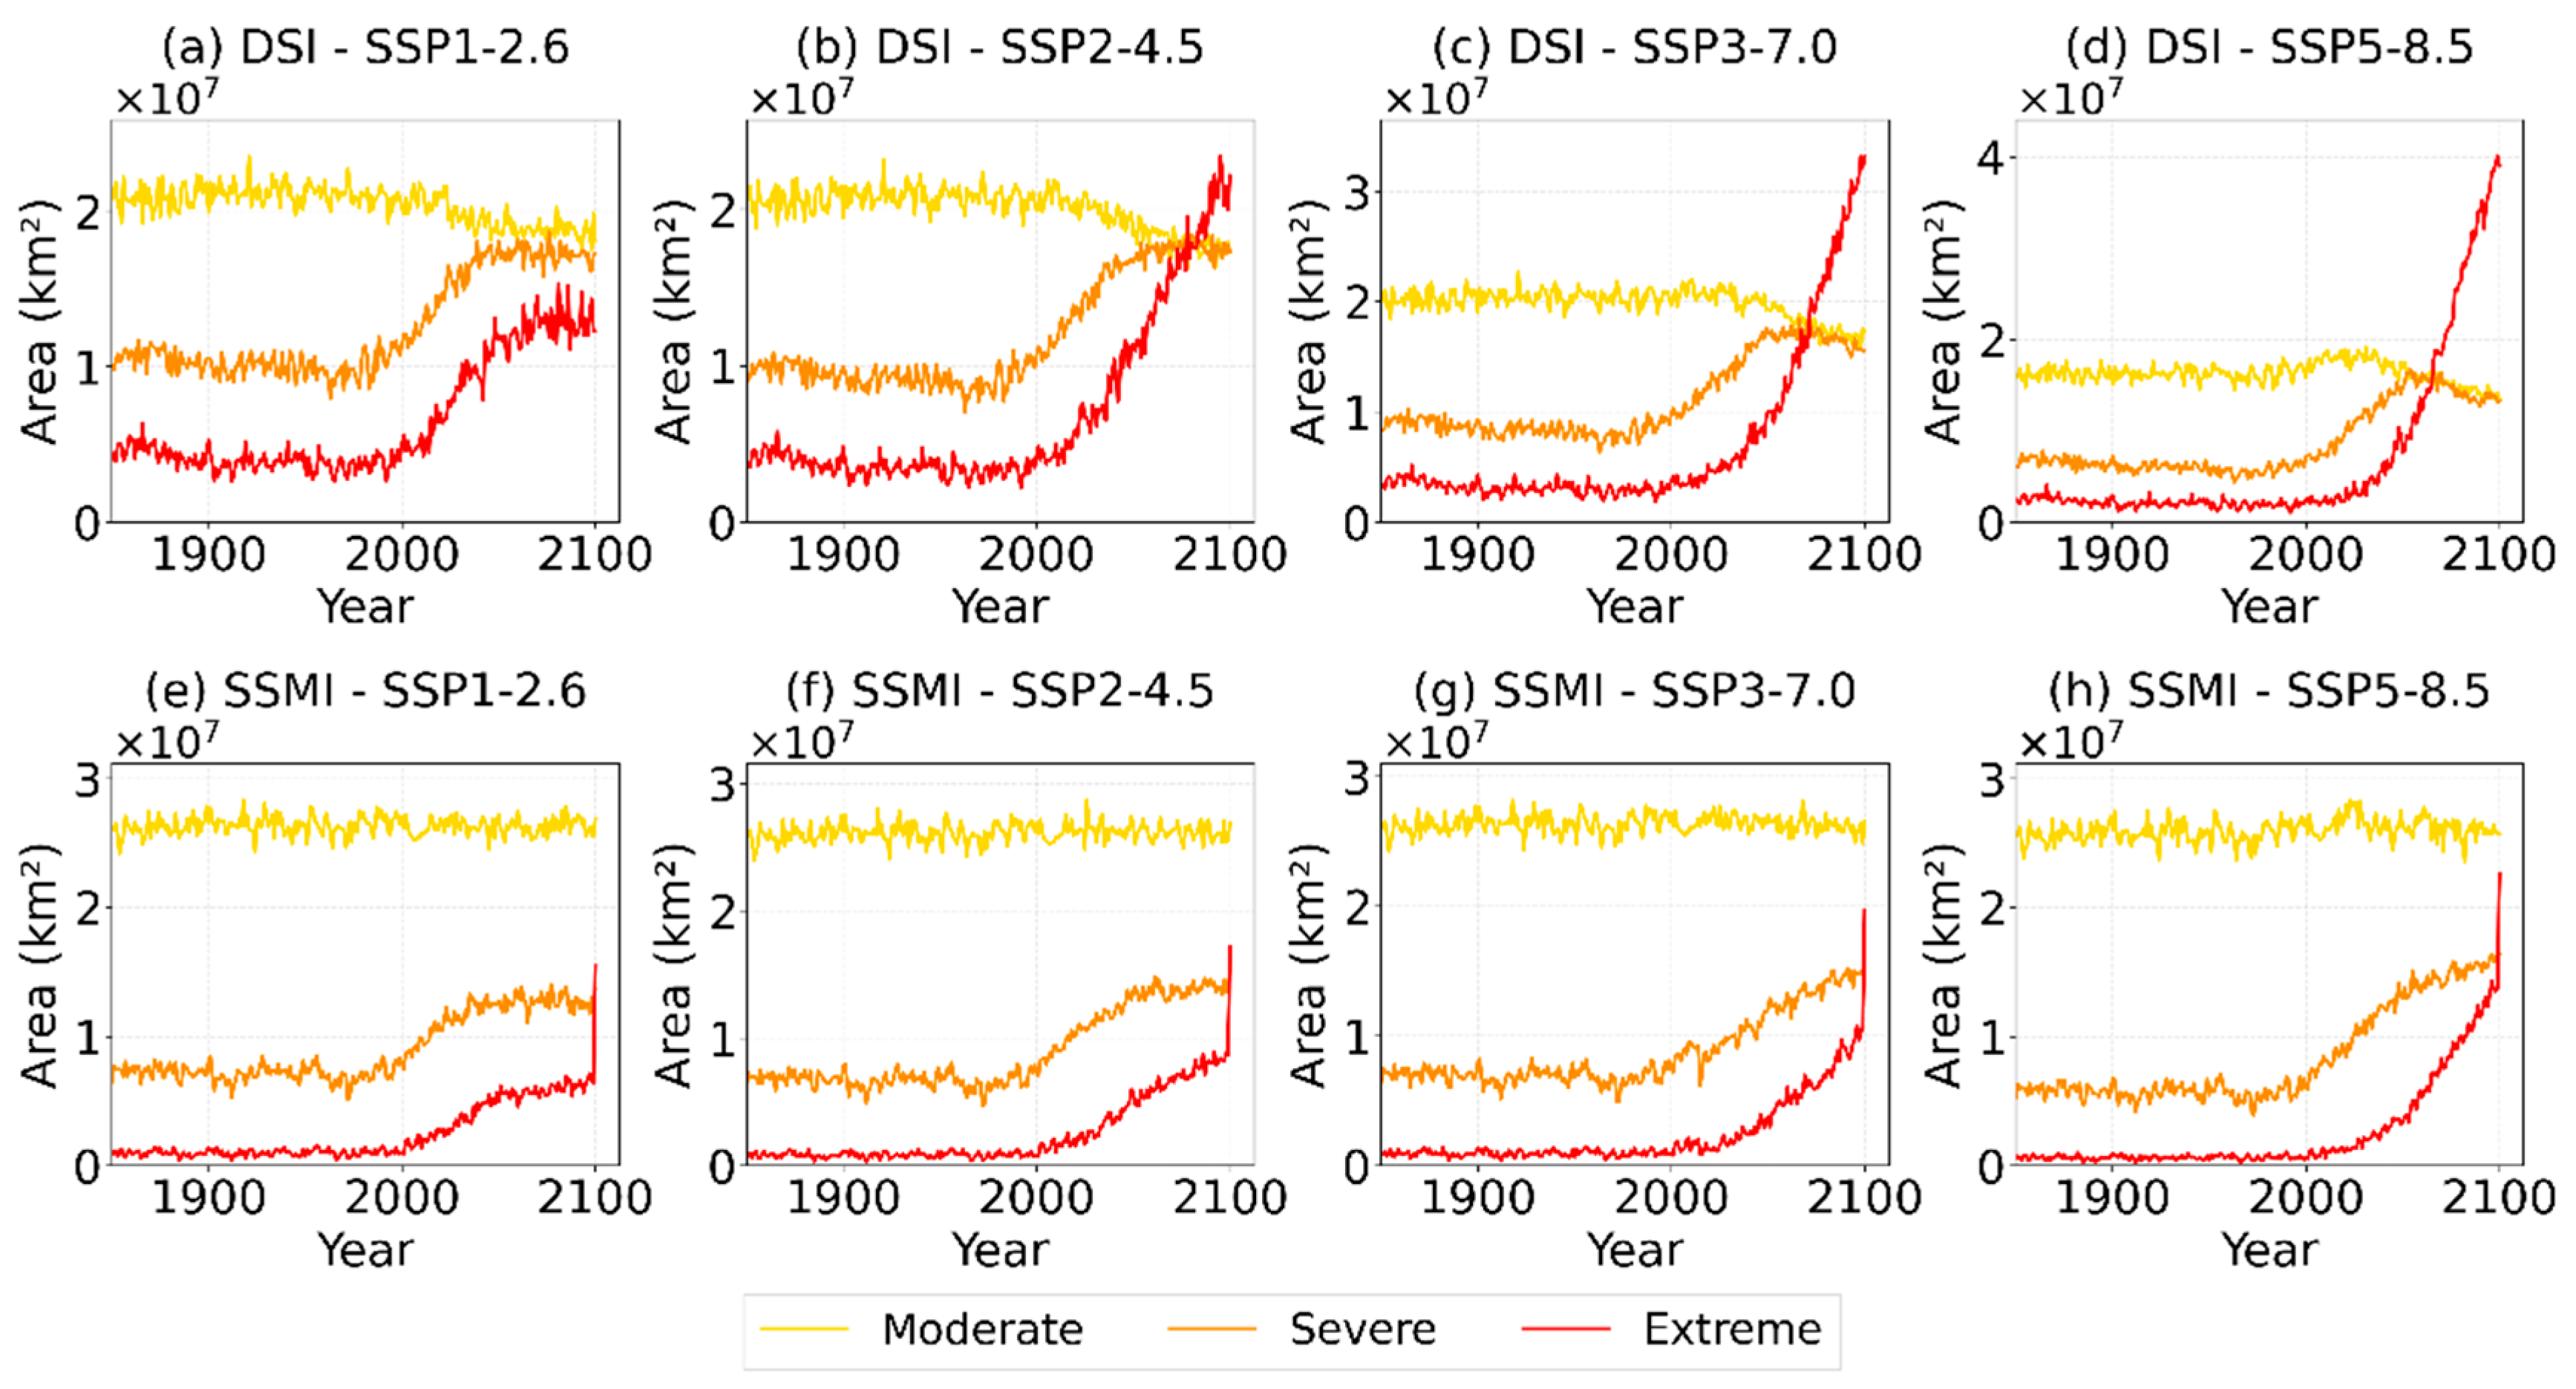
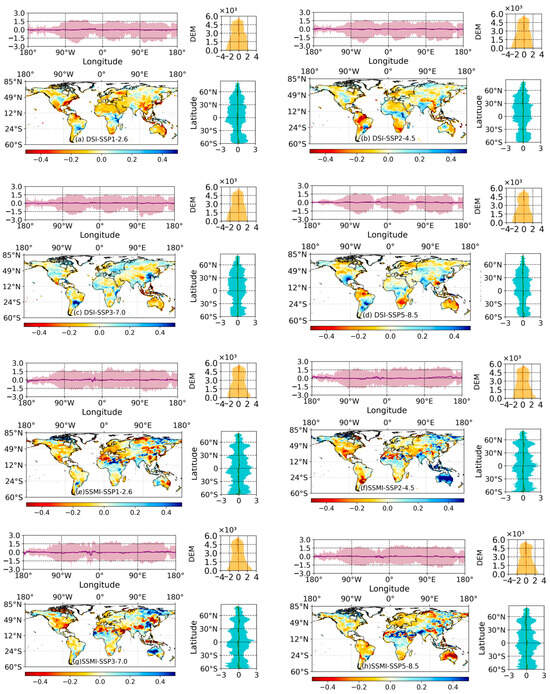
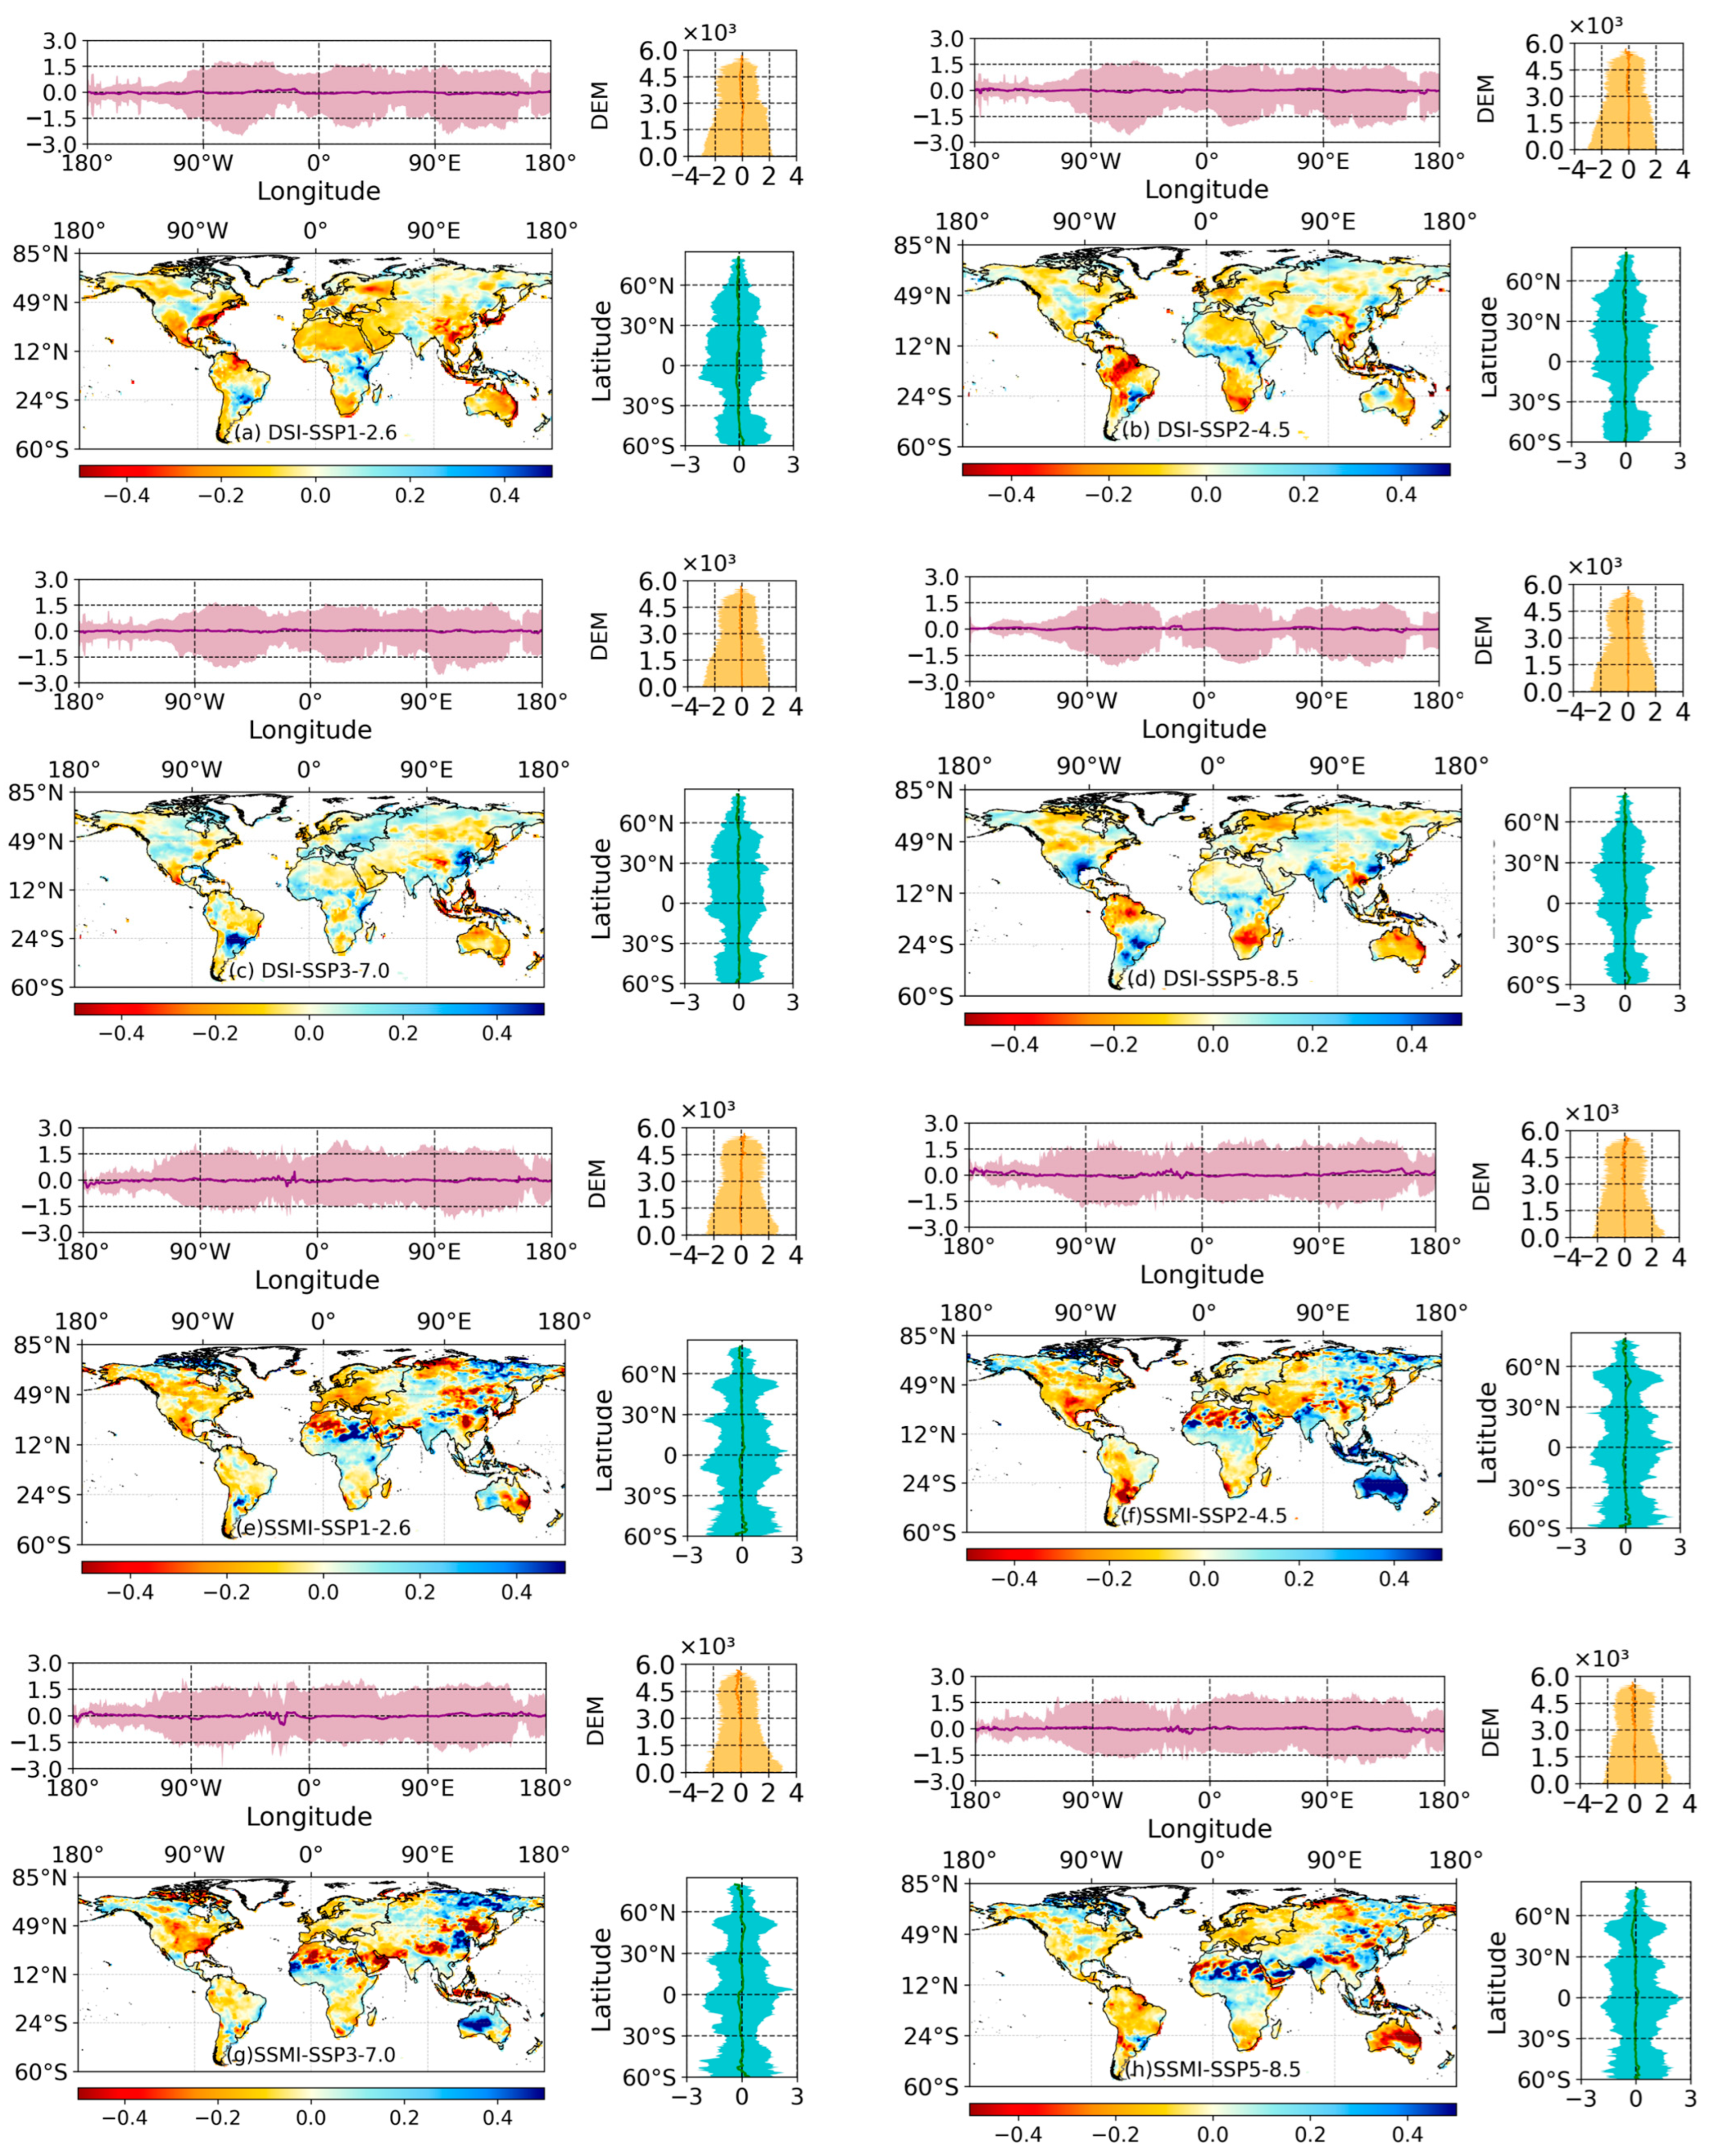
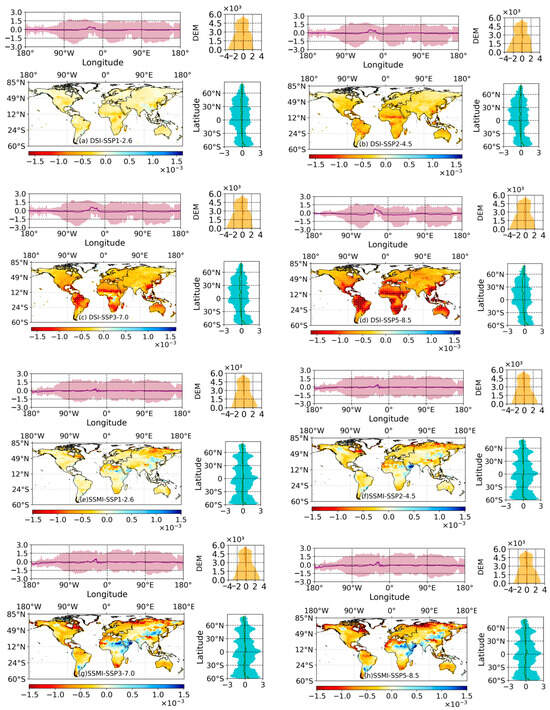
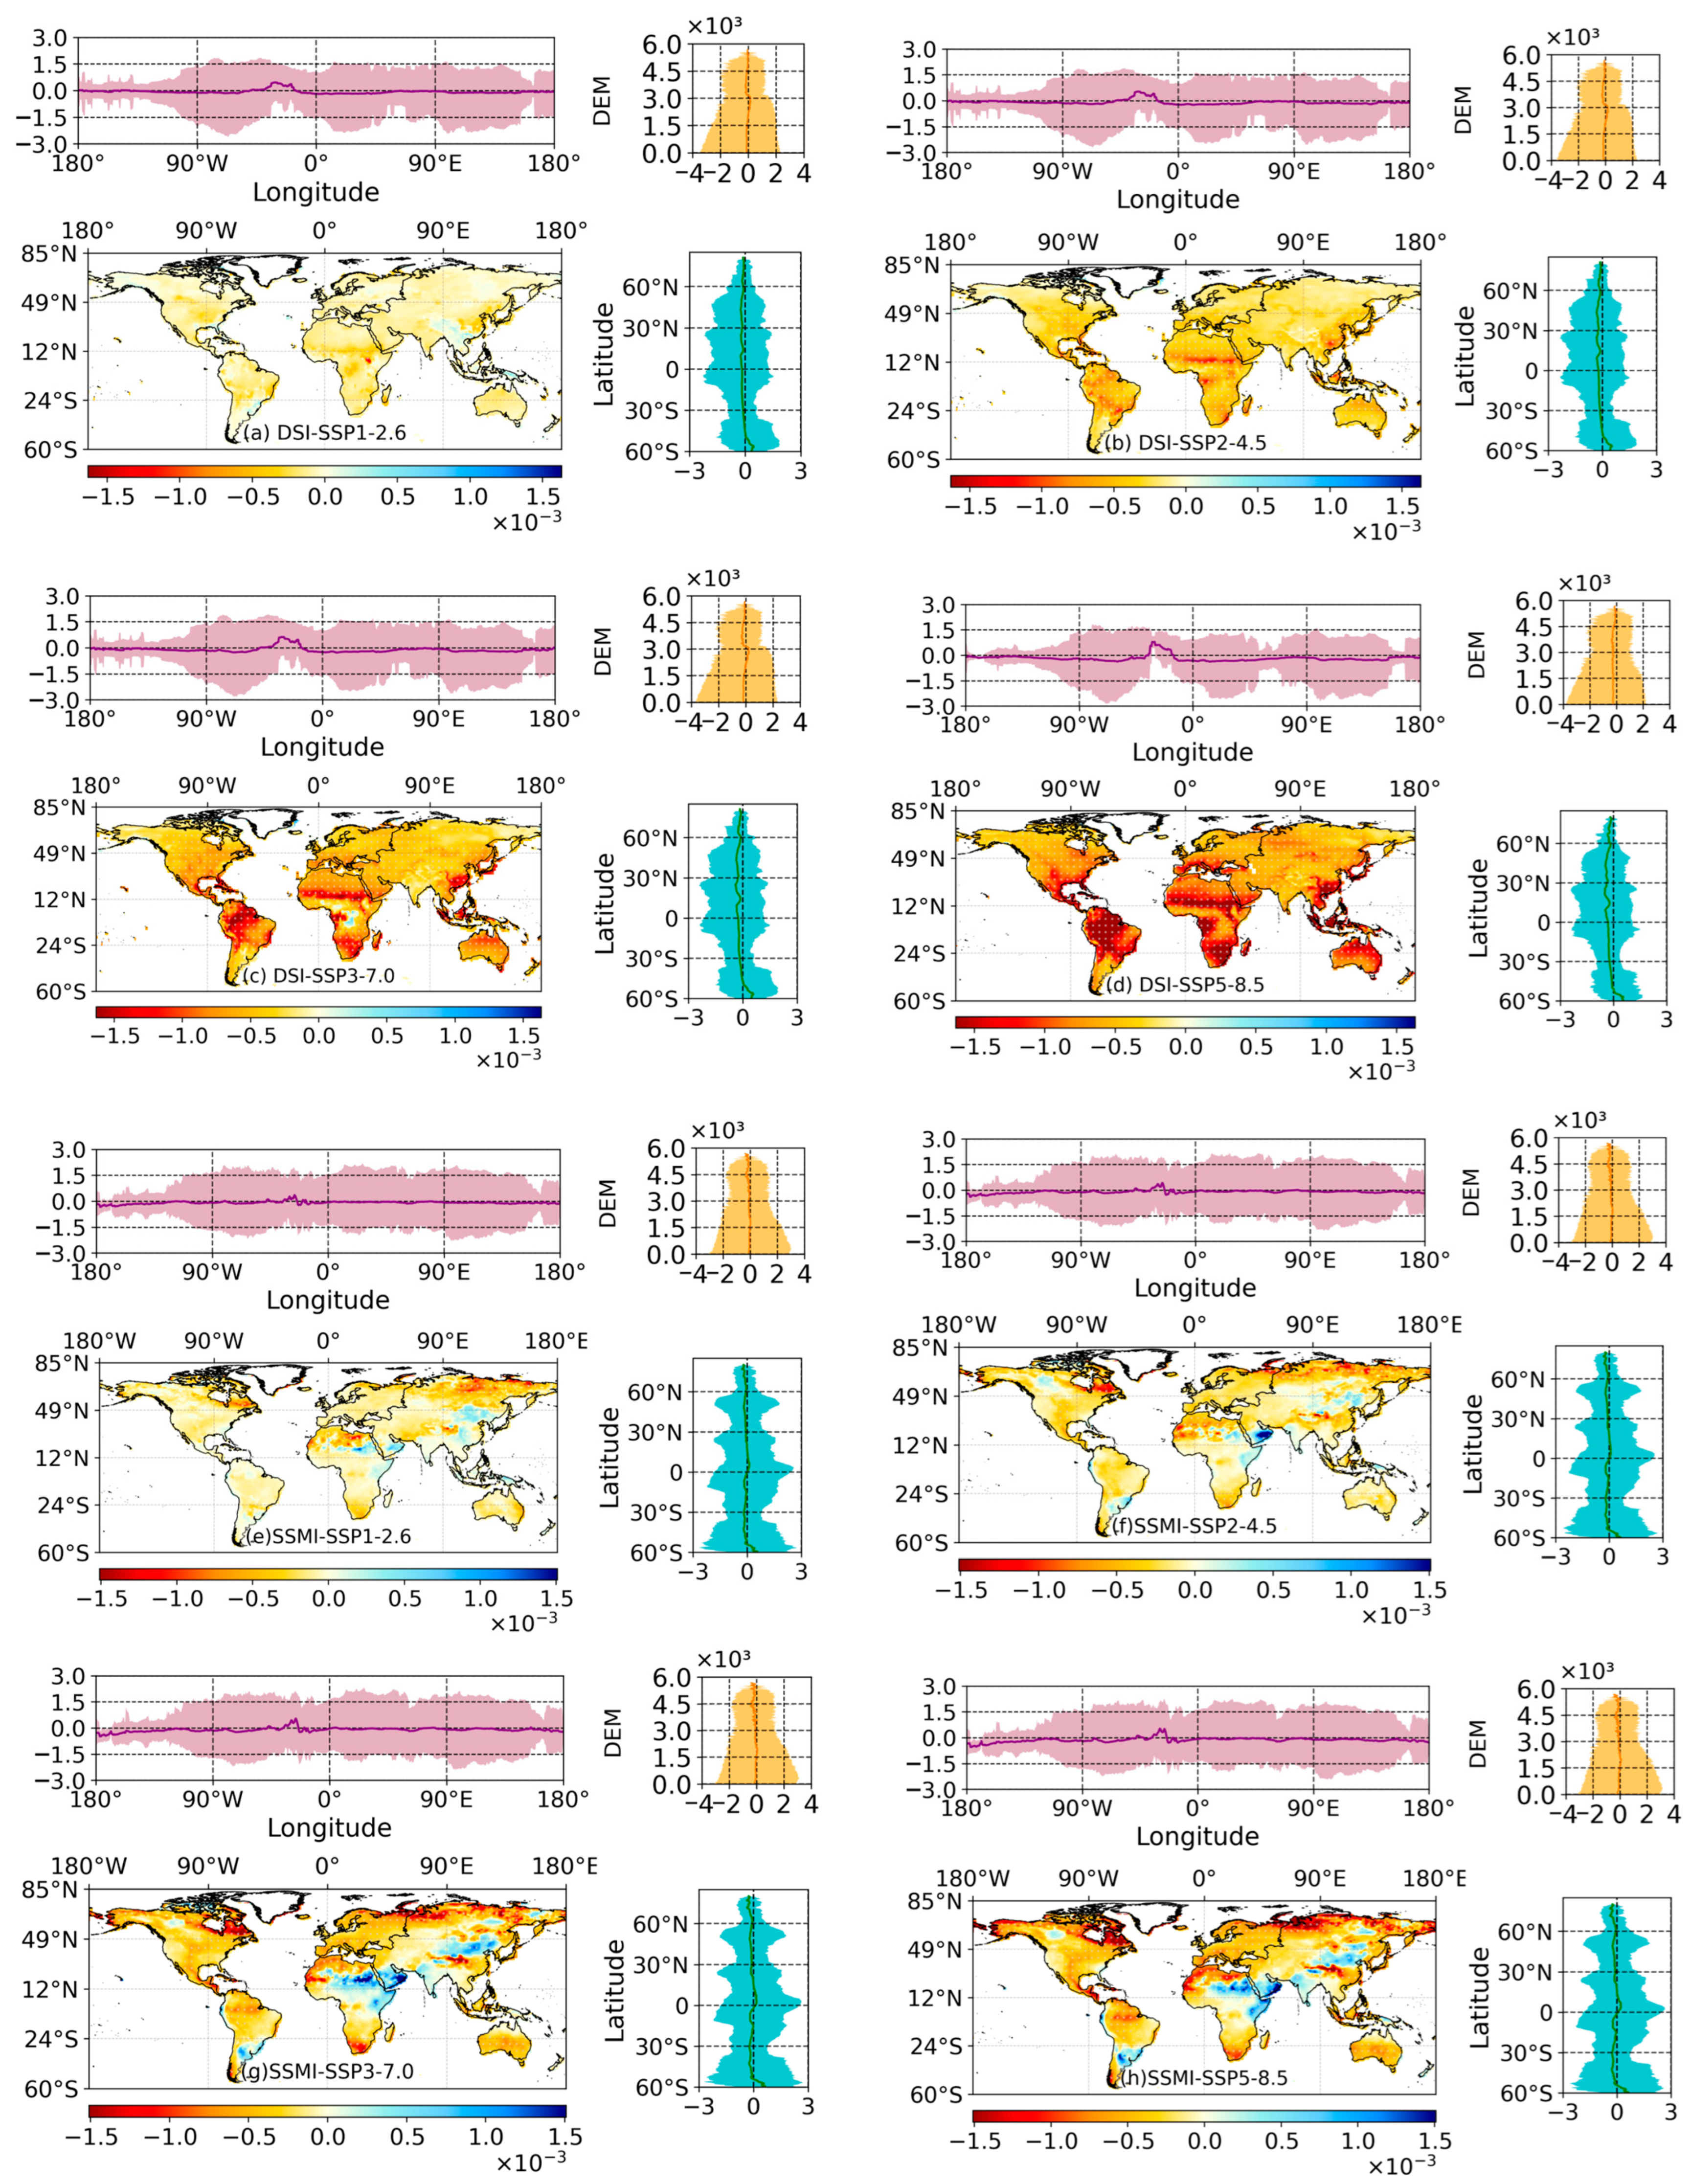

Disclaimer/Publisher’s Note: The statements, opinions and data contained in all publications are solely those of the individual author(s) and contributor(s) and not of MDPI and/or the editor(s). MDPI and/or the editor(s) disclaim responsibility for any injury to people or property resulting from any ideas, methods, instructions or products referred to in the content. |
© 2026 by the authors. Licensee MDPI, Basel, Switzerland. This article is an open access article distributed under the terms and conditions of the Creative Commons Attribution (CC BY) license.