


Highlights
What are the main findings?
- AlphaEarth embeddings encode SOC-relevant information through soil, vegetation, radar and terrain-related signals.
- SOC–embedding relationships and predictive importance vary strongly across European environmental domains.
What are the implications of the main findings?
- Poor cross-region transferability highlights the need for local or regional calibration of SOC models.
- Domain-aware interpretation is essential for the operational use of foundation embeddings in SOC estimation.
Abstract
Soil organic carbon (SOC) estimation from Earth Observation is increasingly important for assessing soil health, carbon dynamics and the effects of agricultural management. However, conventional optical approaches are often constrained by the limited availability of bare-soil observations, particularly in cropping systems affected by vegetation cover, residues and conservation practices. AlphaEarth Foundation (AEF) embeddings provide annual, multi-source, 10 m representations of the land surface and may offer an alternative representation for SOC modelling, although their environmental meaning for soil applications remains poorly understood. In this study, we investigated whether AEF embedding dimensions encode SOC-relevant information consistently across contrasting European agricultural soil datasets. We used 1060 georeferenced topsoil samples collected in Italy, France and Slovakia between 2020 and 2025. SOC–embedding relationships were assessed using Pearson and Spearman correlations, while Random Forest models and bootstrap permutation variable importance were used to identify stable predictive dimensions. Model transferability was evaluated through leave-one-dataset-out validation. To support functional and environmental interpretation, selected embeddings were correlated with separately derived EO and terrain covariates derived from Sentinel-2, Landsat 8/9, Sentinel-1 and SRTM, including bare-soil reflectance, vegetation indices, radar backscatter and topographic variables. Results showed that AEF embeddings contained SOC-relevant information, but this information was distributed across multiple latent dimensions and was strongly context dependent. At the pooled level, A55, A30, A51 and A27 were among the most influential embeddings, with A55 and A30 representing opposite orientations of a soil-brightness gradient. A55, A50 and A30 were associated with bare-soil reflectance patterns consistent with the darkening effect of higher SOC, whereas other embeddings were associated with vegetation, radar and terrain-related signals. Dataset-specific models revealed different importance profiles across France, Italy and Slovakia, and leave-one-dataset-out validation produced negative R2 values for all excluded datasets, indicating poor direct transferability. Overall, AEF embeddings can support SOC estimation within individual environmental domains, but their predictive relevance and functional interpretation are strongly context dependent, and no single embedding dimension showed a universal SOC-related meaning. These findings highlight that geospatial foundation-model embeddings should not be used as black-box predictors for soil applications, but require local or regional calibration, geographically independent validation and domain-aware interpretation. These findings support a practical framework for using foundation-model embeddings more transparently in digital soil mapping, by linking latent dimensions to SOC, EO covariates and transferability behaviour.
1. Introduction
Soil organic carbon (SOC) is a key indicator of soil health, agricultural sustainability and climate-change mitigation potential. Reliable SOC monitoring is therefore increasingly required to evaluate the impact of land management, support carbon accounting schemes and guide the transition towards more sustainable farming systems. At the European level, this demand is also strengthened by the implementation of the EU Soil Monitoring Law, which promotes a harmonised framework for assessing soil health and addressing key degradation processes, including the loss of soil organic matter. Consequently, there is an increasing need for spatially explicit, repeatable and interpretable approaches capable of supporting SOC estimation and monitoring across heterogeneous agricultural landscapes.
In agricultural areas, Earth Observation (EO) has become a major source of spatial information for SOC modelling, particularly through optical satellite data, which can capture spectral differences related to soil colour, organic matter content, texture, moisture and surface conditions [1,2]. However, the operational use of optical EO for SOC estimation remains strongly constrained by the availability of bare-soil observations [3,4]. This limitation is becoming increasingly relevant in regenerative and conservation agriculture systems, where cover cropping, crop residues, reduced tillage and permanent soil cover reduce the frequency and spatial extent of exposed soil conditions. This decreasing availability of bare-soil pixels under cover cropping and no-tillage systems has recently been shown to challenge conventional optical approaches [5].
A possible way to overcome this limitation is to move from single-source, bare-soil-dependent predictors towards multi-source representations of the land surface. Combining optical, radar, topographic and environmental information may help capture SOC-related variability even when bare-soil observations are sparse or temporally discontinuous. In this context, geospatial foundation models offer an alternative to direct EO predictors. Rather than relying on manually engineered covariates, these models generate dense embedding representations that integrate information from multiple EO and ancillary data sources. AlphaEarth Foundations (AEF) is one of the most recent examples of this approach [6]. It provides annual, analysis-ready embedding fields designed to support a wide range of mapping and monitoring tasks from sparse labels. AEF embeddings have shown promising performance across different geospatial applications and have recently attracted attention for environmental and carbon-related modelling tasks.
Despite this potential, a major limitation of foundation-model embeddings is their limited physical interpretability [7]. While conventional EO covariates, such as Sentinel-2 reflectance, Sentinel-1 backscatter or terrain attributes, can often be linked to known biophysical processes [8,9,10], individual embedding dimensions are latent variables whose meaning is not immediately clear. This makes it difficult to know what an SOC prediction based on AEF is actually capturing. A model based on AEF embeddings may predict SOC accurately, but without understanding which embedding dimensions are important and what EO information they encode, it remains difficult to determine whether the model is capturing meaningful soil-related gradients, vegetation or management effects, topographic context, or dataset-specific artefacts. Recent studies have started to investigate the physical and functional meaning of AlphaEarth dimensions, showing that some embedding axes may be associated with environmental variables, land-cover structure or broader geospatial gradients [11,12]. Although AEF embeddings have already been tested for SOC estimation in our previous work [5], their dimension-level environmental meaning, dataset-specific behaviour and geographical transferability for measured SOC observations remain largely unexplored. The operational value of AEF for SOC estimation depends not only on predictive accuracy, but also on understanding whether the most important embedding dimensions encode physically meaningful soil, vegetation, radar or terrain-related gradients, and whether these relationships remain stable across contrasting environmental and management contexts. Unlike environmental variables with a direct and specific spectral signature, SOC is expressed through a relatively indirect optical pathway, primarily a darkening effect on soil reflectance, that covaries with texture, mineralogy, moisture and vegetation, and cannot be unambiguously isolated from these confounding factors. Testing whether a general-purpose geospatial embedding space encodes such an indirect, policy-relevant soil property in an interpretable and transferable way therefore constitutes a non-trivial empirical question, rather than a direct consequence of AEF’s multi-source design.
The relationship between EO signals and SOC is often domain-dependent. Soil reflectance is affected not only by organic carbon, but also by texture, mineralogy, moisture, roughness, crop residues and vegetation cover. Radar signals may respond to surface structure and moisture, while topographic variables may reflect landscape position, erosion processes or environmental gradients. As a result, an embedding dimension that is useful for SOC prediction in one region may not represent the same functional process in another. Understanding the origin and behaviour of SOC-relevant embeddings is thus essential for assessing whether AEF can be used as a transferable SOC estimation tool, or whether local calibration and domain-aware interpretation are required.
In this study, we investigated the interpretability and consistency of AEF embeddings for SOC across three independent European soil datasets. The datasets included more than 1000 georeferenced SOC samples collected in Italy, France and Slovakia, representing contrasting soils, climatic conditions and agricultural contexts. The analysis was structured around three main questions. First, which AEF embedding dimensions most strongly encode SOC-relevant information. Second, we then evaluated the predictive relevance of the selected embeddings using Random Forest models. Models were fitted globally and separately by dataset, and bootstrap permutation variable importance was used to identify stable embedding dimensions contributing to SOC estimation. Cross-dataset transferability was further assessed using leave-one-dataset-out validation. Finally, the EO origin of the most relevant embeddings was investigated by correlating them with separately derived remote-sensing and terrain covariates derived from Sentinel-2, Landsat 8/9, Sentinel-1 and digital elevation model products. These covariates included bare-soil optical reflectance, vegetation reflectance and indices, radar backscatter metrics and topographic descriptors.
The novelty of this study therefore does not lie in testing AEF embeddings as SOC predictors per se, which was addressed in our previous work [5], but in providing a dimension-level interpretation and cross-dataset assessment of their SOC relevance.
Linking SOC correlations, machine-learning importance, geographical transferability and EO-based interpretation allowed us to test whether AEF embeddings capture physically interpretable soil information, rather than acting as opaque predictors. In particular, we tested whether the most important SOC-related dimensions were consistently associated with independently derived EO and environmental covariates, such as soil optical brightness, vegetation or residue signals, radar-sensitive surface structure, or terrain-related context, an association that would support their functional, physically grounded interpretation. Beyond improving model transparency, this distinction clarifies what type of SOC-related trend the model is actually capturing. An embedding that mainly captures bare-soil darkness may represent a relatively direct optical SOC signal, whereas one dominated by vegetation, radar or topographic information likely provides contextual or indirect information related to management, surface cover, moisture or landscape position. Distinguishing among these mechanisms can help target SOC monitoring strategies to the agricultural contexts where bare-soil observations are scarce. Taken together, these analyses assess whether AEF embeddings behave as transferable SOC-relevant representations or as domain-dependent latent features whose value varies across soil, environmental and management contexts.
2. Materials and Methods
2.1. Soil Datasets
A total of 1060 georeferenced soil samples were collected between 2020 and 2025 in three countries following a harmonised field sampling protocol in croplands where wheat was included in the crop rotation (Figure 1). At each sampling location, a composite soil sample was collected from an area of approximately 100 m2, corresponding to the spatial support of the AEF embedding pixel. Sampling was restricted to the upper 20 cm of the soil profile to maximise the correspondence between measured SOC and surface-sensitive EO information. A subsample of each composite sample was transported to the laboratory, where SOC content was determined using the Walkley–Black method (Table 1).
Figure 1.
Sampling areas for the French (FRA), Italian (ITA) and Slovak (SVK) soil datasets.
Table 1.
Descriptive statistics of measured SOC content (%) for the Italian (ITA), French (FRA) and Slovak (SVK) datasets and for the pooled (ALL) dataset.
The Italian and French datasets were previously used in our earlier AEF-based SOC modelling study [5], where the main objective was to evaluate the predictive potential of annual AEF embeddings under conditions of limited bare-soil availability. In the present study, these two datasets were reused as reference agricultural domains, while an independent Slovak dataset was newly included to extend the analysis to a third pedological and geographical context. All three datasets were analysed within a common framework specifically designed to assess SOC–embedding associations, dataset-specific embedding behaviour, cross-dataset transferability and EO-based functional interpretation. Therefore, the reuse of the Italian and French datasets provides continuity with the previous study, whereas the Slovak dataset and the interpretability and transferability analyses constitute new components of the present work.
The Italian dataset (ITA) is composed of 597 soil samples collected in the Po Basin plain, one of the most intensively cultivated agricultural regions in Italy. The area is characterised by a temperate climate with continental influence, including mild to cold winters, warm summers and marked seasonal variability in precipitation and vegetation dynamics. The region supports highly productive cropping and livestock systems, with both autumn–winter and spring–summer crops contributing to strong seasonal variation in vegetation cover and spectral responses. The dominant soil groups include Cambisols, Luvisols, Fluvisols and Regosols (Table 2). Because of its intensive agricultural use and exposure to soil degradation pressures, the Po Basin represents a relevant case study for SOC estimation in highly managed croplands.
Table 2.
Cross-tabulation of soil groups by country dataset. Values indicate the number of samples for each soil group in France (FRA), Italy (ITA) and Slovakia (SVK), with the pooled total (ALL) reported in the final column.
The French dataset (FRA) is composed of 325 soil samples collected across three administrative regions: Bourgogne–Franche-Comté in central France, Auvergne–Rhône-Alpes in the south-central part of the country, and Normandie in northern France. These areas represent contrasting agricultural and environmental conditions across major French cropland regions. The climate is predominantly temperate, ranging from oceanic conditions in the northern sites to more continental and warmer temperate conditions in central and south-central areas. Agricultural systems are diversified and include arable crops, mixed farming, livestock production and, in some areas, permanent crops. As in the Italian dataset, the coexistence of winter and summer crops produces marked seasonal variability in vegetation development and satellite-observed spectral responses. The dominant soil groups include Cambisols, Luvisols, Fluvisols and Retisols (Table 2). Overall, the French dataset provides a heterogeneous agricultural context for assessing SOC–embedding relationships across different climatic, pedological and management conditions.
The Slovak dataset (SVK) is composed of 138 soil samples collected in western and south-western Slovakia. The sampling sites are distributed across four agricultural farms and include both lowland agricultural areas and more northern valley or foothill settings. The region is characterised by a temperate continental climate, with cold winters, warm summers and pronounced seasonal variation in vegetation development. The dominant soil groups represented in the dataset include Phaeozems, Chernozems, Fluvisols and Leptosols (Table 2). These conditions make the Slovak dataset a useful contrast to the Italian and French cases, extending the analysis to a distinct Central European soil and landscape setting.
2.2. AlphaEarth Foundations Embeddings Extraction
AlphaEarth Foundations embeddings were used as the main latent EO representation for SOC modelling and interpretation. The embeddings were obtained from the Google Satellite Embedding V1 annual dataset, which was produced by AlphaEarth Foundations and is available in Google Earth Engine as the image collection GOOGLE/SATELLITE_EMBEDDING/V1/ANNUAL [6]. The dataset provides global annual embedding fields at a 10 m spatial resolution. Each pixel is represented by a 64-dimensional unit-length vector, with individual dimensions stored as bands named A00, A01, …, A63. These dimensions do not correspond to conventional spectral bands but represent latent axes of a learned geospatial embedding space derived from multi-source EO data.
For each SOC sampling location of the three soil datasets, the AEF embedding image corresponds to the year of soil sampling. This ensured temporal consistency between field observations and the annual surface-condition representation encoded by AlphaEarth.
The use of annual AEF embeddings was intended to provide a compact multi-source description of the land surface around each SOC sampling location. Unlike conventional EO predictors, which are directly linked to specific sensors or spectral measurements, AEF embedding dimensions are latent variables summarising temporal and multi-modal surface information. For this reason, the embeddings were first analysed statistically in relation to measured SOC and then interpreted functionally through comparison with separately derived EO and terrain variables described in Section 2.3. This approach allowed us to identify which embedding dimensions were most relevant for SOC and to assess whether their behaviour could be related to interpretable optical, radar or topographic gradients.
2.3. Earth Observation and Terrain Data for Embedding Interpretation
To support the EO-based functional interpretation of the AEF embedding dimensions, a set of separately derived EO and terrain covariates was extracted for each SOC sampling location (Table 3). These covariates were selected to represent the main information domains described by [6] for the AlphaEarth embedding framework, including optical reflectance, radar backscatter and topographic context. They were not intended to reproduce the internal AlphaEarth feature-generation process, but rather to provide functionally interpretable proxies for the main information domains that are relevant to SOC and broadly consistent with the multi-source EO nature of foundation embeddings. These covariates were used exclusively for functional interpretation of the AEF dimensions and were not intended as alternative predictive benchmarks. Specifically, we considered optical, radar and topographic variables derived from Sentinel-2, Landsat 8/9, Sentinel-1 and digital elevation model products.
Table 3.
Earth Observation and terrain covariates extracted for the functional interpretation of AlphaEarth Foundation embeddings.
All EO covariates were extracted in Google Earth Engine using the rgee interface in R (version 4.3.2) [13]. For each SOC observation, covariates were extracted for the corresponding sampling year. Sampling locations were converted to point geometries and buffered by 10 m before extraction in order to approximate the local support of the SOC observations while maintaining consistency with the spatial resolution of AlphaEarth and Sentinel-2. Annual composites were generated separately for each year represented in the soil dataset, and mean values were extracted over the buffered geometries.
Sentinel-2 surface reflectance data were used to derive optical covariates related to both bare-soil and vegetation conditions. Clouds, cloud shadows, cirrus and snow were masked using the Scene Classification Layer. Surface reflectance bands were scaled and annual median composites were produced. A vegetation mask was defined using the combined condition NDVI > 0.25 and NBR2 > 0.125 [14], while the inverse mask was used to identify bare-soil observations. The combined use of NDVI [15] and NBR2 [16] was intended to improve the selectivity of bare-soil observations for SOC-related analyses, as NDVI primarily excludes green vegetation, whereas NBR2, through its sensitivity to SWIR reflectance, helps reduce the influence of crop residues and moisture-affected surfaces [16]. To ensure sufficiently robust annual estimates, for each sampling year, separate median composites for bare-soil and vegetation conditions were calculated for each sampling location when at least five valid observations satisfied the cloud, shadow, NDVI, and NBR2 screening criteria. When fewer than five valid observations were available for a given sensor or covariate, the corresponding annual bare-soil value was treated as missing and excluded from the subsequent correlation analyses.
The extracted Sentinel-2 covariates included visible, red-edge, near-infrared and shortwave-infrared bands. In addition, vegetation indices were calculated from the vegetation composite, including NDVI, EVI [17], SAVI [18] and NDWI [19].
Landsat 8 and Landsat 9 Collection 2 Level 2 surface reflectance data were processed in a similar way to Sentinel-2. Cloud, cloud shadow, cirrus, snow and saturated pixels were masked using the QA_PIXEL and QA_RADSAT bands. Reflectance values were scaled according to the Landsat Collection 2 specifications. Bare-soil and vegetation composites were then generated using the same NDVI and NBR2 thresholds adopted for Sentinel-2. Landsat optical bands and vegetation indices were extracted to provide an additional optical description of soil and vegetation conditions at coarser spatial resolution.
Sentinel-1 GRD data were used to describe radar-sensitive surface properties. Annual median composites were generated from Interferometric Wide Swath acquisitions including both VV and VH polarisations. The extracted radar covariates included VV backscatter, VH backscatter, the VV–VH difference and the linear VV/VH ratio. These variables were included because radar backscatter may provide information on surface roughness, soil moisture, crop residues and vegetation structure, which can indirectly influence the relationship between EO signals and SOC.
Topographic covariates were derived from the Shuttle Radar Topography Mission DEM available in Google Earth Engine (USGS/SRTMGL1_003). Elevation was extracted directly from the DEM, while slope, aspect, curvature and topographic wetness index were calculated to represent terrain-related controls on SOC variability, including landscape position, erosion and deposition processes, and potential moisture accumulation.
The resulting EO and terrain covariates were used exclusively for interpretability analyses. In particular, they were correlated with the selected AEF embedding dimensions to investigate whether the embeddings most relevant for SOC prediction were associated with environmentally meaningful gradients, such as bare-soil optical brightness, vegetation or residue signals, radar-sensitive surface structure, or terrain context. This step allowed us to assess whether the most important SOC-related embedding dimensions encoded direct soil spectral information, indirect surface-cover information, or broader environmental controls.
2.4. SOC-Embedding Correlation Analysis
As an initial screening step, we assessed the correlation between measured SOC and each of the 64 AEF embedding dimensions. The analysis was first performed at the global level by pooling all samples from the three soil datasets. Pearson and Spearman correlation coefficients were calculated to quantify linear and monotonic SOC–embedding relationships, respectively. For each analysis, all 64 embedding dimensions were tested, and the strongest associations were identified by ranking the embeddings according to the absolute value of the correlation coefficient. For each embedding correlation coefficients, p-values and 95% bootstrap confidence intervals based on 500 resamples were recorded. Since multiple embedding dimensions were tested simultaneously, p-values were adjusted using the Benjamini–Hochberg false discovery rate procedure to reduce the risk of chance associations being considered significant. Statistical significance was interpreted using the adjusted p-values, and embeddings were considered statistically significant only when the adjusted p-value was <0.05.
To distinguish within-dataset SOC–embedding associations from relationships potentially driven by between-dataset differences, an additional dataset-centred correlation analysis was performed for the main SOC-relevant embeddings. For this analysis, SOC values and embedding values were centred within each country by subtracting their dataset-specific means, and Pearson correlations were then recalculated on the pooled centred values. This analysis was used to assess whether the strongest pooled SOC–embedding relationships persisted after removing country-level mean differences.
The same correlation analysis was repeated separately for each dataset and soil type to evaluate the stability of SOC–embedding relationships across independent datasets and pedological contexts. For both soil-type- and dataset-specific Pearson correlations, differences in group sample size were accounted for when combining correlation estimates across groups by weighting Fisher’s z-transformed correlations according to group sample size (n − 3). Embeddings were ranked according to the absolute value of their correlation with SOC, and global rankings were compared with dataset- and soil-group-specific rankings to assess the consistency of the associations. Embeddings showing relatively large correlation coefficients, statistical significance after Benjamini–Hochberg correction, and a similar direction of association across multiple datasets or soil groups were considered candidate SOC-relevant dimensions.
This correlation-based screening was not intended to provide a predictive model or to imply causal relationships. Rather, it was used to identify latent AlphaEarth dimensions potentially encoding SOC-related information and to support the subsequent selection of embeddings for EO-based interpretation, together with the model-based variable-importance analysis.
2.5. Random Forest Modelling, Variable-Importance and Transferability Assessment
Random Forest models were used to evaluate the predictive relevance of AEF embedding dimensions for SOC estimation and to assess the transferability of the embedding–SOC relationship across datasets. Random Forest was selected because it can model non-linear relationships and interactions among predictors. The response variable was measured SOC, while the predictors were the AEF embedding dimensions.
A global Random Forest regression model was first fitted by pooling the samples from the three soil datasets. The model was implemented using the ranger package in R, with 1000 trees, the square root of the number of embedding predictors randomly selected at each split, and a minimum node size of 5. Model performance was assessed using out-of-bag predictions and evaluated using root mean square error (RMSE) (Equation (6)), mean absolute error (MAE) (Equation (7)), coefficient of determination (R2) (Equation (8)), and normalized RMSE (nRMSE) (Equation (9)).
where n is the number of observations, is the observed value, is the predicted value and is the mean of the observed values. The out-of-bag and bootstrap predictions were used as internal performance estimates under a common modelling framework and to support the comparison of embedding importance across datasets. They were not intended to provide spatially independent validation because no harmonised field, farm or spatial-block structure was available across the three datasets.
Permutation variable importance was used to quantify the contribution of each embedding dimension to SOC prediction. This method measures the increase in prediction error after randomly permuting a predictor; embeddings associated with larger increases in error were considered more important. To assess the stability of variable importance, a bootstrap procedure with 200 iterations was applied. At each iteration, observations were sampled with replacement from the full dataset, and the observations not selected were used as out-of-bag test data. For each valid bootstrap iteration, a Random Forest model with 700 trees was fitted, predictions were generated for the corresponding out-of-bag observations, and permutation variable importance was extracted. Bootstrap results were summarised by calculating, for each embedding, the mean, median, standard deviation and 2.5th and 97.5th percentiles of importance, together with mean rank.
Cross-dataset transferability was evaluated using leave-one-dataset-out validation. In each iteration, the model was trained on samples from two datasets and tested on the dataset left out, repeating the procedure for Italy, France and Slovakia. Predictive performance was evaluated using RMSE, MAE, R2 and nRMSE. In addition, separate Random Forest models were fitted for each dataset to assess within-dataset performance and dataset-specific embedding importance patterns. The same model settings and bootstrap variable-importance procedure were applied to each national dataset. The same validation framework was not applied at the soil type-group level because the limited sample size of some soil classes would have compromised the robustness of both model training and performance evaluation.
Dataset-specific importance rankings were compared across datasets to evaluate the consistency of SOC-relevant embeddings. Embeddings repeatedly appearing among the most important variables in more than one dataset were considered more stable, whereas embeddings important only in a single dataset were interpreted as potentially domain-specific.
The Random Forest and bootstrap variable-importance analyses were used to identify embedding dimensions with high predictive relevance for SOC and to distinguish between globally relevant and dataset-specific predictors. These model-based results were interpreted jointly with the SOC–embedding correlation analysis and subsequently compared with separately derived EO and terrain variables to identify interpretable EO and environmental associations of the most relevant embeddings.
2.6. EO-Based Interpretation of SOC-Relevant Embeddings
The final step of the analysis investigated the functional meaning of the AEF embedding dimensions identified as relevant for SOC. Since AEF dimensions are latent variables and cannot be directly interpreted as conventional spectral or environmental covariates, they were compared with separately derived EO and terrain variables extracted for the same sampling locations and years. This analysis aimed to determine whether SOC-relevant embeddings were associated with interpretable gradients related to bare-soil reflectance, vegetation condition, radar-sensitive surface properties or terrain context.
The EO-based interpretation focused on embeddings supported by the previous analyses, including those showing relevant SOC correlations, high Random Forest variable importance, or dataset-specific predictive relevance. For each selected embedding, Pearson correlations were calculated against all EO and terrain covariates described in Section 2.3 and Table 3. For each embedding–covariate pair, the number of valid observations, Pearson correlation coefficient, coefficient of determination and p-value were recorded. p-values were adjusted using the Benjamini–Hochberg false discovery rate procedure to account for multiple comparisons.
The analysis was first performed globally by pooling all samples from the three countries. EO and terrain covariates were ranked according to the absolute value of their Pearson correlation with each embedding. Positive and negative correlations were interpreted separately, as the sign of the relationship provided information on the direction of the encoded gradient.
The same embedding–covariate correlation analysis was then repeated separately for each dataset to evaluate whether the EO meaning of selected embeddings was stable across datasets. For each dataset and embedding, the top-ranked EO covariates were compared with the corresponding global ranking by assessing overlap among the most correlated covariates, changes in correlation sign, rank differences and ranking similarity.
Finally, EO-based interpretation was integrated with SOC correlation and Random Forest importance results. Embeddings that were important for SOC prediction and strongly associated with functionally meaningful EO covariates were considered more interpretable, whereas embeddings with high predictive relevance but weak or inconsistent EO associations were interpreted more cautiously.
3. Results
3.1. SOC-AlphaEarth Embedding Correlations
3.1.1. Overall SOC-AEF Correlations
Across the 1060 sampling locations included in the three datasets, fewer than half of the AEF embedding dimensions were significantly correlated with SOC according to both Pearson’s and Spearman’s correlation analyses. Overall, the correlations were weak (Figure 2). The strongest positive correlations were observed for A55 (Pearson’s r = 0.34; Spearman’s ρ = 0.32) and A50 (Pearson’s r = 0.21; Spearman’s ρ = 0.19). The strongest negative correlations were found for A30 (Pearson’s r = −0.23; Spearman’s ρ = −0.24) and A27 (Pearson’s r = −0.16; Spearman’s ρ = −0.12). The close agreement between the Pearson and Spearman coefficients suggests that the relationships were predominantly monotonic and approximately linear, with limited evidence of strong non-linear patterns.
Figure 2.
The 23 strongest positive and negative Pearson and Spearman correlations between AlphaEarth Foundation embedding dimensions and soil organic carbon content in the pooled dataset. All reported correlations were statistically significant after Benjamini–Hochberg correction (p < 0.05).
3.1.2. Dataset-Specific SOC-AEF Correlations
When the datasets were analysed separately, 44 AEF embedding dimensions were significantly correlated with SOC in the French dataset. The strongest positive correlations were observed for A50 (Pearson’s r = 0.36; Spearman’s ρ = 0.41) and A53 (Pearson’s r = 0.33; Spearman’s ρ = 0.38). Conversely, the strongest negative correlations were found for A11 (Pearson’s r = −0.43; Spearman’s ρ = −0.45) and A26 (Pearson’s r = −0.41; Spearman’s ρ = −0.47) (Figure 3).
Figure 3.
The 22 strongest positive and negative Pearson and Spearman correlations between AlphaEarth Foundation embedding dimensions and soil organic carbon content for each dataset. All reported correlations were statistically significant after Benjamini–Hochberg correction (p < 0.05).
In the Italian dataset, 23 AEF embedding dimensions were significantly correlated with SOC. Correlations were generally weaker than those observed in the French dataset. The strongest positive correlation was found for A55 (Pearson’s r = 0.27; Spearman’s ρ = 0.26), whereas A01 showed the strongest negative correlation (Pearson’s r = −0.29; Spearman’s ρ = −0.30).
In the Slovak dataset, 32 AEF embedding dimensions were significantly correlated with SOC, and the correlation coefficients were generally stronger than those observed in the other two datasets. The strongest positive correlations were found for A12 (Pearson’s r = 0.55; Spearman’s ρ = 0.51) and A50 (Pearson’s r = 0.54; Spearman’s ρ = 0.54). The strongest negative correlation was observed for A59 (Pearson’s r = −0.43; Spearman’s ρ = −0.41) (Figure 3).
The most consistent embedding across the three datasets was A55 with an average Pearson’s r of 0.31 and always with a positive sign. A50 showed an average absolute correlation of 0.34; however, the sign was positive for the FRA and SVK datasets and negative for the ITA dataset. Therefore, to distinguish within-dataset SOC–embedding associations from correlations driven by between-dataset differences, SOC and the main SOC-relevant embeddings were centred within each country and Pearson correlations were recalculated on the pooled centred values. The A55–SOC relationship remained positive after dataset centring (r = 0.30, adjusted p < 0.05) but slightly weaker than the original pooled correlation (r = 0.34). A30 also retained a negative association with SOC after centring (r = −0.20, adjusted p < 0.05), compared with r = −0.23 in the pooled analysis. In contrast, the A50–SOC relationship weakened substantially after centring, from r = 0.21 to r = 0.10, although it remained statistically significant. These results indicate that the pooled A55 and A30 relationships were not driven only by between-country differences, whereas the pooled A50 relationship included a stronger between-dataset component.
3.1.3. Soil-Type-Specific SOC-AEF Correlations
When the analysis was stratified by soil group, the relationships between SOC and the AEF embedding dimensions became more heterogeneous (Figure 4). Among the four strongest correlations reported for each soil group, the largest coefficients were observed for Leptosols (n = 89). In this class, A00 and A50 were strongly and positively correlated with SOC (Pearson’s r = 0.67 and 0.65; Spearman’s ρ = 0.69 and 0.70, respectively), whereas A08 and A03 showed strong negative correlations (Pearson’s r = −0.75 and −0.73; Spearman’s ρ = −0.79 and −0.76, respectively).
Figure 4.
Soil-type-specific Pearson correlations r between AlphaEarth Foundation embeddings and soil organic carbon content.
Moderate correlations were also found for Fluvisols (n = 101), particularly for A17 and A56, which were positively associated with SOC, and for A03 and A02, which showed negative relationships. Similarly, in Chernozems (n = 38), A14 and A28 displayed positive correlations of approximately 0.5, while A58 and A29 were negatively correlated with SOC. However, the comparatively small sample size of the Chernozems group should be considered when interpreting these coefficients.
For the remaining soil classes, the relationships were generally weak to moderate. In Cambisols (n = 520), A41 and A18 showed weak positive correlations, whereas A45 and A56 were negatively correlated with SOC. A similar range of coefficients was observed for Luvisols (n = 200), with positive correlations for A55 and A60 and negative correlations for A56 and A48. In Retisols (n = 71), A14 and A04 were positively associated with SOC, whereas A26 and A18 showed weak negative relationships. The weakest correlations were generally observed for Phaeozems (n = 41), particularly for the negative associations involving A03 and A36.
The heatmap highlights marked soil-specific variability in both the magnitude and direction of SOC–AEF correlations (Figure 4). The strongest associations were observed for Leptosols, whereas correlations were generally weaker in the other soil classes. Several embeddings, including A03, A56 and A18, changed correlation sign among soil types, indicating a strong dependence on pedological context.
Considering all embedding dimensions across soil types (not only those among the four strongest per group), A03 showed the strongest overall association with SOC, with a mean absolute Pearson correlation coefficient of 0.31. However, the direction of the relationship was not consistent: the correlation was positive in Chernozems, Cambisols, and Retisols, but negative in Fluvisols, Leptosols, Luvisols and Phaeozems. By contrast, A51 was the only embedding that maintained the same correlation direction across all soil types, showing a consistently negative association with SOC and a mean Pearson correlation coefficient of −0.18. Nevertheless, the strength of this relationship varied considerably among soil types, ranging from −0.47 in Leptosols to values close to zero in Retisols and Phaeozems.
3.2. Random Forest Performance and Bootstrap Variable Importance
3.2.1. Global Model Performance and Bootstrap Variable Importance
The global RF model, trained on the pooled dataset, achieved mean and nRMSE values of 0.51 and 0.28, respectively, across the 200 bootstrap iterations. The corresponding mean RMSE and MAE were 0.50% and 0.36%, respectively (Figure 5).
Figure 5.
Bootstrap distribution of the performance metrics of the global Random Forest model fitted using the pooled dataset: root mean square error (RMSE), mean absolute error (MAE), coefficient of determination (R2) and normalized root mean square error (nRMSE).
The most influential AEF embeddings, based on permutation importance averaged across the 200 bootstrap iterations, were A55, followed by A30, A51, and A27 (Figure 6a). These embeddings also had the lowest mean ranks across the bootstrap iterations, with A55 ranking first in nearly all iterations (Figure 6b).
Figure 6.
Bootstrap permutation variable importance of AlphaEarth Foundation embeddings in the global Random Forest model fitted using the pooled dataset. Panel (a) shows the top 20 embeddings ranked by mean permutation importance, with 95% bootstrap confidence intervals. Panel (b) shows the top 20 embeddings ranked by mean bootstrap rank.
3.2.2. Cross-Dataset Transferability and Dataset-Specific Embedding Importance
The dataset-specific RF models showed clear differences in predictive performance. Models trained separately on the French and Slovak datasets outperformed the global model, achieving mean values of 0.56 and 0.57, respectively, whereas the model developed for the Italian dataset showed lower performance than the global model (Figure 7). Considering the full set of evaluation metrics, the Slovak model provided the best overall results. However, owing to the smaller size of the Slovak dataset, performance estimates were more variable across the 200 bootstrap iterations and included a greater number of extreme values.
Figure 7.
Bootstrap distribution of dataset-specific Random Forest model performance metrics for France (FRA), Italy (ITA) and Slovakia (SVK), expressed as root mean square error percentage (RMSE %), mean absolute error percentage (MAE %), coefficient of determination (R2) and normalized root mean square error (nRMSE).
Dataset-specific permutation-importance profiles also differed markedly. A44 was the most influential embedding in the French dataset, whereas A01 and A50 ranked first in the Italian and Slovak datasets, respectively (Figure 8). Only limited overlap was observed among the highest-ranked predictors across datasets. Moreover, most embeddings showed wide cross-dataset rank ranges, indicating substantial variation in their relative contribution to SOC prediction. Although some dimensions, particularly A55, retained comparatively favorable mean ranks, no single embedding was consistently dominant across all three datasets (Figure 8). This lack of consistency was confirmed by the Spearman correlations between dataset-specific variable-importance rankings, which were close to zero ( to ). Thus, the relative importance of individual AEF embeddings was poorly conserved across datasets, highlighting the strong dependence of model interpretation on the specific environmental and sampling context represented by each dataset.
Figure 8.
Dataset-specific bootstrap permutation variable importance of AlphaEarth Foundation embeddings in Random Forest models for France (FRA), Italy (ITA) and Slovakia (SVK). Upper panels show the top 20 embeddings ranked by mean permutation importance with 95% bootstrap confidence intervals; the lower panel shows the mean importance rank of each embedding across datasets.
The leave-one-dataset-out analysis further confirmed the limited transferability of the learned relationships. Predictive performance was poor for all excluded datasets, with negative values ranging from to and nRMSE values between 0.41 and 0.49. These results are consistent with the near-zero correlations among the dataset-specific importance rankings, indicating that both the predictive relationships captured by the RF models and the relative contribution of individual embeddings were strongly dataset dependent.
3.3. EO-Based Functional Interpretation of SOC-Relevant Embeddings
3.3.1. Pooled Relationships Between Selected SOC-Relevant Embeddings and EO Covariates
Based on the pooled correlation analysis between the AEF embeddings and SOC, together with the variable-importance profiles obtained from the pooled predictive models, seven embedding dimensions—A55, A50, A30, A27, A51, A01 and A10—were selected for further interpretation. This selection included embeddings showing the strongest positive or negative associations with SOC, as well as dimensions identified as relevant predictors by the models despite weak marginal correlations. Their relationships with the vegetation, bare-soil, radar, and terrain covariates listed in Table 3 were subsequently examined to investigate the environmental information encoded by these dimensions. Because AEF dimensions are latent and potentially redundant, the EO-based analysis is intended to provide functional interpretation rather than unique physical attribution. Table 4 summarizes the correlations between the selected AEF embeddings, SOC, and the optical, radar, and terrain covariates, reporting only embedding–covariate relationships with . In addition, Table 5 reports the correlation between EO covariates and SOC content. A01 showed only a weak negative correlation with SOC () but was strongly associated with both vegetation and radar variables. Positive correlations were observed with Sentinel-2 red-edge and NIR vegetation bands, reaching for S2_VEG_B6, and with Sentinel-1 backscatter, particularly S1_VV () and S1_VH (). A10 was also weakly correlated with SOC () but showed marked relationships across several data domains. It was positively correlated with Landsat visible vegetation bands, negatively correlated with elevation (), and positively associated with S1_VV () and the VV–VH polarisation contrast, expressed as S1_VV_minus_VH () and S1_VV_div_VH (). A10 also showed predominantly negative correlations with bare-soil reflectance, with the strongest relationship observed for S2_SOIL_B8A (), although S2_SOIL_B12 showed an opposite positive correlation (). Among the embeddings more strongly associated with SOC, A55 () showed predominantly negative correlations with vegetation reflectance from the visible to the red-edge region, with the strongest relationship observed for S2_VEG_B5 (). A55 was also negatively correlated with bare-soil reflectance across several Sentinel-2 and Landsat bands, with coefficients ranging from to . A50 () exhibited a contrasting vegetation response, showing positive correlations mainly with Sentinel-2 red-edge and NIR bands, reaching for S2_VEG_B7. Conversely, A50 was negatively correlated with bare-soil reflectance, with the strongest associations observed for S2_SOIL_B7 and S2_SOIL_B8A (). Among the negatively SOC-correlated embeddings, A30 () was primarily associated with bare-soil reflectance, showing positive correlations across several Sentinel-2 and Landsat bands and reaching for S2_SOIL_B11. A27 () was instead mainly associated with vegetation SWIR reflectance, showing negative correlations with S2_VEG_B11, LS_VEG_B6, and S2_VEG_B12 ( to ). Finally, A51 showed a negligible correlation with SOC () but broad negative correlations with bare-soil reflectance, with the strongest relationship observed for S2_SOIL_B11 (). Its strongest overall association was with elevation ().
Table 4.
Strongest Pearson correlations between selected SOC-relevant AlphaEarth Foundation embeddings and EO/terrain covariates, grouped by vegetation, bare-soil, radar and terrain domains. The column r with SOC reports the correlation between each embedding and soil organic carbon content. All reported correlations are statistically significant at Benjamini–Hochberg-adjusted p < 0.05.
Table 5.
Pearson correlations between measured SOC content and selected optical, radar and terrain covariates used for EO-based interpretation of AEF embedding dimensions. * indicates Benjamini–Hochberg-adjusted p < 0.05.
The EO covariates showing the strongest relationships with SOC were the Sentinel-2 bare-soil reflectance bands in the visible, red-edge and near-infrared regions (S2_SOIL_B3, S2_SOIL_B4, S2_SOIL_B5, S2_SOIL_B6, S2_SOIL_B7, S2_SOIL_B8 and S2_SOIL_B8A) (Table 5). These covariates showed significant but weak negative correlations with SOC, ranging from −0.25 to −0.32. Sentinel-2-derived bare-soil covariates satisfied the quality-selection criteria for almost all sampling locations, with valid observations available for 1055 out of 1060 samples. These criteria required at least five cloud-free observations meeting the NDVI and NBR2 screening thresholds. Landsat-derived covariates provided fewer valid observations for the correlation analysis, with 984 out of 1060 samples available, probably reflecting the lower spatial and temporal resolution of Landsat data and the more restrictive availability of suitable bare-soil observations.
3.3.2. Dataset-Specific Relationship Between SOC-Relevant Embeddings and EO Covariates
Based on the dataset-specific correlation analysis between the AEF embeddings and SOC, together with the variable-importance profiles obtained from the dataset-specific predictive models, three embeddings were selected for further interpretation for each dataset: A01, A45, A55 for ITA; A11, A44, A51 for FRA; A10, A41, A50 for SVK dataset.
In the French dataset, A11 showed the strongest correlation with SOC () and was also associated with elevation (), Sentinel-1 VH backscatter (), slope (), and LS_VEG_B1 (). A44 was negatively correlated with SOC () and showed a predominantly vegetation-related pattern, with positive correlations with LS_VEG_NDVI (), LS_VEG_SAVI (), and LS_VEG_EVI (), and negative correlations with Landsat visible and SWIR vegetation bands ( to ). A51 was also negatively correlated with SOC (), but its associations with the examined EO covariates were weaker. Negative correlations were observed with selected vegetation and bare-soil bands, with absolute coefficients ranging from 0.23 to 0.28, and no relevant associations with radar or terrain variables were identified.
In the Italian dataset, A01 was negatively correlated with SOC () and showed positive associations mainly with Sentinel-2 red-edge and NIR vegetation reflectance, reaching for S2_VEG_B6. It was also strongly correlated with S1_VV () and with the VV–VH polarisation contrast, expressed by both S1_VV_minus_VH and S1_VV_div_VH (). A45 was also negatively associated with SOC () and showed positive correlations with S1_VV () and S1_VH (), together with negative relationships with bare-soil reflectance, particularly S2_SOIL_B11 () and S2_SOIL_B8A (). A55 was positively correlated with SOC () and displayed a predominantly vegetation-related signature. It was negatively correlated with visible and red-edge reflectance and with NDWI, with coefficients reaching for LS_VEG_B3 and for both S2_VEG_B5 and LS_VEG_NDWI, while showing a positive relationship with LS_VEG_NDVI (). No relevant associations with terrain covariates were observed for the selected Italian embeddings.
In the Slovak dataset, A50 showed the strongest correlation with SOC () and was consistently negatively correlated with Sentinel-2 and Landsat bare-soil reflectance, with coefficients ranging from to . A10 was also positively associated with SOC () and showed even stronger negative correlations with bare-soil reflectance, reaching for LS_SOIL_B5. A10 was additionally strongly negatively correlated with elevation (). A41 showed the opposite orientation, being negatively correlated with SOC () but positively associated with Landsat bare-soil reflectance (–) and elevation (). It was also correlated with vegetation covariates, particularly S2_VEG_NDWI () and S2_VEG_NDVI (), and negatively associated with the VV–VH polarisation contrast, expressed as S1_VV_minus_VH () and S1_VV_div_VH ().
4. Discussion
4.1. EO-Based Functional Interpretation of Pooled SOC-Relevant Embeddings
The relationships between the selected AEF embeddings and the EO covariates indicate that SOC-relevant information is distributed across several latent dimensions representing partly distinct soil, vegetation, radar, and topographic gradients. The clearest connection with soil optical properties was observed for A55, A50, and A30. A55 and A50 were positively associated with SOC and negatively correlated with bare-soil reflectance, indicating that higher values of these embeddings corresponded to darker and less reflective soil surfaces. A30 showed the opposite orientation in the latent space, being negatively associated with SOC and positively correlated with bare-soil reflectance. Despite these contrasting signs, the three dimensions converge on the same underlying pattern, whereby increasing SOC is associated with decreasing soil reflectance. This interpretation is supported by the direct negative correlations between measured SOC and the EO covariates reported in Table 5. SOC was negatively correlated with all selected Sentinel-2 bare-soil reflectance bands, with the strongest relationships observed in the visible and red-edge regions, including S2_SOIL_B3 (r = −0.32), S2_SOIL_B5 (r = −0.31), S2_SOIL_B4 (r = −0.30), S2_SOIL_B6 (r = −0.29), S2_SOIL_B7 (r = −0.28), S2_SOIL_B8 (r = −0.26), and S2_SOIL_B8A (r = −0.25). Landsat bare-soil bands showed the same direction, although with weaker correlations, particularly LS_SOIL_B5 (r = −0.22), LS_SOIL_B7 (r = −0.19), and LS_SOIL_B6 (r = −0.17). These direct SOC–EO relationships confirm that, in the pooled dataset, higher SOC was generally associated with lower bare-soil optical reflectance. This is consistent with the darkening effect of soil organic matter, which generally reduces soil reflectance across the visible, near-infrared, and shortwave-infrared domains [20,21]. The opposite orientation of A55 and A50 relative to A30 should therefore not be considered contradictory, because individual embedding dimensions have no predefined functional direction and may encode the same environmental gradient with reversed signs. The pairwise relationships among the embeddings reinforce this interpretation: A30 was negatively correlated with both A55 (r = −0.46, p < 0.05) and A50 (r = −0.49, p < 0.05), confirming that these dimensions encode a similar soil-brightness gradient with opposite orientations.
These embeddings may consequently contain a soil-brightness or albedo component related to the direct optical expression of SOC, while also integrating covarying effects of texture, mineralogy, surface moisture, roughness, and residue cover.
A10 also showed strong and consistently negative relationships with bare-soil reflectance, particularly in the Sentinel-2 red-edge, NIR, and SWIR regions, despite its weak marginal correlation with SOC (). Higher A10 values were associated with generally darker soil surfaces. However, because the direct relationship between A10 and SOC was limited, this reflectance gradient cannot be attributed primarily to the optical effect of SOC. This distinction is important because the direct SOC–EO correlations were moderate for bare-soil optical bands and weak for most vegetation, radar and terrain covariates. The simultaneous negative association of A10 with elevation and its strong positive relationships with VV and the VV–VH polarisation contrast suggest that it captures a broader combination of topographic, dielectric, and surface-structural conditions. Its bare-soil response may therefore reflect variation in soil moisture, texture, mineralogy, parent material, surface roughness, residue cover, or land management, several of which can reduce optical reflectance independently of SOC.
A51 showed a similar distinction between strong environmental associations and negligible SOC correlation. Although A51 was negatively correlated with several bare-soil bands, its relationship with SOC was almost null (), while its strongest association was with elevation (). The A51 reflectance pattern is therefore more likely to arise from elevation-related differences in parent material, soil development, moisture regime, climate, or land use than from variation in SOC itself. Thus, although A10 and A51 were both associated with darker bare-soil surfaces, their weak marginal relationships with SOC distinguish them from A55, A50, and A30 and indicate that soil brightness alone cannot be considered an unambiguous proxy for SOC across heterogeneous environmental contexts, because optical soil reflectance is also affected by soil texture, moisture, surface roughness, crop residues, emerging vegetation and soil type [1,22].
The vegetation relationships indicate that SOC-related information may also be encoded through multiple and partly complementary vegetation-mediated pathways. A55 was positively correlated with SOC but negatively associated with visible-to-red-edge vegetation reflectance. Higher A55 values may therefore characterize canopies with stronger pigment absorption, greater optical density, increased shadowing, higher water content, or a reduced contribution from the underlying soil. In contrast, A50 was positively related to both SOC and red-edge-to-NIR vegetation reflectance, a pattern more consistent with structural vegetation properties such as leaf area, canopy development, internal leaf scattering, and biomass or productivity [23,24,25]. These opposite optical responses are not necessarily inconsistent because A55 and A50 may represent different components of canopy functioning: A55 may be more closely linked to absorption, canopy closure, and moisture, whereas A50 may be more strongly associated with vegetation structure and vigour.
A27, which was negatively correlated with SOC, was most strongly associated with vegetation SWIR reflectance. This dimension may therefore capture variation in vegetation water status, senescence, dry biomass, crop residues, or soil-background contribution [16,26,27,28]. Its relationship with SOC may consequently reflect differences in crop type, seasonal development, residue retention, management intensity, or hydrological regime rather than a direct vegetation response to SOC.
A01 provides further evidence that strong associations with EO variables do not necessarily correspond to strong marginal relationships with SOC. Although A01 was only weakly correlated with SOC (), it showed marked positive relationships with Sentinel-2 red-edge and NIR vegetation bands and particularly strong correlations with Sentinel-1 backscatter, reaching for VV and for VH. This pattern suggests that A01 primarily captures structural and dielectric characteristics of the vegetation–surface system, including canopy architecture, biomass, surface roughness, and soil or vegetation moisture. Because A01 was positively associated with both VV and VH backscatter, its radar behaviour is better interpreted as an overall increase in microwave backscatter from the vegetation–surface system, rather than as a specific change in polarisation contrast. This interpretation is consistent with Sentinel-1 studies showing that VV and VH backscatter respond to soil moisture, surface roughness and vegetation parameters such as LAI and canopy height, while ratios such as VH/VV are generally used to describe relative polarisation effects and vegetation-structure dynamics [29,30].
A10 showed a different radar response, with positive correlations with VV and stronger relationships with the VV–VH polarisation contrast, expressed by both S1_VV_minus_VH and the corresponding S1_VV_div_VH ratio. Since these two variables are mathematically related, they represent the same underlying increase in the relative contribution of VV compared with VH rather than independent radar signals. This response may be influenced by canopy geometry, row orientation, surface roughness, soil and vegetation moisture, residue distribution, and the relative contributions of surface, double-bounce, and volume scattering [31,32]. Together with its negative relationship with elevation and its consistently negative association with bare-soil reflectance, these results support the interpretation of A10 as a broad topographic and surface-condition gradient rather than an embedding directly sensitive to SOC.
Overall, the results distinguish embeddings with relatively interpretable SOC-related gradients from dimensions whose predictive relevance is likely mediated by broader environmental structure. A55, A50, and A30 partly converge on a bare-soil brightness gradient compatible with both the optical effect of SOC and the direct negative correlations observed between SOC and bare-soil reflectance, while A55, A50, and A27 capture complementary vegetation properties related to canopy absorption, structure, productivity, water status, and phenology. Conversely, A01, A10, and A51 show only weak marginal correlations with SOC but strong relationships with vegetation, radar, bare-soil, or terrain covariates. Their contribution to pooled SOC prediction may therefore depend on multivariate interactions and on their ability to encode geographical, topographic, land-cover, and management contexts in which SOC varies, rather than on a direct monotonic response to SOC itself.
4.2. Dataset-Specific EO Interpretation of SOC-Relevant Embeddings
The selected embeddings in the French dataset appear to reflect its comparatively broad environmental heterogeneity. Among the three datasets, the French data cover wider elevation and slope ranges and greater pedological and climatic variability [33]. This likely contributed to the strong associations of A11 with elevation, slope, VH backscatter, and SOC. A11 may therefore represent an integrated soil–landscape gradient in which topography covaries with climate, drainage, soil type, vegetation, and management, rather than a direct response to SOC.
A44 showed associations consistent with a vegetation-related signature, with positive relationships with vegetation indices and negative correlations with visible and SWIR reflectance. Its negative association with SOC likely reflects differences in crops, phenology, water availability, and management across the diverse French environments, rather than a negative effect of SOC on vegetation vigour. A51 was also negatively correlated with SOC but only weakly related to the examined EO covariates, suggesting that it captures broader environmental context or multivariate interactions not represented by individual variables. Overall, the French embeddings appeared to reflect the broader environmental and topographic heterogeneity of the dataset, with SOC-relevant signals largely embedded within landscape-scale gradients rather than expressed as a distinct optical response.
The Italian results point to a stronger influence of vegetation structure, radar response, and surface conditions than of topography, consistent with the relatively homogeneous lowland setting of the dataset. A01 was associated with a combined vegetation–radar gradient, with higher red-edge–NIR reflectance, stronger VV backscatter, and greater VV relative to VH. Because radar backscatter is strongly affected by surface moisture, roughness, vegetation structure, and crop geometry, these associations should not be interpreted as direct radar sensitivity to SOC. Given that A01 was negatively correlated with SOC, the observed pattern more likely reflects crop, surface, and management conditions that covary with SOC. This is consistent with the management diversity of the regions included in the Italian dataset, which included conventional, regenerative, and organic systems [34].
A45 also reflected structural and dielectric surface properties through positive relationships with VV and VH and negative relationships with bare-soil reflectance. Since it was negatively correlated with both SOC and soil reflectance, its pattern was opposite to the expected SOC-related darkening effect. The radar component may instead reflect differences in surface moisture, roughness, vegetation or residue cover, and other soil or management properties that covary with SOC, rather than tracking it directly.
A55 showed the clearest pattern compatible with a vegetation-mediated relationship with SOC. Higher A55 values were associated with greater NDVI and lower visible-to-red-edge reflectance, consistent with greener or denser canopies. Its negative relationship with NDWI, however, suggests that it integrates not only biomass but also phenology, crop type, canopy water status, and soil-background effects [35]. Overall, the Italian embeddings mainly captured agricultural and surface-management variability associated with SOC rather than a unique direct response to SOC.
The Slovak dataset showed the clearest pattern consistent with a bare-soil optical signature associated with SOC. Although A10 and A50 were positively correlated with SOC and A41 was negatively correlated with it, all three embeddings converged on the same pattern: higher SOC was associated with lower bare-soil reflectance.
This particularly strong soil-darkness gradient is consistent with the generally higher SOC levels of the Slovak dataset and may also reflect its distinctive pedological composition, which included Chernozems and Phaeozems, typically characterized by dark, organic-matter-rich surface horizons, as well as Leptosols. However, given the relatively small number of observations available for some soil groups, particularly Chernozems, these soil-type-specific interpretations should be regarded as exploratory. The strong and spectrally consistent relationships of A10 and A50 with bare-soil bands therefore support a broader sensitivity of these dimensions to soil brightness and potentially organic matter, while texture, mineralogy, moisture, and other surface conditions may also contribute to the observed relationships.
The elevation relationships of A10 and A41 further suggest that SOC variability was partly structured along a soil–landscape gradient. Both embeddings indicate that higher SOC occurred toward lower-elevation positions, whereas higher and in some cases gently sloping areas were associated with lower SOC and brighter soils. This may reflect the distribution of contrasting soil groups, although the limited number of observations within each group prevented a robust soil-specific analysis. The vegetation and radar relationships of A41 likely represent additional differences in crop development, phenology, surface moisture, roughness, residue cover, crop geometry, or management across these soil–landscape settings, more than a direct SOC signal. Overall, the Slovak embeddings appear to encode a stronger direct bare-soil optical component than those identified in the French and Italian datasets, together with a secondary topographic and pedological context.
4.3. Context-Dependent Encoding of SOC Information in AEF Embeddings
Comparison of the pooled and dataset-specific analyses revealed only partial overlap among the SOC-relevant embeddings. These results indicate that the main value of the AEF representation in this study lies in its domain-specific SOC relevance and interpretability, rather than in geographically transferable predictive performance. At the pooled level, the selected dimensions captured both relationships occurring within individual datasets and broader differences among countries in SOC distribution, pedoclimatic conditions, topography, vegetation and management. The pooled model should therefore be interpreted primarily as a descriptive model of shared and between-domain SOC–embedding structure, rather than as evidence of geographical transferability. Its pooled predictive performance (R2 = 0.51; nRMSE = 0.28) was also comparable to previous AEF-based SOC models, which achieved R2 values of 0.46, 0.56 and 0.30 for independent datasets from Italy, France and Taiwan, respectively [5], and falls within the range of performances commonly reported for satellite-based SOC modelling [1].
In contrast, the dataset-specific models identified the dimensions that were most informative within the environmental range represented by each dataset. The French embeddings mainly reflected pedoclimatic, topographic and vegetation gradients; the Italian embeddings emphasized vegetation structure, radar response and management-related surface conditions; and the Slovak embeddings showed a particularly clear bare-soil reflectance gradient associated with SOC. The relatively high within-dataset performance observed for Slovakia should nevertheless be interpreted with caution. The Slovak dataset comprised 138 samples distributed across four farms, and the standard out-of-bag Random Forest assessment may therefore include neighbouring or farm-related observations in both the training and testing subsets. For this reason, the Slovak result should not be interpreted as evidence of farm-independent or spatially independent transferability, but rather as within-dataset predictive performance under the same validation framework applied to all three countries.
This context dependence was further supported by the poor performance of the leave-one-dataset-out models, which produced negative values for all three excluded datasets. Relationships learned from two datasets therefore did not adequately transfer to the third, indicating that the SOC information encoded by AEF did not generalise across datasets, consistent with the broader environmental and management differences that characterise the three study areas. Importantly, this poor transferability is unlikely to be explained by inconsistencies in the soil observations. The three datasets followed a harmonised field protocol, targeted the same 0–20 cm topsoil depth, used the same laboratory method for SOC determination, and were based on composite samples with a spatial support comparable to the AEF pixel. The failure of models trained on two countries to predict the third is therefore consistent with genuine domain dependence of SOC–AEF relationships, rather than being readily explained by differences in sampling depth, analytical procedures, spatial support or farming management. This interpretation agrees with previous SOC spectroscopy and remote-sensing studies reporting that local or context-specific calibration strategies can outperform global models when soil, environmental and management conditions are highly heterogeneous [21,36,37]. This is also in line with recent evidence from other EO applications showing that AEF embeddings do not necessarily outperform simpler, locally calibrated predictors, and that their added value should be assessed against task-specific and context-specific modelling strategies [38]. More broadly, recent AlphaEarth interpretability work has shown that embedding dimensions can encode physically coherent land-surface information, but that dimension assignments and correlation strengths may shift across regions where different environmental processes dominate [11].
The lack of a common set of embeddings should consequently not be interpreted as inconsistency. Because AEF dimensions are latent and partly redundant, similar EO or environmental gradients may be represented by different dimensions in different contexts, while variable importance may be redistributed among correlated embeddings. Conversely, dimensions emerging only in the pooled analysis may represent weak but recurrent relationships that become detectable in the larger combined sample, or contrasts among datasets rather than transferable within-dataset SOC relationships. Taken together, these results suggest that SOC-related information is distributed across context-dependent combinations of soil, vegetation, radar, topographic and management signals, with no single dimension carrying a fixed or universal meaning.
An additional avenue for future work would be to assess farm-level and spatial-block transferability of AEF–SOC relationships. Such analyses were not implemented consistently across all datasets because harmonised field, farm, or spatial-block identifiers were not available for all countries. Future studies based on datasets with more consistent spatial identifiers could therefore further investigate the robustness of these relationships across spatial units.
5. Conclusions
This study showed that AEF embeddings contain SOC-relevant information across contrasting European agricultural datasets, but that their predictive relevance and functional interpretation are distributed across multiple latent dimensions and strongly context-dependent. Dataset-specific models successfully exploited the relationships present within each dataset. However, their reported performance should be interpreted as internal OOB/resampling performance rather than spatially independent validation and may be optimistic where neighboring or farm-related observation occur within the same dataset. In contrast, the poor performance of the leave-one-dataset-out models demonstrated that these relationships did not readily transfer to unseen regions. The limited overlap among the embeddings selected for France, Italy, and Slovakia reflects a genuine domain-specific structure rather than a lack of coherence in the AEF representation, arising instead from differences in pedology, climate, topography, vegetation, and agricultural management, as well as the partly redundant nature of the embedding space, in which similar environmental processes may be represented by different dimensions. Pooled models may capture both within-dataset SOC variation and broader contrasts among datasets; consequently, their application to new areas requires that the calibration data adequately represent the pedoclimatic and management conditions of the target domain.
The comparison with interpretable EO covariates provided a partial functional understanding of the information encoded by the embeddings. Some dimensions, particularly A55, A50, and A30, converged on a bare-soil brightness gradient consistent with the lower optical reflectance generally associated with higher SOC. Other embeddings reflected vegetation absorption, canopy structure, productivity, water status, radar backscatter, surface roughness, or topographic context. These relationships indicate that AEF embeddings encode SOC through both relatively direct soil optical responses and indirect soil–vegetation–landscape interactions. However, no single dimension’s relevance is fixed: each depends on the specific soil, vegetation, radar and topographic context in which it operates, arguing against treating AEF as a one-size-fits-all SOC predictor. Embeddings with weak marginal correlations with SOC could still contribute through nonlinear relationships, interactions, or their ability to identify environmental and management contexts in which SOC varies. AEF embeddings should be regarded as flexible representations of soil–landscape conditions requiring context-specific calibration. Their operational use for SOC mapping should rely on representative local or regional calibration data, geographically independent validation, explicit assessment of the model applicability domain, and prediction uncertainty. More broadly, the analytical framework adopted here, combining correlation screening, model-based importance and EO-based functional interpretation, is not specific to SOC and could be extended to other soil or environmental properties; the present study provides a first demonstration of its application to a variable of direct relevance to EU soil policy. Future work should evaluate whether larger harmonized datasets, explicit management information, and domain-adaptation approaches can improve both the transferability and functional interpretability of AEF-based SOC models.
Author Contributions
Conceptualization, F.C.; methodology, F.C.; validation, F.C.; formal analysis, F.C. and P.T.; data curation, F.C. and P.T.; writing—original draft preparation, F.C. and P.T.; writing—review and editing, F.C. and P.T.; visualization, F.C. All authors have read and agreed to the published version of the manuscript.
Funding
This study was partially supported by the SOC research project DBA. AD001.503 funded by Barilla G. e R. Fratelli S.p.A., the Ministry of Agriculture and the National Research Council of Italy (grant No. 0091275/2022).
Data Availability Statement
Restrictions apply to the availability of soil data used in this study. The SOCRATE soil dataset was obtained from Barilla G. e R. Fratelli S.p.A. and the authors do not have permission to share data.
Acknowledgments
The authors gratefully acknowledge Barilla for making the SOCRATE soil dataset available for this research.
Conflicts of Interest
Barilla G. e R. Fratelli S.p.A provided funding and access to the SOCRATE soil datasets, but had no role in the design of the study; analysis or interpretation of data; in the writing of the manuscript; or in the decision to publish the results.
References
- Vaudour, E.; Gholizadeh, A.; Castaldi, F.; Saberioon, M.; Borůvka, L.; Urbina-Salazar, D.; Fouad, Y.; Arrouays, D.; Richer-De-Forges, A.C.; Biney, J.; et al. Satellite Imagery to Map Topsoil Organic Carbon Content over Cultivated Areas: An Overview. Remote Sens. 2022, 14, 2917. [Google Scholar] [CrossRef] [Scilit]
- Hu, Y.; Cross, A.; Shen, Z.; Bouma, J.; Viscarra Rossel, R.A. On Soil Health and the Pivotal Role of Sensing. SOIL 2026, 12, 227–252. [Google Scholar] [CrossRef] [Scilit]
- Mzid, N.; Pignatti, S.; Huang, W.; Casa, R. An Analysis of Bare Soil Occurrence in Arable Croplands for Remote Sensing Topsoil Applications. Remote Sens. 2021, 13, 474. [Google Scholar] [CrossRef] [Scilit]
- Dvorakova, K.; Heiden, U.; Pepers, K.; Staats, G.; van Os, G.; van Wesemael, B. Improving Soil Organic Carbon Predictions from a Sentinel–2 Soil Composite by Assessing Surface Conditions and Uncertainties. Geoderma 2023, 429, 116128. [Google Scholar] [CrossRef] [Scilit]
- Castaldi, F.; Syu, C.H.; Valdez, M.C.; Yen, C.C.; Chen, C.F.; Bertinaria, F.; Toscano, P. Monitoring Soil Organic Carbon from Earth Observation in the Era of Cover Cropping and No-Tillage. Smart Agric. Technol. 2026, 13, 101935. [Google Scholar] [CrossRef] [Scilit]
- Brown, C.F.; Kazmierski, M.R.; Pasquarella, V.J.; Rucklidge, W.J.; Samsikova, M.; Zhang, C.; Shelhamer, E.; Lahera, E.; Wiles, O.; Ilyushchenko, S.; et al. AlphaEarth Foundations: An Embedding Field Model for Accurate and Efficient Global Mapping from Sparse Label Data. arXiv 2025, arXiv:2507.22291. [Google Scholar] [CrossRef] [Scilit]
- Ma, Y.; Shen, Y.; Swatantran, A.; Lobell, D.B. Harvesting AlphaEarth: Benchmarking the Geospatial Foundation Model for Agricultural Downstream Tasks. Int. J. Appl. Earth Obs. Geoinf. 2026, 149, 105258. [Google Scholar] [CrossRef] [Scilit]
- Ben-Dor, E.; Chabrillat, S.; Demattê, J.A.M.; Taylor, G.R.; Hill, J.; Whiting, M.L.; Sommer, S. Using Imaging Spectroscopy to Study Soil Properties. Remote Sens. Environ. 2009, 113, S38–S55. [Google Scholar] [CrossRef] [Scilit]
- van Wesemael, B.; Abdelbaki, A.; Ben-Dor, E.; Chabrillat, S.; d’Angelo, P.; Demattê, J.A.M.; Genova, G.; Gholizadeh, A.; Heiden, U.; Karlshoefer, P.; et al. A European Soil Organic Carbon Monitoring System Leveraging Sentinel 2 Imagery and the LUCAS Soil Data Base. Geoderma 2024, 452, 117113. [Google Scholar] [CrossRef] [Scilit]
- Urbina-Salazar, D.; Vaudour, E.; Richer-de-Forges, A.C.; Chen, S.; Martelet, G.; Baghdadi, N.; Arrouays, D. Sentinel-2 and Sentinel-1 Bare Soil Temporal Mosaics of 6-Year Periods for Soil Organic Carbon Content Mapping in Central France. Remote Sens. 2023, 15, 2410. [Google Scholar] [CrossRef] [Scilit]
- Rahman, M. Physically Interpretable AlphaEarth Foundation Model Embeddings Enable LLM-Based Land Surface Intelligence. Remote Sens. Appl. 2026, 42, 102045. [Google Scholar] [CrossRef] [Scilit]
- Benavides-Martinez, I.F.; Guthrie, J.; Arias, J.E.; Garces-Gomez, Y.A.; Guzman-Alvis, A.I.; Portilla-Cabrera, C.V.; Mondal, S.; Allyn, A.J.; Ganguly, A.R. What on Earth Is AlphaEarth? Hierarchical Structure and Functional Interpretability for Global Land Cover. arXiv 2026, arXiv:2603.16911. [Google Scholar] [CrossRef] [Scilit]
- Aybar, C.; Wu, Q.; Bautista, L.; Yali, R.; Barja, A. Rgee: An R Package for Interacting with Google Earth Engine. J. Open Source Softw. 2020, 5, 2272. [Google Scholar] [CrossRef] [Scilit]
- Castaldi, F.; Halil Koparan, M.; Wetterlind, J.; Žydelis, R.; Vinci, I.; Özge Savaş, A.; Kıvrak, C.; Tunçay, T.; Volungevičius, J.; Obber, S.; et al. Assessing the Capability of Sentinel-2 Time-Series to Estimate Soil Organic Carbon and Clay Content at Local Scale in Croplands. ISPRS J. Photogramm. Remote Sens. 2023, 199, 40–60. [Google Scholar] [CrossRef] [Scilit]
- Rouse, J.W., Jr.; Haas, R.H.; Schell, J.A.; Deering, D.W. Monitoring Vegetation Systems in the Great Plains with ERTS. In Goddard Space Flight Center 3d ERTS-1 Symposium; Section A; NASA: Washington, DC, USA, 1974; Volume 1. [Google Scholar]
- Castaldi, F.; Chabrillat, S.; Don, A.; van Wesemael, B. Soil Organic Carbon Mapping Using LUCAS Topsoil Database and Sentinel-2 Data: An Approach to Reduce Soil Moisture and Crop Residue Effects. Remote Sens. 2019, 11, 2121. [Google Scholar] [CrossRef] [Scilit]
- Huete, A.; Didan, K.; Miura, T.; Rodriguez, E.P.; Gao, X.; Ferreira, L.G. Overview of the Radiometric and Biophysical Performance of the MODIS Vegetation Indices. Remote Sens. Environ. 2002, 83, 195–213. [Google Scholar] [CrossRef] [Scilit]
- Huete, A.R. A Soil-Adjusted Vegetation Index (SAVI). Remote Sens. Environ. 1988, 25, 295–309. [Google Scholar] [CrossRef] [Scilit]
- McFeeters, S.K. The Use of the Normalized Difference Water Index (NDWI) in the Delineation of Open Water Features. Int. J. Remote Sens. 1996, 17, 1425–1432. [Google Scholar] [CrossRef] [Scilit]
- Viscarra Rossel, R.A.; Walvoort, D.J.J.; McBratney, A.B.; Janik, L.J.; Skjemstad, J.O. Visible, near Infrared, Mid Infrared or Combined Diffuse Reflectance Spectroscopy for Simultaneous Assessment of Various Soil Properties. Geoderma 2006, 131, 59–75. [Google Scholar] [CrossRef] [Scilit]
- Ward, K.J.; Chabrillat, S.; Brell, M.; Castaldi, F.; Spengler, D.; Foerster, S. Mapping Soil Organic Carbon for Airborne and Simulated Enmap Imagery Using the Lucas Soil Database and a Local Plsr. Remote Sens. 2020, 12, 3451. [Google Scholar] [CrossRef] [Scilit]
- Wetterlind, J.; Simmler, M.; Castaldi, F.; Borůvka, L.; Gabriel, J.L.; Gomes, L.C.; Khosravi, V.; Kıvrak, C.; Koparan, M.H.; Lázaro-López, A.; et al. Influence of Soil Texture on the Estimation of Soil Organic Carbon from Sentinel-2 Temporal Mosaics at 34 European Sites. Eur. J. Soil Sci. 2025, 76, e70054. [Google Scholar] [CrossRef] [Scilit]
- Badgley, G.; Field, C.B.; Berry, J.A. Canopy Near-Infrared Reflectance and Terrestrial Photosynthesis. Sci. Adv. 2017, 3, e1602244. [Google Scholar] [CrossRef] [Scilit] [PubMed]
- Gitelson, A.A.; Vina, A.; Arkebauer, T.J.; Rundquist, D.C.; Keydan, G.; Leavitt, B. Remote Estimation of Leaf Area Index and Green Leaf Biomass in Maize Canopies. Geophys. Res. Lett. 2003, 30, 2002GL016450. [Google Scholar] [CrossRef] [Scilit]
- Castaldi, F.; Casa, R.; Pelosi, F.; Yang, H. Influence of Acquisition Time and Resolution on Wheat Yield Estimation at the Field Scale from Canopy Biophysical Variables Retrieved from SPOT Satellite Data. Int. J. Remote Sens. 2015, 36, 2438–2459. [Google Scholar] [CrossRef] [Scilit]
- Jacquemoud, S.; Baret, F. PROSPECT: A Model of Leaf Optical Properties Spectra. Remote Sens. Environ. 1990, 34, 75–91. [Google Scholar] [CrossRef] [Scilit]
- Demattê, J.A.M.; Fongaro, C.T.; Rizzo, R.; Safanelli, J.L. Geospatial Soil Sensing System (GEOS3): A Powerful Data Mining Procedure to Retrieve Soil Spectral Reflectance from Satellite Images. Remote Sens. Environ. 2018, 212, 161–175. [Google Scholar] [CrossRef] [Scilit]
- Daughtry, C.S.T.; Hunt, E.R.; McMurtrey, J.E. Assessing Crop Residue Cover Using Shortwave Infrared Reflectance. Remote Sens. Environ. 2004, 90, 126–134. [Google Scholar] [CrossRef] [Scilit]
- Bousbih, S.; Zribi, M.; Lili-Chabaane, Z.; Baghdadi, N.; El Hajj, M.; Gao, Q.; Mougenot, B. Potential of Sentinel-1 Radar Data for the Assessment of Soil and Cereal Cover Parameters. Sensors 2017, 17, 2617. [Google Scholar] [CrossRef] [Scilit] [PubMed]
- Vreugdenhil, M.; Wagner, W.; Bauer-Marschallinger, B.; Pfeil, I.; Teubner, I.; Rüdiger, C.; Strauss, P. Sensitivity of Sentinel-1 Backscatter to Vegetation Dynamics: An Austrian Case Study. Remote Sens. 2018, 10, 1396. [Google Scholar] [CrossRef] [Scilit]
- Meyer, R.; Zhang, W.; Kragh, S.J.; Andreasen, M.; Jensen, K.H.; Fensholt, R.; Stisen, S.; Looms, M.C. Exploring the Combined Use of SMAP and Sentinel-1 Data for Downscaling Soil Moisture beyond the 1 Km Scale. Hydrol. Earth Syst. Sci. 2022, 26, 3337–3357. [Google Scholar] [CrossRef] [Scilit]
- Susan Moran, M.; Hymer, D.C.; Qi, J.; Sano, E.E. Soil Moisture Evaluation Using Multi-Temporal Synthetic Aperture Radar (SAR) in Semiarid Rangeland. Agric. For. Meteorol. 2000, 105, 69–80. [Google Scholar] [CrossRef] [Scilit]
- Castaldi, F.; Bertinaria, F.; Toscano, P. Conservation Agriculture Enhances Soil Organic Carbon: A 5-Year Assessment Using Sentinel-2 and Machine Learning. Soil Use Manag. 2026, 42, e70226. [Google Scholar] [CrossRef] [Scilit]
- Castaldi, F.; Buttafuoco, G.; Bertinaria, F.; Toscano, P. A Geospatial Approach for Evaluating Impact and Potentiality of Conservation Farming for Soil Health Improvement at Regional and Farm Scale. Soil Tillage Res. 2024, 244, 106212. [Google Scholar] [CrossRef] [Scilit]
- Gao, B.C. NDWI—A Normalized Difference Water Index for Remote Sensing of Vegetation Liquid Water from Space. Remote Sens. Environ. 1996, 58, 257–266. [Google Scholar] [CrossRef] [Scilit]
- Tziolas, N.; Tsakiridis, N.; Ben-Dor, E.; Theocharis, J.; Zalidis, G. Employing a Multi-Input Deep Convolutional Neural Network to Derive Soil Clay Content from a Synergy of Multi-Temporal Optical and Radar Imagery Data. Remote Sens. 2020, 12, 1389. [Google Scholar] [CrossRef] [Scilit]
- Viscarra Rossel, R.A.; Shen, Z.; Ramirez Lopez, L.; Behrens, T.; Shi, Z.; Wetterlind, J.; Sudduth, K.A.; Stenberg, B.; Guerrero, C.; Gholizadeh, A.; et al. An Imperative for Soil Spectroscopic Modelling Is to Think Global but Fit Local with Transfer Learning. Earth Sci. Rev. 2024, 254, 104797. [Google Scholar] [CrossRef] [Scilit]
- Rojas-Lucero, J.C.; Solano-Correa, Y.T.; Kolarik, N.E.; Brandt, J.S.; Caughlin, T. Spectral Indices Outperform AlphaEarth Foundation Embeddings for Aboveground Biomass Estimation in a Regenerating Tropical Andean Forest. Remote Sens. Appl. 2026, 42, 102113. [Google Scholar] [CrossRef] [Scilit]
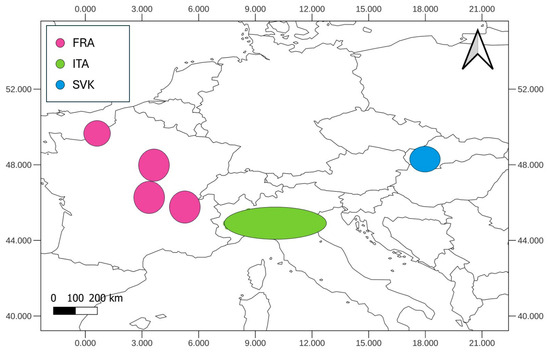
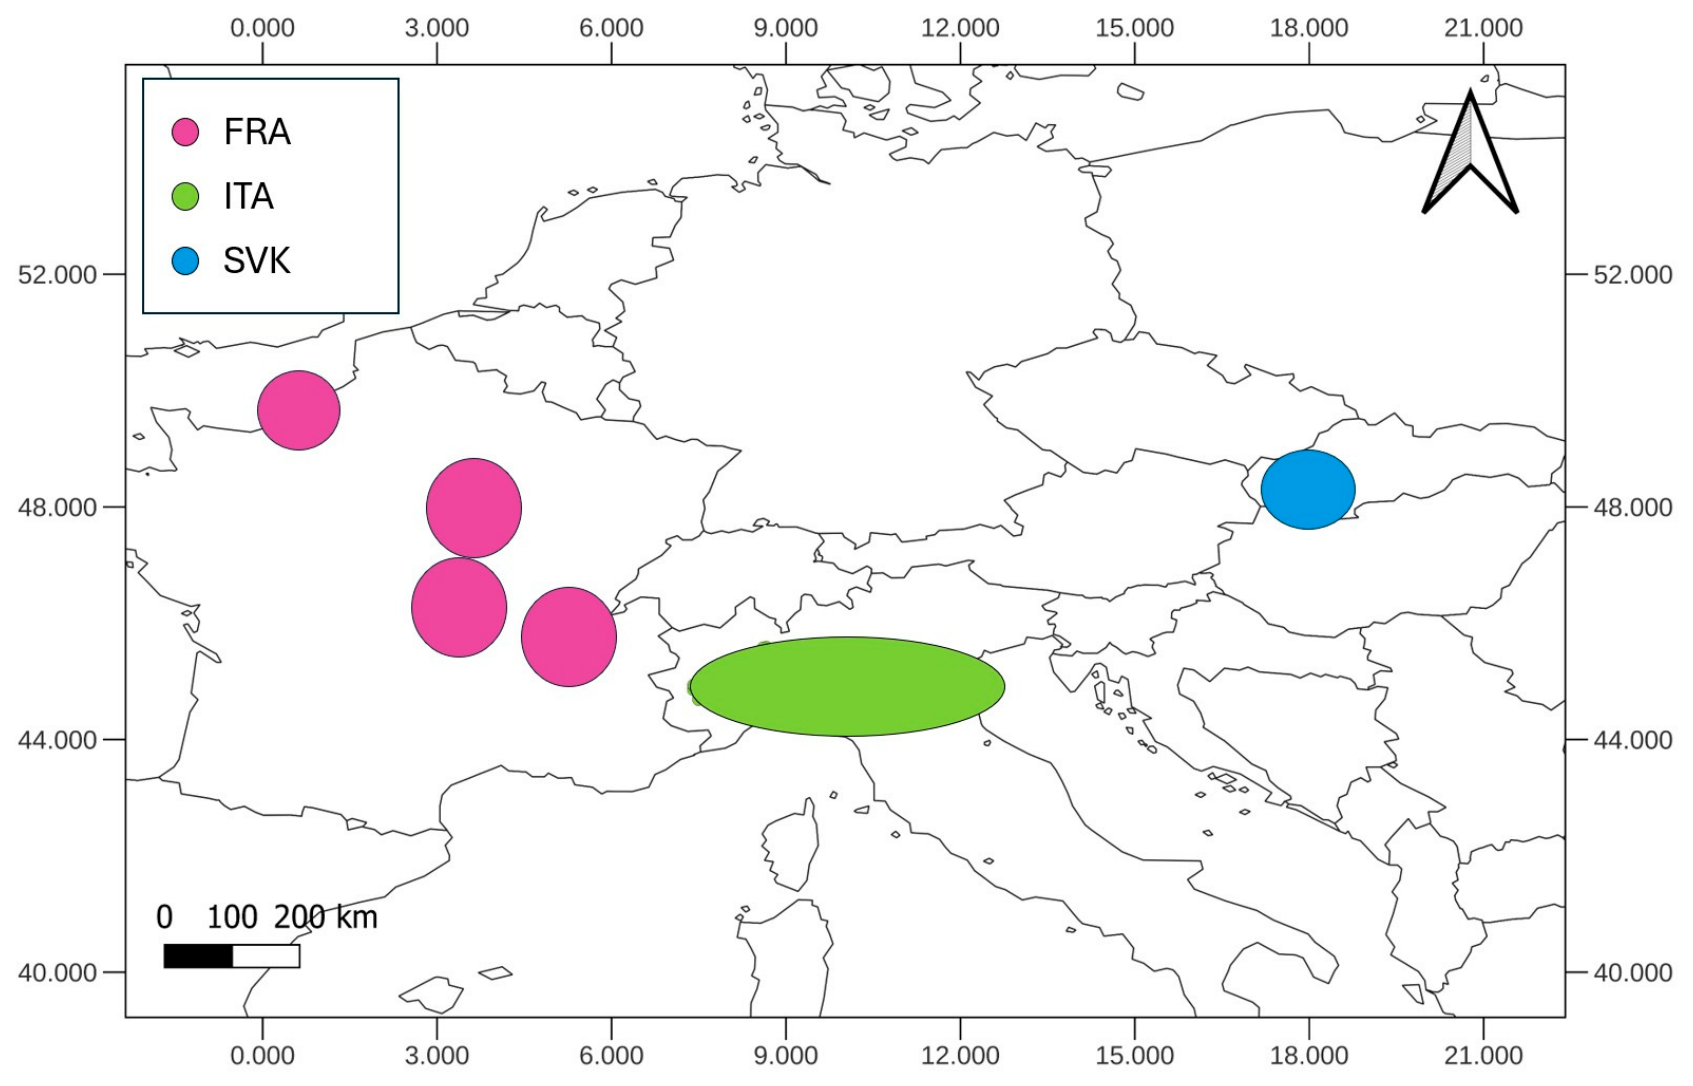
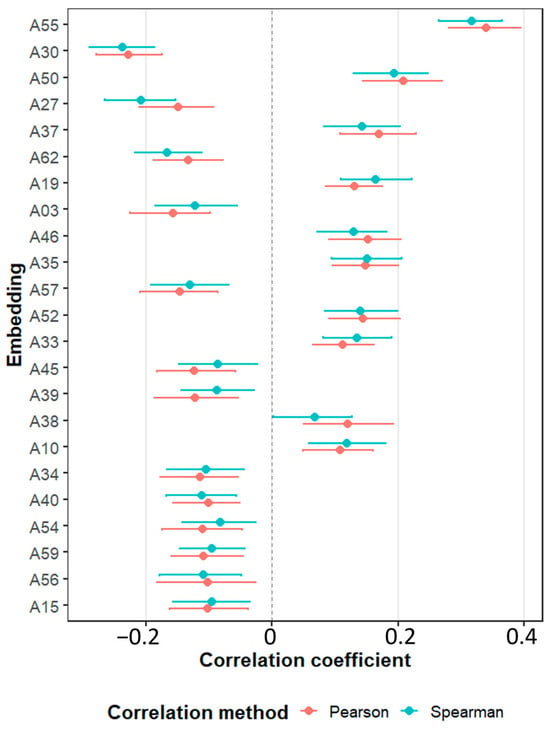
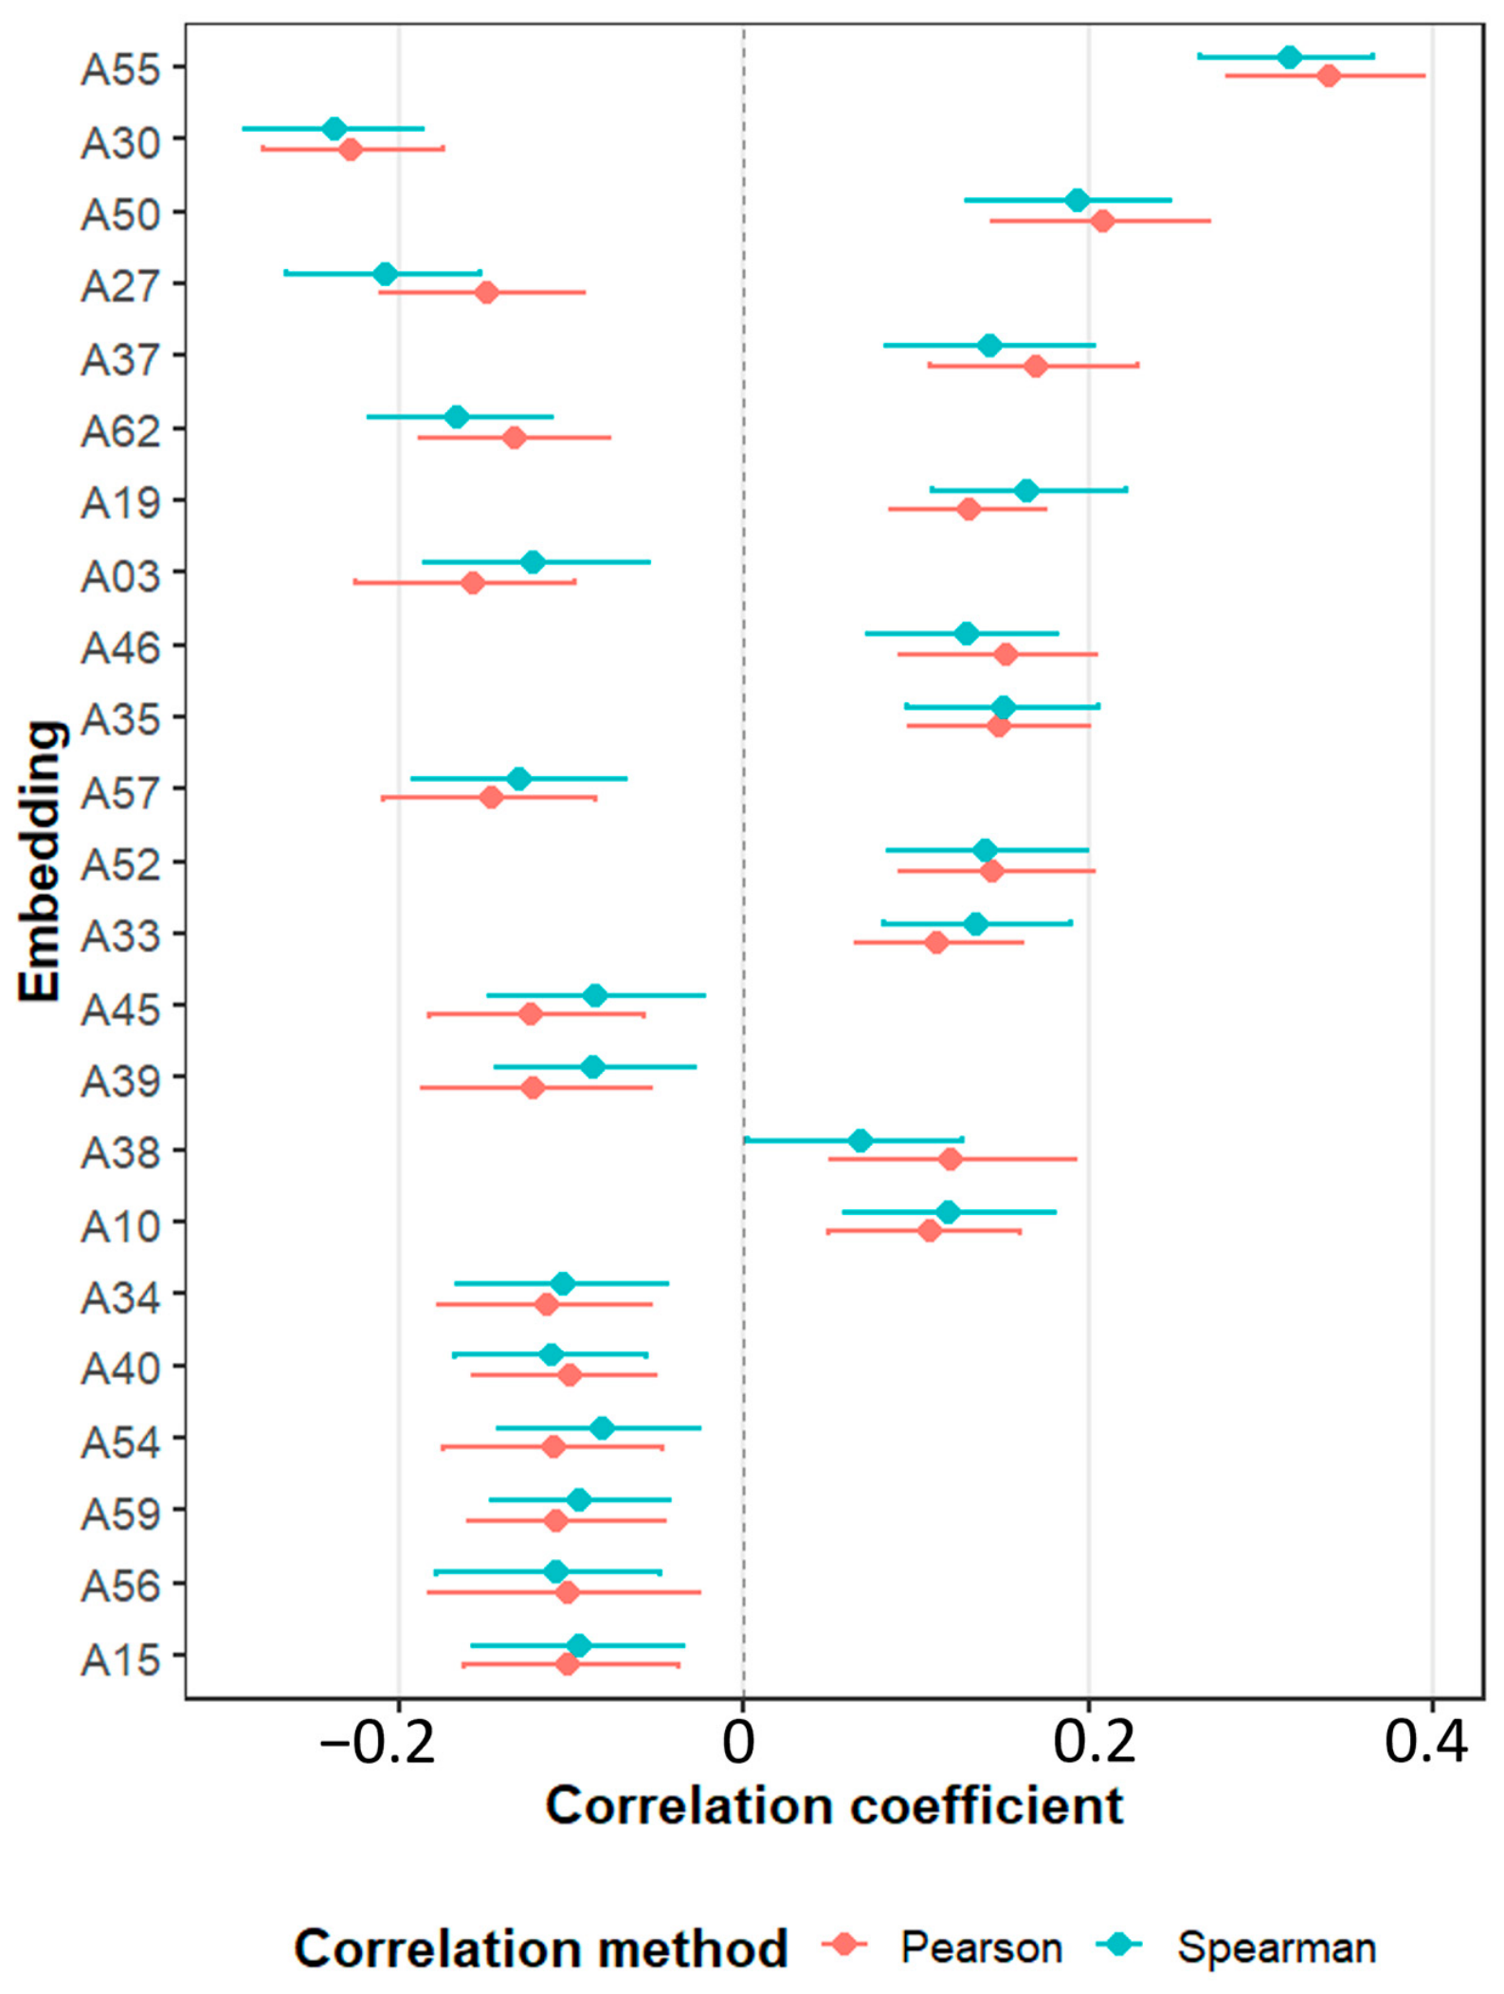
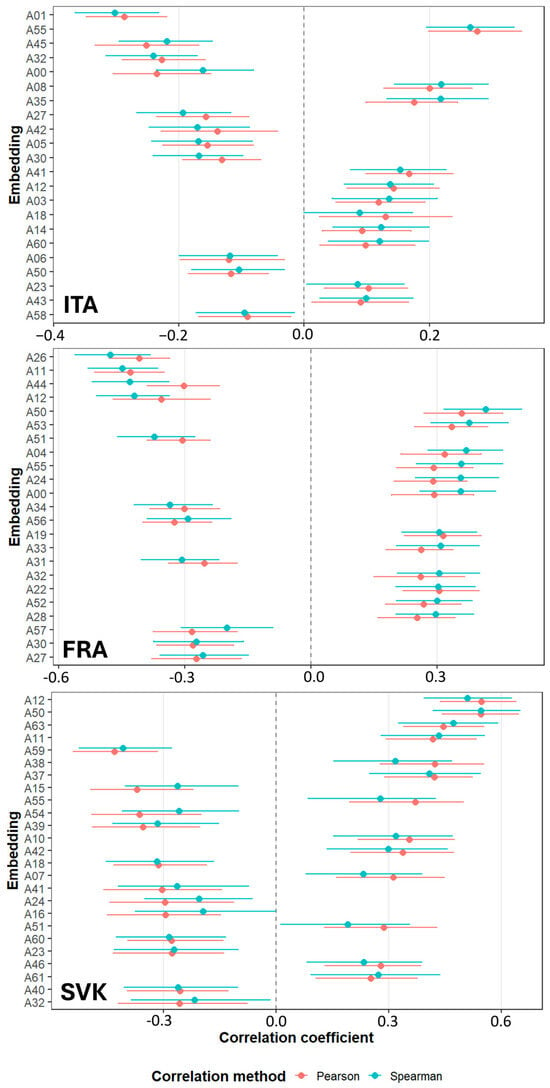
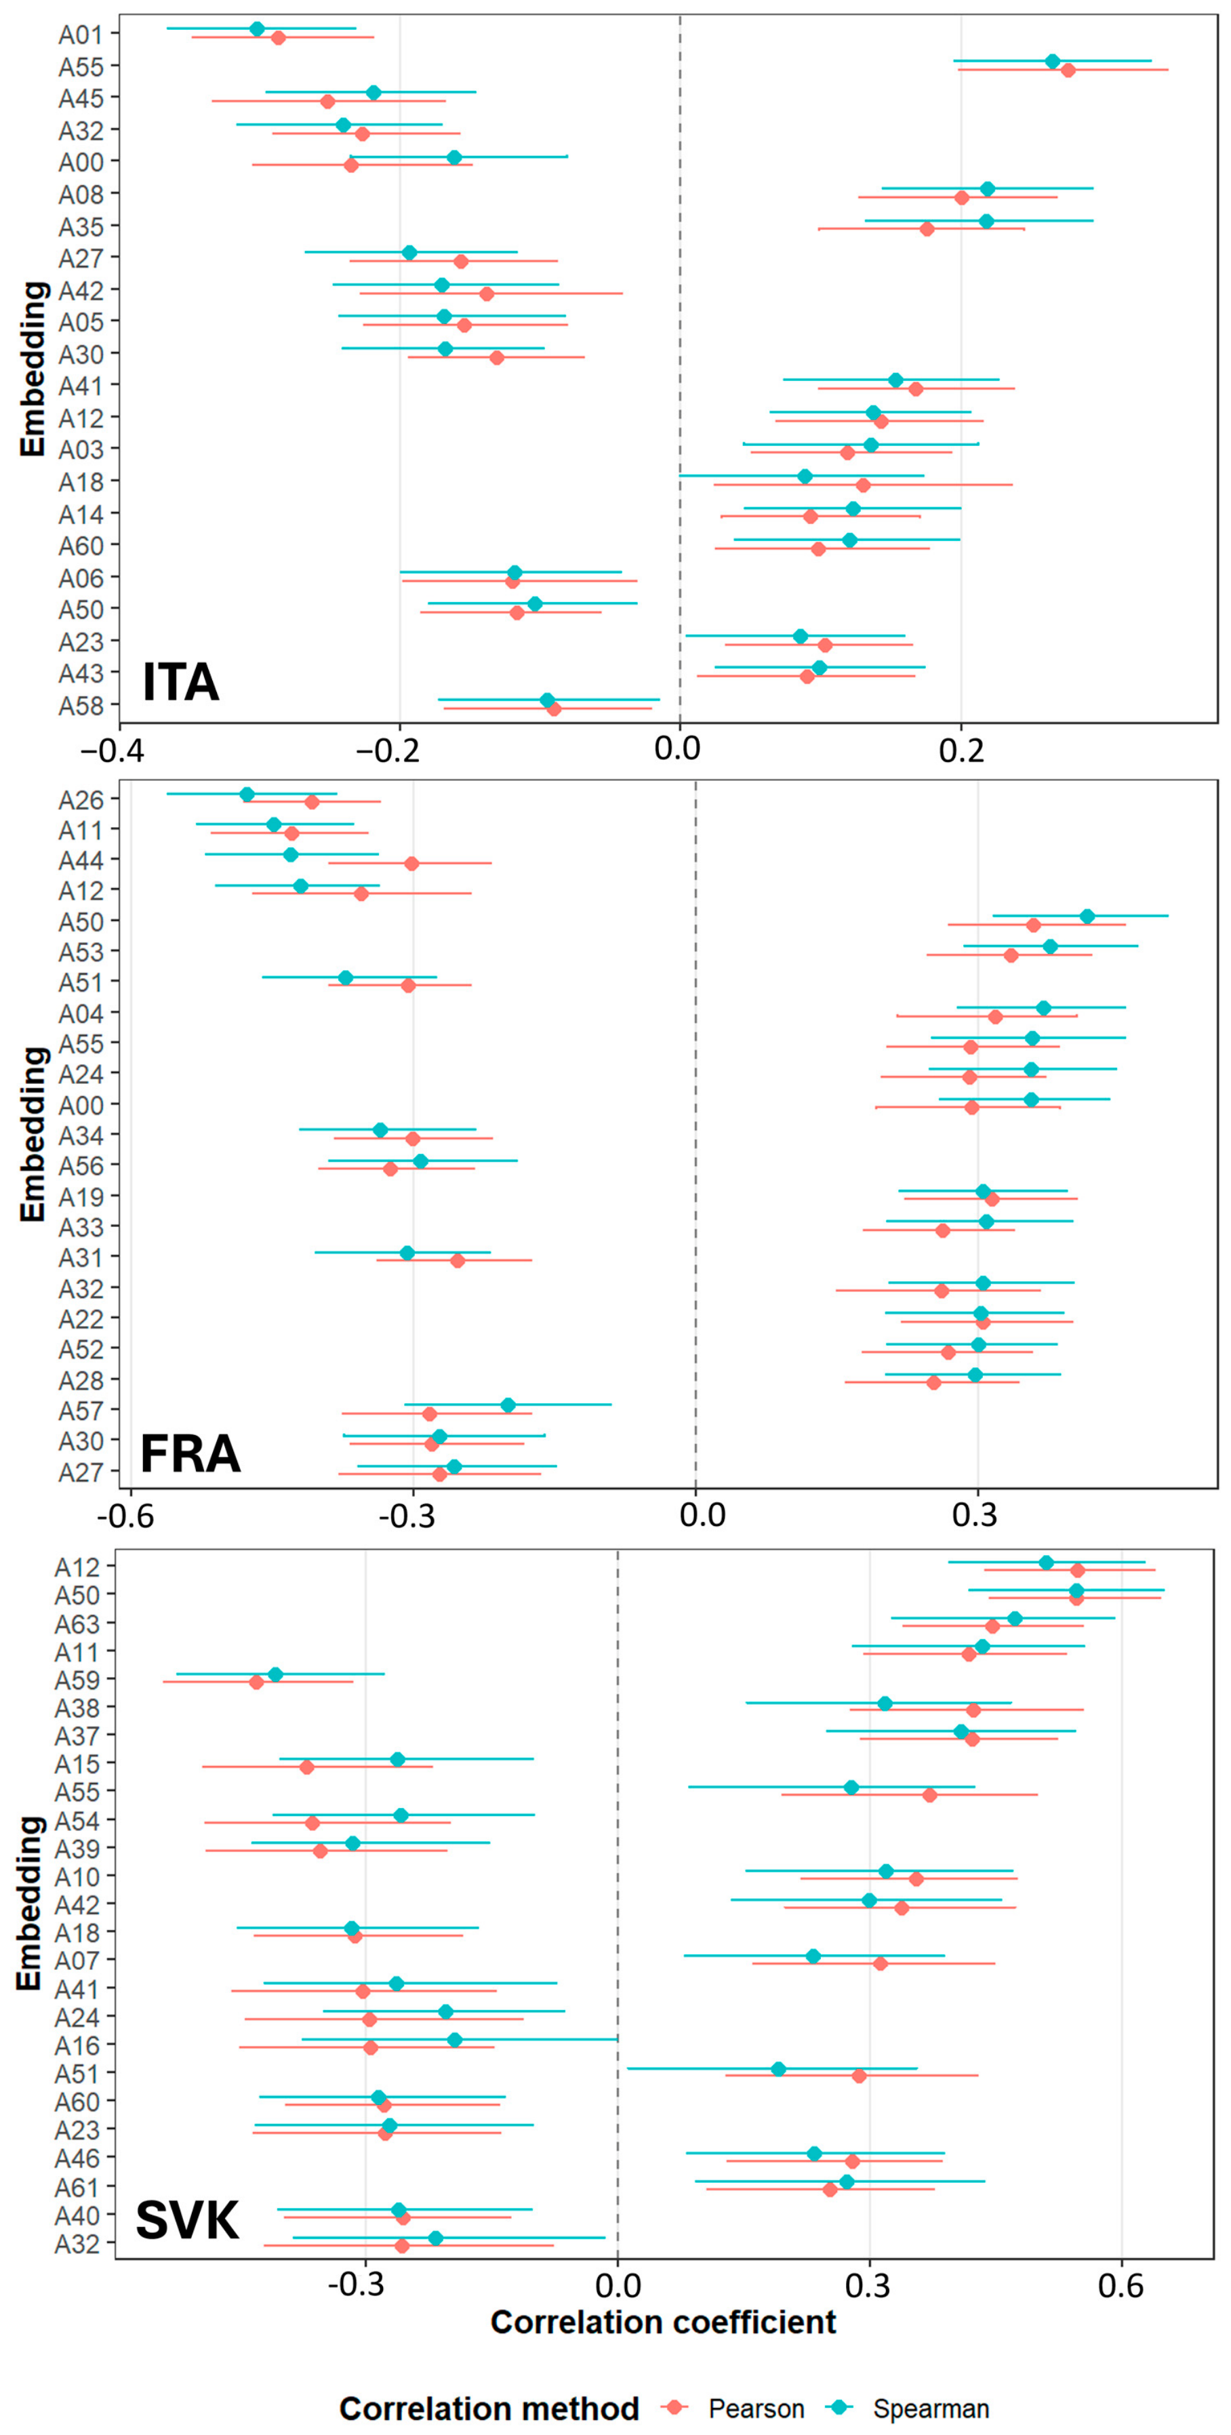
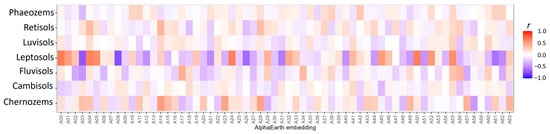
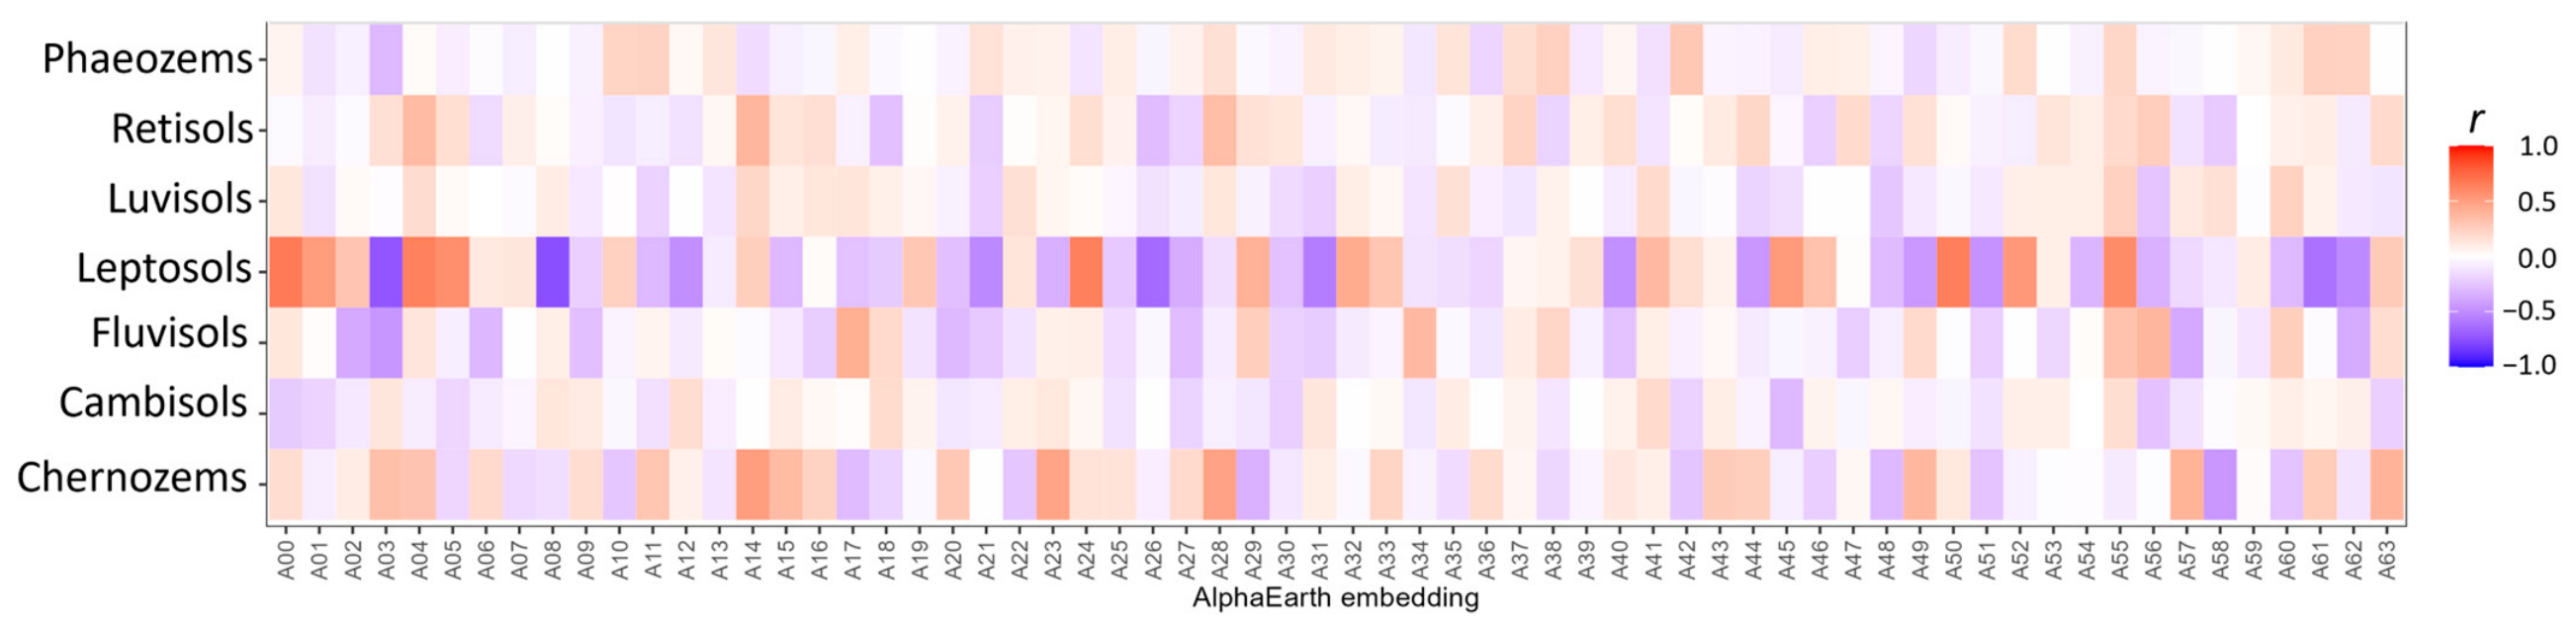
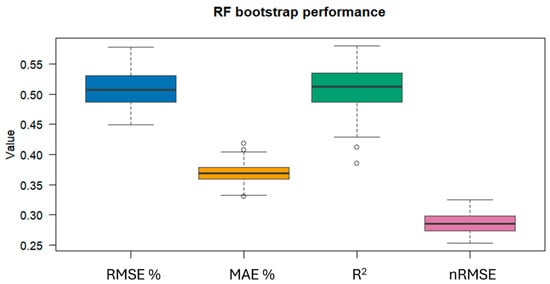
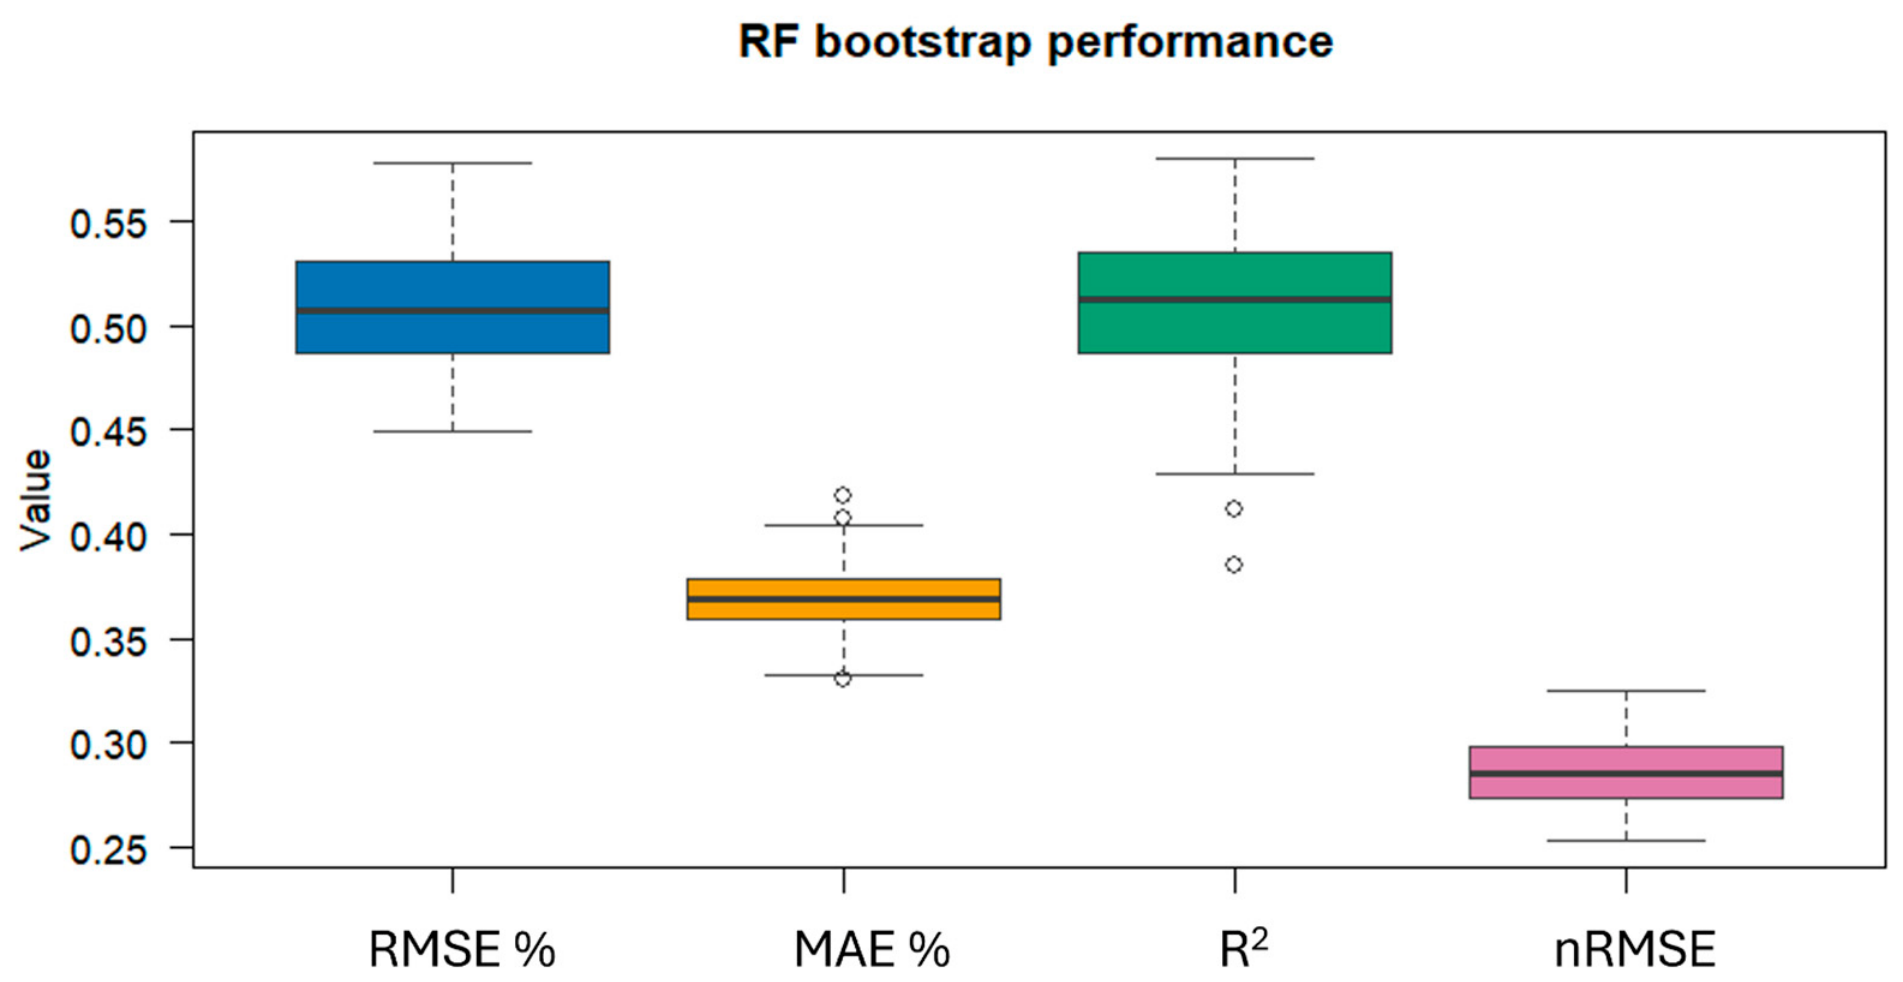
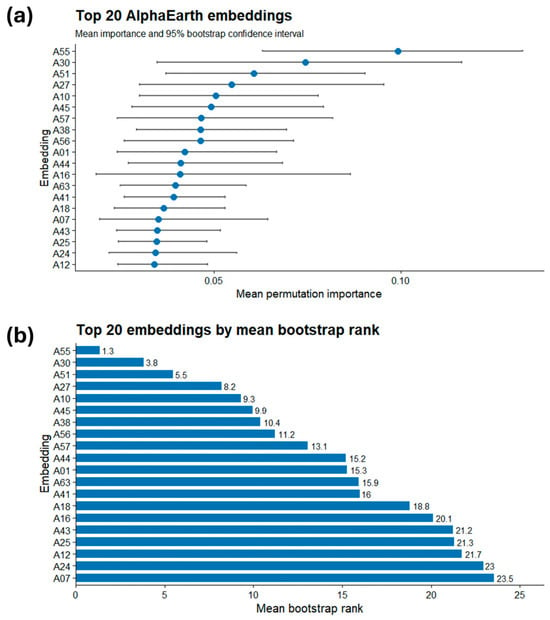
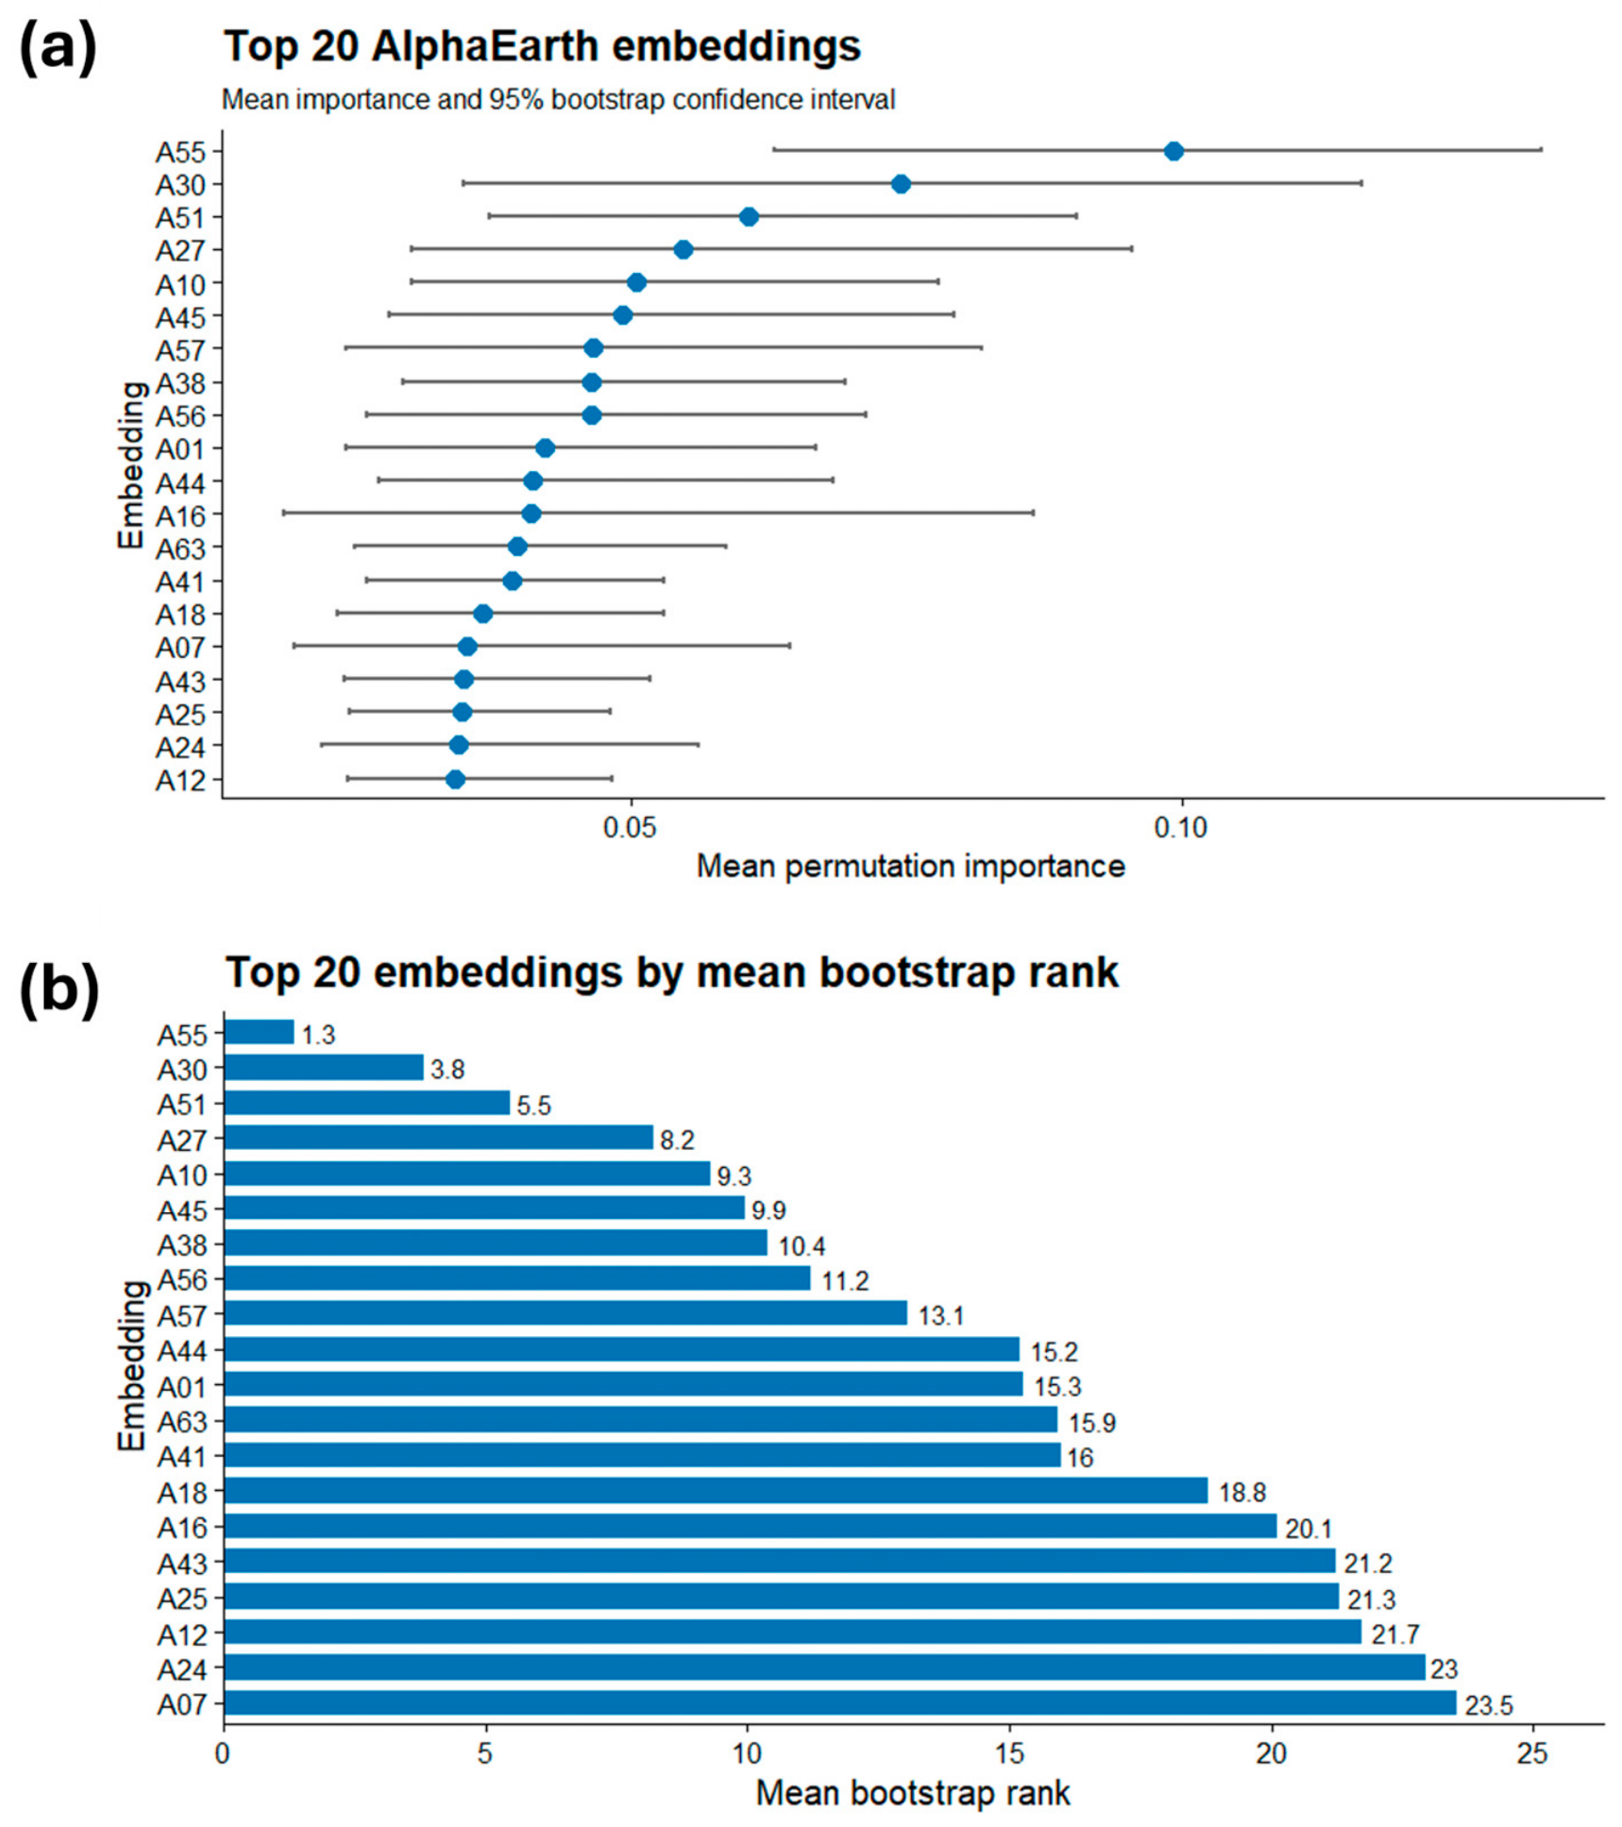
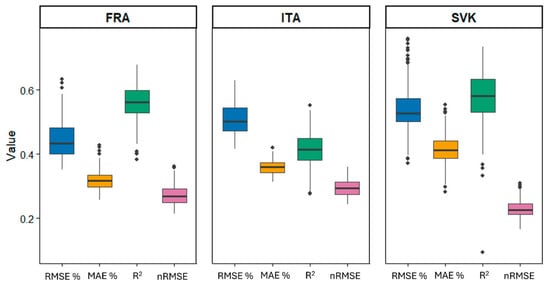
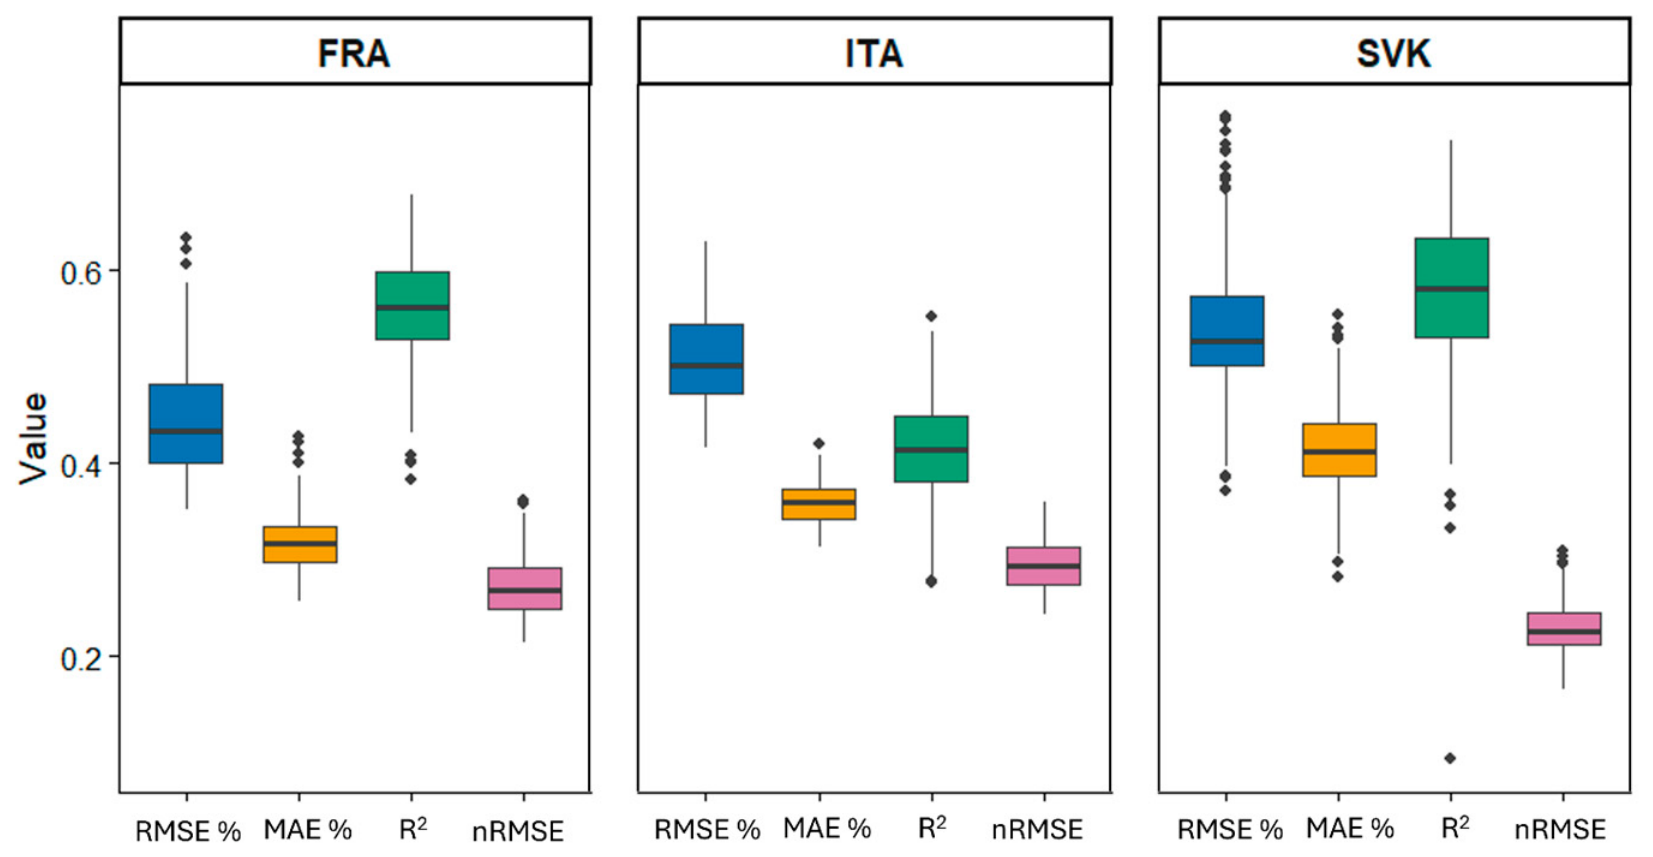
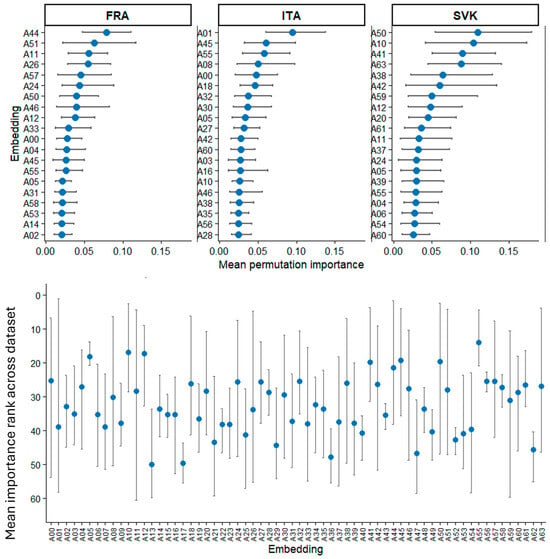
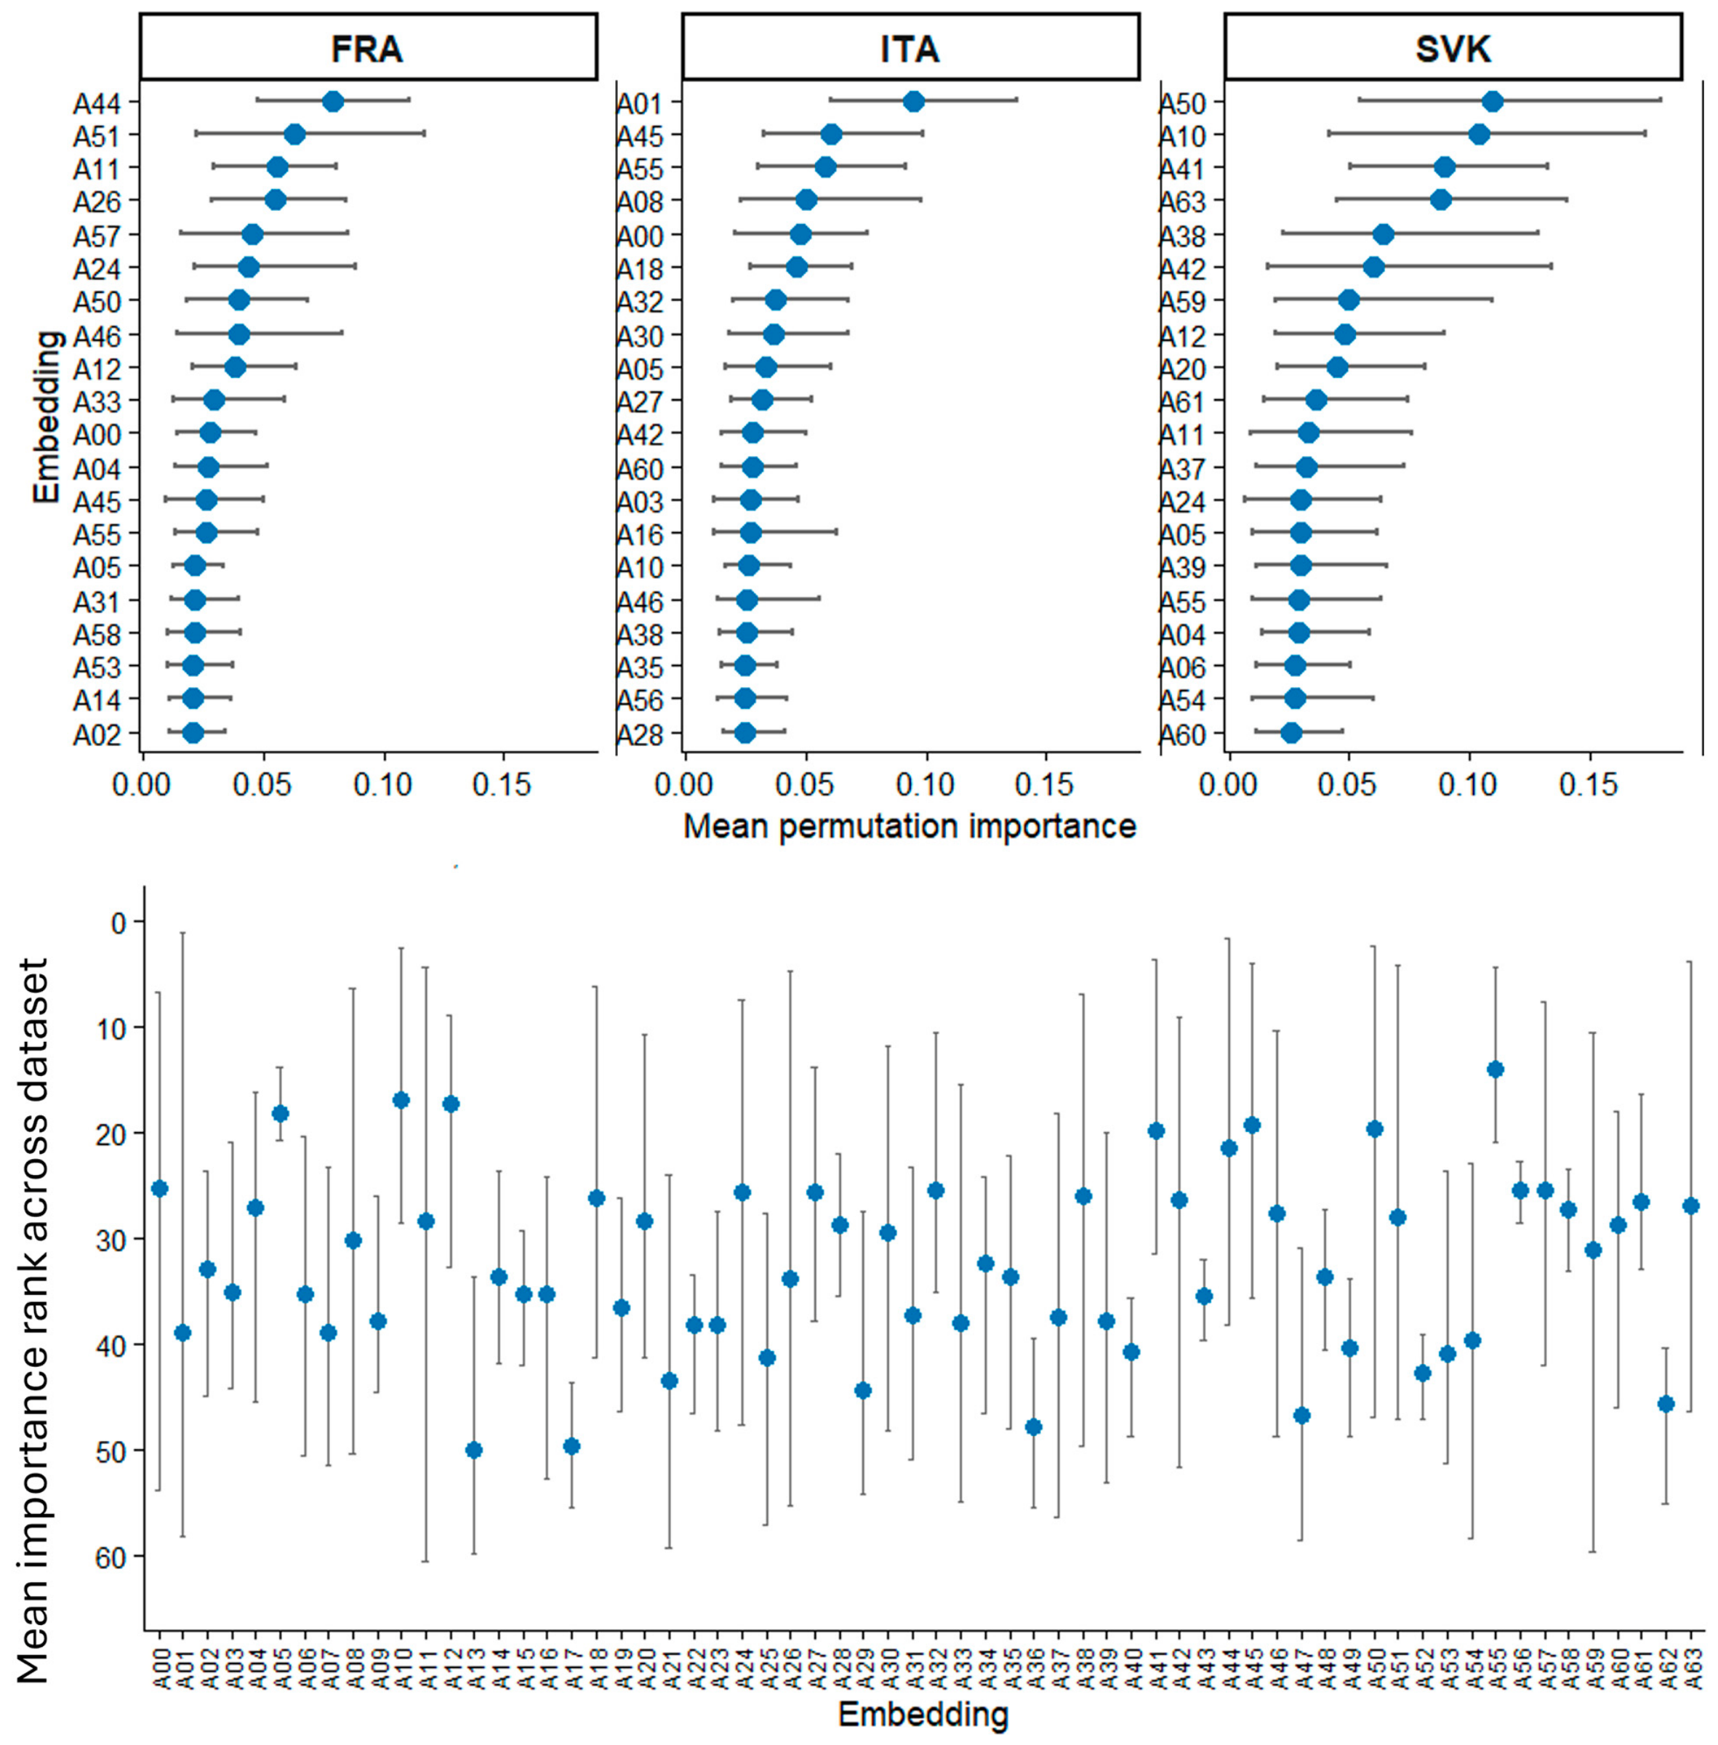

Disclaimer/Publisher’s Note: The statements, opinions and data contained in all publications are solely those of the individual author(s) and contributor(s) and not of MDPI and/or the editor(s). MDPI and/or the editor(s) disclaim responsibility for any injury to people or property resulting from any ideas, methods, instructions or products referred to in the content. |
© 2026 by the authors. Licensee MDPI, Basel, Switzerland. This article is an open access article distributed under the terms and conditions of the Creative Commons Attribution (CC BY) license.