


Highlights
What are the main findings?
- The proposed SPDB-ECEM framework effectively exploits complementary spectral and polarimetric information for target detection in complex grassland backgrounds.
- The dual-branch cascaded structure with cross-branch response guidance improves target–background discrimination compared with single-modality and conventional fusion methods.
- Quantitative experiments demonstrate improved continuous-response separability and detection performance.
What are the implications of the main findings?
- Spectral and polarimetric information provide complementary discrimination cues and should be modeled collaboratively rather than simply concatenated.
- Response-level collaboration and reliability-gated fusion provide an effective strategy for suppressing background interference while preserving target responses.
- The proposed framework provides a practical approach for multidimensional optical target detection in complex backgrounds.
Abstract
Target detection in complex backgrounds remains challenging because targets and backgrounds are often insufficiently separable in a single spectral or polarimetric feature space. In addition, conventional detectors usually have limited capability to exploit multidimensional heterogeneous features, which may result in false alarms and missed detections. To address these issues, this paper proposes a target detection method based on the collaborative enhancement of spectral–polarimetric heterogeneous information. First, density peak clustering (DPC) is employed to select representative and discriminative bands from the original multispectral data, thereby reducing spectral redundancy and concentrating target-related information. Second, a Spectral–Polarimetric Dual-Branch Ensemble-Based Cascaded Constrained Energy Minimization detector, termed SPDB-ECEM is developed. In each cascaded layer, spectral and polarimetric branches are constructed separately to model target responses in different feature spaces, while cross-branch response guidance is introduced to promote the intra-layer interaction and collaborative enhancement of heterogeneous information. Meanwhile, a reliability-gated fusion strategy is designed to adaptively balance the spectral and polarimetric responses according to the polarimetric response and the degree of linear polarization (DoLP). To further suppress local false alarms, background suppression, local consistency enhancement, and orthogonal-complement constraints are incorporated into the cascaded detection process to improve target-response consistency and reduce background interference. Finally, threshold-constrained OTSU (t-OTSU) is adopted to segment the fused response map and generate the target mask. The proposed framework establishes an integrated processing pipeline of band selection, dual-branch enhancement, and threshold segmentation, enabling effective complementarity between spectral and polarimetric information. Experimental results demonstrate that the proposed method improves target saliency and boundary separability in complex backgrounds, enhances the robustness of target enhancement and detection, and provides an effective solution for spectral–polarimetric joint target detection.
1. Introduction
Target detection in complex backgrounds plays a crucial role in remote sensing image interpretation, scene perception, and object recognition. The key challenge lies in accurately extracting target regions with specific spectral or physical properties from complex backgrounds and interfering responses. With the rapid development of hyperspectral and multispectral imaging technologies, target detection has shifted from conventional intensity-image analysis to high-dimensional spectral feature representation, which enables the spectral reflectance differences between targets and backgrounds across multiple bands to be more fully exploited [1]. In particular, hyperspectral imaging provides continuous and fine-grained spectral information, offering richer discriminative cues for weak target, subpixel target, and camouflaged target detection [2]. Nevertheless, in practical observation scenarios, target spectral responses are often affected by the imaging platform, observation geometry, and background environment, leading to significant intra-class spectral variability across different scenes [3].
Conventional hyperspectral target detection methods are mostly driven by prior target spectra, and typically enhance target responses and suppress background interference by constructing linear filters or detection statistics. Constrained energy minimization (CEM) has become a classical algorithm for multispectral and hyperspectral target detection by minimizing the output energy while maintaining a constrained response to the desired target [4]. Subpixel target detection based on the linear mixing model further reveals the relationship among target endmembers, background endmembers, and pixel abundances, providing an important theoretical foundation for weak target detection [5]. The adaptive coherence estimator (ACE) improves target detection capability under unknown background covariance conditions by constructing an invariant adaptive detection statistic [6]. In recent years, theoretical extensions and generalizations of CEM have further demonstrated the value of target-prior-based energy-constrained frameworks for hyperspectral target detection [7]. Representative variants include ensemble-based cascaded CEM, which enhances nonlinear representation and detection stability through cascaded and ensemble mechanisms [8], transform-domain adaptive CEM for improved target–background separability [9], and multiple-target inequality-constrained CEM for handling multiple target priors [10]. However, these methods are generally developed within a single feature space and do not explicitly consider the heterogeneous and complementary characteristics of spectral and polarimetric information.
Recent studies have shown that band selection is an important preprocessing step for reducing redundancy in hyperspectral and multispectral data and improving the efficiency of subsequent detection. Among various approaches, density peak clustering identifies cluster centers by searching for samples with high local density and large relative distance, providing an effective strategy for unsupervised representative sample selection [11]. Band-density-prominence-based clustering further demonstrates that density-based clustering can effectively identify representative bands in hyperspectral images [12]. Band selection methods based on band grouping and adaptive multi-graph constraints can reduce redundant information while preserving the structural relationships among bands [13]. Hyperbolic clustering-based band hierarchy methods improve the effectiveness of unsupervised band selection by constructing hierarchical relationships among spectral bands [14]. New band selection frameworks have also been continuously developed to balance information preservation, redundancy suppression, and computational efficiency in classification and detection tasks [15]. Global partition clustering further indicates that clustering-driven band selection can obtain globally representative band subsets from complex hyperspectral data [16]. Cross-modal guided attention mechanisms have also been introduced into hyperspectral band selection, suggesting that external structural information can assist in selecting more discriminative spectral channels [17]. For the few-band spectral–polarimetric joint detection task considered in this study, appropriate band selection not only reduces the input dimensionality but also provides more compact and effective spectral features for the subsequent dual-branch detector.
During the conversion of a target response map into a binary target region, threshold segmentation is a commonly used and intuitive post-processing strategy. The classical OTSU method adaptively determines the segmentation threshold by maximizing the between-class variance between the foreground and background, providing a simple yet effective statistical criterion for image segmentation [18]. However, in target detection tasks with complex backgrounds, the target region usually occupies only a small proportion of the image, and local high-response background regions may exist in the response map. As a result, the conventional OTSU method is prone to selecting a relatively low threshold due to the influence of target proportion and background distribution. To reduce background misclassification, this study introduces a lower-bound threshold constraint into the OTSU framework and adopts t-OTSU to convert the continuous response map into a target mask. This strategy further suppresses background false alarms while preserving the main target regions.
In addition to spectral information, polarimetric imaging can characterize differences between targets and backgrounds in terms of surface scattering, material roughness, and reflection directionality. Reviews of polarimetric imaging have indicated that polarization information can provide material and geometric cues that are difficult to represent using conventional intensity images, thereby offering a new feature dimension for target perception in complex scenes [19]. Data-driven polarimetric imaging studies have further shown that polarization information is complementary to intensity, color, and texture information, and can be used to enhance target representation in complex backgrounds [20]. Image fusion studies have also demonstrated that multi-source information fusion can exploit the complementarity among different sensing dimensions, thereby improving the robustness of complex visual tasks [21]. Polarimetric-imaging-based target detection methods improve the physical separability between targets and backgrounds by learning the fusion relationships among polarimetric features [22]. Meanwhile, polarization cues can reveal material differences between targets and backgrounds even when they exhibit similar color and texture characteristics [23]. IPNet integrates intensity and polarization information through a dual-flow network, verifying the effectiveness of polarimetric features in camouflaged object detection [24]. Iterative polarimetric feature enhancement networks further demonstrate the important role of polarization information in camouflaged target boundary enhancement and background suppression [25]. In addition, color–polarization synergistic target detection methods considering shadow interference show that combining color and polarization information can improve detection stability under complex illumination conditions [26].
With the continuous development of polarimetric imaging technologies, spectral–polarimetric joint imaging and fusion-based detection have gradually become important directions for target detection in complex backgrounds. Multidimensional fusion methods based on principal component analysis (PCA) and energy weighting have demonstrated the complementary enhancement effect of spectral and polarimetric information in target detection [27]. MSPFusion employs a feature transformer to perform multidimensional spectral–polarimetric image fusion, further demonstrating the potential of deep feature interaction for multimodal target representation [28]. Multidimensional information differential projection and fusion methods exploit response differences among different information dimensions to enhance target detection performance [29]. In addition, multi-channel fusion measurement methods for polarimetric hyperspectral data have shown that the joint use of spectral and polarimetric information can provide richer physically discriminative cues for camouflage target detection [30]. Recent studies in polarimetric radar have further highlighted the value of multidomain physical information for target characterization. The General Polarimetric Correlation Pattern (GPCP) jointly models target scattering characteristics across polarization, time, frequency, and spatial domains [31], while the Scattering Mechanism Embedded Network (SMEN) incorporates physically meaningful scattering mechanisms into network-based target representation [32]. These studies indicate that exploiting complementary information across different physical domains can provide more informative target representations.
Although existing studies have demonstrated the complementarity between spectral and polarimetric information in target detection, many methods still rely on complex network architectures, global feature concatenation, or empirical fusion strategies. These approaches may lead to high model complexity, mixed physical meanings of heterogeneous features, and unstable generalization under limited-sample conditions. Therefore, achieving effective collaboration between few-band spectral information and lightweight polarimetric features while maintaining model interpretability and low complexity remains an important challenge in target detection under complex backgrounds. As illustrated in Figure 1, under complex grassland backgrounds, single-modality detection based on either spectral or polarimetric information alone may still suffer from background interference or incomplete target extraction. This observation motivates the development of a collaborative spectral–polarimetric detection framework.
Figure 1.
Visual motivation for spectral–polarimetric collaborative detection. (a) Representative false-color image of the grassland scene. (b) Detection result based on spectral information alone. (c) Detection result based on polarimetric information alone. Both single-modality results exhibit limitations in complex backgrounds, which motivates the proposed collaborative framework.
To address the above issues, this study proposes a target detection and segmentation method for the collaborative enhancement of low-dimensional spectral–polarimetric heterogeneous information, with a focus on camouflaged target detection in complex grassland backgrounds. First, to reduce the high redundancy of multispectral data and concentrate discriminative information, density peak clustering (DPC) is employed to select representative bands from the original multispectral images, thereby constructing compact and discriminative few-band spectral features. Second, polarimetric contrast features and , together with the degree of linear polarization (DoLP), are derived from four-directional polarimetric images to characterize the differences between targets and backgrounds in surface scattering properties and polarimetric responses. On this basis, a Spectral–Polarimetric Dual-Branch Ensemble-Based Cascaded Constrained Energy Minimization method, termed SPDB-ECEM, is developed. The proposed detector models target responses separately in the spectral and polarimetric branches, and introduce cross-branch response guidance within the cascaded layers to achieve collaborative enhancement of heterogeneous information while preserving the physical meaning of each modality. To further improve target preservation and false alarm suppression in complex backgrounds, reliability gating, background-suppressed CEM, local consistency enhancement, and an orthogonal-complement constraint are incorporated into the cascaded detection process. These mechanisms enable adaptive fusion of spectral and polarimetric responses according to target surface characteristics and background interference. Finally, t-OTSU is adopted to segment the fused response map and generate the target mask.
The main contributions of this study are summarized as follows:
- (1)
- An integrated processing pipeline of “DPC-based band selection, SPDB-ECEM collaborative enhancement, and t-OTSU segmentation” is proposed, providing an interpretable framework for joint target detection using few-band spectral features and low-dimensional polarimetric features.
- (2)
- A spectral–polarimetric dual-branch cascaded detection framework is developed to independently model spectral and polarimetric information in their respective feature spaces. Unlike direct feature concatenation, the proposed architecture preserves the heterogeneous characteristics of the two modalities and avoids premature mixing of spectral and polarimetric features.
- (3)
- A bidirectional cross-branch response-guidance mechanism is introduced into the cascaded CEM process. At each cascade layer, the detection response from one branch is incorporated into the feature representation of the other branch, enabling iterative response-level interaction between spectral and polarimetric information. This design allows complementary cues from the two modalities to progressively enhance target responses and suppress background interference.
- (4)
- A reliability-gated response-fusion strategy is proposed to adaptively integrate the enhanced spectral and polarimetric responses. Instead of using fixed fusion weights, the contribution of each branch is adjusted according to its local response reliability, allowing the detector to exploit modality-specific advantages under heterogeneous background conditions.
2. Methodology
2.1. Overall Framework
To achieve effective target enhancement and detection in complex backgrounds, this study constructs a collaborative processing framework for spectral–polarimetric images, as illustrated in Figure 2.
Figure 2.
Overall framework of the proposed target detection method.
The input data consist of hyperspectral images in the 450–700 nm wavelength range and four-directional polarimetric images acquired at 700 nm. Spectral information characterizes wavelength-dependent reflectance differences between targets and backgrounds, whereas polarimetric information provides complementary information related to surface scattering characteristics. Based on their complementarity, the proposed framework consists of three main stages: feature preparation, SPDB-ECEM, and target segmentation.
In the feature preparation stage, DPC is employed to select representative spectral bands from the original hyperspectral data, thereby reducing spectral redundancy and forming a compact spectral input. Meanwhile, the polarimetric features , , and DoLP are derived from the four-directional polarimetric images to characterize target–background differences in polarimetric responses.
In the target enhancement stage, SPDB-ECEM independently models the selected spectral features and polarimetric features through spectral and polarimetric branches, respectively. Response-level collaboration is introduced between the two branches to exploit complementary information while preserving their modality-specific physical characteristics. The enhanced branch responses are subsequently integrated through reliability-gated fusion to generate a target-enhancement map with improved target–background separability.
Finally, t-OTSU is applied to the fused response map to obtain the binary target mask. Accordingly, the complete processing pipeline can be summarized as “DPC-based band selection–SPDB-ECEM collaborative enhancement–t-OTSU segmentation.” Detailed formulations and implementation procedures for each stage are presented in the following subsections.
2.2. Density-Peak-Clustering-Based Band Selection
To address the problems of a large number of bands, severe information redundancy, and dispersed discriminative information in the original hyperspectral data, this study adopts density peak clustering (DPC) for band selection. By jointly considering the local density and relative distance of samples, DPC can effectively identify representative samples in the data distribution, thereby selecting representative spectral bands.
Before DPC-based band selection, all hyperspectral images are subjected to reflectance calibration. Therefore, the Euclidean distance is calculated between vectorized reflectance images rather than raw digital-number images. This calibration places different spectral bands on a physically meaningful reflectance scale and reduces the influence of wavelength-dependent illumination and sensor response. No additional band-wise normalization is applied because the absolute reflectance differences between the target and background are themselves useful spectral cues for band selection.
Assume that the hyperspectral data contain bands, with each reflectance-calibrated band image regarded as a sample in the spectral feature space. Let and denote the target and background reference reflectances at the -th wavelength, respectively. The target–background reflectance contrast of the -th band is defined as:
which is further normalized as:
where and denote the minimum and maximum target–background contrast values among all spectral bands, respectively, and is a small positive constant used to avoid division by zero. Based on the normalized contrast, the local density of the -th band is defined as:
where the adaptive cutoff distance is given by:
With:
Here, denotes the Euclidean distance between the -th and -th reflectance-calibrated band images. denotes the base cutoff distance and is determined as the 10th percentile of all nonzero pairwise inter-band distances, while denotes the adaptive cutoff distance associated with the -th band. represents the normalized target–background reflectance contrast, and denotes its mean value over all spectral bands. The normalization factor in keeps the overall neighborhood scale close to the original percentile-based DPC setting, while assigning a relatively larger neighborhood to bands with stronger target–background contrast. Consequently, the local-density term incorporates both inter-band representativeness and target–background discriminability. The indicator function is defined as:
The distance metric is used to characterize the similarity between different bands. In this study, the Euclidean distance is adopted to measure the difference between spectral bands:
where and denote the vectorized calibrated reflectance images at the -th and -th wavelengths, respectively. After obtaining the local density, the minimum distance between each band and all bands with higher density is further calculated and defined as follows:
where is used to characterize the degree of isolation of the current band with respect to higher-density bands. A larger indicates that the corresponding band is farther away from other high-density regions in the feature space and therefore has stronger representativeness.
By combining local density and relative distance, the importance evaluation index of each band is defined as follows:
Through DPC-based band selection, redundant and highly correlated bands can be effectively removed while preserving the key spectral information that characterizes the differences between targets and backgrounds. This process improves the stability and discriminative capability of target detection while reducing data dimensionality, and provides more compact and effective input features for the subsequent dual-branch E-CEM enhancement.
2.3. Spectral–Polarimetric Dual-Branch Ensemble-Based Cascaded Constrained Energy Minimization Method (SPDB-ECEM)
E-CEM is an ensemble detection framework developed by incorporating cascaded detection, random averaging, and multi-scale scanning strategies into the CEM detector. Its core objective is to enhance the discriminative capability of the model for complex nonlinear spectral distributions and improve robustness to spectral variability while maintaining the stability of classical detectors. To fully exploit the complementary advantages of few-band spectral information and low-dimensional polarimetric information in target detection under complex backgrounds, this study constructs SPDB-ECEM method, based on the E-CEM framework [8]. Unlike the original E-CEM, which is mainly designed for continuous high-dimensional spectral vectors, the data used in this study consist of a small number of representative bands selected by DPC and four-directional polarimetric images acquired at a single wavelength, exhibiting distinct low-dimensional heterogeneous characteristics. Therefore, this study retains the core ideas of “cascaded detection” and “random averaging” in E-CEM, while redesigning its intra-layer structure to adapt to spectral–polarimetric heterogeneous inputs.
As illustrated in Figure 3, SPDB-ECEM adopts two independent processing branches for spectral and polarimetric information rather than directly concatenating heterogeneous features. The spectral branch exploits the differences and complementarity among the selected bands to enhance target–background separability, whereas the polarimetric branch uses polarimetric contrast and DoLP to characterize differences in surface scattering properties. During the cascaded detection process, cross-branch response guidance enables response-level collaboration between the two branches while preserving their independent feature spaces. Background suppression and local consistency enhancement are further incorporated to reduce background interference and improve the spatial continuity of target responses. In addition, the orthogonal-complement constraint emphasizes complementary polarimetric information that is not sufficiently represented by the spectral response. Finally, the enhanced responses of the two branches are integrated through reliability-gated fusion to generate the final target-enhancement map. Overall, Figure 3 illustrates the key design principle of SPDB-ECEM: independent heterogeneous feature modeling, response-level collaboration, and adaptive response fusion.
Figure 3.
Overall structure of the SPDB-ECEM detector. The spectral branch and polarimetric branch are cascaded separately, and cross-branch response guidance is introduced between adjacent layers. Background suppression, local consistency enhancement, orthogonal-complement enhancement, and reliability-gated fusion are used to refine the final detection response.
2.3.1. Spectral–Polarimetric Heterogeneous Feature Representation
Let denote the number of feature bands selected by DPC. The spectral feature vector of the -th pixel is represented as follows:
The corresponding prior target spectral vector is denoted as:
For the polarimetric input, the four polarization-direction images acquired at a single wavelength are denoted as , , , and , respectively. Under the condition of linear polarization, the Stokes parameters can be expressed as follows:
Since the absolute values of and may vary with exposure time, illumination intensity, and sensor response, normalized polarimetric differential ratios are used in this study as polarimetric contrast features to reduce the influence of external imaging conditions on polarimetric representation:
The degree of linear polarization (DoLP) is further defined as follows:
and characterize signed directional polarization differences, whereas DoLP describes the overall magnitude of linear polarization. Although DoLP is mathematically related to the directional polarization components, it represents a nonlinear magnitude descriptor rather than an additional statistically independent variable. Therefore, , , and DoLP are used in this study as complementary polarimetric descriptors rather than independent physical quantities.
Thus, the polarimetric feature vector of the -th pixel can be written as:
The corresponding prior target polarimetric vector is denoted as . The above feature representation enables the spectral and polarimetric branches to correspond to different physical attributes: the former describes the differences between targets and backgrounds in the reflectance spectral dimension, whereas the latter characterizes their differences in material scattering properties and polarimetric responses.
The spectral and polarimetric target-prior vectors used in SPDB-ECEM were obtained from the independent laboratory characterization experiments described in Section 3.1. Specifically, spectral and polarimetric measurements of targets A, B, and C were acquired in advance using the spectral–polarimetric imaging system, and the corresponding material-specific feature vectors were constructed from these reference measurements. These independently acquired feature vectors were subsequently used as the target priors and in the detection experiments. Therefore, the target priors were not extracted from the ground-truth masks or from the target regions of the test scenes.
2.3.2. Ensemble CEM and Cross-Guided Cascaded Structure
The basic detection unit of SPDB-ECEM remains regularized CEM. For an arbitrary branch , let denote the input feature of the -th pixel at the -th layer, and let denote the corresponding prior target vector. The autocorrelation matrix of the features at this layer is defined as follows:
where denotes the total number of image pixels. To improve the numerical stability of matrix inversion, the weight vector of the -th regularized CEM sub-detector is given by:
where is the random regularization parameter corresponding to the -th base detector, and denotes the identity matrix. In each layer, CEM sub-detectors with different regularization parameters are constructed, and their outputs are randomly averaged to obtain the ensemble response of branch at the -th layer:
where denotes the sigmoid nonlinear mapping. The purpose of introducing the nonlinear mapping is to prevent the cascaded structure from degenerating into a linear feature expansion and to enhance the capability of the detector to characterize nonlinear response distributions in complex backgrounds.
To address the problem that inter-layer responses tend to become similar under low-dimensional spectral and polarimetric feature inputs, cross-branch response guidance is introduced into the cascaded process. For the first layer, the two branches take the original spectral and polarimetric features as their inputs, respectively:
When , the spectral branch incorporates not only its own response from the previous layer but also the polarimetric response from the previous layer as auxiliary modulation information. Similarly, the polarimetric branch introduces the previous-layer spectral response to enable inter-layer interaction between the two types of heterogeneous information:
where and denote the self-cascaded modulation coefficients of the spectral and polarimetric branches, respectively, while and denote the cross-branch guidance coefficients. Through this design, the spectral branch can use the polarimetric response to suppress background regions with similar spectral characteristics, while the polarimetric branch can exploit the spectral response to stabilize the low-dimensional polarimetric detection results.
2.3.3. Intra-Layer Enhancement Mechanisms
In complex grassland backgrounds, CEM responses that rely solely on the target prior are easily affected by local high-reflectance textures and fragmented background responses. To enhance the adaptability of SPDB-ECEM under low-dimensional input conditions, background-suppressed CEM, local consistency enhancement, and an orthogonal-complement constraint are further introduced into each cascaded layer.
First, background-suppressed CEM reduces background misdetections by explicitly estimating the background prior response. Let denote the background prior vector estimated from non-target regions or low-response regions for branch at the -th layer. The target CEM response and the background CEM response can then be calculated separately, and the background-suppressed response is constructed as follows:
where denotes the background suppression coefficient. In this study, is empirically set to 0.35 by default, providing a moderate suppression strength that reduces background interference while avoiding excessive attenuation of target responses. This operation can reduce the influence of high-response pixels in the grassland background on the final detection result while maintaining effective target enhancement.
Second, to exploit the fact that target regions usually exhibit spatial continuity whereas background misdetections are mostly fragmented, local consistency enhancement is introduced into the response map of each layer. Let denote a local mean or Gaussian smoothing operator with scale , where controls the size of the local neighborhood used for spatial consistency modeling. In this study, is set to 3 by default, corresponding to a local neighborhood. This relatively small neighborhood scale can suppress isolated fragmented responses while preserving target boundaries and local structural details. The response after local consistency enhancement can be expressed as follows:
where controls the enhancement strength of locally continuous regions, suppresses locally abrupt responses, and denotes the normalization operation. In all experiments, and are fixed at 0.25 and 0.35, respectively. These settings are kept unchanged across different scenes to ensure consistent response refinement. The resulting local consistency enhancement strengthens spatially continuous target responses while suppressing scattered false alarms caused by grassland textures.
Finally, to prevent the polarimetric branch from merely repeating the responses already obtained by the spectral branch, an orthogonal-complement constraint is introduced, enabling the polarimetric branch to provide more complementary information relative to the spectral branch. Taking the response at the -th layer as an example, the projection component of the polarimetric response that overlaps with the spectral response can be represented and removed as follows:
where denotes the inner product after vectorizing the response maps. The orthogonal-complement term can highlight the independent contribution of polarimetric information relative to spectral information, and is particularly suitable for scenarios in which the target surface is relatively smooth and the polarimetric response is more representative.
After intra-layer enhancement, the multi-layer responses of each branch are aggregated using a later-layer-weighted strategy, so as to increase the contribution of responses refined by deeper cascaded layers:
where denotes the number of cascaded layers in each branch, and denotes the fusion weight assigned to the response of the -th layer. To emphasize the responses refined by deeper cascaded layers, a linearly increasing weighting strategy is adopted in this study, i.e., . Compared with simple averaging, the later-layer-weighted aggregation strategy can reduce the influence of coarse responses from the initial layers on the final detection map.
2.3.4. Reliability-Gated Fusion Strategy
The spectral and polarimetric branches emphasize different target attributes. The spectral branch is more sensitive to reflectance differences across bands, whereas the polarimetric branch is more sensitive to differences in target surface scattering properties and reflection directionality. Considering that the reliability of these two types of information is not fixed under different target materials and background conditions, a reliability-gated mechanism is adopted in this study to adaptively fuse the responses of the two branches.
Let and denote the outputs of the spectral and polarimetric branches, respectively, and let denote the orthogonal-complement polarimetric response. The enhanced polarimetric response can then be expressed as follows:
where denotes the orthogonal-complement weighting coefficient, which controls the contribution of the complementary polarimetric response. In all experiments, is fixed at 0.5. This value provides a balance between introducing complementary polarimetric information and preserving the stability of the original polarimetric response. Furthermore, a polarimetric reliability term is constructed by jointly considering the normalized polarimetric response and DoLP, and is combined with the spectral response to form a pixel-level gating weight:
where ⊙ denotes pixel-wise multiplication, and denote the polarimetric and spectral response-reliability terms, respectively, and represents the pixel-level gating weight used in the fusion process. It should be noted that DoLP is used here as a polarization-strength cue rather than as an independent indicator of target reliability. A large is obtained only when a relatively strong DoLP and a strong target-like polarimetric response occur simultaneously. Therefore, background regions with high DoLP but weak polarimetric detection responses are suppressed by the multiplicative formulation. The final gating weight further balances the polarimetric response against the spectral response, thereby reducing the possibility that strong polarization from background objects dominates the fusion result.
The final fused response map is defined as follows:
The reliability-gated fused response is used as the input for the subsequent t-OTSU segmentation. Through the above design, SPDB-ECEM achieves collaborative enhancement between few-band spectral features and low-dimensional polarimetric features while preserving the interpretability and small-sample adaptability of the CEM detector. The cross-branch cascaded structure enables the two types of heterogeneous responses to guide each other across layers. Background suppression and local consistency enhancement reduce fragmented false alarms in complex grassland backgrounds, while the orthogonal-complement constraint and reliability-gated fusion further improve the effective utilization of polarimetric information. As a result, a more stable target enhancement response can be obtained.
2.4. Target Segmentation Based on t-OTSU
After enhancement by SPDB-ECEM, a fused response map is obtained. In this response map, target regions usually exhibit higher response values, whereas background regions correspond to lower response values. To further convert the continuous response map into a binary target mask, the t-OTSU method is adopted for threshold segmentation in this study.
The basic idea of the conventional OTSU method is to traverse all possible thresholds, divide the image into foreground and background classes, and select the threshold that maximizes the between-class variance as the optimal segmentation threshold. Let the normalized response map have a gray-level range of . Given a threshold , the image can be divided into the background class and the target class . The probabilities of the two classes are denoted as and , respectively; their mean values are denoted as and , respectively; and the global mean is denoted as . The between-class variance can then be expressed as follows:
The optimal threshold determined by the conventional OTSU method is given by:
After enhancement by SPDB-ECEM, the target regions already exhibit high responses in the fused response map, and the response difference between the targets and most background regions is significantly enlarged. Therefore, a reasonable threshold constraint is required in the subsequent segmentation process to prevent low-response background regions or local interference regions from being misclassified as targets. In target detection tasks under complex backgrounds, the target regions usually occupy only a small proportion of the entire image, while local high-response interference caused by grassland textures, locally high-reflectance regions, or background structures may still exist in the enhanced response map. Under such conditions, the conventional OTSU method is easily affected by the small target proportion and the nonuniform distribution of background responses, resulting in an overly low segmentation threshold and causing some background regions to be misclassified as targets. To alleviate this problem, the t-OTSU method is adopted in this study, in which a lower-bound threshold constraint is introduced based on the adaptive OTSU threshold so that the final threshold is not lower than the predefined lower bound. This strategy retains the adaptive segmentation advantage of OTSU while fully exploiting the high target-response characteristics generated by SPDB-ECEM, thereby further enhancing the suppression capability of the segmentation process against complex background interference.
Let denote the manually specified lower-bound threshold, which is used to prevent the final threshold from becoming excessively low in complex-background scenes. The final segmentation threshold is then defined as follows:
where is used to constrain the threshold so that it is not lower than the predefined lower bound. When is too low, the final threshold is determined by ; when the threshold obtained by OTSU itself is sufficiently high, its adaptive advantage is retained. In this way, background misdetections caused by an excessively low threshold can be effectively reduced while preserving the target regions.
Based on the final threshold , the fused response map is converted into a binary target mask :
By introducing the t-OTSU segmentation strategy, the continuous response map output by SPDB-ECEM is further converted into a target region mask. While preserving the adaptive segmentation advantage of OTSU, this method enhances the suppression of background misclassified regions in complex backgrounds through the lower-bound threshold constraint, thereby providing reliable outputs for subsequent target evaluation and detection result analysis.
2.5. Evaluation Metrics
To quantitatively evaluate the performance of the proposed method in target detection and segmentation tasks, the false alarm rate (), F1 score, and accuracy () are adopted as evaluation metrics in this study. Let the pixel-level statistics between the predicted result and the ground-truth annotation be true positives (), true negatives (), false positives (), and false negatives (), respectively. Specifically, denotes the number of pixels correctly identified as targets, denotes the number of pixels correctly identified as background, denotes the number of background pixels incorrectly classified as targets, and denotes the number of target pixels incorrectly classified as background. Based on these statistics, the following metrics are used to evaluate the detection results.
First, the false alarm rate is used to measure the proportion of falsely detected target pixels in the detection result, and is defined as follows:
This metric reflects the proportion of pixels predicted as targets that actually belong to false detection regions. A smaller value indicates a stronger capability of the method to suppress background interference and fewer false alarms in the detection result.
Second, the score is used to comprehensively evaluate the precision and recall of the detection result. The precision and recall are defined as follows:
The score is then defined as follows:
After further expansion, it can be written as:
The score jointly considers the target detection capability and false alarm suppression capability. A larger value indicates that the segmentation result is closer to the ground-truth target region.
Finally, the classification accuracy is used to measure the proportion of correctly classified pixels among all pixels, and is defined as follows:
Considering the strong class imbalance between target and background pixels, detection performance is not evaluated using accuracy alone. is used to quantify background false alarms, while jointly considers precision and recall and therefore provides a more balanced evaluation of target detection performance. is retained only as a supplementary measure of the overall classification accuracy.
3. Results
To systematically evaluate the proposed SPDB-ECEM framework, experiments were conducted under representative complex grassland scenarios. The following subsections describe the experimental setup, evaluation metrics, comparative methods, and detection results, followed by ablation and parameter-sensitivity analyses.
3.1. Experimental Scenarios
To verify the effectiveness of the proposed method in target detection tasks under complex backgrounds, multispectral images in the wavelength range of 450–700 nm and polarimetric images at a specific band were acquired using a spectral–polarimetric imaging system. The overall structure of the experimental system is shown in Figure 4a and Figure 4b, and the selected experimental materials are shown in Figure 4c, Figure 4d, and Figure 4e, corresponding to materials A, B, and C, respectively.
Figure 4.
Experimental system and target materials. (a) Spectral–polarimetric camera; (b) internal structure of the spectral–polarimetric camera; (c) visible-light image of material A; (d) visible-light image of material B; (e) visible-light image of material C.
The imaging system uses a Hamamatsu C13440 camera (Hamamatsu Photonics K.K., Hamamatsu, Japan) as the imaging detector, together with a 50-mm imaging lens for target-scene acquisition. The C13440 camera provides high imaging sensitivity and stability, meeting the requirements for fine spectral imaging in the visible range. To enable spectral-dimensional acquisition, a liquid crystal tunable filter (LCTF; Cambridge Research & Instrumentation, Inc., Cambridge, MA, USA) is mounted in front of the camera, and band-by-band scanning of the target scene is achieved by adjusting the central transmission wavelength. In the experiments conducted in this study, the system covers the visible spectral range, with a wavelength scanning resolution of up to 1 nm, thereby enabling the acquisition of scene image data with relatively high spectral resolution.
To capture the response differences between targets and backgrounds in the polarimetric dimension, a liquid crystal variable retarder (LCVR) and a liquid crystal polarization rotator (LPR) from Meadowlark Optics, Inc. (Frederick, CO, USA) are further integrated into the optical path. Based on this configuration, the system can acquire four polarization-direction images of the target scene at a specific band, from which polarimetric features such as the Stokes parameters and , as well as the degree of linear polarization (DoLP), can be further constructed.
To characterize the spectral and polarimetric responses of several target materials, preliminary material testing was conducted before the detection experiments. In a laboratory environment, the spectral–polarimetric camera was used to perform band-by-band scanning of scene images over the wavelength range of 450–700 nm. Since polarimetric parameters are strongly affected by variations in observation angle, a high-precision motorized rotation stage was employed to acquire data of the target materials under different illumination-angle conditions, thereby forming the original spectral–polarimetric image dataset. Based on these independently acquired measurements, material-specific spectral and polarimetric feature vectors were constructed for each target category and subsequently used as prior target signatures in the detection algorithms. Importantly, these prior signatures were obtained independently of the complex grassland test scenes and their ground-truth masks.
During the experimental acquisition process, images at the selected target-relevant bands were first acquired based on prior information. Subsequently, at the 700 nm band, four polarization-direction images were collected using the spectral–polarimetric imaging system for polarimetric parameter calculation. The spectral responses of different materials and the polarimetric responses of several targets under different observation azimuth and zenith angles are shown in Figure 5. The experimental scenarios in this study mainly focus on target detection under complex background conditions. In the acquired data, the targets and background exhibit certain overlap in brightness, texture, and color representations, making it difficult to achieve stable detection using a single imaging feature alone. With the above spectral–polarimetric joint imaging system, spectral and polarimetric information can be acquired on a unified experimental platform, thereby providing reliable data support for investigating the collaborative detection mechanism of these two types of heterogeneous features.
Figure 5.
Spectral and polarimetric responses of different materials. (a) Spectral curves of several target materials and grass; (b) polarimetric information of several targets under different observation azimuth angles and observation zenith angles @700nm.
3.2. Band Selection
To reduce the redundancy of the original hyperspectral data and improve the efficiency of subsequent target detection, feature band selection was first performed within the spectral range of 450–700 nm. Since adjacent bands in the original multiband data usually exhibit strong correlations, directly using all bands for detection would not only reduce acquisition and processing efficiency but may also introduce redundant information. Therefore, before target enhancement and segmentation, it is necessary to select representative feature bands from the original spectral data that contribute more effectively to target recognition.
In this study, the DPC method described in Section 2.2 is adopted for spectral band selection. As illustrated in Figure 6, each reflectance-calibrated band image is treated as an individual sample in the spectral feature space. The inter-band distance matrix is first calculated, based on which the local density , relative distance , and comprehensive evaluation index are obtained for each band. Bands with larger values are considered more representative and are preferentially selected. Considering the subsequent spectral–polarimetric dual-branch detector and the balance between spectral representation capability and computational complexity, four representative bands are retained as the input of the spectral branch. Figure 6 therefore illustrates how DPC identifies compact and representative spectral information from the original multiband data while reducing redundancy among adjacent bands.
Figure 6.
DPC-based band selection method.
In the specific implementation, each band image is first vectorized, and the Euclidean distance is used to measure the difference between any two bands. Subsequently, the decision value of each band is obtained using the DPC algorithm, and all bands are ranked in descending order according to . Since bands with larger values generally possess both high local density and strong independence, they can effectively preserve the main spectral characteristics while avoiding the selection of overly similar adjacent bands. Finally, the top four ranked bands are selected as representative feature bands, and the band selection results are shown in Table 1.
Table 1.
Band selection results.
3.3. Comparative Methods
To comprehensively evaluate the effectiveness of the proposed method in target detection tasks under complex backgrounds, several classical target detection methods and their improved variants are selected as comparative baselines. The comparison methods mainly include constrained energy minimization (CEM), matched filter (MF), orthogonal subspace projection (OSP), and hierarchical constrained energy minimization (HCEM). Among them, CEM and MF are widely used target-prior-driven detectors in multispectral and hyperspectral target detection, which construct detection responses based on known target features. OSP suppresses background components by constructing a background subspace and performing orthogonal projection, and is therefore suitable for evaluating the background interference suppression capability of different methods under complex backgrounds. HCEM extends conventional CEM through a hierarchical structure, which enhances the nonlinear representation capability and cascaded enhancement effect of the detector to a certain extent.
In the experimental settings, to ensure fair comparison, all spectral detection methods use the four feature bands selected by DPC as input. For polarimetric-feature-based methods, , , and DoLP are uniformly used as polarimetric inputs. For fusion-based methods, both the early fusion strategy based on direct concatenation of spectral and polarimetric features and the proposed method are considered, so as to analyze the influence of heterogeneous information organization on detection performance.
Based on the above settings, the main comparative methods in this study are divided into the following categories:
- (1)
- Single-spectral detection methods: CEM, MF, OSP, and HCEM are applied to the four DPC-selected bands, aiming to evaluate the performance of classical detectors under low-dimensional selected spectral inputs.
- (2)
- Single-polarimetric detection methods: CEM, MF, OSP, and HCEM are applied to the polarimetric feature vector , aiming to analyze the effectiveness and limitations of using polarimetric information alone for target detection.
- (3)
- Spectral–polarimetric fusion detection methods: The four selected spectral bands and three polarimetric features are directly concatenated to form a joint feature vector, which is then input into CEM, MF, OSP, and HCEM detectors, respectively. This setting is used to evaluate the performance of simple feature-level fusion strategies.
- (4)
- Proposed method: The proposed SPDB-ECEM method first adopts DPC for band selection, then extracts target responses separately from the spectral and polarimetric branches. Through cross-branch cascaded guidance, background suppression, local consistency enhancement, orthogonal-complement constraint, and reliability-gated fusion, collaborative enhancement of spectral–polarimetric heterogeneous information is achieved. Finally, t-OTSU is used to generate the target mask.
To avoid ambiguity in the definition of the detection tasks, two experimental settings were considered in this study. In the single-class multi-instance scenario, multiple spatially separated instances belonging to the same target category were placed in the grassland background. For each detection task, a single target-prior signature corresponding to the target category was used, and all instances belonging to this category were regarded as target pixels.
In the mixed-target scenario, targets A, B, and C coexisted in the same grassland scene. Since CEM and its variants are target-prior-driven binary detectors, simultaneous multi-class classification was not performed within a single detection run. Instead, three independent class-specific binary detection tasks were conducted for targets A, B, and C, respectively. Specifically, when Target-A was detected, pixels belonging to Target-A were regarded as positive samples, whereas targets B and C together with the grassland background were treated as non-target regions. The same protocol was applied to targets B and C. Therefore, three independent binary detection maps and their corresponding class-specific ground-truth masks were generated for the mixed-target scene. All quantitative evaluation metrics were calculated independently for each target category.
3.4. Experimental Results in the Single-Class Multi-Instance Scenario
To evaluate the capability of the proposed method to detect multiple instances belonging to the same target category, a single-class multi-instance scenario was constructed. Multiple spatially separated instances of Target-A were placed in a complex grassland background. Although these objects belong to the same material category, their observed responses vary because of differences in spatial position, pose, local illumination, and surrounding vegetation.
In this experiment, a single target-prior signature of material A, independently obtained from the laboratory characterization experiments described in Section 3.1, was provided to each target-prior-driven detector. All instances of Target-A in the test scene were regarded as target pixels, whereas the grassland background was treated as the non-target class. The complete ground-truth mask was used only for quantitative evaluation and was not involved in target-prior construction or detection.
The spectral–polarimetric direct fusion method and the proposed SPDB-ECEM method are mainly compared. The former directly concatenates the selected spectral bands with , , and DoLP for detection, where the latter models the spectral and polarimetric information separately through the spectral and polarimetric branches, and realizes collaborative enhancement of heterogeneous information through cross-branch cascaded guidance and reliability-gated fusion. By comparing the detection results of these two methods, the advantages of the dual-branch structure over simple feature concatenation in terms of target integrity preservation and background false alarm suppression can be analyzed. The ground-truth mask and false-color image of Target-A are shown in Figure 7.
Figure 7.
(a) False-color image of Target-A in the grassland background; (b) ground-truth mask of the target.
To further evaluate the intrinsic discrimination capability of different detectors independently of the subsequent threshold-segmentation procedure, the continuous response maps were analyzed before applying t-OTSU. As shown in Figure 8, most conventional detectors can produce enhanced responses in the target regions; however, considerable responses are also observed along grass stems, leaf edges, and other high-contrast background structures. These background responses reduce the separability between the target and the complex grassland background.
Figure 8.
Continuous response maps obtained by different detection methods in the single-target scenario. (a) SPDB-ECEM; (b) E-CEM; (c) CEM; (d) MF; (e) OSP; and (f) HCEM.
Compared with the conventional methods, SPDB-ECEM produces a more concentrated target response while suppressing a larger proportion of the structured background interference. This improvement can also be observed from the corresponding ROC curves in Figure 9. The AUC values of CEM, HCEM, MF, OSP, and E-CEM are 0.9496, 0.9504, 0.9500, 0.5784, and 0.9538, respectively, whereas SPDB-ECEM achieves the highest AUC of 0.9874.
Figure 9.
ROC curves of different detection methods in the single-target scenario. The ROC curves were calculated directly from the continuous detection responses before threshold segmentation.
Figure 10 shows the binary segmentation results obtained by different detectors. It can be observed that the OSP method produces many fragmented false alarms in grass texture regions, indicating that relying solely on background subspace projection is insufficient to suppress local high-response regions in complex grassland backgrounds. CEM and MF can detect the main target regions, but obvious false alarms caused by grass leaves, edge textures, and local bright spots still remain, and certain adhesion and fragmentation also occur around target boundaries. HCEM improves the detection performance of conventional CEM to some extent through its hierarchical cascaded structure; however, false detections still exist for slender grass-leaf textures. Compared with CEM, MF, and HCEM, E-CEM further reduces background false alarms and produces more concentrated target regions, demonstrating that the ensemble cascaded structure can improve response stability. Nevertheless, E-CEM still performs detection based on directly fused features and does not sufficiently exploit the differences between polarimetric and spectral information; therefore, a small number of false alarms remain in some background texture regions.
Figure 10.
Comparison of binary segmentation results obtained by different detectors. (a) SPDB-ECEM; (b) E-CEM; (c) CEM; (d) MF; (e) OSP; and (f) HCEM. White regions represent detected target pixels, whereas black regions represent background pixels.
In contrast, the proposed SPDB-ECEM method achieves more complete and compact target segmentation results. As shown in Figure 10a, multiple target regions are effectively extracted, with good continuity in the main target areas, while fragmented false alarms caused by grass leaves in the background are significantly reduced. This improvement mainly benefits from the separate modeling of spectral and polarimetric features in the proposed method. The dual-branch cascaded structure preserves the independent discriminative capabilities of the two types of heterogeneous information, while cross-branch guidance and reliability-gated fusion enhance target responses and suppress background interference. Compared with direct concatenation-based fusion, this strategy avoids mutual interference between different types of features in the same feature space, making the target regions more prominent in the final response map.
The quantitative evaluation results further verify the above observations. As shown by the metric variations in Figure 11, OSP produces the highest false alarm rate , while its and values are relatively low. CEM, MF, and HCEM achieve improved detection performance, but they are still affected by false alarms caused by background textures. E-CEM shows better performance in reducing the false alarm rate and improving the score. The proposed method achieves the lowest among all methods, while obtaining the highest and , indicating that it can not only effectively detect target regions but also better suppress non-target res ponses in the grassland background. Overall, the binary segmentation results and quantitative metrics demonstrate that SPDB-ECEM provides better target integrity, background suppression capability, and detection stability in the single-class multi-instance target scenario.
Figure 11.
Evaluation metric results for target detection using different detectors.
3.5. Experimental Results in the Mixed-Target Scenario
To further evaluate the capability of the proposed method in the presence of interference from different target materials, a mixed-target scenario was constructed in which targets A, B, and C coexisted in the same complex grassland background. In addition to irregular vegetation textures and locally high-response background regions, this scene contains inter-class interference caused by other target materials, making the detection task more challenging.
It should be emphasized that this experiment is formulated as a set of class-specific binary detection tasks, rather than a simultaneous multi-class classification problem. For each detection run, the independently measured laboratory prior of one material was supplied to the detector. For example, when detecting Target-A, only Target-A was regarded as the desired target, whereas targets B and C together with the grassland background were treated as non-target regions. The same procedure was independently applied to targets B and C. Therefore, the three ground-truth masks shown in Figure 12 correspond to three independent class-specific binary detection tasks conducted on the same mixed-target scene. As a result, traditional methods based on single spectral or single polarimetric features are prone to problems such as insufficiently prominent target responses and numerous background false alarms. The ground-truth masks and false-color images of several targets are shown in Figure 12.
Figure 12.
Mixed-target experimental scene and class-specific ground-truth masks. (a) False-color image of the mixed-target scene containing targets A, B, and C; (b) ground-truth mask for Target-A; (c) ground-truth mask for target B; (d) ground-truth mask for target C.
3.5.1. Experimental Results for Target-A
Figure 13 presents the binary segmentation results of different detection methods for target-A in the grassland background. In this scenario, the target region exhibits certain similarities to the grassland background in terms of brightness and local texture, while the background also contains a large number of irregular textures and local high-response regions, which easily lead to false detections. Although the conventional CEM, MF, OSP, and HCEM methods can enhance the target region to a certain extent, they still retain considerable non-target responses in the grassland background, manifested as large-area or scattered white false-alarm regions. Specifically, CEM and MF are relatively sensitive to background textures and tend to misclassify high-reflectance or high-response regions in the grassland as targets. OSP suppresses part of the background interference to some extent, but still suffers from incomplete target boundaries and residual local background responses. Compared with conventional CEM, HCEM shows a certain enhancement effect; however, it is still unable to completely eliminate non-target responses in the complex grassland background.
Figure 13.
Comparison of binary segmentation results for Target-A obtained by different detectors. (a) SPDB-ECEM; (b) E-CEM; (c) CEM; (d) MF; (e) OSP; and (f) HCEM.
In contrast, the proposed SPDB-ECEM method can extract the main body of Target-A more completely while effectively reducing false-alarm responses in the grassland background. Compared with E-CEM, SPDB-ECEM further reduces scattered false detections in the background while preserving the main target region. This indicates that, after introducing the spectral–polarimetric dual-branch collaborative mechanism, the detector can more fully exploit the complementary differences between the target and the background in spectral responses and polarimetric scattering characteristics, thereby improving the stability of target segmentation results under complex backgrounds.
Figure 14 further compares the detection results of different detectors under single-spectral and single-polarimetric input conditions. It can be observed that, when only spectral features are used, all methods can roughly localize the target regions, but varying degrees of scattered false alarms still occur in the grassland background. This indicates that although the selected spectral bands contain the main discriminative information, relying solely on spectral differences remains insufficient to completely suppress complex background interference. As shown in Figure 15, when only polarimetric features are used, background false alarms increase significantly for some methods, and the target regions become less stable. This suggests that the use of polarimetric features alone for target detection is easily affected by local textures, noise, and imaging conditions.
Figure 14.
Evaluation metric results for Target-A detection using different detectors.
Figure 15.
Comparison of Target-A detection results obtained by different detectors under single-spectral and single-polarimetric feature input conditions. (a) E-CEM-Spectral; (b) CEM-Spectral; (c) MF-Spectral; (d) OSP-Spectral; (e) HCEM-Spectral; (f) E-CEM-Polarimetric; (g) CEM-Polarimetric; (h) MF-Polarimetric; (i) OSP-Polarimetric; and (j) HCEM-Polarimetric.
3.5.2. Experimental Results for Target-B
Figure 16 shows the binary segmentation results of different detection methods in the Target-B scenario. In this scene, the target regions exhibit a certain degree of spatial separation, and the grassland background contains many irregular textures and local high-response regions, which easily lead to background false alarms. As shown in Figure 16, although methods such as CEM, MF, and HCEM are able to detect the main target bodies, they still retain considerable responses from other non-target regions, which appear as scattered white false-detection areas around the targets and near the image boundaries. The OSP method performs relatively better in background suppression; however, some target regions are missed, resulting in insufficient target integrity. In contrast, the proposed SPDB-ECEM method is able to extract the target regions more completely while effectively reducing scattered false alarms in the background, yielding segmentation results that are more consistent with the true target distribution. The corresponding quantitative results in Figure 17 further support these observations.
Figure 16.
Comparison of binary segmentation results for Target-B obtained by different detectors. (a) SPDB-ECEM; (b) E-CEM; (c) CEM; (d) MF; (e) OSP; and (f) HCEM.
Figure 17.
Evaluation metric results for Target-B detection using different detectors.
To further analyze the role of different modal information, Figure 18 shows the detection results under single-spectral and single-polarimetric feature input conditions. It can be observed that, when only spectral features are used, most methods can roughly localize the target regions, although certain background residues still remain. In contrast, when only polarimetric features are used, the stability of the detection results decreases significantly, and large-area false alarms occur in some methods. This indicates that, in the Target-B scenario, spectral information remains the main discriminative source for target detection, whereas polarimetric information alone is more susceptible to background textures and local noise. However, when polarimetric features are introduced as an auxiliary branch into the dual-branch framework, they can supplement the scattering-property differences between the target and the background, thereby improving the overall detection robustness. Taken together, Figure 16, Figure 17 and Figure 18 demonstrate that SPDB-ECEM achieves better target preservation and background suppression in the Target-B scenario.
Figure 18.
Comparison of Target-B detection results obtained by different detectors under single-spectral and single-polarimetric feature input conditions. (a) E-CEM-Spectral; (b) CEM-Spectral; (c) MF-Spectral; (d) OSP-Spectral; (e) HCEM-Spectral; (f) E-CEM-Polarimetric; (g) CEM-Polarimetric; (h) MF-Polarimetric; (i) OSP-Polarimetric; and (j) HCEM-Polarimetric.
3.5.3. Experimental Results for Target-C
Figure 19 shows the binary segmentation results of different detection methods in the Target-C scenario. Compared with Target-A and Target-B, Target-C has a relatively smooth surface and is more likely to produce directional reflection responses during imaging; therefore, its polarimetric features are relatively more prominent. The grassland background is mainly composed of rough and randomly distributed vegetation textures, whose reflection and scattering characteristics are complex and unstable. As a result, certain differences exist between Target-C and the grassland background in terms of surface roughness and polarimetric response. Therefore, this scenario can not only verify the role of spectral features in target detection, but is also more suitable for analyzing the auxiliary contribution of polarimetric information to target enhancement.
Figure 19.
Comparison of binary segmentation results for Target-C obtained by different detectors. (a) SPDB-ECEM; (b) E-CEM; (c) CEM; (d) MF; (e) OSP; and (f) HCEM.
E-CEM, CEM, MF, OSP, and HCEM can all extract the main region of Target-C to some extent; however, most methods still retain varying degrees of background false alarms around the target or near the image boundaries. Among them, CEM, MF, and HCEM are relatively sensitive to local high-response regions in the grassland background, resulting in obvious scattered white false-alarm regions in the segmentation results. OSP performs relatively better in background suppression, but still suffers from local target incompleteness or residual background responses. In contrast, the proposed SPDB-ECEM method can preserve the main body of Target-C more completely while effectively suppressing background false alarms, producing segmentation results that are closer to the true target regions. The corresponding quantitative comparison is presented in Figure 20.
Figure 20.
Evaluation metric results for Target-C detection using different detectors.
This result indicates that the auxiliary role of polarimetric information is more evident in the Target-C scenario. Because target C has a relatively smooth surface, polarimetric parameters such as , , and DoLP can better characterize the differences between the target and the grassland background in polarimetric scattering properties. In contrast, the polarimetric response of the grassland background is strongly affected by leaf orientation, local occlusion, and rough textures, leading to a more random spatial distribution. Therefore, the polarimetric branch can provide additional physical discriminative information for the spectral branch, making the target regions more concentrated in the fused response map and further reducing background interference.
Figure 21 further shows the detection results under single-spectral and single-polarimetric feature input conditions. It can be observed that, when only spectral features are used, all detectors can roughly localize the target regions, but they are still affected by locally similar spectral responses in the grassland background, resulting in certain false detections. When only polarimetric features are used, although some methods still suffer from unstable background responses, the polarimetric detection results for Target-C exhibit more obvious target directivity compared with the Target-A and Target-B scenarios. This indicates that, owing to its relatively smooth surface, Target-C has more representative and exploitable polarimetric features.
Figure 21.
Comparison of Target-C detection results obtained by different detectors under single-spectral and single-polarimetric feature input conditions. (a) E-CEM-Spectral; (b) CEM-Spectral; (c) MF-Spectral; (d) OSP-Spectral; (e) HCEM-Spectral; (f) E-CEM-Polarimetric; (g) CEM-Polarimetric; (h) MF-Polarimetric; (i) OSP-Polarimetric; and (j) HCEM-Polarimetric.
3.6. Ablation Study and Parameter Sensitivity
3.6.1. Component Ablation Study
To investigate the individual contributions of the key components in SPDB-ECEM, a comprehensive component-wise ablation study was conducted. During the experiments, the acquisition data, target priors, number of cascade layers, and other parameters were kept unchanged, and only the component under investigation was removed or replaced. Specifically, the following variants were considered: (1) w/o DPC, in which the DPC-selected bands were replaced by four uniformly sampled spectral bands while maintaining the same spectral dimensionality; (2) w/o DB, in which the spectral and polarimetric features were directly concatenated and processed using a single E-CEM branch; (3) w/o CG, in which the cross-branch response guidance was removed while retaining the independent spectral and polarimetric cascades; (4) w/o BS, in which the background-suppression term was disabled; (5) w/o LC, in which local consistency enhancement was removed; (6) w/o OC, in which the orthogonal-complement constraint was disabled; and (7) w/o RG, in which the reliability-gated fusion was replaced by equal-weight response fusion. In addition, conventional OTSU segmentation was used instead of t-OTSU to evaluate the contribution of the lower-bound threshold constraint.
The ablation results are summarized in Table 2. Replacing the dual-branch architecture with early feature fusion decreases from 0.921925 to 0.695306, confirming the advantage of independently modeling spectral and polarimetric information. Removing cross-branch guidance, background suppression, local consistency enhancement, or reliability-gated fusion also results in performance degradation to varying degrees, indicating that these components contribute to collaborative feature enhancement and false-alarm suppression. In particular, removing background suppression increases from 0.006225 to 0.017645, while replacing t-OTSU with conventional OTSU further increases to 0.085378 and reduces to 0.566624. Overall, the full SPDB-ECEM achieves the best comprehensive performance, demonstrating the complementary contribution of the proposed components.
Table 2.
Component-wise ablation results of SPDB-ECEM.
3.6.2. Sensitivity to the Number of Cascade Layers
To verify the influence of the cascaded structure on detection performance and determine a reasonable number of cascade layers in SPDB-ECEM, a layer-sensitivity ablation experiment was conducted for the detection of Target-B using the Mixed-Target-Scenario data. In the experiment, the band input, polarimetric features, threshold segmentation strategy, and other parameters were kept unchanged, and only the number of dual-branch cascade layers was varied.
As shown in Table 3, when the number of cascade layers increases from 1 to 3, the overall detection performance is significantly improved. Specifically, the score increases from 0.8374 to 0.8738, increases from 0.9693 to 0.9786, and decreases to 0.0171. This indicates that an appropriate increase in the number of cascade layers helps progressively enhance target responses and suppress part of the interference responses in the complex grassland background. When the number of cascade layers is further increased to 5 and 8, decreases slightly, but and do not continue to improve; instead, they become slightly lower than those obtained with the three-layer structure. This suggests that an excessively deep cascaded structure can further suppress some background false alarms, but may also weaken target boundaries or local weak-response regions, resulting in limited improvement or even a certain loss of target integrity. Considering detection accuracy, target integrity, and computational complexity, a three-layer cascaded structure is finally adopted as the default setting of SPDB-ECEM in this study.
Table 3.
Detection performance of SPDB-ECEM with different numbers of cascade layers.
3.6.3. Effect of the Number of Selected Spectral Bands
To evaluate the influence of spectral dimensionality on detection performance, the highest-ranked bands obtained by DPC were progressively selected to construct spectral inputs with different numbers of bands. During the experiment, all other parameters were kept unchanged. The results are summarized in Table 4, and the corresponding binary detection results are shown in Figure 22.
Table 4.
Effect of the number of DPC-selected spectral bands on detection performance in the single-class multi-instance scenario.
Figure 22.
Binary detection results obtained using different numbers of DPC-selected spectral bands. (a) ; (b) ; (c) ; and (d) .
The results in Table 4 show that increasing the number of selected bands from 2 to 4 substantially improves detection performance. increases from 0.621368 to 0.923198, accompanied by a clear reduction in . Further increasing the number of bands to 5 produces only marginal improvement, with increasing by 0.009908. Therefore, four bands are selected as a reasonable compromise between detection performance and spectral dimensionality.
3.6.4. Effect and Sensitivity of the t-OTSU Threshold
As shown in Figure 23, to evaluate the influence of the lower-bound threshold in t-OTSU, a sensitivity analysis was performed by varying while keeping the other parameters unchanged. As increases, background false alarms are progressively suppressed, resulting in a continuous decrease in . Meanwhile, the score increases from 0.648866 at to 0.915963 at , indicating improved balance between target preservation and false-alarm suppression.
Figure 23.
Sensitivity of the detection performance to the lower-bound threshold t in t-OTSU.
When is further increased to 0.80, decreases to 0.005510 and reaches 0.990541, while remains at a comparable level of 0.912728. However, increasing to 0.85 causes to decrease to 0.884751, suggesting that an excessively high threshold may suppress weak target responses. Therefore, was selected in this experiment as a suitable compromise between false-alarm suppression and target preservation. These results indicate that t-OTSU effectively improves the robustness of the final segmentation, while its threshold should be maintained within an appropriate range.
3.6.5. Quantitative Analysis of Spectral–Polarimetric Complementarity
To quantitatively evaluate the complementary contribution of spectral and polarimetric information, the target–background separability of different intermediate responses was analyzed in the single-target scenario. Specifically, the aggregated spectral-branch response , the enhanced polarimetric-branch response , and the final reliability-gated fused response were directly evaluated before threshold segmentation. This avoids the influence of t-OTSU and enables the intrinsic discrimination capability of the response maps to be assessed independently. The corresponding spectral-branch, polarimetric-branch, and reliability-gated fused response maps are shown in Figure 24.
Figure 24.
Binary detection results obtained from different branch responses in the single-target scenario. (a) Spectral-branch response; (b) polarimetric-branch response; (c) reliability-gated fused response.
The target–background separability is quantified using the following index:
where and denote the mean response values of the target and background regions, respectively, and and denote the corresponding standard deviations. is a small positive constant introduced to avoid numerical instability. A larger indicates a larger inter-class difference and lower intra-class dispersion, and therefore represents stronger target–background separability.
As shown in Table 5, the spectral-branch and polarimetric-branch responses achieve values of 6.371 and 6.085, respectively, indicating that the two branches provide comparable target–background discrimination capability while retaining different response characteristics. After cross-branch collaboration and reliability-gated fusion, increases substantially to 9.954. Compared with the spectral-branch and polarimetric-branch responses, the target–background separability of the fused response is improved by approximately 56.24% and 63.59%, respectively.
Table 5.
Target–background separability of different response maps in the single-target scenario.
The response statistics further show that the fused response increases the mean target response from 219.321 and 220.139 to 232.262, while reducing the target-region standard deviation to 24.073. This indicates that the fusion process not only strengthens the target response but also improves its intra-region consistency. Although the spectral and polarimetric branches exhibit different background-response distributions, their complementary information is effectively exploited through cross-branch interaction and adaptive fusion, resulting in substantially enhanced target–background separability.
These quantitative results demonstrate that the spectral and polarimetric branches provide complementary discrimination information and that SPDB-ECEM effectively exploits this complementarity to improve the separability of the final detection response.
4. Discussion
The three target scenarios present different detection challenges and therefore provide complementary validation of the proposed framework. For Target-A, the main difficulty is the spectral similarity between the target and the surrounding grassland, which mainly tests the target–background discrimination capability of the detector. For Target-B, the coexistence of other target materials introduces stronger inter-class interference, making class-specific discrimination more important. In contrast, Target-C exhibits more pronounced polarimetric characteristics because of its relatively smooth surface, allowing the complementary contribution of the polarimetric branch to be more clearly observed. These scenario-dependent results indicate that the performance advantage of SPDB-ECEM does not arise from a single type of feature contrast, but from its ability to exploit different spectral and polarimetric cues according to the characteristics of the target and background.
The experimental results demonstrate that the proposed spectral–polarimetric dual-branch detection framework exhibits good target enhancement and region extraction capability under complex background conditions. Compared with traditional single-spectral detection methods, the proposed method can effectively suppress certain background interference regions while preserving the integrity of the main target body, indicating that polarimetric and spectral information are complementary to some extent. Overall, the proposed method can produce more stable detection outputs in scenarios involving complex backgrounds, weakly salient targets, and partial representational overlap between targets and backgrounds.
From the perspective of the methodological mechanism, the performance improvement of the proposed method mainly originates from three aspects. First, DPC-based band selection effectively reduces redundant information in the original multiband data, enabling the subsequent detector to make more concentrated use of representative spectral features. In multispectral target detection tasks, excessive redundant bands not only increase computational complexity but may also weaken the representation of key discriminative information. The four selected bands used in this study preserve the main spectral differences between the targets and background at a relatively low dimensionality. Second, the SPDB-ECEM framework models spectral and polarimetric features separately, avoiding the statistical distribution mixing caused by direct concatenation of heterogeneous features, so that the two types of information can function in their respective suitable feature spaces. The spectral branch mainly enhances the reflectance-response differences between targets and the background, whereas the polarimetric branch supplements the characterization of differences in material scattering and physical properties. After response-level fusion, the saliency of the target regions can be further improved. Finally, while retaining the adaptive thresholding advantage of OTSU, the t-OTSU segmentation strategy improves the suppression capability against background false-alarm regions through a lower-bound threshold constraint, resulting in a more stable final target mask.
For scenarios where the spectral difference between the target and the background is relatively obvious, the spectral branch usually serves as the main contributor, whereas the polarimetric branch mainly provides auxiliary constraints and helps suppress background false alarms. For scenarios where the target and background are similar in brightness and texture but differ in polarimetric scattering characteristics, the polarimetric branch can provide additional discriminative information, thereby enhancing the physical separability between the target and the background. This indicates that the proposed method does not simply stack the two types of information, but instead achieves differentiated collaborative enhancement under different scene conditions. In other words, the significance of the dual-branch structure lies in preserving the respective advantages of spectral and polarimetric information and realizing their complementarity at the response level.
Overall, the proposed method provides an effective technical route for spectral–polarimetric joint target detection under complex background conditions. Its advantages are reflected not only in target saliency enhancement, but also in the stability of region-level outputs and the relatively low background false alarm rate. In particular, the proposed method demonstrates good adaptability in complex grassland backgrounds with significant texture fluctuations and unclear boundaries of camouflaged targets. Future work can be carried out in the following directions. First, more adaptive branch weighting and response fusion strategies can be introduced to improve the adaptability of the method to different target types and background conditions. Second, segmentation methods incorporating spatial priors can be explored to further enhance target boundary recovery. Third, more experimental scenarios and target samples can be expanded to verify the generalization performance of the proposed method under broader application conditions.
5. Conclusions
To address the problem of unstable camouflaged target detection under complex background conditions, this paper proposes a target enhancement and segmentation method based on the collaborative processing of spectral–polarimetric heterogeneous information. The proposed method is designed for multispectral images and four-directional polarimetric images acquired at a single band, and establishes a complete processing pipeline of “DPC-based band selection, SPDB-ECEM, and t-OTSU segmentation.” In this way, a unified detection framework from multi-source heterogeneous feature input to target-region mask output is achieved.
First, to address the high band redundancy and dispersed discriminative information in the original multispectral data, density peak clustering (DPC) is adopted to select four representative feature bands from the original multiband data. This reduces the input dimensionality while preserving the key spectral information required for target recognition. Second, a spectral–polarimetric dual-branch E-CEM framework, termed SPDB-ECEM, is constructed. The spectral branch extracts the spectral response differences between targets and the background, whereas the polarimetric branch uses , , and DoLP to characterize the physical differences between targets and the background in terms of polarimetric scattering properties. A high-contrast target enhancement map is then obtained through dual-branch response fusion. Finally, t-OTSU is applied to convert the enhanced response map into a binary target mask, thereby completing target-region extraction under complex background conditions.
Experimental results demonstrate that the proposed method can effectively improve target saliency, enhance target boundary separability, and achieve a good balance between false alarm suppression and target preservation in typical scenarios. Compared with traditional single-spectral detection methods, the proposed method shows better overall performance in terms of , , and , verifying the effectiveness of the collaborative utilization of spectral and polarimetric information for target detection under complex backgrounds. Meanwhile, the results also indicate that DPC-based band selection, the dual-branch structure, and the t-OTSU segmentation strategy all contribute positively to the improvement of final detection performance.
Overall, the proposed spectral–polarimetric joint detection framework provides a feasible and effective technical approach for camouflaged target detection under complex background conditions. Future work will further focus on adaptive fusion strategies, spatially constrained segmentation methods, and multi-scenario generalization capability, so as to continuously improve the robustness and application potential of the proposed method.
Nevertheless, the current study still has several limitations. The experiments are mainly conducted in complex grassland backgrounds and involve a limited number of target materials, so the generalization capability of the proposed method in other background types requires further validation. Future work will focus on broader multi-scene validation, adaptive parameter estimation, and improving the robustness of spectral–polarimetric collaborative detection under varying observation conditions.
Author Contributions
Conceptualization, H.W. and Y.T.; methodology, H.W.; software, H.W.; validation, H.W., Y.Z. and J.W.; formal analysis, H.W.; investigation, H.W., Y.Z. and J.W.; resources, Y.T.; data curation, H.W.; writing—original draft preparation, H.W.; writing—review and editing, Y.T., Y.Z. and J.W.; visualization, H.W.; supervision, Y.T.; project administration, Y.T.; funding acquisition, Y.T. All authors have read and agreed to the published version of the manuscript.
Funding
This work was financially supported by the Key Research and Development Program of the Science and Technology Development Plan of Jilin Province, China (No. 20260201028GX).
Data Availability Statement
The data supporting the findings of this study are available from the corresponding author upon reasonable request.
Conflicts of Interest
The authors declare no conflicts of interest.
References
- Chen, B.; Liu, L.; Zou, Z.; Shi, Z. Target detection in hyperspectral remote sensing image: Current status and challenges. Remote Sens. 2023, 15, 3223. [Google Scholar] [CrossRef] [Scilit]
- Raina, S.; Kaul, A. Hyperspectral imaging and target detection algorithms: A review. Multimed. Tools Appl. 2022, 81, 44141–44206. [Google Scholar] [CrossRef] [Scilit]
- Jha, S.S.; Nidamanuri, R.R.; Ientilucci, E.J. Influence of atmospheric modeling on spectral target detection through forward modeling approach in multi-platform remote sensing data. ISPRS J. Photogramm. Remote Sens. 2022, 183, 286–306. [Google Scholar] [CrossRef] [Scilit]
- Chang, C.-I.; Liu, J.-M.; Chieu, B.-C.; Ren, H.; Wang, C.-M.; Lo, C.-S.; Chung, P.-C.; Yang, C.-W.; Ma, D.-J. Generalized constrained energy minimization approach to subpixel target detection for multispectral imagery. Opt. Eng. 2000, 39, 1275–1281. [Google Scholar] [CrossRef] [Scilit]
- Manolakis, D.; Siracusa, C.; Shaw, G. Hyperspectral subpixel target detection using the linear mixing model. IEEE Trans. Geosci. Remote Sens. 2001, 39, 1392–1409. [Google Scholar] [CrossRef] [Scilit]
- Kraut, S.; Scharf, L.L.; Butler, R.W. The adaptive coherence estimator: A uniformly most-powerful-invariant adaptive detection statistic. IEEE Trans. Signal Process. 2005, 53, 427–438. [Google Scholar] [CrossRef] [Scilit]
- Chang, C.-I. Constrained energy minimization (CEM) for hyperspectral target detection: Theory and generalizations. IEEE Trans. Geosci. Remote Sens. 2024, 62, 1–21. [Google Scholar] [CrossRef] [Scilit]
- Zhao, R.; Shi, Z.; Zou, Z.; Zhang, Z. Ensemble-based cascaded constrained energy minimization for hyperspectral target detection. Remote Sens. 2019, 11, 1310. [Google Scholar] [CrossRef] [Scilit]
- Zhao, X.; Hou, Z.; Wu, X.; Li, W.; Ma, P.; Tao, R. Hyperspectral target detection based on transform domain adaptive constrained energy minimization. Int. J. Appl. Earth Obs. Geoinf. 2021, 101, 102346. [Google Scholar] [CrossRef] [Scilit]
- Zhu, L.; Wang, L.; Ji, L.; Yang, W.; Geng, X. Multiple targets inequality constrained energy minimization for multispectral imagery. Infrared Phys. Technol. 2020, 110, 103465. [Google Scholar] [CrossRef] [Scilit]
- Rodriguez, A.; Laio, A. Clustering by fast search and find of density peaks. Science 2014, 344, 1492–1496. [Google Scholar] [CrossRef] [Scilit]
- Chang, C.-I.; Kuo, Y.-M.; Ma, K.-Y. Band selection via band density prominence clustering for hyperspectral image classification. Remote Sens. 2024, 16, 942. [Google Scholar] [CrossRef] [Scilit]
- You, M.; Meng, X.; Wang, Y.; Jin, H.; Zhai, C.; Yuan, A. Hyperspectral band selection via band grouping and adaptive multi-graph constraint. Remote Sens. 2022, 14, 4379. [Google Scholar] [CrossRef] [Scilit]
- Sun, H.; Zhang, L.; Ren, J.; Huang, H. Novel hyperbolic clustering-based band hierarchy for effective unsupervised band selection of hyperspectral images. Pattern Recognit. 2022, 130, 108788. [Google Scholar] [CrossRef] [Scilit]
- Kumar, B.L.N.P.; Vaddi, R.; Manoharan, P.; Agilandeeswari, L.; Sangeetha, V. A new band selection framework for hyperspectral remote sensing image classification. Sci. Rep. 2024, 14, 31836. [Google Scholar] [CrossRef] [Scilit]
- Hu, T.; Guo, X.; Gao, P. Hyperspectral band selection method based on global partition clustering. Remote Sens. 2025, 17, 435. [Google Scholar] [CrossRef] [Scilit]
- Yang, J.X.; Zhou, J.; Wang, J.; Tian, H.; Liew, A.W.-C. LiDAR-guided cross-attention fusion for hyperspectral band selection and image classification. IEEE Trans. Geosci. Remote Sens. 2024, 62, 1–15. [Google Scholar] [CrossRef] [Scilit]
- Otsu, N. A threshold selection method from gray-level histograms. IEEE Trans. Syst. Man Cybern. 1979, 9, 62–66. [Google Scholar] [CrossRef] [Scilit]
- Li, X.; Yan, L.; Qi, P.; Zhang, L.; Goudail, F.; Liu, T.; Zhai, J.; Hu, H. Polarimetric imaging via deep learning: A review. Remote Sens. 2023, 15, 1540. [Google Scholar] [CrossRef] [Scilit]
- Yang, K.; Liu, F.; Liang, S.; Xiang, M.; Han, P.; Liu, J.; Dong, X.; Wei, Y.; Wang, B.; Shimizu, K.; et al. Data-driven polarimetric imaging: A review. Opto-Electron. Sci. 2024, 3, 230042. [Google Scholar] [CrossRef] [Scilit]
- Karim, S.; Tong, G.; Li, J.; Qadir, A.; Farooq, U.; Yu, Y. Current advances and future perspectives of image fusion: A comprehensive review. Inf. Fusion 2023, 90, 185–217. [Google Scholar] [CrossRef] [Scilit]
- Gao, S.; Cao, Y.; Zhang, W.; Dai, Q.; Li, J.; Xu, X. Learning feature fusion for target detection based on polarimetric imaging. Appl. Opt. 2022, 61, D15–D21. [Google Scholar] [CrossRef] [Scilit]
- Wang, X.; Zhang, Z.; Gao, J. Polarization-based camouflaged object detection. Pattern Recognit. Lett. 2023, 174, 106–111. [Google Scholar] [CrossRef] [Scilit]
- Wang, X.; Ding, J.; Zhang, Z.; Xu, J.; Gao, J. IPNet: Polarization-based camouflaged object detection via dual-flow network. Eng. Appl. Artif. Intell. 2024, 127, 107303. [Google Scholar] [CrossRef] [Scilit]
- Zhang, X.; Ru, J.; Wang, Y.; Wu, C. Polarization-driven camouflaged object detection: A multimodal fusion network with iterative polarimetric feature enhancement. Appl. Opt. 2025, 64, 7899–7913. [Google Scholar] [CrossRef] [Scilit]
- Feng, B.; Xiao, J.; Zhang, J.; Li, L.; Wu, Y.; Ye, Q. Color-polarization synergistic target detection method considering shadow interference. Def. Technol. 2024, 37, 50–61. [Google Scholar] [CrossRef] [Scilit]
- Guo, F.; Zhu, J.; Huang, L.; Li, F.; Zhang, N.; Deng, J.; Li, H.; Zhang, X.; Zhao, Y.; Jiang, H.; et al. Multi-Dimensional Fusion of Spectral and Polarimetric Images Followed by Pseudo-Color Algorithm Integration and Mapping in HSI Space. Remote Sens. 2024, 16, 1119. [Google Scholar] [CrossRef] [Scilit]
- Tong, G.; Yao, X.; Li, B.; Fu, J.; Wang, Y.; Hao, J.; Karim, S.; Yu, Y. MSPFusion: A feature transformer for multidimensional spectral-polarization image fusion. Expert Syst. Appl. 2025, 275, 127079. [Google Scholar] [CrossRef] [Scilit]
- Dong, X.; Lan, Y.; Zhao, Z.; Cai, C.; Zhou, Z.; Zhang, T.; Han, P.; Xiang, M.; Liu, J.; Xie, P.; et al. Target detection enhancement method through multi-dimensional information differential projection and fusion. Opt. Express 2025, 33, 21116–21131. [Google Scholar] [CrossRef] [Scilit]
- Yan, L.; Cao, Y.; Li, H. Measurement and multi-channel fusion method of polarization hyperspectral for camouflage targets. Appl. Opt. 2025, 64, 8952–8960. [Google Scholar] [CrossRef] [Scilit]
- Li, H.-L.; Chen, S.-W. General Polarimetric Correlation Pattern: A Visualization and Characterization Tool for Target Joint-Domain Scattering Mechanisms Investigation. IEEE Trans. Geosci. Remote Sens. 2026, 64, 5200417. [Google Scholar] [CrossRef] [Scilit]
- Li, H.-L.; Hu, Y.-S.; Chen, S.-W. SMEN: Scattering Mechanism Embedded Network for Polarimetric Radar Corner Reflector Array Identification. IEEE Trans. Aerosp. Electron. Syst. 2026, 62, 16728–16744. [Google Scholar] [CrossRef] [Scilit]
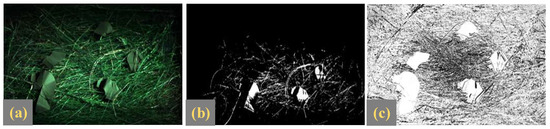
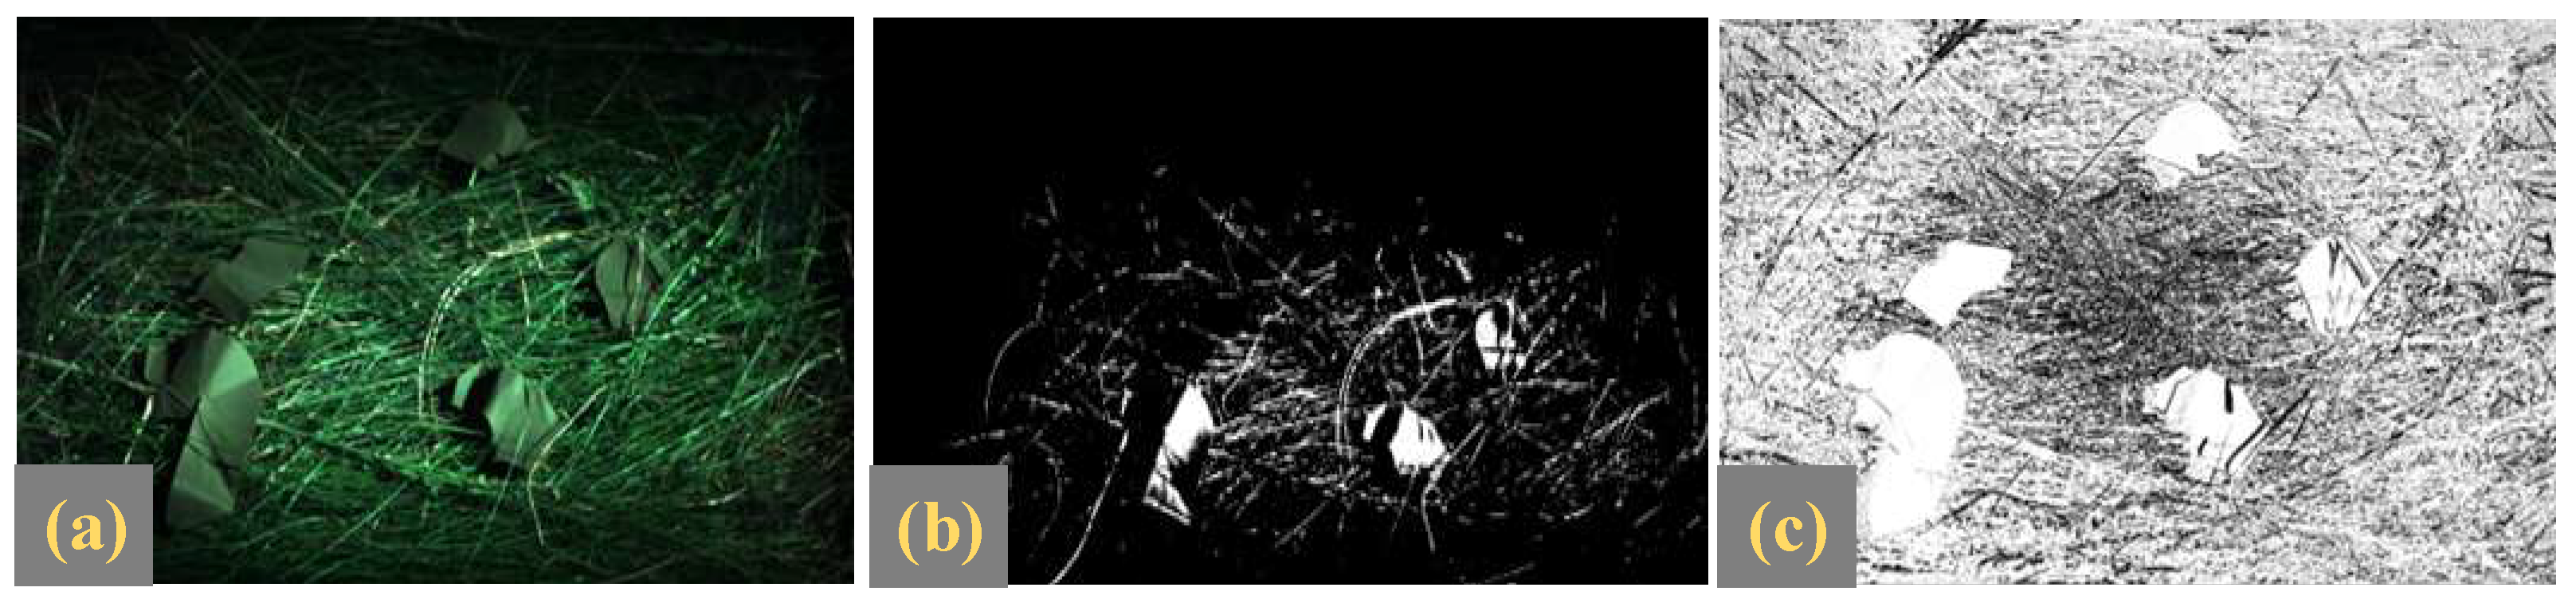
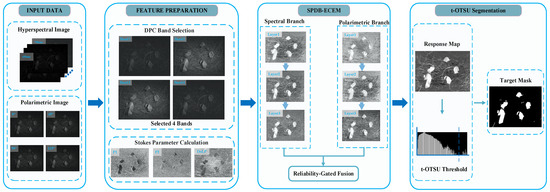
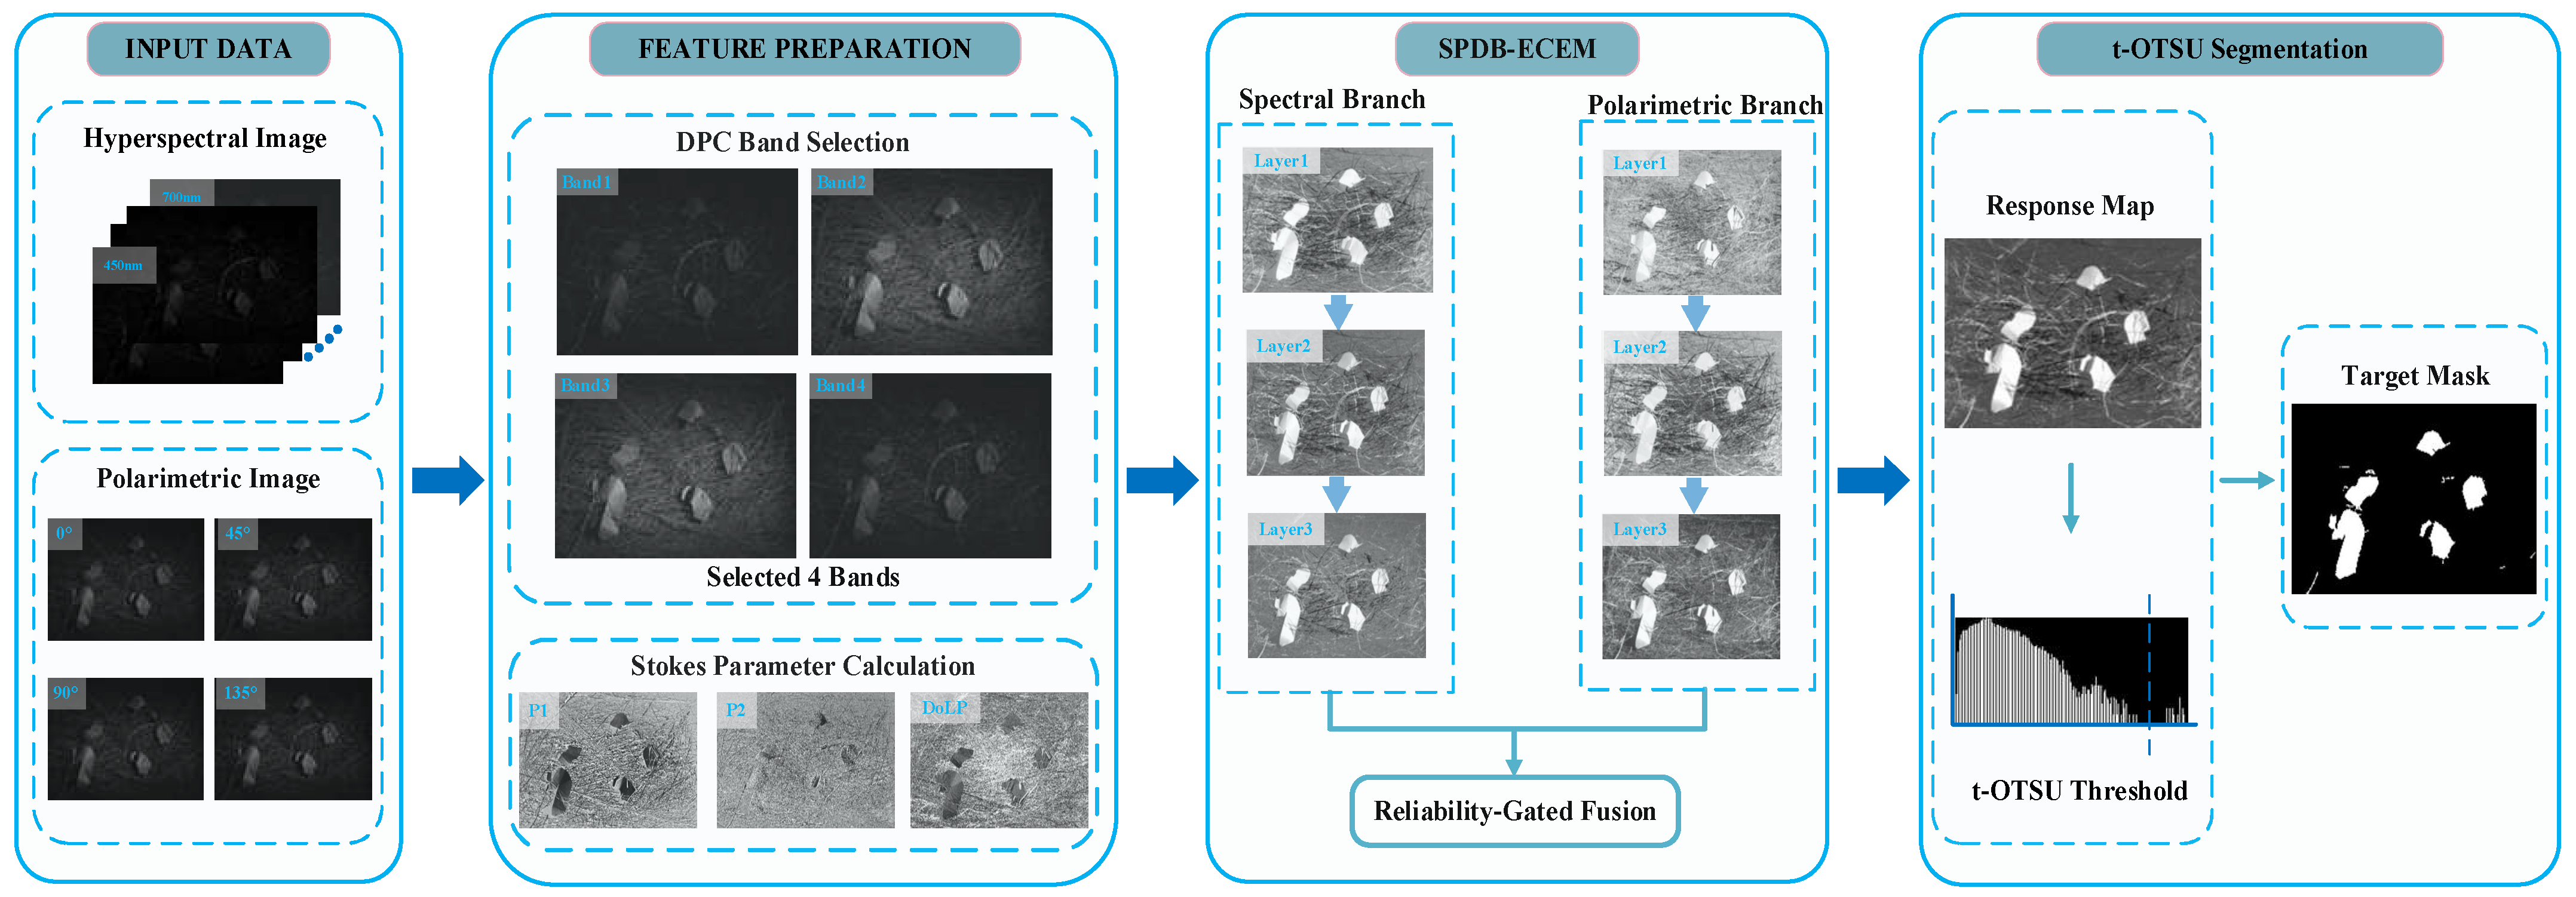
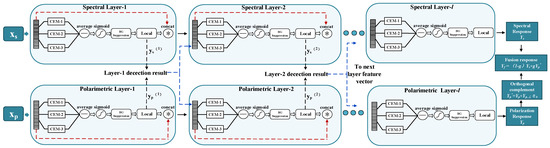
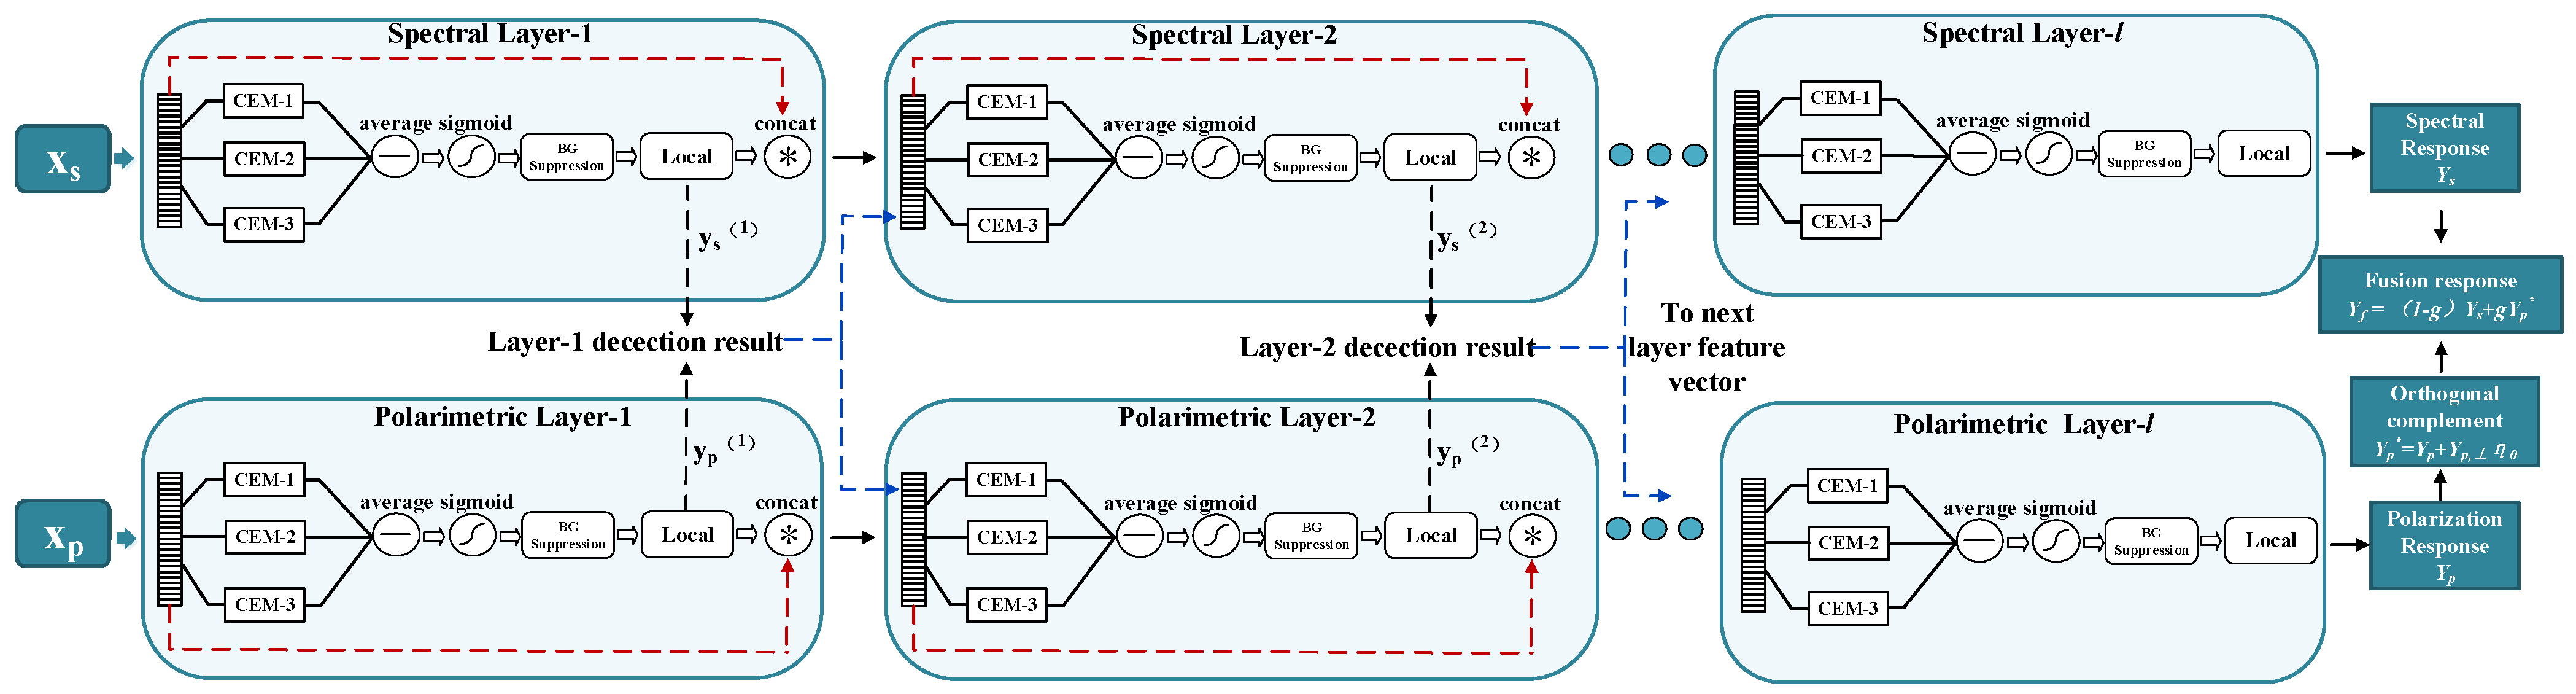


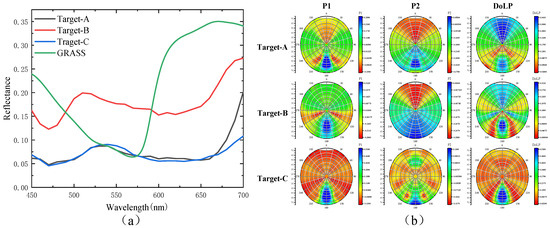
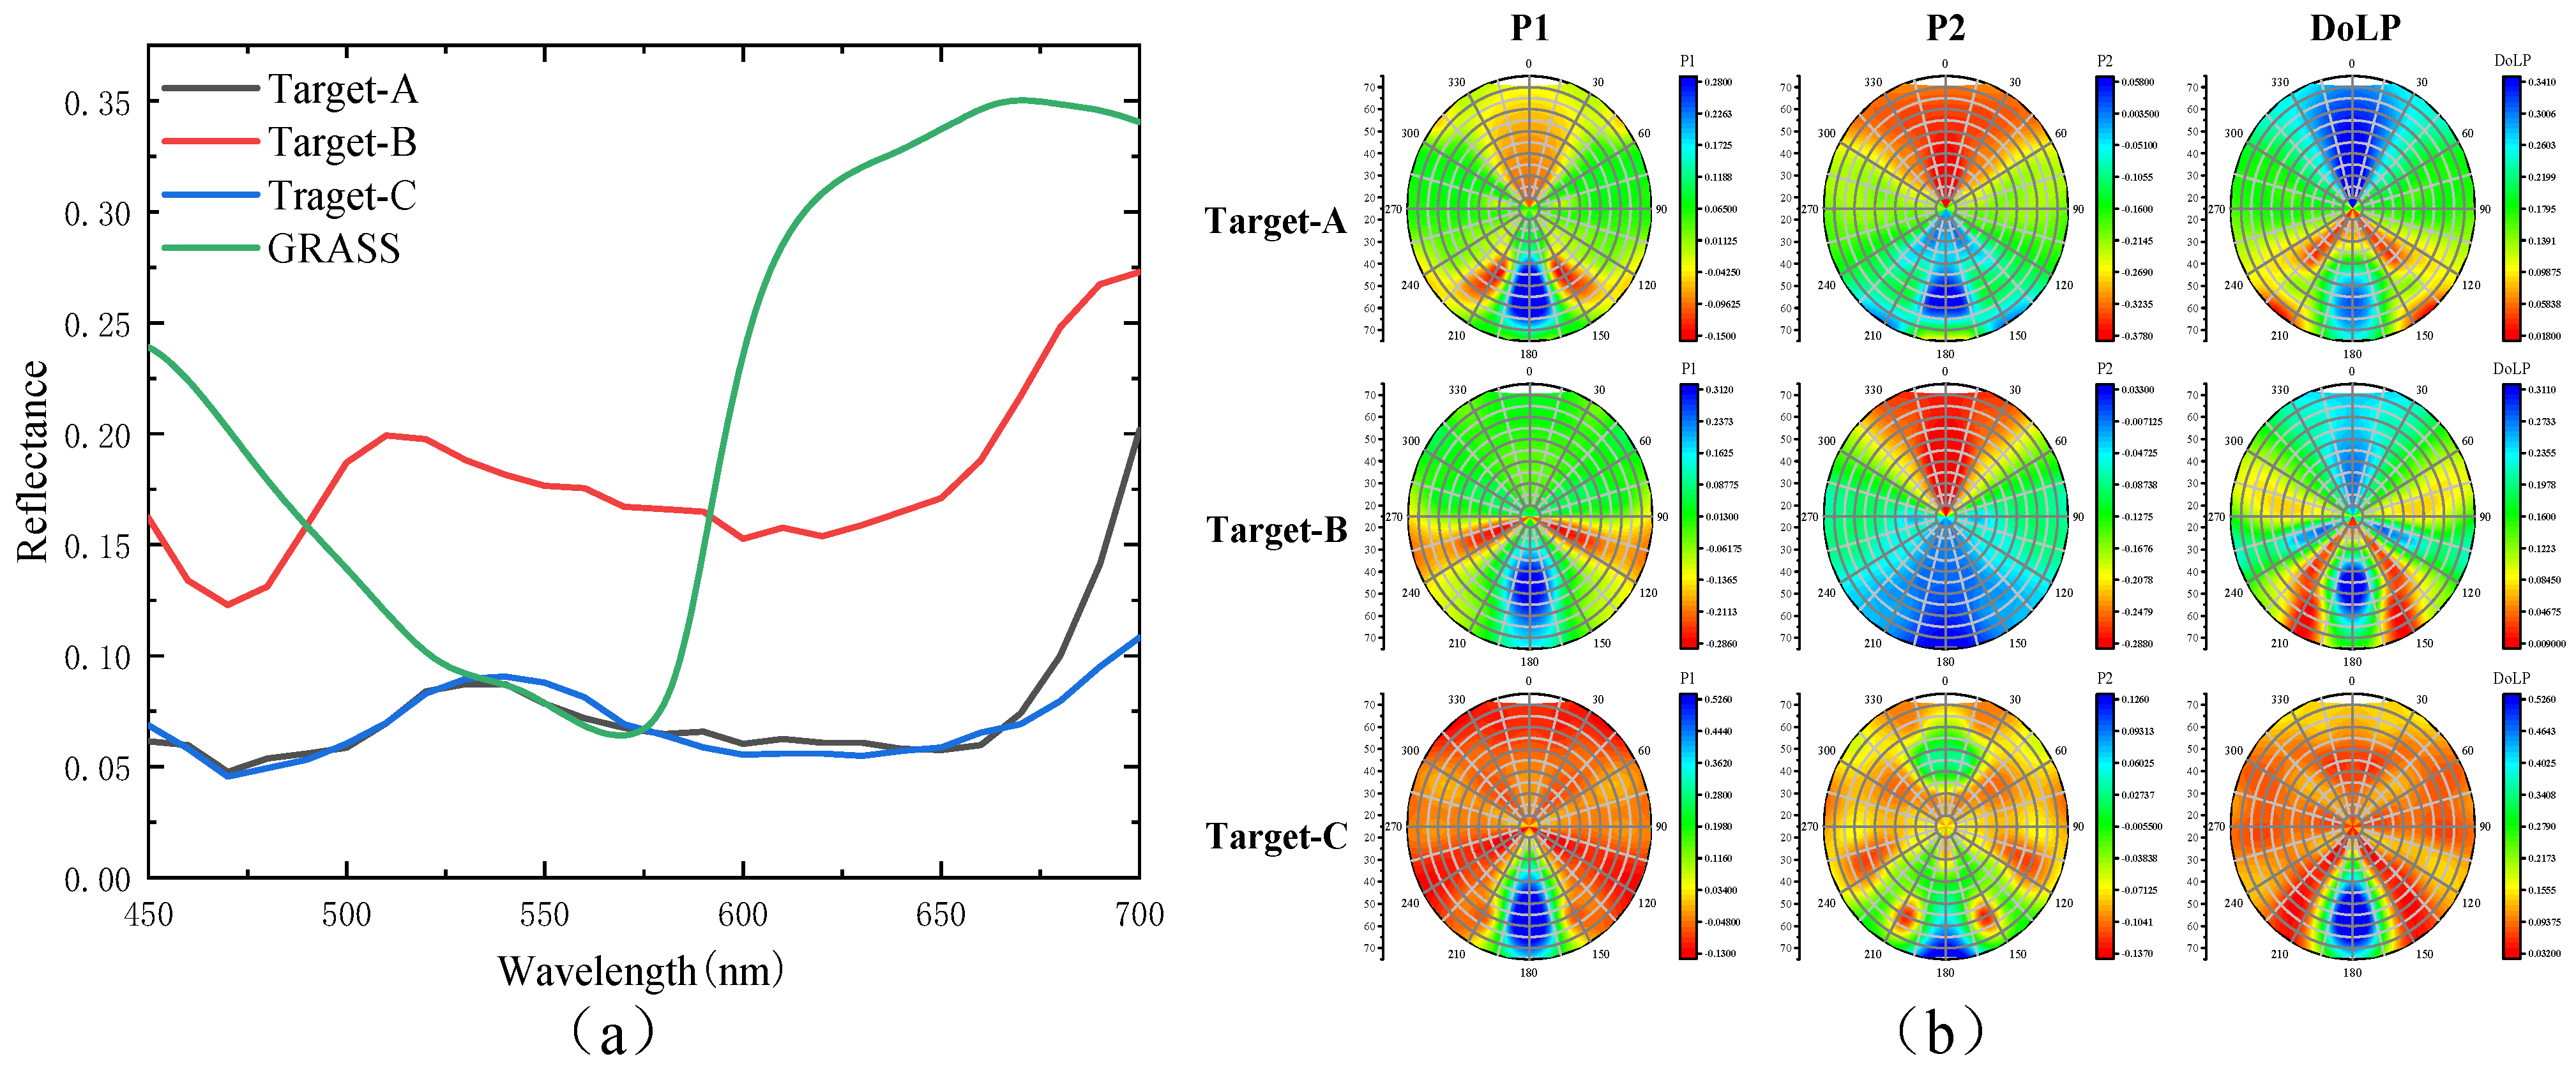
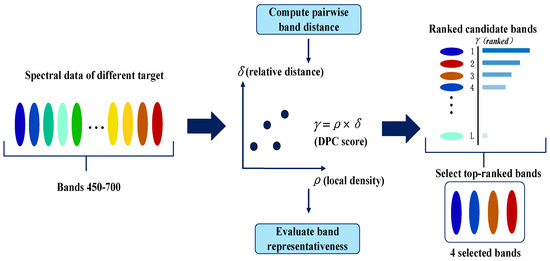
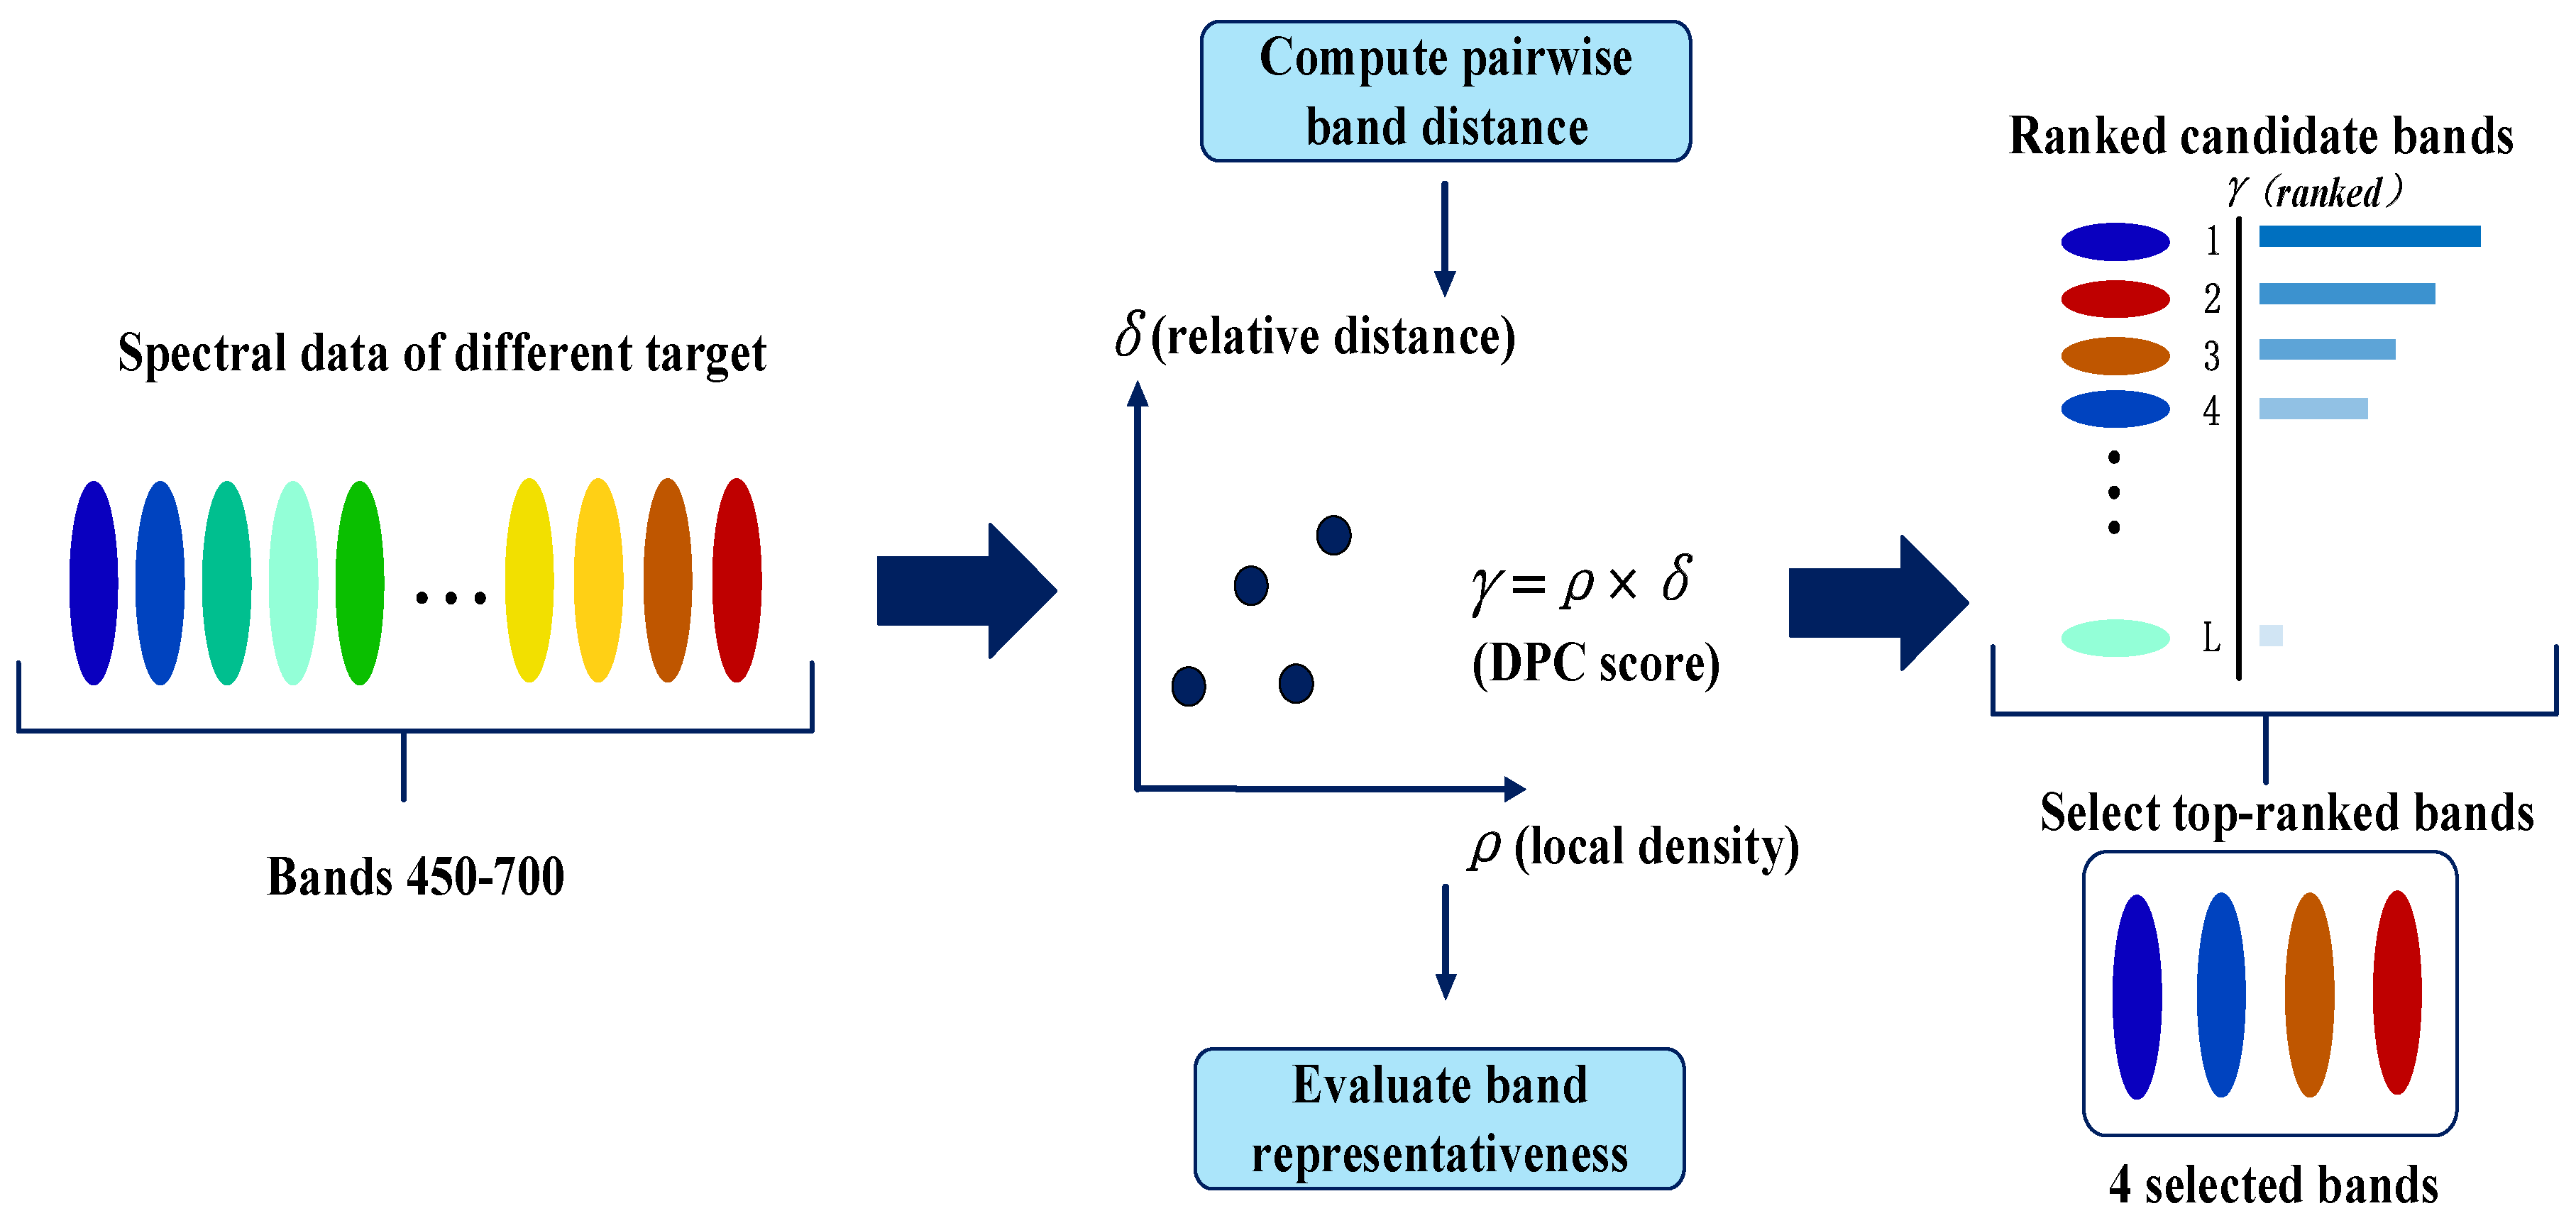
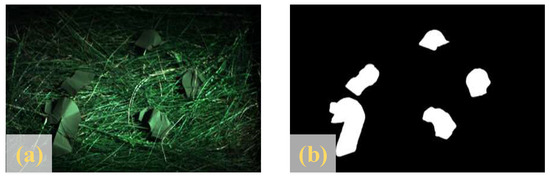
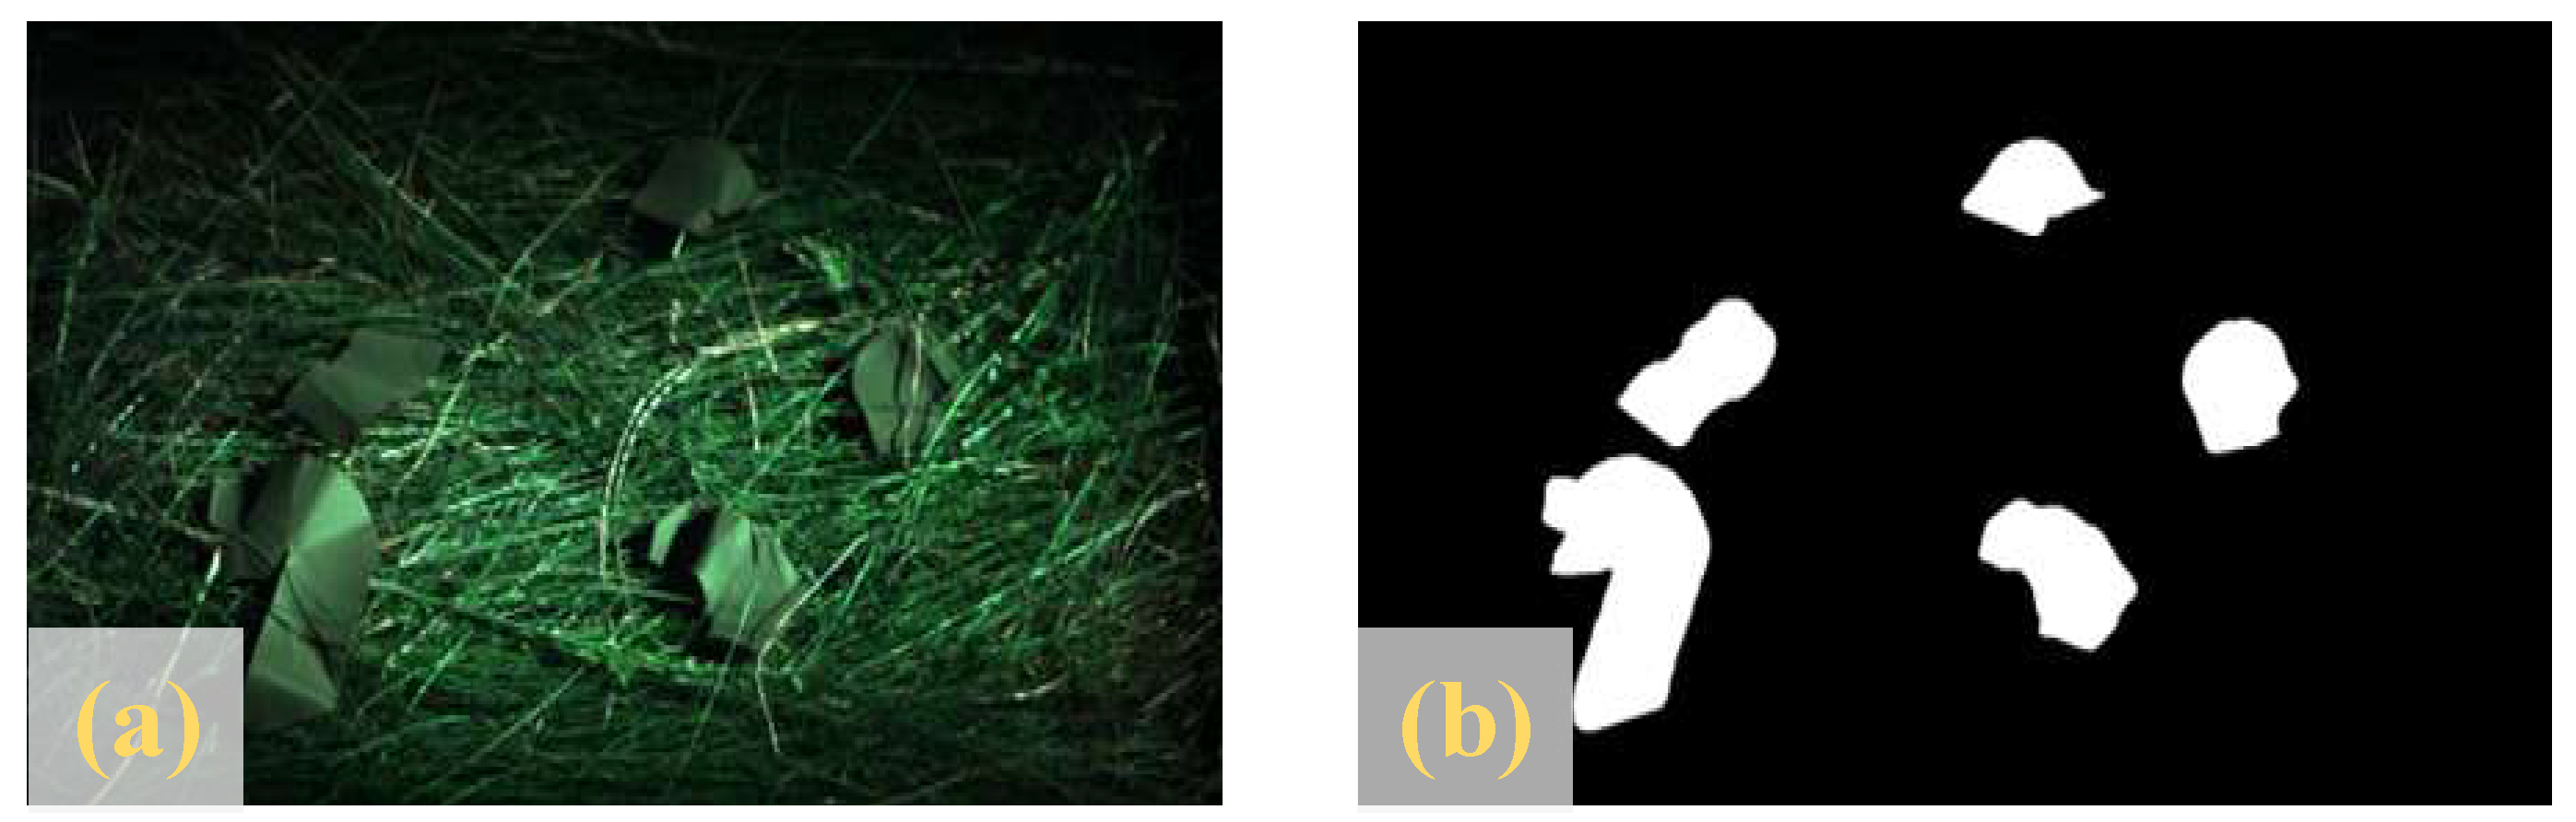
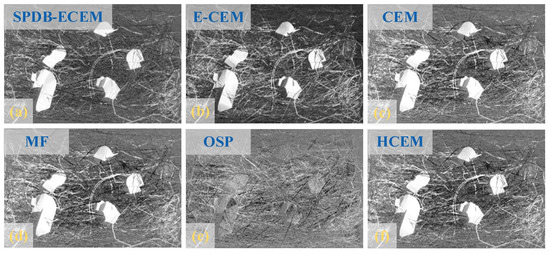
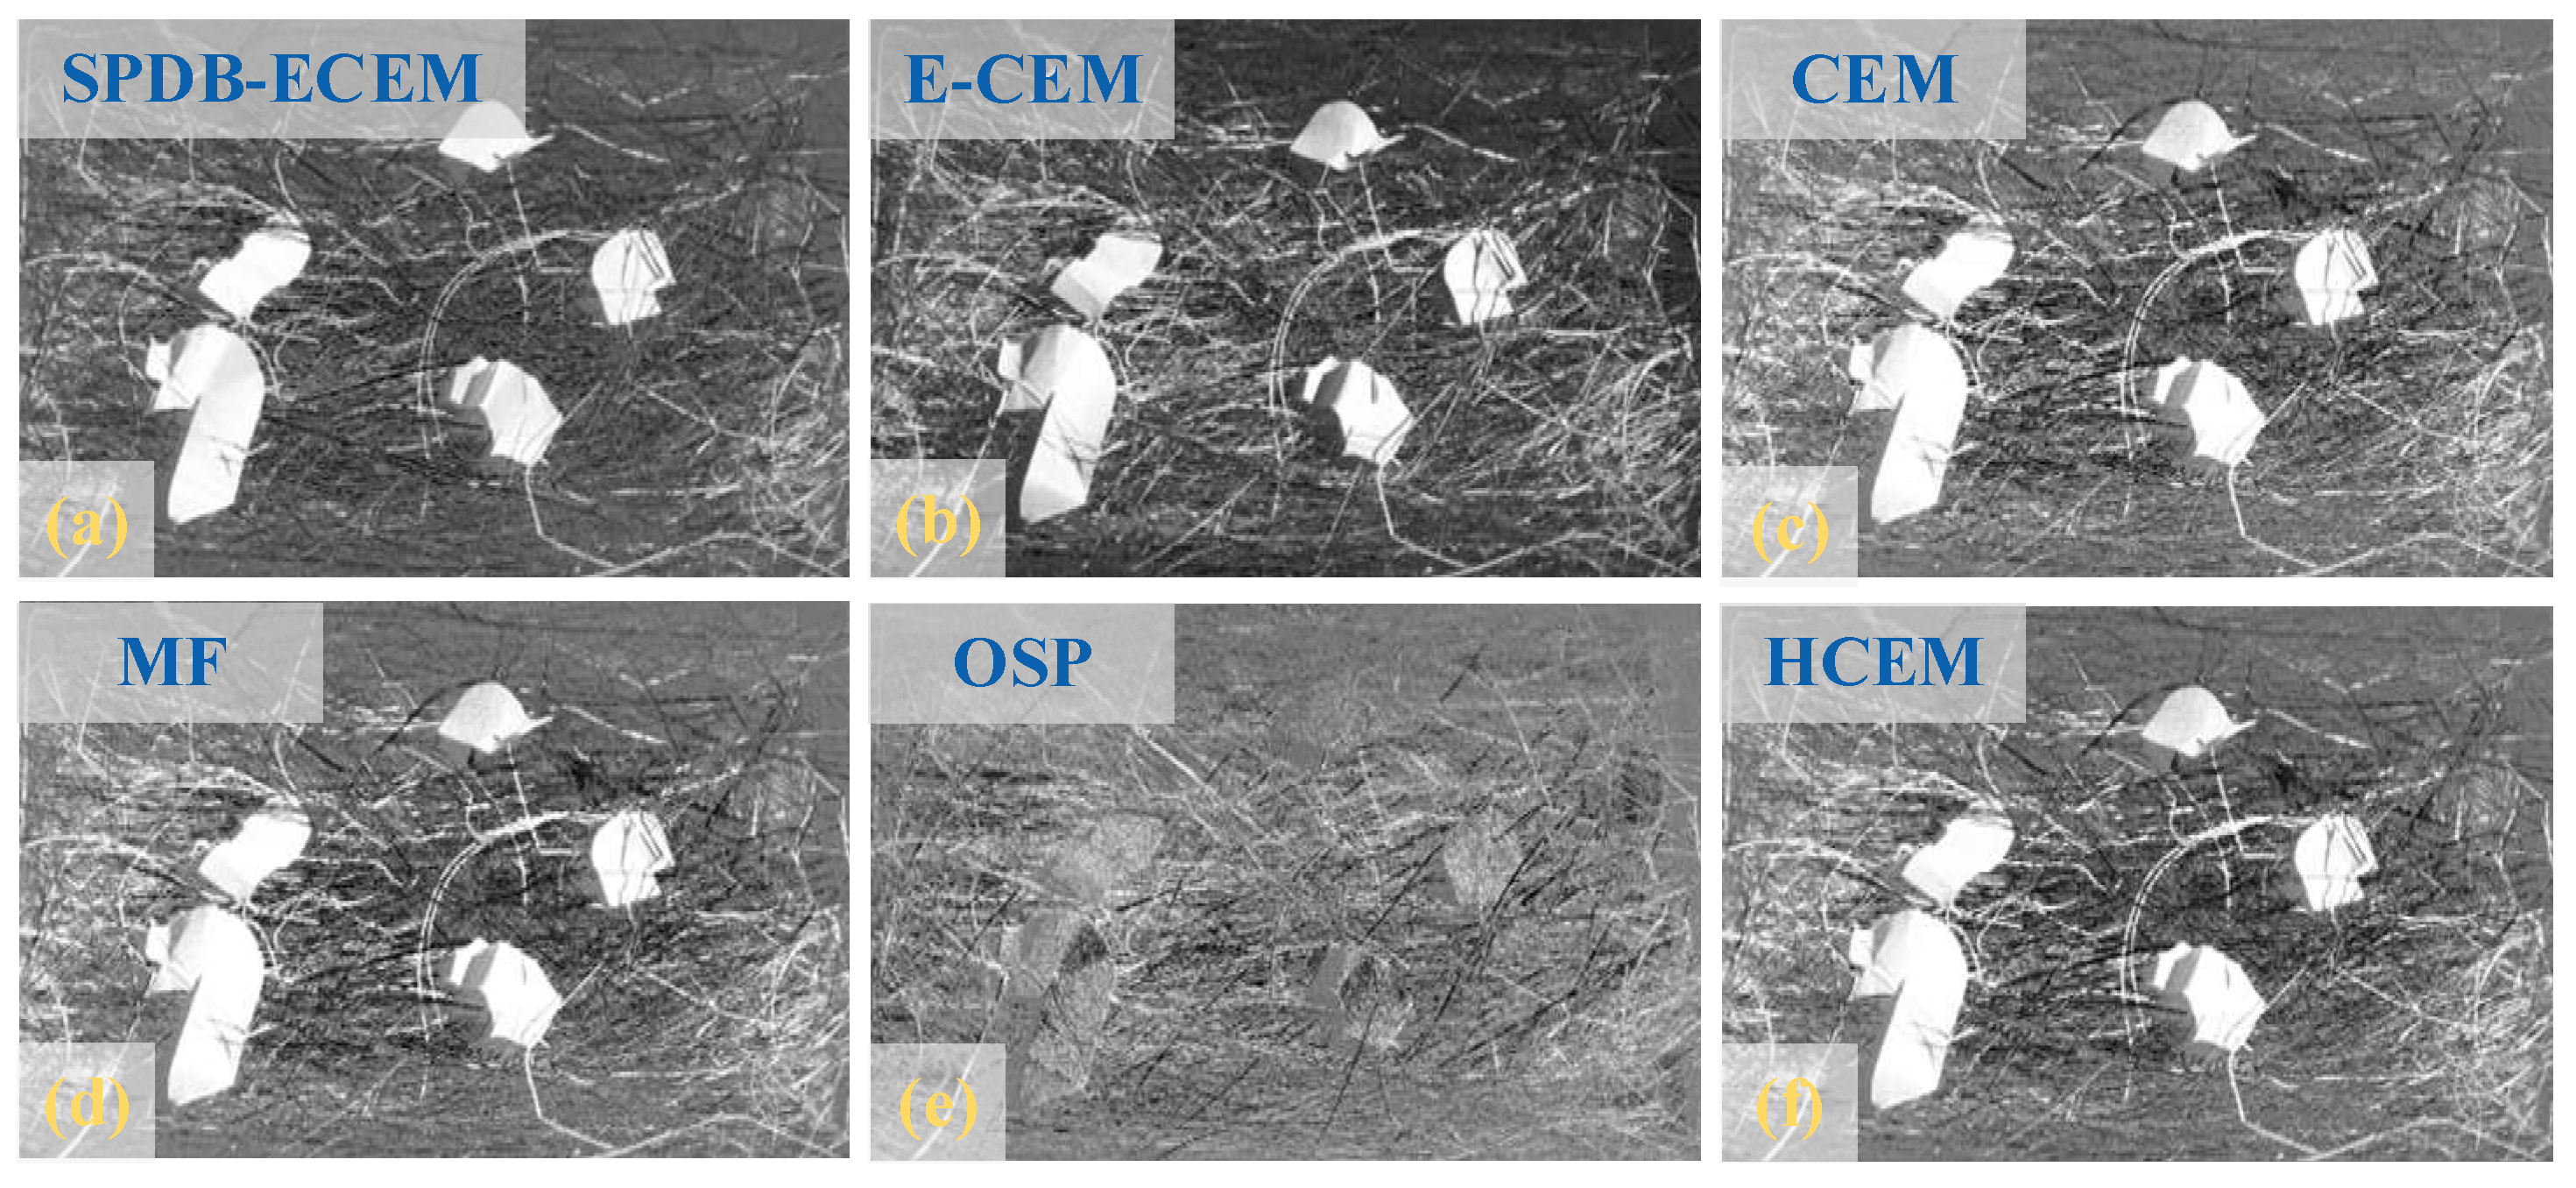
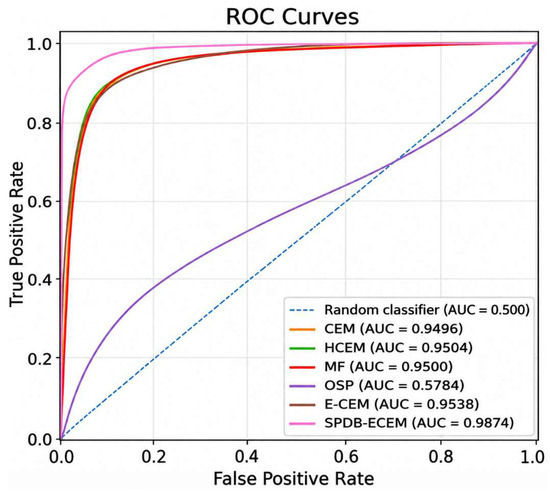
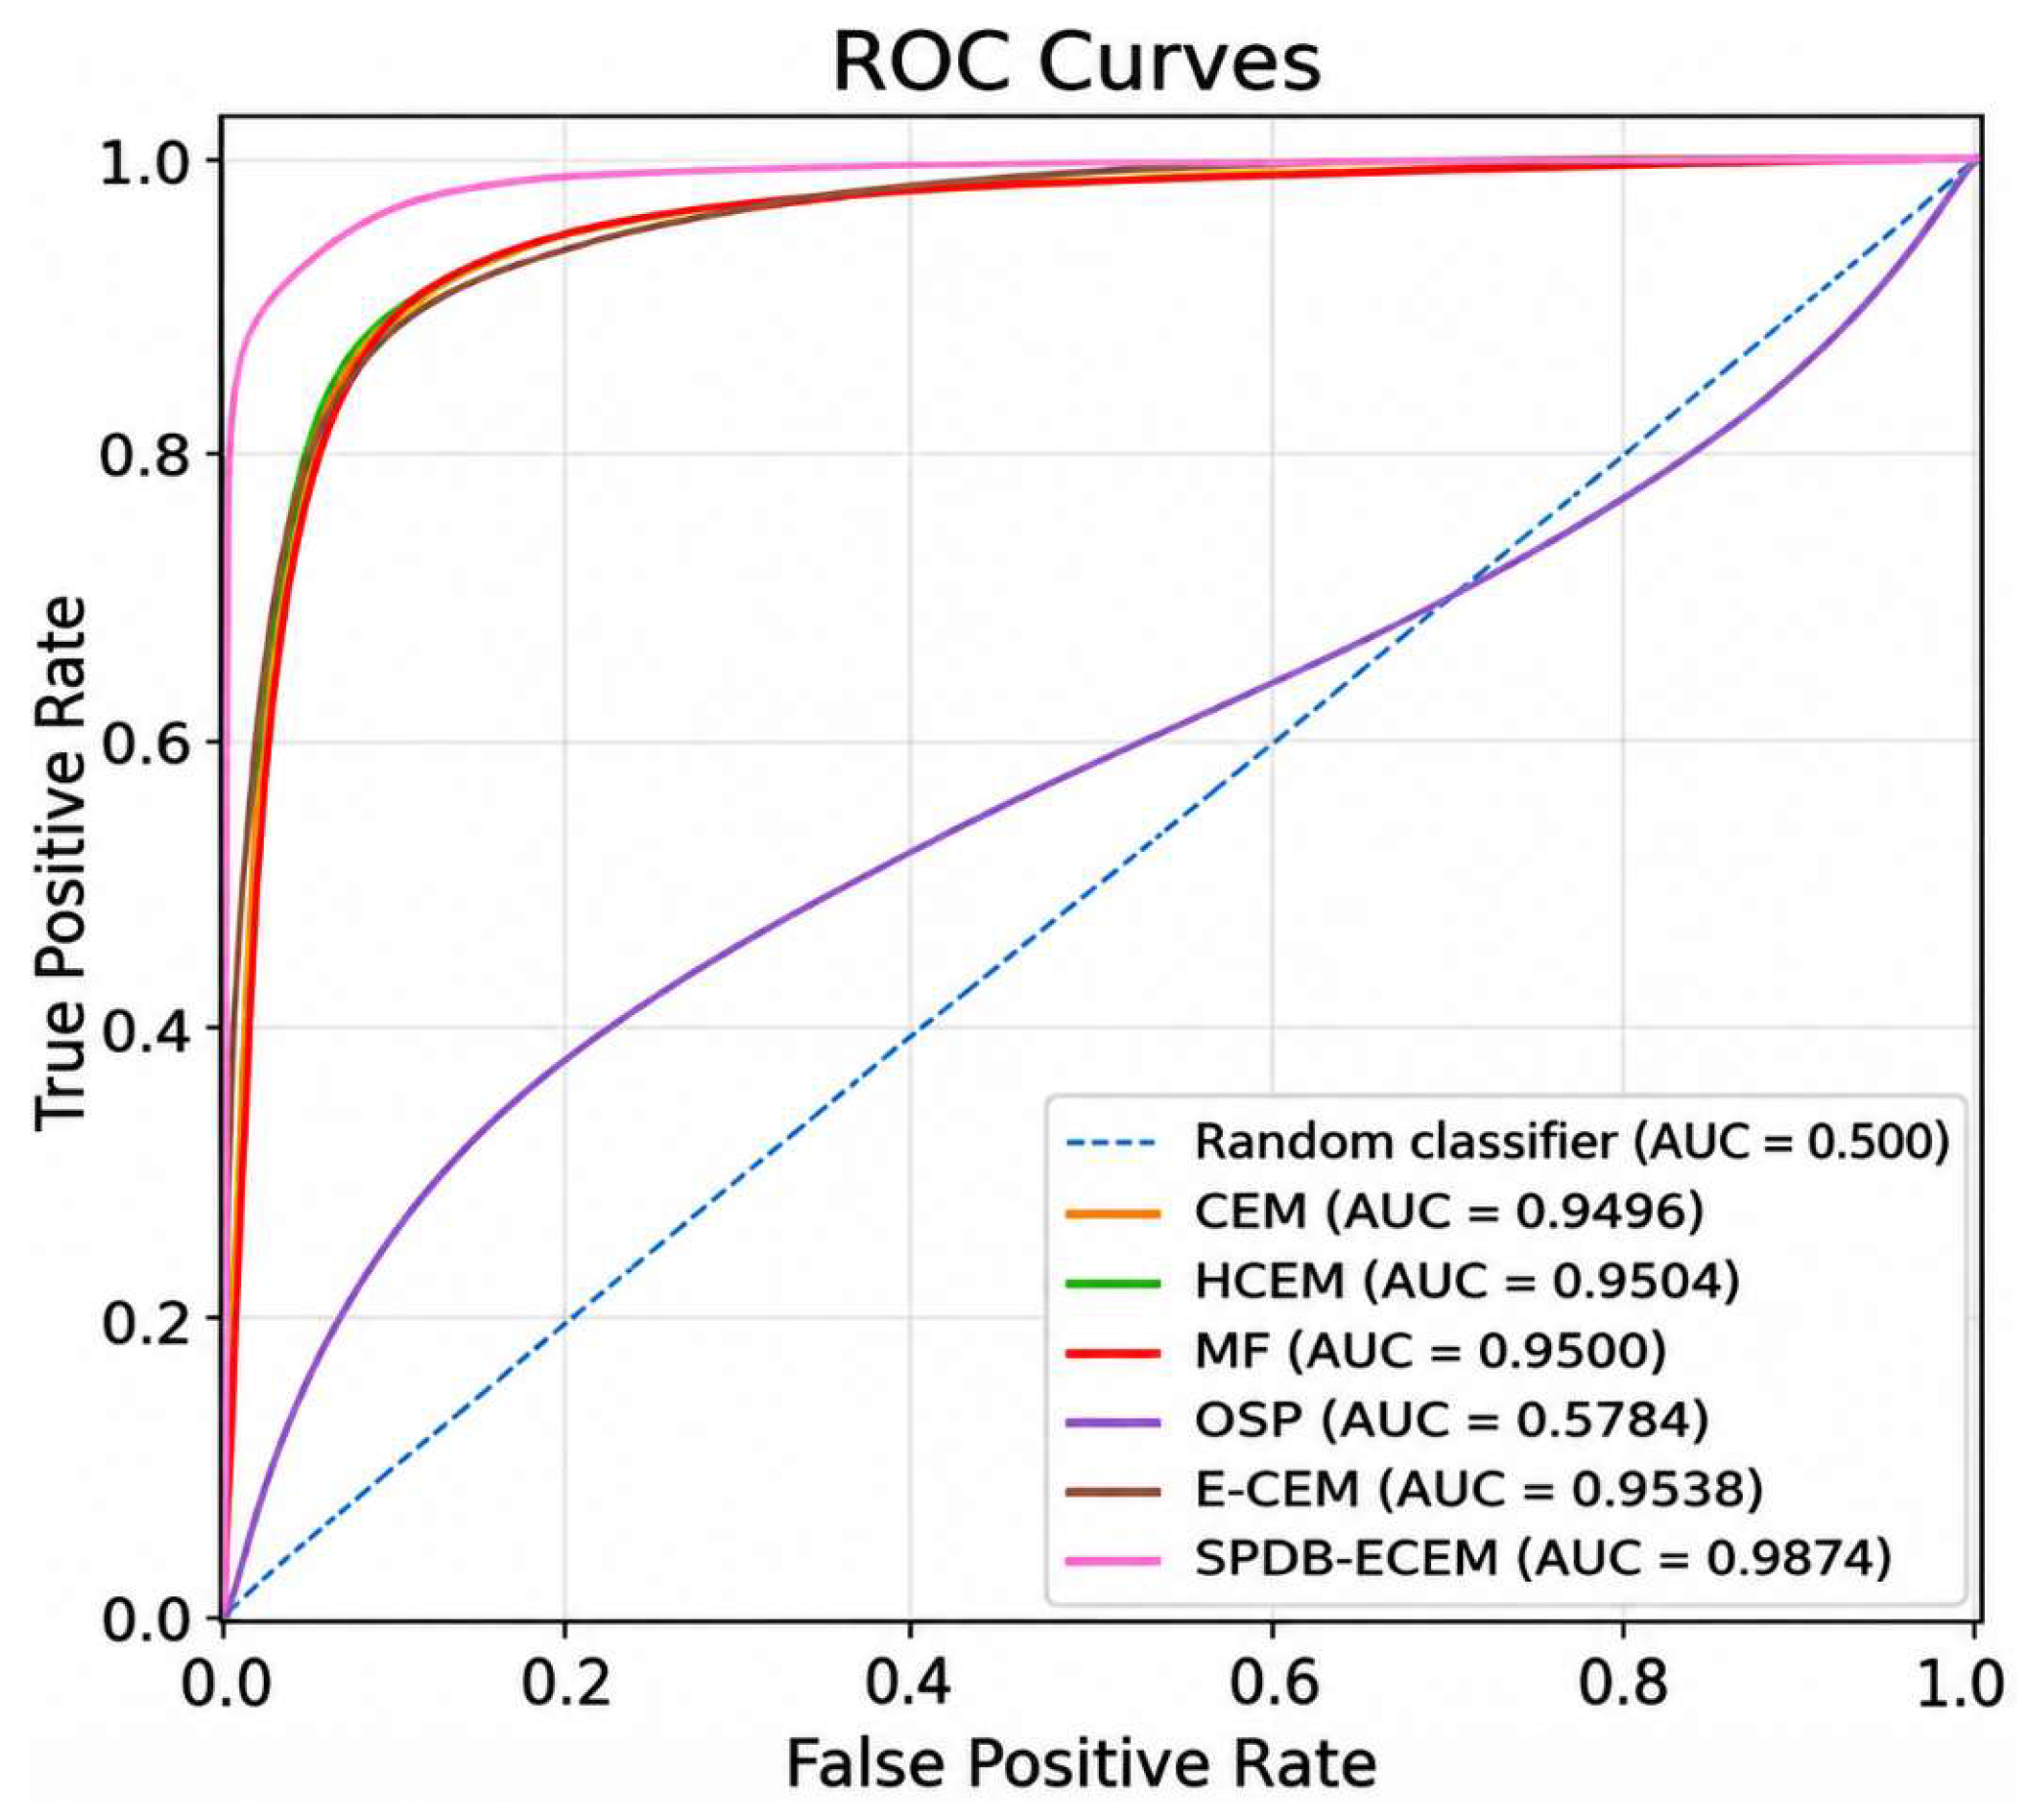
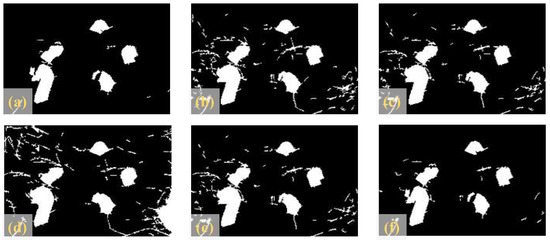
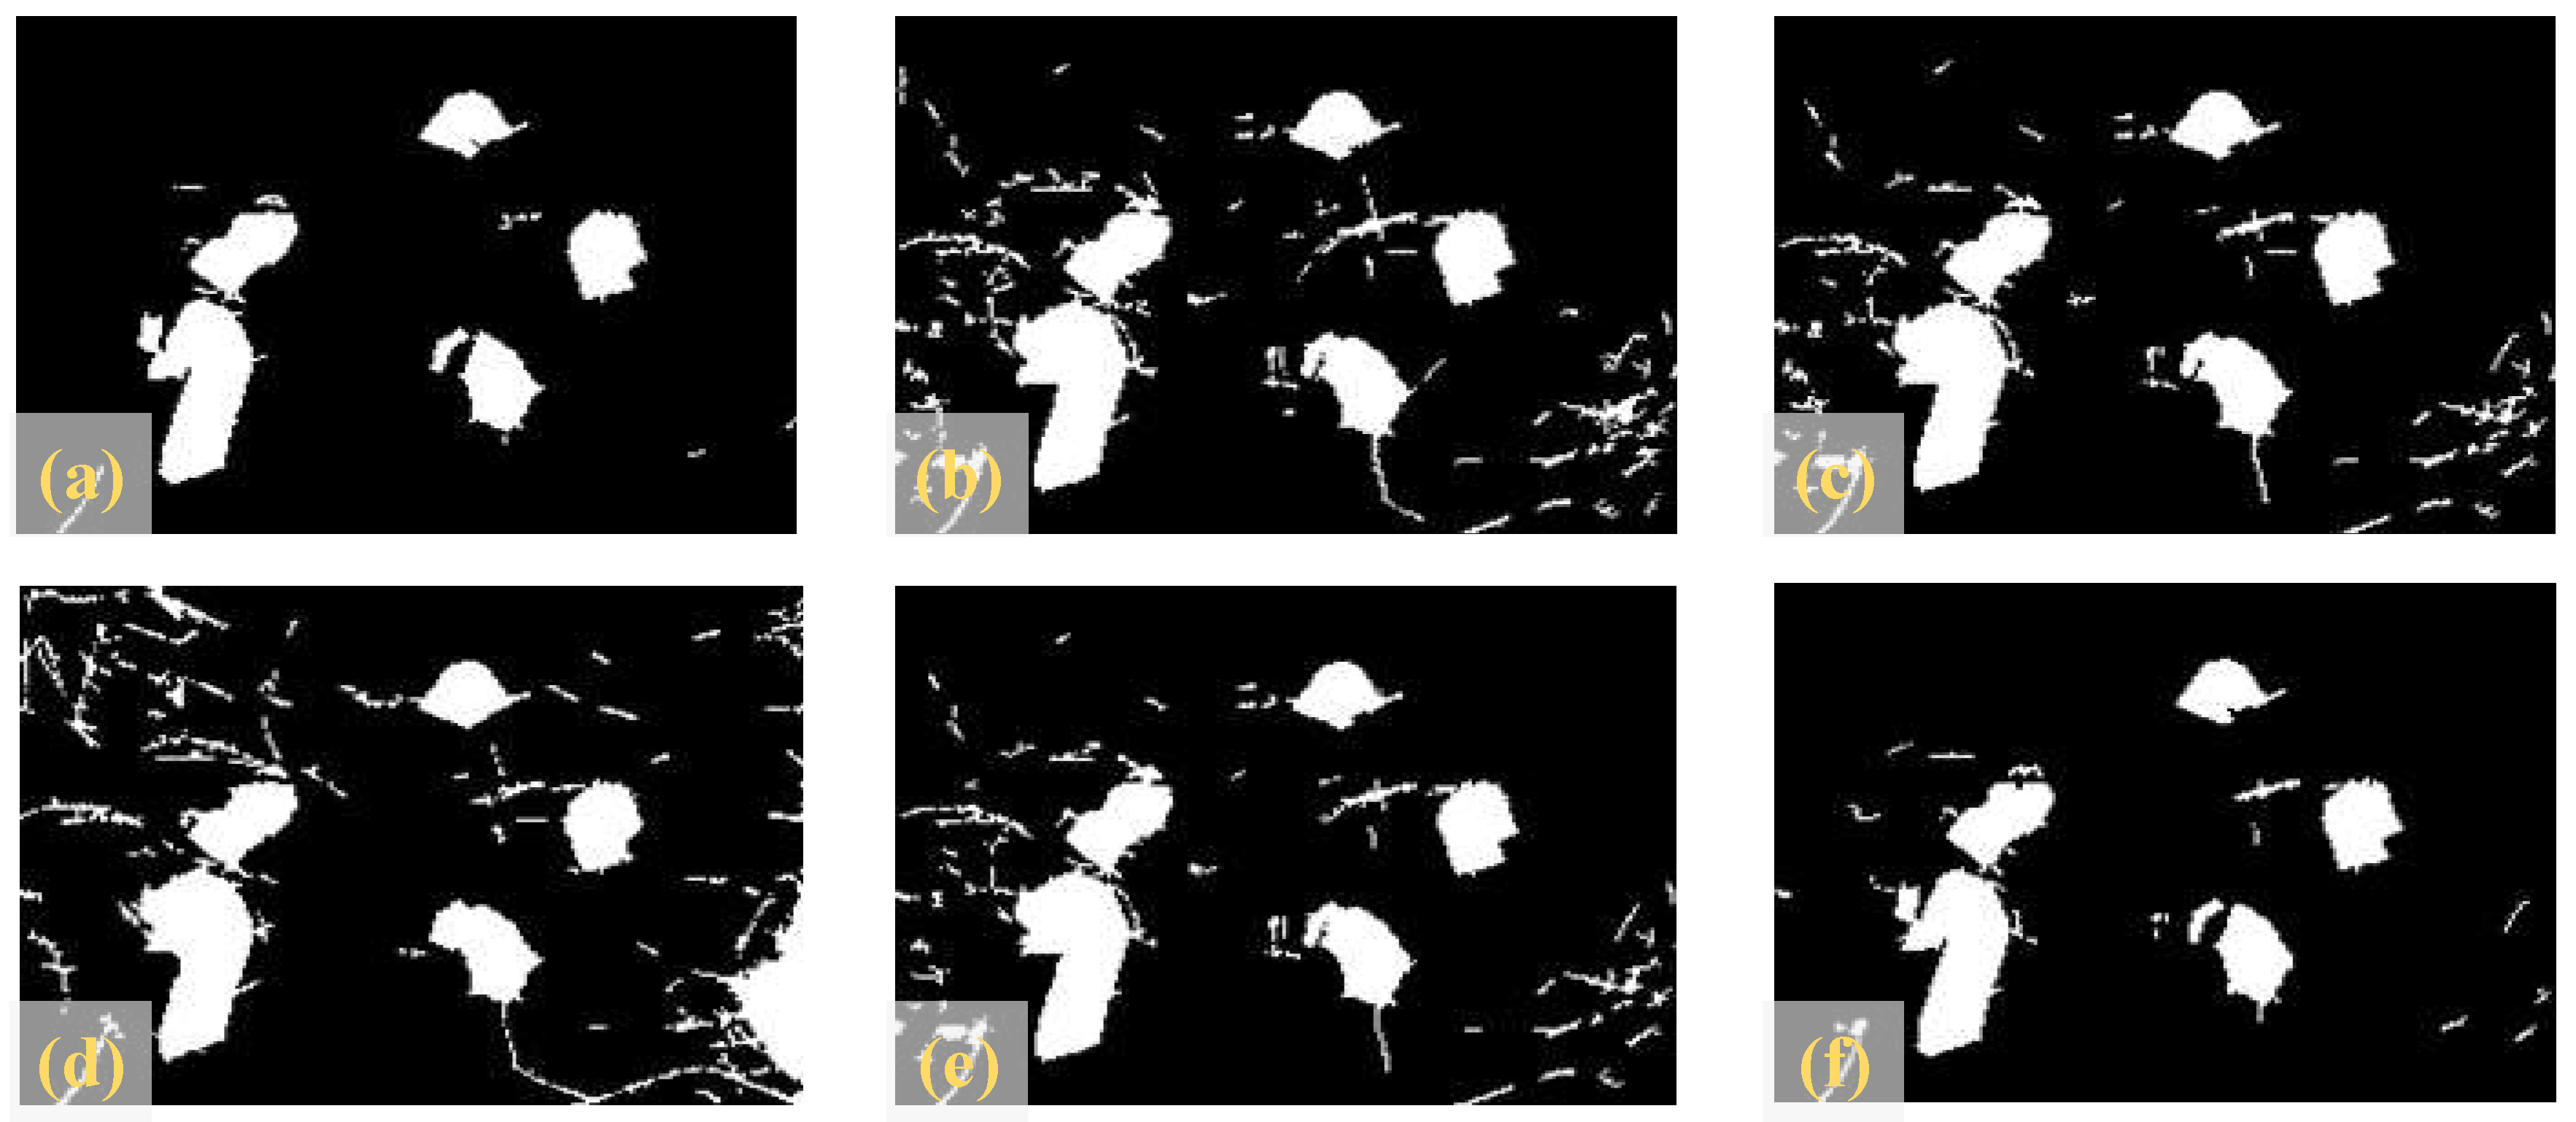
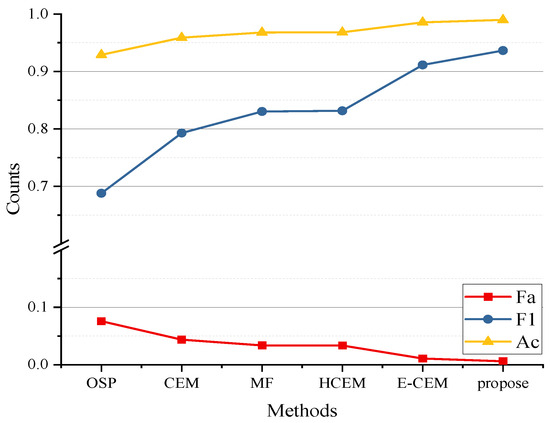
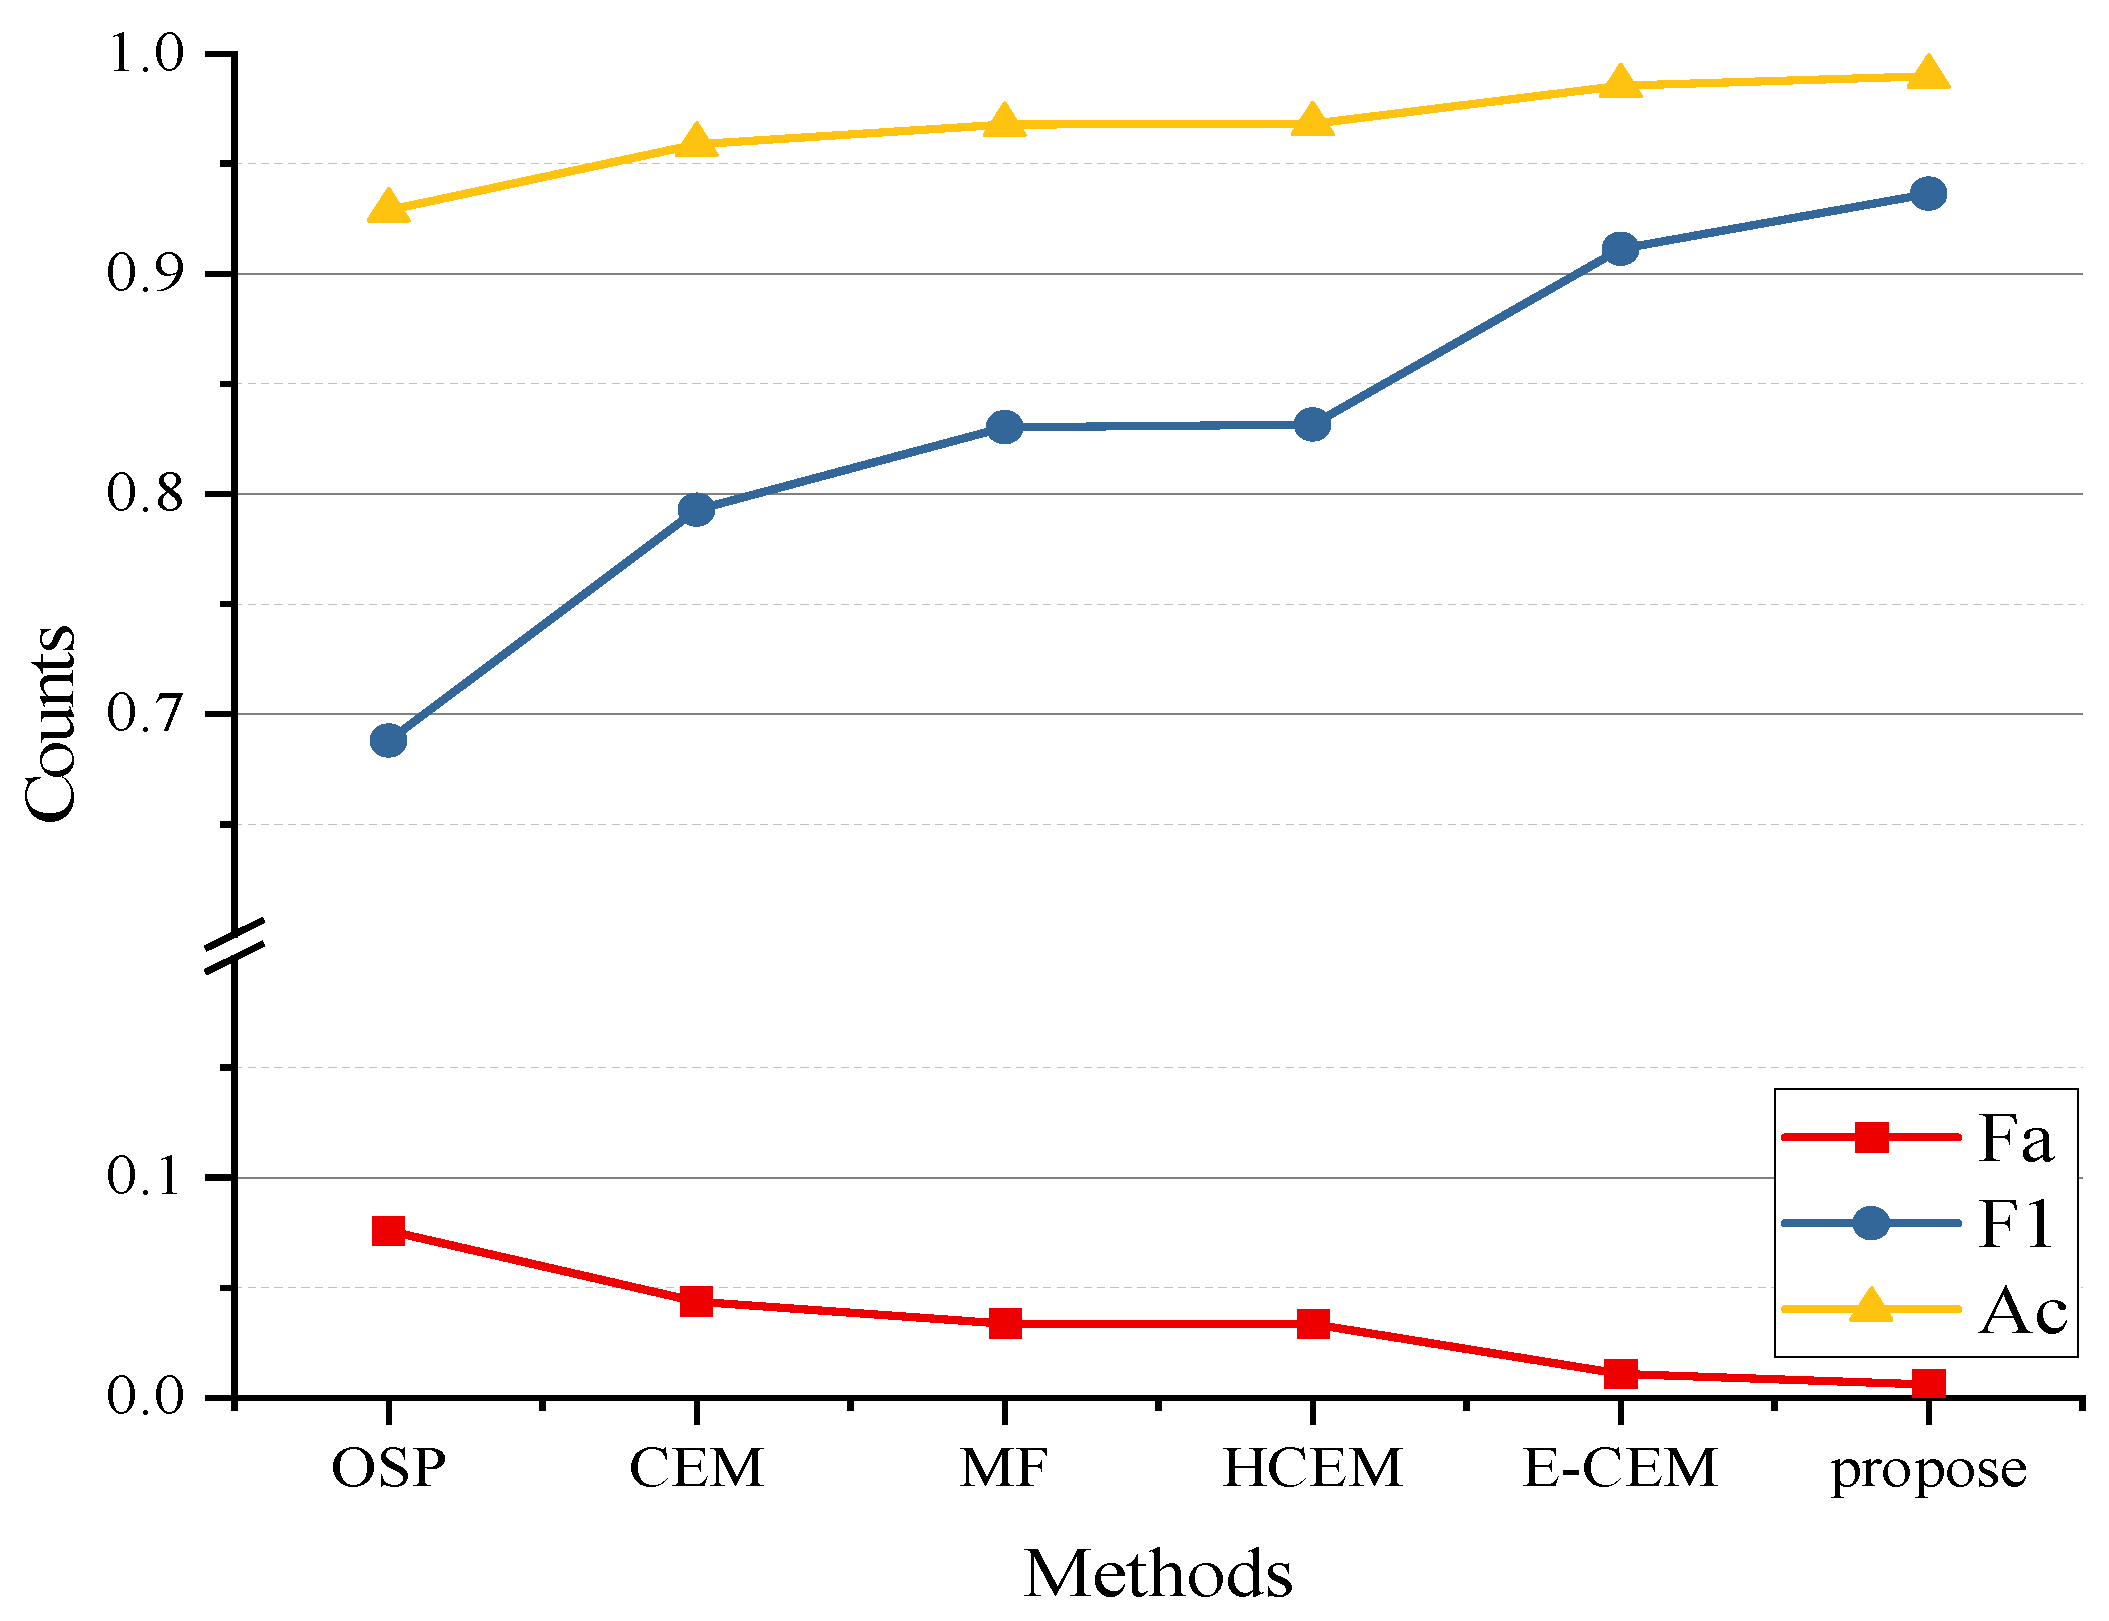
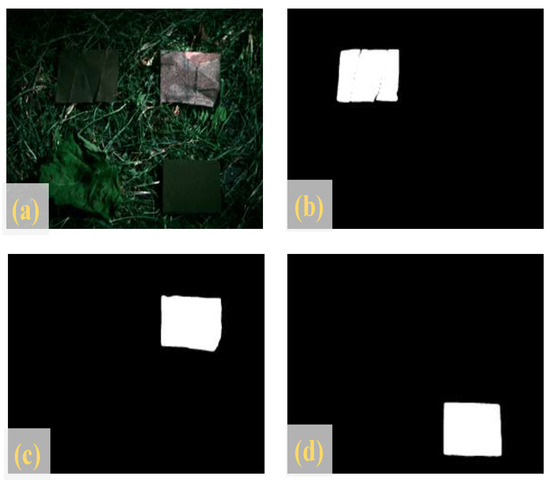
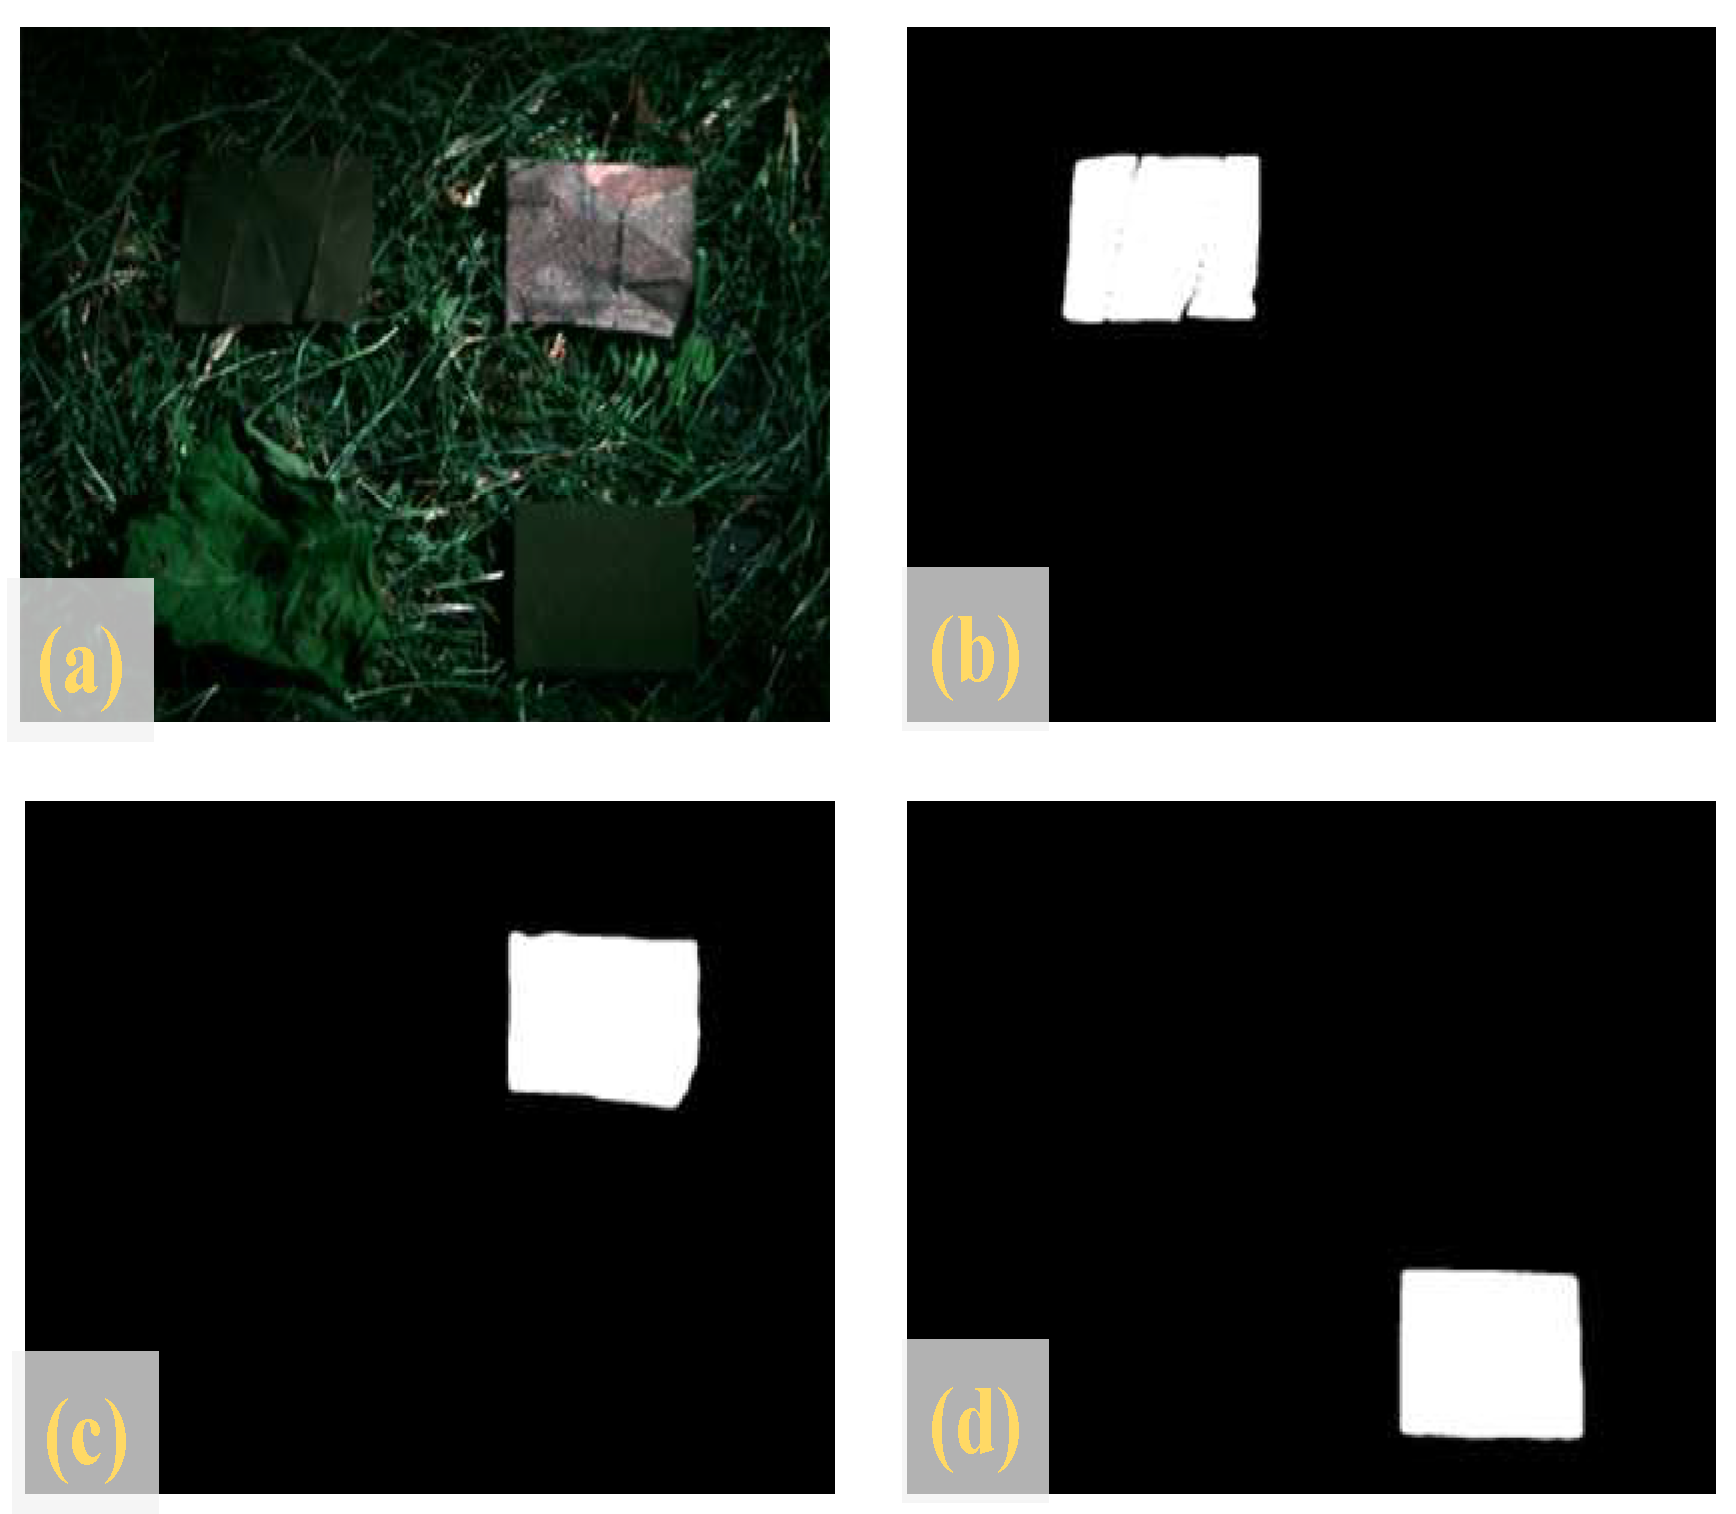
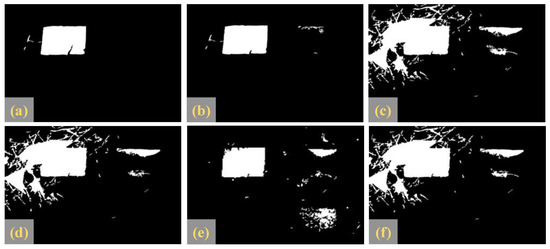
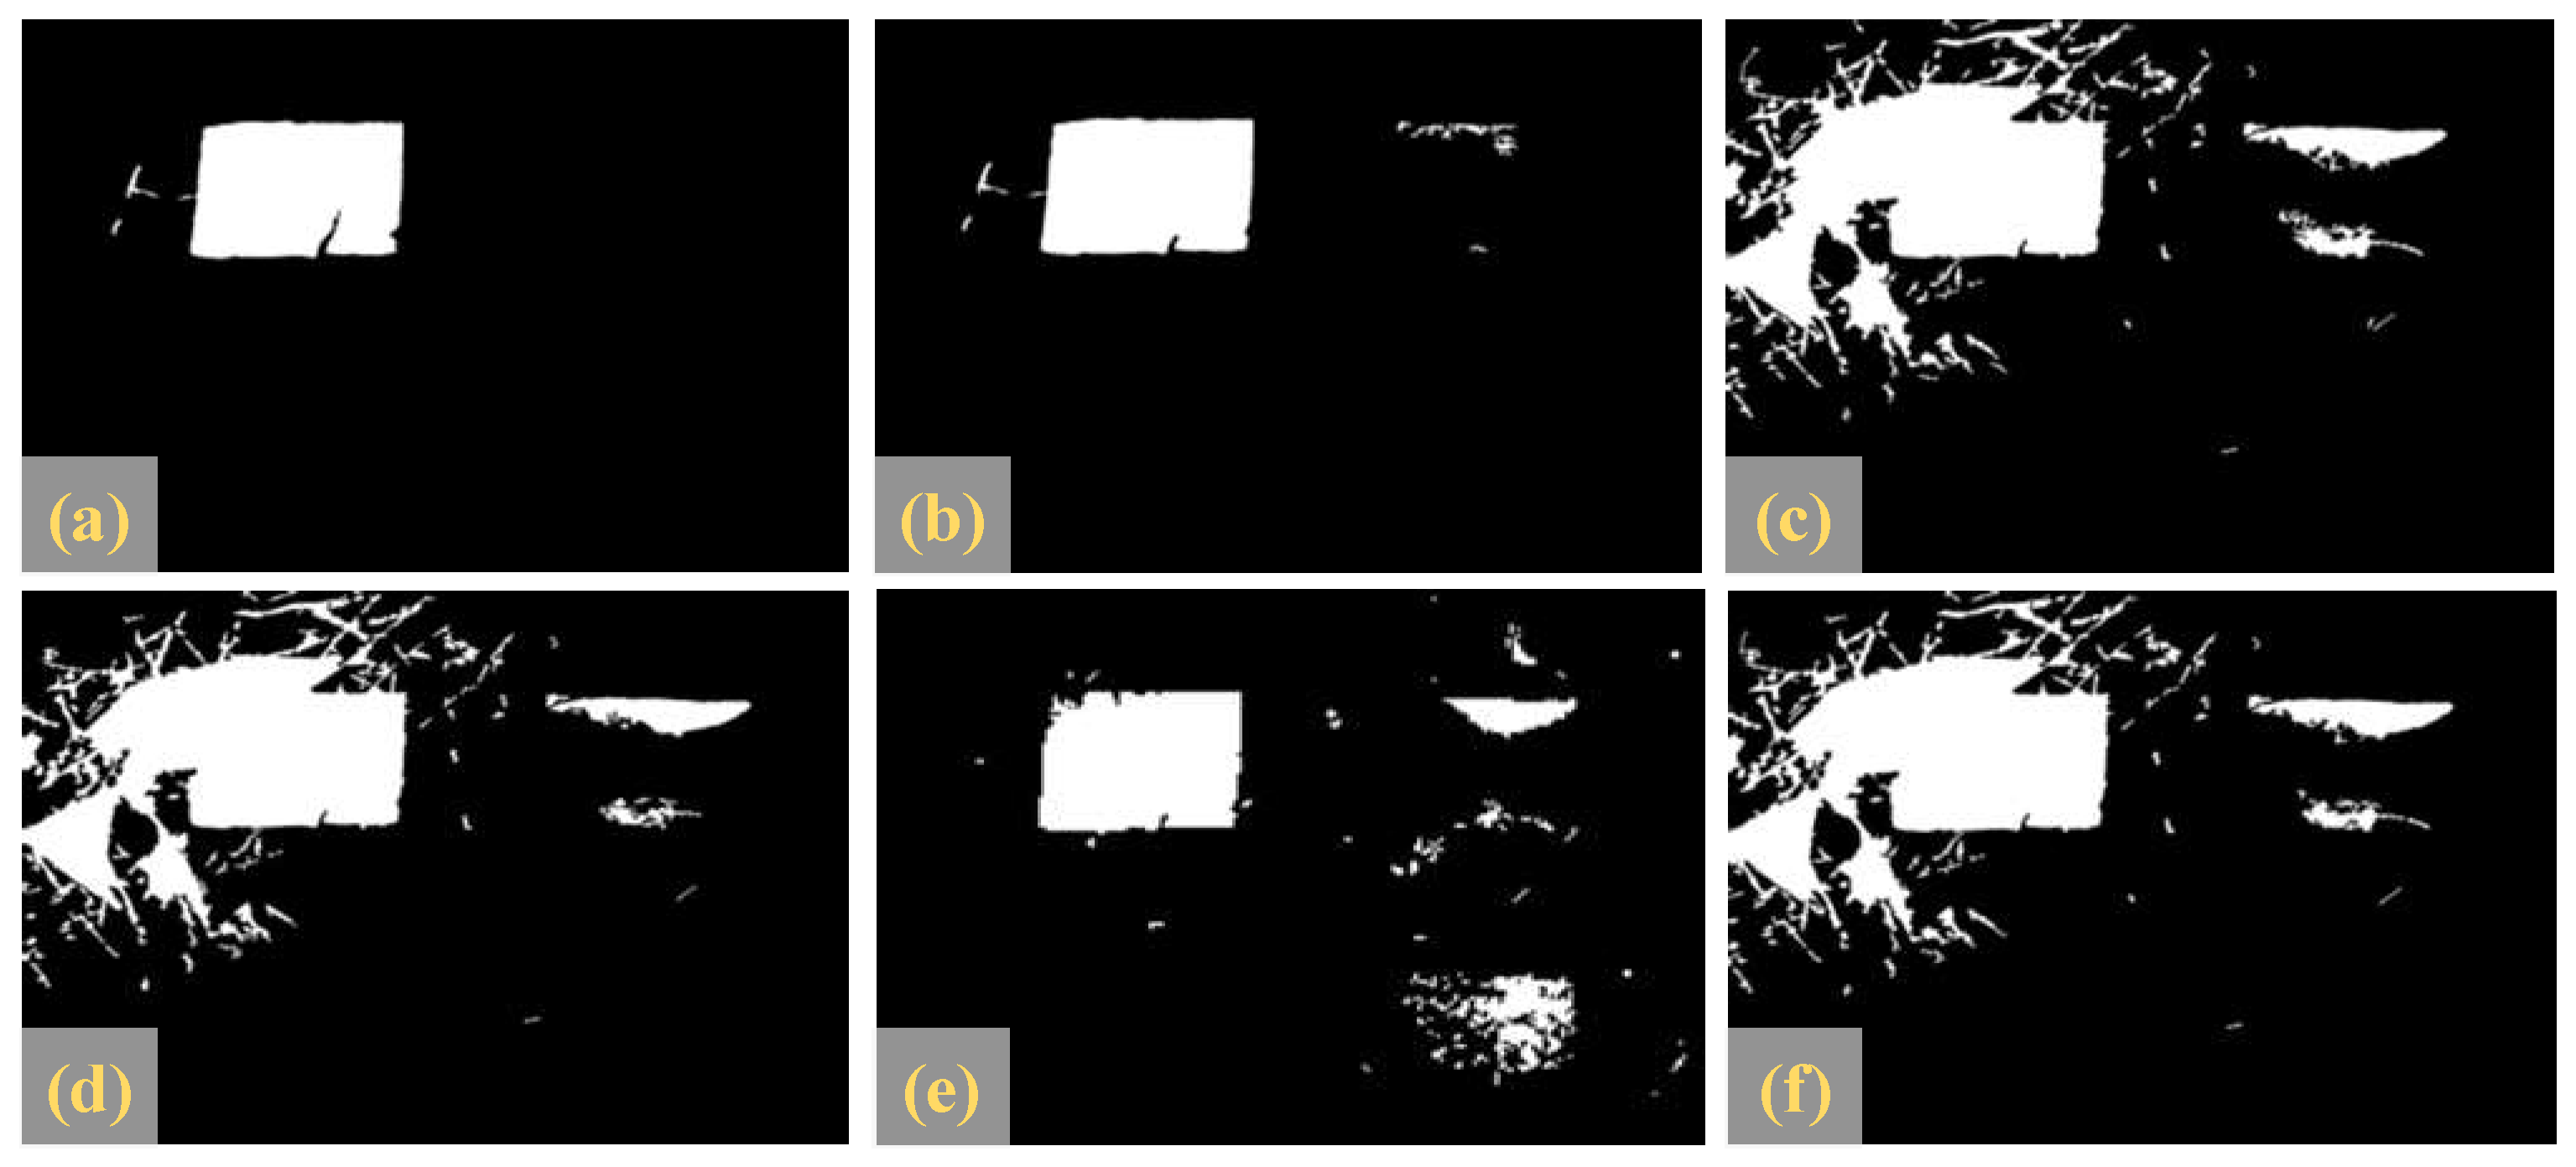
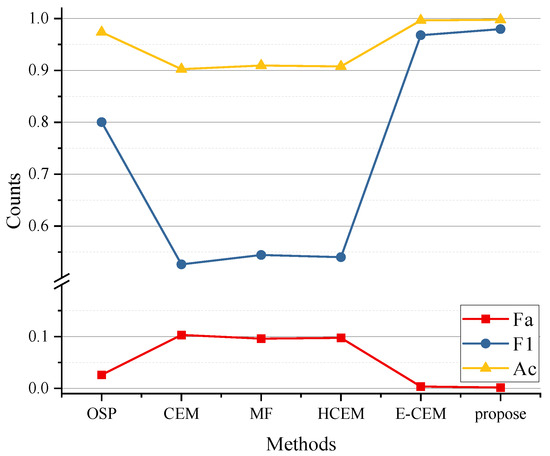
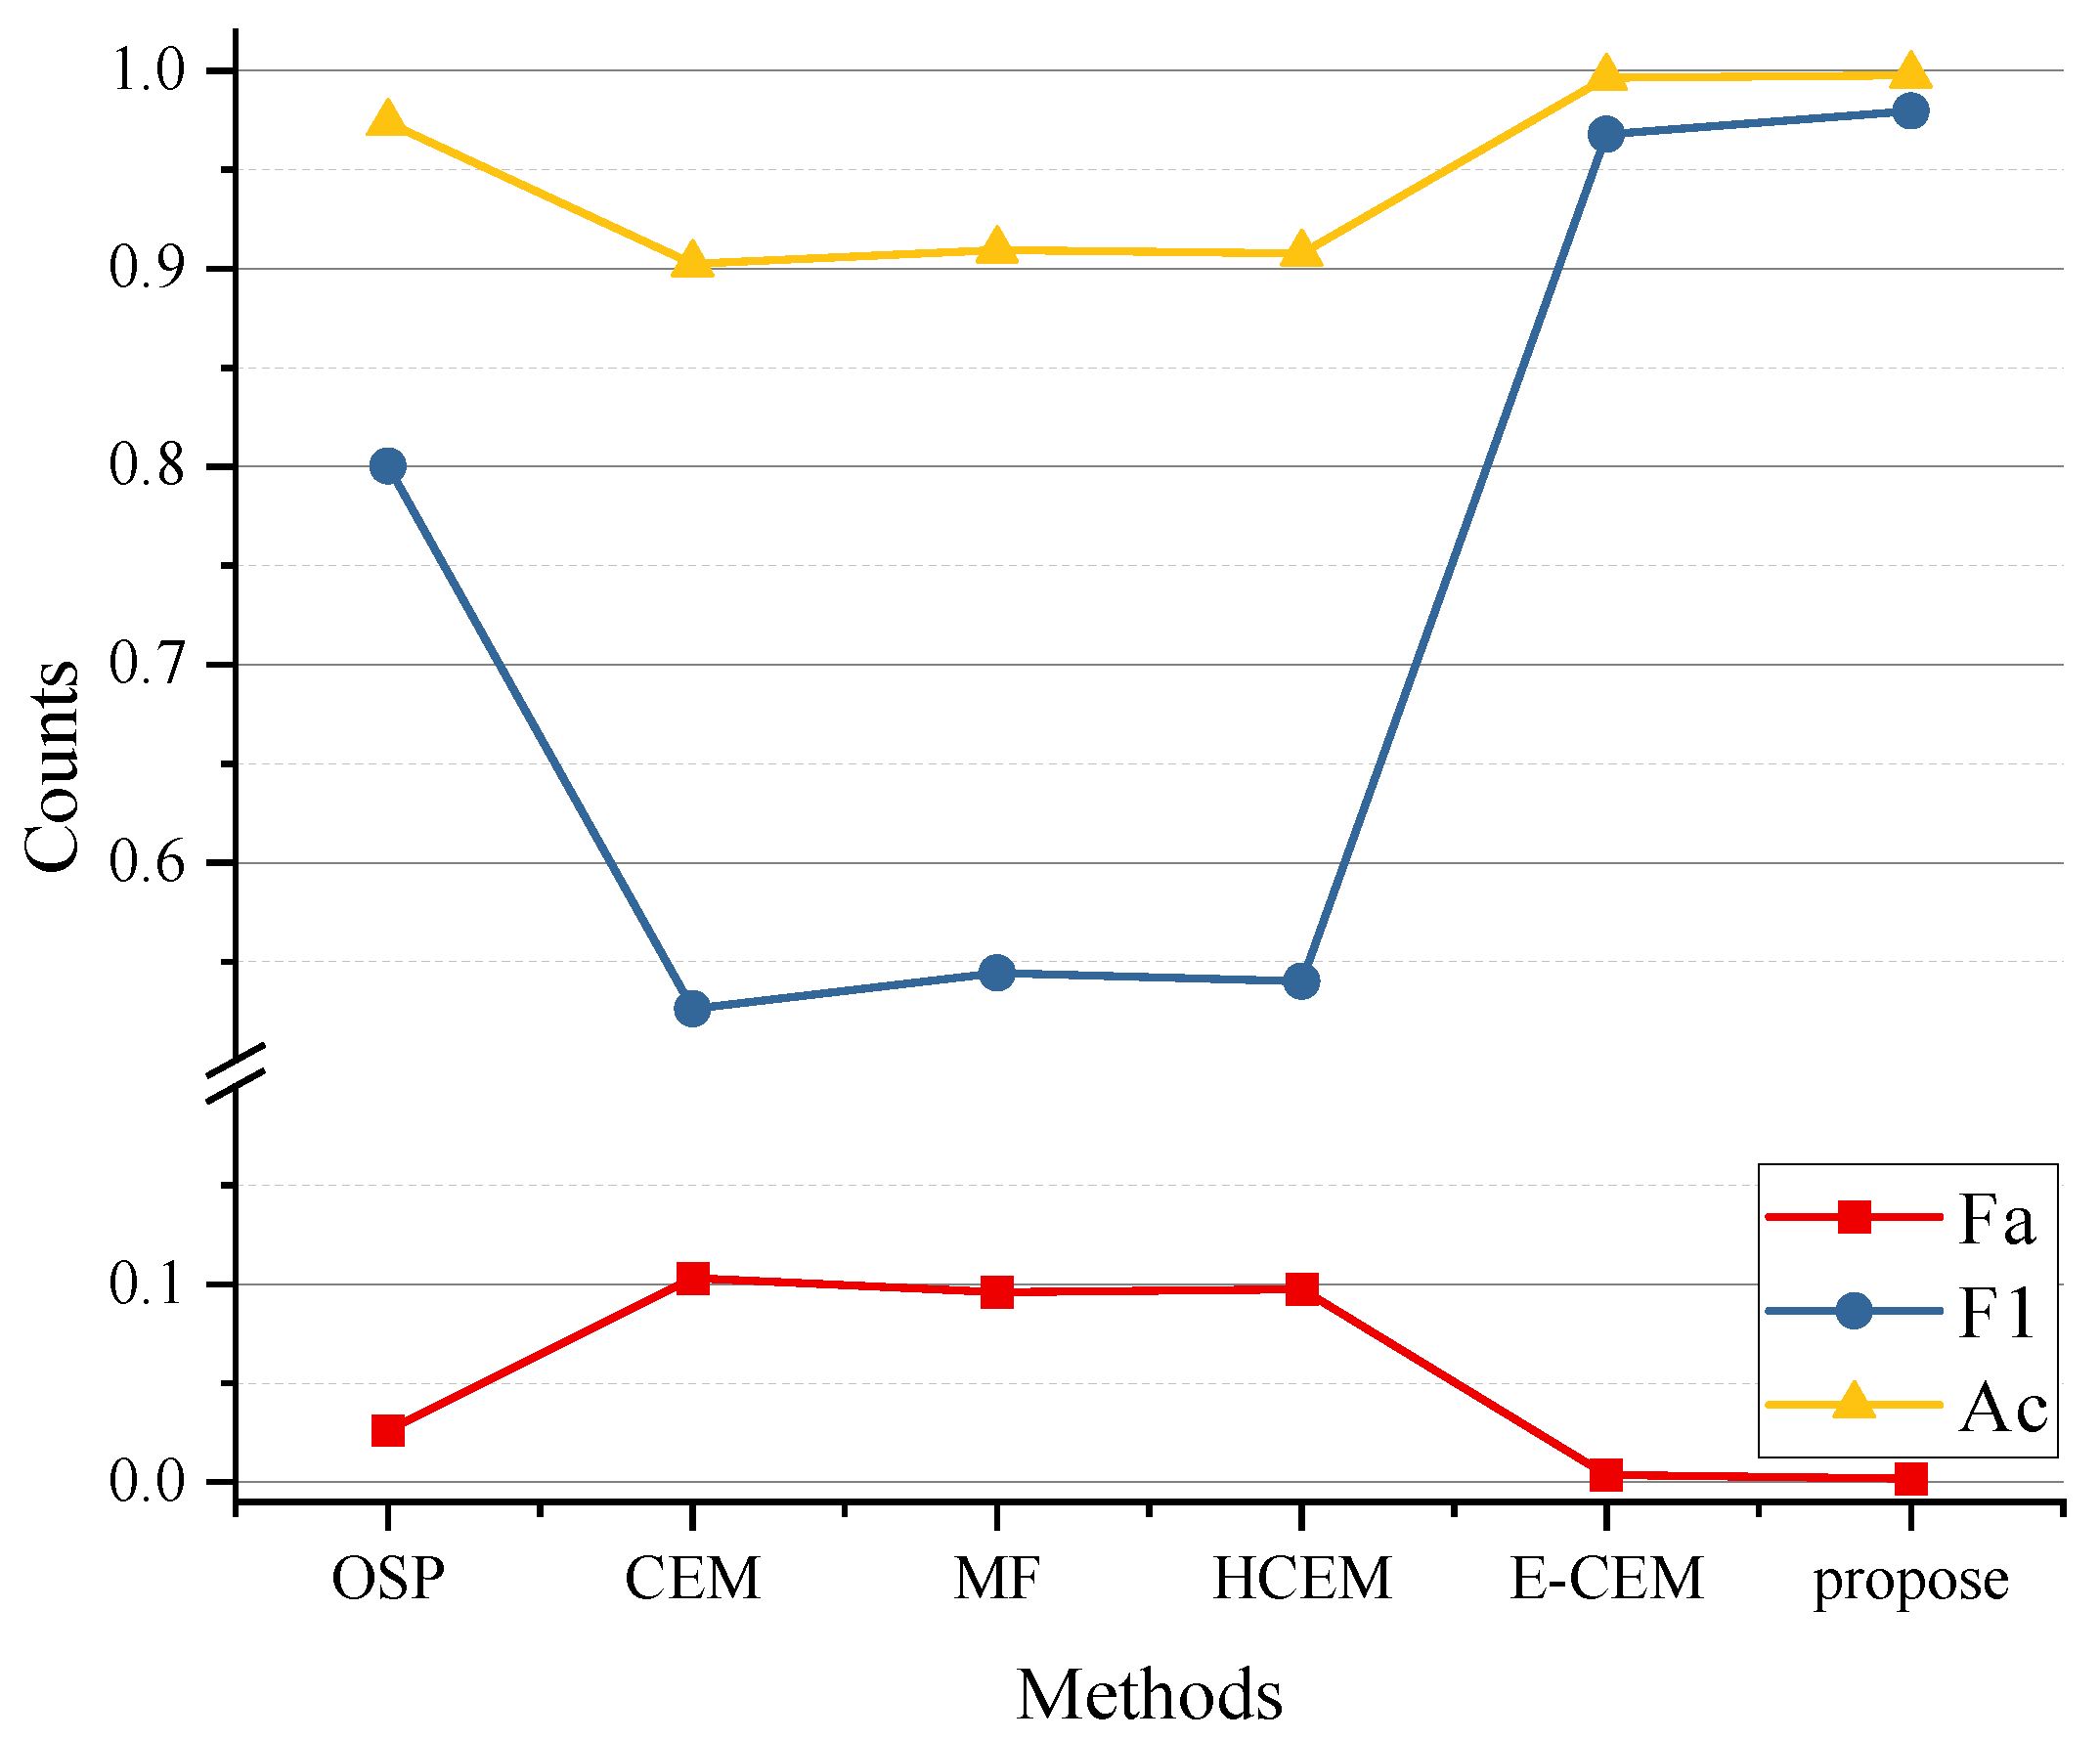
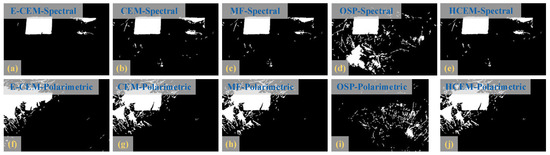
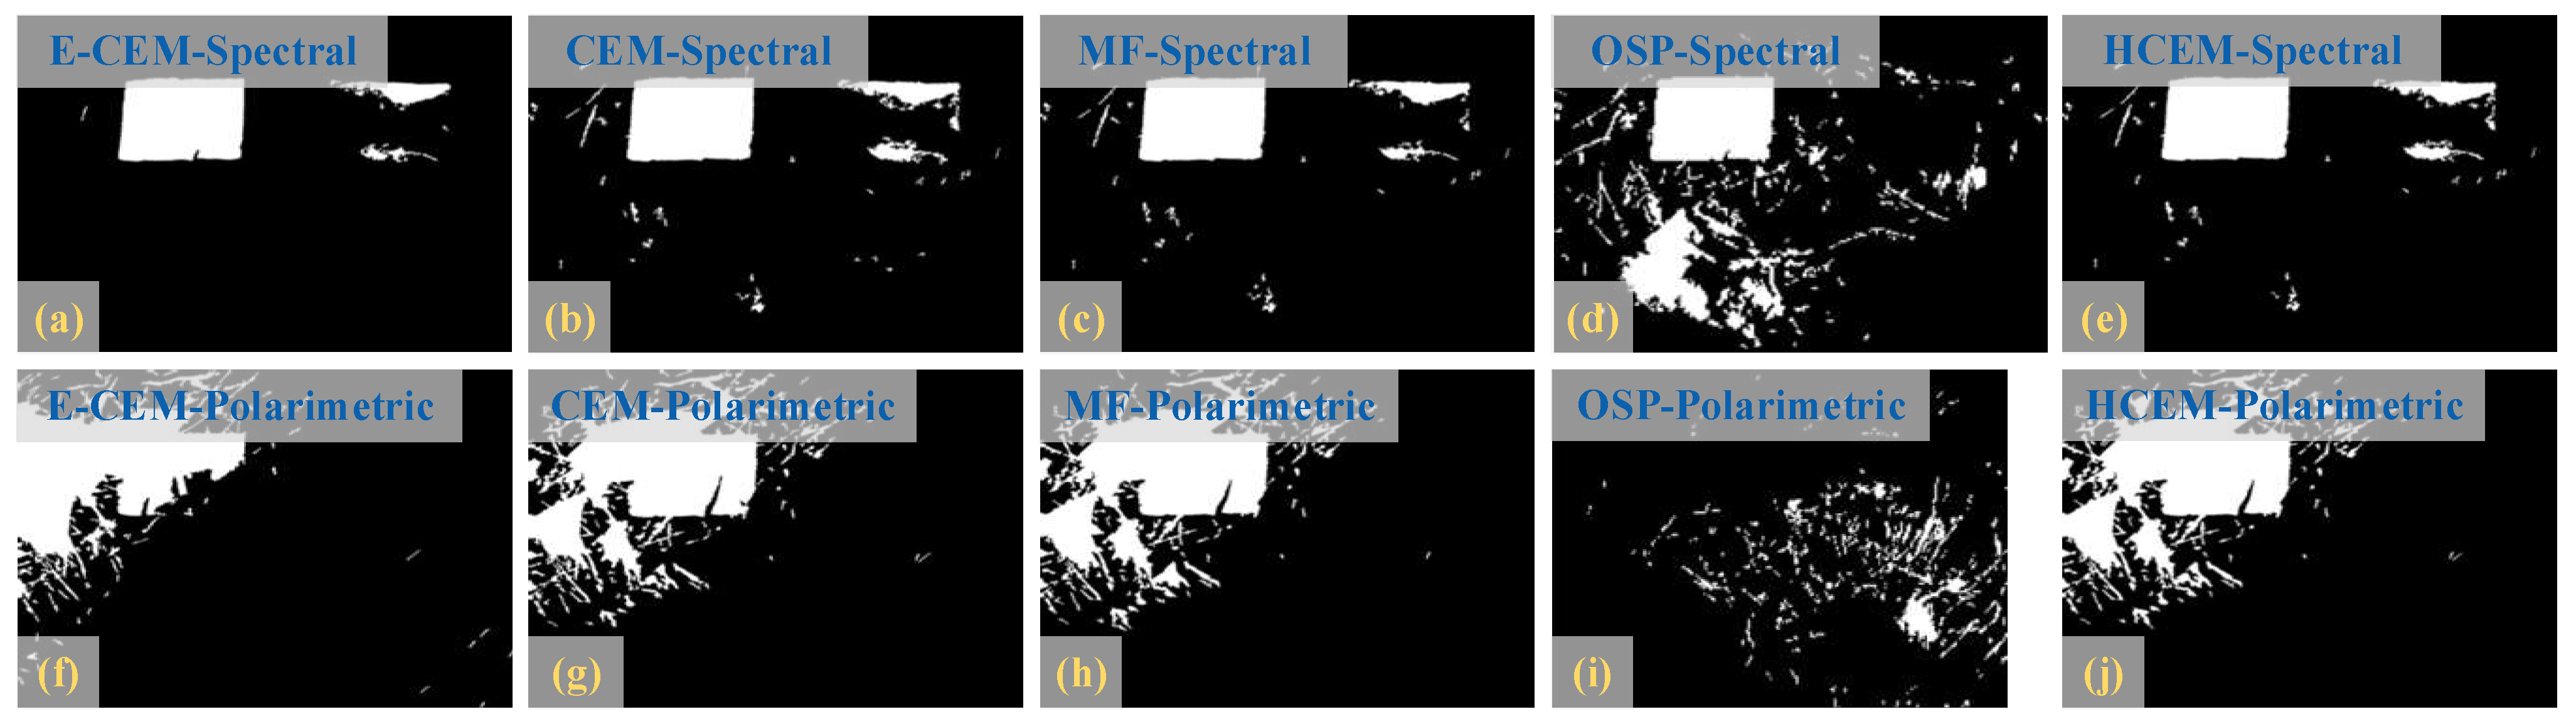
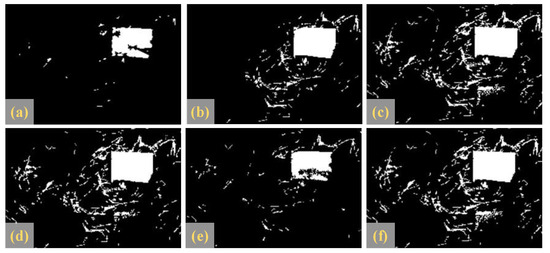
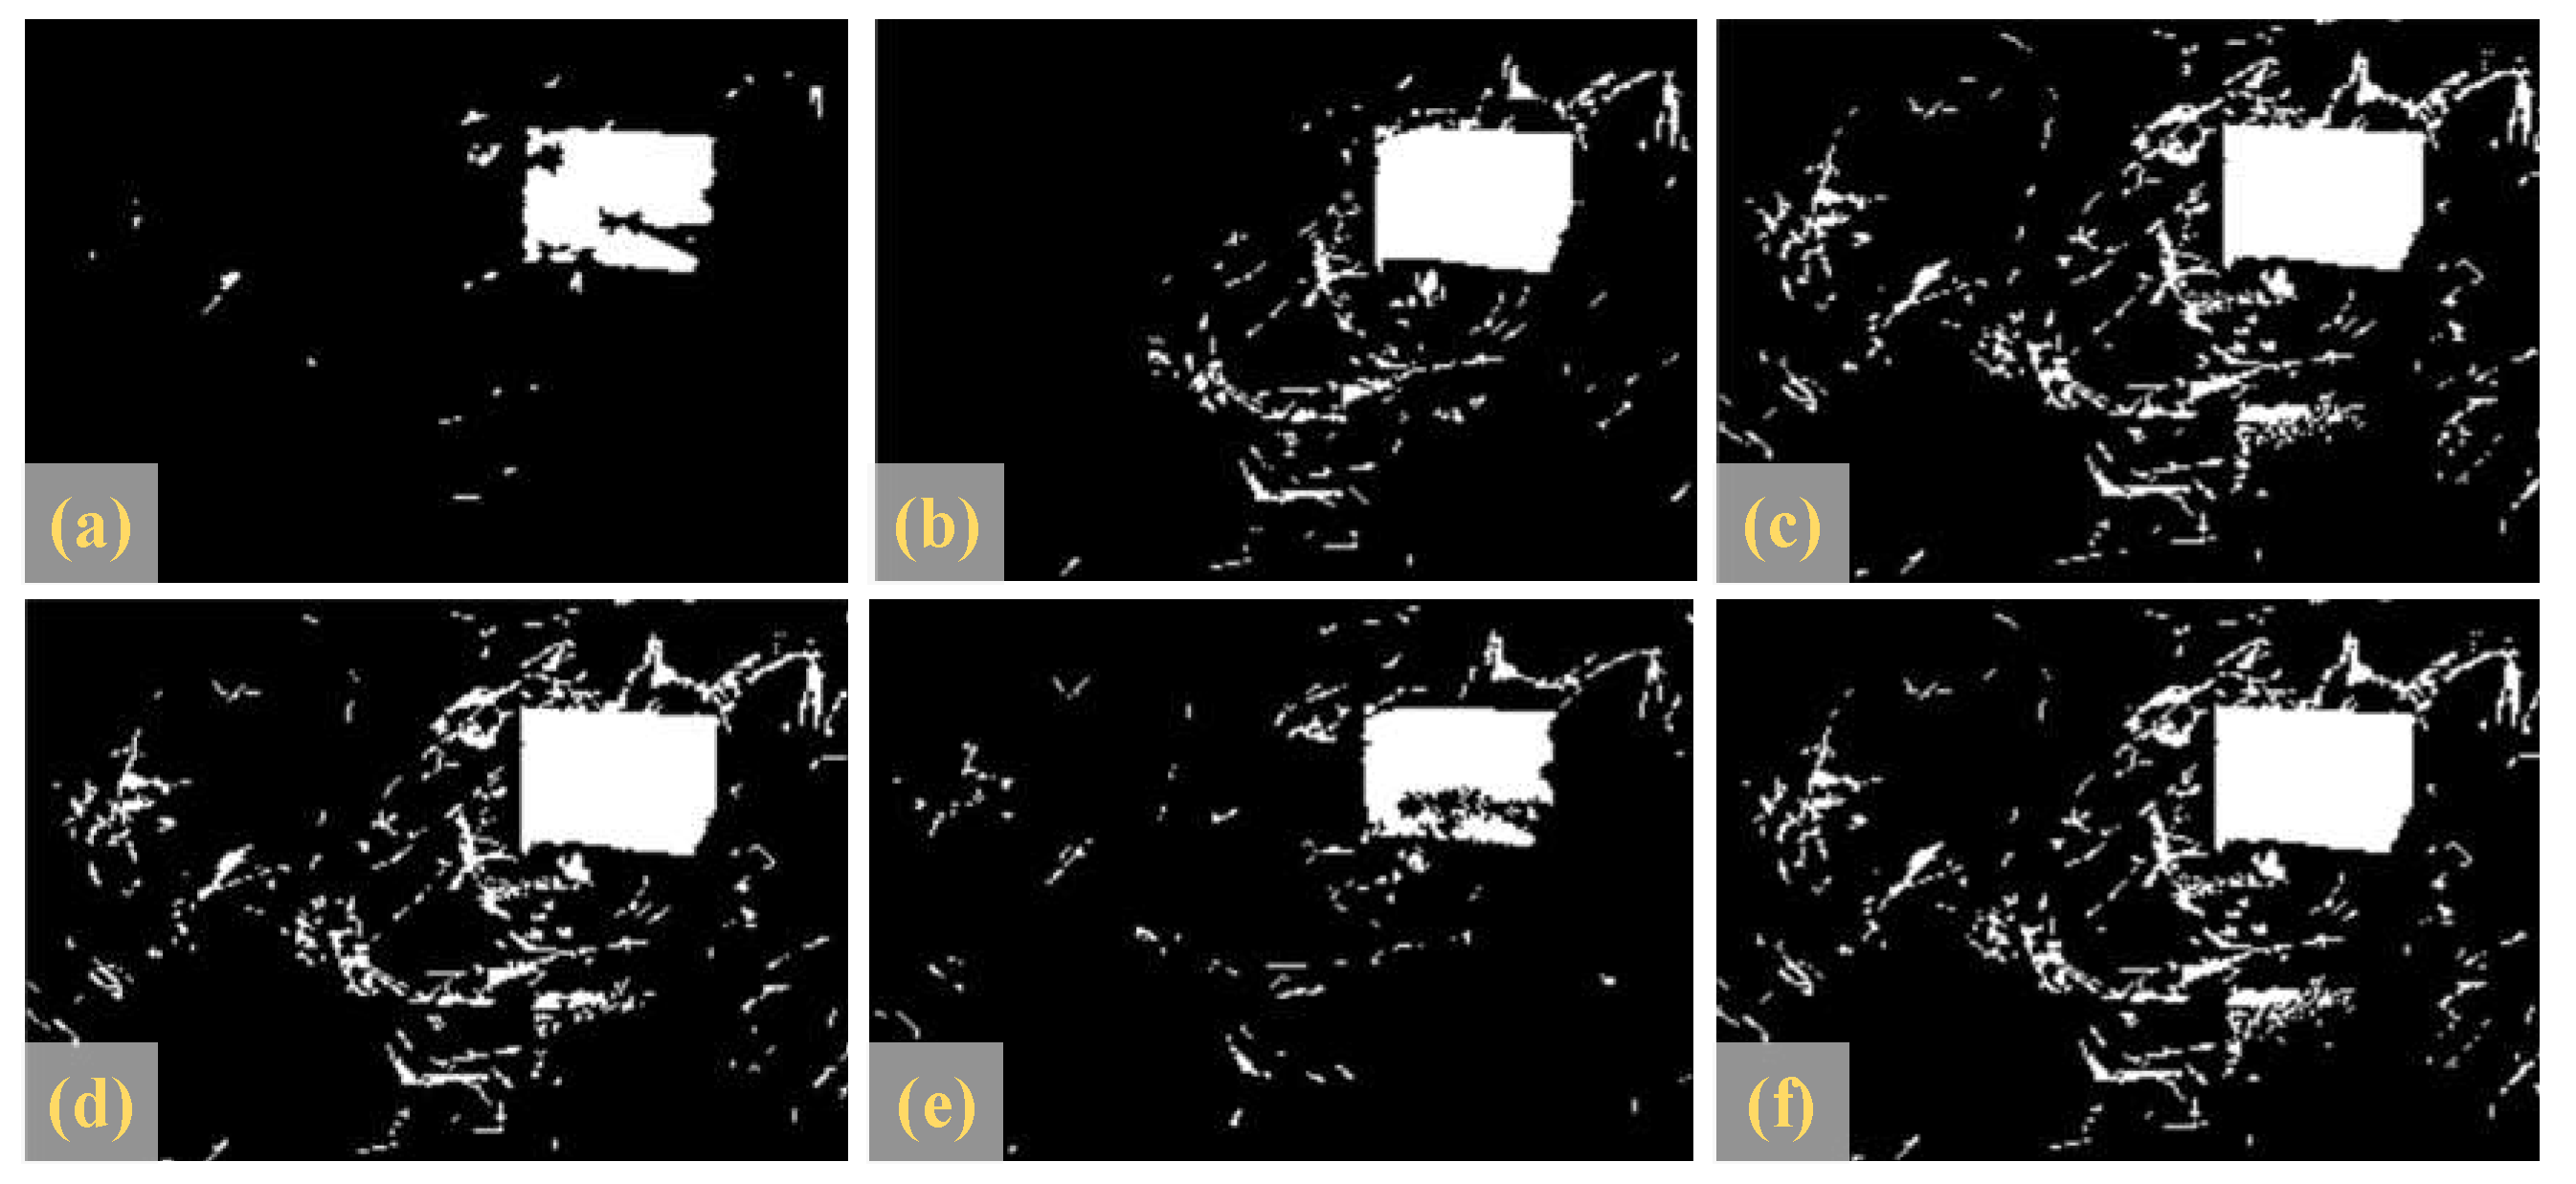
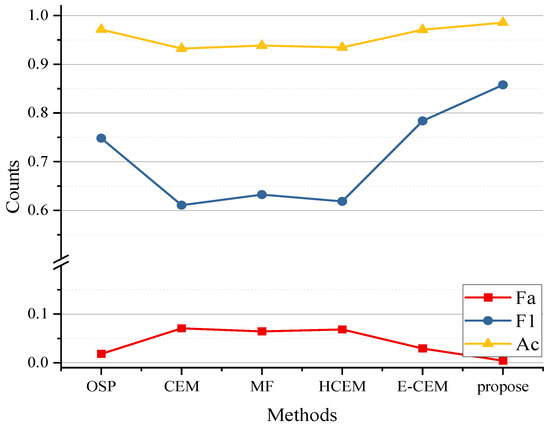
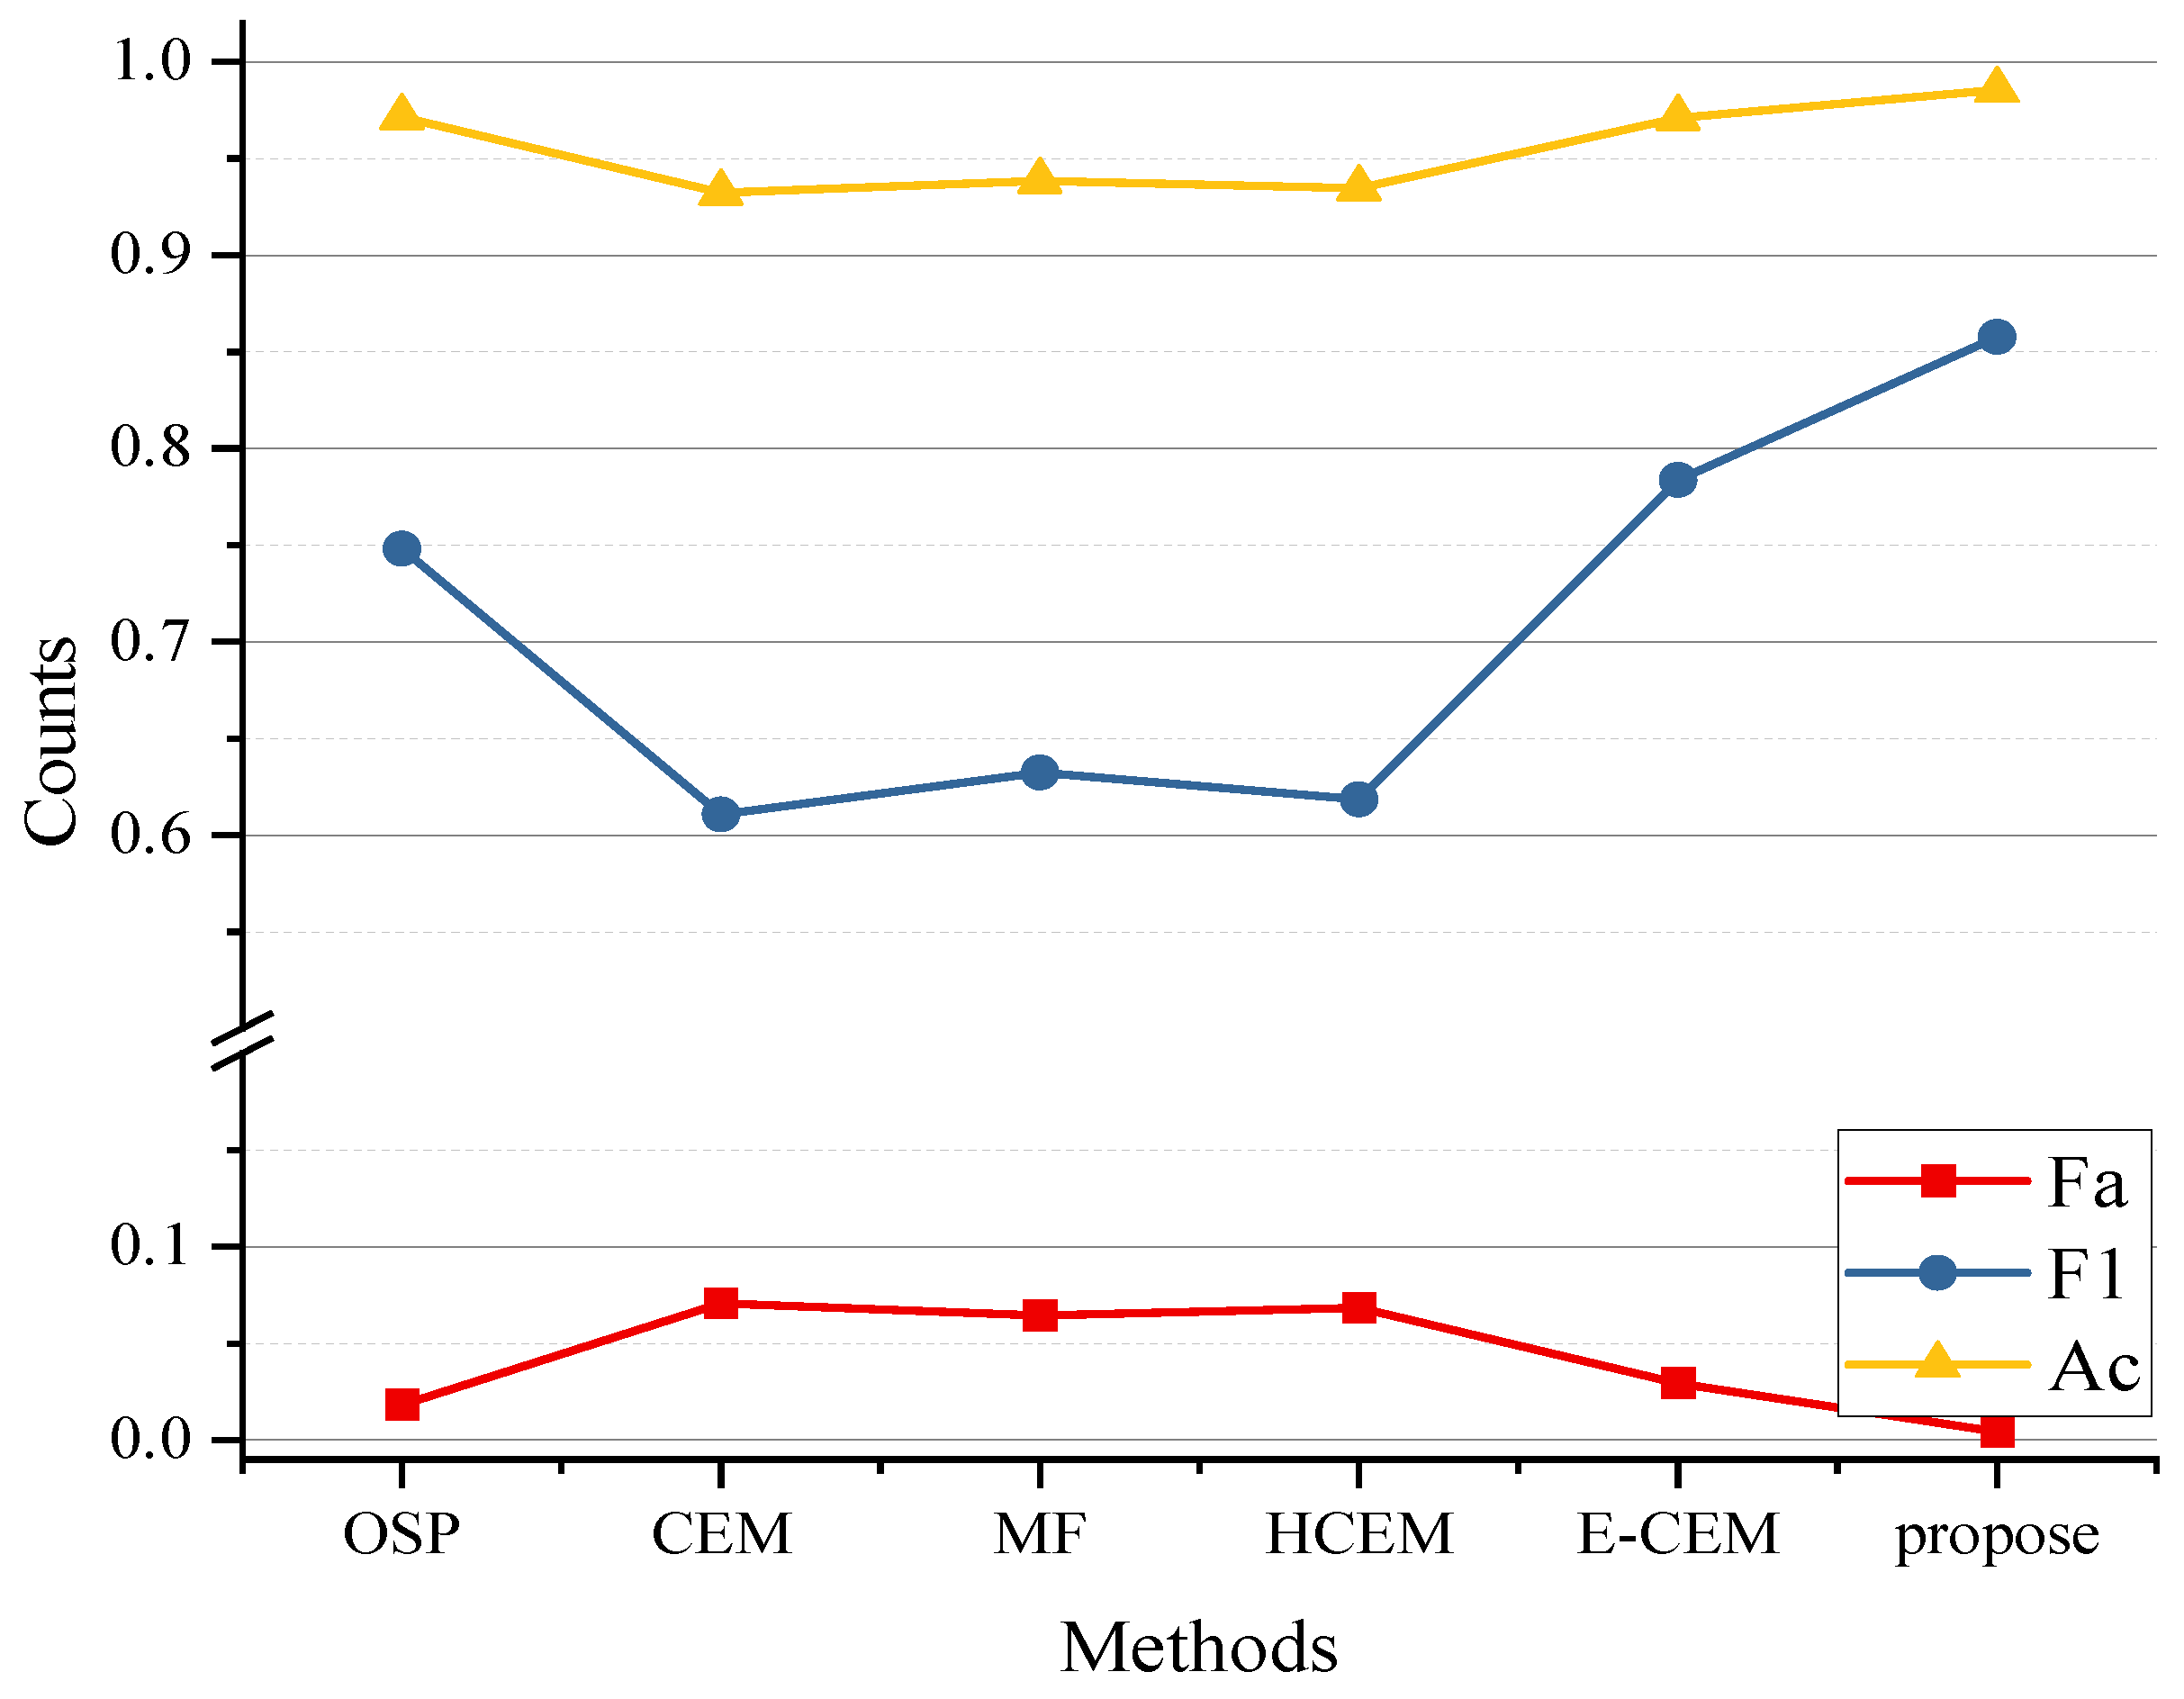
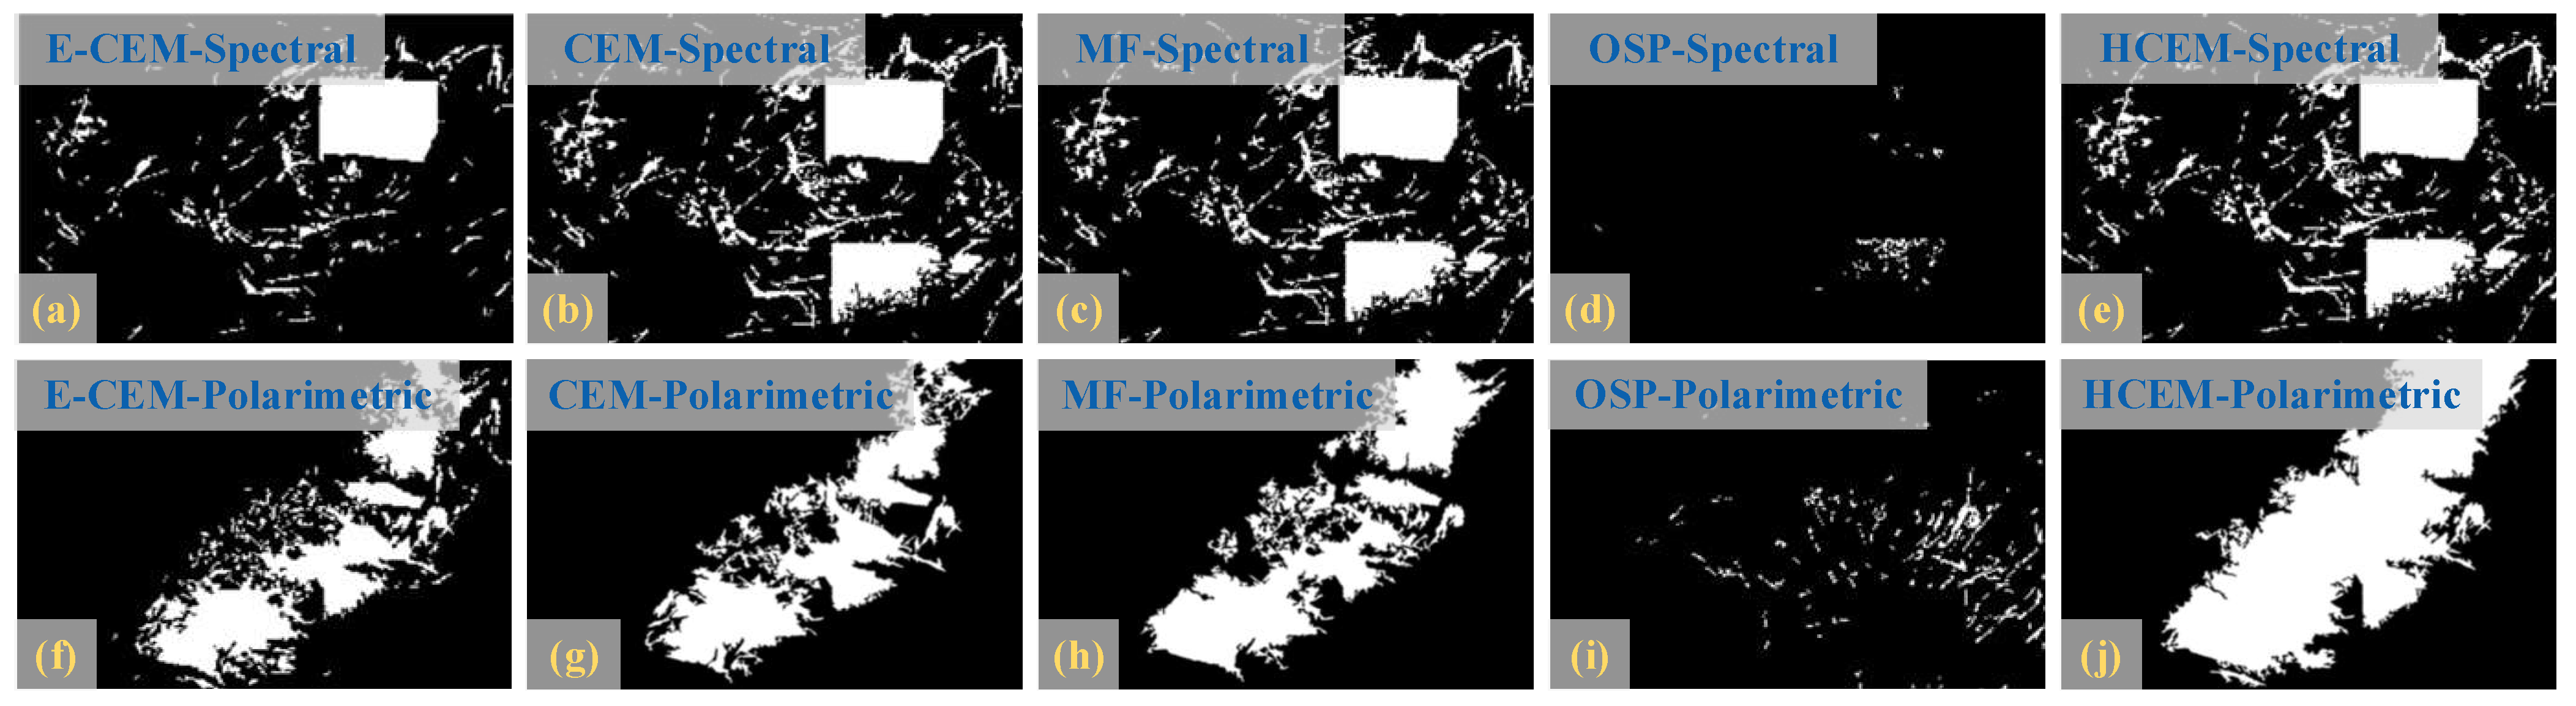
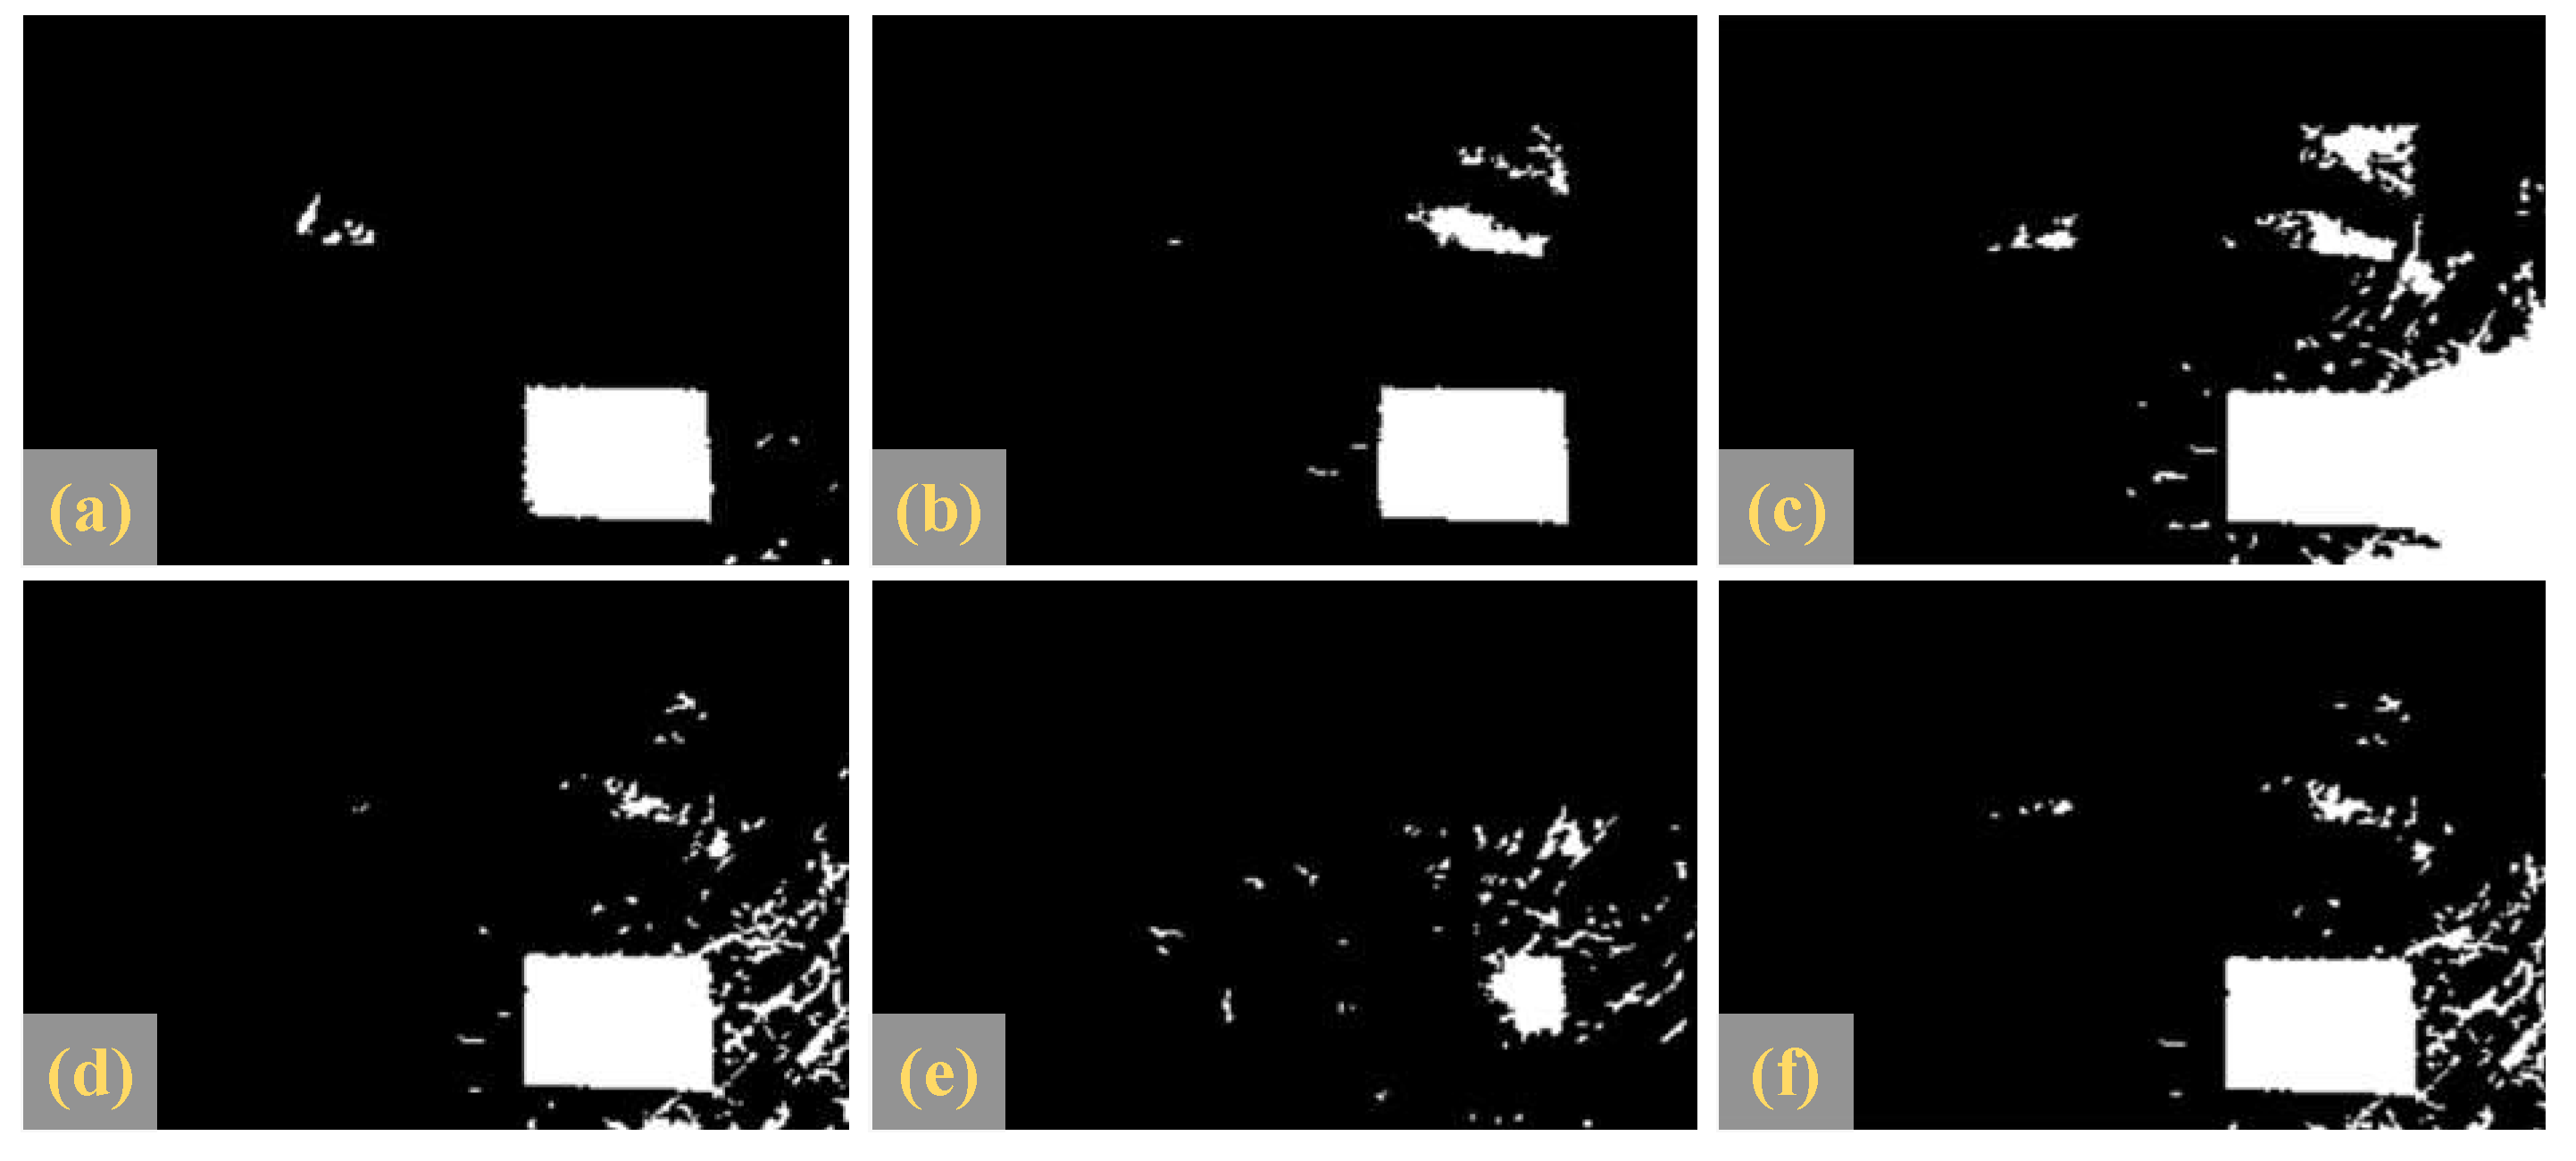
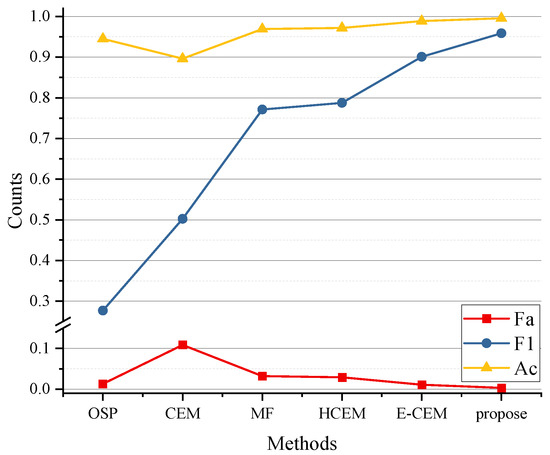
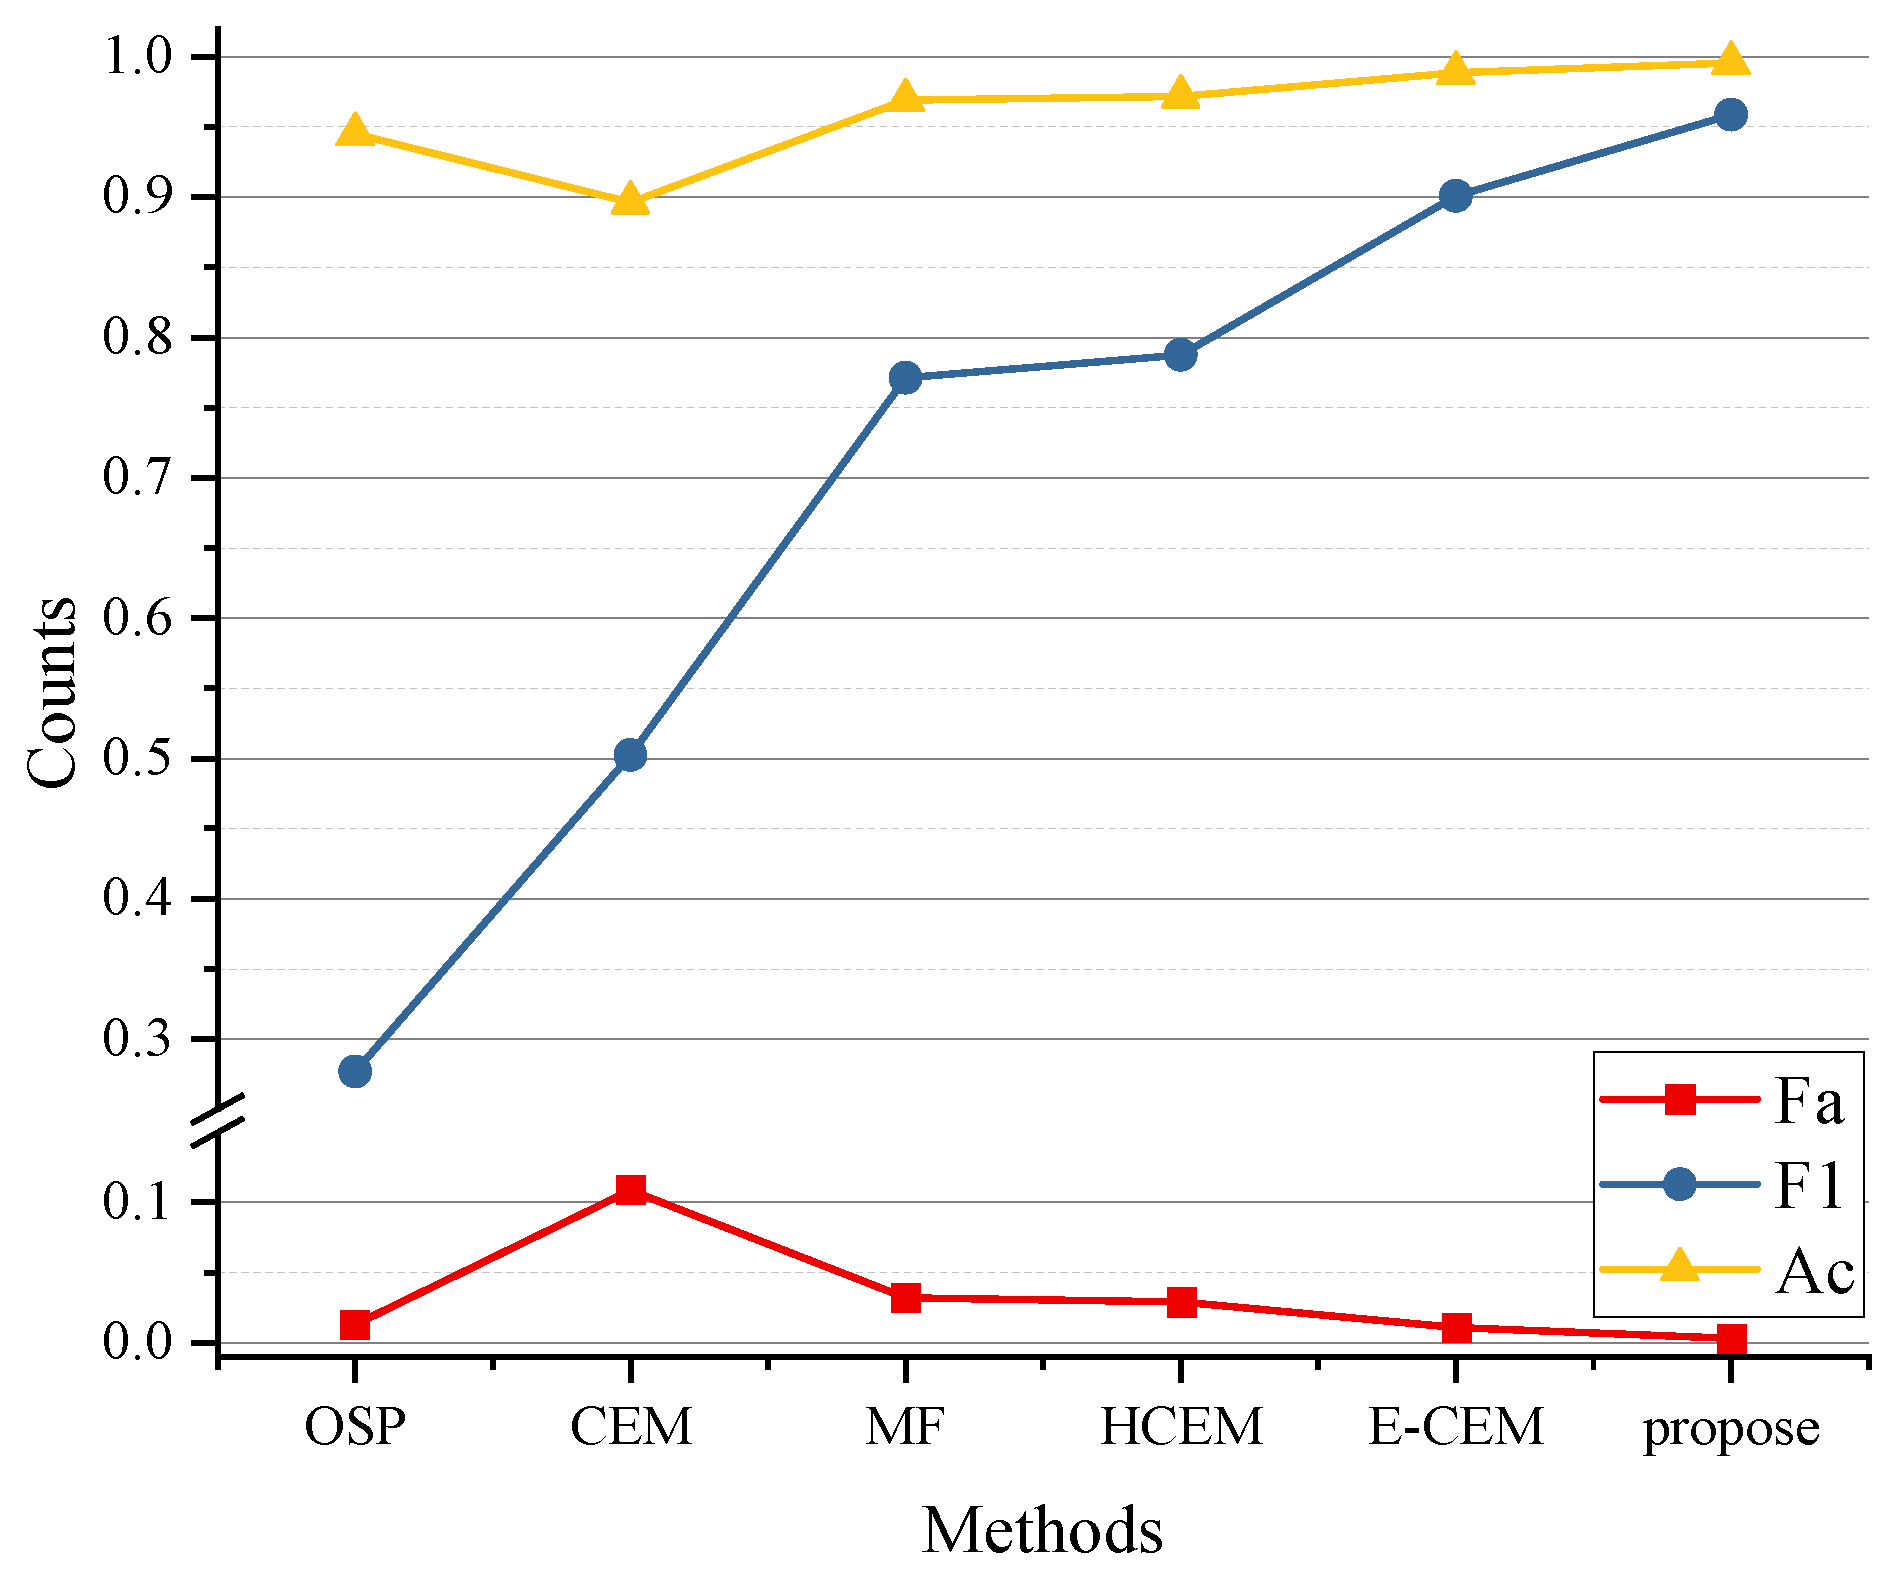
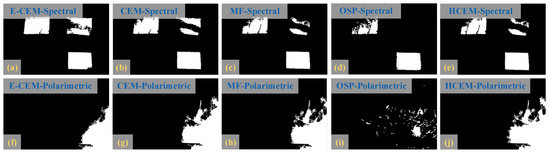
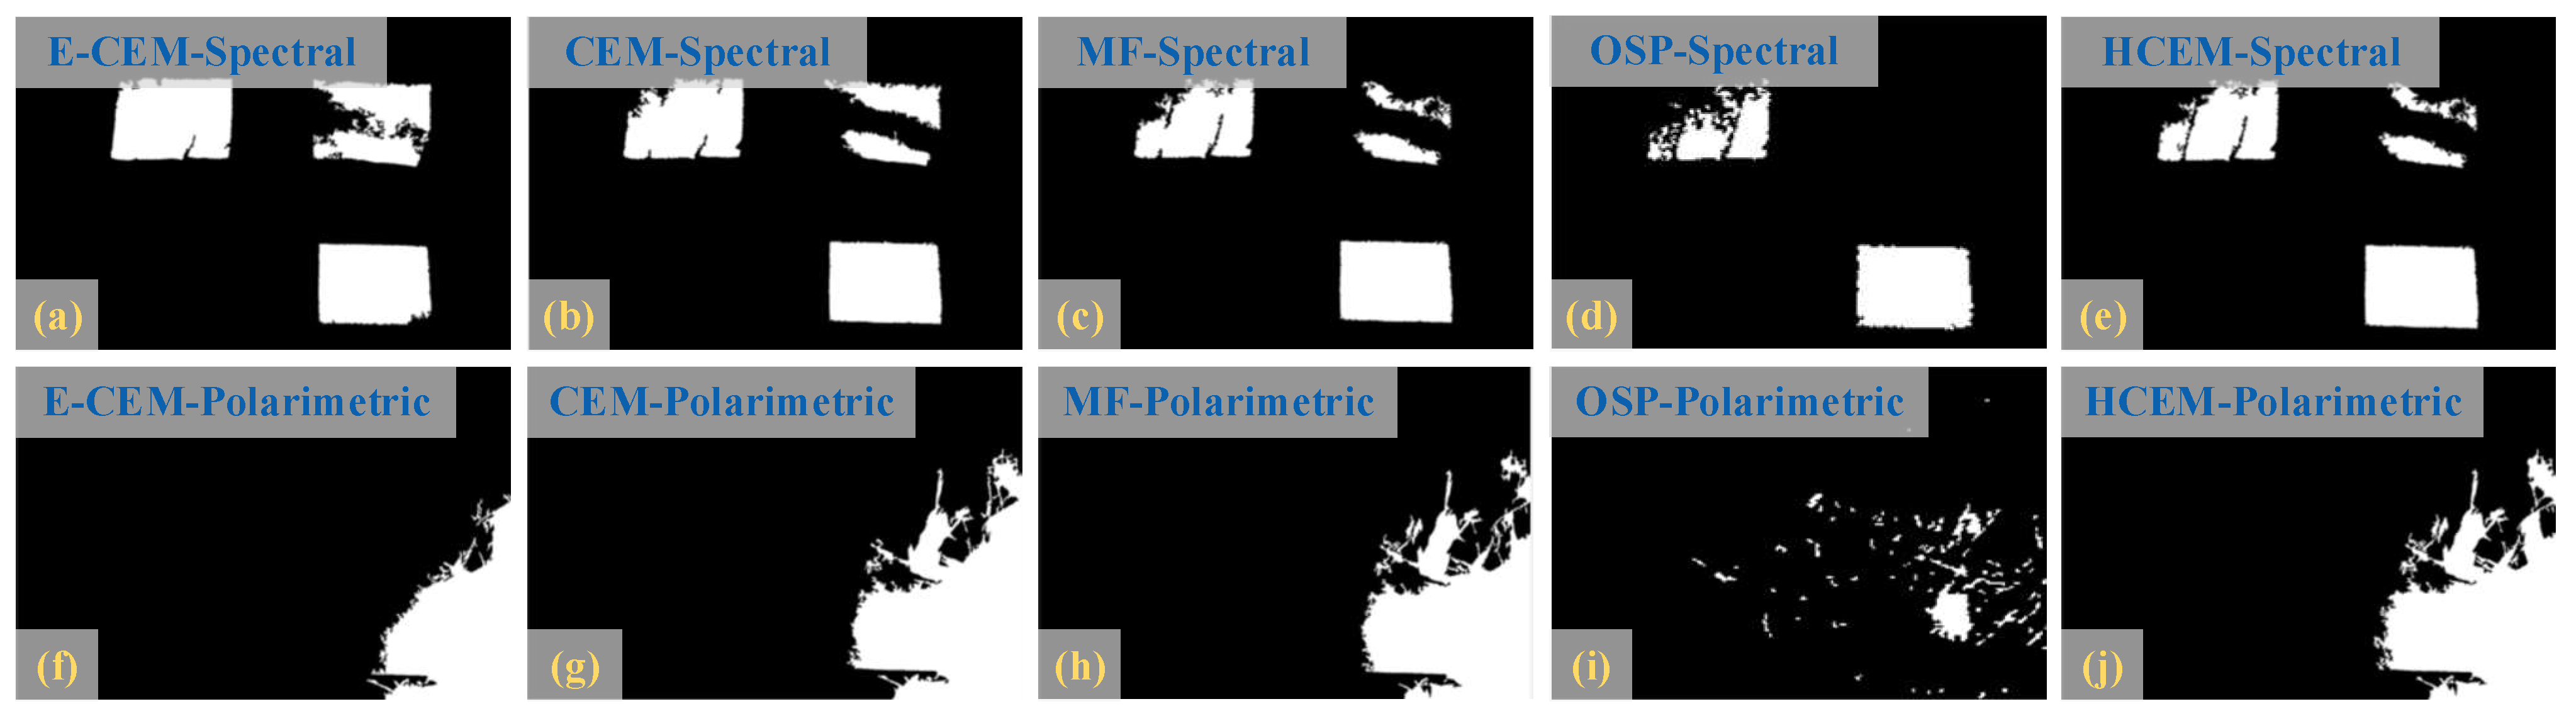


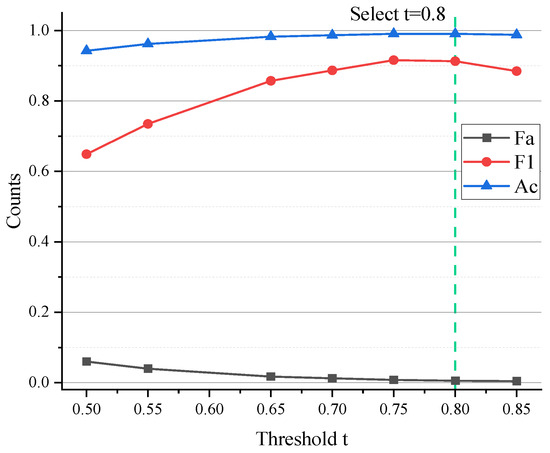
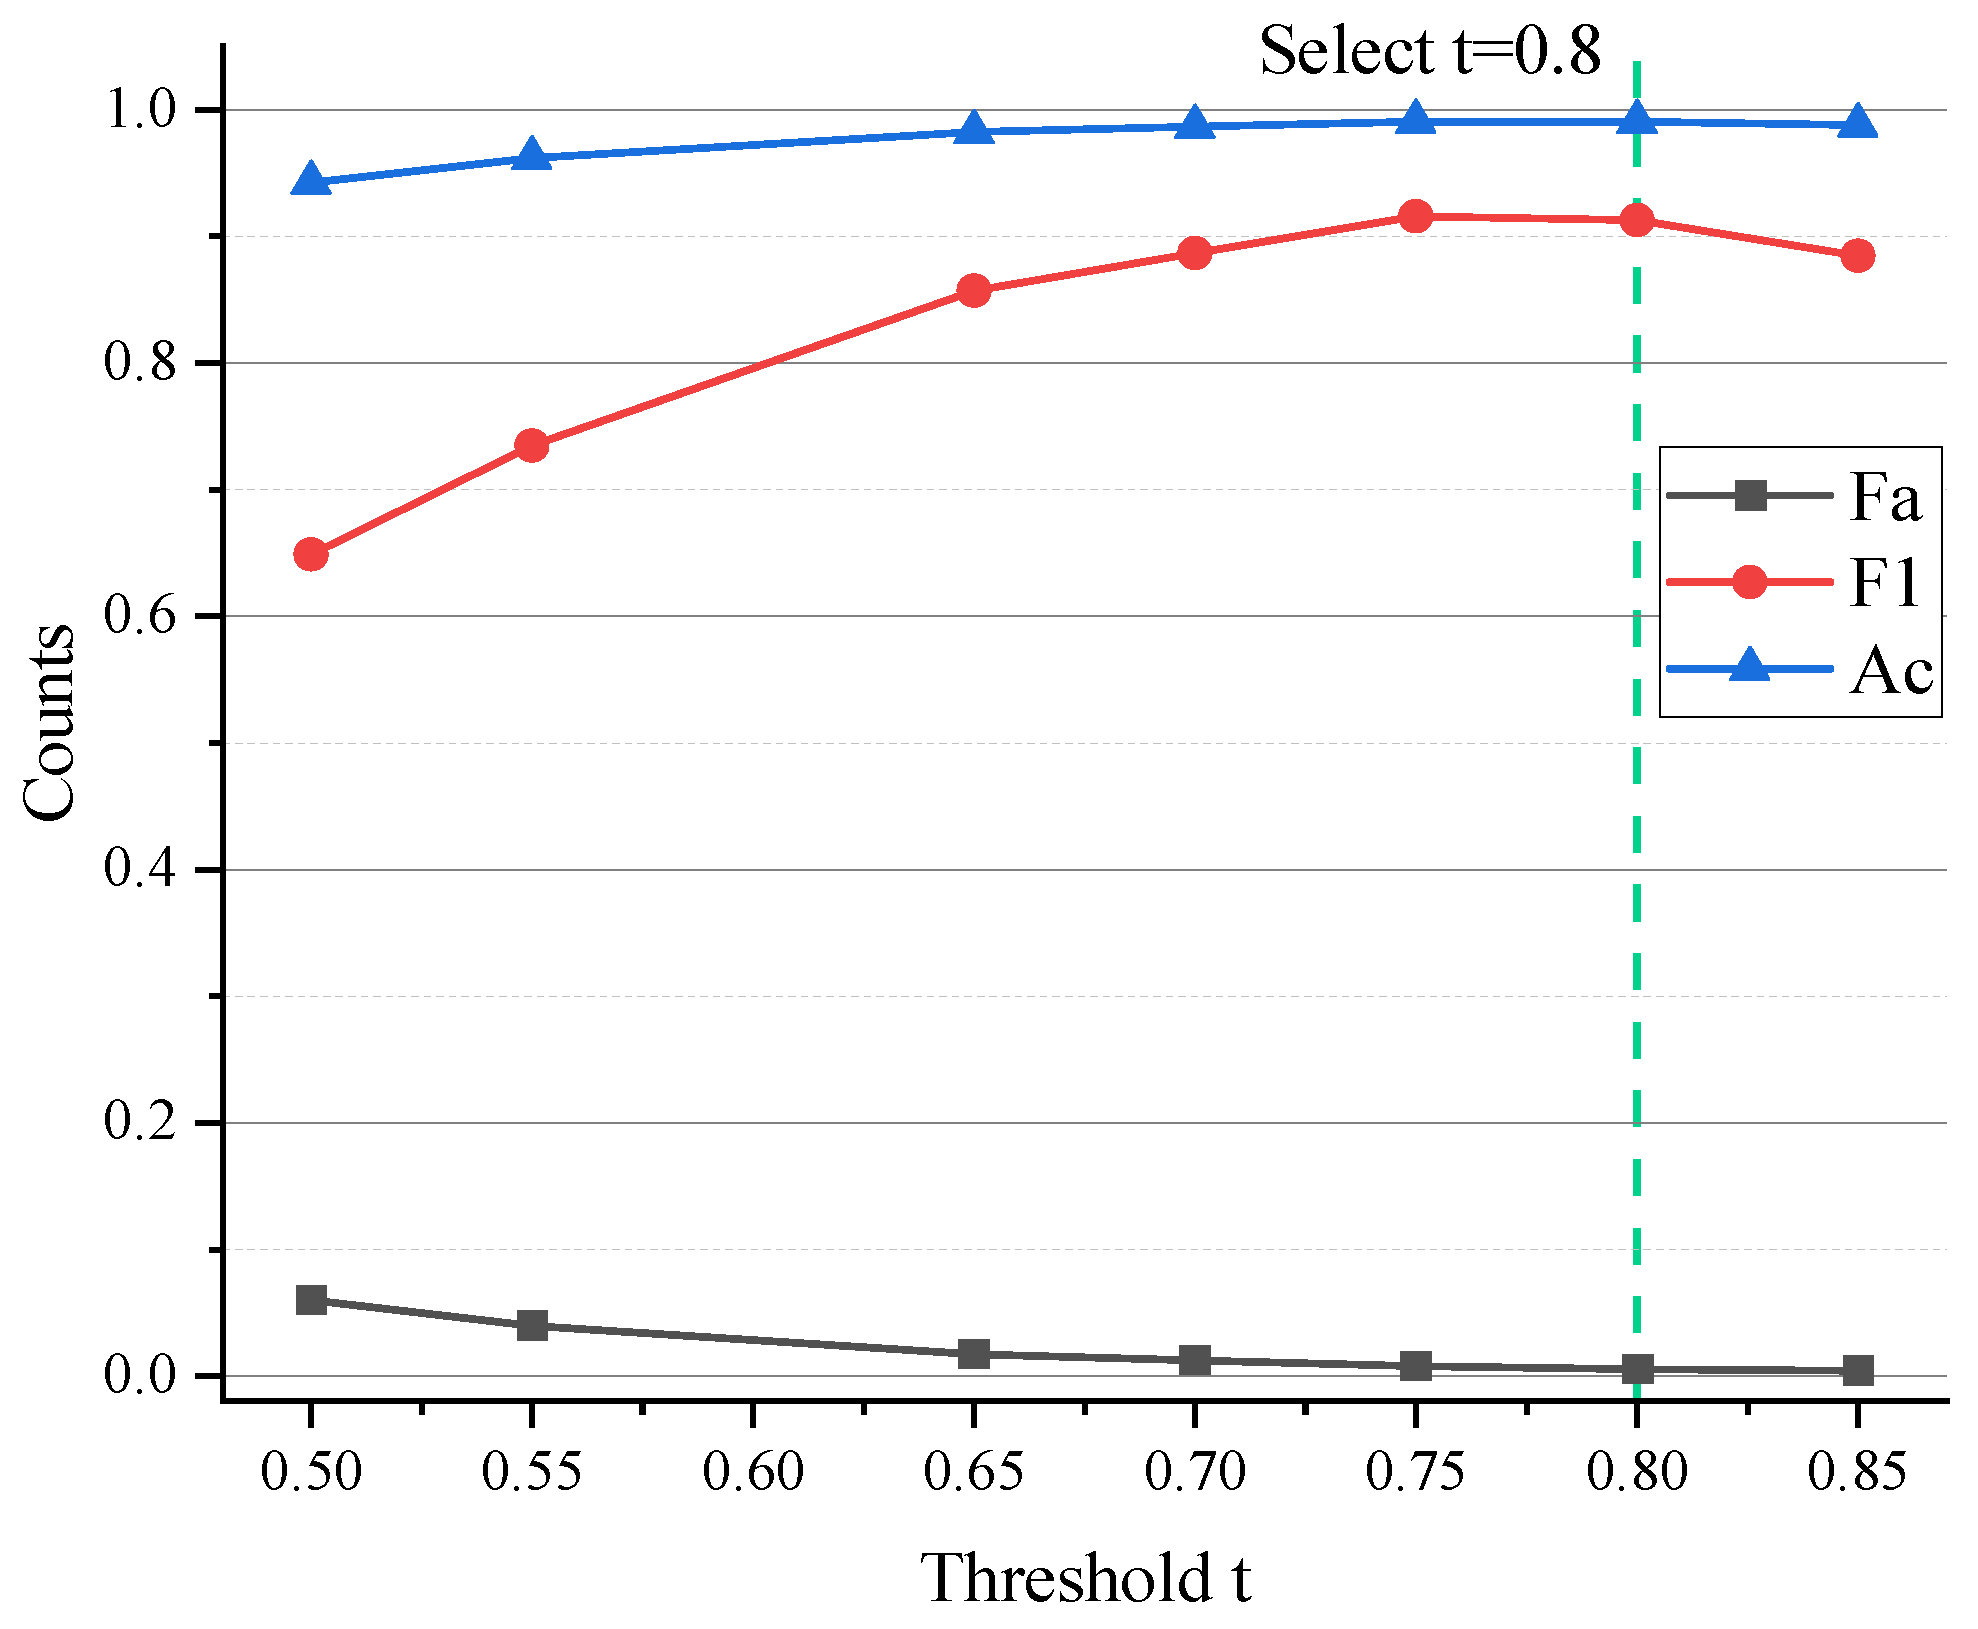
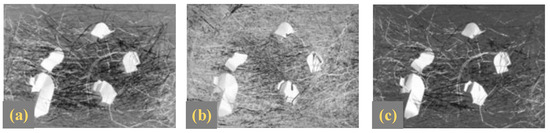
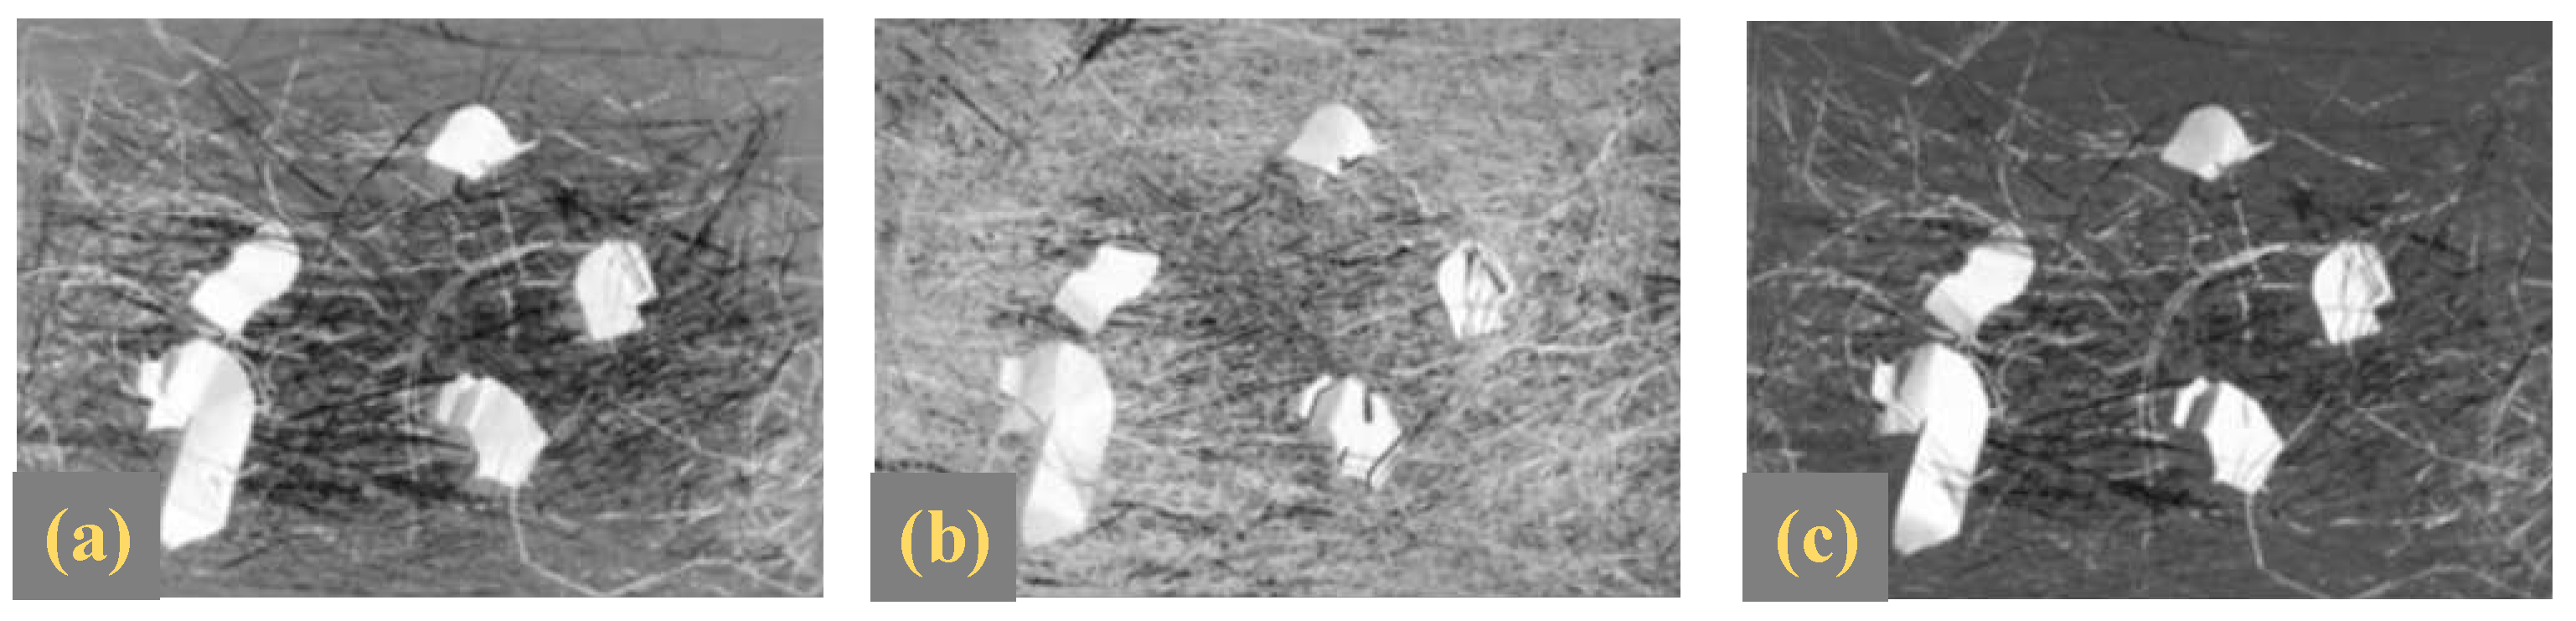

Disclaimer/Publisher’s Note: The statements, opinions and data contained in all publications are solely those of the individual author(s) and contributor(s) and not of MDPI and/or the editor(s). MDPI and/or the editor(s) disclaim responsibility for any injury to people or property resulting from any ideas, methods, instructions or products referred to in the content. |
© 2026 by the authors. Licensee MDPI, Basel, Switzerland. This article is an open access article distributed under the terms and conditions of the Creative Commons Attribution (CC BY) license.