


Highlights
What are the main findings?
- An integrated multi-platform observational framework combining Raman lidar, cloud radar, in situ measurements, satellite products, and aerosol models resolved the rapid transition from regional smoke to transported mineral dust during the “Cerberus” heatwave.
- Aerosol properties shifted markedly across the transition, with smoke characterized by enhanced organic aerosol contributions and dust by increased coarse-particle influence and distinct depolarisation signatures.
What are the implications of the main findings?
- Coupling Lagrangian transport analyses with satellite, ground-based remote sensing, and in situ products provides a robust source–receptor framework for distinguishing overlapping aerosol regimes.
- The observed contrast in smoke–cloud and dust–cloud interactions suggests that rapid aerosol regime changes can substantially modify cloud microphysical processes, which is an important consideration for regional climate assessments.
Abstract
This study demonstrates a synergetic multi-instrument and modelling approach for the rigorous characterisation of rapid aerosol regime transitions, applied to an exceptional atmospheric event over the RADO-Bucharest station during the July 2023 “Cerberus” heatwave. By anchoring our analysis in high-power Raman lidar profiling, integrated with sun-photometry (GRASP inversions), near-surface chemical speciation (ACSM, Aethalometer), and Lagrangian transport models (FLEXPART, HYSPLIT), we quantitatively resolve the vertical dynamics of shifting aerosol plumes. We identify a definitive two-phase evolution: a regional biomass-burning fine-mode plume advected at 2 km altitude on 12 July, abruptly displaced by a coarse-mode Saharan mineral dust intrusion at 3 km altitude on 13 July. Convective planetary boundary layer (PBL) growth drove the daytime entrainment of these lofted layers, while high-resolution Doppler wind lidar measurements confirm that nocturnal subsidence provided the mechanical forcing necessary to entrain these lofted layers during the night into the planetary boundary layer, driving near-surface severe air quality degradation. Furthermore, parameterised scenario demonstrations indicate that these aerosol layers influenced the subsequent cloud microphysical evolution. Organic smoke aerosols acted as cloud stabilisers, with simulated high droplet concentrations suppressing collision–coalescence and locking the hydrometeor population in a non-precipitating liquid state (median reff_liq ∼ 5.0 ± 1.2 μm). Conversely, the subsequent mineral dust intrusion provided potent ice nucleating particles, triggering the Wegener–Bergeron–Findeisen process. This catalysed a rapid phase transition into a deep glaciated system (reff_ice ∼ 49.7 ± 12.5 μm) and established a bimodal melting layer that culminated in widespread washout. This work underscores that high-resolution vertical profiling, specifically via Raman lidar, is indispensable for resolving transient atmospheric events and parameterising aerosol-mediated modifications to the regional hydrological cycle.
1. Introduction
Aerosols represent one of the most significant sources of uncertainty in current climate models due to their diverse chemical composition, varying physical properties, and complex atmospheric interactions [1]. These particles originate from a diverse array of natural and anthropogenic sources, ranging from primary emissions like sea salt and mineral dust to secondary processes involving combustion products and urban pollutants. Their impact on the Earth’s radiative balance is twofold, manifesting through direct scattering and absorption of solar radiation, as well as indirect effects by acting as cloud condensation nuclei [2]. In regional contexts, particularly over Eastern Europe and the Balkans, the atmosphere serves as a critical junction where continental air masses converge with long-range transport corridors from the Sahara and regional emission hotspots [3,4]. Consequently, the regional atmosphere is frequently subject to the simultaneous presence or rapid succession of contrasting aerosol types, requiring advanced observational frameworks to disentangle their individual contributions [5,6]. The rapid transition between these contrasting aerosol regimes, such as the succession of biomass-burning smoke and mineral dust within a single day, represents one of the most challenging atmospheric scenarios to monitor. These events are often driven by the intersection of distinct transport pathways, where shifting synoptic configurations—facilitated by cold fronts or tropopause folds—can suddenly replace regional smoke plumes with long-range advections of crustal particles. Seasonality plays a decisive role in the frequency of such events. In Eastern Europe, spring (April–May) is typically dominated by intense Saharan dust outbreaks at higher altitudes, while summer and early autumn (July–September) see an increase in regional agricultural fires and wildfires [7]. The ability to characterise these high-frequency dynamics, where one layer is vertically displaced or “washed out” by another in just a few hours, is essential for improving air quality forecasts and understanding the chemical state of the boundary layer [8]. This complexity is further compounded by aerosol–cloud interactions, as both smoke and dust influence cloud microphysics through distinct pathways. While smoke aerosols, rich in soot and organics, primarily act as cloud condensation nuclei (CCN) to reduce droplet size and increase cloud coverage, mineral dust particles are particularly effective as ice nucleating particles (INPs). In a rapid transition scenario, the sudden introduction of coarse dust into a smoke-dominated environment can trigger a shift from liquid-phase to mixed-phase or ice-phase clouds. Recent synergetic studies using cloud radar and lidar have identified “dust-embedded” clouds that exhibit unique properties, such as heterogeneous ice nucleation at the cloud top occurring simultaneously with liquid droplet activation in the mid-section [9]. Characterising these transitions requires a synergetic approach that bridges the gap between columnar integrated properties and vertically resolved profiles, as single measurement techniques or satellite observations can be limited by cloud cover or vertical blind zones [10].
The Copernicus Atmosphere Monitoring Service (CAMS) is currently producing a global reanalysis of reactive trace gases, greenhouse gases, and aerosol concentrations [11]. However, numerical tools such as CAMS often struggle to capture ephemeral fluctuations due to their limited spatial resolution and coarse emission inventories, which may not account for real-time fire outbreaks. Evaluations at Aerosol, Clouds and Trace Gases Research Infrastructure (ACTRIS) sites have revealed a consistent negative bias in modelled profiles within the first 2–3 km of the atmosphere, often missing the intensity of elevated layers before they are mixed down [12]. Furthermore, data assimilation cycles can lead to a “smoothing” effect where distinct smoke and dust peaks are blurred into a single, less accurate mixture. Despite these limitations, CAMS provides global and regional coverage with detailed information on atmospheric composition, including speciated aerosol and trace gas concentrations [13], aerosol optical properties such as size distribution and optical thickness [14], and comprehensive emission inventories that incorporate both anthropogenic [15] and natural sources, making it a valuable tool for contextualising regional pollution events [16]. Therefore, mathematical modelling plays a complementary role only when validated against ground-based observations.
Integrating Lagrangian models like FLEXPART—FLEXible PARTicle dispersion model [17,18,19] or HYSPLIT—Hybrid Single-Particle Lagrangian Integrated Trajectory [20,21] for trajectory analysis and advanced algorithms like GRASP—Generalized Retrieval of Atmosphere and Surface Properties [22] for detailed component profiles allows for a holistic understanding of the atmospheric column that observations or models alone might lack. Specifically, aerosol transport models such as FLEXPART or HYSPLIT identify the geographical sources and transport histories that drive these sudden shifts, providing the causal evidence for the change in air mass. Simultaneously, GRASP provides a vertically resolved quantification of individual aerosol species (based on fine mode and coarse mode separation), allowing for the precise disentanglement of overlapping layers as one regime is replaced by another [22]. Furthermore, the synergy between these methodologies reconciles ground-based point measurements with the broader spatial context provided by satellite observations and numerical simulations, yielding a consistent spatial–temporal representation of the atmosphere. This integrated approach is essential for resolving transient events that may otherwise be under-sampled due to cloud interference or the inherent spatial constraints of individual sensors.
An exceptional atmospheric event was observed in July 2023 over the RADO-Bucharest station, Romania, characterized by a rapid shift in air-mass transport within a 24 h period. A dense biomass-burning smoke layer was followed immediately by a pronounced Saharan dust intrusion. Occurring between 11 and 14 July 2023, this episode illustrates the complex interplay between regional and long-range aerosol sources and highlights the importance of high-temporal-resolution observations for resolving such transient atmospheric dynamics. In the present study, a comprehensive suite of ACTRIS-compliant instruments, including multi-wavelength Raman lidar, sun-photometry, and near-surface in situ measurements, was employed to accurately monitor the evolution of the air column’s microphysical and optical properties. The analysis demonstrates how the synergy of ground-based remote sensing and numerical modelling can resolve complex transport scenarios and explore the vertical dynamics that connect long-range transport with local meteorological conditions and cloud formation.
This paper is organized into five main sections. Section 2 details the multi-tiered observational framework at the RADO-Bucharest station, describing the synergetic use of active and passive remote sensing (lidar, sun-photometer, cloud radar, microwave radiometer), near-surface chemical speciation instruments (ACSM, Aethalometer), and numerical modelling tools (FLEXPART, HYSPLIT, GRASP, CAMS). Section 3 presents an integrated analysis that combines comprehensive aerosol characterisation—encompassing both lofted layers and near-surface observations—with detailed source attribution and chemical speciation. Section 4 contextualises these observations, further linking these findings to the microphysical evolution of clouds during contrasting aerosol regimes. Finally, Section 5 synthesises these key findings, highlighting the necessity of multi-instrument synergy in resolving transient atmospheric events, which can further improve air quality forecasts and our understanding of the regional hydrological cycle.
2. Materials and Methods
2.1. Site Description, Synergy of Instruments and Models
RADO-Bucharest is located in Magurele (44.34°N, 26.01°E, 77 m a.s.l.), approximately 8 km southwest of Bucharest centre. As a Global Atmosphere Watch (GAW) regional site (https://nflabelling.actris.eu/facility/99 last accessed on 16 June 2026) and a prominent node within the ACTRIS infrastructure (https://www.actris.eu, last accessed on 16 June 2026), the station adheres to strict standardisation and quality assurance protocols, ensuring the production of interoperable datasets (https://data.actris.eu, last accessed on 16 June 2026) essential for monitoring high-frequency atmospheric dynamics.
The local meteorology and atmospheric composition are defined by strong seasonal contrasts, both in terms of temperature and air-mass transport patterns. Seasonal variability exerts a significant influence on the prevailing aerosol regimes at the station. During summer and early autumn (July–September), atmospheric composition is predominantly affected by regional agricultural burning and wildfire emissions, occasionally coupled with long-range transport of mineral dust. In contrast, winter conditions are generally characterised by enhanced contributions from local residential heating sources and the persistence of stagnant air masses, which favour the accumulation of near-surface pollutants. Furthermore, the site is characterised by persistently high relative humidity throughout the year, resulting in a high frequency of low-level clouds and fog. These conditions render RADO-Bucharest particularly suitable for investigating aerosol–cloud interactions, including the transformation processes occurring at the interface between dry aerosol particles and hydrometeors.
The comprehensive characterisation of complex atmospheric events, such as the rapid transition from biomass-burning smoke to mineral dust observed in July 2023, necessitates a multi-layered observational and numerical framework. At the RADO-Bucharest station, this is achieved through the technical and scientific integration of active and passive remote sensing, high-resolution near-surface in situ monitoring, and advanced atmospheric transport modelling. The fundamental added value of this synergy lies in its ability to reconcile the varying spatial and temporal scales at which aerosol processes occur, bridging the gap between local surface loading and long-range transport in the free troposphere [23].
To investigate the 11–14 July 2023 event, this study employs a multi-tiered synergetic framework designed to resolve the rapid transition between the observed aerosol regimes. Rather than relying on isolated measurements, which are inherently limited by vertical blind zones, cloud attenuation, or an inability to capture lofted plumes before surface entrainment, we employ a combined retrieval strategy. The synergetic use of GRASP algorithms combines lidar and photometer data to refine the vertical profiling of fine and coarse mode concentrations [22]. This vertical characterisation is anchored by near-surface ACSM and Aethalometer in situ measurements, which provide precise chemical signatures and source apportionment at the receptor level. Simultaneously, Doppler wind lidar and CLOUDNET data introduce the necessary dynamic dimension, identifying vertical mixing mechanisms and distinguishing aerosol-induced hazes from thermodynamic cloud formation [24,25].
To provide a broader spatial and temporal context, these ground-based observations are coupled with meteorological and chemical transport models. FLEXPART and HYSPLIT identify the geographical sources and transport histories driving these sudden shifts, while CAMS aerosol speciation is validated against the physical reality of the atmospheric column [18,26,27]. This integrated approach overcomes the limitations of standalone numerical models, such as negative biases in lower-troposphere profiling during episodic events, yielding high-resolution spatial–temporal representation of the atmosphere.
2.1.1. Ground-Based Aerosol Remote Sensing
The columnar aerosol properties at the RADO-Bucharest station are characterised using a Cimel CE318 multi-band sun/sky/lunar photometer, which operates as part of the Aerosol Robotic Network (AERONET). The instrument’s measurement principle relies on automated direct sun observations and diffuse sky radiance scans at specific wavelengths, ranging for RADO-Bucharest from 340 to 1640 nm [28]. Primary parameters include the spectral AOD and AE, the latter being an indicator of particle size. To derive more complex properties such as the single scattering albedo (SSA), refractive indices, and volume size distributions, the inversion algorithm [29] is applied to the sky radiance measurements. These retrievals are subject to specific uncertainty constraints [30]. Aerosol typing is performed by examining the relationship between these retrieved parameters. For the specific case of rapidly changing regimes, the fine-mode fraction and AE serve as primary discriminators. Biomass-burning smoke is typically characterised by high AE values (>1.5) and a dominance of the fine mode, whereas mineral dust is identified by low AE values (<1.0) and a significant coarse-mode contribution [31]. This classification is further refined using the spectral dependency of the SSA and the Particle Linear Depolarisation Ratio (PLDR) retrieved from lidar, ensuring a robust attribution of the observed plumes to either organic combustion or crustal origins.
The vertical distribution of aerosol optical properties is monitored using a multi-wavelength Raman lidar system, which is a key component of the ACTRIS/EARLINET station at RADO-Bucharest. This high-power system operates by emitting laser pulses at 355, 532, and 1064 nm and detecting the backscattered radiation at both elastic and inelastic (Raman) wavelengths [32]. To ensure the highest degree of data quality and interoperability within the European network, raw lidar signals are processed using the Single Calculus Chain (SCC). This standardised tool automates the pre-processing and optical retrieval steps, incorporating advanced algorithms for dead-time correction, background subtraction, and signal gluing [33,34]. The primary EARLINET/ACTRIS-derived parameters include the spectral backscatter and extinction coefficients, as well as the Particle Linear Depolarisation Ratio (PLDR) at 532 nm. Uncertainty calculations within the SCC are performed using a rigorous error propagation approach, accounting for both statistical noise and systematic errors related to the calibration constants and reference altitudes [35]. The PLDR serves as the primary discriminatory parameter for the identification of non-spherical particles. Along with PLDR, LR is essential for distinguishing between the smoke and mineral dust regimes observed during the transition period, as these aerosol types exhibit distinct intensive parameters [36,37].
2.1.2. Near-Surface Aerosol In Situ Measurements
The characterisation of aerosol properties at the near-surface level at RADO-Bucharest is conducted using a comprehensive suite of aerosol in situ (AIS) instruments integrated into the ACTRIS observational framework. The key instrument among these is the Aerosol Chemical Speciation Monitor (ACSM), which provides real-time, continuous measurements of non-refractory submicron aerosol (NR-PM1) mass concentrations, including organics, sulphate, nitrate, ammonium, and chloride fractions [38]. Simultaneously, the multi-wavelength Aethalometer (AE33) is employed to measure aerosol absorption at seven wavelengths, utilising a dual-spot technology that compensates for filter-loading effects to provide stable equivalent black carbon (BC) concentrations [39]. An optical counter continuously monitors the PM1, PM2.5 and PM10 mass concentrations. These ground-level observations are essential for verifying the descent and mixing of transported layers, such as the smoke and dust events observed in July 2023, into the PBL and quantifying their influence on local air quality.
Retrieval algorithms and source apportionment techniques are applied to these datasets to disentangle the contributions from various emission sources. For the organic fraction, Positive Matrix Factorisation (PMF) is utilised to identify specific organic aerosol (OA) components, either primary such as biomass-burning organic aerosol (BBOA), hydrocarbon-like organic aerosol (HOA), or secondary, oxygenated organic aerosol (OOA) [40]. This apportionment is critical for the July 2023 case study, as it allows for the quantitative identification of the smoke signature on 12 July. Concurrently, the Aethalometer model is used for BC source attribution, separating the BC contribution from fossil fuel combustion (BClf) and wood burning (BCsf) based on the spectral dependence of the absorption [41,42,43].
The added value of the AIS suite within the synergetic framework lies in its ability to provide a high-confidence chemical “ground truth” that complements the optical retrievals from remote sensing. While lidars and photometers identify the presence of transported layers in the column, the in situ instruments confirm whether these air masses have effectively reached the surface and influenced local air quality. For the short-lived events of 12–13 July, the correlation between elevated OOA, BBOA and BCsf concentrations with the lidar-detected smoke layers provides a comprehensive narrative of the air-mass transport, bridging the gap between long-range dynamics and near-surface exposure [44].
2.1.3. Cloud Remote Sensing
The continuous profiling of cloud properties at the RADO-Bucharest station is achieved through the CLOUDNET framework, which integrates a suite of active and passive remote sensing instruments [45]. The core instrumentation includes a 35 GHz Doppler cloud radar (MIRA-35), a CHM15k ceilometer, and a multi-channel microwave radiometer (MWR). The measurement principle relies on the synergy between these sensors: the cloud radar provides the vertical structure of ice and liquid water layers by detecting the backscatter from hydrometeors, while the ceilometer identifies the cloud base height and narrow aerosol layers with high precision. The MWR complements these active sensors by providing the total liquid water path (LWP) and integrated water vapour, which are essential for constraining the retrieval of Liquid Water Content.
The CLOUDNET processing chain generates a variety of standardised parameters used to characterise the atmospheric scene [46,47]. The primary output is the target classification mask, which distinguishes between various atmospheric components, including liquid droplets, ice particles, melting layer, insects, and aerosols. This classification is useful to assess the transition between aerosol-dominated and cloud-dominated profiles. Quantitative parameters such as Liquid Water Content (LWC), Ice Water Content (IWC), and cloud fraction are retrieved using a combination of radar reflectivity, ceilometer backscatter, and MWR-derived LWP [48,49]. The high temporal resolution of the CLOUDNET suite is particularly relevant for the July 2023 case study, as it allows for the detailed monitoring of cloud formation in the presence of mineral dust, facilitating the investigation of aerosol–cloud interactions [50].
2.1.4. Satellite Remote Sensing
Satellite observations provide the indispensable “top-down” perspective required to track the geographical evolution of aerosol plumes from their source regions to the receptor site at RADO-Bucharest. For the July 2023 case study, we used a synergetic use of specific satellite datasets to confirm the rapid transition between aerosol regimes. To validate the biomass-burning event on 12 July, MODIS thermal anomalies and Fire Radiative Power (FRP) data have been utilised to map active regional fires in the upwind air-mass trajectories identified by HYSPLIT. Note that only the FRPs for which the confidence was larger than 70 were chosen.
The integration of these satellite products helps overcome the “single-point” limitation of ground-based observations by confirming that the smoke and dust detected over RADO-Bucharest are part of large-scale transport features rather than local contamination.
2.1.5. Models
To complement the observational data at RADO-Bucharest, numerical modelling tools from the European Centre for Medium-Range Weather Forecasts (ECMWF) implemented in the CAMS (Copernicus Atmosphere Monitoring Service) are utilised to provide the necessary spatio-temporal chemistry context [11,51]. CAMS datasets were used to identify the dominant aerosol types in the atmospheric column and to track the vertical evolution of smoke and dust layers, providing a continuous temporal context that complements the episodic lidar measurements. These data are important for interpreting the transitions between 12 and 13 July 2023, as they offer a continuous narrative of the aerosol speciation that complements the episodic nature of the high-power lidar observations.
The Lagrangian history of the air masses arriving at the receptor site is simulated using the FLEXPART Lagrangian Particle Dispersion Model [17,19].
Model results are interpreted alongside high-resolution lidar observations and in situ aerosol measurements at RADO-Bucharest to overcome limitations associated with model spatial resolution (typically 0.1–0.4°), uncertainties in emission inventories, or PBL parametrisations [52,53]. The synergistic use of these observational and modelling tools offers a robust framework to analyse aerosol sources, transport, vertical mixing, and near-surface aerosol impacts, while improving confidence in model performance over the RADO-Bucharest site [7,54,55,56].
The atmospheric backward trajectories are computed using the HYSPLIT (Hybrid Single-Particle Lagrangian Integrated Trajectory) model, which relies on gridded meteorological datasets to trace the movement of air parcels. For this analysis, the model utilises the NCEP/NCAR Reanalysis I dataset, providing three-dimensional wind fields that include both horizontal and vertical velocity components (https://psl.noaa.gov/data/atmoswrit/trajtool, last accesed on 16 June 2026). The calculation is performed through a Lagrangian integration method, where the position of a virtual air parcel is tracked backwards from the receptor site at RADO-Bucharest for a specific duration—in this case, 72/96 h and starting altitude where the aerosol layers were detected by the lidar [55,57,58].
The Generalized Retrieval of Aerosol and Surface Properties (GRASP) is a versatile and robust inversion algorithm designed to extract comprehensive aerosol information from a variety of remote sensing observations [22]. Within the context of the RADO-Bucharest station, GRASP is utilised to enhance the synergy between active and passive sensors by simultaneously inverting lidar profiles and sun-photometer data [22]. The inputs for the GRASP retrieval in this study consist of the Range-Corrected Signal (RCS) profiles of the elastic backscatter signals provided by the High-Resolution EARLINET Lidar Pre-Processor (HiRELPP), the columnar AOD and sky radiance measurements provided by the AERONET sun-photometer. By integrating these vertically resolved and columnar datasets, GRASP produces the volume concentration profiles for both fine and coarse aerosol modes, which are instrumental in identifying the separate layers of biomass-burning smoke and mineral dust column-integrated estimates of the aerosol absorption optical depth, refractive index, single scattering albedo, and LR.
The accuracy of the retrievals is highly dependent on the quality and temporal synchronisation of the input data [22,59]. In the current study, 20 bins are used to retrieve the particle size distribution (10 for fine mode and 10 for coarse mode) for the [1000, 7000] m altitude range.
2.2. Data Processing and Analytical Methodologies
The overall methodology relies on a synergetic framework integrating ground-based active and passive remote sensing, near-surface chemical speciation, and atmospheric transport modelling to characterise rapid aerosol regime transitions. Figure 1 illustrates the synergetic data-processing workflow that integrates ground-based remote sensing, in situ observations, and atmospheric modelling tools to characterise aerosol–cloud interactions.
Figure 1.
Schematic workflow of the synergetic multi-instrument and modelling data-processing chain.
For the overall qualitative atmospheric scene characterisation, we relied on the CLOUDNET target classification, which allowed us to identify the time intervals for in-depth analysis. The detailed characterisation of aerosol properties was achieved using high-resolution, multi-parameter data from the Raman lidar, sun-photometer, Aethalometer, and ACSM. Data from the Raman lidar and sun-photometer are coupled via the GRASP inversion algorithm to derive vertically resolved fine and coarse aerosol profiles. Concurrently, near-surface chemical measurements from the ACSM and Aethalometer undergo Positive Matrix Factorisation (PMF) and Aethalometer modelling to yield quantitative source apportionment. Cloud properties were retrieved from the combined cloud radar and microwave radiometer data, specifically Liquid Water Content (LWC) and Ice Water Content (IWC). Finally, to provide a comprehensive, unified analysis of the physical, chemical, and dynamic evolution of the atmospheric column during rapid aerosol regime transitions, and to evaluate aerosol–cloud relationships, we analysed concurrent data from all instruments in parallel, supporting our conclusions with satellite observations (FIRMS) and atmospheric transport models (CAMS, FLEXPART, HYSPLIT).
2.2.1. Multi-Instrument Data Harmonisation and Processing
The integration of heterogeneous datasets—spanning active and passive remote sensing, near-surface chemical speciation, and target classification arrays—required a standardised data treatment protocol to ensure temporal synchronisation and physical consistency. A dedicated Python-based processing framework was implemented to systematically align, filter, and integrate the diverse data streams generated by the Raman lidar, sun-photometer, CLOUDNET algorithms, and the ACSM/Aethalometer suite.
To resolve the discrepancy between native instrument sampling rates (e.g., continuous high-frequency lidar profiling versus discrete 15 to 30 min integration intervals for in situ chemical analysers), all temporal vectors were resampled and interpolated to a unified temporal grid of 1 h.
An automated outlier exclusion filter was configured to remove instrument noise, transient local emission spikes, and precipitation-induced signal attenuation artefacts.
The standardised numerical arrays were utilised to calculate derived intensive parameters: the fine-to-coarse volume concentration ratios from the GRASP inversion outputs, the size-segregated mass fractions (PM1/PM10) from the optical counters, and the source-apportioned mass concentrations from the Aethalometer and the ACSM. This harmonised matrix established the mathematical baseline required to evaluate the aerosol–cloud microphysical transitions and vertical coupling mechanisms detailed in the subsequent sections.
The quantification of observational and retrieval uncertainties was integrated into the data-processing workflow to establish confidence intervals for the derived aerosol and microphysical parameters. For active remote sensing, uncertainties in the Raman lidar optical profiles were calculated using the EARLINET Single Calculus Chain (SCC) standard error propagation, which accounts for statistical signal noise and systematic errors related to calibration constants and reference altitudes. Sun-photometer uncertainties were defined by AERONET Version 3 limits, specifically ±0.01 to ±0.02 for Aerosol Optical Depth (AOD) and ±0.03 to ±0.05 for inversion products such as the single scattering albedo. Within the GRASP inversion framework, the reliability of the fine- and coarse-mode volume concentrations was enforced by restricting the dataset to outputs with a total inversion residual of ≤5. Near-surface chemical uncertainties for the ACSM and Aethalometer incorporated physical variables such as collection efficiency (CE) and relative ionisation efficiency (RIE), alongside the sensitivity of the Positive Matrix Factorisation (PMF) solution to the specified number of factors and seed values. For the CLOUDNET microphysical retrievals, errors associated with the microwave radiometer liquid water path (LWP) and the assumed droplet size distribution parameters were propagated pixel by pixel, generating dynamic confidence intervals for the calculated liquid and ice effective radii (reff_liq and reff_ice).
2.2.2. Methodology for Atmospheric Composition and Source Characterisation
The comprehensive analysis of atmospheric composition during the rapid transition event is achieved through a multi-tiered approach that bridges the gap between long-range transport dynamics and near-surface chemical signatures. The methodology integrates Lagrangian transport modelling, synergetic remote sensing retrievals, and high-resolution ground-based in situ source apportionment.
The geographical provenance and transport history of the air masses are established using the FLEXPART Particle Dispersion Model and HYSPLIT backward trajectories [20,21]. To attribute aerosol layers to specific sources, these trajectories are spatially overlapped with NASA Fire Information for Resource Management System (FIRMS) thermal anomaly maps (MODIS and VIIRS), identifying intersections with active regional biomass-burning source regions.
Vertical characterisation of the aerosol species is performed by integrating multi-wavelength lidar and sun-photometer data through the GRASP algorithm. For the cases described in this study, 15 min averaged RCSs were employed along with AOD and almucantar measurements taken within a 30 min window around lidar measurements. This provides vertically resolved volume concentration profiles for fine and coarse modes, allowing for the physical separation of smoke from mineral dust layers. These observations are qualitatively validated against CAMS global atmospheric composition forecasts, which provide a first-order identification of aerosol components such as organic matter, sulphates, and mineral dust within the column.
The chemical “ground truth” at the receptor level is determined using an ACSM for non-refractory submicron mass concentrations and an AE33 Aethalometer for black carbon signatures. Source apportionment is conducted using Positive Matrix Factorisation (PMF) to isolate biomass-burning organic aerosol (BBOA) and the Aethalometer model to separate solid fuel from liquid fuel. Finally, the physical link between the lofted layers and near-surface measurements is established by calculating the “vertical transit time” based on the vertical velocity profiles (w) from the Doppler wind lidar, confirming the entrainment of transported plumes into the planetary boundary layer (PBL).
2.2.3. Methodology for Aerosol–Cloud Interaction Analysis
The analysis of aerosol–cloud interactions integrates standard CLOUDNET target classification masks and retrieved microphysical products—specifically Liquid Water Content (LWC) and Ice Water Content (IWC)—to characterise the vertical cloud structure and hydrometeor phase distribution throughout the 11–14 July 2023 study period.
Quantitative parameters such as Liquid Water Content (LWC) and cloud fraction are retrieved through the synergetic combination of radar reflectivity, ceilometer backscatter, and MWR-derived LWP. To resolve the microphysical transitions characteristic of contrasting aerosol regimes, the liquid droplet effective radius (reff_liq) is derived from the retrieved LWC using a regime-dependent droplet number concentration (Nc). This approach allows for a physically consistent representation of the droplet population, accounting for the suppression of droplet growth in smoke-dominated conditions versus the enhancement of drizzle-mode radii during mineral dust events, thereby resolving the bimodal distribution of droplet sizes during washout events. Ice effective radius (reff_ice) is subsequently derived via temperature-dependent empirical relations based on radar reflectivity and ambient temperature, ensuring consistency across the melting layer.
To address the inherent variability in droplet populations, we implement a dynamic derivation of the liquid droplet effective radius (reff_liq) that explicitly accounts for the atmospheric aerosol environment based on the adiabatic assumption [60]:
where ρw is the density of water and k is the spectral dispersion parameter [61]. A value of k = 0.75 was set as a representative intermediate value within the range reported for continental and polluted cloud conditions. The methodology allows for the selection of specific droplet number concentration (Nc) values according to the prevailing aerosol conditions: high loading for smoke stagnation events (Nc ≈ 7.7 × 10⁸ m−3) and low loading for dust/drizzle-washout scenarios (Nc ≈ 1.0 × 10⁷ m−3), which are physically consistent with the contrasting aerosol regimes identified from the GRASP retrievals. The value selected for smoke stagnation events is also consistent with airborne observations of biomass-burning-affected clouds reported by Twohy et al. (2021) [62], who found median cloud droplet concentrations of approximately 7.8 × 10⁸ m−3 in smoke-impacted clouds. Their observations further showed that biomass-burning smoke substantially enhanced cloud droplet concentrations while reducing droplet size. In contrast, the value adopted for dust/drizzle-washout scenarios is treated as a diagnostic microphysical parameter rather than as a directly observed cloud droplet concentration. Its physical interpretation is supported by observations and modelling of mineral-dust—cloud interactions, which demonstrate that the size, concentration, chemical composition, and mixing state of mineral dust and dust–sea-salt particles can substantially modify cloud droplet formation and precipitation development [63]. This dynamic tuning enables the retrieval to capture the physical shift from small, smoke-inhibited droplets to larger drizzle-mode droplets during the dust intrusion. To validate the selected droplet number concentrations, we conducted a comprehensive sensitivity analysis (Appendix A Figure A1 and Figure A2). For the smoke intrusion event, varying the concentration across established bounds for aged regional biomass burning confirmed that maximum derived droplet radii remain below the 14 µm threshold required to initiate warm rain via collision–coalescence [64]. Conversely, evaluating lower concentrations representative of the coarse-mode mineral dust regime revealed that the effective radius rapidly surpasses this precipitation boundary [65,66]. To evaluate the transition to glaciated systems, the ice crystal effective radius is parameterised using an ice nucleating particle concentration specific to the dust-seeded regime, establishing the physical constraints required to assess the Wegener–Bergeron–Findeisen process. The selection of the ice nucleating particle concentration was further corroborated through an ice-phase sensitivity analysis (Appendix A Figure A3). By evaluating a range of concentrations, we identified the specific low-concentration regime (Ni ≈ 5.0 × 10⁴ m−3) that physically supports the observed mean ice effective radius of 49.7 µm within the deep glaciated system.
3. Results
3.1. Atmospheric Scene Characterisation
The complex atmospheric evolution observed over the RADO-Bucharest station during the 11–14 of July 2023 is exemplified through the target classification mask provided by the CLOUDNET suite of instruments, which resolves the high-temporal vertical succession of aerosol and hydrometeor layers (Figure 2).
Figure 2.
CLOUDNET target classification over RADO-Bucharest, 11–14 July 2023. Altitude is above sea level.
The CLOUDNET classification for the period of 11–14 July 2023 reveals a dynamic atmospheric structure characterised by a persistent aerosol presence in the lower troposphere and intermittent episodes of complex cloud development. The most prominent and continuous feature is a dense layer of “aerosols and insects” (dark red) that consistently occupies the altitude range up to approximately 3–4 km above ground. Note that the CLOUDNET “aerosols and insects” mask during summer inherently contains insect echoes and should not be interpreted purely as aerosol loading. This layer represents the heavily laden PBL and the lower free troposphere, maintaining its vertical extent even during the most stable periods. The sky conditions fluctuate between clear-sky subsidence and significant cloud intrusions. In the early hours of 11 July, high-altitude ice clouds were detected between 8 and 10 km (vertical profiles in the figure are truncated at 7 km to highlight aerosol features; high-altitude cloud presence is acknowledged in the raw data but omitted here for visual clarity), followed by localised low-level droplets and drizzle. During the afternoon of 11 July, convection developed within the tropical air mass, leading to pronounced vertical growth. From midday to late afternoon, cloud tops reached the upper tropospheric limit near 12 km. This convective system exhibited a complex phase structure, with a mixed-phase base of ice crystals and supercooled droplets transitioning into extensive upper-level ice anvils.
A notable transition to clearer conditions occurred during the daytime on 12 and 13 July, where the atmosphere above 4 km remained largely cloud free, except for sporadic, thin cirrus filaments above 10 km. Late on the night of 12 July, cumulonimbus clouds developed along the periphery of an advancing warm front, accompanied by a brief rain/drizzle event (2.77 mm over 21:36–22:42 UTC) and ice clouds extending up to 12 km, persisting for approximately one hour. Throughout these two days, the scene was dominated by a stagnant and persistent aerosol layer confined to the lowermost 3 km. This evolution culminated in the early morning of 14 July with the passage of a cold front, triggering deep convection. The resulting cloud system was characterised by widespread drizzle or rain below 4 km (6.16 mm over 03:47–05:19 UTC) and thick ice cloud formations extending up to approximately 11 km. This marked a clear transition from stable aerosol-dominated conditions to active precipitation and multi-layered cloud structures, persisting for about one hour.
To further detail the vertical structure and optical intensity of the aerosol layers identified, the attenuated backscatter coefficient retrieved from ceilometer data (Figure 3) provides a high-resolution physical counterpart to the categorical CLOUDNET classification mask.
Figure 3.
Ceilometer-derived attenuated backscatter coefficient time series, 11–14 July 2023. Altitude is above ground level.
The ceilometer attenuated backscatter coefficient time series (smooth product) reveals a highly structured atmospheric column throughout the 9–15 July 2023 period. A persistent and intense aerosol layer is observed in the lower troposphere, extending from the surface up to approximately 3–4 km over 11–14 July. This region, which remained stagnant during the mid-week anticyclonic ridge, is characterised by higher attenuated backscatter intensities. Initial observations on 9–10 July show this lower loading punctuated by short-lived high-altitude ice clouds between 9 and 11 km in the afternoon of the 10th. A period of significant instability late on 12 July led to deep vertical cloud development, reaching the tropopause limit, above 12 km. The most critical aerosol dynamics occurred during the transition on 12–13 July, where backscatter intensities in the PBL remained exceptionally high. On 12 July, a lofted aerosol layer was concentrated near 2 km altitude (highest intensity). Weaker layers were observed around 2.5 km and 4 km. This was subsequently displaced on 13 July by a more intense layer (higher intensity at approximately 3 km), which extended to ~5 km, signifying an intrusion from other regions. The arrival of these particles served as a catalyst for the deep convective system on 14 July, ultimately resulting in widespread precipitation and subsequent aerosol wet scavenging.
To quantify the integrated impact of the persistent aerosol layers on the entire atmospheric column, we examine the evolution of the columnar aerosol optical thickness and size-related parameters retrieved from sun-photometry. The columnar aerosol optical properties obtained from sun-photometer measurements provide an integrated perspective on the atmospheric load and particle size throughout the observation window (Figure 4).
Figure 4.
Photometer-derived columnar Aerosol Optical Depth (500 nm) and Ångström Exponent (440/870 nm), 11–14 July 2023.
The Aerosol Optical Depth (AOD) at 500 nm and the Ångström Exponent (AE) reveal distinct temporal phases tied to shifting atmospheric conditions.
During the initial phase (9–10 July), AOD values remained moderate, fluctuating around a mean of 0.1–0.3, though data availability was intermittently limited by high-altitude ice clouds and localized drizzle.
AOD values progressively climbed, reaching peak levels between 11 and 13 July that significantly exceeded seasonal background levels. This increase is primarily attributed to the long-range transport of aerosol layers detected aloft, consistent with the deep aerosol structures identified in the CLOUDNET target classification and ceilometer backscatter profiles. Superimposed on this long-range transport, diurnal variations in AOD are driven by the development of the planetary boundary layer (PBL), which modulates the mixing of both locally emitted pollutants and these transported layers.
The evolution of the Ångström Exponent provides further insight into the nature of the particles inhabiting the column. On 12 July, the AE remains consistently high (above 1.5), which indicates a strong spectral dependence of the AOD and suggests that the column is dominated by fine-mode particles. A notable transition occurs on 13 July, where a sharp decrease in the AE is observed, falling toward values near or below 1.0. This drop in AE, occurring while the AOD remains elevated, signifies a possible shift toward a coarser particle size distribution. The period concludes on 14 July with a significant reduction in AOD, likely resulting from the change in the synoptic regime and the wet scavenging associated with the arrival of the multi-layered cloud system and subsequent precipitation.
While the columnar measurements capture the total atmospheric loading, high-power lidar observations are required to resolve the precise vertical placement and optical signatures of the individual layers during these rapid transitions. In the following analysis, we focus on 12 and 13 July 2023, which represents the scientifically interesting time interval when the rapid transition occurred, and lidar multi-wavelength profiling is available. Figure 5 and Figure 6 illustrate the vertical evolution of the aerosol column through high-power Raman lidar observations, displaying the time–height cross-sections of Range-Corrected Signals (RCSs) and Volume Linear Depolarisation Ratios (VLDRs), alongside vertically resolved profiles of the particle backscatter coefficients and Particle Linear Depolarisation Ratios (PLDR) for 12 and 13 July 2023.
Figure 5.
High-power Raman lidar Range-Corrected Signals (1064 nm) and Volume Linear Depolarisation Ratios (532 nm) for 12 (left panel) and 13 July 2023 (right panel). Altitude above instrument.
Figure 6.
Lidar-derived vertical profiles of particle backscatter coefficients (355, 532, 1064 nm) and Particle Linear Depolarisation Ratio (532 nm) resolving aerosol layers on 12 (left panel) and 13 July 2023 (right panel). Altitude is above sea level.
The lidar observations effectively resolve the structural and optical transition between the two contrasting aerosol regimes observed during the mid-week stability. On 12 July, the RCS reveals a stable, stratified atmosphere with a prominent lofted layer situated between 1.5 and 2.5 km altitude. This layer is characterised by low PLDR values (typically <0.05), indicating a dominance of spherical, fine-mode particles consistent with aged biomass-burning smoke. The corresponding optical profiles at 10:30 UTC show a backscatter peak of approximately (2.0 ± 0.2) × 10−6 sr−1 m−1 at 532 nm, with PLDR values remaining below 0.05 ± 0.02, confirming the presence of predominantly small, non-depolarising organic particles. The upper layer (~2.7–4.2 km) shows a similar particle backscatter coefficient and PLDR. As shown later (back-trajectories), the air-mass source for both layers is similar.
Conversely, the atmosphere on 13 July is marked by the arrival of a significantly more intense and depolarising layer. The RCS time series displays the intrusion of a dense plume after 14:00 UTC, which displaces the previous layer and establishes a new maximum at approximately 3 km altitude. This feature exhibits backscatter coefficients at 532 nm reaching (2.0 ± 0.2) × 10−6 sr−1 m−1. The most striking discriminator is the sharp increase in both VLDR and PLDR. The vertically resolved profile on 13 July shows PLDR values exceeding 0.30 ± 0.05 within the plume core. This high degree of linear depolarisation is a definitive signature of non-spherical crustal particles, confirming the mineral dust attribution. Note that even if the layer decreases in intensity above 3 km, it shows similar PLDR up to ~5 km.
The vertical transport mechanisms and mixing processes that facilitate the descent of these aerosol layers to the ground are further investigated through high-resolution vertical wind speed profiles. While daytime entrainment of the lofted plumes (07:00–11:00 UTC and 14:00 UTC) was driven by the convective growth of the planetary boundary layer (PBL) reaching the elevated layers, we specifically focus on nocturnal periods to investigate secondary mixing mechanisms. The nocturnal vertical dynamics for the periods of 12–13 July and 13–14 July 2023, captured by the Doppler wind lidar (which operates exclusively at night due to daytime overheating), illustrate the physical mechanisms driving the downward transport of elevated aerosol layers after sunset. For visual clarity, we chose to present the narrow time ranges relevant for this study (Figure 7).
Figure 7.
Doppler wind lidar vertical velocity profiles capturing nocturnal downdraft entrainment (the negative values) for late 12 (left panel) and early 14 July 2023 (right panel). Altitude is above sea level.
During the night of 12–13 July, the atmosphere was characterised by a transition from late-evening turbulence into well-defined, organised vertical structures. Observations reveal a systematic pattern of alternating updrafts and downdrafts (Figure 7 left panel), with vertical velocities of −1.5 ± 0.2 m/s for the latter. A particularly pronounced interval of vertical motion was sustained between 21:00 and 23:00 UTC, coinciding with the passage of the peripheral region of a warm front and associated weak convective activity. These processes facilitated continuous vertical mixing within the lower troposphere. The alternating convective ascent and subsidence cycles provided the mechanical forcing required to breach the nocturnal boundary layer inversion, entraining the aerosol plumes detected by the Raman lidar into the near-surface environment, while PBL particles are also entrained by updrafts.
In contrast, the night of 13–14 July exhibited a more episodic yet dynamically intense feature associated with the rapid passage of the cold front and its accompanying deep convective activity. The most prominent observation was the rapid updraft (before 04:00 UTC) followed by a pronounced downdraft event during the early morning hours, approximately between 04:00 and 04:30 UTC. This event is visible as a deep-blue structure in the vertical velocity time series (Figure 7, right panel), as a well-defined region of strong negative values, extending from the upper boundary layer towards the surface, with sustained downward velocities exceeding −3.0 ± 0.2 m/s. Temporally, this intense subsidence immediately preceded the onset of the rain/drizzle event detected by the CLOUDNET target classification (Figure 2), confirming that the dynamic downward transport facilitated rapid cloud activation.
To evaluate whether the elevated plumes (shown in Figure 5 and Figure 6) effectively reached the surface and influenced the local air quality, we analyse the temporal evolution of near-surface particulate matter (PM) mass concentrations at the receptor level.
The temporal evolution of near-surface particulate matter (PM) mass concentrations (Figure 8) reveals a distinct departure from the typical sub-urban background levels observed at the RADO-Bucharest station [67]. The intensification of PM loading during the July 2023 event significantly exceeded these seasonal background values, reflecting the influence of long-range transport. As shown later, the peaks occurring on the 11th are associated with local, sub-urban pollution.
Figure 8.
Near-surface particulate matter mass concentrations (PM1, PM2.5, PM10, top panel) and corresponding fine-to-coarse fractions (bottom panel), 11–14 July 2023.
On 12 July, higher-than-usual PM1 concentrations and elevated PM1/PM10 ratios, during midday, when usually the PM mass concentrations are at minimum, correlated with the arrival of the organic-rich fine-mode aerosol detected aloft at an altitude of approximately 2 km. While continuous ceilometer backscatter profiles suggest the plume’s presence in the upper boundary layer prior to 07:00 UTC (Figure 3), the high-power Raman lidar provided a detailed optical snapshot at this time, confirming the fine-mode biomass-burning composition (Figure 5). The specific surface signature of these transported small-size particles—characterised by a sharp rise in the PM1/PM10 fraction—subsequently appeared in the in situ data, first between 07:00 and 11:00 UTC (Figure 8). This interval is consistent with the vertical mixing lag estimated from the Doppler wind lidar vertical velocity profiles.
Conversely, the transition on 13 July is characterised by a sharp rise in PM10 after 12:00 UTC, signifying the successful entrainment of coarse mineral particles into the surface layer. Following the detection of the layer aloft at approximately 14:00 UTC, the ground-level instruments registered the arrival of the dust from roughly 14:35 UTC onwards.
3.2. Source Attribution and Chemical Composition
To determine the geographical provenance and atmospheric evolution of the observed aerosol layers, a synergetic Lagrangian framework was employed, combining the FLEXPART (version 11) and HYSPLIT backward trajectory models. This multi-model approach allows for differentiation between regional emissions and long-range transported plumes, capturing rapid transitions in aerosol regimes. The transport pathways identified in Figure 9 and Figure 10 elucidate the rapid atmospheric transition experienced over RADO-Bucharest between 12 and 13 July 2023.
Figure 9.
FLEXPART residence time footprints for air masses arriving at RADO-Bucharest on 12 July at 2 km (left panel) and 13 July 2023 at 3 km (right panel).
Figure 10.
HYSPLIT 72 h/96 h back-trajectories superimposed on FIRMS active fire hotspots for 12 July at 2 km (left panel) and 13 July 2023 at 3 km (right panel). Orange dots represent the fires’ location (upper) or time (lower). The blue lines represent the back-trajectories, while the black lines represent the altitude of the air masses along the back-trajectories.
The transport history of air masses arriving at the RADO-Bucharest station was reconstructed using FLEXPART, driven by ERA5 reanalysis data from ECMWF with an hourly temporal resolution at a horizontal resolution of 31 km on 137 model levels. Simulations were initialised at the RADO-Bucharest station, at altitudes corresponding to the aerosol layers detected by lidar (2 km for 12 July 2023 10:00 UTC and 3 km for 13 July 2023 16:00 UTC). Figure 9 illustrates the FLEXPART footprint of the transport pathways of air masses associated with specific aerosol layers (BC for 12 July and mineral dust for 13 July).
To refine the source attribution, the transport pathways were spatially combined with NASA’s FIRMS thermal anomaly maps. FIRMS integrates observations from MODIS (Terra/Aqua) and VIIRS (Suomi-NPP/NOAA) sensors to detect active fire hotspots via thermal infrared emissions [68]. The fires provided by FIRMS were superimposed over HYSPLIT back-trajectories using a common coordinate system (52.5°W–29°E, 20–52.6°N), enabling direct correlation between air-mass pathways and regional biomass-burning events occurring during the three/four days preceding their arrival at RADO-Bucharest (Figure 10). Ensemble back-trajectories with durations of 72 h and 96 h were computed for 12 and 13 July, respectively. Fire events were identified when they occurred within a temporal window of ±1 h and a spatial distance of ±100 km from the air-mass pathway of each trajectory, following the approach described by Adam et al. (2020) [57]. HYSPLIT runs were performed for air masses arriving at the receptor 2 and 4 km altitudes on 12 July, and for arriving at the receptor 3 and 4.5 km altitudes on 13 July, respectively.
On 12 July 2023 at 10:00 UTC, the retro-plume calculated with FLEXPART for the smoke layer observed at approximately 2 km (Figure 9 left panel) indicates that the air masses passed over Central and Western Europe. The dominant sources of this smoke were located in Central Europe (higher residence time), suggesting that biomass burning and anthropogenic emissions from this region contributed significantly to the observed aerosol composition at this altitude. During transport, the smoke gradually interacted with aerosols in the lower layers, including dust, sulphates and primary organic aerosols. The combination of transport pathways and vertical mixing highlights the interplay between regional emissions and atmospheric stability in shaping near-surface aerosol concentrations. The HYSPLIT trajectory (Figure 10, left panel) confirms that this transport occurred within the lower free troposphere, frequently aligning with the top of the PBL. The ensemble back-trajectories arriving at 2 km and 4 km followed a similar transport pathway, extending across Central Europe before turning south-westward towards France and Northern Spain. The 2 km ensemble exhibited a larger spatial spread than the 4 km ensemble (Appendix A, Figure A4). A few fire detections were identified along the air-mass pathways; however, their FRP remained relatively low, below 100 MW (maxima of 72 MW and 20.4 MW for the 2 km and 4 km receptor). Along their transport pathways, the air trajectories were predominantly located at altitudes of approximately 3–4 km and 4–6 km for the 2 km and 4 km arrival trajectories, respectively. This geographical origin is consistent with the optical properties observed during this period, including the high Ångström Exponent (AE > 1.5) and fine-mode dominance confirmed by vertically resolved profiles.
By 13 July 2023 at 16:00 UTC (Figure 9, right panel), the atmospheric composition underwent a pronounced shift, as the previously dominant regional smoke was replaced by a dust plume at 3 km altitude. This dust layer reflected a mixture of Saharan dust transported from North Africa and continental dust originating from Europe, consistent with the observed mid-tropospheric dust dominance. Retro-plume analyses further indicate that the vertical distribution and composition of the aerosol layers during this period were strongly modulated by the interplay of regional emissions and long-range transport. The ensemble back-trajectories for 13 July (Figure 10, right panel) show pathways coming from North Africa, passing south of Spain and the Mediterranean region before crossing the Balkans. At the source, the air parcel (the majority of the individual trajectories) resided at a relatively low altitude (~2 km) within the Saharan convective boundary layer, facilitating efficient entrainment of mineral dust. A few fires were detected along back-trajectories, but their FRP was very low (maximum FRP was 9.4 MW). The ensemble covered a broader envelope after ~30 h back when the air mass, after descending trajectories, shows a more complicated pathway. Note that for the 4.5 km receptor (Appendix A Figure A4, right panel), no fire was identified along the pathways. The Saharan provenance distinguishes the 13 July plume from the regional smoke observed in preceding days, a distinction corroborated by the sharp decrease in the Ångström Exponent toward 1.0 and the elevated PLDR values (~0.3) detected by Raman lidar.
By effectively linking the regional fire activity with the subsequent intrusion of Saharan dust, the smoke layer observed on 12 July at ~2 km was attributed to regional biomass burning in Central Europe, while the coarse aerosol layer on 13 July at ~3 km was linked to long-range transport of Saharan dust, mixed with continental dust and potential regional smoke.
The investigation of aerosol types is further refined by evaluating the detailed microphysical properties of the atmospheric column derived from the synergy of coincident lidar and photometer measurements processed via the GRASP inversion algorithm. Figure 11 illustrates these retrieved changes in the aerosol microphysical parameters across the 12–13 July 2023 period.
Figure 11.
GRASP-retrieved fine and coarse mode volume concentrations and size distributions derived from synergetic lidar-photometer inversions, 12–13 July 2023: total column fine- and coarse-mode volume concentrations (top left); total column fine and coarse-mode size distributions (bottom left); profile of the fine- and coarse-mode volume concentrations (centre); profile of the ratio between coarse- and fine-mode volume concentrations (right).
On 12 July (07:34, 07:49, and 08:04 UTC), the atmospheric column exhibited fine-mode predominance throughout all three measurements. The column-integrated volume size distribution, shown in the bottom-left panel, displays a distinct fine-mode peak reaching approximately 0.06 μm3/μm2 at a radius of approximately 0.15 µm, while the coarse-mode distribution is comparatively flat, with peak values ranging between 0.02 and 0.03 μm3/μm2. This fine-mode dominance at the columnar level is mirrored in the vertical profiles, where both modes exhibit similar spatial structure, but the fine mode consistently prevails in the layers at and above 3 km. Three distinct layers are identifiable: a first layer near 2.8–3.0 km, where the fine-mode concentration peaks at around 15 μm3/cm3 against a coarse-mode peak of around 8–9 µm3/cm3; a second layer between 3 and 4 km, where the fine-mode signal decreases to around 8–9 μm3/cm3 and the coarse-mode approaches near-zero values; and a third layer between 4 and 5 km, where the fine mode rises again to a local maximum of 30 µm3/µcm3 while the coarse mode recovers mostly to 10 µm3/cm3.
The right panel resolves the coarse-to-fine volume concentration ratio, which further supports this layer interpretation. The first and third layers are fully dominated by fine particles, with ratios remaining well below 1 throughout. The second layer shows a slightly closer balance between the two modes, with a modest coarse influence pushing the ratio marginally above 1. The elevated ratio values observed above 6 km should be interpreted with caution, as they arise from the near-zero absolute magnitudes of both modes at those altitudes rather than from any genuine coarse-mode enhancement.
By 13 July, the microphysical state of the column undergoes a structural transition driven by the Saharan dust intrusion. Consistent coarse-mode predominance is now evident across all four measurements in the column-integrated size distribution, with the coarse-mode peak reaching approximately 0.11 μm3/μm2. The fine mode shows some temporal evolution: the first measurement at 14:44 UTC exhibits an elevated fine-mode peak of approximately 0.08 μm3/μm2, which subsequently decreases to around 0.05 μm3/μm2 in the later retrievals.
The vertical profiles reveal a massive, highly localized coarse-mode aerosol layer extending between 3 and 5.5 km altitude, with peak concentrations in the range of 60–75 μm3/cm3. This layer dominates the coarse-to-fine ratio panel across the same altitude range. At 14:59 UTC in particular, the fine-mode concentration within the 4.2–5.2 km sub-layer approaches near-zero values, causing the coarse-to-fine ratio to exceed 500, thus representing a direct reflection of the extreme coarse-mode dominance within the plume core rather than a retrieval artefact. Below 3 km, a shallow fine-mode-predominant layer is present, with a peak concentration of 25 μm3/cm3 at 14:44 UTC that progressively weakens in subsequent measurements.
To gain an initial understanding of the chemical nature of the particles distributed within the aerosol column as identified by the photometer-lidar synergy, we evaluate the aerosol speciation modelled by CAMS. Figure 12 illustrates the temporal evolution of aerosol composition over the RADO-Bucharest station from 11 to 14 July 2023. The left panel shows the absolute mass concentrations of modelled species, while the right panel displays their relative mass fractions, revealing distinct atmospheric regimes driven by synoptic-scale transport and local boundary layer dynamics.
Figure 12.
CAMS-modelled vertical aerosol mass concentrations and relative mass fractions, 11–14 July 2023: absolute values of the mass concentrations (left panel) and mass fractions to the total aerosol load (right panel).
During the initial study period (9–10 July), the composition was dominated by sulphates, representing the anthropogenic baseline of the sub-urban environment. During this interval, Lidar and CLOUDNET profiles confirm a highly decoupled vertical structure: while sulphates persist within the PBL, a distinct dust layer is present aloft at 5–8 km. This decoupling is consistent with the thermodynamic stability of the lower troposphere, which prevents vertical mixing and isolates the local surface chemistry from the high-altitude mineral dust.
A notable regime shift appears on 11–12 July. Figure 12 shows a significant enhancement in organic aerosol mass after 12:00 UTC, corresponding to a smoke intrusion descending through the free troposphere. However, a quantitative discrepancy is observed here when compared with observational data: while the model captures the boundary layer entrainment past 12:00 UTC, the Raman lidar recorded the physical arrival of these smoke particles significantly earlier, between 07:30 and 11:30 UTC. This 3 h lag highlights the vertical transport delay inherent in chemical transport models under stagnant heat-dome conditions.
The period of 13–14 July marks the total dominance of mineral dust. The mass fractions in Figure 12 shift rapidly, with coarse-mode dust overwhelming all local species. This regime change coincides with the maximum total column volume concentration retrieved by GRASP on 13 July 14:44 UTC (µm3/µm2). Finally, the 15 July transition phase illustrates the atmospheric “clean-up”. As column-integrated dust concentrations decline, the relative mass fractions of local sulphates, organics, and black carbon recover, signalling a return to background conditions. This recovery is physically supported by the PBL transitioning into a moderately unstable state, as evidenced by the lidar mixing-layer height increase, which promotes the vertical dispersion of anthropogenic aerosols and brings the aerosol regime transition to a close.
To characterise the chemical composition at the near-surface level, the Aerosol Chemical Speciation Monitor (ACSM) provides real-time mass concentrations of non-refractory submicron aerosols, while the AE33 Aethalometer monitors equivalent black carbon (BC) signatures. Through PMF and the Aethalometer model, we quantify specific signatures such as biomass-burning organic aerosol (BBOA), less-oxidized oxygenated organic aerosol (LOOOA), more-oxidized oxygenated organic aerosol (MOOOA) and wood-burning-related black carbon (BCsf), establishing a robust chemical “ground truth” that validates the downward mixing of elevated plumes into the PBL. The chemical composition and source apportionment results retrieved from ACSM and Aethalometer data, which serve as the high-confidence observational ground truth for the distinct plumes arriving during the 12–13 July window, are presented in Figure 13 and Figure 14.
Figure 13.
ACSM-derived near-surface non-refractory submicron mass concentrations and organic aerosol source apportionment, 11–14 July 2023 (top panel), and source apportionment of organic aerosol (OA) factors (bottom panel).
Figure 14.
Aethalometer-derived equivalent black carbon (BC) mass concentrations and quantitative source apportionment (liquid vs. solid fuel), 11–14 July 2023.
The aerosol chemical composition near the surface during the initial phase of the event on 12 July provides primary evidence for the arrival of the biomass-burning plume. During the morning hours, the total organic mass concentrations as measured by the ACSM exhibited a significant intensification, reaching peak values of approximately 16.2 ± 0.9 μg/m3. Source apportionment through PMF confirmed that this spike was largely driven by a sharp rise in BBOA, which contributed maximum 1.49 ± 0.1 μg/m3 and MOOOA, which contributed 9.3 ± 0.1 μg/m3 to the total organic fraction during the morning smoke detection window. Simultaneously, the AE33 Aethalometer recorded a corresponding increase in equivalent BC loading, with total concentrations reaching 0.8 ± 0.1 μg/m3 during the morning peak. The source attribution model for BC identified an important contribution from wood-burning black carbon reaching approximately 0.15 ± 0.03 μg/m3, establishing a high-confidence chemical signature that mirrors the smoke layers detected aloft by the Raman lidar at 2 km. The long-range transported aerosols overlap on local contributions, highlighted by HOA and BClf, associated with traffic-related particles.
As the atmospheric regime transitioned on 13 July, the chemical ground truth at the receptor level shifted in response to the Saharan mineral dust intrusion arriving aloft at 3 km. The initial surface manifestation of these coarser crustal particles occurred from approximately 14:35 UTC onwards, driven by daytime convective boundary layer growth. This stage was marked by a gradual rise in ground-level organic mass concentrations from 15.2 ± 0.7 μg/m3 at 14:02 UTC to 16.3 ± 0.7 μg/m3 by 15:00 UTC, alongside a concurrent sulphate increase from 5.4 ± 0.1 μg/m3 to 6.6 ± 0.1 μg/m3. The aerosol burden remained high until the arrival of the cold front in the early morning of 14 July. The intense updraft period observed before 04:00 UTC facilitated a final surge in concentrations; however, this was immediately followed by the pronounced downdraft event between 04:00 and 04:30 UTC. As indicated by the Doppler wind lidar and CLOUDNET data, this downdraft coincided with a precipitation event, resulting in a rapid washout of the accumulated aerosol burden. This physical scavenging explains the sharp decrease in PM concentrations observed from the early morning hours of 14 July onward.
3.3. Cloud Microphysical Response to Aerosol Regime Transitions
Building upon the regime-dependent microphysical derivations defined in Section 2.2.3, this section quantifies the impact of these distinct aerosol chemical signatures on the regional hydrological cycle by contrasting the smoke-inhibited liquid clouds of 12 July with the dust-induced glaciated systems observed on 14 July (see below).
The microphysical state of the atmosphere during the smoke-dominated phase is presented in Figure 15, focusing on the nocturnal transition window of 12 July (20:00–00:00 UTC). Applying the regime-dependent derivation framework defined in Section 2.2.3 (Nc ~ 7.7 × 10⁸ m−3), Figure A5 in Appendix A provides the high-resolution time–height cross-section of the cloud droplet effective radius (reff_liq), illustrating the vertical placement of liquid clouds relative to the 2 km smoke plume. Figure 15 offers a synergetic statistical characterisation through the split violin plots of the reff distributions across the 2–11 km altitude range, categorised by LWC intensity, and the high-resolution histogram of reff at the 2 km plume core to resolve the specific droplet population density.
Figure 15.
Asymmetric semi-violin distributions of reff_liq across altitude ranges (2–11 km) for the 12 July 2023 nocturnal window (20:00–24:00), partitioned by Liquid Water Content (LWC) regime.
The subsequent phase transition in cloud development following the Saharan dust intrusion is captured in Figure 16, which focuses on the peak event on 14 July (03:00–07:00 UTC). Following the regime-dependent microphysical derivation framework defined in Section 2.2.3 (Nc ~ 1.0 × 10⁷ m−3), Figure A6 in Appendix A presents the time–height evolution of reff_ice, resolving the vertical displacement of liquid-phase water by the advancing, deep glaciated system. Figure 16 offers a comparative microphysical analysis, employing asymmetric semi-violin plots to resolve the phase transition between reff_liq and reff_ice across the atmospheric column, complemented by a high-resolution frequency distribution of reff_liq at the 4 km altitude to characterise the melting layer dynamics.
Figure 16.
Cloud effective radius distributions (liquid and ice phases) across altitude ranges (2–11 km) for the 14 July 2023 nocturnal window (03:00–07:00 UTC).
4. Discussions
Between 9 and 15 July 2023, Southern and Eastern Europe was dominated by an intense and quasi-stationary anticyclonic ridge, informally designated as “Cerberus” (https://www.preventionweb.net/collections/europe-heatwave-2023, last accessed on 16 June 2026), developing amid an unprecedented global heat anomaly. According to ERA5 available data from the Copernicus Climate Change Service, July 2023 ranked as the warmest month ever recorded globally, dating back to 1940, with an average surface air temperature of 16.95 °C—approximately 0.7 °C above the 1991–2020 climatological mean and about 1.5 °C above preindustrial levels. These exceptional conditions were further amplified by unprecedented global sea surface temperatures and by short-term breaches of the 1.5 °C warming threshold during early and mid-July (climate.copernicus.eu, last accessed on 16 June 2026). Within this global framework of extreme warmth, the high-pressure system generated a pronounced “heat dome” effect over Europe, characterised by large-scale atmospheric subsidence that induced adiabatic compression and significant thermal enhancement of the lower troposphere. The stable atmospheric stratification suppressed cloud formation and facilitated the increase in solar irradiance at the surface, thereby producing predominantly clear-sky conditions, most notably during 12–13 July.
Over Romania, the prevailing circulation pattern was marked by the advection of tropical air masses from the south and southwest Europe, guided along the western periphery of the ridge [69,70]. This synoptic configuration enabled the transport of hot and dry air originating from North Africa and the Iberian Peninsula towards the Balkan region, superimposed on a hemispheric-scale heat anomaly. While during the onset phase of the ridge (9–10 July), residual atmospheric instability allowed localized convective cloud development, its subsequent intensification by mid-week (11–13 July) led to the consolidation of a stagnant and markedly stable atmospheric regime. This increased stability prompted the vertical confinement of aerosol layers within the lowest approximately 3 km of the troposphere. The ridge entered its decay phase in the early morning of 14 July, when an approaching cyclonic disturbance progressively weakened and disrupted the dominant anticyclonic circulation.
The synergetic observational and numerical framework presented in this study resolves the rapid transition between 11 and 14 July 2023, from a fine-mode smoke regime to a coarse-mode mineral dust intrusion. To synthesise the rapid atmospheric transition, Figure 17 presents the integrated evolution of near-surface aerosol mass, chemical composition, and columnar optical properties across the study period. The upper panel details the temporal evolution of particulate matter mass concentrations, quantifying the total aerosol burden at the surface level. The middle panel resolves the chemical speciation, highlighting the shifting influence of organic matter through specific fractional indicators. These include the ratio of total organics to the overall non-refractory mass, the biomass-burning organic aerosol fraction indicative of combustion sources, and the more-oxidized oxygenated organic aerosol fraction representing atmospheric aging and processing. A min–max-normalised equivalent black carbon metric is also included to trace combustion dynamics. The lower panel displays the column-integrated Aerosol Optical Depth and Ångström Exponent retrieved from sun-photometry, capturing the broader atmospheric state. Note that the continuous lines in the optical property series represent temporal interpolations applied strictly for visualisation purposes, whereas all statistical trends are derived exclusively from the discrete observed values.
Figure 17.
Integrated temporal evolution of near-surface particulate matter mass concentrations, fractional chemical composition indicators, and columnar optical properties during the 11–14 July 2023 aerosol transition event.
Prior to the regime shift, the near-surface aerosol remained relatively stable regarding total mass concentrations and base chemical composition, yet the columnar optical properties evolved continuously. This indicates that the physical properties of the extended atmospheric column were already shifting aloft despite surface stability.
On 12 July, the presence of regional biomass-burning smoke was confirmed by high Ångström Exponent values (>1.5) and GRASP-derived fine-mode volume concentration profiles (peaking at 0.06 μm3/μm2), which were corroborated by CAMS speciation and FLEXPART footprints analyses tracing the air mass to active fires in Central Europe. Near-surface in situ data validated the entrainment of this layer, with peak organic mass concentrations reaching 16.2 ± 0.9 μg/m3 and elevated MOOOA and wood-burning black carbon signatures confirming the successful downward mixing of the plume detected aloft.
On 13 July, the atmospheric conditions changed markedly following the arrival of a Saharan dust plume at approximately 3 km altitude. This transition was characterised by a pronounced decrease in the Ångström Exponent towards values close to 1.0 and a substantial increase in the coarse-mode aerosol fraction retrieved by GRASP. In fact, the Ångström Exponent proved to be the most sensitive indicator of the transition, immediately reflecting the influx of large mineral particles as the total columnar Aerosol Optical Depth increased. Simultaneously, the near-surface fine particulate fraction decreased sharply without a corresponding reduction in PM10, indicating a clear shift in the particle size distribution toward a coarse-mode dominant state. This physical shift was accompanied by a fundamental compositional change: the ratio of total organics to the overall chemical mass decreased significantly, while the more-oxidized oxygenated organic aerosol (MOOOA) fraction rose sharply, suggesting that the remaining organic aerosol became highly aged and oxidised. During this transition phase, near-surface fine mass concentrations decreased while total columnar loading increased. This decoupling demonstrates that the transition was driven by a fundamental restructuring of the vertical aerosol distribution associated with the shifting air-mass trajectories from Central Europe to North Africa, rather than mere surface-level variations. Simultaneously, lidar depolarisation measurements (PLDR > 0.3 at 532 nm) provided a clear indication of the presence of non-spherical mineral particles. The dust intrusion was accompanied by a sharp increase in surface PM10 and sulphate concentrations, with sulphate reaching 6.6 ± 0.1 μg·m−3, following nocturnal downdrafts. FLEXPART trajectories and source–receptor footprints identified the Saharan border region between Algeria and Tunisia as the dominant source area, consistent with previous studies documenting long-range transport of sulphate-enriched Saharan dust into southeastern Europe. Following the transition, the atmosphere settled into a new equilibrium characterised by increased biomass-burning organic aerosol (BBOA) contributions and reduced MOOOA fractions, while the optical properties continued to evolve independently of the stabilised surface mass concentrations.
The atmospheric transition between 11 and 14 July 2023 provides an opportunity to investigate how chemically contrasting aerosol plumes dictate cloud microphysical evolution. As established in Section 3.2, the persistence of the anticyclonic ridge created a stable atmospheric stratification that vertically constrained the regional smoke and long-range dust within the lower 3 km. The dynamic coupling connecting these lofted structures to the cloud-active troposphere was governed by multi-stage vertical transport. While daytime boundary layer growth initiated the surface entrainment of the dust plume on the afternoon of 13 July, the subsequent manifestation of deep nocturnal downdrafts on 14 July forced the dense core of the dust layer into the cloud activation zone.
Through parameterised scenario demonstrations, evidence for this growth inhibition is provided by the semi-violin distributions in Figure 15 (left panel). At the 2 km altitude, the reff_liq population is remarkably compressed, with median radii of 3.0 ± 0.8 mm for the low LWC regime and 5.5 ± 1.2 mm for the high LWC regime. The unimodal histogram at 2 km (Figure 15, right panel) reflects this ‘locked’ microphysical state, showing a sharp, single peak centred at 5.0 ± 1.2 mm. In this simulated regime, the high density of activated smoke particles creates intense competition for available water vapour, distributing moisture among so many nuclei that droplets are unable to reach the collision–coalescence threshold. Physically, this scenario shows how the smoke acts as a cloud stabiliser, maintaining the hydrometeor population within the non-precipitating size range and explaining why the 12 July clouds remained as shallow liquid layers despite strong nocturnal subsidence.
The Saharan mineral dust intrusion on 13–14 July facilitated a precipitation pathway that was physically suppressed during the preceding smoke-dominated phase. Unlike organic smoke, crustal mineral dust acts as a potent ice nucleating particle (INP). Following the regime-dependent microphysical framework established in Section 2.2.3 (using the low-loading regime Nc ~ 1.0 × 10⁷ m−3), Figure A6 in Appendix A illustrates the resulting activation of a deep glaciated system reaching a cloud-top altitude of 11.8 km. Figure 16, left panel, quantitatively resolves this vertical phase partitioning, revealing a rapid glaciation via the Wegener–Bergeron–Findeisen (WBF) process, where ice particles grew at the expense of liquid droplets facilitated by the presence of dust INPs.
A primary indicator of this transition is found in the bimodal frequency distribution at 4 km (Figure 16, right panel). While the smoke regime was unimodal and restricted, the dust-dominated regime reveals two distinct populations: a primary cloud droplet peak at 7.0 ± 1.5 mm and a secondary, broad drizzle-sized mode centred at 27.5 ± 4.5 mm. This bimodality serves as a clear empirical signature of the melting layer transition. As ice crystals descended through the 0 °C isotherm (~3.5–4 km), they transitioned into large liquid drops, with the drizzle-mode population extending up to 60.0 ± 10.0 mm. This bimodal distribution suggests that mineral dust INPs facilitate heterogeneous ice nucleation at temperatures above the homogeneous freezing threshold and subsequently initiate a microphysical growth process. As ice crystals accrete mass at the expense of supercooled droplets via the WBF process, they overcome suspension thresholds, resulting in active precipitation and the wet scavenging of the aerosol column.
This comparative analysis of the 12 and 14 July events demonstrates that the physicochemical regime of transported aerosols is an important driver of regional cloud microphysical profiles. During the smoke-dominated phase, parameterisations indicate biomass-burning aerosols acted as cloud stabilisers. The excessive organic CCN loading constrained the hydrometeor population to a unimodal distribution with a median reff_liq of 5.0 ± 1.2 μm, effectively inhibiting droplet growth and suppressing vertical cloud development. Conversely, the Saharan dust intrusion triggered a transition to a deep glaciated system. By serving as potent ice nucleating particles (INPs), the dust particles ‘unlocked’ the Wegener–Bergeron–Findeisen (WBF) process, shifting the cloud population into a bimodal state with hydrometeors exceeding 40.0 ± 8.0 μm.
These findings underscore that the vertical co-location of these species, specifically the 2 km smoke plume versus the 3–4 km dust intrusion, influences whether an air mass remains a stable, non-precipitating haze or evolves into an active hydrometeor system. This high-frequency characterisation of aerosol–cloud states demonstrates the necessity of the synergetic observational approach employed in this study. Such integrated frameworks are essential for resolving transient atmospheric events, ultimately improving the accuracy of air quality forecasts and our understanding of aerosol-mediated modifications to the hydrological cycle.
5. Conclusions
The 11–14 July 2023 event measured at the RADO-Bucharest station provides a case study for quantifying rapid aerosol regime transitions under the influence of anticyclonic subsidence. By integrating active Raman, wind lidar and cloud radar profiling with passive remote sensing, near-surface chemical speciation, and Lagrangian transport modelling, this study provides a mechanistic reconstruction of the atmospheric column that addresses the limitations of isolated point measurements or numerical models.
The initial regime on 12 July was governed by an organic-rich biomass-burning plume constrained at an altitude of approximately 2 km. Lidar observations provided the vertical structure of this layer, revealing low Particle Linear Depolarisation Ratios (PLDR < 0.05) characteristic of spherical, carbonaceous particles. This optical classification was quantitatively validated by near-surface ACSM data showing peak organic mass concentrations of 16.2 ± 0.9 µg/m3, and Aethalometer source apportionment isolating solid-fuel combustion signatures (0.15 ± 0.03 µg/m3).
An atmospheric transition occurred on 13 July, as the regional smoke was displaced by a Saharan mineral dust intrusion at 3 km altitude. The Raman lidar captured this phase shift, detecting an increase in depolarisation (PLDR > 0.30 ± 0.05 at 532 nm) that provided the signature of non-spherical mineral particles. Doppler wind lidar established the mechanical link between these free-tropospheric layers and the surface, recording nocturnal downdrafts which facilitated a secondary nighttime mixing mechanism complementing the daytime entrainment driven by convective boundary layer growth. The observed decoupling between stabilised surface mass concentrations and rapidly evolving columnar optical properties during this transition validates the necessity of our synergetic vertical profiling approach. It demonstrates that relying solely on near-surface monitoring networks is insufficient for capturing the true structural evolution of rapidly changing aerosol regimes, as the most significant dynamic shifts occurred aloft.
The physicochemical regime of these transported aerosols influenced the subsequent cloud microphysical profiles. Scenario demonstrations indicate that the organic CCN loading of the smoke plume suppressed collision–coalescence, maintaining the hydrometeor population in a non-precipitating liquid state (reff_liq 5.0 ± 1.2 µm). The entrainment of mineral dust INPs initiated the Wegener–Bergeron–Findeisen process, shifting the atmospheric column into a glaciated system (reff_ice ~ 49.7 ± 12.5 µm). The descent of these ice crystals through the 0 °C isotherm generated a bimodal melting layer, resulting in precipitation and aerosol washout. Resolving these mechanistic links—from lidar-detected aerosol advection to surface-level microphysical activation—supports the predictive accuracy of air quality and meteorological models.
Author Contributions
Conceptualization, D.N. and L.B.; methodology, L.B., C.T., J.V., A.M.D. and A.N.; software, V.N., G.C., A.V.D. and S.N.; validation, C.T., I.B., M.A. and S.A.; formal analysis, L.B., C.T., J.V., A.M.D., A.N., I.B., M.A. and S.A.; investigation, F.T., E.C., C.R., G.C., A.V.D., A.I., M.A. and S.A.; data curation, V.N.; writing—original draft preparation, L.B., C.T. and D.N.; writing—review and editing, all authors; visualization, S.N. and M.T.; supervision, D.N.; project administration, D.N., F.T. and A.T. All authors have read and agreed to the published version of the manuscript.
Funding
This work was carried out through the Core Program within the National Research Development and Innovation Plan 2022–2027, with the support of MCID, project no. PN23 05/-3.01.2023 and was financed by Smart Growth, Digitization and Financial Instruments Program (PoCIDIF) 2021–2027, Action 1.3 Integration of the national RDI ecosystem in the European and international Research Space, project “Supporting the operation of facilities in Romania within the ACTRIS ERIC research infrastructure”, SMIS code 309113. It was carried out with the support of CARGO-ACT HEU Grant Agreement no. 101132093 and through the ACTRIS ERIC and CARS Cooperation Agreement.
Data Availability Statement
ACTRIS data used in this study (aerosol in situ, aerosol remote sensing and cloud remote sensing) are available through the ACTRIS Data Portal (https://data.actris.eu/). The CAMS data used in this study were obtained from the Atmosphere Data Store (https://atmosphere.copernicus.eu/data (accessed on 21 September 2026)). GRASP code for lidar-photometer combine retrieval is available through the DIVA portal (https://www.diva-platform.com/#applications (accessed on 21 September 2026)). FLEXPART code is available through Gitlab (https://gitlab.phaidra.org/flexpart/flexpart (accessed on 21 September 2026)).
Acknowledgments
The authors would like to thank ACTRIS Topical Centres (CAIS-ECAC, CARS and CCRES) for providing the calibration of aerosol in situ, aerosol remote sensing and cloud remote sensing instruments, and the ACTRIS Data Center (EBAS, ARES and CLU) for providing access to quality-assured data. We acknowledge NOAA ARL for providing the HYSPLIT transport and dispersion model and the READY system used in this work, the use of data from the Copernicus Atmosphere Monitoring Service (CAMS), and thank the FLEXPART development team for providing the Lagrangian transport model. Authors acknowledge the ESA-funded project DIVA (Demonstration of an Integrated approach for the Validation and exploitation of Atmospheric missions) and the GRASP algorithm developed by the GRASP-OPEN community.
Conflicts of Interest
The authors declare no conflicts of interest.
Appendix A
Figure A1.
Sensitivity analysis of the calculated liquid cloud droplet effective radius as a function of measured Liquid Water Content for a range of liquid droplet number concentrations characteristic of the smoke-dominated regime.
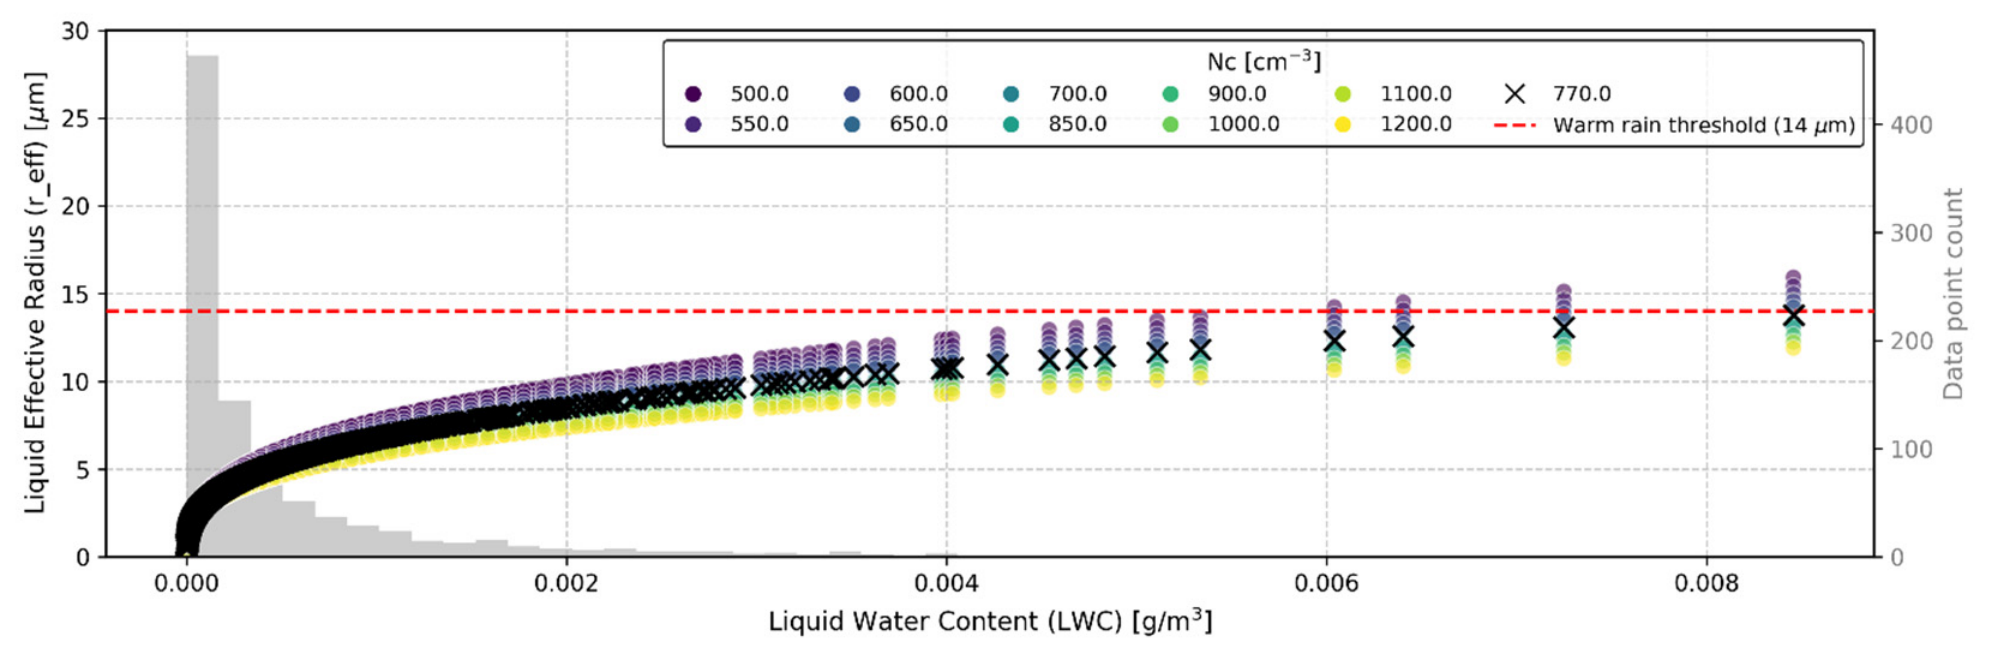
Figure A2.
Sensitivity analysis of the calculated liquid cloud droplet effective radius evaluating lower droplet number concentrations representative of the coarse-mode mineral dust regime.
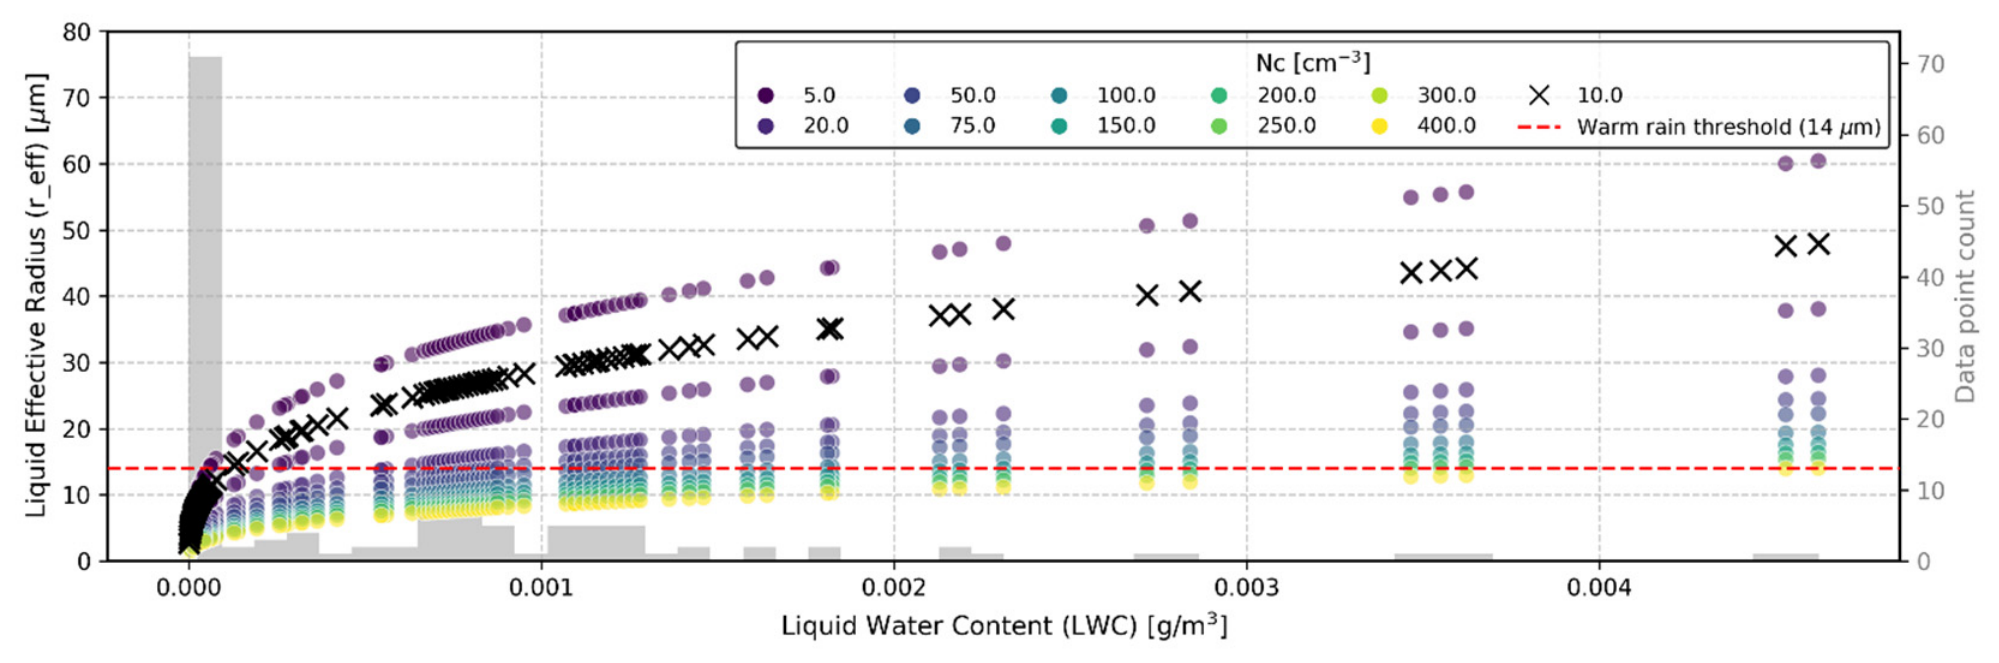
Figure A3.
Sensitivity analysis of the calculated ice crystal effective radius as a function of measured Ice Water Content across a range of ice nucleating particle concentrations, identifying the low-concentration regime supporting the observed deep glaciated system.
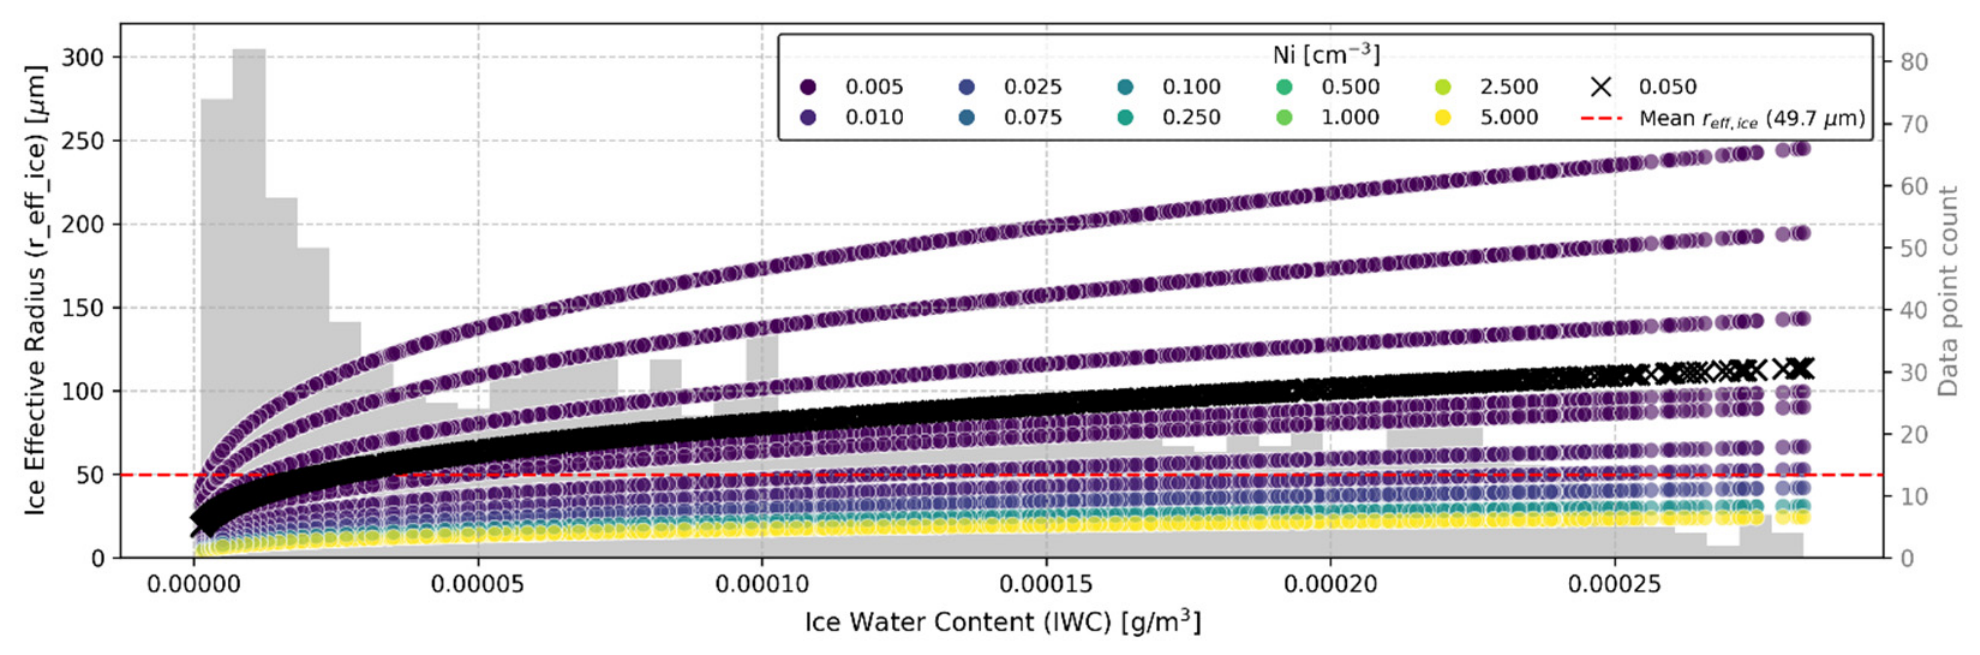
Figure A4.
HYSPLIT 240/96 h back-trajectories superimposed on FIRMS active fire hotspots for 12 July at 4 km (left panel) and 13 July 2023 at 4.5 km (right panel). Orange dots represent the fires’ location (upper) or time (lower). The blue lines represent the back-trajectories, while the black lines represent the altitude of the air masses along the back-trajectories.
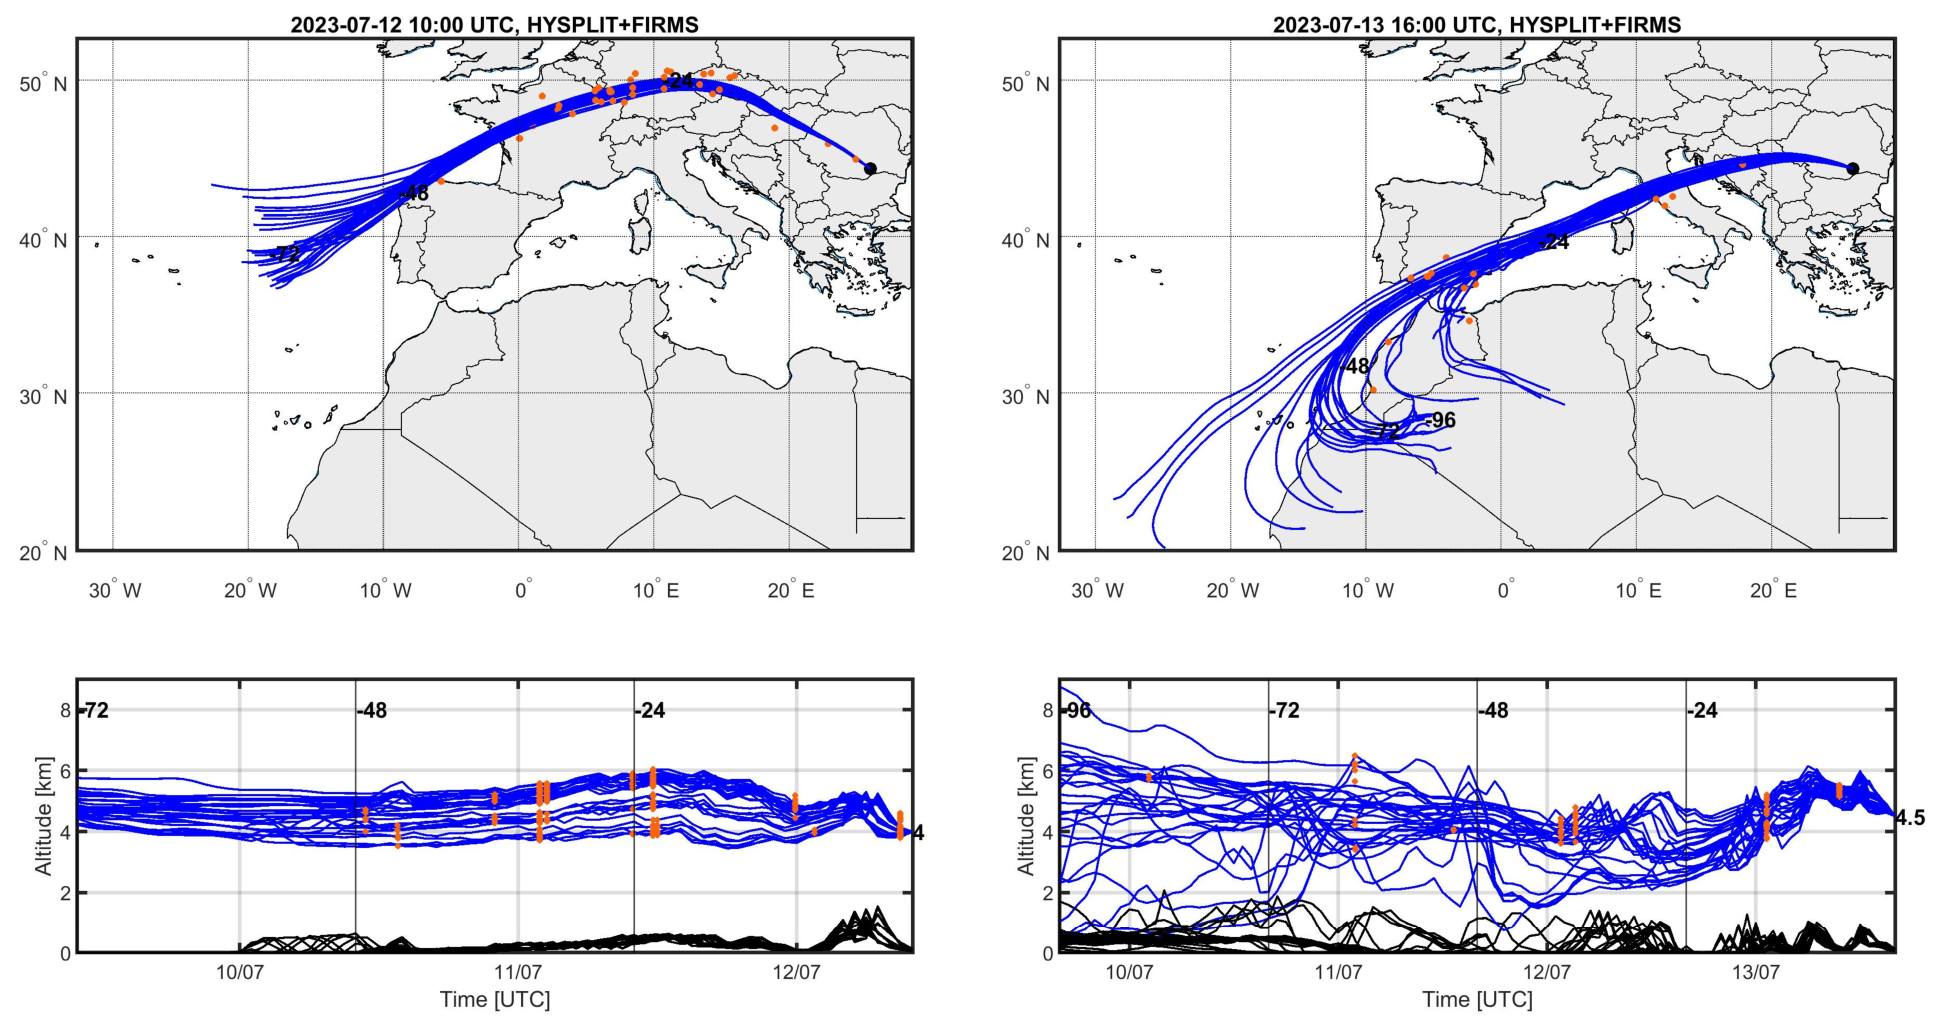
Figure A5.
Time–height cross-section of the liquid cloud droplet effective radius (reff_liq) during the nocturnal transition on 12 July 2023 (20:00–00:00 UTC).
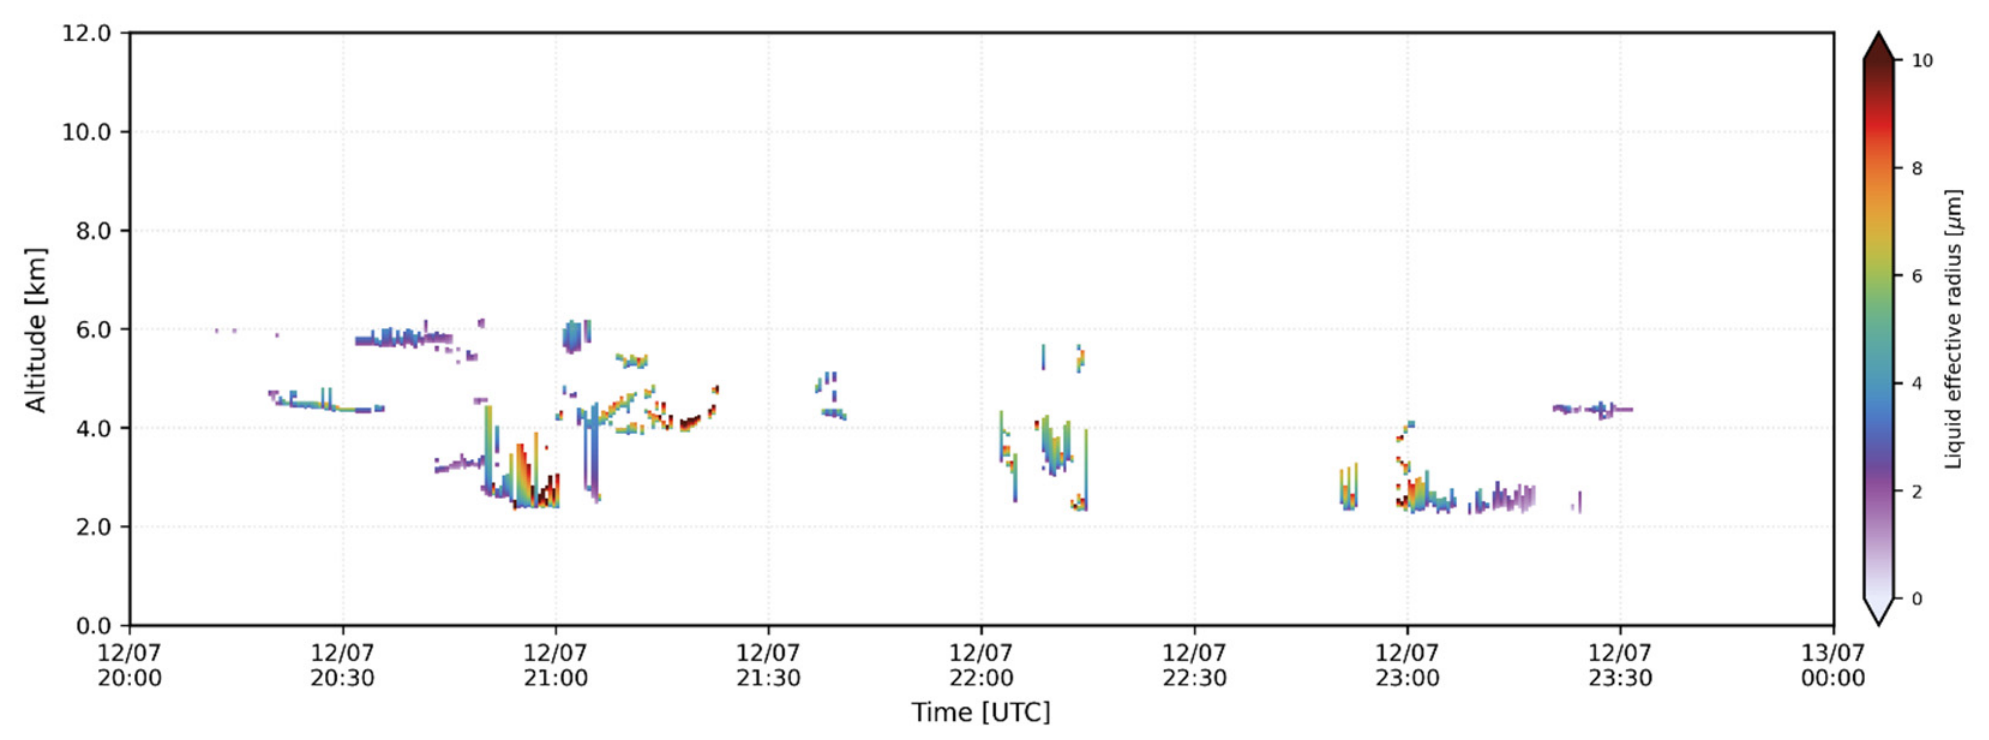
Figure A6.
Time–height cross-sections of the ice effective radius during the deep cloud event on 14 July 2023 (03:00–07:00 UTC).
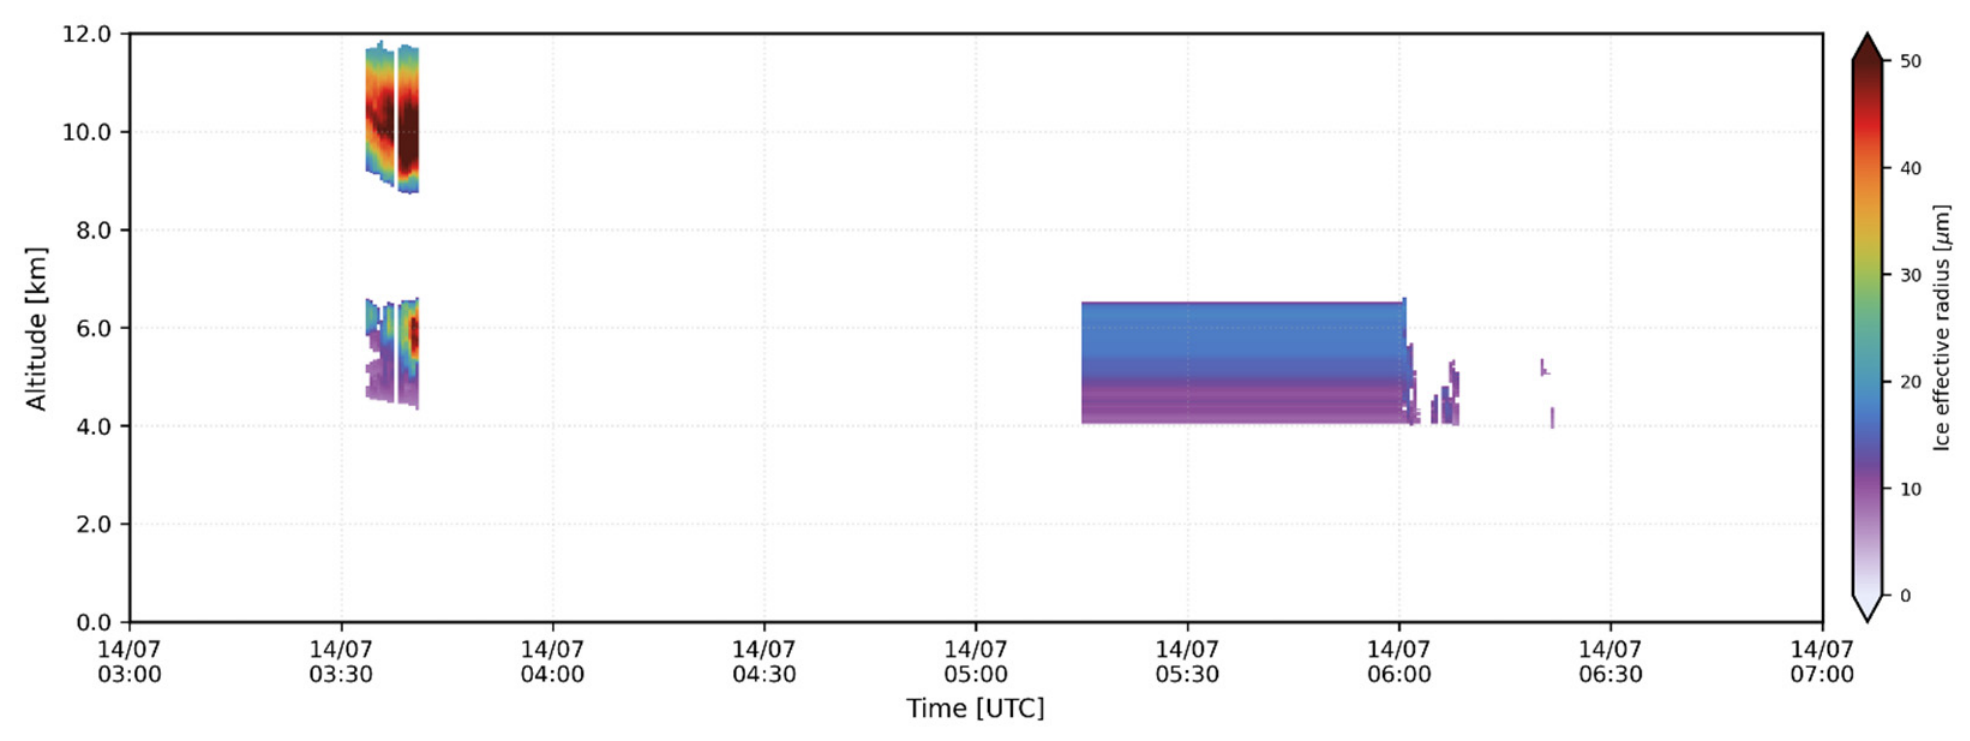
References
- Masson-Delmotte, V.; Zhai, P.; Pirani, A.; Connors, S.L.; Pean, C.; Berger, S.; Caud, N.; Chen, Y.; Goldfarb, L.; Gomis, M.I.; et al. Climate Change 2021: The Physical Science Basis. Contribution of Working Group I to the Sixth Assessment Report of the Intergovernmental Panel on Climate Change; Cambridge University Press: Cambridge, UK, 2021. [Google Scholar] [CrossRef] [Scilit]
- Cairo, F.; Di Liberto, L.; Dionisi, D.; Snels, M. Understanding aerosol–cloud interactions through lidar techniques: A review. Remote Sens. 2024, 16, 2788. [Google Scholar] [CrossRef] [Scilit]
- Peshev, Z.; Chaikovsky, A.; Evgenieva, T.; Pescherenkov, V.; Vulkova, L.; Deleva, A.; Dreischuh, T. Combined characterization of airborne Saharan dust above Sofia, Bulgaria, during blocking-pattern conditioned dust episode in February 2021. Remote Sens. 2023, 15, 3833. [Google Scholar] [CrossRef] [Scilit]
- Ajtai, N.; Stefănie, H.; Ozunu, A. Description of Aerosol Properties over Cluj-Napoca Derived from AERONET Sun-Photometric Data. Environ. Eng. Manag. J. 2013, 12, 227–232. [Google Scholar] [CrossRef] [Scilit]
- Osborne, M.; Malavelle, F.F.; Adam, M.; Buxmann, J.; Sugier, J.; Marenco, F.; Haywood, J. Saharan dust and biomass burning aerosols during ex-hurricane Ophelia: Observations from the new UK lidar and sun-photometer network. Atmos. Chem. Phys. 2019, 19, 3557–3578. [Google Scholar] [CrossRef] [Scilit]
- Garnés-Morales, G.; Montávez, J.P.; Halifa-Marín, A.; Jiménez-Guerrero, P. Role of aerosols on atmospheric circulation in regional climate experiments over Europe. Atmosphere 2023, 14, 491. [Google Scholar] [CrossRef] [Scilit]
- Nicolae, D.; Ciocan, G.A.; Nemuc, A.; Nicolae, V.; Talianu, C.; Vasilescu, J.; Dandocsi, A.; Radu, C.; Cazacu, M.M.; Vulturescu, V.; et al. Examining the characteristics of aerosols: A statistical analysis based on a decade of lidar and photometer observations at the Eastern border of ACTRIS. Atmos. Meas. Tech. 2026, 19, 1179–1199. [Google Scholar] [CrossRef] [Scilit]
- Zhang, H.; Huang, W.; Shen, X.; Ramisetty, R.; Song, J.; Kiseleva, O.; Holst, C.C.; Khan, B.; Leisner, T.; Saathoff, H. Aerosol composition, air quality, and boundary layer dynamics in the urban background of Stuttgart in winter. Atmos. Chem. Phys. 2024, 24, 10617–10637. [Google Scholar] [CrossRef] [Scilit]
- Ansmann, A.; Mamouri, R.E.; Bühl, J.; Seifert, P.; Engelmann, R.; Hofer, J.; Nisantzi, A.; Atkinson, J.D.; Kanji, Z.A.; Sierau, B.; et al. Ice-nucleating particle versus ice crystal number concentrationin altocumulus and cirrus layers embedded in Saharan dust: A closure study. Atmos. Chem. Phys. 2019, 19, 15087–15115. [Google Scholar] [CrossRef] [Scilit]
- de Morales, J.R.; Calbo, J.; Gonzalez, J.A.; Sola, Y. A method to assess the cloud-aerosol transition zone from ceilometer measurements. Atmos. Res. 2024, 310, 107623. [Google Scholar] [CrossRef] [Scilit]
- Inness, A.; Ades, M.; Agustí-Panareda, A.; Barré, J.; Benedictow, A.; Blechschmidt, A.M.; Dominguez, J.J.; Engelen, R.; Eskes, H.; Flemming, J.; et al. The CAMS reanalysis of atmospheric composition. Atmos. Chem. Phys. 2019, 19, 3515–3556. [Google Scholar] [CrossRef] [Scilit]
- Millet, T.; Arola, A.; Benas, N.; Benedictow, A.; Bennouna, Y.; Bouarar, I.; Bowdalo, D.; Clerbaux, C.; Emili, E.; Errera, Q.; et al. Validation Report of the CAMS Near-Real-Time Global Atmospheric Composition Service, September–November 2025; CAMS report CAMS2_82_bis_2025SC1_D82_bis.1.1.1-SON2025; Copernicus Atmosphere Monitoring Service (CAMS): Reading, UK, 2026. [Google Scholar] [CrossRef]
- Gualtieri, G.; Brilli, L.; Carotenuto, F.; Cavaliere, A.; Gioli, B.; Giordano, T.; Putzolu, S.; Vagnoli, C.; Zaldei, A. Assessing capability of Copernicus Atmosphere Monitoring Service to forecast PM2.5 and PM10 hourly concentrations in a European air quality hotspot. Atmos. Pollut. Res. 2025, 16, 102567. [Google Scholar] [CrossRef] [Scilit]
- Garrigues, S.; Remy, S.; Chimot, J.; Ades, M.; Inness, A.; Flemming, J.; Kipling, Z.; Laszlo, I.; Benedetti, A.; Ribas, R.; et al. Monitoring multiple satellite aerosol optical depth (AOD) products within the Copernicus Atmosphere Monitoring Service (CAMS) data assimilation system. Atmos. Chem. Phys. Discuss. 2022, 2022, 14657–14692. [Google Scholar] [CrossRef] [Scilit]
- Soulie, A.; Granier, C.; Darras, S.; Zilbermann, N.; Doumbia, T.; Guevara, M.; Jalkanen, J.P.; Keita, S.; Liousse, C.; Crippa, M.; et al. Global anthropogenic emissions (CAMS-GLOB-ANT) for the Copernicus Atmosphere Monitoring Service simulations of air quality forecasts and reanalyses. Earth Syst. Sci. Data Discuss. 2023, 2023, 2261–2279. [Google Scholar] [CrossRef] [Scilit]
- Eskes, H.; Tsikerdekis, A.; Ades, M.; Alexe, M.; Benedictow, A.C.; Bennouna, Y.; Blake, L.; Bouarar, I.; Chabrillat, S.; Engelen, R.; et al. Evaluation of the copernicus atmosphere monitoring service cy48r1 upgrade of june 2023. Atmos. Chem. Phys. 2024, 24, 9475–9514. [Google Scholar] [CrossRef] [Scilit]
- Thompson, R.L.; Krishnankutty, N.; Pisso, I.; Schneider, P.; Stebel, K.; Sasakawa, M.; Stohl, A.; Platt, S.M. Efficient use of a Lagrangian particle dispersion model for atmospheric inversions using satellite observations of column mixing ratios. Atmos. Chem. Phys. 2025, 25, 12737–12751. [Google Scholar] [CrossRef] [Scilit]
- Bakels, L.; Tatsii, D.; Tipka, A.; Thompson, R.; Dütsch, M.; Blaschek, M.; Seibert, P.; Baier, K.; Bucci, S.; Cassiani, M.; et al. FLEXPART version 11: Improved accuracy, efficiency, and flexibility. Geosci. Model. Dev. 2024, 17, 7595–7627. [Google Scholar] [CrossRef] [Scilit]
- Stohl, A.; Forster, C.; Frank, A.; Seibert, P.; Wotawa, G. The Lagrangian particle dispersion model FLEXPART version 6.2. Atmos. Chem. Phys. 2005, 5, 2461–2474. [Google Scholar] [CrossRef] [Scilit]
- Stein, A.F.; Draxler, R.R.; Rolph, G.D.; Stunder, B.J.; Cohen, M.D.; Ngan, F. NOAA’s HYSPLIT atmospheric transport and dispersion modeling system. Bull. Am. Meteorol. Soc. 2015, 96, 2059–2077. [Google Scholar] [CrossRef] [Scilit]
- Rolph, G.; Stein, A.; Stunder, B. Real-time environmental applications and display system: READY. Environ. Model. Softw. 2017, 95, 210–228. [Google Scholar] [CrossRef] [Scilit]
- Dubovik, O.; Fuertes, D.; Litvinov, P.; Lopatin, A.; Lapyonok, T.; Doubovik, I.; Xu, F.; Ducos, F.; Chen, C.; Torres, B.; et al. A comprehensive description of multi-term LSM for applying multiple a priori constraints in problems of atmospheric remote sensing: GRASP algorithm, concept, and applications. Front. Remote Sens. 2021, 2, 706851. [Google Scholar] [CrossRef] [Scilit]
- Arora, S.; Poulain, L.; Lhotka, R.; Schwarz, J.; Vodička, P.; Mbengue, S.; Zíková, N.; Ondráček, J.; Pokorná, P.; Ždímal, V.; et al. Tracing local and long-range aerosol emission areas using multi-method and multi-site analyses in central Europe. Atmos. Environ. 2025, 367, 121733. [Google Scholar] [CrossRef] [Scilit]
- Radenz, M.; Engelmann, R.; Henning, S.; Schmithüsen, H.; Baars, H.; Frey, M.M.; Weller, R.; Bühl, J.; Jimenez, C.; Roschke, J.; et al. Ground-based remote sensing of aerosol, clouds, dynamics, and precipitation in Antarctica: First results from the 1-year COALA campaign at Neumayer Station III in 2023. Bull. Am. Meteorol. Soc. 2024, 105, E1438–E1457. [Google Scholar] [CrossRef] [Scilit]
- Nicolae, D.; Nemuc, A.; Müller, D.; Talianu, C.; Vasilescu, J.; Belegante, L.; Kolgotin, A. Characterization of fresh and aged biomass burning events using multiwavelength Raman lidar and mass spectrometry. J. Geophys. Res. Atmos. 2013, 118, 2956–2965. [Google Scholar] [CrossRef] [Scilit]
- Amarillo, A.C.; Curci, G.; De Santis, D.; Bassani, C.; Barnaba, F.; Rémy, S.; Di Liberto, L.; Oxford, C.R.; Windwer, E.; Del Frate, F. Validation of aerosol chemical composition and optical properties provided by Copernicus Atmosphere Monitoring Service (CAMS) using ground-based global data. Atmos. Environ. 2024, 334, 120683. [Google Scholar] [CrossRef] [Scilit]
- Schoenhardt, A.; Arola, A.; Benedictow, Y.; Bennouna, I.; Bouarar, E.; Emili, Q.; Errera, H.J.; Eskes, M.; Gauss, C.; Gil Diaz, A.; et al. Validation Report for the CAMS Global Reanalyses of Aerosol and Reactive Gases (EAC4): Period 2003–2025; Copernicus Atmosphere Monitoring Service (CAMS) report, CAMS2_82_bis_2025SC1_D82_bis.4.1.1-2026.pdf; European Commission: Brussels, Belgium, 2026. [Google Scholar] [CrossRef]
- Holben, B.N.; Eck, T.F.; Slutsker, I.A.; Tanré, D.; Buis, J.P.; Setzer, A.; Vermote, E.; Reagan, J.A.; Kaufman, Y.J.; Nakajima, T.; et al. AERONET—A federated instrument network and data archive for aerosol characterization. Remote Sens. Environ. 1998, 66, 1–16. [Google Scholar] [CrossRef] [Scilit]
- Dubovik, O.; King, M.D. A flexible inversion algorithm for retrieval of aerosol optical properties from Sun and sky radiance measurements. J. Geophys. Res. Atmos. 2000, 105, 20673–20696. [Google Scholar] [CrossRef] [Scilit]
- Sinyuk, A.; Holben, B.N.; Eck, T.F.; Giles, D.M.; Slutsker, I.; Korkin, S.; Schafer, J.S.; Smirnov, A.; Sorokin, M.; Lyapustin, A. The AERONET Version 3 aerosol retrieval algorithm, associated uncertainties and comparisons to Version 2. Atmos. Meas. Tech. 2020, 13, 3375–3411. [Google Scholar] [CrossRef] [Scilit]
- Giles, D.M.; Sinyuk, A.; Sorokin, M.G.; Schafer, J.S.; Smirnov, A.; Slutsker, I.; Eck, T.F.; Holben, B.N.; Lewis, J.R.; Campbell, J.R.; et al. Advancements in the Aerosol Robotic Network (AERONET) Version 3 database–automated near-real-time quality control algorithm with improved cloud screening for Sun photometer aerosol optical depth (AOD) measurements. Atmos. Meas. Tech. 2019, 12, 169–209. [Google Scholar] [CrossRef] [Scilit]
- Ansmann, A.; Wandinger, U.; Riebesell, M.; Weitkamp, C.; Michaelis, W. Independent measurement of extinction and backscatter profiles in cirrus clouds by using a combined Raman elastic-backscatter lidar. Appl. Opt. 1992, 31, 7113–7131. [Google Scholar] [CrossRef] [Scilit] [PubMed]
- D’Amico, G.; Amodeo, A.; Baars, H.; Binietoglou, I.; Freudenthaler, V.; Mattis, I.; Wandinger, U.; Pappalardo, G. EARLINET Single Calculus Chain–overview on methodology and strategy. Atmos. Meas. Tech. 2015, 8, 4891–4916. [Google Scholar] [CrossRef] [Scilit]
- D’Amico, G.; Amodeo, A.; Mattis, I.; Freudenthaler, V.; Pappalardo, G. EARLINET Single Calculus Chain–technical–Part 1: Pre-processing of raw lidar data. Atmos. Meas. Tech. 2016, 9, 491–507. [Google Scholar] [CrossRef] [Scilit]
- Mattis, I.; D’Amico, G.; Baars, H.; Amodeo, A.; Madonna, F.; Iarlori, M. EARLINET Single Calculus Chain–technical–Part 2: Calculation of optical products. Atmos. Meas. Tech. 2016, 9, 3009–3029. [Google Scholar] [CrossRef] [Scilit]
- Burton, S.; Ferrare, R.; Hostetler, C.; Hair, J.; Rogers, R.; Obland, M.; Butler, C.; Cook, A.; Harper, D.; Froyd, K. Aerosol classification using airborne High Spectral Resolution Lidar measurements–methodology and examples. Atmos. Meas. Tech. 2012, 5, 73–98. [Google Scholar] [CrossRef] [Scilit]
- Groß, S.; Freudenthaler, V.; Haarig, M.; Ansmann, A.; Toledano, C.; Mateos, D.; Seibert, P.; Mamouri, R.E.; Nisantzi, A.; Gasteiger, J.; et al. Characterization of aerosol over the eastern Mediterranean by polarization-sensitive Raman lidar measurements during A-LIFE–aerosol type classification and type separation. Atmos. Chem. Phys. 2025, 25, 3191–3211. [Google Scholar] [CrossRef] [Scilit]
- Ng, N.L.; Herndon, S.C.; Trimborn, A.; Canagaratna, M.R.; Croteau, P.; Onasch, T.B.; Sueper, D.; Worsnop, D.R.; Zhang, Q.; Sun, Y.; et al. An Aerosol Chemical Speciation Monitor (ACSM) for routine monitoring of the composition and mass concentrations of ambient aerosol. Aerosol Sci. Technol. 2011, 45, 780–794. [Google Scholar] [CrossRef] [Scilit]
- Drinovec, L.; Močnik, G.; Zotter, P.; Prévôt, A.; Ruckstuhl, C.; Coz, E.; Rupakheti, M.; Sciare, J.; Müller, T.; Wiedensohler, A.; et al. The “dual-spot” Aethalometer: An improved measurement of aerosol black carbon with real-time loading compensation. Atmos. Meas. Tech. 2015, 8, 1965–1979. [Google Scholar] [CrossRef] [Scilit]
- Canonaco, F.; Crippa, M.; Slowik, J.G.; Baltensperger, U.; Prévôt, A.S. SoFi, an IGOR-based interface for the efficient use of the generalized multilinear engine (ME-2) for the source apportionment: ME-2 application to aerosol mass spectrometer data. Atmos. Meas. Tech. 2013, 6, 3649–3661. [Google Scholar] [CrossRef] [Scilit]
- Sandradewi, J.; Prévôt, A.S.; Szidat, S.; Perron, N.; Alfarra, M.R.; Lanz, V.A.; Weingartner, E.; Baltensperger, U. Using aerosol light absorption measurements for the quantitative determination of wood burning and traffic emission contributions to particulate matter. Environ. Sci. Technol. 2008, 42, 3316–3323. [Google Scholar] [CrossRef] [Scilit] [PubMed]
- Nault, B.A.; Croteau, P.; Jayne, J.; Williams, A.; Williams, L.; Worsnop, D.; Katz, E.F.; DeCarlo, P.F.; Canagaratna, M. Laboratory evaluation of organic aerosol relative ionization efficiencies in the aerodyne aerosol mass spectrometer and aerosol chemical speciation monitor. Aerosol Sci. Technol. 2023, 57, 981–997. [Google Scholar] [CrossRef] [Scilit]
- Chen, G.; Sosedova, Y.; Canonaco, F.; Fröhlich, R.; Tobler, A.; Vlachou, A.; Daellenbach, K.R.; Bozzetti, C.; Hueglin, C.; Graf, P.; et al. Time-dependent source apportionment of submicron organic aerosol for a rural site in an alpine valley using a rolling positive matrix factorisation (PMF) window. Atmos. Chem. Phys. 2021, 21, 15081–15101. [Google Scholar] [CrossRef] [Scilit]
- Mărmureanu, L.; Vasilescu, J.; Slowik, J.; Prévôt, A.S.; Marin, C.A.; Antonescu, B.; Vlachou, A.; Nemuc, A.; Dandocsi, A.; Szidat, S. Online chemical characterization and source identification of summer and winter aerosols in Măgurele, Romania. Atmosphere 2020, 11, 385. [Google Scholar] [CrossRef] [Scilit]
- Pîrloagă, R.; Ene, D.; Boldeanu, M.; Antonescu, B.; O’Connor, E.J.; Ştefan, S. Ground-based measurements of cloud properties at the Bucharest–Măgurele Cloudnet Station: First results. Atmosphere 2022, 13, 1445. [Google Scholar] [CrossRef] [Scilit]
- Tukiainen, S.; O’Connor, E.; Korpinen, A. CloudnetPy: A Python package for processing cloud remote sensing data. J. Open Source Softw. 2020, 5, 2123. [Google Scholar] [CrossRef] [Scilit]
- Tolentino, M.; Bravo-Aranda, J.A.; Guerrero-Rascado, J.L.; Navas-Guzmán, F.; Pérez-Ramírez, D.; Alados-Arboledas, L.; Granados-Muñoz, M.J. Long-term cloud characterization at the AGORA ACTRIS-CCRES station using a novel classification algorithm. Atmos. Meas. Tech. 2026, 19, 2079–2102. [Google Scholar] [CrossRef] [Scilit]
- Delanoë, J.; Hogan, R.J. A variational scheme for retrieving ice cloud properties from combined radar, lidar, and infrared radiometer. J. Geophys. Res. Atmos. 2008, 113, 9000. [Google Scholar] [CrossRef] [Scilit]
- Ham, S.H.; Kato, S.; Rose, F.G. Examining Impacts of Mass-Diameter (m-D) and Area-Diameter (A-D) Relationships of Ice Particles on Retrievals of Effective Radius and Ice Water Content from Radar and Lidar Measurements. J. Geophys. Res. Atmos. 2017, 122, 3396–3420. [Google Scholar] [CrossRef] [Scilit] [PubMed] [PubMed Central]
- Illingworth, A.; Hogan, R.; O’connor, E.; Bouniol, D.; Brooks, M.; Delanoë, J.; Donovan, D.; Eastment, J.; Gaussiat, N.; Goddard, J.; et al. Cloudnet: Continuous evaluation of cloud profiles in seven operational models using ground-based observations. Bull. Am. Meteorol. Soc. 2007, 88, 883–898. [Google Scholar]
- Moustaka, A.; Gkikas, A.; Logothetis, S.A.; Flemming, J.; Rémy, S.; Ades, M.; Benedetti, A.; Tourpali, K.; Amiridis, V.; Kazadzis, S. Two Decades of Aerosol Optical Depth evolution from CAMS Reanalysis. EGUsphere 2026, 2026, 1–61. [Google Scholar] [CrossRef] [Scilit]
- Seibert, P.; Frank, A. Source-receptor matrix calculation with a Lagrangian particle dispersion model in backward mode. Atmos. Chem. Phys. 2004, 4, 51–63. [Google Scholar] [CrossRef] [Scilit]
- Ansmann, A.; Ohneiser, K.; Mamouri, R.E.; Knopf, D.A.; Veselovskii, I.; Baars, H.; Engelmann, R.; Foth, A.; Jimenez, C.; Seifert, P.; et al. Tropospheric and stratospheric wildfire smoke profiling with lidar: Mass, surface area, CCN, and INP retrieval. Atmos. Chem. Phys. 2021, 21, 9779–9807. [Google Scholar] [CrossRef] [Scilit]
- Nicolae, V.; Dandocsi, A.; Marmureanu, L.; Talianu, C. Biomass burning aerosol over Romania using dispersion model and Calipso data. In Proceedings of the EPJ Web of Conferences; EDP Sciences: Les Ulis, France, 2018; Volume 176, p. 04012. [Google Scholar] [CrossRef] [Scilit]
- Adam, M.; Fragkos, K.; Solomos, S.; Belegante, L.; Andrei, S.; Talianu, C.; Mărmureanu, L.; Antonescu, B.; Ene, D.; Nicolae, V.; et al. Methodology for Lidar Monitoring of Biomass Burning Smoke in Connection with the Land Cover. Remote Sens. 2022, 14, 4734. [Google Scholar] [CrossRef] [Scilit]
- Talianu, C.; Nicolae, D.; Nicolae, V. Aerosol climatology from lidar observations using deep learning. In Proceedings of the EPJ Web of Conferences; EDP Sciences: Les Ulis, France, 2026; Volume 362, p. 01028. [Google Scholar] [CrossRef] [Scilit]
- Adam, M.; Nicolae, D.; Stachlewska, I.S.; Papayannis, A.; Balis, D. Biomass burning events measured by lidars in EARLINET–Part 1: Data analysis methodology. Atmos. Chem. Phys. 2020, 20, 13905–13927. [Google Scholar] [CrossRef] [Scilit]
- Adam, M.; Fragkos, K.; Binietoglou, I.; Wang, D.; Stachlewska, I.S.; Belegante, L.; Nicolae, V. Towards early detection of tropospheric aerosol layers using monitoring with ceilometer, photometer, and air mass trajectories. Remote Sens. 2022, 14, 1217. [Google Scholar] [CrossRef] [Scilit]
- Herrera, M.E.; Dubovik, O.; Torres, B.; Lapyonok, T.; Fuertes, D.; Lopatin, A.; Litvinov, P.; Chen, C.; Benavent-Oltra, J.A.; Bali, J.L.; et al. Estimates of remote sensing retrieval errors by the GRASP algorithm: Application to ground-based observations, concept and validation. Atmos. Meas. Tech. 2022, 15, 6075–6126. [Google Scholar] [CrossRef] [Scilit]
- Martin, G.M.; Johnson, D.W.; Spice, A. The Measurement and Parameterization of Effective Radius of Droplets in Warm Stratocumulus Clouds. J. Atmos. Sci. 1994, 51, 1823–1842. [Google Scholar] [CrossRef] [Scilit]
- Wood, R. Parametrization of the effect of drizzle upon the droplet effective radius in stratocumulus clouds. Q. J. R. Meteorol. Soc. 2000, 126, 3309–3324. [Google Scholar] [CrossRef]
- Twohy, C.H.; Toohey, D.W.; Levin, E.J.T.; DeMott, P.J.; Rainwater, B.; Garofalo, L.A.; Pothier, M.A.; Farmer, D.K.; Kreidenweis, S.M.; Pokhrel, R.P.; et al. Biomass burning smoke and its influence on clouds over the western U. S. Geophys. Res. Lett. 2021, 48, e2021GL094224. [Google Scholar] [CrossRef] [Scilit]
- Levin, Z.; Teller, A.; Ganor, E.; Yin, Y. On the interactions of mineral dust, sea-salt particles, and clouds: A measurement and modeling study from the Mediterranean Israeli Dust Experiment campaign. J. Geophys. Res. 2005, 110, D20202. [Google Scholar] [CrossRef] [Scilit]
- Rosenfeld, D. TRMM observed first direct evidence of smoke from forest fires inhibiting rainfall. Geophys. Res. Lett. 1999, 26, 3105–3108. [Google Scholar] [CrossRef] [Scilit]
- Rosenfeld, D.; Wang, H.; Rasch, P.J. The roles of cloud drop effective radius and LWP in determining rain properties in marine stratocumulus. Geophys. Res. Lett. 2012, 39, 52028. [Google Scholar] [CrossRef] [Scilit]
- Freud, E.; Rosenfeld, D. Linear relation between convective cloud drop number concentration and depth for rain initiation. J. Geophys. Res. Atmos. 2012, 117, 16457. [Google Scholar] [CrossRef] [Scilit]
- Dandocsi, A.V.; Vasilescu, J.; Nemuc, A.; Toanca, F.; Ilie, A.; Tilea, A.; Vulturescu, V.; Stan, C. Variability and trends of PM concentrations near Bucharest in relation to European air quality standards. Univ. Politeh. Buchar. Sci. Bull.–Ser. A Appl. Math. Phys. 2025, 87, 197–208. [Google Scholar]
- NASA MODIS Science Data Support Team. VIIRS (NOAA-21/JPSS-2) I Band 375 m Active Fire Product NRT (Vector Data). NASA LANCE MODIS at the MODAPS, 2021. Data Set. Available online: https://www.earthdata.nasa.gov/data/catalog/lancemodis-mcd14dl-6.1nrt (accessed on 26 May 2026).
- Antonescu, B.; Ene, D.; Boldeanu, M.; Andrei, S.; Mărmureanu, L.; Marin, C.; Pîrloagă, R. Future Changes in Heatwaves Characteristics in Romania. Theor. Appl. Climatol. 2023, 153, 525–538. [Google Scholar] [CrossRef] [Scilit]
- Apetroaie, C.; Timofte, A.; Bostan, D.C. Heat Waves Analysis of 2023 Summer in Eastern Part of Romania and Atmospheric Instability Events Which Succeeded Between Them. Buletinul Institutului Politehnic din Iasi. Sect. Mat. Mec. Teor. Fiz. 2024, 70, 19–55. [Google Scholar] [CrossRef] [Scilit]
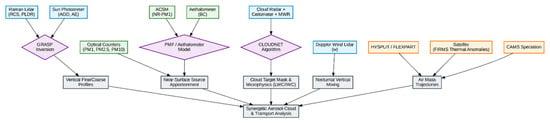
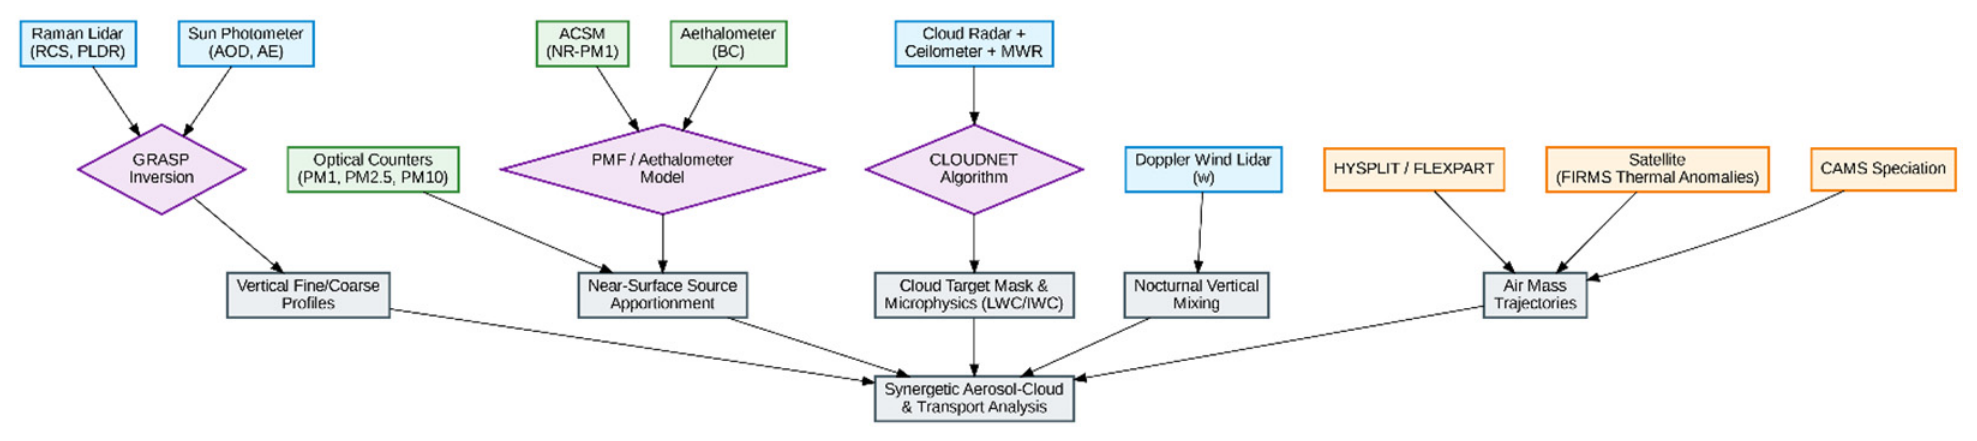
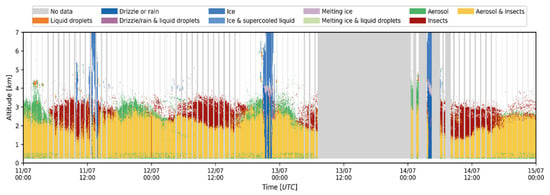
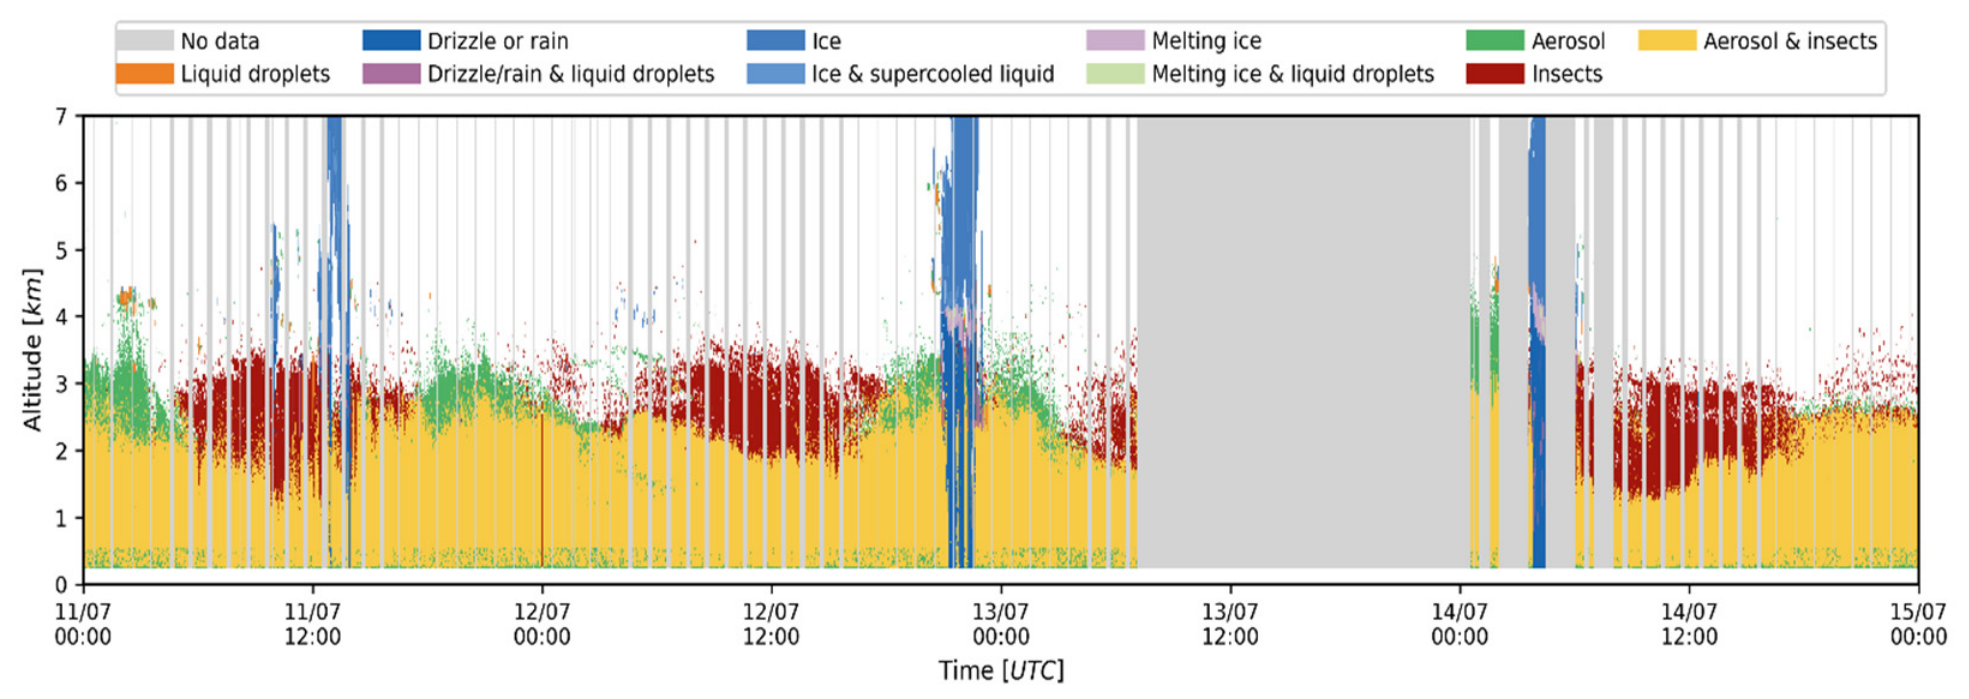
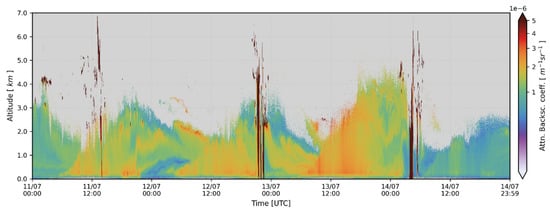
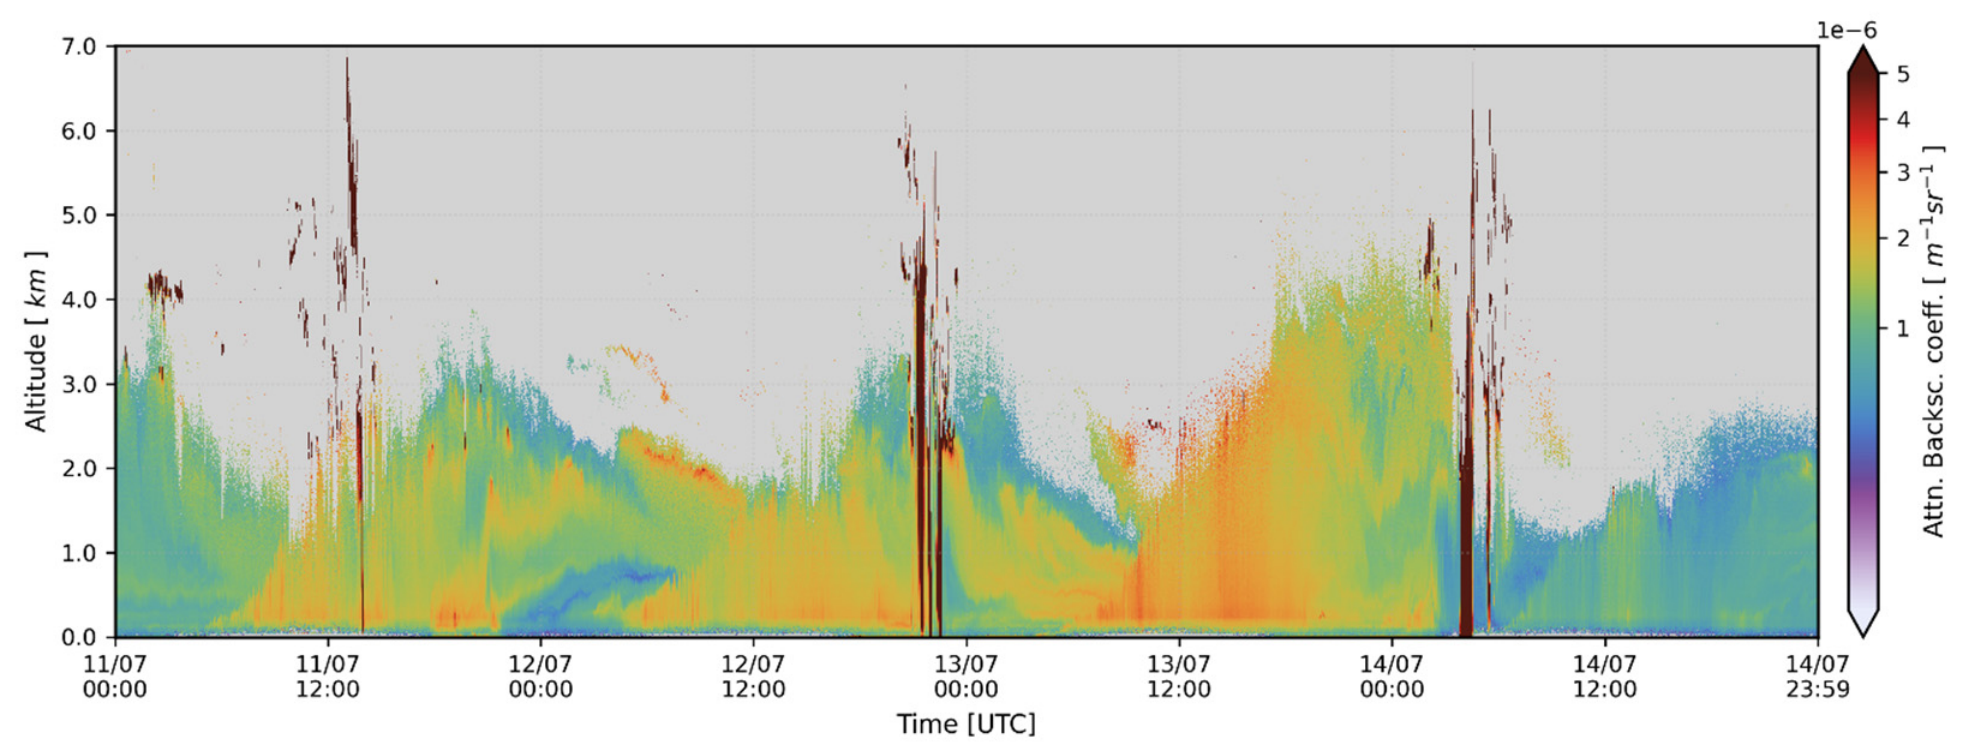
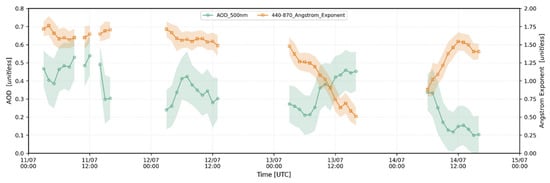
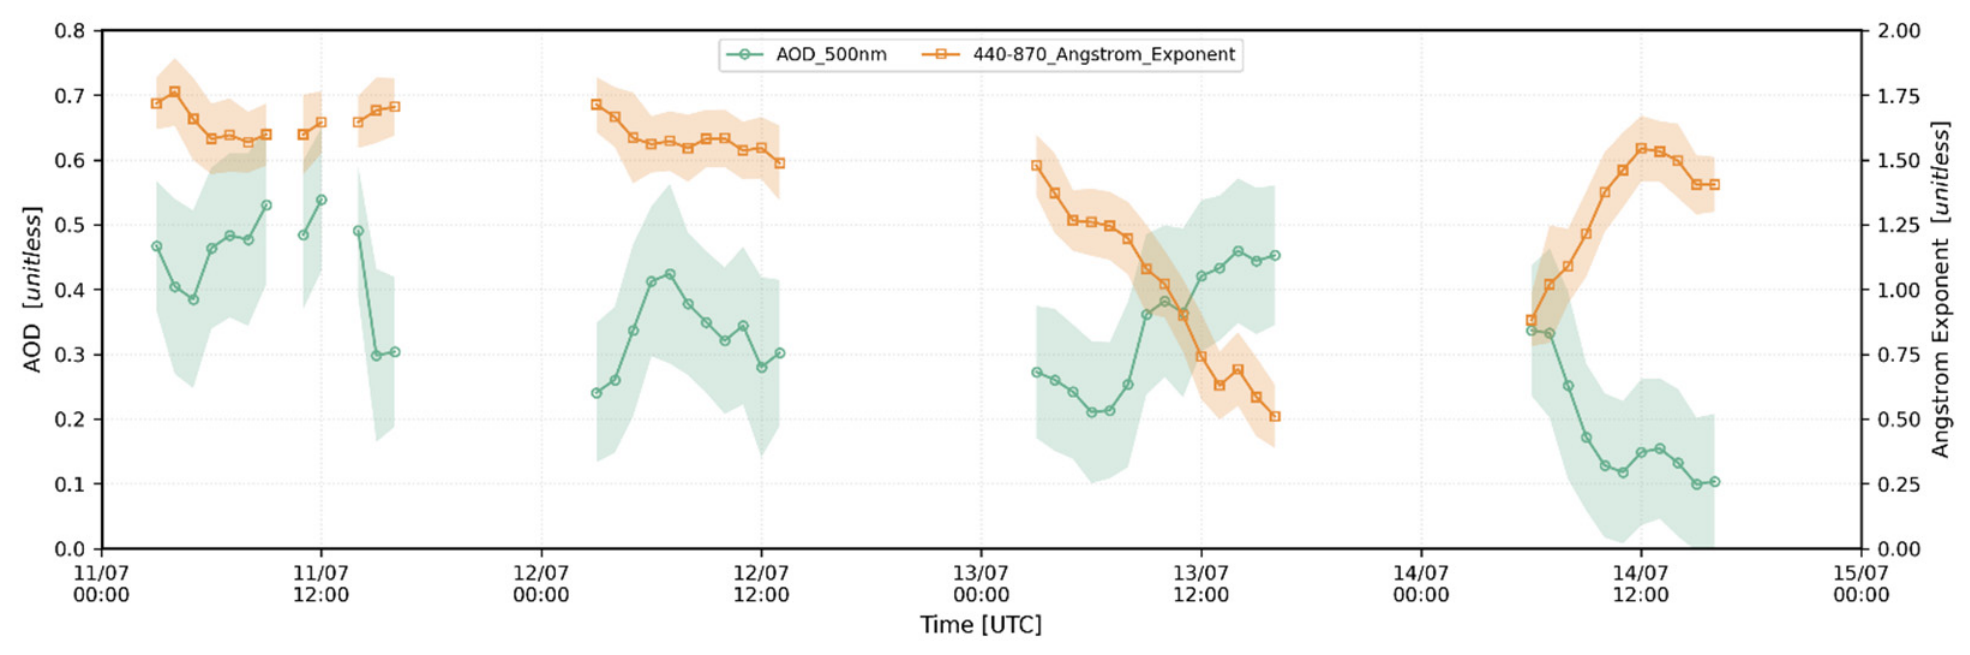
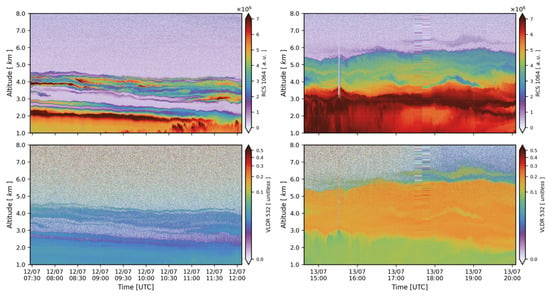
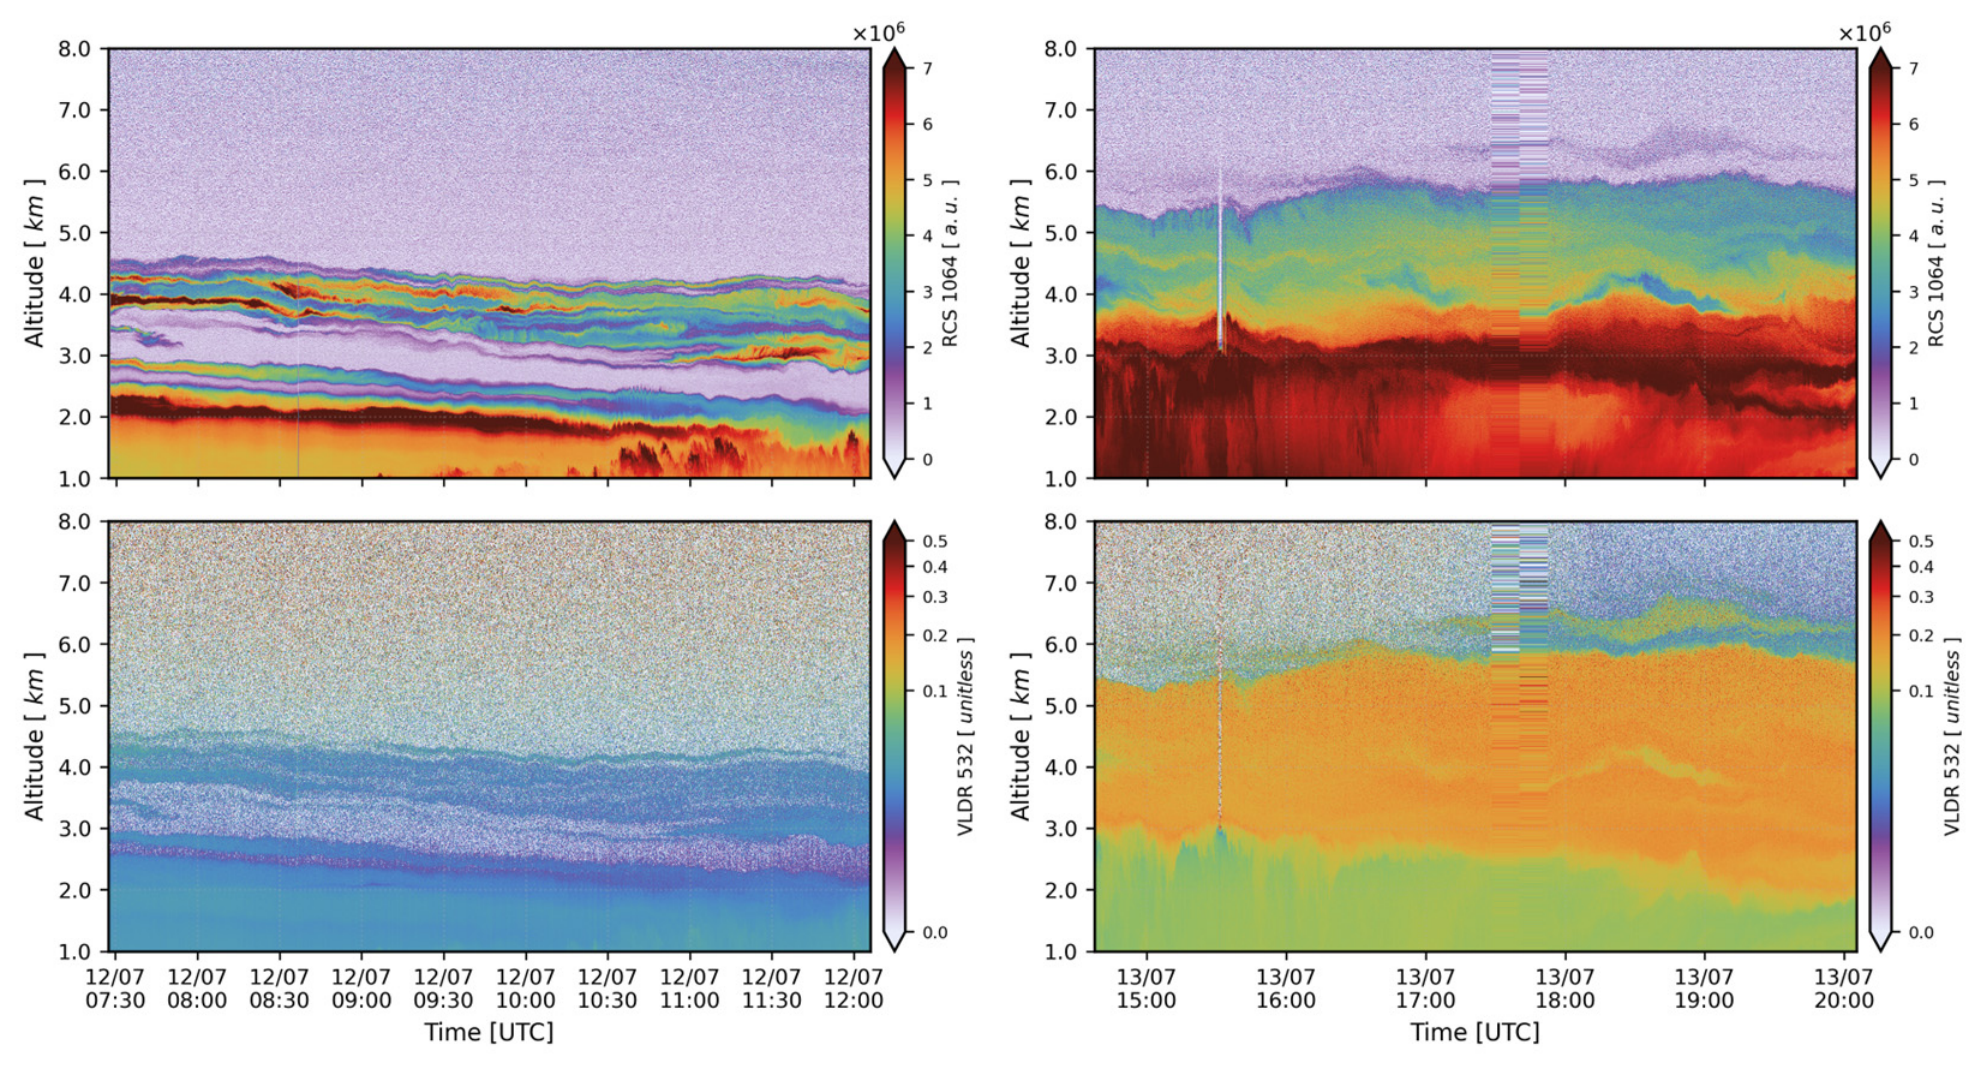
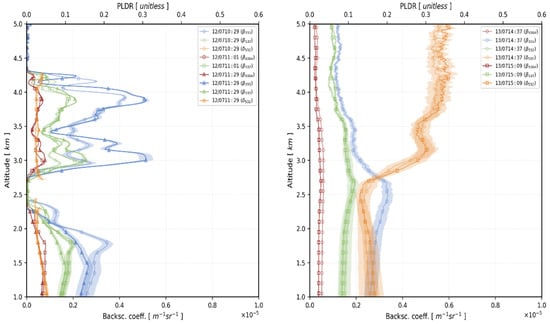
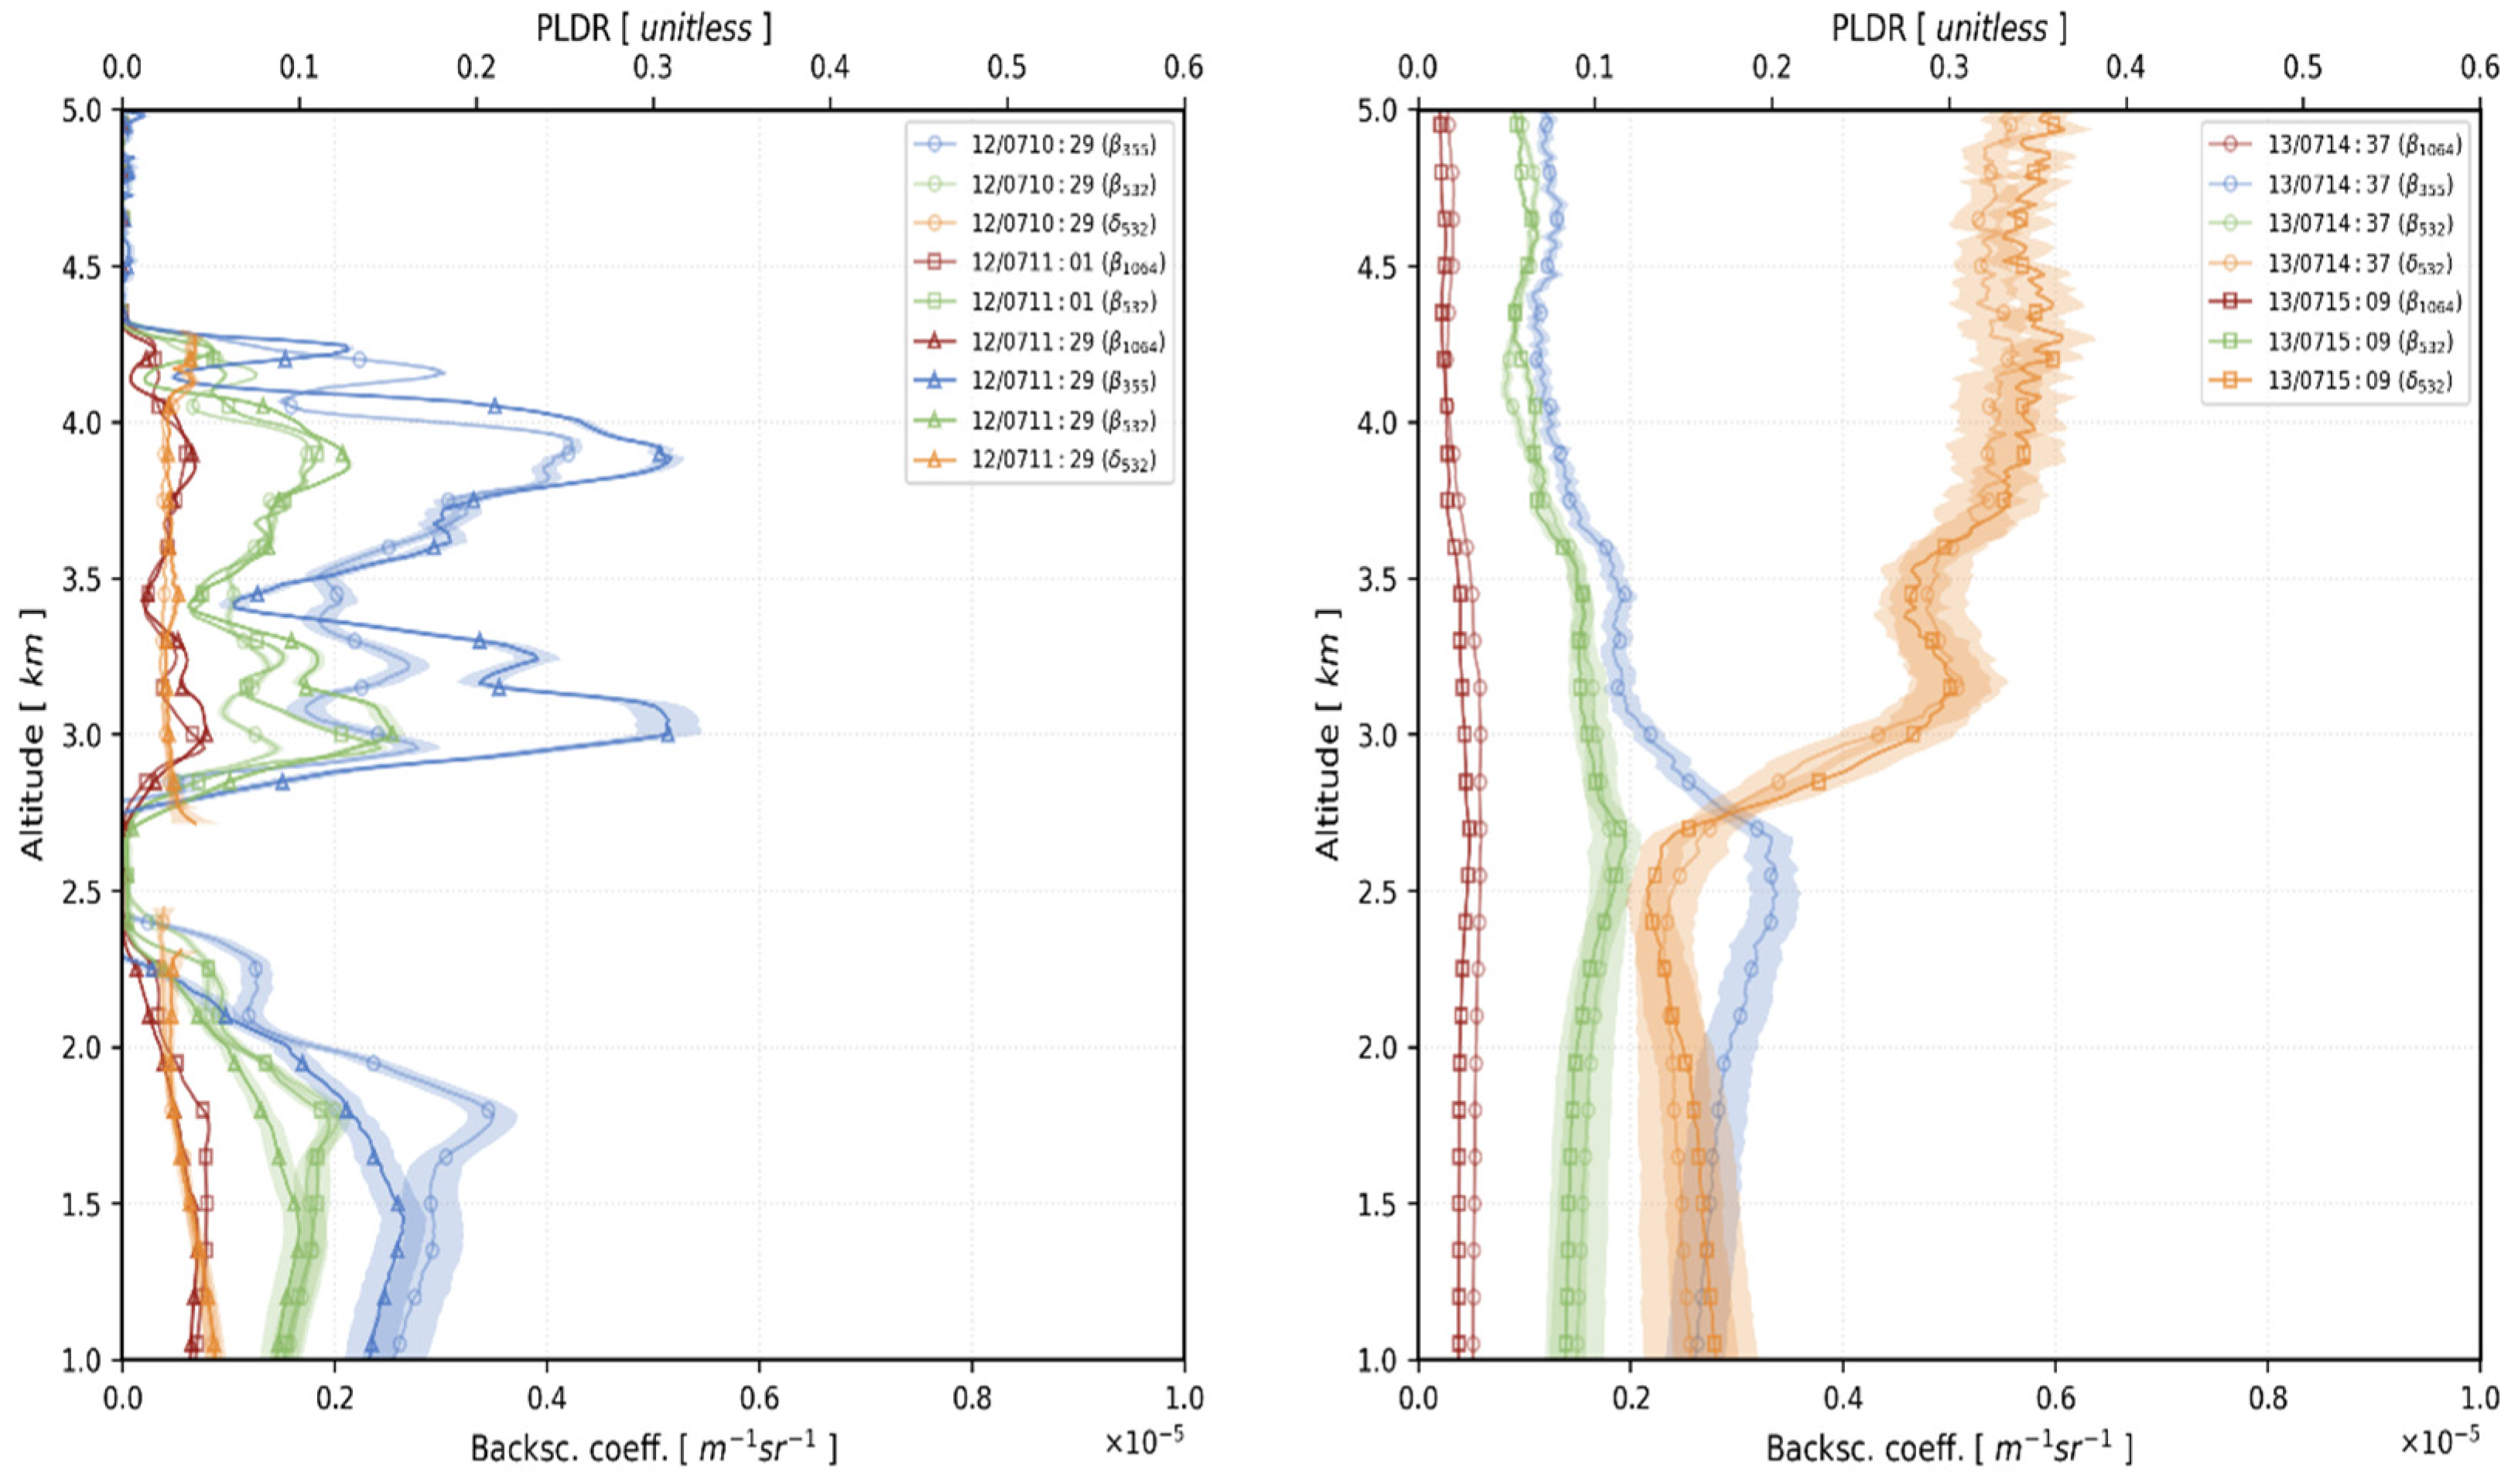
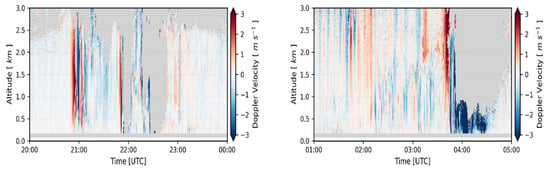
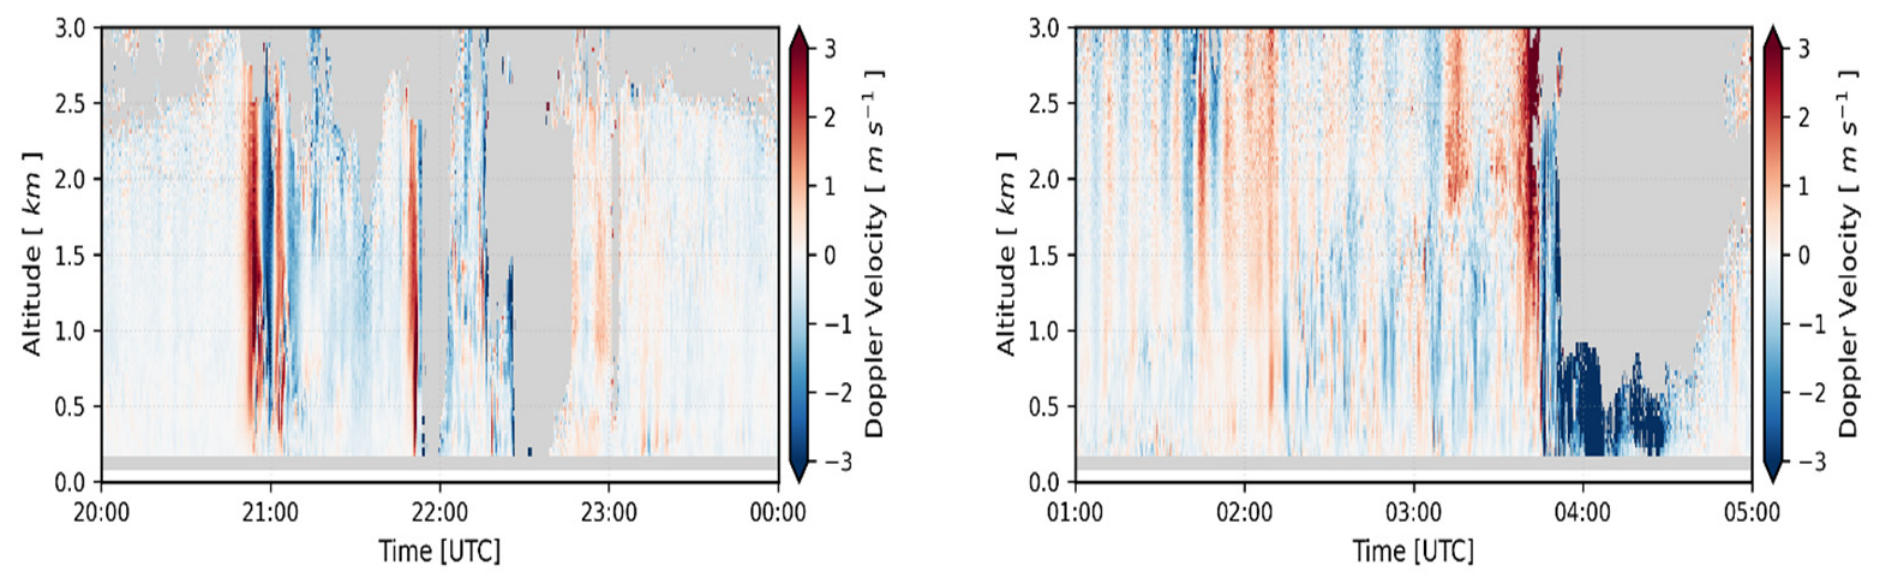
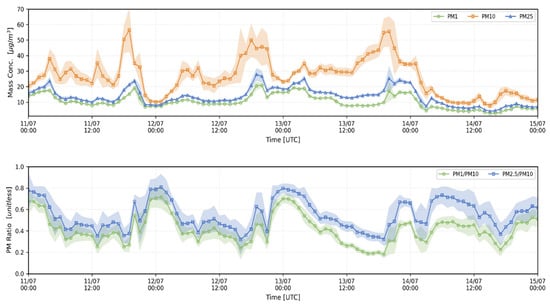
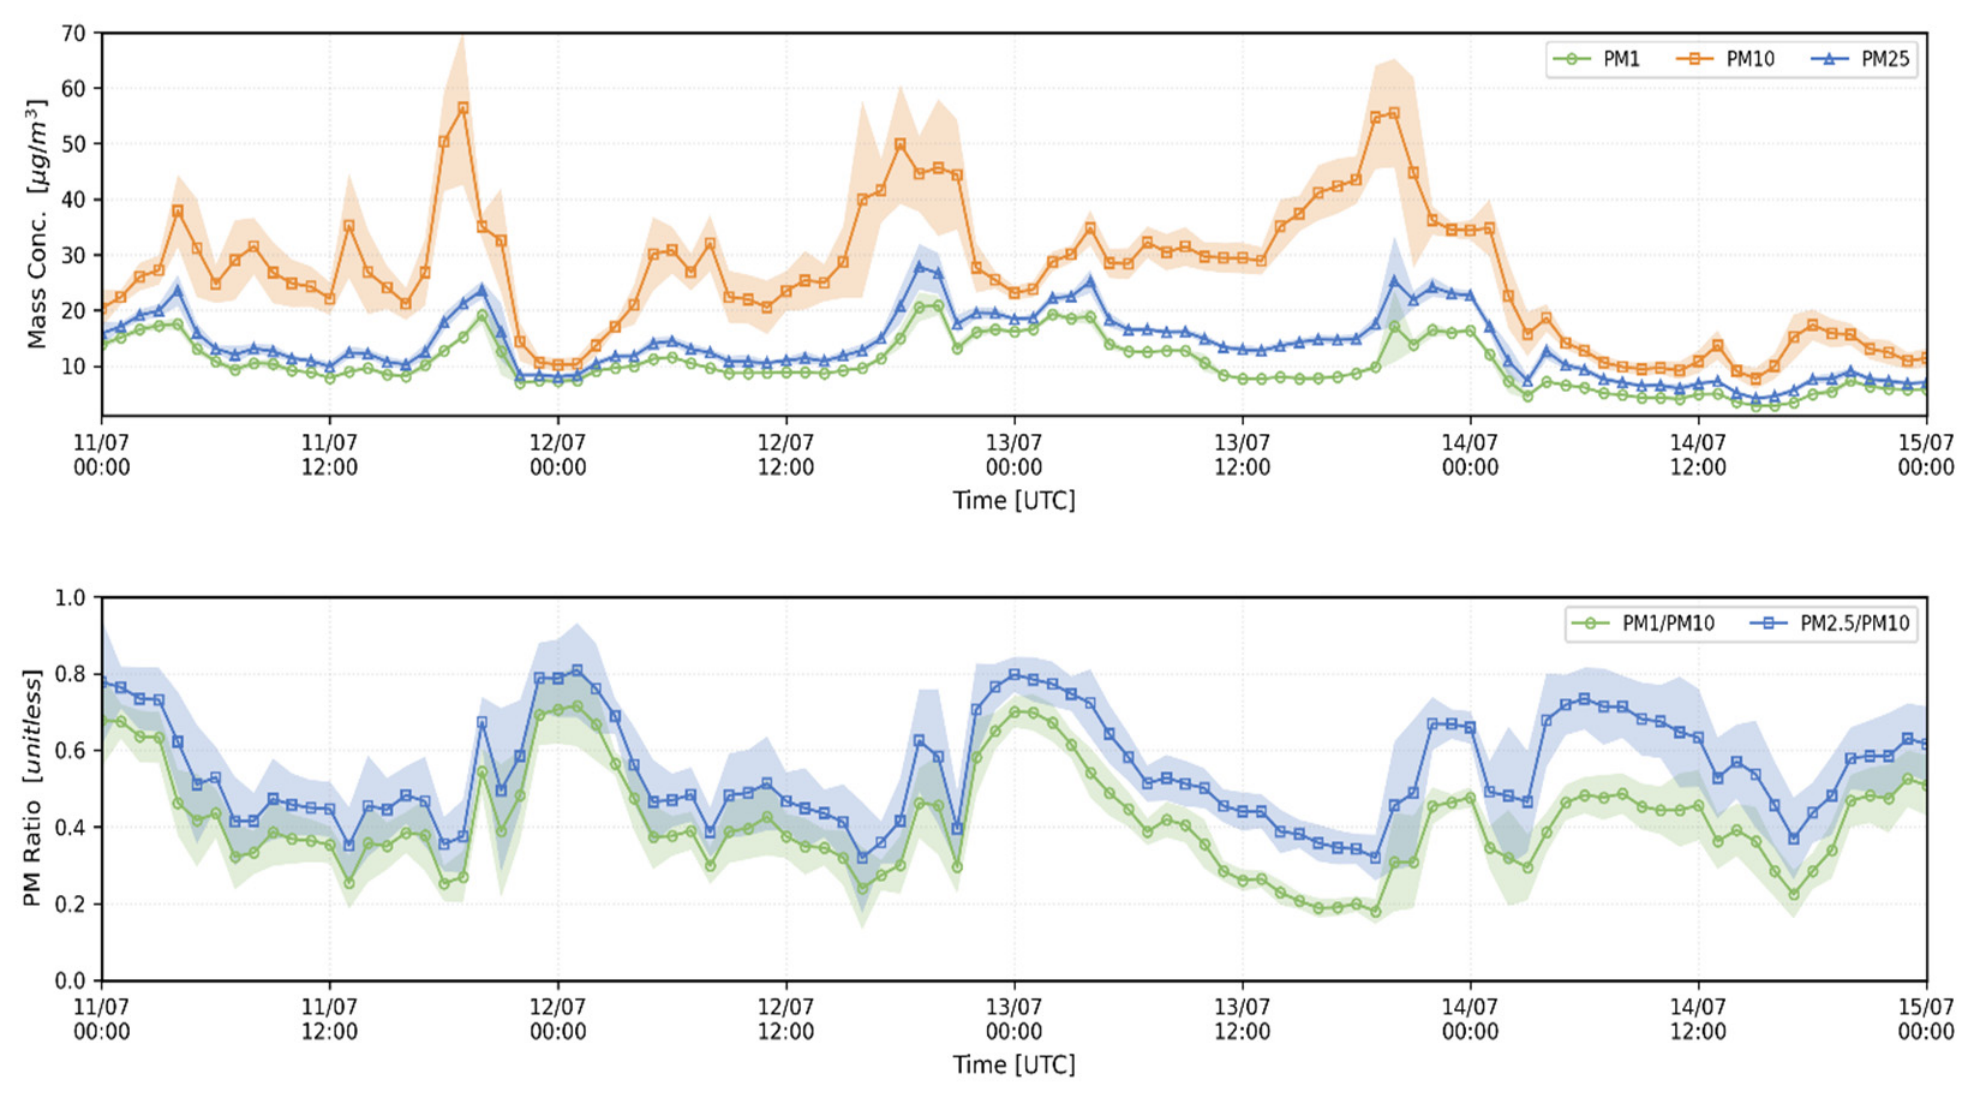
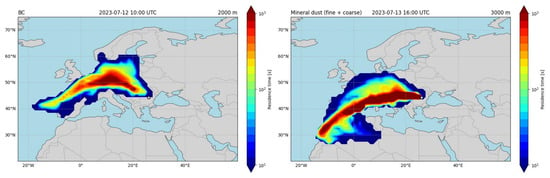
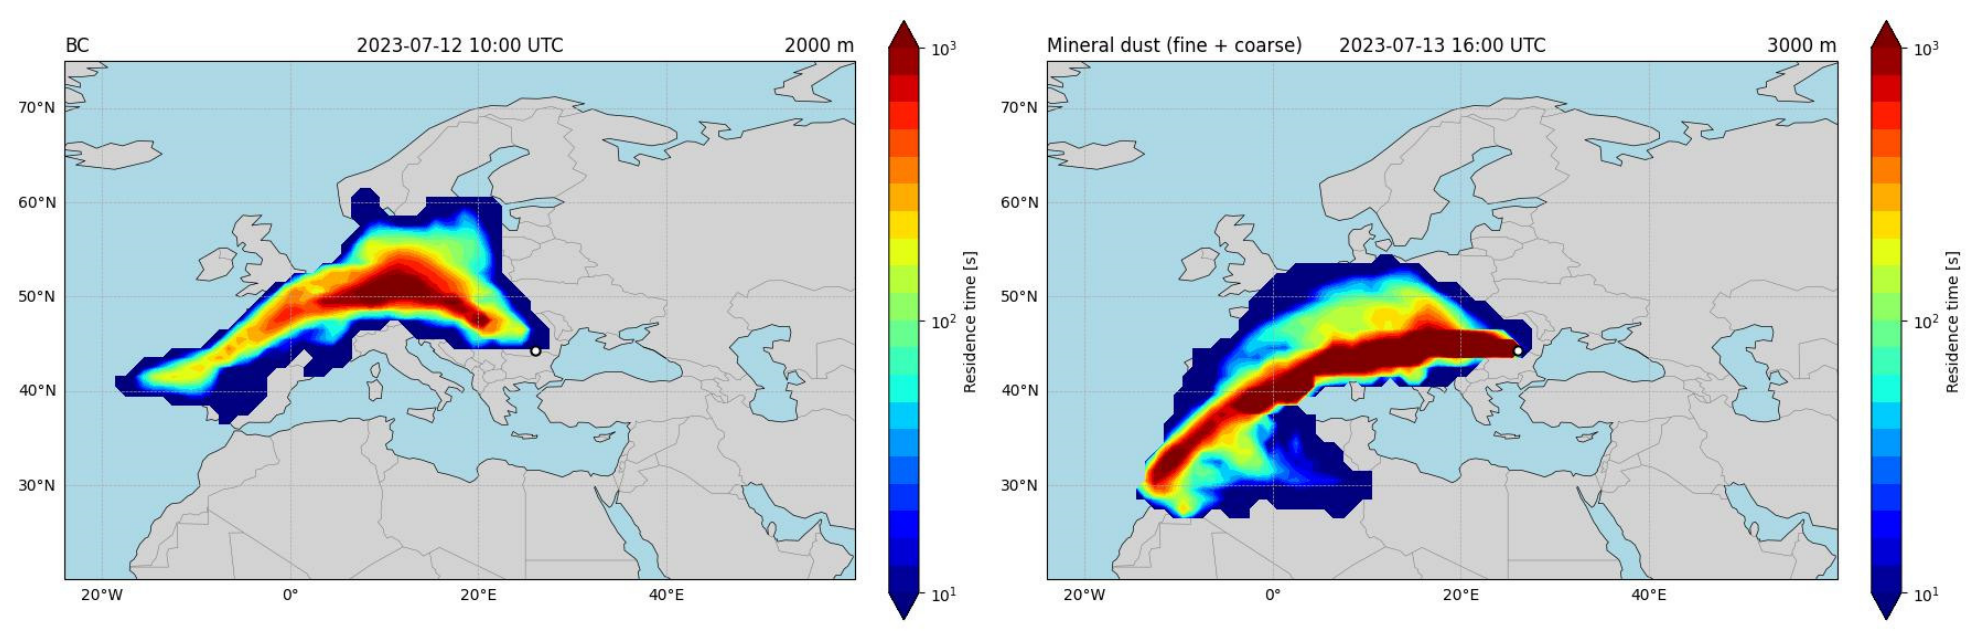
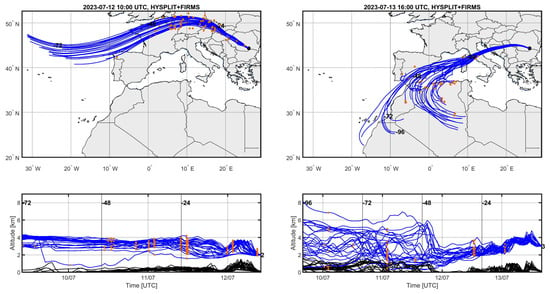
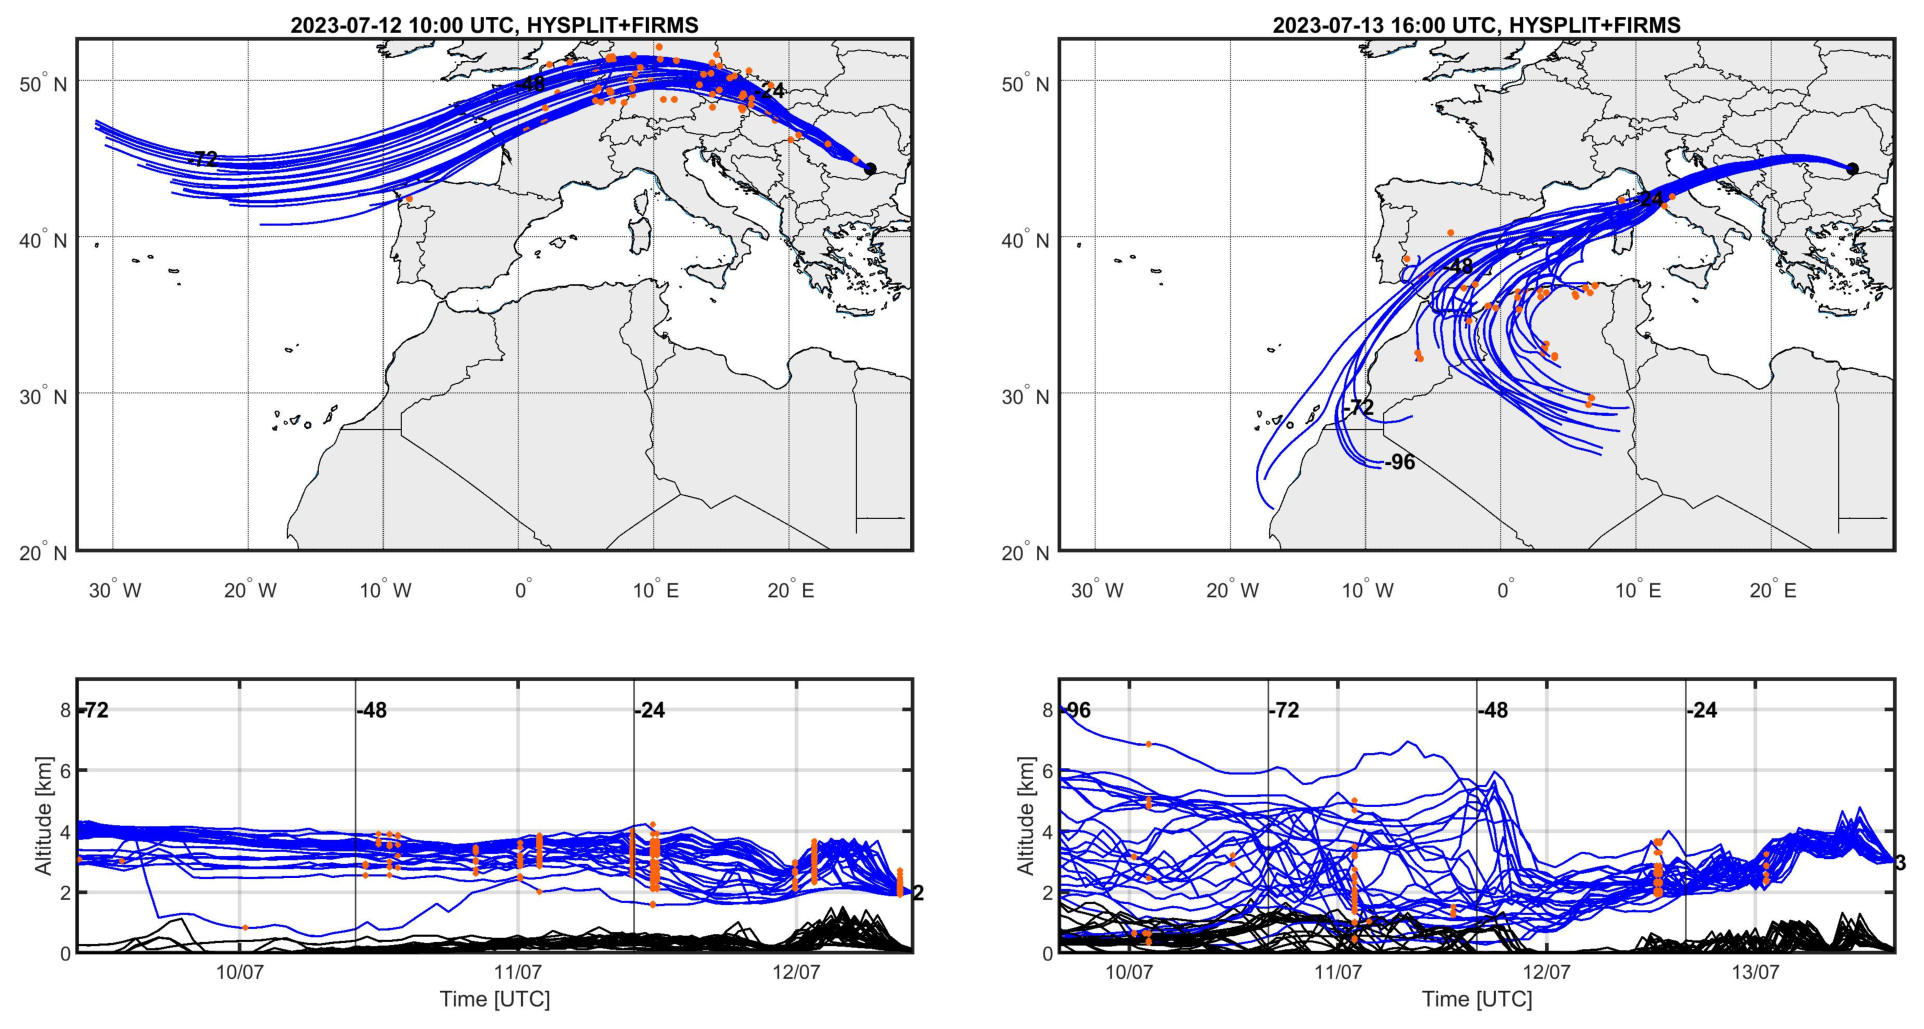
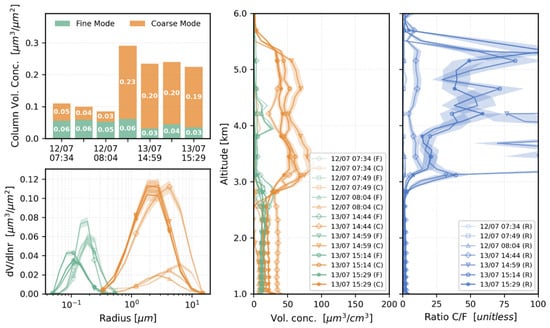
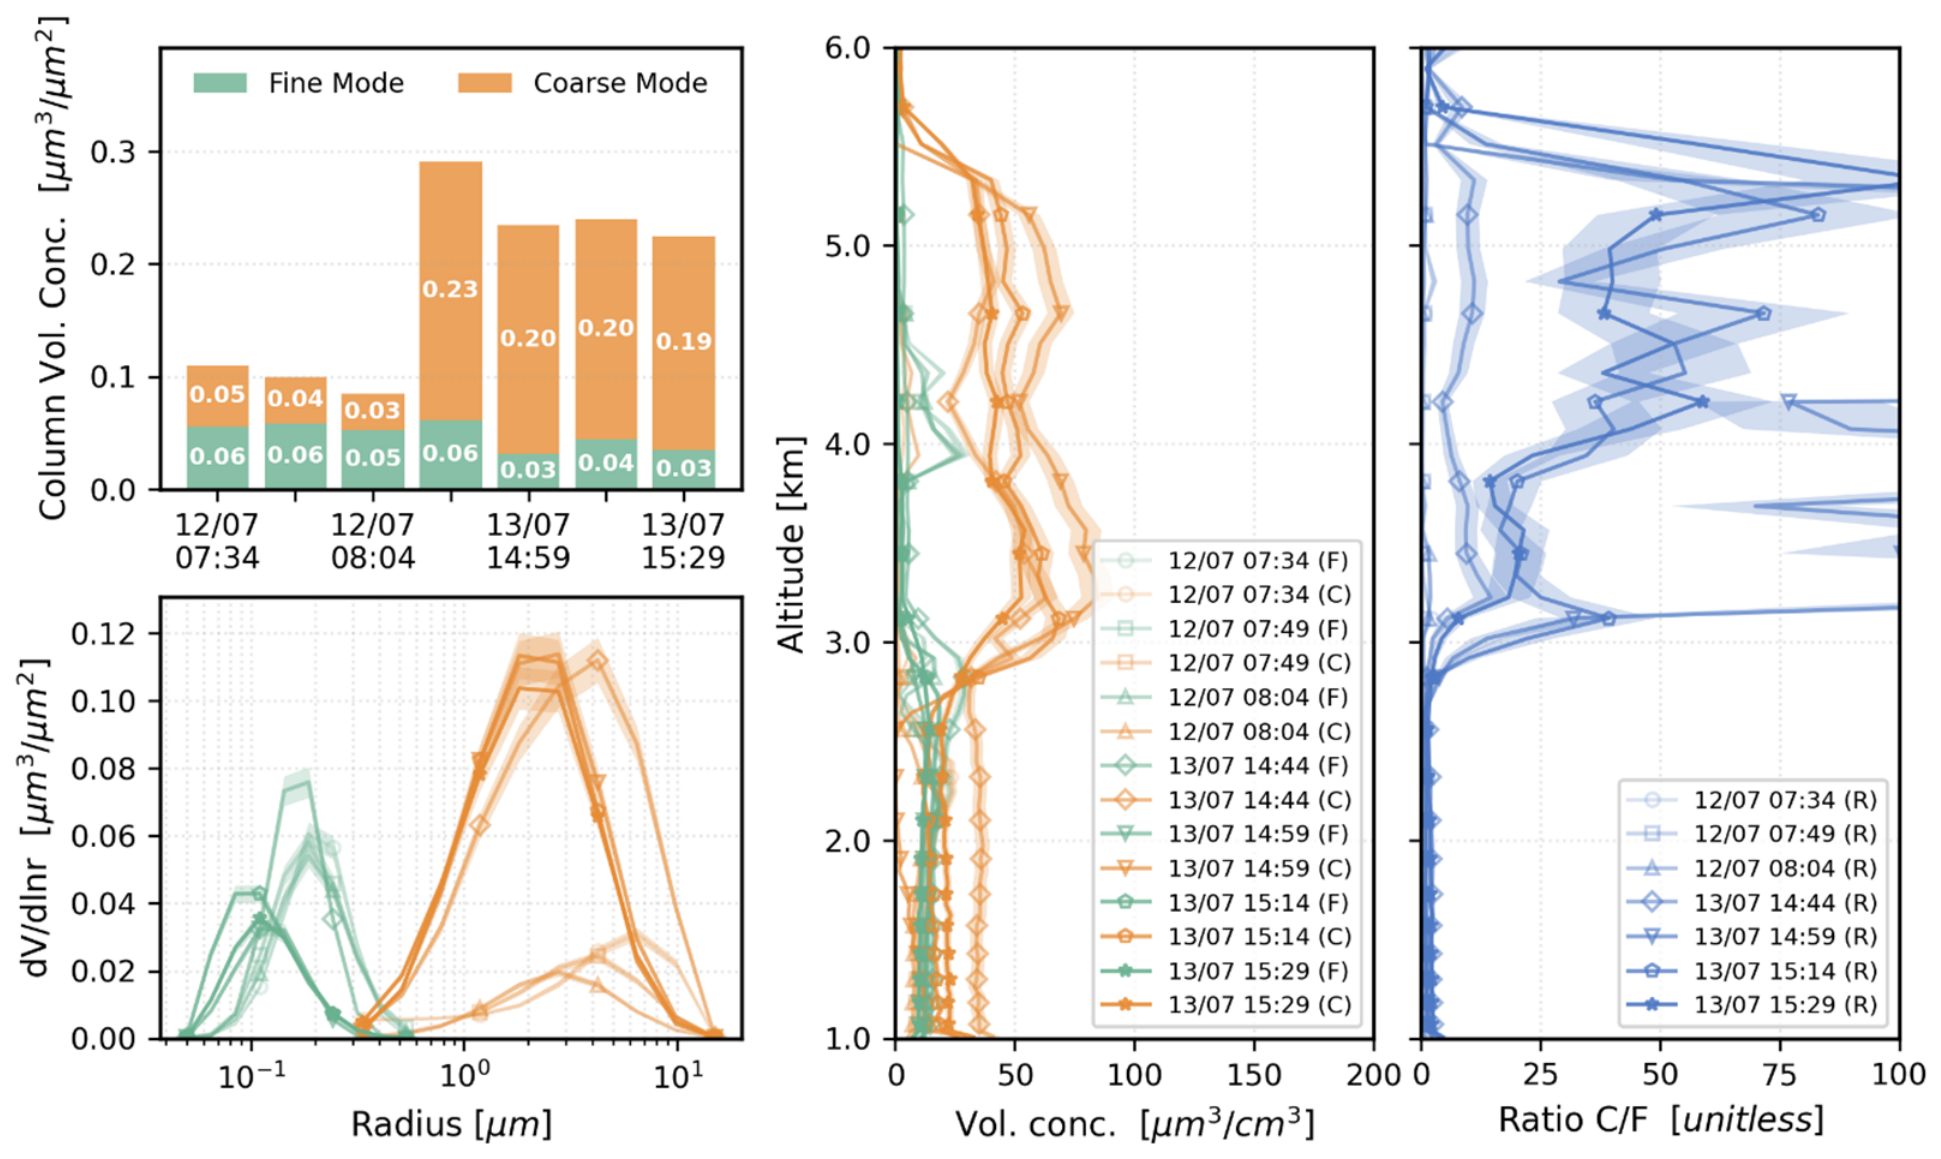
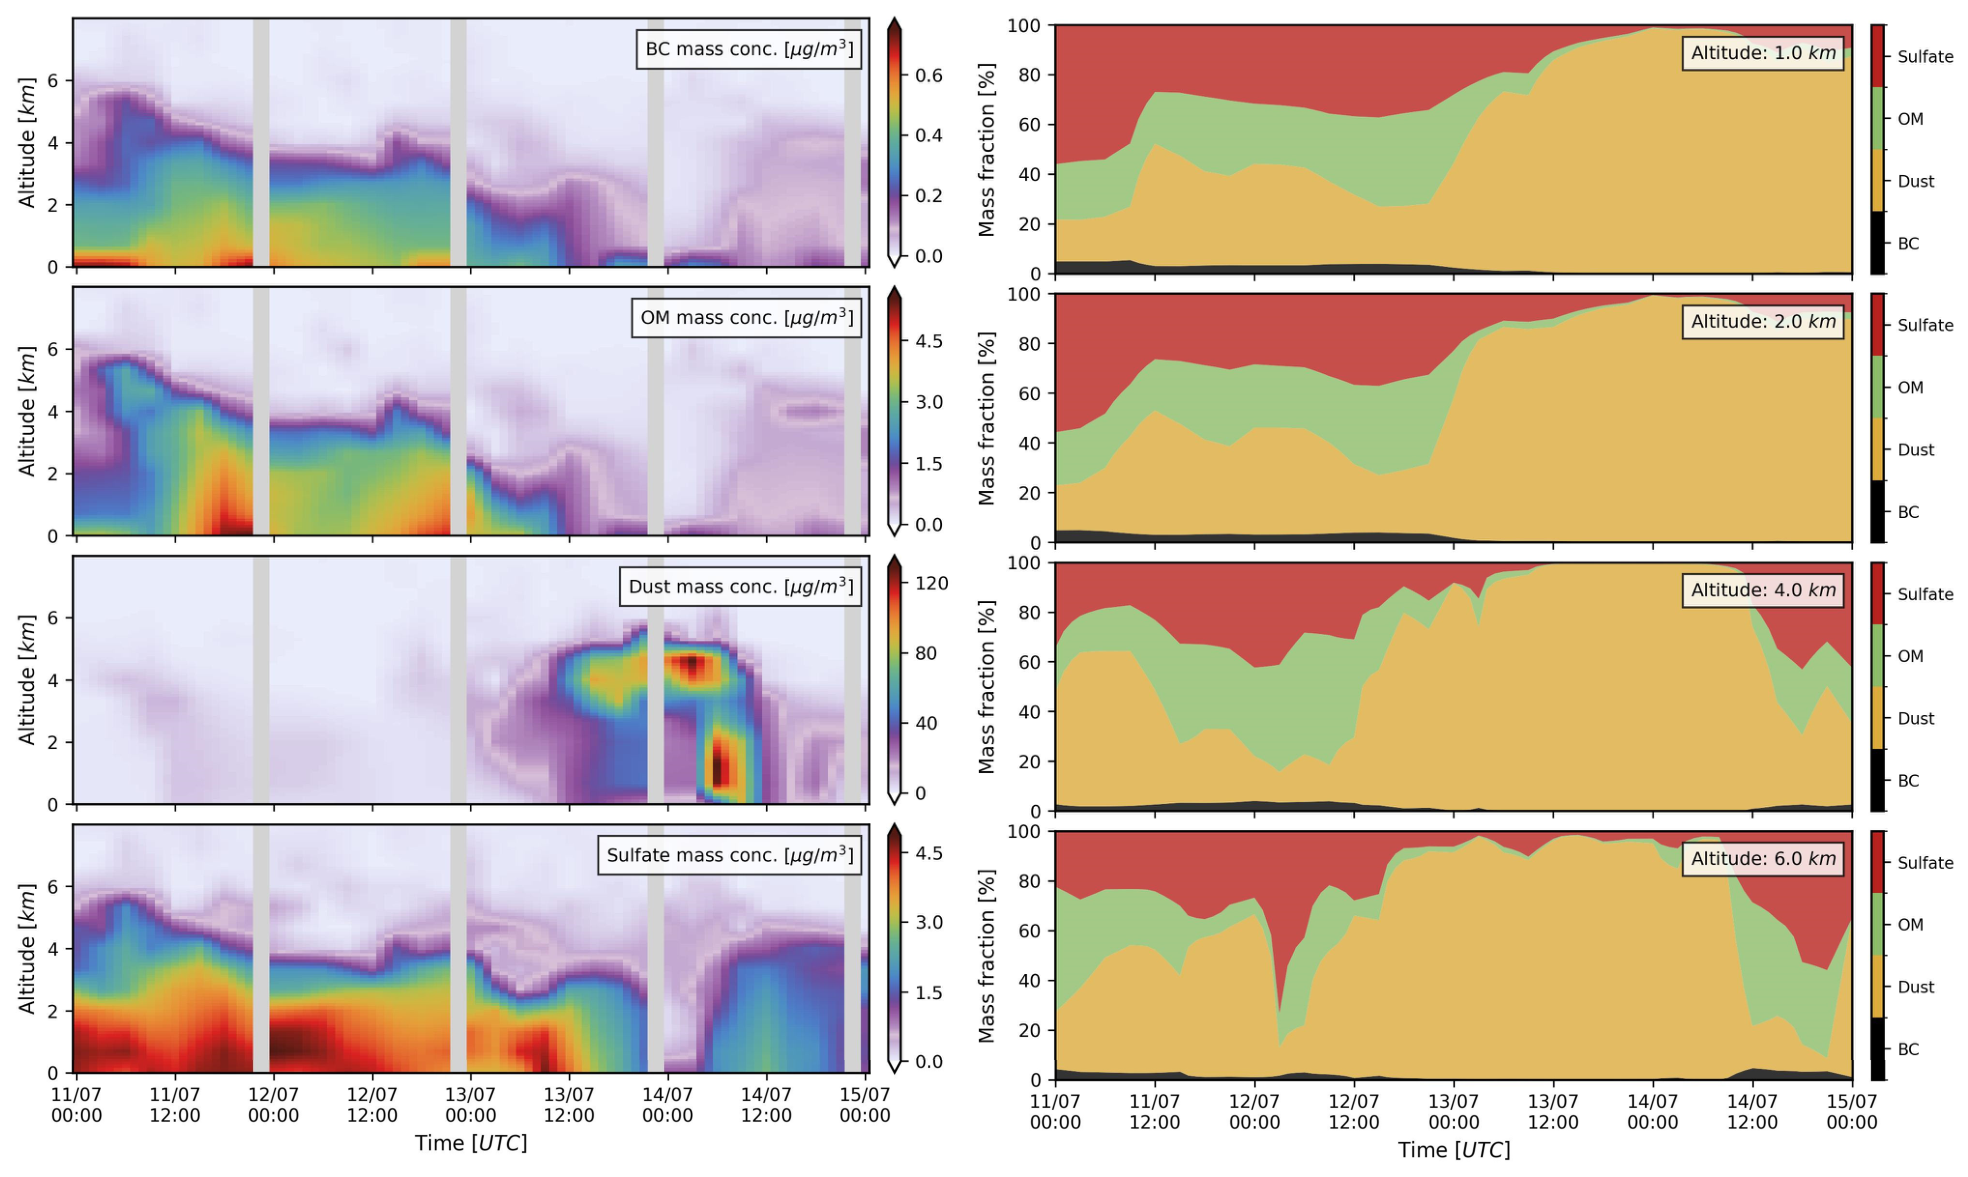
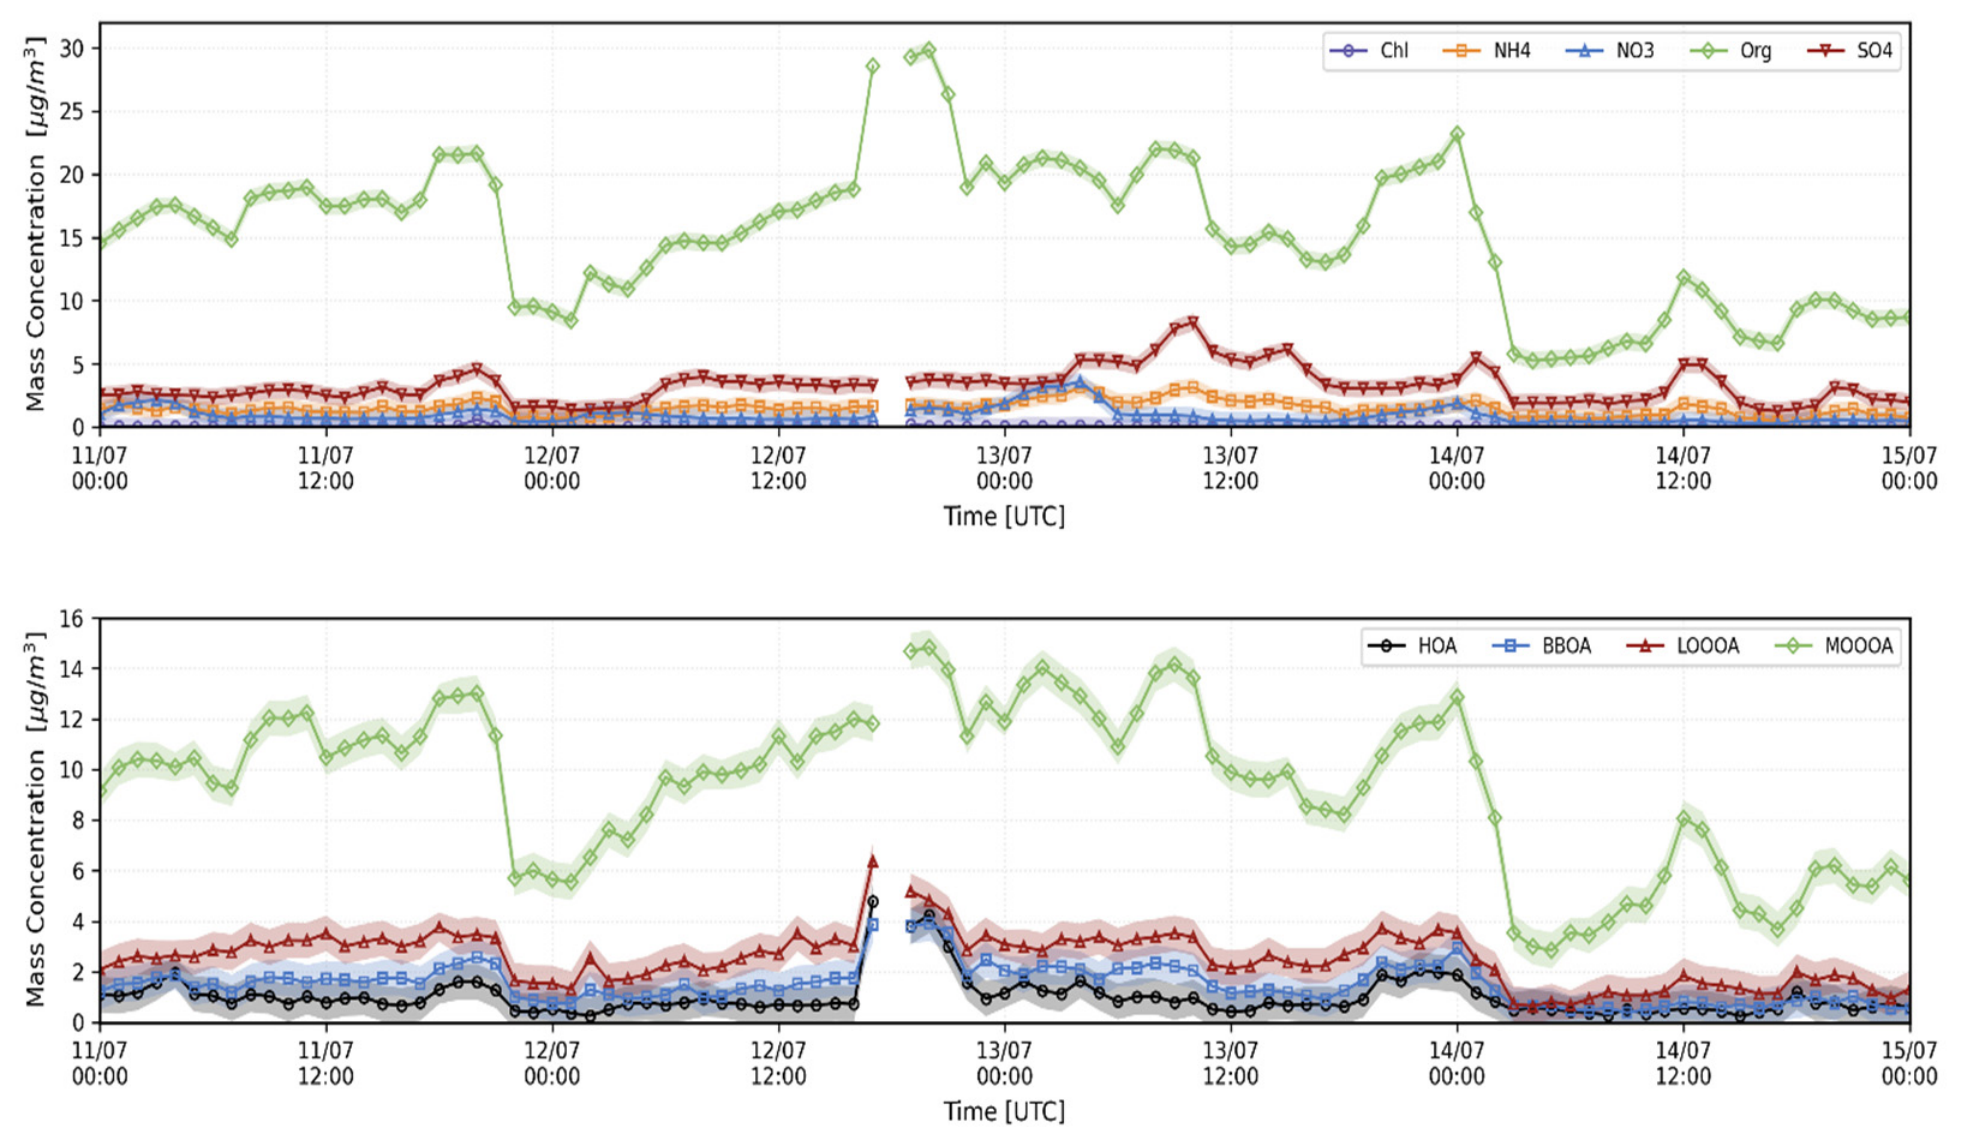
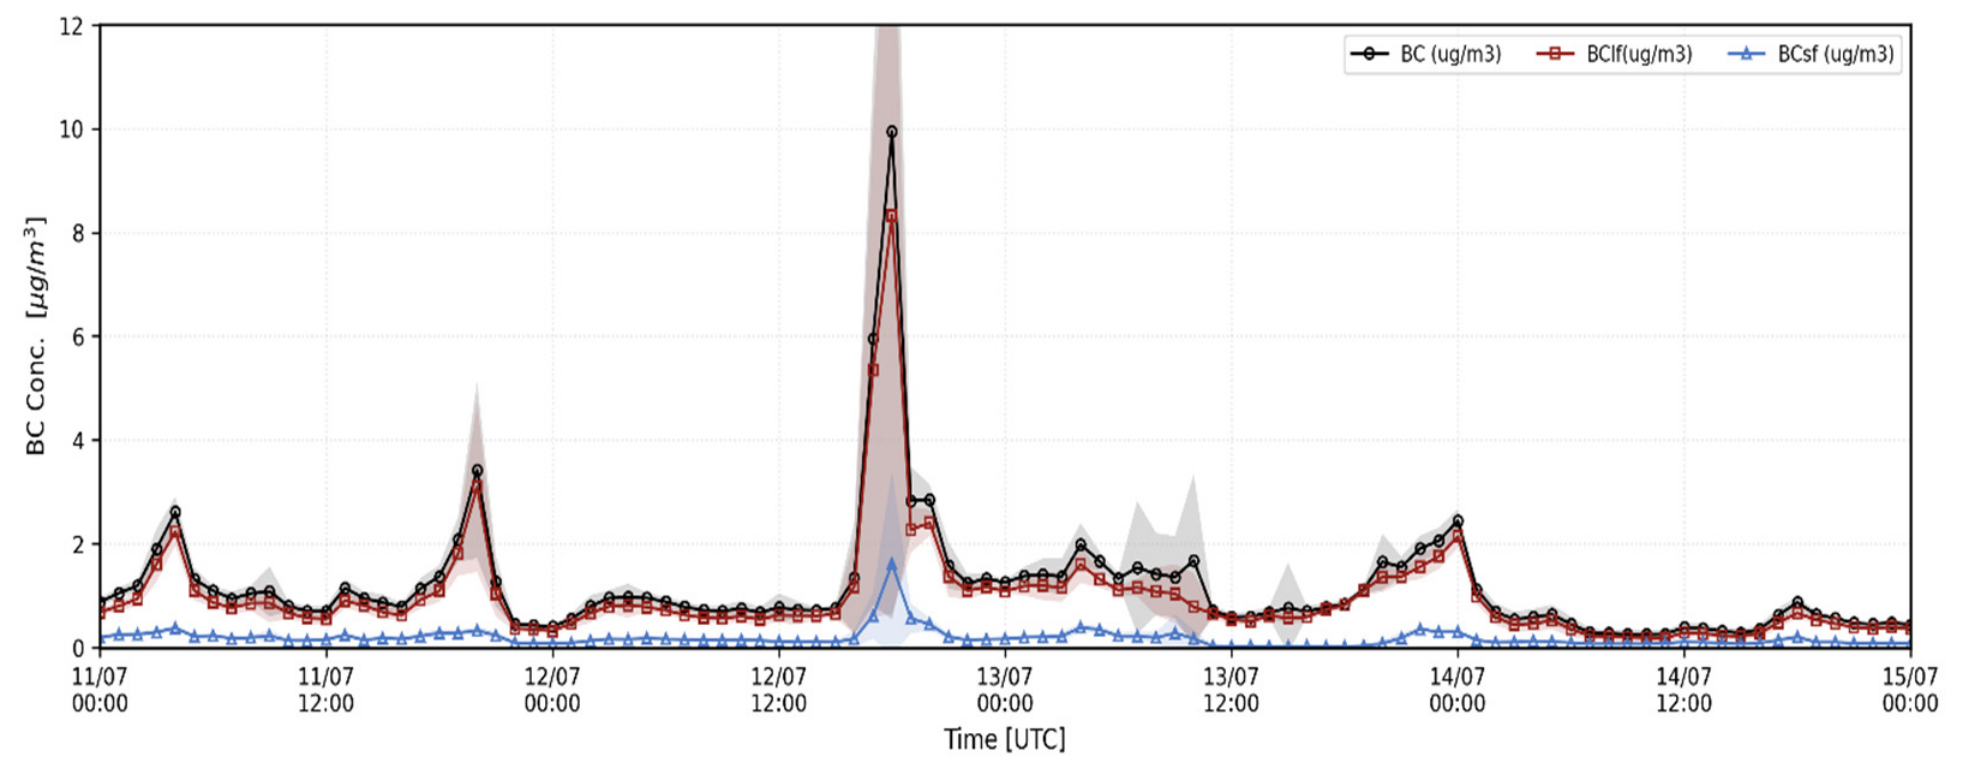
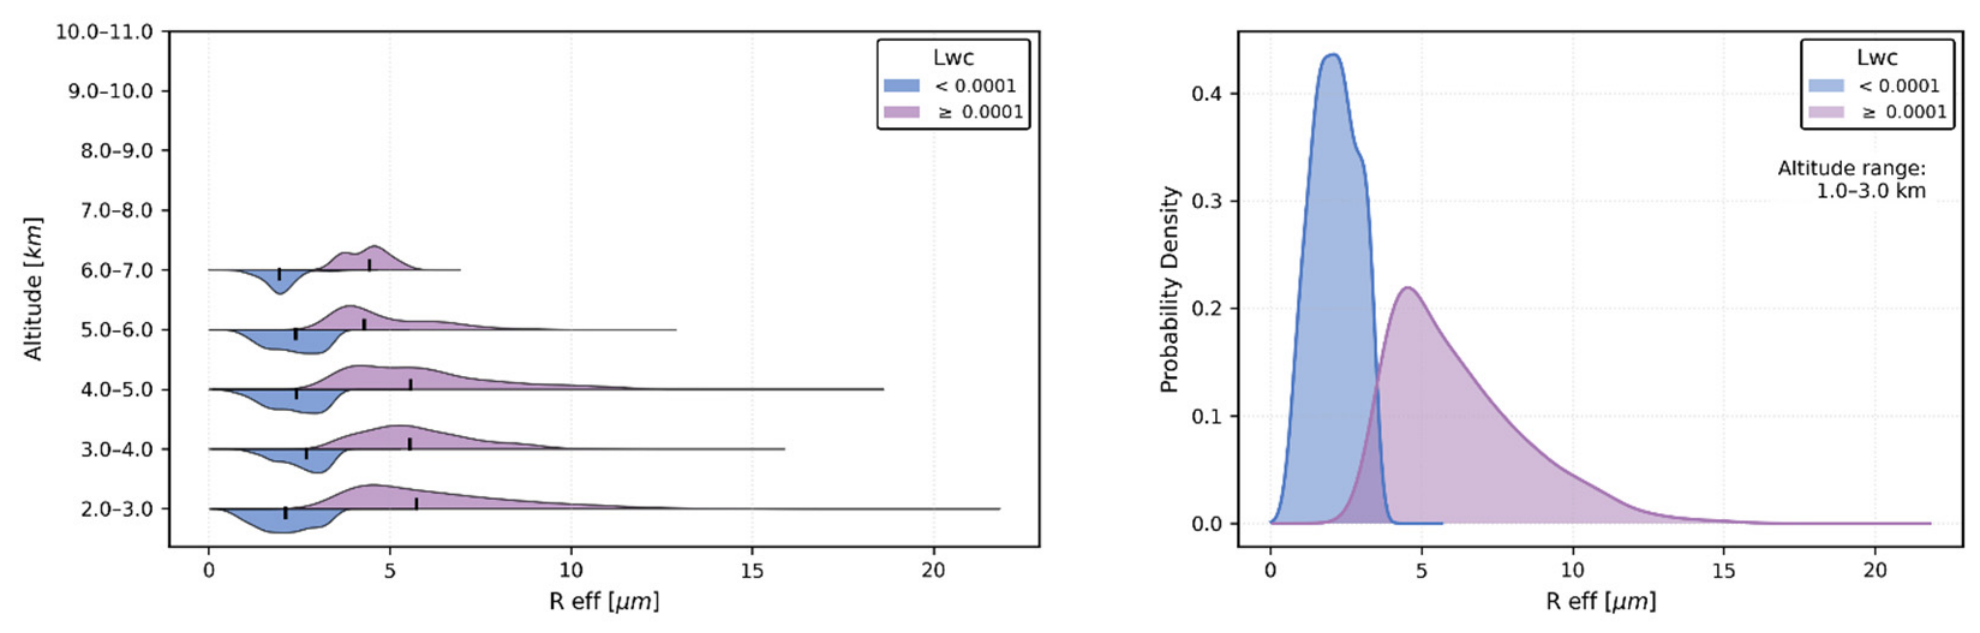
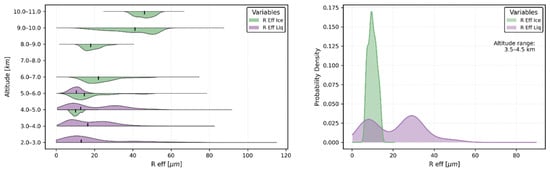
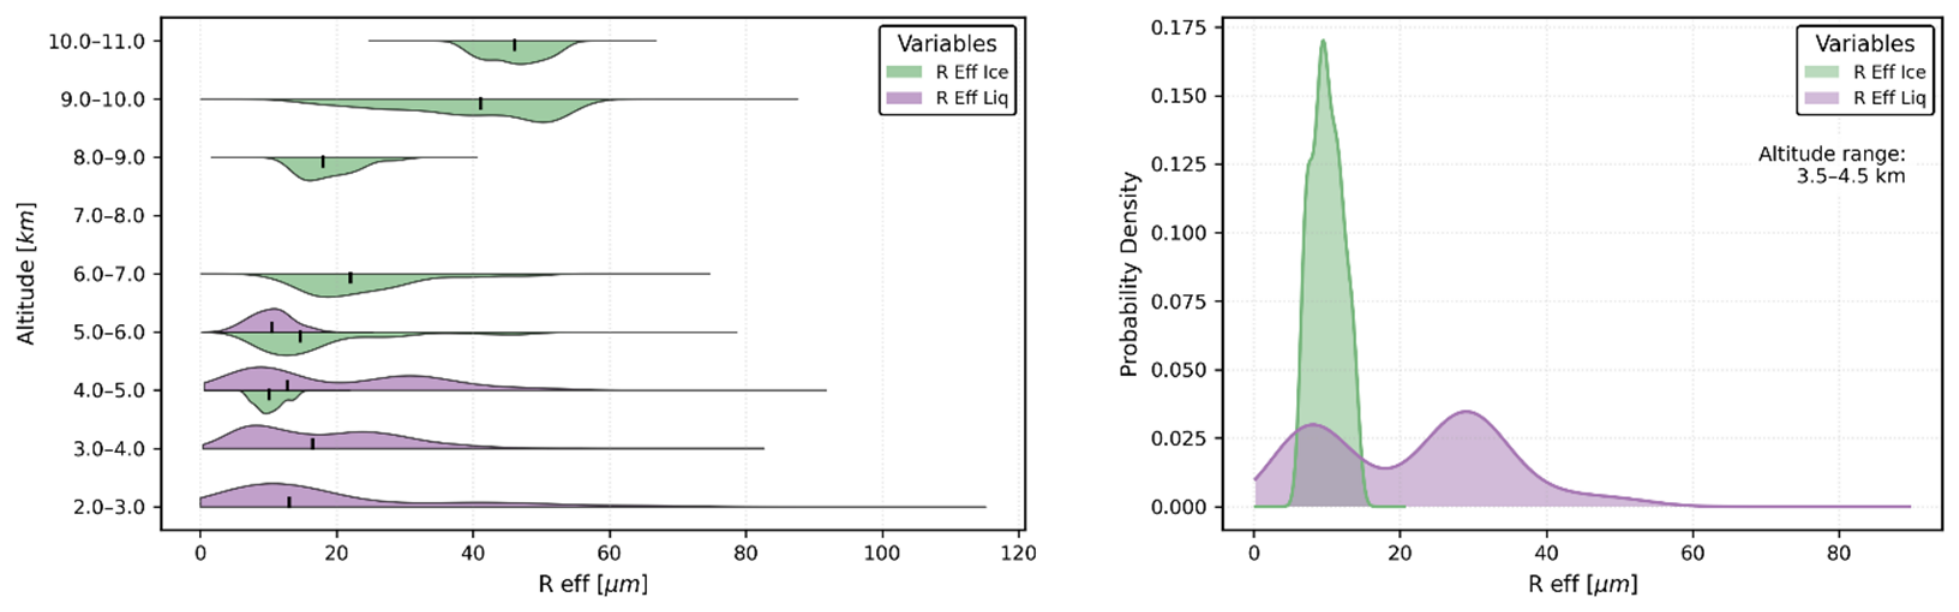
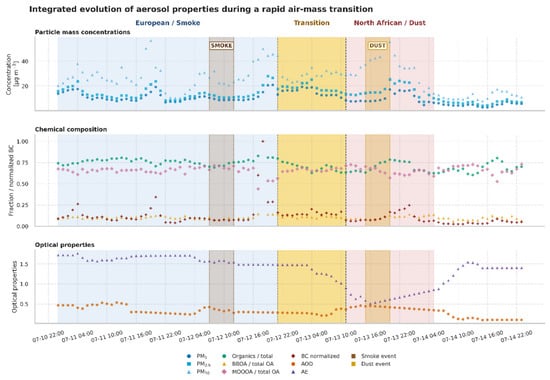
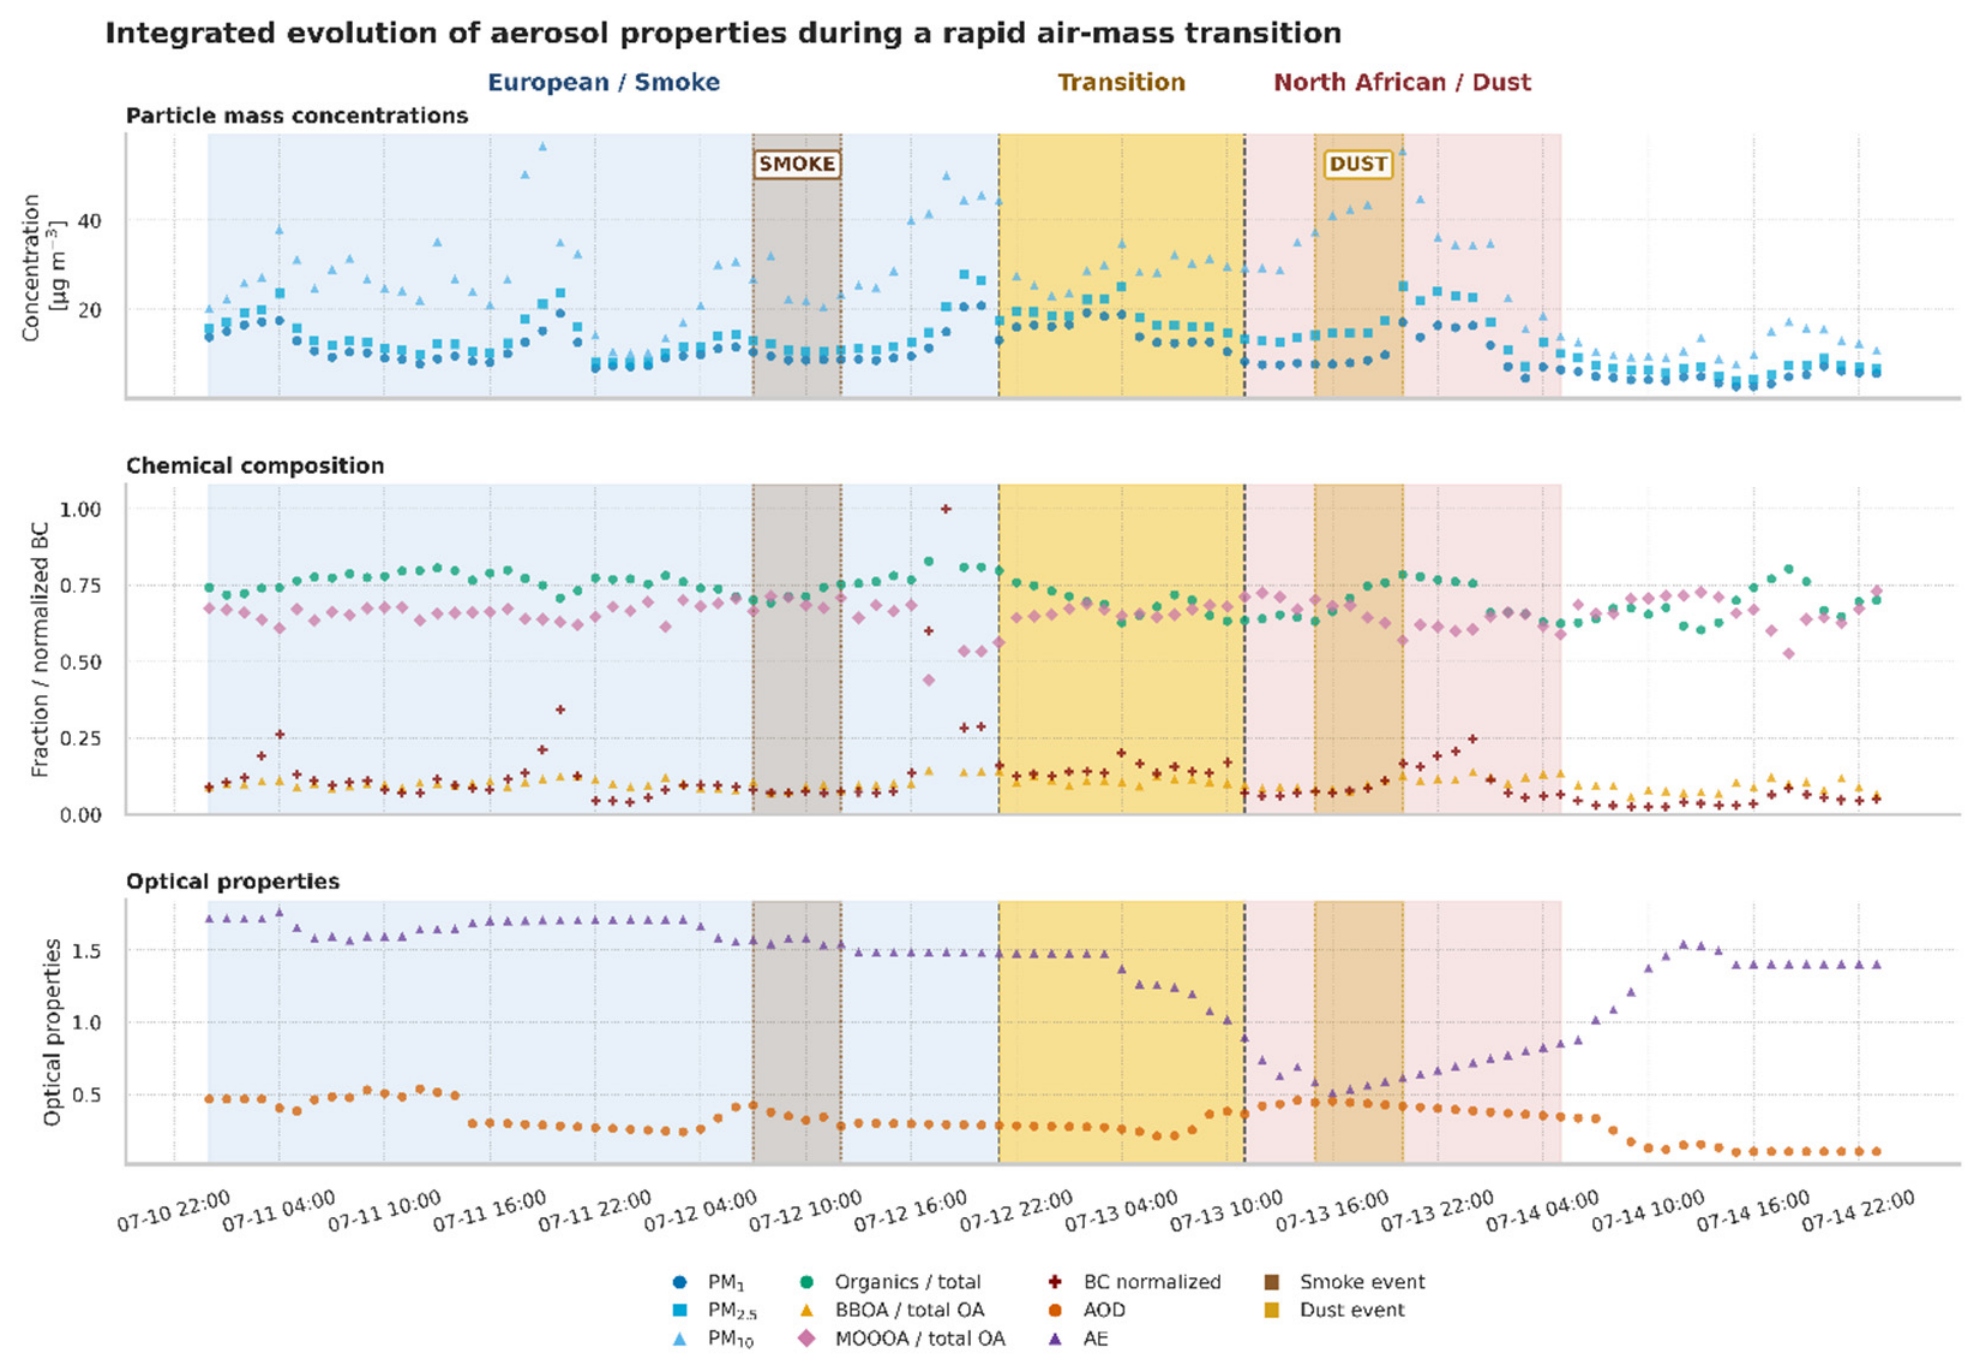
Disclaimer/Publisher’s Note: The statements, opinions and data contained in all publications are solely those of the individual author(s) and contributor(s) and not of MDPI and/or the editor(s). MDPI and/or the editor(s) disclaim responsibility for any injury to people or property resulting from any ideas, methods, instructions or products referred to in the content. |
© 2026 by the authors. Licensee MDPI, Basel, Switzerland. This article is an open access article distributed under the terms and conditions of the Creative Commons Attribution (CC BY) license.