


Highlights
What are the main findings?
- The imaging mechanisms, technical characteristics, and data sources of Synthetic Aperture Radar (SAR), optical imagery, and Nighttime Light (NTL) remote sensing modalities for fishing vessel detection are systematically reviewed.
- A multi-dimensional comparison of different remote sensing modalities in terms of detection sensitivity, environmental robustness, and spatiotemporal resolution is provided.
- Publicly available fishing vessel datasets are compiled into a systematic inventory, with characterization of their sources, scales, resolutions, and features.
What are the implications of the main findings?
- The performance complementarity of heterogeneous sensors indicates that multi-source data fusion is the key to persistent and all-weather maritime supervision.
- The scarcity of dedicated NTL fishing vessel datasets, despite significant advancements in NTL sensing technology, highlights an important area for future dataset development.
Abstract
With the increase in global fishing activities, the transparency of fishery data has drawn increasing attention. Data transparency enables stakeholders to play a greater role in ensuring that fisheries are legal, ethical, and sustainable. Improving the transparency of fishing vessel data can effectively support vessel monitoring and enhance fishery safety. This paper presents a systematic review of satellite remote sensing modalities and datasets currently available for fishing vessel identification and monitoring. Conducted in accordance with the PRISMA 2020 guidelines, this study employs a dual-track search strategy to retrieve, screen, and synthesize academic literature and public datasets from mainstream databases, including the Web of Science Core Collection, IEEE Xplore, and CNKI. First, the existing remote sensing modalities were classified into three major categories based on their imaging principles: synthetic aperture radar (SAR), optical remote sensing, and nighttime light (NTL) remote sensing. In addition, the mainstream satellite data sources and their corresponding parameters were summarized for each category. Second, an in-depth comparative analysis of these remote sensing modalities is conducted from core dimensions such as target detection sensitivity, robustness under complex environments and meteorological conditions, and spatiotemporal resolution. This reveals the performance limitations and significant complementarity of different sensor data in fishing vessel detection. Finally, mainstream remote sensing datasets for fishing vessels (such as xView3-SAR, xView, and VBD) are summarized and evaluated, pointing out the gaps in certain types of datasets. In conclusion, this paper suggests that building a “full spatiotemporal and multi-scale” observation framework based on multi-source heterogeneous data fusion is an important trend for the future development of fishing vessel detection using remote sensing, aiming to provide a reference for relevant researchers.
1. Introduction
As a key sector in the global economy, fisheries are of great significance in ensuring food security, promoting economic growth, and maintaining the balance of marine ecosystems. According to The State of World Fisheries and Aquaculture 2024: Blue Transformation in Action [1] published by the Food and Agriculture Organization of the United Nations (FAO), total global capture fisheries production reached 92.3 million tonnes in 2022, with a value of USD 159 billion. This total included 91 million tonnes of aquatic animals and 1.3 million tonnes of algae, among which 79.7 million tonnes of aquatic animals were captured in marine waters and 11.3 million tonnes in inland waters. Marine capture fisheries remained a major source of global aquatic animal production, accounting for 43%. Over 500 million people worldwide rely directly or indirectly on fisheries for their livelihoods, making the industry an essential economic pillar, especially for coastal regions and developing countries.
However, with the rapid expansion of the marine economy and the continuous increase in fishing intensity, fishery resources are under unprecedented pressure. The problem of Illegal, Unreported and Unregulated (IUU) fishing remains severe [2,3]. Recent global-scale satellite analyses have further demonstrated the extensive distribution of industrial maritime activities, highlighting the importance of satellite-based observation for improving transparency in ocean management [4]. Building a comprehensive fishery management system has become a pressing need to enhance resource protection capabilities and achieve ocean-friendly and sustainable development [5]. Meanwhile, accurate information on fishing grounds and fishing activities is essential for improving fishing efficiency and supporting sustainable exploitation of marine resources [6]. Against this background, global fisheries transparency has gradually attracted attention. Disclosing fishing vessel information can help strengthen social supervision mechanisms, enhance vessel monitoring, and safeguard the lives and property of fishers. By transparently disclosing the number, distribution, trajectories, and operational patterns of fishing vessels, regulatory agencies can not only scientifically formulate management policies but also effectively identify illegal activities and improve the level of resource protection.
Currently, fishing vessel monitoring mainly relies on traditional manual inspections and electronic monitoring systems. Manual inspections include at-sea observer monitoring and port boarding inspections. However, these inspections are costly and inefficient, making it difficult to cover vast ocean areas [7]. Electronic monitoring systems installed on fishing vessels, including the Automatic Identification System (AIS) and the Vessel Monitoring System (VMS), have facilitated the shift toward precision-oriented fisheries management. However, these systems are susceptible to intentional shutdowns and data manipulation, making it difficult to fully reflect the actual activities of fishing vessels. Furthermore, some fishing vessels are not even equipped with any monitoring devices, leading to a large number of illegal operations going undetected [2]. On the other hand, drone monitoring remains constrained by labor-intensive operation and limited detection accuracy, hindering large-scale deployment [8,9].
In recent years, the development of remote sensing technology has provided another approach to fishing vessel monitoring. Remote sensing platforms offer advantages such as non-contact observation, wide coverage, high timeliness, and all-weather capabilities. They can obtain information on sea surface targets without relying on shipborne equipment, significantly improving the dynamic monitoring capabilities in coastal, offshore, and port areas [10]. With the development of technologies such as artificial intelligence, computer vision, and deep learning, the level of automated processing and intelligent recognition of remote sensing data continues to improve. This promotes the accelerated transformation of marine remote sensing from merely “observable” to “identifiable and trackable” [11,12].
Research on fishing vessel detection using remote sensing is undergoing a paradigm shift from being method-driven to data-driven. As the foundation of fishing vessel monitoring, the quality of remote sensing data directly determines the reliability of the subsequent analysis. Among these factors, the spatial resolution, revisit period, and spectral characteristics of remote sensing data jointly constrain the maximum accuracy of fishing vessel detection. In addition, the spatiotemporal coverage of the data also affects the reliability and comprehensiveness of fishing vessel monitoring. Due to significant differences in vessel scale, material, and activity patterns, treating fishing vessels as remote sensing targets necessitates tailored research that considers their inherent features. Therefore, systematically evaluating the observational effectiveness of multi-source remote sensing platforms and collecting remote sensing data applicable to fishing vessel detection are beneficial for improving the monitoring system and providing a data foundation for vessel supervision. Existing review studies on remote sensing of ships generally treat fishing vessels as a subcategory, while review studies that focus specifically on fishing vessels remain limited. This indicates a need for a more comprehensive review dedicated to fishing vessel remote sensing.
This paper aims to systematically review the remote sensing data currently available in the field of fishing vessel detection. Specifically, it focuses on reviewing different types of remote sensing data sources related to fishing vessels and conducts a comparative analysis of different data modalities from various dimensions. Finally, it summarizes existing remote sensing datasets for fishing vessels to provide scholars with a reference for acquiring vessel data. On this basis, the paper summarizes the main challenges faced in this field and looks forward to future development directions, aiming to provide researchers with a reference for selecting and acquiring remote sensing data for fishing vessels.
2. Methodology
This systematic review was conducted in accordance with the Preferred Reporting Items for Systematic Reviews and Meta-Analyses (PRISMA 2020) statement to ensure a transparent, reproducible, and rigorous process [13]. A protocol for this systematic review was not prospectively registered. The core purpose of this methodology design is to systematically retrieve, screen, evaluate, and synthesize academic literature and public datasets on satellite remote sensing technology for fishing vessel identification and monitoring. Figure 1 illustrates the overall methodology and screening process of this study.
Figure 1.
PRISMA 2020 flow diagram for the systematic review process. Adapted from PRISMA 2020 [13]. * Records identified from each database; ** Records excluded by automated scripts.
2.1. Literature Search and Information Sources
To identify relevant academic literature and publicly available datasets on satellite remote sensing for fishing vessel identification and monitoring, a comprehensive search was performed across multiple academic databases.
The primary literature search was conducted in three mainstream academic databases: Web of Science (WoS) Core Collection and IEEE Xplore for English literature, and China National Knowledge Infrastructure (CNKI) for Chinese literature. The literature search was restricted to peer-reviewed journal articles, review papers, and conference proceedings published in either English or Chinese. The literature search covered publications from 1 January 2015 to 31 December 2025.
To ensure comprehensive coverage, the search followed a dual-track strategy: Track A targeted methodological and application studies on fishing and dark vessel detection (Table 1), while Track B focused on general maritime vessel datasets and benchmarks (Table 2) to avoid omitting broader ship datasets containing fishing vessel categories. Commercial satellite systems were not included as a major focus of this review because their data accessibility and technical documentation are generally limited.
Table 1.
Web of Science Search Strategy for Track A: Fishing Vessel Remote Sensing Detection.
Table 2.
Web of Science Search Strategy for Track B: Maritime Vessel Remote Sensing Dataset.
2.2. Eligibility Criteria and Selection Process
To ensure a highly focused and objective evaluation of the remote sensing modalities and datasets, explicit inclusion and exclusion criteria were established prior to the screening process.
The inclusion criteria required that studies and datasets meet the following requirements: (1) Focus primarily on the application of satellite remote sensing modalities—specifically SAR, optical imagery, or NTL—for the detection, identification, or monitoring of fishing vessels. (2) Evaluate, benchmark, or release public datasets that explicitly contain or specialize in fishing vessel targets.
Conversely, to address the distinct focus of the two search tracks, specific exclusion criteria were applied as follows: For Track A, studies were excluded if they: (1) did not incorporate or integrate satellite remote sensing data (e.g., relying exclusively on cooperative tracking systems like AIS or VMS without satellite imagery validation), or (2) did not target fishing vessel detection, identification, or monitoring as their primary research objective. For Track B, studies were excluded if they: (3) did not introduce, release, or evaluate a specific dataset or benchmark, or (4) did not involve or explicitly distinguish fishing vessel targets within the dataset (e.g., labeling all targets under a broad “ship” category without providing a distinct fishing vessel subcategory or label).
The literature selection was executed systematically according to the standard workflow illustrated in the PRISMA flow diagram (Figure 1). Following duplicate removal, two reviewers (T.H. and T.C.) independently screened the titles, abstracts, and subsequent full texts of the retrieved records, with any discrepancies resolved via arbitration with a third reviewer (W.Z.).
2.3. Data Extraction
To ensure systematic and standardized data collection, a structured data extraction form was pre-designed. Two reviewers (T.H. and T.C.) independently extracted the relevant data from the selected literature and datasets, with any discrepancies resolved through consensus or consultation with a third reviewer (W.Z.).
To enable a systematic comparative analysis across different remote sensing modalities (SAR, optical, and NTL), this review evaluates several key dimensions. First, we examine the technical specifications of satellite data sources, including sensor types, spectral bands, spatial resolution, swath width, and revisit period. Second, regarding environmental adaptability, we assess the operational robustness of each modality under complex meteorological and sea-state conditions, along with their viability for nighttime monitoring. Furthermore, considering the physical attributes inherent to fishing vessels (such as non-metallic hull compositions and relatively small geometric dimensions), we evaluate the detection sensitivity of the three modalities in capturing subtle target signatures.
Regarding the compilation and review of publicly available datasets, the extracted variables focus primarily on core dataset metadata, encompassing dataset names, data sources, sensor types, dataset scale, total number of target instances, and label granularity. Moreover, to ensure systematic coverage and a rigorous literature synthesis, this study compiles not only fishing-vessel-specific datasets but also widely used maritime benchmark datasets across SAR, optical, and NTL domains.
2.4. Qualitative Evaluation Framework for Remote Sensing Modalities
Due to the high heterogeneity of the algorithms, performance metrics, sensor configurations, and evaluation environments across the selected studies, a quantitative meta-analysis was not feasible. Instead, this review adopts a literature-based qualitative synthesis to compare the relative capabilities of SAR, optical, and NTL remote sensing for fishing vessel identification and monitoring.
To facilitate a systematic comparison of different satellite remote sensing modalities for fishing vessel identification and monitoring, this review adopts six representative capability dimensions as a unified evaluation framework. These dimensions include (1) detection sensitivity: the ability to distinguish small fishing vessel signatures from the surrounding ocean background, (2) environmental robustness: the ability to maintain stable observation performance under adverse weather (e.g., clouds, rain) and rough sea conditions, (3) day–night capability: the ability to operate independently of solar illumination, enabling continuous day-and-night vessel monitoring, (4) spatial detail: the degree to which the sensor’s spatial resolution preserves fine-grained physical features, such as vessel shapes and wakes, for accurate identification, (5) coverage efficiency: the sensor’s swath width, which determines its suitability for large-scale regional monitoring, and (6) temporal continuity: the sensor’s revisit ability, which determines the frequency and temporal stability of fishing vessel observations.
The selected dimensions are not intended as independent quantitative performance metrics, but rather as qualitative criteria for synthesizing the relative strengths and limitations of different sensing modalities reported in the literature. Based on this framework, the comparative analyses presented in Section 4 systematically evaluate the applicability of synthetic aperture radar (SAR), optical remote sensing, and nighttime light (NTL) remote sensing for fishing vessel monitoring from multiple complementary perspectives.
This was accompanied by a systematic tabular synthesis of widely used public datasets, which summarizes their data types, dataset sizes, spatial resolutions, and fishing vessel categories, thereby identifying future research directions.
3. Different Remote Sensing Data Sources
Different types of remote sensing platforms vary significantly in spatial resolution, temporal resolution, illumination dependency, robustness to interference, and application scenarios. Their imaging mechanisms and characteristics directly determine the selection and performance of subsequent detection methods. In other words, remote sensing modalities serve as the starting point for research on detection algorithms, playing an important role in the accuracy and stability of the monitoring system.
Based on imaging principles and observation capabilities, the data commonly used in current fishing vessel detection using remote sensing are mainly divided into three major categories: (1) Synthetic Aperture Radar (SAR) imagery, which has all-weather and day-and-night active imaging capabilities; (2) Optical remote sensing imagery, which features high spatial resolution and rich details, making it suitable for fine-grained identification; and (3) Nighttime Light (NTL) remote sensing, which can utilize the lighting characteristics of fishing vessels for nighttime monitoring. To lay the groundwork for subsequent cross-modality comparisons on fishing vessels, the following sections will review the mainstream satellite missions and their technical specifications for each data source.
3.1. Synthetic Aperture Radar Imagery Data Sources
Synthetic Aperture Radar (SAR) is an active remote sensing system. Its imaging principle involves the platform emitting microwaves to the Earth’s surface and receiving the scattered echoes to generate images [14]. SAR data are typically acquired via satellites. In the field of marine remote sensing, SAR satellites operating in the C-band (wavelength: 3.75–7.5 cm) and X-band (wavelength: 2.5–3.75 cm) are well-suited and extensively adopted [15]. Therefore, this paper focuses on representative SAR satellites from these two bands for comparative analysis. These satellites include, but are not limited to, Sentinel-1, Gaofen-3, and TerraSAR-X.
Sentinel-1 is a common source of SAR imagery. It consists of radar observation satellites under the Copernicus Programme of the European Space Agency (ESA). The Sentinel-1 mission operates as a two-satellite C-band SAR constellation, recently updated to comprise the Sentinel-1C and Sentinel-1D units. Operating in tandem, the constellation significantly reduces observation gaps, achieving a combined 6-day revisit cycle. To accommodate diverse observational needs, the system features four operational imaging modes, offering spatial resolutions down to 5 m and a maximum swath width of up to 400 km. Furthermore, the mission provides dual-polarization capabilities alongside continuous, all-weather, day-and-night imaging, serving as a highly robust platform for global Earth observation. Sentinel-1 operates in both single-polarization (HH, VV) and dual-polarization (HH + HV, VV + VH) modes [16,17]. The data can be accessed for free through the data portals of ESA and the National Aeronautics and Space Administration (NASA) [18].
Gaofen-3 (GF-3) is China’s first civilian C-band SAR satellite. It features multiple imaging modes, high resolution, and wide imaging swaths, with a revisit period of 29 days [19]. GF-3 is equipped with a C-band SAR and supports various working modes, including Stripmap, ScanSAR, and Spotlight modes, enabling observations from medium to high resolutions. The spatial resolution of GF-3 SAR data ranges from 1 m to 500 m, and the observation swath ranges from 10 to 650 km, taking into account local details and large-scale coverage. It also supports single polarization (HH, VV), dual polarization (HH + HV, VV + VH), and full polarization (HH + HV + VH + VV) observations, which can extract more target feature information and enhance the capability for land cover classification and target recognition [20,21].
Furthermore, TerraSAR-X satellite data can be used to detect the features of small boats, conducting fishing vessel detection in High Resolution Spotlight mode [14,19]. TerraSAR-X is an advanced X-band SAR mission operating with an exact 11-day repeat cycle. The satellite operates in six distinct imaging modes for a wide range of applications in Earth observation: ranging from the Staring Spotlight mode with a resolution down to 25 cm at a scene size of about 4 km × 3.7 km (mainly for image intelligence applications), to the Wide ScanSAR mode, which provides a resolution of 40 m at a scene size of 270 km × 200 km (extendible to a scene length of 1500 km) particularly suitable for maritime applications. Additionally, the system supports versatile polarimetric capabilities, offering single or dual polarization and even full polarimetric acquisitions enabled by its Dual Receive Antenna architecture.
3.2. Optical Remote Sensing Imagery Data Sources
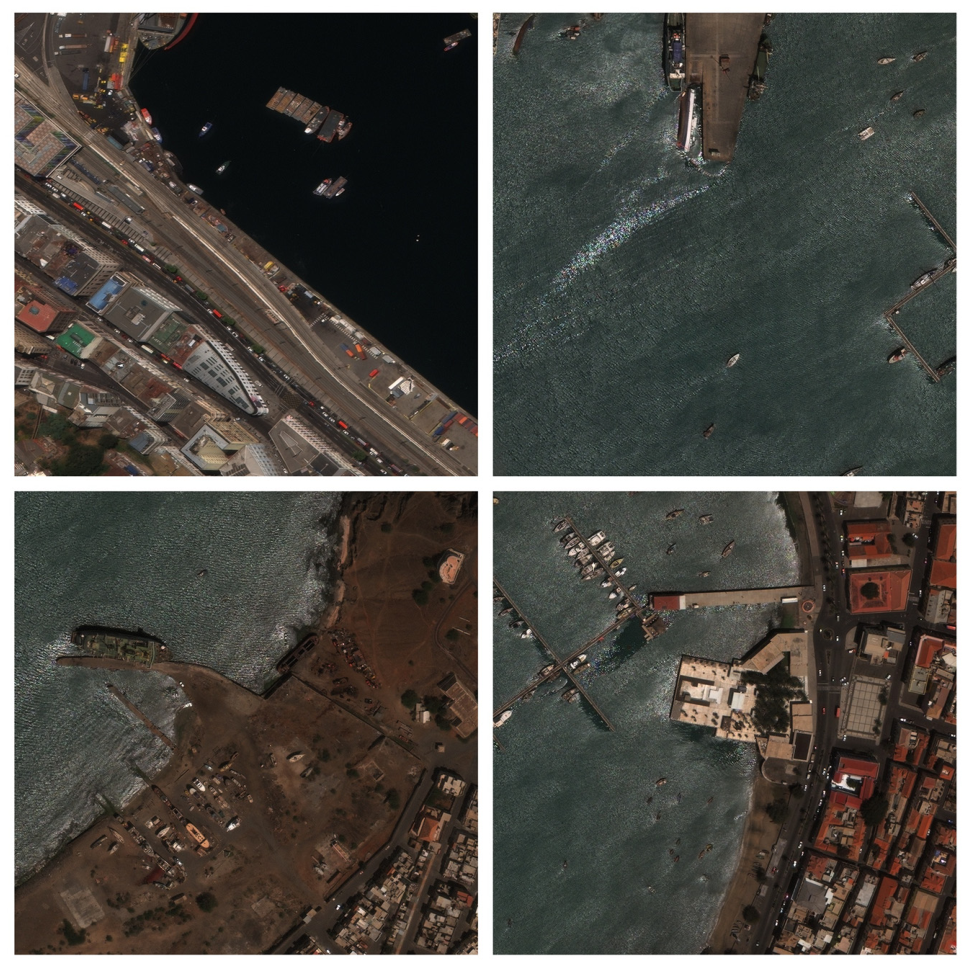
Optical remote sensing imagery is a typical type of passive remote sensing data. It typically uses satellite-borne optical sensors to receive the reflection and scattering information of surface objects under natural light radiation, which is then processed to generate images with rich spectral and spatial details [22]. Its advantage lies in its relative ease of acquisition, enabling automated image collection and automated fishing vessel detection. Moreover, detection methods based on RGB images are simple to operate and have strong real-time performance [23]. Compared with other remote sensing data, optical remote sensing imagery can reveal more details of fishing vessel targets, as shown in Figure 2, making it the primary reference data source for fishing vessel detection. There are numerous existing optical remote sensing satellites, such as China’s Gaofen series, the United States’ Landsat series, and Europe’s Sentinel-2 satellites.
Among the Gaofen series satellites, Gaofen-1 (GF-1), Gaofen-2 (GF-2), and Gaofen-6 (GF-6) are high-spatial-resolution multispectral satellites equipped with panchromatic and multispectral cameras [24]. GF-1 operates with one panchromatic and four multispectral bands. It provides spatial resolutions of 2 m (panchromatic) and 8 m (multispectral) with a 60 km swath width. Additionally, it features a 16 m wide-field multispectral sensor with an 800 km swath width. Its revisit cycle is 4 days. GF-2 operates with one panchromatic and four multispectral bands. It delivers sub-meter spatial resolutions of 0.8 m for the panchromatic band and 3.2 m for the multispectral bands. The combined swath width is 45 km, and its revisit cycle is 5 days. GF-6 features one panchromatic and four standard multispectral bands. Notably, its wide-field sensor adds two red-edge bands, a purple band, and a yellow band. It offers 2 m panchromatic and 8 m multispectral resolutions (90 km swath), alongside a 16 m wide-field resolution (800 km swath) [25]. The revisit cycle is 4 days. They can acquire a large amount of spatial and spectral information in both spatial and spectral dimensions, providing a multi-dimensional, high-quality data source for scientific research.
Figure 2.
Examples of the optical satellite remote sensing images of fishing vessels from the ShipRSImageNet dataset. Reproduced from Zhang et al. [26].
The Landsat series represents the longest-running and most continuous global land observation satellite program in human history [27]. Landsat 8 and Landsat 9 are introduced here as representative examples. Both satellites carry the Operational Land Imager (OLI) and Thermal Infrared Sensor (TIRS), providing 11 spectral bands that include coastal/aerosol, visible, near-infrared, shortwave-infrared, panchromatic, and thermal infrared wavelengths. The spatial resolution is 30 m for the multispectral bands, 15 m for the panchromatic band, and 100 m for the thermal bands. Each satellite has a swath width of 185 km and an individual revisit cycle of 16 days. Through their coordinated orbits, the combined revisit time is 8 days, supporting stable environmental and coastal monitoring.
Sentinel-2 is a high-resolution optical Earth observation mission specifically developed by the European Space Agency (ESA) for the GMES (now Copernicus) program [28]. The core advantage of this satellite lies in its MultiSpectral Instrument (MSI), which provides 13 spectral bands with spatial resolutions ranging from 10 m to 60 m. With an ultra-wide observation swath of 290 km and a high-frequency revisit period of only 5 days under a twin-satellite constellation, it significantly surpasses and complements the traditional Landsat and SPOT series satellites in terms of capabilities. Sentinel-2’s Multispectral Instrument (MSI) has been widely utilized for rapid and direct ship recognition [29]. To address downlink bandwidth limitations, recent advancements also explore the feasibility of deep-learning-based onboard edge processing directly on Sentinel-2 raw data [30].
3.3. Nighttime Light Remote Sensing Imagery Data Sources
Nighttime Light (NTL) remote sensing uses sensors to capture visible or near-infrared light radiation emitted from the Earth’s surface at night to generate images. These light sources are primarily artificial. NTL remote sensing data mainly come from satellite systems equipped with low-light sensors [31,32]. These primarily include DMSP-OLS, JPSS, Luojia-1, and SDGSAT-1.
Among them, the Defense Meteorological Satellite Program—Operational Linescan System (DMSP-OLS) is the earliest satellite sensor system used for nighttime observation. It provided data from 1992 to 2013, which was once used to obtain positioning information about fishing vessels. However, the spatial resolution of DMSP-OLS is relatively coarse, offering a fine mode of 0.56 km and a smoothed mode of 2.7 km. This severe lack of detail limits its further application [33,34,35].
The Joint Polar Satellite System (JPSS), operated by the U.S. National Oceanic and Atmospheric Administration (NOAA), is the nation’s advanced series of polar-orbiting environmental satellites [36]. JPSS includes five polar-orbiting satellites with four or more instruments and a versatile ground system. The satellites currently in orbit are Suomi-NPP, NOAA-20 (JPSS-1), and NOAA-21 (JPSS-2). They are equipped with the Visible Infrared Imaging Radiometer Suite (VIIRS). Notably, the VIIRS instrument features a specialized Day/Night Band (DNB) that is uniquely capable of conducting highly sensitive nighttime remote sensing [37,38]. The DNB operates across a wavelength range of 0.5 to 0.9 µm to detect extremely low-light emissions. A major engineering advantage of the DNB is its ability to maintain a constant spatial resolution of 750 m across the entire image, from nadir to the edge of the scan. Furthermore, VIIRS features a massive swath width of 3040 km, ensuring that each satellite achieves complete global coverage at least twice daily. The VBD dataset is a vessel detection product developed based on VIIRS data (Details are provided in Section 5.3). An example is shown in Figure 3.
Figure 3.
Examples of the NTL remote sensing images from the VBD dataset. Reproduced from Elvidge et al. [39].
The Luojia-1 satellite is China’s first dedicated satellite focusing on NTL remote sensing. It aims to provide high-spatial-resolution nighttime light data. The CMOS sensor equipped on Luojia-1 increases the spatial resolution of its NTL images to 130 m [32]. It has a 250 km-wide luminous imaging capability and a revisit period of 15 days. Additionally, its higher dynamic range (15 bits) makes it more sensitive in capturing faint light sources, enabling it to provide higher-quality NTL images [40]. Research by Zhou Weifeng et al. shows that the information entropy, clarity, and noise performance of the LJ1-01 image are higher than those of the DMSP/OLS and VIIRS/DNB images [41].
The Sustainable Development Science Satellite 1 (SDGSAT-1) is the world’s first scientific satellite dedicated to supporting the United Nations Sustainable Development Goals (SDGs) [42]. It carries three payloads, including a Glimmer Imager (GLI), a Multispectral Imager (MSI), and a Thermal Infrared Spectrometer (TIS), enabling coordinated daytime and nighttime Earth observation. The GLI is a nighttime optical sensor designed for low-light imaging. It acquires one panchromatic band with a spatial resolution of 10 m and three RGB bands with a spatial resolution of 40 m, providing a swath width of approximately 300 km and a revisit period of about 11 days. Compared with Luojia-1 (130 m spatial resolution) and the VIIRS Day/Night Band (750 m spatial resolution), the GLI provides substantially finer spatial resolution while maintaining wide-area observation capability. These characteristics facilitate the observation of small targets and complex nighttime scenes, providing valuable data for fine-scale nighttime fishing vessel detection [43].
In addition to the public satellite missions described in the previous sections, the rapid development of commercial constellations has significantly expanded the data options for maritime monitoring across the SAR and optical domains. Representative systems such as ICEYE and Capella Space in the SAR domain provide sub-meter spatial resolution and hourly revisit frequencies. Similarly, in the optical domain, the PlanetScope constellation achieves daily global coverage through a vast network of CubeSats. The primary advantages of these commercial systems include their high temporal continuity and enhanced spatial detail, which are critical for tracking non-cooperative vessels [4]. However, their practical application for large-scale research is currently constrained by data procurement costs and narrower swath widths compared to public missions such as Sentinel-1 and Sentinel-2. Consequently, these commercial constellations represent a high-performance complement to the public datasets analyzed in this study.
4. Comparative Analysis of Different Remote Sensing Data Modalities
Due to differences in imaging mechanisms, spectral characteristics, and observation geometries among various sensors, a single data source is often insufficient to maintain optimal performance across all monitoring scenarios [44]. To objectively evaluate the suitability of various remote sensing data modalities for fishing vessel detection, this section conducts an in-depth comparison from three core dimensions. First, it analyzes the detection sensitivity of different imaging mechanisms to fishing vessel targets and their features. Second, it explores the robustness of different data modalities under complex weather conditions and dynamic sea states. Third, it evaluates the performance indicators of different data modalities in large-scale normal monitoring. Finally, we comprehensively compare different data modalities and explore the feasibility of multi-source data fusion. Through this multi-dimensional systematic comparison, this section aims to provide a theoretical basis for optimal data source selection and multi-source data fusion strategies under specific monitoring requirements.
4.1. Detection Sensitivity to Fishing Vessel Targets
Because fishing vessels differ significantly from large commercial ships in size, materials, and distribution characteristics, different types of remote sensing devices exhibit obvious heterogeneity in target detection sensitivity. Starting from the physical properties of imaging, this section deeply analyzes the detection sensitivity and mechanistic limitations of each data modality for fishing vessel targets. It compares the specific performance of SAR, optical remote sensing imagery, and NTL in fishing vessel detection.
Target size is one of the primary factors affecting fishing vessel detection. Compared with large commercial ships, fishing vessels usually occupy only a limited number of pixels in satellite imagery, making them typical small-object targets [45]. High-resolution optical imagery generally provides high detection sensitivity because it preserves vessel contours, shapes, and wake information, enabling accurate discrimination between fishing vessels and the surrounding sea surface [46]. With the development of deep learning-based detection methods, convolutional neural networks have gradually improved the ability to extract weak and complex ship features from SAR images. For example, BiFA-YOLO introduced bidirectional feature aggregation and oriented bounding box prediction to improve ship detection performance in high-resolution SAR imagery, demonstrating the potential of deep learning approaches for complex maritime target recognition [47]. However, detection performance decreases rapidly as spatial resolution declines or when vessels are densely clustered, resulting in missed detections and false alarms. In SAR imagery, small fishing vessels often occupy only a few radar resolution cells, making their scattering signatures difficult to distinguish from surrounding sea clutter, particularly under rough sea conditions. Polarimetric SAR information has been demonstrated to improve small target discrimination by exploiting differences in scattering characteristics between vessels and sea clutter [45,48]. The limitation is even more evident in NTL imagery, where multiple illuminated vessels may be represented by a single pixel due to its relatively coarse spatial resolution, making individual vessel identification difficult.
Detection capability is further influenced by the interaction between the sensing mechanism and vessel characteristics. SAR identifies vessels through microwave backscattering, and its performance strongly depends on the radar cross section (RCS) of the target [49,50]. Metallic vessels generally produce strong scattering responses and can be readily detected, whereas traditional wooden or fiberglass fishing vessels usually exhibit much weaker backscatter because of their lower dielectric constants and less pronounced corner-reflector structures [51]. In contrast, optical imagery relies primarily on the visual appearance of vessels and is therefore much less sensitive to hull material, provided that illumination and atmospheric conditions are favorable [52]. NTL imagery differs fundamentally from both SAR and optical remote sensing by detecting artificial light emissions rather than the vessels themselves [53,54]. Consequently, its detection performance mainly depends on the intensity and distribution of fish-attracting lights instead of the physical properties of the vessel hull.
Thermal infrared (TIR) sensing is frequently integrated as a supplementary channel on multispectral platforms such as Landsat or NTL-capable platforms such as VIIRS. This technology provides a distinctive physical dimension for vessel identification by capturing thermal anomalies. The detection mechanism relies on the temperature contrast between high-temperature propulsion systems or metallic structures and the cooler maritime background. This capability is particularly valuable for identifying “dark vessels” that evade NTL detection by switching off artificial lights [55]. Nevertheless, the practical applicability of satellite-based TIR is often constrained by its coarse spatial resolution. Consequently, its sensitivity for resolving individual small-scale fishing boats is limited compared to SAR or high-resolution optical imagery.
Fishing operations are frequently conducted during nighttime, making illumination conditions another important factor affecting detection capability. Optical remote sensing becomes ineffective after sunset because passive optical sensors depend on reflected solar radiation [56]. In contrast, SAR maintains stable detection performance regardless of illumination conditions owing to its active microwave imaging mechanism [57]. NTL provides an alternative observation approach by directly detecting high-intensity fishing lights, enabling efficient monitoring of nighttime fishing activities over large ocean areas [58]. However, because the detected signal corresponds to emitted light rather than the vessel itself, blooming effects and stray-light contamination may merge adjacent vessels into a single light source or generate false detections, limiting the accuracy of individual vessel localization and counting [59].
Polarization configuration also influences the sensitivity of SAR-based fishing vessel detection by affecting the scattering contrast between vessels and the surrounding sea surface [60,61]. Co-polarization channels (HH and VV) generally provide strong vessel backscatter, while cross-polarization channels (HV and VH) can suppress sea clutter under certain conditions and improve the detection of weak targets [62]. Consequently, dual-polarization observations (e.g., VV + VH or HH + HV) often provide more complementary scattering information than single-polarization data, leading to improved detection performance. Fully polarimetric SAR can further exploit scattering characteristics to distinguish vessels from the ocean background, particularly for small fishing vessels with relatively weak radar cross sections (RCS) [63,64].
The choice of SAR frequency band dictates both target sensitivity and clutter interference levels. X-band sensors utilize short wavelengths that excel in resolving small-scale vessel features and geometric details. C-band sensors represent the current operational standard by providing an optimal balance between spatial resolution and swath coverage for maritime surveillance. While L-band sensors are less affected by sea surface roughness, their longer wavelengths often result in diminished backscattering from the small-scale targets typical of fishing fleets [65]. Consequently, X and C bands remain the most effective choices for monitoring the diverse and often small-sized vessels characteristic of global fisheries.
4.2. Robustness Under Complex Environmental and Weather Conditions
Driven by the need for dynamic monitoring across all sea areas and weather conditions, the stable acquisition of remote sensing data is highly constrained by atmospheric states and marine environmental parameters. Fishing operations are often accompanied by complex weather changes. This requires detection methods to have strong resistance to environmental interference, known as robustness. This section systematically evaluates the observation stability of different data modalities under different weather conditions and sea states, analyzing the impact of environmental factors on fishing vessel detection.
Weather conditions are very important factors influencing remote sensing observations. Among the three modalities, SAR generally provides the highest environmental robustness because microwave signals are largely independent of solar illumination and can penetrate clouds, light rain, and moderate fog [66]. This capability allows SAR to maintain relatively stable observations under conditions where optical sensors may experience a significant reduction in image quality. In contrast, optical remote sensing relies on reflected sunlight and is therefore highly sensitive to cloud cover, precipitation, and atmospheric scattering [56]. These factors reduce image clarity and visibility, making fishing vessels difficult to distinguish from the surrounding ocean surface. NTL imagery is also affected by cloud cover because visible light emitted from fishing vessels cannot penetrate dense clouds [67,68]. As a result, cloud contamination may weaken or completely obscure nighttime light signals, leading to incomplete observations of fishing activities.
Observation capability also differs significantly between daytime and nighttime conditions. Optical imagery generally performs well during daytime because abundant sunlight provides clear information on vessel shape and surrounding environments. However, its detection capability decreases rapidly after sunset, limiting its use for continuous monitoring [69]. In comparison, SAR maintains nearly the same observation capability during both daytime and nighttime because its active microwave imaging does not depend on natural illumination [70]. NTL imagery is specifically designed for nighttime observations and is particularly effective in detecting illuminated fishing vessels using fish-attracting lights [71,72]. Nevertheless, its performance may be influenced by natural light sources such as moonlight, which can increase background brightness and reduce the contrast between vessel lights and the surrounding environment. Consequently, NTL is most suitable for monitoring nighttime fishing activities but cannot provide continuous observations throughout the entire day.
Sea conditions further influence the robustness of different remote sensing modalities. Wind, waves, and sea clutter can all interfere with vessel detection by reducing the contrast between fishing vessels and the surrounding ocean. In SAR imagery, rough sea surfaces increase microwave backscatter from the ocean, making weak vessel targets more difficult to separate from background clutter, particularly for small fishing vessels [73,74]. Optical imagery is also influenced by rough sea conditions because wave reflections, sea spray, and surface glint may reduce image quality and partially obscure vessel boundaries. Although NTL imagery is less directly affected by sea surface roughness, strong waves and unstable atmospheric conditions may scatter or diffuse emitted light, reducing the stability of nighttime observations [75,76]. Therefore, all three modalities experience some degree of performance degradation under severe sea conditions, although the underlying causes differ.
4.3. Observation Capability of Remote Sensing Systems
The observation capability of remote sensing systems is mainly determined by spatial resolution, swath width, revisit capability, and the information provided by different sensing modalities. As discussed in Section 3, public SAR, optical, and nighttime light (NTL) satellite systems were developed with different observation objectives, resulting in complementary capabilities for fishing vessel monitoring. The key technical specifications (spatial resolution, swath width, revisit period, and sensor) of the satellite systems mentioned above are summarized in Table 3 for reference.
Table 3.
Comparison of representative satellite-based remote sensing data sources.
Spatial resolution and swath width jointly determine the balance between observation detail and spatial coverage. Public optical satellites generally provide spatial resolutions ranging from sub-meter to tens of meters. For example, the Gaofen series achieves panchromatic resolutions of 0.8–2 m and multispectral resolutions of 3.2–8 m, while Sentinel-2 and Landsat provide multispectral observations at 10–60 m and 30 m, respectively [77]. These resolutions preserve vessel geometry and surrounding environmental information, making optical imagery suitable for vessel detection and identification. However, higher spatial resolution is usually accompanied by reduced coverage. Sentinel-2 provides a swath width of approximately 290 km, whereas the wide-field sensor of GF-1 reaches 800 km, enabling efficient regional-scale observation [78]. A similar trade-off exists in SAR systems. Sentinel-1 routinely provides 5–20 m imagery with a swath width of up to 400 km, while GF-3 supports multiple imaging modes with resolutions ranging from 1 m to 500 m and swath widths from 10 km to 650 km. TerraSAR-X further improves the spatial resolution to 0.25 m in Staring Spotlight mode but at the expense of substantially reduced coverage. In contrast, NTL sensors emphasize wide-area observation. VIIRS provides a swath width of approximately 3040 km, enabling global observations at least twice per day, whereas Luojia-1 and SDGSAT-1 improve the spatial resolution to 130 m and up to 10 m (40 m multispectral), respectively. These advances have extended NTL applications from large-scale fishing activity statistics to finer observations of fishing vessel distributions.
Revisit capability determines the temporal continuity of fishing vessel observations. Public optical and SAR satellites generally revisit the same location every several days to weeks, including 5 days for Sentinel-2, 6 days for Sentinel-1, 8 days for the combined Landsat 8/9 constellation, and 29-day and 11-day repeat cycles for GF-3 and TerraSAR-X, respectively. Among NTL missions, Luojia-1 and SDGSAT-1 revisit approximately every 15 and 11 days, respectively, whereas VIIRS provides much higher temporal continuity through at least two global observations per day. These differences reflect the inherent trade-off between spatial and temporal resolution in public remote sensing systems: optical and SAR satellites are more suitable for periodic observations requiring higher spatial detail, whereas VIIRS is better suited for continuous monitoring of large-scale nighttime fishing activities.
Beyond spatial and temporal characteristics, different sensing modalities provide complementary information because of their distinct imaging mechanisms. Optical imagery provides rich spectral information for vessel identification and environmental interpretation. For example, Sentinel-2 offers 13 spectral bands, GF-6 includes additional red-edge, purple, and yellow bands that enhance coastal observations, and Landsat provides 11 spectral bands, including thermal infrared observations that support environmental analysis. In contrast, SAR imagery records microwave backscatter under all-weather and day-and-night conditions while supporting multiple polarization modes that provide scattering information unavailable from optical sensors [79]. NTL imagery captures artificial lighting emitted during nighttime fishing operations and directly reflects the spatial distribution and intensity of fishing activities. Therefore, the three sensing modalities provide complementary information from different physical perspectives.
4.4. Comprehensive Comparison and Multi-Source Data Fusion
The radar chart in Figure 4 summarizes the qualitative comparison of the three remote sensing modalities according to the six evaluation dimensions defined in Section 2.4. Rather than identifying a universally superior sensing modality, the comparison highlights the complementary characteristics of SAR, optical imagery, and nighttime light (NTL) remote sensing. SAR demonstrates outstanding environmental robustness and day-and-night observation capability but provides relatively limited visual details. Optical imagery achieves the highest spatial detail and target recognition capability under favorable illumination conditions but is highly susceptible to clouds and weather. NTL imagery excels in large-scale nighttime monitoring by directly capturing fishing lights, although its coarse spatial resolution limits precise vessel localization [66]. These complementary strengths and weaknesses indicate that future fishing vessel monitoring should increasingly rely on multi-source data fusion rather than individual sensing modalities.
Figure 4.
Qualitative comparison of satellite remote sensing modalities for fishing vessel monitoring. Note: The radar-chart ratings represent qualitative relative capability on a five-point ordinal scale (1 = limited; 5 = excellent) and should not be interpreted as quantitative performance measurements. The ratings were derived through an evidence-based qualitative assessment by the authors, based on a synthesis of findings reported in the reviewed literature and publicly documented sensor and mission characteristics. Detection sensitivity and environmental robustness were evaluated primarily from physical imaging mechanisms and reported vessel-observation characteristics, while spatial detail, coverage efficiency, and temporal continuity were assessed mainly from sensor specifications and mission-level observation characteristics. The ratings therefore reflect relative modality-level capabilities and necessarily involve a degree of subjectivity and author judgment.
Multi-source fusion can be performed at different levels depending on the application requirements. At the image level, pixel-level fusion combines co-registered observations from different sensors into a unified representation, while feature-level fusion extracts modality-specific features and integrates them through deep neural networks or attention-based architectures to exploit complementary information [80]. Decision-level fusion combines the outputs of independent detectors using confidence weighting or ensemble strategies, making it suitable when heterogeneous observations cannot be perfectly aligned [81]. Beyond satellite imagery itself, trajectory-level fusion associates image-derived vessel detections with cooperative tracking systems such as AIS and VMS, enabling vessel identification, behavior analysis, and anomaly detection [79]. Existing studies have demonstrated that combining SAR, optical imagery, NTL, and cooperative tracking data can significantly improve the continuity and reliability of maritime surveillance, particularly for monitoring illegal fishing activities and identifying dark vessels.
The fusion of SAR and optical imagery is particularly compelling: SAR provides cloud-penetrating, all-weather capability, while optical imagery captures rich spatial details that SAR lacks due to clutter [82]. This complementary approach has been successfully deployed using Sentinel-1 (SAR) and Sentinel-2 (optical) to monitor illegal fishing in cloud-prone tropical waters [83]. Furthermore, combining daytime optical imagery with nighttime light (NTL) data enables continuous, full-time fishing vessel monitoring across day-night cycles [84,85].
Cooperative tracking systems, including AIS and VMS, provide cooperative tracking data that can assist in the validation of satellite-based remote sensing detections. Early studies have demonstrated that integrating spaceborne SAR observations with AIS information can improve ship surveillance capability by combining independent remote sensing observations with cooperative tracking data [86]. Physical vessel locations extracted from SAR or optical imagery are subjected to spatiotemporal cross-matching with AIS or VMS trajectories [87]. Galdelli et al. integrated SAR and AIS data to build a near real-time monitoring and violation identification system, achieving excellent results [88]. To systematically expose vessels that deliberately disable tracking systems, spaceborne Vessel Detection Systems (VDS) must be integrated with cooperative databases such as AIS, VMS, or regional systems like V-Pass [89,90]. However, matching coarse-resolution SAR detections with sparse or manipulated AIS data presents significant spatiotemporal correlation challenges, requiring optimized matching algorithms [91] and route prediction techniques to identify anomalous behaviors [92].
Despite these advantages, practical implementation of multi-source fusion remains challenging. Accurate registration between SAR and optical imagery is difficult because of their different imaging mechanisms and observation geometries [93]. Temporal mismatches among satellite acquisitions further complicate the association of highly dynamic fishing vessels. In addition, AIS and VMS records are often incomplete because of transmission gaps, intentional shutdowns, or spoofing, limiting their effectiveness for trajectory matching and dark vessel identification [94]. Data quality also remains an important issue, as many existing datasets rely on AIS-assisted automatic annotation and therefore inevitably contain label noise [95].
Future research should therefore focus on more robust multimodal fusion frameworks that can effectively address heterogeneous data alignment, incomplete cooperative observations, and uncertainty propagation throughout the processing pipeline. Meanwhile, improving the generalization of detection models across different sensors, geographic regions, and environmental conditions remains essential because of the substantial domain shifts among existing datasets. With the rapid development of multimodal deep learning and foundation models, unified frameworks capable of jointly exploiting SAR, optical, NTL, and trajectory information are expected to provide more accurate, continuous, and intelligent support for sustainable fisheries management and the detection of illegal fishing activities. Meanwhile, end-to-end oriented object detection frameworks provide a promising direction for reducing the dependence on manually designed post-processing procedures in remote sensing target detection [96].
5. Existing Remote Sensing Datasets for Fishing Vessels
5.1. Synthetic Aperture Radar Fishing Vessel Datasets
Currently, commonly used SAR fishing vessel datasets include xView3-SAR, SARFish, OpenSARShip, FishingVesselSAR, among others.
The xView3-SAR dataset is a large-scale SAR dataset for vessel detection [97]. It contains nearly 1000 analysis-ready SAR images from the Sentinel-1 mission. The average size of a single image is about 29,400 × 24,400 pixels, with a spatial resolution of about 20 m and a pixel spacing of 10 m. Each image is accompanied by manual and automatic annotations of vessels and maritime infrastructure. This dataset provides dual-polarization (VV + VH) image data, supplemented by ancillary environmental information such as bathymetry and wind speed rasters. Its labeling system combines automatic algorithms with manual analysis results, providing detailed annotations for vessel detection, classification (e.g., vessel vs. fixed infrastructure, fishing vs. non-fishing), and length estimation. The FAD-SAR system presents one of the first large-scale benchmarks on xView3, evaluating six classic object detection algorithms (including SSD and Faster R-CNN) for fishing activity classification and dark vessel detection. Its systematic approach offers significant academic value [98].
The SARFish dataset is a companion to xView3-SAR, offering finer-resolution Single-Look Complex (SLC) imagery. It was released by the Defence Science and Technology Group (DSTG) of Australia, aiming to assist in identifying IUU fishing activities through deep learning technologies. Built upon Sentinel-1 satellite imagery, this dataset contains 753 pairs of full-size, dual-polarized (VV + VH) scene images. It annotates a total of approximately 140,000 maritime targets, covering tasks such as ship detection, fishing/non-fishing vessel classification, and vessel length regression prediction. The greatest academic value and uniqueness of SARFish lie in its provision of both GRD intensity images and raw SLC data, while utilizing the high-quality labels from the xView3 dataset. This feature fills the gap left by previous large-scale datasets, which typically lacked complex phase information. Consequently, it enables higher-precision fishing vessel monitoring in complex marine environments [99,100].
OpenSARShip is a dataset established for ship interpretation and fine-grained classification in SAR imagery based on Sentinel-1 satellite data [101]. It provides highly reliable ground-truth labels for SAR image chips. It provides 11,346 SAR ship chips integrated with AIS information, including 316 chips of the fishing vessel category. Furthermore, it provides dual-polarized (VV + VH) ship chips in both SLC and GRD data formats. OpenSARShip 2.0 is an expanded and upgraded version based on its predecessor. It also utilizes Sentinel-1 satellite data and provides dual-polarized (VV + VH) ship chips in both SLC and GRD formats [102]. The number of its chips has been increased to 34,528, which includes 454 fishing vessel category chips. Both the OpenSARShip and OpenSARShip 2.0 datasets can be obtained for free from the OpenSAR platform [103].
The FishingVesselSAR dataset was constructed by Guan et al. [14]. This dataset utilizes AIS identification models to determine fishing vessel types. Built from high-resolution SAR images, it is specifically designed to support fishing vessel type identification tasks. FishingVesselSAR was created using 369 images from China’s Gaofen-3 (GF-3) satellite. It contains 116 images of gillnetters, 72 of purse seiners, and 181 of trawlers, with a spatial resolution ranging from 3 to 10 m.
The High-Resolution SAR Ship Sample Set (HR4S) is a specialized dataset designed for maritime ship target detection and classification [104]. It is constructed from 53 spaceborne C-band SAR scenes—specifically 25 RADARSAT-2 images and 28 Chinese GaoFen-3 images—matched with Automatic Identification System (AIS) data, featuring a spatial resolution ranging from 3 m to 25 m. HR4S contains 1962 annotated ship target chips under multiple polarization modes. The dataset encompasses 21 distinct ship categories, with fishing vessels, cargo ships, container ships, and oil tankers constituting the primary classes.
The Complex-Valued SAR Ship Dataset (ComplexSAR_Ship) is a benchmark dataset designed for ship target classification in the complex-valued SAR domain [105]. It is constructed from 126 high-resolution scenes of Chinese GaoFen-3 satellite (comprising 75 scenes in Ultrafine Strip mode and 51 in Fine Strip I mode), featuring spatial resolutions of 3 m and 5 m respectively, and is co-registered with synchronized AIS data. Preserving both amplitude and phase information, ComplexSAR_Ship contains 2921 high-resolution ship slices. The dataset encompasses 5 main categories and 17 subcategories, which explicitly include fishing vessels.
FUSAR-Ship is a high-resolution synthetic aperture radar (SAR) ship dataset developed from Gaofen-3 (GF-3) SAR imagery and Automatic Identification System (AIS) data for ship detection and recognition [106]. The dataset consists of 753 SAR–AIS matched image pairs and contains more than 5000 high-resolution ship samples cropped from 126 GF-3 SAR scenes. The GF-3 images have a spatial resolution of approximately 1 m. FUSAR-Ship adopts a hierarchical labeling scheme with 15 ship categories and 98 ship subcategories, together with sea, land, and strong false alarm categories. The ship categories include fishing vessels, and the fishing vessel category is further divided into Bulk carrier (1 sample), Fishing (783 samples), and Trawler (3 samples). However, the number of samples in the Bulk carrier and Trawler subcategories is extremely limited, which restricts the applicability of FUSAR-Ship to fine-grained fishing vessel operation type classification tasks.
SRSDD-v1.0 is a high-resolution synthetic aperture radar (SAR) ship detection dataset designed for rotated object detection [107]. The dataset was constructed from 30 Gaofen-3 Spotlight SAR images collected over port areas in China and Japan, including Nanjing, Zhoushan, Hong Kong, Macao, and Yokohama. The original SAR images have a spatial resolution of 1 m and were cropped into 666 image patches with a size of 1024 × 1024 pixels. The dataset contains 2884 ship instances annotated with both horizontal bounding boxes and oriented bounding boxes. SRSDD-v1.0 provides six ship categories, including ore–oil ships, bulk cargo ships, fishing boats, law enforcement ships, dredger ships, and container ships. The dataset also contains a large proportion of nearshore scenes with complex backgrounds, making it suitable for evaluating SAR ship detection methods under challenging conditions.
Several widely used SAR ship datasets, including SSDD [108], LS-SSDD [109], and HRSID [110], provide annotations only for generic ship detection, where all ship targets are labeled as a single “ship” category. As they do not distinguish fishing vessels from other ship types, these datasets are not suitable for fishing vessel classification studies. Therefore, they are not discussed in detail in this paper.
5.2. Optical Image Datasets of Fishing Vessels
Most existing optical image datasets related to fishing vessels focus on general ship detection and classification. In these datasets, “fishing vessel” often exists only as a coarse-grained category under the broader “ship” label. Public datasets for fine-grained classification—based on operation types (e.g., trawling, seining), hull structures, or functional attributes—remain extremely scarce and need to be supplemented [111]. Below is a brief introduction to several optical imagery ship datasets that include the “fishing vessel” category.
ShipRSImageNet, released by Zhang et al. [26] in 2021, is a public satellite remote sensing dataset for ship detection. It provides accurately labeled data across different categories, image sources, and scenarios. ShipRSImageNet contains over 3435 images and 17,573 ship instances across 50 categories (including a fishing vessel category). These instances are meticulously annotated by experts using both horizontal and oriented bounding boxes.
xView is one of the largest and most diverse public satellite remote sensing datasets for object detection to date [112]. Its data is sourced from the WorldView-3 satellite, offering higher resolution than most public satellite imagery datasets. It contains over one million objects across 60 categories within more than 1400 square kilometers of imagery. The annotated categories in xView include large identifiable ground objects such as fixed-wing aircraft, passenger vehicles, trucks, railway vehicles, maritime vessels, engineering vehicles, buildings, and so on. In this dataset, “fishing vessel” serves only as a sub-category of “maritime vessel.”
FAIR1M, released in 2021, is a dataset sourced from Gaofen satellites and Google Earth with global geographical coverage [113]. It contains over one million instances and more than 15,000 images, designed for fine-grained object recognition in high-resolution remote sensing imagery. Objects are annotated with oriented bounding boxes (OBB) across five main categories (airplane, ship, vehicle, court, and road) and 37 sub-categories, which include the “fishing vessel” sub-category under the “ship” label.
The Very High-Resolution Ships (VHRShips) dataset is a benchmark optical satellite imagery dataset designed for deep learning-based maritime ship detection and classification applications [114]. Generated from Google Earth images captured across 52 different geographical locations worldwide, the dataset consists of 6312 RGB images (including 5312 containing ships and 1000 background images) with a standardized dimension of 720 × 1280 pixels. It features a spatial resolution of 0.43 m per pixel and contains 11,179 annotated ship instances. Its comprehensive taxonomy originally includes 24 parent categories and 11 child classes (mostly military sub-classes), and it explicitly incorporates fishing vessels.
Several widely used optical remote sensing ship datasets, such as HRSC2016 [115], DOTA [116], DIOR [117], and iSAID [118], are mainly designed for generic ship detection and do not provide a dedicated fishing vessel category. Although SeaShips [119] includes fishing boats as an independent category, its images are collected from a coastal video surveillance system rather than satellite or airborne remote sensing platforms. Therefore, the imaging characteristics and application scenarios of SeaShips differ from those of remote sensing datasets. As a result, these datasets are beyond the scope of this paper and are not discussed further.
5.3. Nighttime Light Remote Sensing Fishing Vessel Datasets
Processed datasets for NTL remote sensing are relatively scarce, with the VIIRS Boat Detection (VBD) dataset being the most prominent and widely utilized.
VBD is a boat detection product developed by the Earth Observation Group at the Colorado School of Mines, based on VIIRS/DNB imagery [75]. Rather than providing explicit fishing vessel type labels, the VBD product employs specialized algorithms to detect illuminated vessels at night and provides several detection categories, including high-quality and blurry detections. The data is captured by VIIRS instrument aboard the Suomi NPP, NOAA-20, and NOAA-21 satellites, which records electromagnetic signals in the DNB. The dataset includes metadata such as geographic coordinates, detection timestamps, and radiance values for the lit fishing vessels globally, with daily updates since April 2012. Data older than 45 days and monthly/annual composites are available for free, while real-time and near-real-time data require a subscription [120]. Although VBD does not distinguish fishing vessels from other vessel types, previous studies have shown that most nighttime illuminated vessels detected over major fishing grounds are light-luring fishing vessels [58]. Therefore, the VBD product has been widely used for fishing vessel detection, fishing activity monitoring, illegal, unreported and unregulated (IUU) fishing surveillance, and maritime management [55]. Due to its high reliability, VBD is extensively used by international organizations such as Global Fishing Watch and serves as the industry standard for nighttime fishing vessel monitoring [121].
Furthermore, Hu et al. constructed a small fishing vessel dataset named luojia_01 (https://github.com/echo20229/luojia_01 (accessed on 8 June 2026)) based on Luojia1-01 imagery [53]. The dataset features a spatial resolution of approximately 130 m and comprises 104 images. To highlight the faint visual characteristics of the fishing vessels, the raw images were preprocessed using techniques such as image enhancement and three-band synthesis. The researchers utilized high-precision VMS data for annotation, with lit fishing vessels as the target category.
While high-quality NTL data sources such as Luojia-1 and SDGSAT-1 are now available, there remains a significant shortage of ready-to-use, processed datasets, which highlights an urgent need for further development in this field.
5.4. Summary of Existing Remote Sensing Datasets for Fishing Vessels
To clarify the current state of data resources for fishing vessel monitoring, this section systematically summarizes mainstream remote sensing datasets that include fishing vessels. By presenting sample sizes, spatial scales, and annotation categories, this section aims to provide a data reference for algorithm selection based on different application requirements.
As shown in Table 4, these datasets exhibit significant heterogeneity in terms of sensor types and spatial resolutions. Despite this diversity, several deficiencies persist. Firstly, public optical datasets specifically designed for fine-grained fishing vessel classification remain scarce; most optical datasets (e.g., xView, FAIR1M) treat “fishing vessel” merely as a sub-category under the broad “ship” label, lacking operational-type granularity such as trawlers, seiners, or gillnetters. On the other hand, processed NTL datasets dedicated to fishing vessels remain scarce. Therefore, constructing high-quality NTL fishing vessel datasets based on Luojia-1, SDGSAT-1, and comparable sensors represents a critical research direction to address this deficiency.
Table 4.
Summary and comparison of existing remote sensing datasets for fishing vessels.
6. Conclusions and Outlook
This review evaluates the current landscape of satellite remote sensing modalities and datasets dedicated to fishing vessel identification and monitoring. A core synthesis of the existing literature reveals that relying on a single data source is often insufficient to meet the demands of dynamic, complex marine environments. Rather than treating SAR, optical imagery, and NTL as isolated solutions, the future of maritime surveillance hinges on a “full-time, all-space, and multi-scale” observation framework. The true potential for robust vessel detection lies in the deep synergy of these heterogeneous sensors, supplemented by cooperative tracking systems (e.g., AIS and VMS), to achieve persistent monitoring and effectively expose non-cooperative dark vessels.
Despite the promising conceptual framework of multi-source monitoring, several critical open challenges remain regarding algorithmic implementation. The foremost hurdle is the intricate task of data fusion and the alignment of highly heterogeneous features. Significant disparities in spatial resolution, temporal revisit frequencies, spectral bands, and underlying physical imaging mechanisms create substantial inconsistencies in feature representation.
Furthermore, the scarcity of domain-specific, high-quality datasets continues to constrain the advancement of deep learning in this field. While several large-scale maritime datasets exist, they predominantly treat fishing vessels as a monolithic, coarse-grained sub-category under the broader “ship” label. There is a critical lack of public datasets featuring fine-grained annotations, such as specific operational types (e.g., trawlers, purse seiners, gillnetters) and behavioral statuses (e.g., actively fishing versus transiting). Additionally, datasets featuring high-quality processed NTL data from newer sensors (such as Luojia-1 and SDGSAT-1) are still notably scarce. Constructing and openly sharing these specialized datasets is imperative for training robust, next-generation detection architectures. In addition to deep learning-based detection, understanding target scattering mechanisms through electromagnetic characterization is becoming increasingly important for fine-grained vessel identification. Recent studies have introduced joint-domain characterization and interpretation methods, such as the General Polarimetric Correlation Pattern (GPCP) and multi-domain joint characterization, to mine latent scattering features in the polarimetric domain [122]. These physics-driven approaches enable a more robust discrimination between metallic ship structures and complex sea clutter, offering a promising direction for enhancing the interpretability of SAR-based fishing vessel monitoring.
Looking ahead, with the rapid advancement of multimodal artificial intelligence and interconnected sensing platforms, the paradigm is shifting from simple bounding-box detection to semantic activity understanding. To bridge the gap between broad regional surveillance and tactical law enforcement, integrating macroscopic spaceborne platforms with localized, low-altitude Unmanned Aerial Vehicle (UAV) systems represents a crucial hardware extension [123,124]. Concurrently, recent in-context vision-pattern-language models can ingest fused satellite observations and cooperative tracking data to automatically generate explanations regarding complex vessel behaviors and operational context [125], representing an important future direction for cognitive maritime surveillance.
Author Contributions
Conceptualization, W.Z.; methodology, T.H. and T.C.; validation, W.Z., T.H., T.C. and F.W.; formal analysis, W.Z. and T.H.; investigation, T.H.; writing—original draft preparation, T.H.; writing—review and editing, W.Z.; project administration and funding acquisition, W.Z. All authors have read and agreed to the published version of the manuscript.
Funding
This research was funded by the National Key R&D Program of China (2023YFD2401303).
Data Availability Statement
The datasets discussed and compared in this review are publicly available and can be accessed through the original publications and online resources cited in the text. No new datasets were generated by the authors.
Conflicts of Interest
The authors declare no conflicts of interest.
References
- FAO. In Brief to the State of World Fisheries and Aquaculture 2024. Blue Transformation in Action; FAO: Rome, Italy, 2024; pp. 4–5. Available online: https://openknowledge.fao.org/handle/20.500.14283/cd0690en (accessed on 15 April 2026).
- Arifin, M.D.; Muslim, M.; Octaviani, F.; Faturachman, D. Review of Automatic Identification System: Application, Challenge and Limitations. Int. J. Mar. Eng. Innov. Res. 2024, 9, 464–475. [Google Scholar] [CrossRef] [Scilit]
- Seguin, R.; Le Manach, F.; Devillers, R.; Velez, L.; Mouillot, D. Global Patterns and Drivers of Untracked Industrial Fishing in Coastal Marine Protected Areas. Science 2025, 389, 396–401. [Google Scholar] [CrossRef] [Scilit]
- Paolo, F.S.; Kroodsma, D.; Raynor, J.; Hochberg, T.; Davis, P.; Cleary, J.; Marsaglia, L.; Orofino, S.; Thomas, C.; Halpin, P. Satellite Mapping Reveals Extensive Industrial Activity at Sea. Nature 2024, 625, 85–91. [Google Scholar] [CrossRef] [Scilit]
- Elvidge, C.D.; Baugh, K.; Zhizhin, M.; Hsu, F.-C.; Ghosh, T. Supporting International Efforts for Detecting Illegal Fishing and GAS Flaring Using Viirs. In Proceedings of the 2017 IEEE International Geoscience and Remote Sensing Symposium (IGARSS); IEEE: New York, NY, USA, 2017; pp. 2802–2805. [Google Scholar]
- Zhou, W. Key Technologies and Applications in Fishery Forecasting: In the Case of the Open South China Sea; Science Press: Beijing, China, 2022. [Google Scholar]
- Li, D.; Lu, F.; Xu, S.; Liu, H.; Xue, M.; Fang, H.; Cui, G. Research on fishing effort algorithm of trawler based on Beidou Satellite navigation data. Mar. Fish. 2023, 45, 472–482. (In Chinese) [Google Scholar] [CrossRef]
- Intyanto, G.W.; Anam, K.; Putra, B.J.M.; Prasetyo, H. Detection of Indonesian Fishing Vessels on Unmanned Aerial Vehicle Images Using YOLOv5s. In Proceedings of the 2023 International Seminar on Intelligent Technology and Its Applications (ISITIA); IEEE: New York, NY, USA, 2023; pp. 468–472. [Google Scholar]
- Jia, X.; Li, B.; Qi, L.; Lu, Z.; Yu, C.; Gu, J.; Sun, J. Ship Target Recognition and Positioning Based on Aerial Photos. In Proceedings of the 2021 33rd Chinese Control and Decision Conference (CCDC); IEEE: New York, NY, USA, 2021; pp. 7483–7487. [Google Scholar]
- Elvidge, C.D.; Ghosh, T.; Baugh, K.; Zhizhin, M.; Hsu, F.-C.; Katada, N.S.; Penalosa, W.; Hung, B.Q. Rating the Effectiveness of Fishery Closures with Visible Infrared Imaging Radiometer Suite Boat Detection Data. Front. Mar. Sci. 2018, 5, 132. [Google Scholar] [CrossRef] [Scilit]
- Li, J.; Li, J.; Zhang, K.; Li, X.; Chen, Z. Enhanced Fishing Monitoring in the Central-Eastern North Pacific Using Deep Learning with Nightly Remote Sensing. Remote Sens. 2024, 16, 4312. [Google Scholar] [CrossRef] [Scilit]
- Xue, J.; Yang, P.; Li, Q.; Song, Y.; Gelder, P.H.A.J.M.v.; Papadimitriou, E.; Hu, H. Machine Learning in Maritime Safety for Autonomous Shipping: A Bibliometric Review and Future Trends. J. Mar. Sci. Eng. 2025, 13, 746. [Google Scholar] [CrossRef] [Scilit]
- Page, M.J.; McKenzie, J.E.; Bossuyt, P.M.; Boutron, I.; Hoffmann, T.C.; Mulrow, C.D.; Shamseer, L.; Tetzlaff, J.M.; Akl, E.A.; Brennan, S.E.; et al. The PRISMA 2020 Statement: An Updated Guideline for Reporting Systematic Reviews. BMJ 2021, 372, n71. [Google Scholar] [CrossRef] [Scilit]
- Guan, Y.; Zhang, X.; Chen, S.; Liu, G.; Jia, Y.; Zhang, Y.; Gao, G.; Zhang, J.; Li, Z.; Cao, C. Fishing Vessel Classification in SAR Images Using a Novel Deep Learning Model. IEEE Trans. Geosci. Remote Sens. 2023, 61, 5215821. [Google Scholar] [CrossRef] [Scilit]
- Aldenhoff, W.; Heuzé, C.; Eriksson, L.E.B. Comparison of Ice/Water Classification in Fram Strait from C- and L-Band SAR Imagery. Ann. Glaciol. 2018, 59, 112–123. [Google Scholar] [CrossRef] [Scilit]
- Shin, D.-W.; Yang, C.-S.; Chowdhury, S.J.K. Enhancement of Small Ship Detection Using Polarimetric Combination from Sentinel−1 Imagery. Remote Sens. 2024, 16, 1198. [Google Scholar] [CrossRef] [Scilit]
- Fitriani, S.P.; Gaol, J.L.; Kushardono, D. Fishing-Vessel Detection Using Synthetic Aperture Radar (SAR) Sentinel-1 (Case Study: Java Sea). Int. J. Remote Sens. Earth Sci. 2020, 16, 131–142. [Google Scholar] [CrossRef] [Scilit]
- Marzuki, M.I.; Rahmania, R.; Kusumaningrum, P.D.; Akhwady, R.; Sianturi, D.S.A.; Firdaus, Y.; Sufyan, A.; Hatori, C.A.; Chandra, H. Fishing Boat Detection Using Sentinel-1 Validated with VIIRS Data. In Proceedings of the IOP Conference Series: Earth and Environmental Science; IOP Publishing: Bristol, UK, 2021; Volume 925, p. 012058. [Google Scholar]
- Zucchetta, M.; Madricardo, F.; Ghezzo, M.; Petrizzo, A.; Picciulin, M. Satellite-Based Monitoring of Small Boat for Environmental Studies: A Systematic Review. J. Mar. Sci. Eng. 2025, 13, 390. [Google Scholar] [CrossRef] [Scilit]
- Xu, Y.; Cheng, C.; Guo, W.; Zhang, Z.; Yu, W. Exploring Similarity in Polarization: Contrastive Learning with Siamese Networks for Ship Classification in Sentinel-1 SAR Images. In Proceedings of the IGARSS 2022—2022 IEEE International Geoscience and Remote Sensing Symposium; IEEE: New York, NY, USA, 2022; pp. 835–838. [Google Scholar]
- Kerekes, D.; Nascetti, A. Multi-Temporal Sentinel-1 SAR Images for Dark Vessel Detection and Classification Using a Circlenet Model. In Proceedings of the IGARSS 2024—2024 IEEE International Geoscience and Remote Sensing Symposium; IEEE: New York, NY, USA, 2024; pp. 8223–8227. [Google Scholar]
- Yuan, Y.; Li, L.; Yao, X.; Li, L.; Feng, X.; Cheng, G.; Han, J. A comprehensive review of optical remote-sensing image object detection datasets. Natl. Remote Sens. Bull. 2023, 27, 2671–2687. [Google Scholar] [CrossRef] [Scilit]
- Xiang, L. Improved YOLOX-Based Recognition of Harbor Area and Inland Fishing Vessels. Master’s Thesis, Dalian Maritime University, Dalian, China, 2024. (In Chinese) [Google Scholar] [CrossRef]
- Chen, L.; Letu, H.; Fan, M.; Shang, H.; Tao, J.; Wu, L.; Zhang, Y.; Yu, C.; Gu, J.; Zhang, N.; et al. An Introduction to the Chinese High-Resolution Earth Observation System: Gaofen-1~7 Civilian Satellites. J. Remote Sens. 2022, 2022, 9769536. [Google Scholar] [CrossRef] [Scilit]
- Liu, Y.; Tian, H.; Li, C.; Fan, J.; Luo, Y.; Yin, Z.; Xu, Z.; Chang, D.; Huang, C. The application and prospects of satellite remote sensing in marine fisheries. Period. Ocean Univ. China 2024, 54, 90–103. (In Chinese) [Google Scholar] [CrossRef]
- Zhang, Z.; Zhang, L.; Wang, Y.; Feng, P.; He, R. ShipRSImageNet: A Large-Scale Fine-Grained Dataset for Ship Detection in High-Resolution Optical Remote Sensing Images. IEEE J. Sel. Top. Appl. Earth Obs. Remote Sens. 2021, 14, 8458–8472. [Google Scholar] [CrossRef] [Scilit]
- Wulder, M.A.; Loveland, T.R.; Roy, D.P.; Crawford, C.J.; Masek, J.G.; Woodcock, C.E.; Allen, R.G.; Anderson, M.C.; Belward, A.S.; Cohen, W.B.; et al. Current Status of Landsat Program, Science, and Applications. Remote Sens. Environ. 2019, 225, 127–147. [Google Scholar] [CrossRef] [Scilit]
- Drusch, M.; Del Bello, U.; Carlier, S.; Colin, O.; Fernandez, V.; Gascon, F.; Hoersch, B.; Isola, C.; Laberinti, P.; Martimort, P.; et al. Sentinel-2: ESA’s Optical High-Resolution Mission for GMES Operational Services. Remote Sens. Environ. 2012, 120, 25–36. [Google Scholar] [CrossRef] [Scilit]
- Heiselberg, H. A Direct and Fast Methodology for Ship Recognition in Sentinel-2 Multispectral Imagery. Remote Sens. 2016, 8, 1033. [Google Scholar] [CrossRef] [Scilit]
- Prete, R.D.; Meoni, G.; Longépé, N.; Graziano, M.D.; Renga, A. First Results of Vessel Detection with Onboard Processing of Sentinel-2 Raw Data by Deep Learning. In Proceedings of the IGARSS 2023—2023 IEEE International Geoscience and Remote Sensing Symposium; IEEE: New York, NY, USA, 2023; pp. 6262–6265. [Google Scholar]
- Zuo, G. Study and Application of Vessel Detection Using Satellite Low-Light Remote Sensing Data. Master’s Thesis, University of Electronic Science and Technology of China, Chengdu, China, 2024. (In Chinese) [Google Scholar] [CrossRef]
- Hu, H.; Zhou, W.; Cheng, T. Application of nighttime light remote sensing in fishery based on bibliometrics. Mar. Fish. 2023, 45, 797–808. (In Chinese) [Google Scholar] [CrossRef]
- Cheng, T.; Zhou, W.; Xu, H.; Fan, W. Estimation of Fishing Vessel Numbers Close to the Terminator in the Pacific Northwest Using OLS/DMSP Data. In Proceedings of the Geo-Spatial Knowledge and Intelligence; Yuan, H., Geng, J., Bian, F., Eds.; Springer: Singapore, 2017; pp. 321–327. [Google Scholar]
- Cheng, T.F. Spatial-Temporal Variation of Light-Fishing Grounds Based on Nighttime Light Remote Sensing in the Arabian Sea. Ph.D. Thesis, Shanghai Ocean University, Shanghai, China, 2023. (In Chinese) [Google Scholar]
- Paulino, C.; Aroni, E.; Xu, H.; Alburqueque, E.; Demarcq, H. Use of Nighttime Visible Images in the Study of the Spatial and Temporal Variability of Fishing Areas of Jumbo Flying Squid (Dosidicus gigas) Outside Peruvian EEZ 2004–2015. Fish. Res. 2017, 191, 144–153. [Google Scholar] [CrossRef] [Scilit]
- Wu, J.; Guan, W. Study on the distribution and variation of fishing vessels in East China Sea and Yellow Sea based on the nighttime light remote sensing data from SNPP/VIIRS. J. Fish. Sci. China 2019, 26, 221–231. (In Chinese) [Google Scholar] [CrossRef] [Scilit]
- Zhang, S. Research on Fishing Dynamic Changes in the South China Sea Using Nighttime Light Data. Master’s Thesis, Nanjing University, Nanjing, China, 2017. (In Chinese) [Google Scholar]
- Guo, G. Detection Algorithm for Operating Pelagic Light-Fishing Boats in the Northwestern Pacific and Its Fishing Ground Analysis Based on NPP/VIIRS Low Light Imaging Data. Master’s Thesis, Shanghai Ocean University, Shanghai, China, 2018. (In Chinese) [Google Scholar]
- VIIRS Boat Detection. Available online: https://eogdata.mines.edu/products/vbd/ (accessed on 17 April 2026).
- Krebs, G.D. Luojia 1-01 (LJ 1-01). Gunter’s Space Page. Available online: https://space.skyrocket.de/doc_sdat/luojia-1.htm (accessed on 8 July 2026).
- Zhou, W.; Hu, H.; Cheng, T. Multi-Nighttime-Light Data Comparison Analysis Based on Image Quality Values and Lit Fishing Vessel Identification Effect. Front. Environ. Sci. 2023, 11, 1174894. [Google Scholar] [CrossRef] [Scilit]
- Satellite Description—SDGSAT-1 OPEN SCIENCE PROGRAM. Available online: https://www.sdgsat.ac.cn/satellite/describe (accessed on 8 July 2026).
- Guo, H.; Dou, C.; Chen, H.; Liu, J.; Fu, B.; Li, X.; Zou, Z.; Liang, D. SDGSAT-1: The World’s First Scientific Satellite for Sustainable Development goals. Sci. Bull. 2023, 68, 34–38. [Google Scholar] [CrossRef] [Scilit]
- Huang, Z.; Wu, F.; Fu, Y.; Zhang, Y.; Jiang, X. Review of Deep Learning-Based Algorithms for Ship Target Detection from Remote Sensing Images. Opt. Precis. Eng. 2023, 31, 2295–2318. (In Chinese) [Google Scholar] [CrossRef] [Scilit]
- Liu, G.; Zhang, X.; Meng, J. A Small Ship Target Detection Method Based on Polarimetric SAR. Remote Sens. 2019, 11, 2938. [Google Scholar] [CrossRef] [Scilit]
- Bi, F.; Chen, J.; Zhuang, Y.; Bian, M.; Zhang, Q. A Decision Mixture Model-Based Method for Inshore Ship Detection Using High-Resolution Remote Sensing Images. Sensors 2017, 17, 1470. [Google Scholar] [CrossRef] [Scilit]
- Sun, Z.; Leng, X.; Lei, Y.; Xiong, B.; Ji, K.; Kuang, G. BiFA-YOLO: A Novel YOLO-Based Method for Arbitrary-Oriented Ship Detection in High-Resolution SAR Images. Remote Sens. 2021, 13, 4209. [Google Scholar] [CrossRef] [Scilit]
- Sasamal, S.K.; Mallenahalli, N.K. Detection of Fishing Boats in SAR Image Using Linear Moments and Machine Learning. In Proceedings of the 2019 IEEE Recent Advances in Geoscience and Remote Sensing: Technologies, Standards and Applications (TENGARSS); IEEE: New York, NY, USA, 2019; pp. 21–25. [Google Scholar]
- Yin, X.; Lan, S.; Huang, W.; Ma, Y.; Wang, W.; Yang, H.; Zheng, Y. DLAHSD: Dynamic Label Adopted In Auxiliary Head for SAR Detection. In Proceedings of the 2023 IEEE International Conference on Image Processing (ICIP); IEEE: New York, NY, USA, 2023; pp. 3434–3438. [Google Scholar]
- Touzi, R.; Charbonneau, F.J.; Hawkins, R.K.; Vachon, P.W. Ship Detection and Characterization Using Polarimetric SAR. Can. J. Remote Sens. 2004, 30, 552–559. [Google Scholar] [CrossRef] [Scilit]
- Zhang, F.; Yin, Q.; Zhang, F.; Ma, F.; Zhou, Y. Compact Polarimetric SAR Ship Detection Based on Deformation Convolution and Data Augmentation. In Proceedings of the IGARSS 2024—2024 IEEE International Geoscience and Remote Sensing Symposium; IEEE: New York, NY, USA, 2024; pp. 8299–8302. [Google Scholar]
- Zhang, S.; Wu, R.; Xu, K.; Wang, J.; Sun, W. R-CNN-Based Ship Detection from High Resolution Remote Sensing Imagery. Remote Sens. 2019, 11, 631. [Google Scholar] [CrossRef] [Scilit]
- Hu, H.; Zhou, W.; Jiang, B.; Zhang, J.; Cheng, T. Exploring Deep Learning Techniques for the Extraction of Lit Fishing Vessels from Luojia1-01. Ecol. Indic. 2024, 159, 111682. [Google Scholar] [CrossRef] [Scilit]
- Tian, H.; Liu, Y.; Li, J.; Xing, Q.; Sun, H.; Tian, Y. Satellite Nighttime Remote Sensing Promotes the Spatially Refined Monitoring and Assessment of Offshore Fishery. Int. J. Digit. Earth 2024, 17, 2322762. [Google Scholar] [CrossRef] [Scilit]
- Elvidge, C.D.; Zhizhin, M.; Baugh, K.; Hsu, F.-C. Automatic Boat Identification System for VIIRS Low Light Imaging Data. Remote Sens. 2015, 7, 3020–3036. [Google Scholar] [CrossRef] [Scilit]
- Li, J.; Li, Z.; Chen, M.; Wang, Y.; Luo, Q. A New Ship Detection Algorithm in Optical Remote Sensing Images Based on Improved R3Det. Remote Sens. 2022, 14, 5048. [Google Scholar] [CrossRef] [Scilit]
- Gong, Y.; Zhang, Z.; Wen, J.; Lan, G.; Xiao, S. Small Ship Detection of SAR Images Based on Optimized Feature Pyramid and Sample Augmentation. IEEE J. Sel. Top. Appl. Earth Obs. Remote Sens. 2023, 16, 7385–7392. [Google Scholar] [CrossRef] [Scilit]
- Li, J.; Cai, Y.; Zhang, P.; Zhang, Q.; Jing, Z.; Wu, Q.; Qiu, Y.; Ma, S.; Chen, Z. Satellite Observation of a Newly Developed Light-Fishing “Hotspot” in the Open South China Sea. Remote Sens. Environ. 2021, 256, 112312. [Google Scholar] [CrossRef] [Scilit]
- Guo, G.; Fan, W.; Xue, J.; Zhang, S.; Zhang, H.; Tang, F.; Cheng, T. Identification for Operating Pelagic Light-Fishing Vessels Based on NPP/VIIRS Low Light Imaging Data. Trans. Chin. Soc. Agric. Eng. 2017, 33, 245–251. [Google Scholar]
- Venkata, S.B.; Ashirova, A.; Karwande, V.S.; T M, A.; Kholiyarov, E.; Singh, S. Towards Accurate Maritime Surveillance: A Hybrid CNN-Transformer Architecture for Ship Detection in SAR Imagery. In Proceedings of the 2025 International Conference on Innovations in Intelligent Systems: Advancements in Computing, Communication, and Cybersecurity (ISAC3); IEEE: New York, NY, USA, 2025; pp. 1–6. [Google Scholar]
- Cui, J.; Jia, H.; Wang, H.; Xu, F. A Fast Threshold Neural Network for Ship Detection in Large-Scene SAR Images. IEEE J. Sel. Top. Appl. Earth Obs. Remote Sens. 2022, 15, 6016–6032. [Google Scholar] [CrossRef] [Scilit]
- Zhang, H.; Zhang, X.; Wang, J.; Cao, C.; Liu, G.; Ji, Y. Impact of Motion on Weak Target Detection Using Polarimetric SAR. In Proceedings of the IGARSS 2025—2025 IEEE International Geoscience and Remote Sensing Symposium; IEEE: New York, NY, USA, 2025; pp. 7927–7930. [Google Scholar]
- Shin, D.-W.; Yang, C.-S.; Marino, A. Small Fishing Vessel Detection Using Polarimetric Observables Fusion With Dual-Polarization Sentinel-1 SAR Data. IEEE J. Sel. Top. Appl. Earth Obs. Remote Sens. 2025, 18, 27828–27839. [Google Scholar] [CrossRef] [Scilit]
- Caricchio, C.; Mendonça, L.F.; Lentini, C.A.D.; Lima, A.T.C.; Silva, D.O.; Meirelles e Góes, P.H. YOLOv8 Neural Network Application for Noncollaborative Vessel Detection Using Sentinel-1 SAR Data: A Case Study. IEEE Geosci. Remote Sens. Lett. 2025, 22, 4001005. [Google Scholar] [CrossRef] [Scilit]
- Moreira, A.; Prats-Iraola, P.; Younis, M.; Krieger, G.; Hajnsek, I.; Papathanassiou, K.P. A Tutorial on Synthetic Aperture Radar. IEEE Geosci. Remote Sens. Mag. 2013, 1, 6–43. [Google Scholar] [CrossRef] [Scilit]
- Cheng, X.; Zhang, F.; Chen, X.; Wang, J. Application of Artificial Intelligence in the Study of Fishing Vessel Behavior. Fishes 2023, 8, 516. [Google Scholar] [CrossRef] [Scilit]
- Straka, W.C.; Seaman, C.J.; Baugh, K.; Cole, K.; Stevens, E.; Miller, S.D. Utilization of the Suomi National Polar-Orbiting Partnership (NPP) Visible Infrared Imaging Radiometer Suite (VIIRS) Day/Night Band for Arctic Ship Tracking and Fisheries Management. Remote Sens. 2015, 7, 971–989. [Google Scholar] [CrossRef] [Scilit]
- Tsuda, M.E.; Miller, N.A.; Saito, R.; Park, J.; Oozeki, Y. Automated VIIRS Boat Detection Based on Machine Learning and Its Application to Monitoring Fisheries in the East China Sea. Remote Sens. 2023, 15, 2911. [Google Scholar] [CrossRef] [Scilit]
- Li, J.; Chen, M.; Hou, S.; Wang, Y.; Luo, Q.; Wang, C. An Improved S2A-Net Algorithm for Ship Object Detection in Optical Remote Sensing Images. Remote Sens. 2023, 15, 4559. [Google Scholar] [CrossRef] [Scilit]
- Prasad, M.S.; Verma, S.; Shichkina, Y.A. Dark Ship Detection: SAR Images. In Proceedings of the 2023 XXVI International Conference on Soft Computing and Measurements (SCM), Saint Petersburg, Russian Federation, 24–26 May 2023; IEEE: New York, NY, USA, 2023; pp. 341–344. [Google Scholar]
- Luo, L.; Kang, M.; Guo, J.; Zhuang, Y.; Liu, Z.; Wang, Y.; Zou, L. Spatiotemporal Pattern Analysis of Potential Light Seine Fishing Areas in the East China Sea Using VIIRS Day/Night Band Imagery. Int. J. Remote Sens. 2019, 40, 1460–1480. [Google Scholar] [CrossRef] [Scilit]
- Li, H.; Liu, Y.; Sun, C.; Dong, Y.; Zhang, S. Satellite Observation of the Marine Light-Fishing and Its Dynamics in the South China Sea. J. Mar. Sci. Eng. 2021, 9, 1394. [Google Scholar] [CrossRef] [Scilit]
- Kim, D.-J.; Song, J.; Han, S.; Lee, C.; Yoo, H.; Lee, D. Leveraging SAR Satellites and AI for Real-Time Dark Vessel Detection and Maritime Surveillance. In Proceedings of the OCEANS 2025 Brest; IEEE: New York, NY, USA, 2025; pp. 1–5. [Google Scholar]
- Wang, C.; Guo, B.; Song, J.; He, F.; Li, C. A Novel CFAR-Based Ship Detection Method Using Range-Compressed Data for Spaceborne SAR System. IEEE Trans. Geosci. Remote Sens. 2024, 62, 5215515. [Google Scholar] [CrossRef] [Scilit]
- Li, Y.; Song, L.; Zhao, S.; Zhao, D.; Wu, Y.; You, G.; Kong, Z.; Xi, X.; Yu, Z. Nighttime Fishing Vessel Observation in Bohai Sea Based on VIIRS Fishing Vessel Detection Product (VBD). Fish. Res. 2023, 258, 106539. [Google Scholar] [CrossRef] [Scilit]
- Chang, H.; Hu, C.; Lu, J.; Yan, D.; Tang, P. Fishing Vessel Identification by Low-light Images of SDGSAT-1 Satellites. Radio Eng. 2023, 53, 2691–2698. (In Chinese) [Google Scholar] [CrossRef]
- Choi, S.; Jeon, W.; Jung, I.; Jung, D.; Sim, S.; Woo, J.; Kim, H.; Park, S.; Kim, S.; Lee, S.; et al. Integrated Detection of Ships and Their Wakes Using Sentinel-2A Imagery and Automated Machine Learning Approaches. Mar. Geod. 2025, 48, 665–687. [Google Scholar] [CrossRef] [Scilit]
- Del Prete, R.; Graziano, M.D.; Renga, A. Keypoints Method for Recognition of Ship Wake Components in Sentinel-2 Images by Deep Learning. IEEE Geosci. Remote Sens. Lett. 2023, 20, 5002805. [Google Scholar] [CrossRef] [Scilit]
- Chen, P.; Li, X.; Zheng, G. Rapid Detection to Long Ship Wake in Synthetic Aperture Radar Satellite Imagery. J. Oceanol. Limnol. 2019, 37, 1523–1532. [Google Scholar] [CrossRef] [Scilit]
- Guida, R.; Rodger, M.; Bissonauth, V.; Soreefan, Z.; Hurnath, P.; Matthews, M.; Elseoud, A. Nereus: A Space-Based Maritime Surveillance System for Fisheries Monitoring and Anomaly Detection. In Proceedings of the IGARSS 2023—2023 IEEE International Geoscience and Remote Sensing Symposium; IEEE: New York, NY, USA, 2023; pp. 2069–2072. [Google Scholar]
- Rodger, M.; Guida, R. Revealing Dark Vessels in the Mauritius Exclusive Economic Zone (EEZ) Using Multi-Temporal SAR and AIS Data. In Proceedings of the IGARSS 2023—2023 IEEE International Geoscience and Remote Sensing Symposium; IEEE: New York, NY, USA, 2023; pp. 2077–2080. [Google Scholar]
- Zhang, Z.; Zhang, L.; Wu, J.; Guo, W. Optical and Synthetic Aperture Radar Image Fusion for Ship Detection and Recognition: Current State, Challenges, and Future Prospects. IEEE Geosci. Remote Sens. Mag. 2024, 12, 132–168. [Google Scholar] [CrossRef] [Scilit]
- Kurekin, A.; Loveday, B.; Clements, O.; Quartly, G.; Miller, P.; Wiafe, G.; Agyekum, K.A. Use of Sentinel-l and Sentinel-2 for Monitoring Illegal Fishing Off Ghana. In Proceedings of the IGARSS 2018—2018 IEEE International Geoscience and Remote Sensing Symposium; IEEE: New York, NY, USA, 2018; pp. 6875–6878. [Google Scholar]
- Duan, H.; Cao, Z.; Shen, M.; Liu, D.; Xiao, Q. Detection of Illicit Sand Mining and the Associated Environmental Effects in China’s Fourth Largest Freshwater Lake Using Daytime and Nighttime Satellite Images. Sci. Total Environ. 2019, 647, 606–618. [Google Scholar] [CrossRef] [Scilit]
- Guido, R.M.D.; Santos, G.P.A. Exploring Spratly Islands in Using VIIRS Boat Detection Satellite Image Analytics. In Proceedings of the 2022 IEEE 14th International Conference on Humanoid, Nanotechnology, Information Technology, Communication and Control, Environment, and Management (HNICEM); IEEE: New York, NY, USA, 2022; pp. 1–6. [Google Scholar]
- Zhao, Z.; Ji, K.; Xing, X.; Zou, H.; Zhou, S. Ship Surveillance by Integration of Space-Borne SAR and AIS—Review of Current Research. J. Navig. 2014, 67, 177–189. [Google Scholar] [CrossRef] [Scilit]
- Li, X.; Xiao, Y.; Su, F.; Wu, W.; Zhou, L. AIS and VBD Data Fusion for Marine Fishing Intensity Mapping and Analysis in the Northern Part of the South China Sea. ISPRS Int. J. Geo-Inf. 2021, 10, 277. [Google Scholar] [CrossRef] [Scilit]
- Galdelli, A.; Mancini, A.; Ferrà, C.; Tassetti, A.N. A Synergic Integration of AIS Data and SAR Imagery to Monitor Fisheries and Detect Suspicious Activities. Sensors 2021, 21, 2756. [Google Scholar] [CrossRef] [Scilit]
- Lee, Y.-K.; Jung, H.C.; Kim, K.; Jang, Y.; Ryu, J.-H.; Kim, S.-W. Assessment of Maritime Vessel Detection and Tracking Using Integrated SAR Imagery and AIS/V-Pass Data. Ocean Sci. J. 2024, 59, 27. [Google Scholar] [CrossRef] [Scilit]
- Longépé, N.; Hajduch, G.; Ardianto, R.; Joux, R.d.; Nhunfat, B.; Marzuki, M.I.; Fablet, R.; Hermawan, I.; Germain, O.; Subki, B.A.; et al. Completing Fishing Monitoring with Spaceborne Vessel Detection System (VDS) and Automatic Identification System (AIS) to Assess Illegal Fishing in Indonesia. Mar. Pollut. Bull. 2018, 131, 33–39. [Google Scholar] [CrossRef] [Scilit]
- Meyer, R.G.V.; Schwegmann, C.P.; Kleynhans, W. The Best of a BAD Situation: Optimising an Algorithm to Match Course Resolution SAR Vessel Detections to Sparse AIS Data. In Proceedings of the 2017 IEEE International Geoscience and Remote Sensing Symposium (IGARSS); IEEE: New York, NY, USA, 2017; pp. 2385–2388. [Google Scholar]
- Papoudos, I.; Guida, R.; Rodger, M.; Iervolino, P. A Model for the Identification of Anomalous Fishing Vessels Using Data Association and Route Prediction Techniques. In Proceedings of the IGARSS 2024—2024 IEEE International Geoscience and Remote Sensing Symposium; IEEE: New York, NY, USA, 2024; pp. 1443–1446. [Google Scholar]
- Jayaswal, B.; Ghosh, S.K. A Knowledge Discovery Framework for Maritime Intelligence on Dark Vessels. In Proceedings of the 2025 17th International Conference on COMmunication Systems and NETworks (COMSNETS); IEEE: New York, NY, USA, 2025; pp. 969–973. [Google Scholar]
- Deng, J.; Liu, X.; Du, G.; Yang, X.; Jiang, L.; Sun, C. Small Fishing Boat Classification and Recognition Method Based on GASF Temporal Graph Coding and EMPViT Model. Sci. Rep. 2025, 15, 4619. [Google Scholar] [CrossRef] [Scilit]
- Xing, B.; Zhang, L.; Liu, Z.; Sheng, H.; Bi, F.; Xu, J. The Study of Fishing Vessel Behavior Identification Based on Ais Data: A Case Study of the East China Sea. J. Mar. Sci. Eng. 2023, 11, 1093. [Google Scholar] [CrossRef] [Scilit]
- Zhang, C.; Chen, Z.; Xiong, B.; Ji, K.; Kuang, G. EOOD: End-to-End Oriented Object Detection. Neurocomputing 2025, 621, 129251. [Google Scholar] [CrossRef] [Scilit]
- Paolo, F.; Lin, T.T.; Gupta, R.; Goodman, B.; Patel, N.; Kuster, D.; Kroodsma, D.; Dunnmon, J. xView3-SAR: Detecting Dark Fishing Activity Using Synthetic Aperture Radar Imagery. Adv. Neural Inf. Process. Syst. 2022, 35, 37604–37616. [Google Scholar] [CrossRef] [Scilit]
- Bai, Y.; Li, S.; Ju, R.-Y.; Yang, Z.; Yu, J.; Chiang, J.-S. FAD-SAR: A Novel Fishing Activity Detection System via Synthetic Aperture Radar Images Based on Deep Learning Method. In Proceedings of the 2024 International Symposium on Intelligent Signal Processing and Communication Systems (ISPACS); IEEE: New York, NY, USA, 2024; pp. 1–5. [Google Scholar]
- Luckett, C.; McCarthy, B.; Cao, T.-T.; Robles-Kelly, A. The SARFish Dataset and Challenge. In Proceedings of the IEEE/CVF Winter Conference on Applications of Computer Vision (WACV), Waikoloa, HI, USA, 4–8 January 2024; IEEE: New York, NY, USA, 2024; pp. 752–761. [Google Scholar]
- Cao, T.-T.; Luckett, C.; Williams, J.; Cooke, T.; Yip, B.; Rajagopalan, A.; Wong, S. SARFish: Space-Based Maritime Surveillance Using Complex Synthetic Aperture Radar Imagery. In Proceedings of the 2022 International Conference on Digital Image Computing: Techniques and Applications (DICTA); IEEE: New York, NY, USA, 2022; pp. 1–8. [Google Scholar]
- Huang, L.; Liu, B.; Li, B.; Guo, W.; Yu, W.; Zhang, Z.; Yu, W. OpenSARShip: A Dataset Dedicated to Sentinel-1 Ship Interpretation. IEEE J. Sel. Top. Appl. Earth Obs. Remote Sens. 2018, 11, 195–208. [Google Scholar] [CrossRef] [Scilit]
- Li, B.; Liu, B.; Huang, L.; Guo, W.; Zhang, Z.; Yu, W. OpenSARShip 2.0: A Large-Volume Dataset for Deeper Interpretation of Ship Targets in Sentinel-1 Imagery. In Proceedings of the 2017 SAR in Big Data Era: Models, Methods and Applications (BIGSARDATA); IEEE: New York, NY, USA, 2017; pp. 1–5. [Google Scholar]
- Shanghai Jiao Tong University. OpenSAR: An Open SAR Dataset Platform. Available online: http://opensar.sjtu.edu.cn/ (accessed on 15 April 2026).
- Meng, B.; Min, M.J.; Xi, Z.; Wang, L.G. A High Resolution SAR Ship Sample Database and Ship Type Classification. In Proceedings of the IGARSS 2020—2020 IEEE International Geoscience and Remote Sensing Symposium; IEEE: New York, NY, USA, 2020; pp. 1774–1777. [Google Scholar]
- Gao, G.; He, Y.; Zhao, J.; Li, S.; Wang, M.; Yang, G.; Zhang, X. FDC-TA-DSN Ship Classification Model and Dataset Construction Based on Complex-Valued SAR. IEEE J. Sel. Top. Appl. Earth Obs. Remote Sens. 2025, 18, 7034–7047. [Google Scholar] [CrossRef] [Scilit]
- Hou, X.; Ao, W.; Song, Q.; Lai, J.; Wang, H.; Xu, F. FUSAR-Ship: Building a High-Resolution SAR-AIS Matchup Dataset of Gaofen-3 for Ship Detection and Recognition. Sci. China Inf. Sci. 2020, 63, 140303. [Google Scholar] [CrossRef] [Scilit]
- Lei, S.; Lu, D.; Qiu, X.; Ding, C. SRSDD-v1.0: A High-Resolution SAR Rotation Ship Detection Dataset. Remote Sens. 2021, 13, 5104. [Google Scholar] [CrossRef] [Scilit]
- Zhang, T.; Zhang, X.; Li, J.; Xu, X.; Wang, B.; Zhan, X.; Xu, Y.; Ke, X.; Zeng, T.; Su, H.; et al. SAR Ship Detection Dataset (SSDD): Official Release and Comprehensive Data Analysis. Remote Sens. 2021, 13, 3690. [Google Scholar] [CrossRef] [Scilit]
- Zhang, T.; Zhang, X.; Ke, X.; Zhan, X.; Shi, J.; Wei, S.; Pan, D.; Li, J.; Su, H.; Zhou, Y.; et al. LS-SSDD-v1.0: A Deep Learning Dataset Dedicated to Small Ship Detection from Large-Scale Sentinel-1 SAR Images. Remote Sens. 2020, 12, 2997. [Google Scholar] [CrossRef] [Scilit]
- Wei, S.; Zeng, X.; Qu, Q.; Wang, M.; Su, H.; Shi, J. HRSID: A High-Resolution SAR Images Dataset for Ship Detection and Instance Segmentation. IEEE Access 2020, 8, 120234–120254. [Google Scholar] [CrossRef] [Scilit]
- Nelson, K.; Harper, M. POSEIDON-SAT: Data Enhancement for Optical Fishing Vessel Detection From Low-Cost Satellites. IEEE Trans. Intell. Transp. Syst. 2025, 26, 1113–1122. [Google Scholar] [CrossRef] [Scilit]
- Lam, D.; Kuzma, R.; McGee, K.; Dooley, S.; Laielli, M.; Klaric, M.; Bulatov, Y.; McCord, B. xView: Objects in Context in Overhead Imagery. arXiv 2018, arXiv:1802.07856. [Google Scholar] [CrossRef] [Scilit]
- Sun, X.; Wang, P.; Yan, Z.; Xu, F.; Wang, R.; Diao, W.; Chen, J.; Li, J.; Feng, Y.; Xu, T.; et al. FAIR1M: A Benchmark Dataset for Fine-Grained Object Recognition in High-Resolution Remote Sensing Imagery. ISPRS J. Photogramm. Remote. Sens. 2022, 184, 116–130. [Google Scholar] [CrossRef] [Scilit]
- Kızılkaya, S.; Alganci, U.; Sertel, E. VHRShips: An Extensive Benchmark Dataset for Scalable Deep Learning-Based Ship Detection Applications. ISPRS Int. J. Geo-Inf. 2022, 11, 445. [Google Scholar] [CrossRef] [Scilit]
- Liu, Z.; Yuan, L.; Weng, L.; Yang, Y. A High Resolution Optical Satellite Image Dataset for Ship Recognition and Some New Baselines. In Proceedings of the International Conference on Pattern Recognition Applications and Methods; SciTePress: Setúbal, Portugal, 2017; Volume 2, pp. 324–331. [Google Scholar]
- Xia, G.-S.; Bai, X.; Ding, J.; Zhu, Z.; Belongie, S.; Luo, J.; Datcu, M.; Pelillo, M.; Zhang, L. DOTA: A Large-Scale Dataset for Object Detection in Aerial Images. In Proceedings of the IEEE Conference on Computer Vision and Pattern Recognition; IEEE: New York, NY, USA, 2018; pp. 3974–3983. [Google Scholar]
- Li, K.; Wan, G.; Cheng, G.; Meng, L.; Han, J. Object Detection in Optical Remote Sensing Images: A Survey and a New Benchmark. ISPRS J. Photogramm. Remote Sens. 2020, 159, 296–307. [Google Scholar] [CrossRef] [Scilit]
- Waqas Zamir, S.; Arora, A.; Gupta, A.; Khan, S.; Sun, G.; Shahbaz Khan, F.; Zhu, F.; Shao, L.; Xia, G.-S.; Bai, X. Isaid: A Large-Scale Dataset for Instance Segmentation in Aerial Images. In Proceedings of the IEEE/CVF Conference on Computer Vision and Pattern Recognition Workshops; IEEE: New York, NY, USA, 2019; pp. 28–37. [Google Scholar]
- Shao, Z.; Wu, W.; Wang, Z.; Du, W.; Li, C. SeaShips: A Large-Scale Precisely Annotated Dataset for Ship Detection. IEEE Trans. Multimed. 2018, 20, 2593–2604. [Google Scholar] [CrossRef] [Scilit]
- Elvidge, C.D.; Ghosh, T.; Chatterjee, N.; Zhizhin, M.; Sutton, P.C.; Bazilian, M. A Comprehensive Global Mapping of Offshore Lighting. Earth Syst. Sci. Data 2025, 17, 579–594. [Google Scholar] [CrossRef] [Scilit]
- Wang, D.; Zheng, W.; Tang, S.; Zhang, L.; Liu, Y.; Yu, J. Nighttime Remote Sensing Analysis of Lit Fishing Boats: Fisheries Management Challenges in the South China Sea (2013–2022). Remote Sens. 2025, 17, 2967. [Google Scholar] [CrossRef] [Scilit]
- Li, H.-L.; Chen, S.-W. General Polarimetric Correlation Pattern: A Visualization and Characterization Tool for Target Joint-Domain Scattering Mechanisms Investigation. IEEE Trans. Geosci. Remote Sens. 2025, 64, 5200417. [Google Scholar] [CrossRef] [Scilit]
- Lu, Y.; Guo, J.; Guo, S.; Fu, Q.; Xu, J. Study on Marine Fishery Law Enforcement Inspection System Based on Improved YOLO V5 with UAV. In Proceedings of the 2022 IEEE International Conference on Mechatronics and Automation (ICMA); IEEE: New York, NY, USA, 2022; pp. 253–258. [Google Scholar]
- Prayudi, A.; Sulistijono, I.A.; Risnumawan, A.; Darojah, Z. Surveillance System for Illegal Fishing Prevention on UAV Imagery Using Computer Vision. In Proceedings of the 2020 International Electronics Symposium (IES); IEEE: New York, NY, USA, 2020; pp. 385–391. [Google Scholar]
- Lee, C.; Youn, C.-H. In-Context Vision-Pattern-Language Model for Enhancing Vessel Activity Explanation. IEEE Access 2025, 13, 94464–94477. [Google Scholar] [CrossRef] [Scilit]
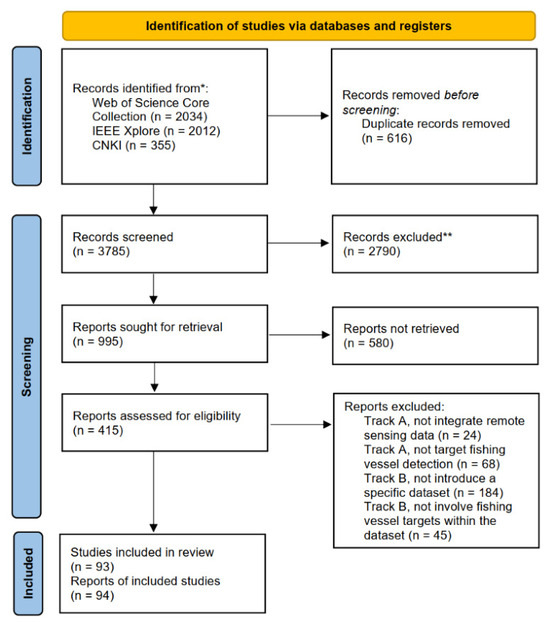
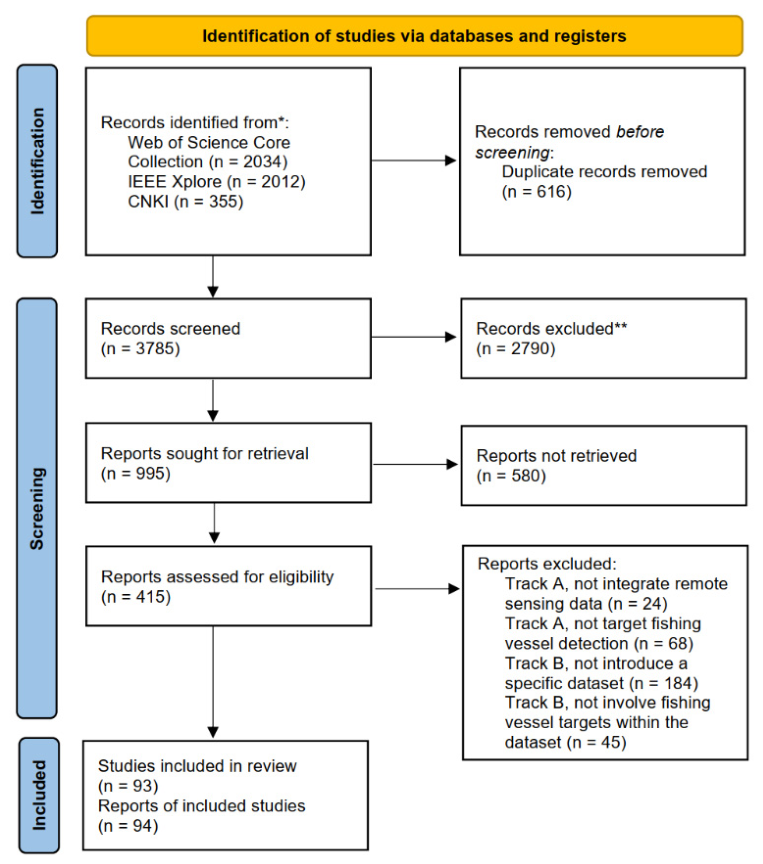
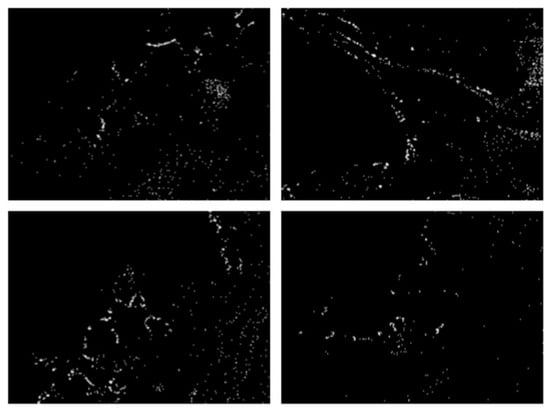
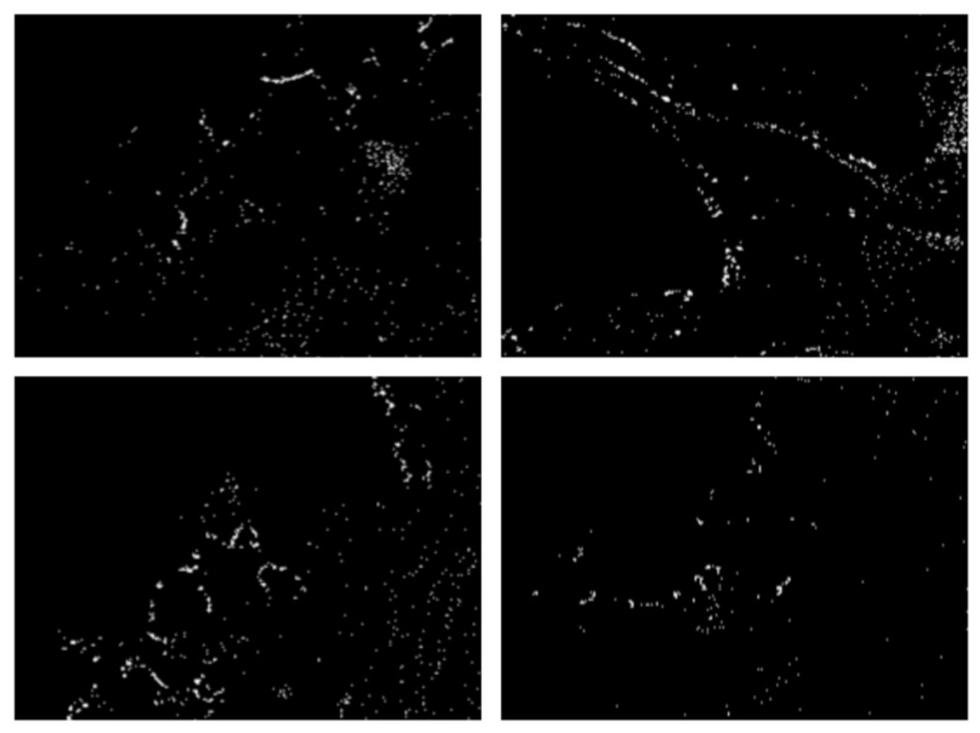
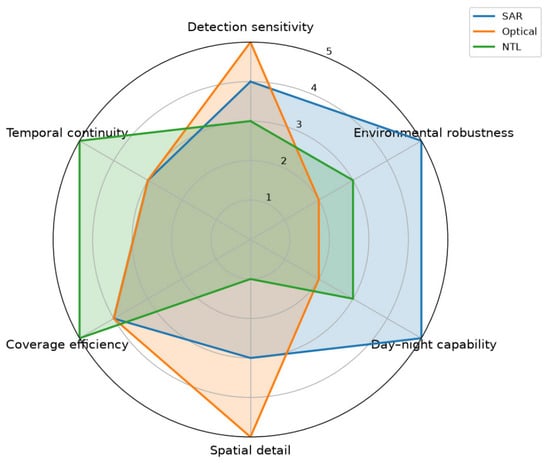
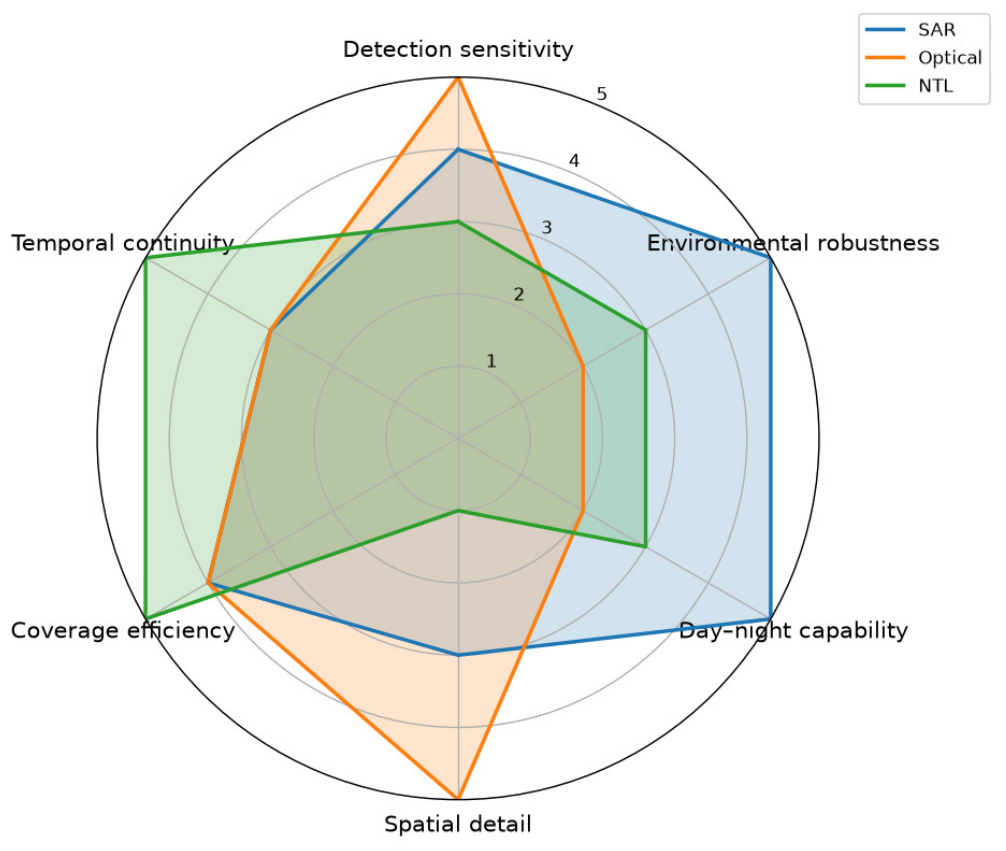

Disclaimer/Publisher’s Note: The statements, opinions and data contained in all publications are solely those of the individual author(s) and contributor(s) and not of MDPI and/or the editor(s). MDPI and/or the editor(s) disclaim responsibility for any injury to people or property resulting from any ideas, methods, instructions or products referred to in the content. |
© 2026 by the authors. Licensee MDPI, Basel, Switzerland. This article is an open access article distributed under the terms and conditions of the Creative Commons Attribution (CC BY) license.