


Highlights
What are the main findings?
- SAR-derived phenological nodes (LOS, FGP, FCP) exhibited high stability and cross-region consistency across diverse sub-regions, revealing significant phenological contrasts.
- A cascading constraint architecture tightly couples SAR anchors with optical index screening and RPDI, achieving >90% within-mask classification accuracy under a spatially independent evaluation protocol and outperforming direct multi-source stacking.
- Error structure analysis identifies landscape fragmentation and residual cloud contamination as primary failure drivers, explicitly delineating the model’s generalizability boundaries.
What are the implications of the main findings?
- The cascading constraint architecture transforms isolated operational steps into a structurally coherent system for cloud-independent tropical mapping.
- Explicitly defined generalizability boundaries, together with a quantified direct cross-region transfer test, clarify that PARM’s adaptive procedure—rather than a fixed, directly transferable parameter set—supports reliable, region-adaptive monitoring for initiatives like REDD+ and the EU Deforestation Regulation.
Abstract
Accurate mapping of rubber plantations is essential for sustainable land management and forest conservation in tropical regions. However, existing methods face two major challenges: persistent cloud cover limits the effectiveness of optical remote sensing in tropical areas, and regional phenological heterogeneity hinders the transferability of fixed-parameter approaches. This study proposes a Phenology-Adaptive Rubber Plantation Mapping (PARM) framework that integrates Sentinel-1 SAR time-series data with optimally selected spectral indices through a cascading constraint architecture. The framework operates as a structurally coherent system wherein SAR-derived phenological anchors explicitly govern downstream optical analysis across three internally dependent modules. First, three key phenological nodes—leaf-off start (LOS), fastest greening point (FGP), and full canopy point (FCP)—are extracted directly from SAR VH-polarization backscatter time series, enabling cloud-independent extraction of phenological temporal anchors. Second, the Jeffries–Matusita (JM) distance, evaluated within SAR-constrained phenological windows, is employed to identify the optimal vegetation and water indices for each region from six candidate spectral indices. Third, a time-weighted Rubber Plantation Discrimination Index (RPDI) is constructed using the selected indices and locally extracted phenological nodes, thereby amplifying the coupled signals of canopy greenness and moisture dynamics during critical phenological transitions. The framework was validated in Hainan Island and Vietnam, two regions with contrasting phenological regimes, using a spatial-block partitioning protocol (leave-one-subregion-out combined with DBSCAN-based clustering) designed to prevent samples from the same plantation from occurring in both training and test subsets. Within the Dynamic World forest mask, PARM achieved overall accuracies of 92.04% and 91.24%, respectively (93.57% and 91.00% on the fully held-out Qionghai City and Gia Lai province subregions), with Kappa coefficients exceeding 0.81 in both regions, consistently outperforming schemes based on raw spectral bands, individual spectral indices or direct multi-source time-series stacking. Error structure analysis revealed that residual classification failures are primarily associated with landscape fragmentation, stand immaturity, and residual cloud contamination, delineating the generalizability boundaries of the framework. These results demonstrate that tightly coupling SAR-based phenological characterization with adaptive optical index selection through a cascading constraint architecture provides a reliable foundation for rubber plantation mapping in cloud-prone tropical regions.
1. Introduction
Rubber (Hevea brasiliensis) is one of the most economically important tree crops in the tropics, providing natural rubber that is essential for a wide range of industrial applications. Global demand for natural rubber has driven unprecedented plantation expansion since the 1990s, with Southeast Asia (SEA) serving as the epicenter of this growth [1,2,3,4]. However, this rapid expansion has caused substantial ecological degradation, including an estimated 4.1 million hectares of forest loss in SEA between 1993 and 2016, of which more than 1 million hectares occurred within global biodiversity hotspots [5,6,7,8]. The large-scale conversion of natural forests into rubber monocultures has not only resulted in habitat loss and biodiversity decline but has also significantly reduced carbon storage capacity, thereby exacerbating global climate change risks [9,10,11,12]. Given these far-reaching impacts and their close connections to international sustainable development initiatives, such as Reducing Emissions from Deforestation and Forest Degradation Plus (REDD+) and the European Union Deforestation Regulation, accurate monitoring and mapping of rubber plantation distribution have become increasingly important for supporting evidence-based policymaking and sustainable land management [13,14,15].
Early studies primarily relied on visual interpretation of cloud-free optical imagery to identify rubber plantations based on their distinct spatial patterns and spectral characteristics [16,17,18]. However, these methods were labor-intensive, subjective, and poorly suited for large-scale or monitoring potential across regions. With advances in remote sensing technology, research has progressively evolved toward automated classification approaches. Optical remote sensing data, particularly those derived from Landsat and Sentinel-2 satellites, have been widely applied in rubber plantation mapping. These studies demonstrated that phenology-based time-series analysis methods can effectively distinguish rubber plantations from other vegetation types by capturing their characteristic leaf-fall and leaf-flushing cycles [6,19,20,21]. These phenology-driven algorithms have progressed through three distinct developmental stages. The first stage relied on short-term MODIS time-series analysis, which, despite its coarse 250-m spatial resolution, enabled the first continental-scale mapping of rubber plantations across mainland Southeast Asia by leveraging characteristic NDVI phenological signals [19]. The second stage introduced medium-resolution Landsat-based approaches, in which improved spectral quality and 30 m spatial detail allowed for more precise delineation of plantation boundaries and better discrimination from surrounding natural forests [22]. The third and most recent stage has advanced toward multi-source imagery fusion, integrating optical and SAR data alongside refined phenological indices to produce 30-m resolution products with enhanced temporal continuity and regional transferability, thereby significantly improving both the accuracy and spatial detail of rubber plantation monitoring [6,7,23,24].
Despite these advancements, current rubber plantation mapping methods still face several critical challenges. First, optical remote sensing is severely constrained by persistent cloud cover in tropical regions, particularly during the rainy season, which limits effective image acquisition and compromises the completeness of phenological time-series data [25]. Clear-sky conditions are often available only during limited seasonal windows, resulting in substantial temporal gaps in the phenological record and introducing uncertainties into classification accuracy. Second, regional differences in phenological timing pose substantial obstacles to model transferability. For example, in Southeast Asian monsoon regions, rubber trees typically undergo leaf-fall during January–February and leaf-flushing during March–April, whereas in equatorial island regions, these phenological signals are less pronounced or may even be absent in certain cultivars [26]. This phenological heterogeneity complicates the development of universal mapping algorithms and necessitates region-specific parameter adjustments [27]. Third, existing phenology-based methods predominantly rely on pre-selected vegetation indices, such as NDVI or EVI, whose discriminatory performance varies across different ecological contexts and may not optimally capture the unique phenological characteristics of rubber plantations [22]. Moreover, effective identification of rubber plantations requires consideration of not only greenness dynamics but also canopy moisture variations during phenological transitions; however, most current approaches lack systematic integration of both vegetation and moisture information.
Recent developments in Synthetic Aperture Radar (SAR) technology offer new opportunities to address these limitations. SAR’s all-weather, day-and-night observation capability makes it particularly valuable for monitoring tropical plantations, where persistent cloud cover frequently hampers optical observations [28,29], and previous studies combining SAR with phenological features have reported classification accuracies of up to 89% [25,30]. However, SAR-based rubber plantation mapping remains relatively underexplored, with most existing applications using SAR primarily as a complementary data source for auxiliary tasks such as forest/non-forest classification or boundary delineation [28,31].
A closer synthesis of this literature reveals that existing SAR applications in plantation mapping fall into three functional categories: SAR used as a structural or moisture proxy for forest/non-forest stratification [28,30]; SAR used as a boundary-delineation aid within multi-source fusion frameworks, where its temporal dynamics are typically discarded after mosaicking with optical imagery [24,29]; and SAR used for stand-age or structural characterization via polarimetric decomposition rather than phenological timing extraction [31]. Notably, a recent meta-review of 305 peer-reviewed studies on rubber plantation remote sensing [32] confirms that while SAR usage has tripled over the past decade, optical data remains dominant, accounting for 68% of studies, and reported SAR-phenology combinations achieve accuracies of only up to 89%. Across all three categories, SAR consistently serves an auxiliary or structural role; to date, no study has used SAR backscatter time series as the primary and independent source for extracting discrete phenological timing nodes to anchor a discrimination index. The potential of SAR for independent, phenology-driven rubber plantation classification has yet to be fully realized, particularly in terms of integrating backscatter dynamics with vegetation phenological cycles and moisture variations.
Beyond SAR-specific applications, recent studies have also explored machine learning and deep learning classifiers—including random forest ensembles, CNN- and LSTM-based time-series models, and deep learning fusion frameworks combining vegetation indices with neural architectures—for rubber plantation mapping. These approaches can achieve high classification accuracy but typically learn spectral–temporal decision boundaries implicitly from large labeled training sets, embedding any phenological information within learned model weights rather than extracting it explicitly. This implicit representation limits interpretability and can constrain transferability, as a model trained in one phenological regime may require retraining or fine-tuning when applied to a region with markedly different phenological timing and amplitude. In contrast, the framework proposed here explicitly derives interpretable phenological anchors for each region directly from the SAR signal prior to classification, so that regional adaptation occurs at the feature-construction stage rather than through re-optimization of model parameters.
To address these challenges, this study proposes a Phenology-Adaptive Rubber Plantation Mapping (PARM) framework that couples Sentinel-1 SAR time-series data with optimally selected spectral indices through a cascading constraint architecture: SAR-derived phenological anchors—leaf-off start (LOS), fastest greening point (FGP), and full canopy point (FCP)—are extracted directly from the backscatter signal and then explicitly govern two downstream steps, namely the Jeffries–Matusita (JM) distance-based selection of the best-performing vegetation and water indices within the SAR-defined transition window [33], and the construction of a time-weighted Rubber Plantation Discrimination Index (RPDI) anchored to the same nodes. Unlike existing phenology-adaptive frameworks, which typically introduce regional adaptivity at a single stage—such as feature weighting or ensemble structure—while still deriving phenological timing from optical time series or fixed calendar windows, the proposed framework lets the same SAR-derived anchors simultaneously govern index selection and temporal weighting, without dependence on cloud-free optical observations at any stage. We hypothesize that this SAR-anchored, cascading design allows the resulting RPDI to outperform fixed-parameter or single-source alternatives specifically because it adapts both index choice and temporal emphasis to each region’s own phenological timing, rather than relying on a universally fixed spectral–temporal signature. The RPDI time series, together with topographic features, is incorporated into a Random Forest classifier to map rubber plantations.
To test this hypothesis, parallel experiments were conducted in Hainan Island and Vietnam—two regions with contrasting phenological regimes, the former exhibiting pronounced monsoon-driven defoliation and the latter a broader latitudinal range with more attenuated, spatially heterogeneous signals—together with a direct cross-region transfer experiment quantifying how much the calibrated RPDI parameters themselves, as opposed to the underlying procedure, can be transferred between regions without recalibration. This research pursues three objectives: (1) extracting SAR-derived phenological nodes and validating their stability and cross-region consistency across multiple sub-regions; (2) establishing the cascading constraint mechanism by which these nodes govern both index selection and RPDI construction, so that the necessity and boundaries of each component are physically and mathematically defined; and (3) evaluating the classification accuracy and procedural adaptability of the complete framework across the two regions, including the cross-region transfer experiment and a failure case analysis that delineates the model’s generalizability boundaries.
2. Study Area and Data
2.1. Study Area Selection
This study selected Hainan Island and Vietnam as the research areas to account for regional variations in rubber plantation phenology. Previous studies have shown that rubber plantations in Southeast Asia exhibit spatial heterogeneity in phenological characteristics. In the monsoon regions of Southeast Asia, rubber defoliation primarily occurs during January and February, whereas in tropical island regions, the defoliation phenomenon is generally less pronounced [32]. Hainan Island is located at the southernmost tip of China, along the northern edge of the tropics, and is characterized by a typical tropical monsoon climate with an annual average temperature of 22–26 °C and annual precipitation of 1500–2000 mm, exhibiting distinct dry and wet seasons. The region has a long history of rubber cultivation and serves as China’s most important natural rubber production base. Rubber plantations in Hainan are highly concentrated and extensively managed, providing an ideal experimental setting for algorithm validation. Vietnam is located in the eastern part of the Indochina Peninsula and spans both tropical and subtropical climate zones. The northern region is strongly influenced by monsoon systems, whereas the southern region exhibits characteristics of a tropical rainforest climate. As one of the world’s major rubber-producing countries, Vietnam has experienced continuous expansion of rubber cultivation areas, encompassing both large-scale industrial plantations and numerous fragmented smallholders plots. The country also features highly diverse terrain conditions, including plains, hills, and mountainous regions. By conducting experiments in these two regions with contrasting climatic backgrounds, plantation structures, and topographic conditions, the applicability and robustness of the proposed rubber plantation mapping method across different phenological zones can be comprehensively evaluated (Figure 1).
Figure 1.
Geographic overview of the study areas and their climatological characteristics: (a,b) Spatial locations of the two study areas, with (a) Hainan Island (red outline) and (b) Vietnam (green outline) shown in the regional context of Southeast Asia, (c) Monthly mean precipitation (bar chart, left y-axis) and mean temperature (line chart, right y-axis) for Hainan Island, and (d) Monthly mean precipitation (bar chart, left y-axis) and mean temperature (line chart, right y-axis) for Vietnam.
In the context of the broader Southeast Asian rubber-growing region, these two areas represent the primary climatic gradients where rubber is extensively cultivated. Hainan Island represents the typical concentrated industrial plantations at the northern margin of the tropics, while Vietnam represents the highly fragmented smallholder landscapes spanning from monsoon to equatorial rainforest climates, thereby capturing the essential heterogeneity of Southeast Asian rubber cultivation.
2.2. Data Sources and Acquisition
2.2.1. Satellite Data
The remote sensing data used in this study were acquired and processed through the Google Earth Engine (GEE) cloud platform [34].
Sentinel-1 SAR data were employed as the primary data source for phenological characterization [35]. This dataset provides all-weather, day-and-night observation capabilities, enabling effective penetration of cloud cover for surface information acquisition. All available Sentinel-1 Ground Range Detected (GRD) scenes covering the study areas during 2025, from both ascending and descending orbits, were collected to maximize temporal density; in total, 182 scenes were acquired for Hainan Island and 1810 scenes for Vietnam. Each scene was radiometrically calibrated and terrain-corrected using the 30 m SRTM digital elevation model, normalizing the backscatter coefficient to a common sigma-naught (σ0) reference to remove terrain-induced radiometric distortion; because both orbital directions were corrected to this common reference and co-registered onto the same 10 m grid, ascending and descending acquisitions were treated as equivalent samples of the underlying VH backscatter time series without requiring additional inter-track bias correction. Speckle noise was subsequently suppressed by applying a 5 × 5 Refined Lee filter separately to the ascending and descending image stacks prior to merging them into a single, chronologically ordered time series, resulting in a spatial resolution of 10 m and a nominal per-track revisit interval of 6 days.
Sentinel-2 multispectral surface reflectance (SR) data were used to calculate spectral indices [36]. This product includes 13 spectral bands, with visible and near-infrared bands provided at 10 m spatial resolution and red-edge and shortwave infrared bands at 20-m resolution. The data were atmospherically corrected, geometrically rectified, and cloud masked prior to analysis. Only images with cloud cover below 30% were retained. After filtering, 440 scenes were acquired for Hainan Island and 2268 scenes for Vietnam during 2025. The Sentinel-2 constellation provides a revisit interval of 5 days, offering sufficient temporal density to capture rapid phenological changes in rubber plantations.
To quantify the severity of cloud contamination affecting the Sentinel-2 archive underlying the spectral index reconstruction described in Section 3.3, the number of cloud-free observations and the maximum single-gap length between consecutive cloud-free observations were computed for every pixel in both study areas for 2025, using the Cloud Score+ algorithm (pixels with a CLEAR_THRESHOLD below 0.6 masked as cloud or cloud shadow). Across most of both study areas, 24–48 cloud-free observations were available per year (modal value of approximately 30–40 in Hainan Island and 25–30 in Vietnam), and the maximum single cloud-gap length was generally between 30 and 60 days; the maximum gap length remained below 58 days for 90% of Hainan Island and below 80 days for 90% of Vietnam (Appendix A, Figure A2 and Figure A3). These empirically observed gap magnitudes directly motivated the temporal-compositing and gap-filling procedure applied to the spectral index time series (Section 3.3).
The Dynamic World V1 dataset was used for land cover masking. This near-real-time global land cover product is generated through deep learning classification of Sentinel-2 imagery and provides nine land cover categories at a spatial resolution of 10 m [37]. In this study, the “trees” category was used to generate a forest mask, thereby restricting classification analysis to forested areas and excluding non-forest land cover types such as croplands, built-up areas, and water bodies. This masking step reduces confusion between rubber plantations and spectrally similar non-forest classes, thereby improving both classification efficiency and accuracy. In addition, we acknowledge a potential bias: it may inadvertently exclude young rubber plantations (less than 3 years old) or highly fragmented smallholder plots that are misclassified as shrubland or cropland, which could lead to a slight underestimation of total rubber area.
In addition, daily precipitation and soil moisture estimates for 2025 were obtained from the Climate Hazards Group InfraRed Precipitation with Station data (CHIRPS; ~0.05° spatial resolution) [38] and the Global Land Data Assimilation System (GLDAS-2.1; ~0.25° spatial resolution) [39], respectively. These products were used exclusively for the independent environmental cross-check of the SAR-derived phenological proxy nodes reported in Section 4.1 and played no role in phenological node extraction, spectral index selection, RPDI construction, or classification.
2.2.2. Sample Data
Sample data acquisition combined field surveys with high-resolution remote sensing imagery. All rubber plantation and other-forest samples used in this study were collected through field surveys conducted in 2025, concurrent with the satellite observation period analyzed in this study. Field reconnaissance was conducted in both Hainan Island and Vietnam using handheld RTK-GPS receivers with a horizontal positioning accuracy of approximately 3 cm, to record the locations of two land cover categories: rubber plantations and other forest lands (including natural forests and other economic tree species). For each sample point, the sampling date, geographic coordinates, vegetation type, stand age structure, canopy closure, elevation, terrain type, and slope were recorded, and on-site photographs were taken for auxiliary verification. The sampling design targeted a reasonably balanced spatial distribution across the eastern, western, southern, northern, and central portions of each study area, and across different elevation, slope, and aspect classes; within each land-cover class, sampling further sought to cover a range of planting densities and stand ages wherever such variation was present in the field.
Each field-recorded sample point was subsequently checked against high-resolution historical imagery from Google Earth Pro (version 7.3.7.1155) for a posteriori verification only; this imagery was not used to supplement or add new sample points, but solely to confirm the recorded land-cover label and coordinates. Uncertain or mixed-pixel samples, as well as points that could not be confirmed or were found to be erroneous upon this check, were eliminated through visual interpretation based on planting texture and canopy structure. Although no formal minimum-polygon-area threshold was imposed during sampling, this screening step implicitly excluded sample points falling within very small or narrow plantation fragments, since such points could not be reliably isolated from adjacent non-rubber cover at the 10 m pixel scale of the satellite imagery used. In total, 3065 valid, field-derived sample points were retained across the two areas, comprising 673 points in Hainan Island (358 rubber, 315 other forests) and 2392 points in Vietnam (1268 rubber, 1124 other forests). The samples maintained a balanced ratio between rubber plantation and other forest classes and exhibited a spatially distributed coverage across each study area, satisfying the requirements for model training, validation, and accuracy assessment.
This sample set was subsequently partitioned into independent training and test subsets following the spatial-block protocol described in Section 3.5, including two fully held-out subregion test sets (Qionghai City, 109 samples; Gia Lai province, 289 samples), ensuring that phenological extraction, index selection, and final accuracy assessment did not share overlapping samples, and that no single plantation contributed samples to both the training and test subsets.
3. Methodology
The Phenology-Adaptive Rubber Plantation Mapping (PARM) framework proposed in this study maps rubber plantations by adapting to local phenological conditions through a tightly coupled, multi-source data integration strategy. Unlike conventional linear processing pipelines, PARM is designed as a structurally coherent modeling system wherein Synthetic Aperture Radar (SAR) dynamics physically constrain and guide optical feature extraction. The framework comprises three internally dependent modules: (1) the extraction of stable SAR phenological anchors; (2) phenology-constrained optimal spectral index selection; and (3) the construction of a dual-signal coupled Rubber Plantation Discrimination Index (RPDI). The complete PARM workflow is illustrated in Figure 2.
Figure 2.
Technical framework of the proposed phenology-adaptive rubber plantation mapping method.
3.1. Overall Framework Architecture and Internal Constraints
To ensure structural integrity and procedural clarity, the PARM framework operates on a cascading constraint mechanism rather than independent processing steps. The core internal logic dictates that SAR-derived temporal anchors explicitly govern downstream optical analysis. Specifically, the all-weather SAR time series provides indispensable, cloud-independent physical boundaries (LOS, FGP, FCP) that define the critical phenological transition windows. These boundaries subsequently constrain the temporal domain for optical spectral separability evaluation (via Jeffries–Matusita distance), ensuring that optical screening is only evaluated during periods of maximum biological divergence. Finally, these same SAR anchors serve as explicit mathematical reference baselines within the RPDI formulation. This architectural design ensures that regional adaptivity propagates through the entire pipeline, transforming isolated operational steps into an integrated system where the necessity and boundaries of each component are physically and mathematically defined.
3.2. Phenological Characteristic Extraction from SAR Time Series
Accurate extraction of phenological parameters forms the foundation for the subsequent index selection and RPDI construction and therefore must be both physically interpretable and stable against sampling variation. In this study, the all-weather observation capability of Sentinel-1 SAR data was utilized to extract VH-polarization backscatter coefficients from rubber plantation training samples across the study areas. Temporal averaging was subsequently performed to generate mean backscatter time series representing the typical phenological characteristics of rubber plantations. Phenological node extraction and spectral index selection (Section 3.3) are each performed once for the entire study region (Hainan Island; Vietnam) rather than for finer agro-climatic or administrative sub-units; the rationale for this choice and its implications for sub-regional robustness are discussed in Section 5.2. Outlier removal was applied prior to averaging, and the resulting series was smoothed using a Savitzky–Golay filter (window size of 5 time points, second-order polynomial) to suppress speckle-related noise while preserving the underlying phenological trend (Figure 3). This 5-point window corresponds to a smoothing span of approximately 25–30 days at the native Sentinel-1 sampling density, well below the roughly 100–150 day scale separating successive phenological nodes reported in Section 4.1, so that short-term speckle-related fluctuations are suppressed without eroding the underlying phenological trend; the second-order polynomial is the lowest order capable of tracking the curvature characteristic of green-up and senescence, consistent with the original Savitzky–Golay formulation, while avoiding the greater noise sensitivity of higher-order fits. The empirical extraction of VH extrema and derivatives is designed to capture robust, macroscopic temporal anchors for large-scale mapping, intentionally bypassing the reliance on continuous optical data.
Figure 3.
Workflow for phenological characteristic extraction from Sentinel-1 SAR VH polarization backscatter time series.
Because Sentinel-1 VH backscatter is jointly sensitive to canopy structure and dielectric (moisture) conditions, the three extracted nodes are best regarded as SAR-derived phenological proxy nodes rather than literal, independently observed biological transition events; their physical plausibility is further examined against independent precipitation and soil-moisture records in Section 4.1. The leaf-off proxy node (LOS) was determined by identifying the annual minimum value in the VH backscatter time series; rather than marking the discrete onset of leaf shedding, this minimum is more appropriately interpreted as the point of peak defoliation and minimum canopy density, when canopy biomass and structural complexity reach their lowest annual level. The fastest-greening proxy node (FGP) was identified by calculating the first derivative of the VH backscatter time series and locating its maximum value, that is, the point at which d(VH)/dt reaches its maximum, representing the period of most rapid canopy recovery. The full-canopy proxy node (FCP) was determined by identifying the annual maximum value in the VH backscatter time series, representing the period of near-maximum canopy development and structural density; because this maximum may also be modulated by concurrent moisture conditions, its interpretation as a canopy-development anchor is supported by, rather than assumed prior to, the environmental cross-checks reported in Section 4.1. Collectively, LOS, FGP, and FCP delineate the complete seasonal backscatter cycle of rubber plantations and, as established in Section 3.1, serve as the temporal anchors that directly govern both the index-selection window (Section 3.3) and the RPDI time-weighting function (Section 3.4).
3.3. Optimal Spectral Index Selection Based on Jeffries–Matusita Distance
To maximize the separability between rubber plantations and other forest types, this study employed the Jeffries–Matusita (JM) distance as the evaluation metric to systematically assess the discriminative capability of multiple spectral indices. The JM distance is a probabilistic measure of class separability ranging from 0 to 2, with higher values indicating stronger separability between classes.
Three vegetation indices and three water-related indices were calculated to characterize different biophysical properties of the canopy. The vegetation indices included the Normalized Difference Vegetation Index (NDVI), the two-band Enhanced Vegetation Index (EVI2), and the Green Chlorophyll Index (CIgreen), which are sensitive to chlorophyll content, canopy structure, and photosynthetic activity, respectively [40,41]. The water-related indices included the Normalized Difference Water Index (NDWI), the Land Surface Water Index (LSWI), and the Moisture Stress Index (MSI), which reflect vegetation water content, canopy moisture status, and drought stress conditions [42]. For all six indices, time series were first extracted from cloud- and cloud-shadow-masked Sentinel-2 surface reflectance data and aggregated into 10-day composites, using the median of all cloud-free observations within each 10-day interval, to mitigate the sparse and irregular acquisition dates imposed by persistent cloud cover (Section 2.2.1; Appendix A). Missing composites arising from cloud gaps exceeding 10 days were linearly interpolated from the nearest valid composites before and after the gap, and the resulting 10-day composite series was smoothed using a Savitzky–Golay filter (window size of 5 data points, second-order polynomial) to further suppress residual noise while preserving the underlying phenological trend [43]. Because the training samples used to reconstruct each index’s time series are spatially dispersed across the study area, a cloud gap affecting one sample at a given date is generally compensated by other samples with valid observations at that date, further limiting the impact of individual, localized gaps on the resulting composite-level time series.
Unlike a conventional full-year separability assessment, the JM distance for each index in this study was computed using index values restricted to the region-specific LOS–FCP window extracted in Section 3.2, rather than the complete annual cycle. This restriction is a direct consequence of the coupling established in Section 3.1: because rubber plantations and other forest types are expected to diverge most strongly during the SAR-identified leaf-off-to-full-canopy transition, evaluating separability specifically within this window ensures that the selected indices are optimized for the phenological period that the RPDI is subsequently designed to emphasize, rather than for the annual mean condition, during which canopy conditions of the two classes may converge (as illustrated schematically in Figure 4, where the discrimination signal between rubber and other forests is markedly reduced outside the LOS–FCP interval). Among the three vegetation indices, the index achieving the maximum JM distance within this window was selected as the optimal vegetation index (VI) for the region; the same procedure was applied to the three water-related indices to select the optimal water index (WI). Throughout this study, “optimal” denotes the best-performing index among the three vegetation (or three water-related) candidates evaluated here, rather than a claim of optimality among all possible spectral indices; we retain this shorthand, consistent with the VI/WI notation used in the RPDI formulation (Section 3.4), for the JM-distance-maximizing index within each candidate set. Because the LOS–FCP window itself differs between regions with contrasting phenological regimes, this procedure inherently allows the identity of the optimal VI and WI to vary regionally, consistent with the adaptive design objective of the framework.
Figure 4.
Conceptual illustration of the Rubber Plantation Discrimination Index (RPDI) temporal profile and its correspondence with key phenological stages of rubber trees.
3.4. Construction of the Rubber Plantation Discrimination Index(RPDI)
Based on the extracted phenological parameters and selected optimal indices, this study proposes a novel Rubber Plantation Discrimination Index (RPDI) that incorporates a time-weighting function to emphasize the spectral response dynamics during critical phenological stages. The RPDI is designed as a piecewise function that adapts to different phenological phases of rubber plantations, thereby amplifying the coupled variation in canopy greenness and moisture content specifically during the phenological transition period identified by the SAR-derived anchors.
The mathematical formulation of RPDI is defined as follows:
where VI_, , , and denote the values of the selected optimal indices at the SAR-derived LOS and FCP nodes, respectively. Two design choices in this formulation are made explicit here, as they constitute the internal constraints linking the RPDI to the preceding modules. First, the reference point switches from LOS to FCP at t = FCP, so that prior to full canopy closure the index measures departure from the defoliated state, whereas after FCP it measures departure from the fully developed canopy state; this ensures that the discrimination signal remains anchored to a physically meaningful reference throughout the year rather than to a single fixed point. Second, VI and WI enter the formulation multiplicatively rather than additively: because rubber plantations are expected to exhibit a synchronized change in both greenness and moisture during leaf flushing, the multiplicative form yields a strong signal only when both components deviate from their reference values simultaneously, whereas an additive form would allow a change in either component alone to produce a comparable response. This multiplicative coupling is therefore the mechanism through which the RPDI translates the two independently selected indices into a single signal specific to the coupled phenological behavior of rubber plantations.
The time-weighting function further concentrates discriminative emphasis on the LOS–FGP–FCP transition sequence:
where , and . The empirical weighting parameters (, ) were adopted as representative base values, and their robustness was subsequently evaluated through a grid-search sensitivity analysis spanning and (35 parameter combinations in total). Across the entire grid, the overall accuracy fluctuated by no more than 1 percentage point in either Hainan Island or Vietnam, confirming that the framework’s classification performance is genuinely insensitive to the precise choice of these parameters within this range and substantiating the robustness of the time-weighting formulation for large-scale mapping without region-specific tuning.
Three internal constraints govern this function and are stated explicitly to clarify why the piecewise design is necessary rather than arbitrary: (i) the ordering LOS < FGP < FCP, inherited directly from Section 3.2, is required for both the quadratic and Gaussian segments to be well defined; (ii) ensures that the weighting function increases monotonically toward FGP, consistent with the physical expectation that discriminability peaks during the most rapid leaf-renewal phase rather than at the onset or completion of canopy recovery; and (iii) the function returns to a constant value of 1 outside the LOS–FCP interval, reflecting the assumption—already established in Section 3.3—that discrimination outside this window is not preferentially weighted, since index selection itself was not optimized for that period. Through this construction, the RPDI functions as the fusion operator of the framework: it does not simply concatenate the outputs of Section 3.2 and Section 3.3, but combines them such that removing either the phenological anchors or the optimally selected indices would leave the formulation undefined.
The RPDI amplifies the coupled variation signals of photosynthetic activity and water dynamics through the multiplicative combination of vegetation and water indices. This coupled response is particularly pronounced during the rapid leaf-renewal period of rubber plantations (Figure 4). The incorporation of the weighting function further enhances the discrimination signal during critical phenological transition periods, effectively exploiting the fundamental differences in seasonal dynamic patterns between rubber plantations and natural evergreen forests.
3.5. Random Forest Classification and Accuracy Assessment
This study employed the Random Forest (RF) algorithm to classify rubber plantations based on the processed RPDI time series [44]. Random Forest is an ensemble learning method that constructs multiple decision trees and generates classification results through majority voting [45]. The algorithm has demonstrated strong performance in handling high-dimensional remote sensing data and exhibits robust resistance to overfitting. The complete RPDI time series for the study period was used as the input feature set, with each time step treated as an independent predictor variable. To mitigate the risk that spatial autocorrelation among adjacent samples inflates classification accuracy, the sample dataset was partitioned using a leave-one-subregion-out design combined with DBSCAN-based spatial-block partitioning, rather than stratified random sampling at the individual-point level. Specifically, all samples located within Qionghai City (Hainan Island) and Gia Lai province (Vietnam) were withheld in their entirety as fully independent, held-out subregion test sets. For the remaining samples in each region, DBSCAN was applied to identify spatially contiguous plots (parameters selected using the k-distance graph method: minimum samples = 2; eps = 2 km for Hainan Island and eps = 5 km for Vietnam), and entire clusters—rather than individual sample points—were then assigned to training or test subsets, thereby ensuring that no single plantation contributed samples to both subsets. The training subset alone was used for SAR-based phenological node extraction (Section 3.2), Jeffries–Matusita distance-based index selection (Section 3.3), and Random Forest model training. Both the DBSCAN-based spatial-block test subset and the fully held-out subregion test subset were withheld from all of these preceding steps and used exclusively for the independent accuracy assessment reported in Section 4.3. Key hyperparameters of the Random Forest model, including the number of trees, maximum tree depth, and minimum number of samples required for node splitting, were optimized through cross-validation (consistent with the strict separation described above, neither the DBSCAN-based spatial-block test subset nor the fully held-out subregion test subset was used at any stage of this tuning process, and both were reserved solely for the final, independent accuracy assessment). The Random Forest model was implemented with the following optimized hyperparameters: number of trees = 200, maximum tree depth = 30, minimum samples per split = 5, and variables per split = sqrt(total features). A random seed of 42 was used. The trained model was subsequently applied to all pixels within the study areas to generate binary classification maps distinguishing rubber plantations from other land cover types.
Classification performance was comprehensively evaluated using the independent test subsets through multiple accuracy metrics, including overall accuracy, producer’s accuracy, user’s accuracy, and the Kappa coefficient [46]. To validate the effectiveness of the proposed RPDI, comparative experiments were conducted using three feature combinations as inputs to the Random Forest classifier. The first group used spectral band reflectance values combined with terrain elevation data (Spectral Bands + Elevation). The second group used the six spectral indices employed in RPDI construction—namely NDVI, EVI2, CIgreen, NDWI, LSWI, and MSI—combined with elevation data (Spectral Indices + Elevation). The third group used the proposed RPDI combined with elevation data (RPDI + Elevation). By comparing classification accuracies across these three groups, the contribution of the RPDI formulation relative to raw spectral information and individual spectral indices can be systematically evaluated, thereby demonstrating the superiority of the proposed index in terms of class separability and classification performance.
To ensure that comparisons among these feature-combination schemes, together with the two additional multi-temporal schemes introduced in Section 4.3 (Scheme 4: Sentinel-1 VV and VH time series + Elevation; Scheme 5: Sentinel-1 and Sentinel-2 time series + Elevation), are not confounded by inconsistencies in classifier configuration, temporal sampling, or sample partitioning, all five schemes, together with the three RPDI ablation variants evaluated in Section 4.2, were trained and tested using the identical Random Forest hyperparameters specified above and the identical DBSCAN-based spatial-block training/test partition described later in this section. The split-selection parameter (variables per split = sqrt(total features)) further adapts automatically to each scheme’s own feature count, which is standard Random Forest practice and additionally mitigates dimensionality-related bias. All time-series inputs were also aggregated onto the same 10-day compositing interval used for spectral index reconstruction (Section 3.3), yielding an identical number of temporal composites (≈36 per year) across schemes and thereby eliminating any inconsistency in temporal sampling density.
We nonetheless acknowledge that the input feature dimensionality genuinely differs across schemes by design, since each scheme is intended to represent a distinct quantity of information rather than a controlled variable: Scheme 1 uses six Sentinel-2 reflectance bands (Red, Green, Blue, NIR, SWIR1, SWIR2) per time step; Scheme 2 uses the six spectral indices defined in Section 3.3; Scheme 4 uses two SAR polarizations (VV, VH); Scheme 5 combines these two SAR polarizations with the six optical bands used in Scheme 1; and Scheme 3 (RPDI) uses a single fused time series. Because Scheme 3 therefore has a substantially lower feature dimensionality than Schemes 1, 2, 4, and 5, part of the accuracy gap between the RPDI-based scheme and these higher-dimensional feature-stacking schemes may in principle be partly attributable to this dimensionality difference rather than to the RPDI formulation alone. This caveat does not, however, affect the ablation comparison reported in Section 4.2, since RPDI, RPDI_w/o_T, RPDI_w/o_VI, and RPDI_w/o_WI are all single time series of identical dimensionality; the accuracy differences among these variants therefore isolate the genuine contribution of each RPDI component independent of any dimensionality confound.
In addition, the procedural adaptability of the RPDI-based method was assessed by comparing classification accuracies between Hainan Island and Vietnam, thereby evaluating the robustness of the algorithm across different phenological zones and geographic contexts. These analyses provide empirical evidence supporting the broader regional applicability of the PARM workflow, rather than of any fixed parameter set. To explicitly separate procedural adaptability from parameter-level transferability, a direct cross-region transfer experiment was additionally conducted: the complete RPDI formulation calibrated in one region—including its SAR-derived phenological nodes (LOS, FGP, FCP), its Jeffries–Matusita-selected optimal VI and WI, and its time-weighting parameters—was applied without any regional recalibration to compute RPDI time series in the other region, and only the Random Forest classifier was retrained on the target region’s own training samples. The resulting model was evaluated on the same DBSCAN-based spatial-block and fully held-out subregion test subsets described above. This procedure was performed in both directions (Hainan-calibrated RPDI applied to Vietnam, and Vietnam-calibrated RPDI applied to Hainan) and is reported in Section 4.5.
4. Results
4.1. Phenological Characteristic Analysis Across Study Regions
The phenological characteristics of rubber plantations were extracted from VH-polarization backscatter time series in both Hainan Island and Vietnam, revealing distinct temporal patterns that closely correspond to the regional climatic characteristics described in Section 2.1 (Figure 5). The Savitzky–Golay filtering method effectively smoothed the raw SAR backscatter signals while preserving phenological trend information, thereby enabling accurate identification of the three key phenological nodes: leaf-off start (LOS), fastest greening point (FGP), and full canopy point (FCP).
Figure 5.
Phenological characteristic extraction results from Sentinel-1 VH polarization backscatter time series. (a1) Hainan Island and its representative cities spanning different geographical locations: (a2) Sanya, (a3) Danzhou, (a4) Haikou, and (a5) Qionghai. (b1) Vietnam and its representative provinces spanning a broad latitudinal gradient: (b2) Binh Phuoc, (b3) Gia Lai, (b4) Quang Nam, and (b5) Son La. Gray lines indicate raw VH backscatter time series and blue lines indicate Savitzky–Golay smoothed time series. Vertical dashed lines mark the three extracted phenological nodes: leaf-off start (LOS, red), fastest greening point (FGP, orange), and full canopy point (FCP, green). “Min” and “Max” denote the annual minimum and maximum VH backscatter coefficients (dB), respectively, which serve as the basis for LOS and FCP identification.
In Hainan Island, the extracted phenological parameters exhibited a pronounced seasonal cycle characteristic of typical tropical monsoon climate. The LOS proxy node occurred at day 15 (mid-January), consistent with the January-February defoliation period widely observed in Southeast Asian monsoon regions. At this date, the VH backscatter coefficient reached its annual minimum value of approximately −16.0 dB, consistent with peak defoliation and minimum canopy biomass and structural complexity during the distinct dry season. Following defoliation, the FGP was identified at day 129 (early May), marking the period of most rapid leaf renewal when d(VH)/dt reaches its maximum value. This timing corresponds to the transition from the dry season to the wet season, during which favorable moisture and temperature conditions trigger synchronized leaf flushing across rubber plantations. The VH backscatter exhibited a sharp increasing trend during this phase, rising from approximately −15.7 dB to −14.5 dB. The FCP proxy node was detected on day 297 (late October), when the VH backscatter peaked at approximately −14.0 dB, consistent with near-complete canopy development and maximum structural density. The total duration from LOS to FCP spanned 282 days, and the amplitude of VH variation throughout the phenological cycle exceeded 2.0 dB, demonstrating the pronounced seasonal dynamics characteristic of Hainan’s location along the northern tropical margin, where monsoon influence is particularly strong. To further validate the stability and reproducibility of the SAR-based phenological node extraction across different geographical locations, we examined the local-scale VH backscatter time series for four representative cities in Hainan Island (Sanya, Danzhou, Haikou, and Qionghai) covering the southern, northern, western, and eastern regions (Figure 5(a2–a5)). Despite slight variations in absolute backscatter values due to local environmental conditions, all four cities exhibited consistent seasonal trajectories. The LOS, FGP, and FCP were successfully and stably identified in each city, demonstrating strong cross-region consistency and the structural stability of the extraction method within Hainan’s homogeneous monsoon climate.
Vietnam exhibited similar phenological timing patterns but with notably different amplitude characteristics. The LOS occurred on day 37 (early February), falling within the typical January-February defoliation window for monsoon-influenced regions, although approximately 22 days later than Hainan Island. The minimum VH backscatter value reached approximately −15.1 dB, which was already higher than the minimum value observed in Hainan, suggesting less complete defoliation. The FGP was identified on day 109 (mid-April), approximately 20 days earlier than in Hainan Island, indicating a more rapid transition from defoliation to active canopy growth. Notably, the magnitude of VH increase during the leaf flushing period was considerably less pronounced than that observed in Hainan Island, with the backscatter increasing from approximately −15.1 dB to −14.3 dB, corresponding to an amplitude of only about 0.8 dB. The FCP occurred on day 258 (mid-September), approximately 39 days earlier than in Hainan Island, with a peak VH value of approximately −14.1 dB. The total VH variation amplitude throughout the phenological cycle was approximately 1.0 dB, significantly smaller than that observed in Hainan Island. Furthermore, the VH time series after FCP in Vietnam exhibited greater temporal variability and a less distinct decline toward the subsequent defoliation period. Similarly, to address the phenological heterogeneity across its broad latitudinal range, we analyzed four representative provinces in Vietnam spanning from north to south (Son La, Quang Nam, Gia Lai, and Binh Phuoc) (Figure 5(b2–b5)). While the overall backscatter amplitude was attenuated compared to Hainan Island, the three key phenological nodes were consistently extracted across all selected provinces. Notably, the northern province (e.g., Son La) exhibited clearer phenological signals and larger amplitude variations, whereas the southern provinces (e.g., Binh Phuoc) showed more attenuated signals, directly reflecting the spatial transition from monsoon-dominated to equatorial rainforest climates. Nevertheless, the successful node extraction across these diverse localities confirms the method’s robustness, reproducibility, and cross-region consistency even under complex and heterogeneous climatic scenarios.
While direct field validation of absolute physical phenology is beyond the scope of this rapid mapping framework, the SAR-derived VH backscatter dynamics inherently capture the macroscopic canopy moisture and structural responses to regional climatic forcing. The pronounced amplitude variation in Hainan Island directly reflects the strong monsoonal dry-season forcing, whereas the attenuated amplitude in Vietnam corresponds to the more uniform year-round moisture availability in equatorial zones. We do not treat the consistently high classification accuracies achieved using these empirical SAR nodes as evidence of their biophysical validity, since the classification and the nodes are derived from the same underlying VH signal. Independent supporting evidence for the physical plausibility of LOS, FGP, and FCP is instead provided by the environmental cross-check reported below and by the literature-based comparison in Table A1, both of which we present as qualitative and semi-quantitative rather than as a substitute for field-based phenological validation (Section 5.4).
To further examine whether the extracted LOS and FCP proxy nodes reflect sustained seasonal environmental forcing rather than isolated rainfall events, we cross-checked both dates against independent GLDAS soil moisture and CHIRPS precipitation records for 2025 (Section 2.2.1). For each region, we computed the within-year percentile rank of the 7-day and 14-day mean soil moisture and cumulative precipitation immediately preceding LOS and FCP. At LOS, both regions fell within the driest portion of the annual cycle at both time scales (soil moisture percentile 13.97–20.82%; precipitation percentile 0.54–9.58%), with consistent rankings across the two window lengths, indicating that LOS coincides with a sustained dry period rather than the mere absence of rain on a single day, and consistent with the January–February monsoon defoliation window widely reported in the regional literature. At FCP, both regions fell within a comparatively wet percentile range (soil moisture 70.13–90.68%; precipitation 58.90–84.39%), but in both regions the day-of-year of FCP lagged the seasonal precipitation peak by roughly 40–100 days.
A direct, daily-scale comparison of the VH, precipitation, and soil-moisture time series (Figure A1) refines this picture and reveals a regionally distinct pattern. In Hainan Island, a pronounced precipitation peak does occur before FCP, but only after a lag of roughly two to three Sentinel-1 acquisition cycles (approximately 15–20 days), over which interval soil moisture itself remains comparatively stable; in Vietnam, by contrast, no comparable precipitation peak is evident in the days immediately preceding FCP. Were the VH maximum simply an instantaneous dielectric response to a nearby rain event, a near-synchronous precipitation spike accompanied by a corresponding rise in soil moisture would be expected in both regions; the multi-week lag observed in Hainan, and the absence of any preceding peak in Vietnam, are inconsistent with this explanation. Instead, this pattern is consistent with the well-established physiological expectation that rubber tree leaf flushing and canopy expansion are water-demanding growth processes and therefore track—with an inherent developmental lag—the progression of the regional rainy season rather than any single precipitation event [47]. Under this interpretation, the co-occurrence of FCP with a comparatively wet portion of the annual cycle in both regions is not a confound to be discounted but an expected consequence of the coupled relationship between rubber canopy phenology and monsoon-driven water availability; the observed lag structure and its regional variability further support FCP as reflecting accumulated canopy development rather than a short-term moisture artifact. We nonetheless acknowledge that single-polarization VH backscatter cannot fully disentangle structural from moisture-driven contributions to the signal, and we present both cross-checks as qualitative and semi-quantitative supporting evidence rather than a substitute for independent phenological validation (Section 5.4).
These phenological differences between the two study regions strongly reflect their contrasting climate regimes, as described in Section 2.1. Hainan Island’s location along the northern tropical margin, combined with its typical tropical monsoon climate and distinct dry-wet seasonal differentiation, produces highly synchronized and pronounced defoliation-flushing cycles accompanied by strong SAR backscatter amplitude variation. In contrast, Vietnam spans a broader latitudinal range, and its rubber plantations encompass both monsoon-dominated northern regions, which exhibit clearer phenological signals, and southern regions characterized by tropical rainforest climates, where defoliation phenomena are less pronounced. The reduced phenological amplitude and greater temporal variability observed in Vietnam’s aggregated time series likely result from the spatial averaging of these contrasting phenological regimes, particularly the influence of southern equatorial zones, where year-round favorable temperature and moisture conditions reduce the intensity and synchronization of seasonal defoliation. The earlier occurrence of FGP and FCP in Vietnam may additionally reflect differences in photoperiod responses or cultivar-specific adaptations to the region’s more complex climate gradient. Crucially, the local-scale analysis (Figure 5(a2–a5,b2–b5)) directly illustrates that these regional aggregated results are not artifacts of isolated local anomalies, but rather represent a stable and reproducible phenological pattern observable across various sub-regions.
These regional phenological variations underscore the necessity of phenology-adaptive approaches for rubber plantation mapping across heterogeneous tropical landscapes. The successfully extracted phenological nodes provide critical temporal anchors for the subsequent construction of the RPDI, enabling the proposed method to dynamically adjust to both the pronounced monsoon-driven phenology of Hainan Island and the more attenuated and spatially heterogeneous phenology in Vietnam.
To provide an independent, non-circular check on the physical plausibility of the extracted proxy nodes, we compiled a literature-based comparison matching the SAR-derived LOS, FGP, and FCP dates for both regions against phenological timing windows reported in seven independent published studies covering rubber plantations in Hainan Island and mainland/southern Southeast Asia (Table A1 in Appendix A). These studies employ diverse observation methods, including LAI inversion from Landsat imagery, MODIS EVI/LST temporal analysis, and field-informed NDVI time-series decomposition, and are therefore fully independent of the SAR-derived backscatter signal and the classification outcomes reported in Section 4.3. For Hainan Island, the SAR-derived LOS (day 15, mid-January) falls within the defoliation windows of late December–mid-March and January–February reported in the literature; the FGP (day 129, early May) is consistent with the reported onset of the vigorous growth stage in mid-May; and the FCP (day 297, late October) falls within the reported vigorous growth window of mid-May to late November. For Vietnam, the SAR-derived LOS (day 37, early February) falls within the reported mid-January–early March defoliation window; the FGP (day 109, mid-April) is consistent with the reported refoliation period of March–April; and the FCP (day 258, mid-September) is broadly consistent with the reported continued LAI increase until late September in comparable Southeast Asian settings. In all cases, the SAR-derived dates fall within, or closely adjacent to, the independently reported phenological windows. We emphasize that this constitutes a qualitative literature-based cross-check rather than a quantitative field validation, and the absence of direct ground-based phenological observations or independent phenology products is acknowledged as the primary methodological limitation of the present study (Section 5.4).
4.2. RPDI Construction and Separability Assessment
The JM distance evaluation results for all six spectral indices are presented in Figure 6h. In Hainan Island, the Moisture Stress Index (MSI) achieved the highest JM distance among the water-related indices (1.411), while NDVI marginally outperformed CIgreen among the vegetation indices (1.175 vs. 1.174). Accordingly, NDVI and MSI were selected as the optimal vegetation index (VI) and water index (WI) for Hainan Island. In Vietnam, CIgreen yielded the highest JM distance among the vegetation indices (1.195), and MSI again demonstrated the strongest discriminative capability among the water-related indices (1.086). Therefore, CIgreen and MSI were selected as the optimal index pair for Vietnam. The consistent selection of MSI across both regions highlights its sensitivity to canopy moisture dynamics during rubber plantation phenological transitions. In contrast, the differences in the optimal vegetation index reflects regional variations in phenological expression. Specifically, the pronounced defoliation cycle in Hainan Island generates strong NDVI contrasts, whereas the more attenuated phenological amplitude in Vietnam makes the chlorophyll-sensitive CIgreen a more effective discriminator.
Figure 6.
Spectral index separability analysis and RPDI construction results for Hainan Island. Qualitative visual comparisons of (a) true color image, (b) MSI image, (c) NDVI image, and (d) RPDI image, with rubber plantations and natural forests labeled in panel (a) for reference. Distribution analysis: violin plots illustrating the distribution characteristics of (e) MSI, (f) NDVI, and (g) RPDI for rubber plantations and other forest types, where wider sections indicate higher data density. (h) Comparison of Jeffries–Matusita (JM) distances among the six individual spectral indices and the RPDI for both study regions. The JM distance ranges from 0 to 2, with higher values indicating greater class separability between rubber plantations and other forest types.
Based on the selected index pairs and the phenological nodes extracted in Section 4.1, RPDI time series were constructed for both study regions. The violin plots in Figure 6e–g illustrate the distributional characteristics of the individual indices and the RPDI for rubber plantations and other forest types. While MSI and NDVI exhibited considerable distributional overlap between the two classes, the RPDI showed markedly improved separation, with rubber plantation samples concentrated within clearly distinct value ranges. This improvement confirms that the multiplicative combination of VI and WI, further enhanced by the time-weighting function, effectively amplifies the coupled phenological signal unique to rubber plantations. Quantitatively, the RPDI achieved JM distances of 1.816 and 1.602 in Hainan Island and Vietnam, respectively, substantially exceeding the values obtained for the best-performing individual indices in both regions (1.411 and 1.195). These results demonstrate that RPDI consistently outperforms any single spectral index in distinguishing rubber plantations from other forest types and retains substantial discriminative capability even under the more attenuated phenological conditions observed in Vietnam.
To quantify the contribution of each component in the RPDI formulation, an ablation study was conducted using the DBSCAN-based spatial-block training and test subsets described in Section 3.5. Three variant models were evaluated: RPDI without the time-weighting function (RPDI_w/o_T), RPDI without the VI difference (RPDI_w/o_VI), and RPDI without the WI difference (RPDI_w/o_WI). As presented in Table 1, removing the time-weighting function decreased the OA to 86.36% in Hainan and 85.50% in Vietnam. Removing the VI difference resulted in an OA of 86.93% and 83.91%, while excluding the WI difference caused a substantial drop to 85.79% and 86.62%, respectively. These results confirm that all three components are essential under the more conservative spatial-block evaluation protocol, with each ablated variant showing a consistent, non-trivial reduction in performance relative to the complete RPDI in both regions.
Table 1.
Ablation study results for the RPDI components in Hainan Island and Vietnam, evaluated on the DBSCAN-based spatial-block test subsets.
Furthermore, to assess the statistical significance of the improvements, McNemar’s test with Yates’ continuity correction was applied to the classification results of the complete RPDI (Scheme 3) against each ablated variant and each comparative feature scheme, using the same DBSCAN-based spatial-block test subsets, using the same DBSCAN-based spatial-block test subsets. To avoid conflating two conceptually distinct sets of hypotheses, p-values were adjusted using the Holm-Bonferroni step-down procedure separately within two comparison families in each region: an ablation family (RPDI vs. RPDI_w/o_T, RPDI_w/o_VI, and RPDI_w/o_WI; three comparisons) and a comparative-scheme family (RPDI vs. Scheme 1, Scheme 2, Scheme 4, and Scheme 5; four comparisons), yielding four independent applications of the Holm procedure in total (Table 2). In Hainan Island, the complete RPDI achieved statistically significant improvements (adjusted p < 0.05) over all three ablated variants (RPDI_w/o_T, RPDI_w/o_VI, RPDI_w/o_WI) and over Schemes 1, 2, and 4; the improvement over Scheme 5 was numerically positive but did not reach statistical significance (adjusted p = 0.109), likely reflecting the smaller test sample size in this region (n = 176). In Vietnam, the complete RPDI achieved statistically significant improvements (adjusted p < 0.05) over all three ablated variants and over all four comparative schemes, including Scheme 5 (adjusted p = 0.040), on a larger test sample (n = 628). These results indicate that the individual contributions of the time-weighting function, the VI difference, and the WI difference, as well as the overall advantage of the RPDI formulation over raw spectral- or index-stacking approaches, remain statistically robust under the more conservative spatial-block evaluation protocol.
Table 2.
Pairwise McNemar’s test results (with Yates’ continuity correction and Holm-Bonferroni-adjusted p-values for multiple comparisons) comparing the classification performance of the complete RPDI (Scheme 3) against each ablated RPDI variant and each comparative feature-combination scheme, evaluated on the DBSCAN-based spatial-block test subsets for Hainan Island and Vietnam. n denotes the number of test samples in each region; b and c denote, respectively, the number of discordant samples misclassified only by the compared scheme and misclassified only by Scheme 3.
Regarding computational efficiency, the PARM framework operates as a modular pipeline on the Google Earth Engine (GEE) cloud platform. While the initial phenological node extraction and JM distance calculation require limited processing time per region, the subsequent RPDI generation and Random Forest classification are highly parallelizable and efficient. The entire workflow can process thousands of satellite scenes within hours, making it highly suitable for rapid, large-scale implementation. The robustness of the framework in changing environments is inherently addressed by its adaptive design: rather than relying on fixed spectral–temporal thresholds, the pipeline dynamically calibrates temporal anchors and optimal indices to local climatic conditions, ensuring stable procedural adaptability across regions with pronounced phenological contrasts, while the resulting numerical parameters themselves remain region-specific (Section 4.5).
4.3. Rubber Plantation Classification Performance
Under the spatial-block partitioning protocol described in Section 3.5, the proposed PARM framework (Scheme 3) achieved strong classification performance within the Dynamic World forest mask in both study regions. All accuracy metrics reported in this section are therefore conditional on this mask: they reflect the model’s ability to distinguish rubber plantations from other forest types within the masked area, rather than representing unconditional mapping accuracy for the entire study region. In Hainan Island, the DBSCAN-based spatial-block test subset yielded an overall accuracy (OA) of 92.04%, a Kappa coefficient of 0.8409, and an F1 score of 0.9186, while the fully held-out Qionghai City subregion yielded an OA of 93.57%, a Kappa coefficient of 0.8711, and an F1 score of 0.9391. In Vietnam, the spatial-block test subset yielded an OA of 91.24%, a Kappa coefficient of 0.8248, and an F1 score of 0.9120, while the fully held-out Gia Lai province subregion yielded an OA of 91.00%, a Kappa coefficient of 0.8191, and an F1 score of 0.9161. For comparison, the original random 70/30 split—retained here for reference only—yielded higher accuracies of 95.24% and 93.38% OA in Hainan Island and Vietnam, respectively (Table 3); the modest reduction observed under the spatial-block protocol is consistent with the removal of spatial-autocorrelation-driven inflation and indicates that the random-split results modestly overestimated the model’s true generalization performance. The slightly lower accuracy in Vietnam relative to Hainan Island under both evaluation protocols remains consistent with the more attenuated phenological amplitude and greater spatial heterogeneity discussed in Section 4.1. Nevertheless, both regions attained Kappa coefficients exceeding 0.82 and F1 scores above 0.91 under the more conservative spatial-block protocol, demonstrating that the robust classification capability of the PARM framework is not merely an artifact of sample-level spatial autocorrelation. Full confusion matrices for both test subsets in each region are provided in Table A2 (Hainan Island) and Table A3 (Vietnam). Producer’s and user’s accuracies, and per-class F1 scores derived from these confusion matrices are summarized in Table A4.
Table 3.
Classification accuracy comparison across three feature combination schemes for Hainan Island and Vietnam, evaluated on the DBSCAN-based spatial-block test subsets (Section 3.5). For Scheme 3, results are additionally reported for the fully held-out subregion test subset (Qionghai City for Hainan Island; Gia Lai province for Vietnam). Values in parentheses, reported only for Scheme 3, correspond to the original random 70/30 partitioning protocol, retained here solely for reference against the spatial-block results.
Comparative experiments across the three feature schemes, evaluated on the DBSCAN-based spatial-block test subsets, confirmed the advantages of the adaptive framework (Table 3). In Hainan Island, Scheme 1 (Spectral Bands + Elevation) achieved an OA of 82.95%, a Kappa coefficient of 0.6590, and an F1 score of 0.8255. Scheme 2 (Spectral Indices + Elevation) improved the classification performance to an OA of 86.36%, a Kappa coefficient of 0.7272, and an F1 score of 0.8604. Scheme 3 achieved the highest performance across all evaluation metrics (OA = 92.04%). Similar trends were observed in Vietnam: Scheme 1 attained an OA of 80.25%, a Kappa coefficient of 0.6049, and an F1 score of 0.8092, while Scheme 2 reached an OA of 81.52%, a Kappa coefficient of 0.6304, and an F1 score of 0.8215, both substantially lower than the OA of 91.24% obtained using Scheme 3. McNemar’s test confirmed that the improvement of Scheme 3 over both Scheme 1 and Scheme 2 was statistically significant in both regions (Holm-adjusted p < 0.05; see Section 4.2). These findings demonstrate a consistent, statistically supported stepwise improvement from raw spectral features to individual spectral indices, and further to the RPDI-based formulation, under the more conservative spatial-block evaluation protocol.
To further validate the superiority of the PARM framework over conventional multi-temporal classification approaches, two additional comparative schemes were introduced: Scheme 4 (Sentinel-1 VV and VH time series + Elevation) and Scheme 5 (Sentinel-1 and Sentinel-2 time series + Elevation), both evaluated on the DBSCAN-based spatial-block test subsets. As shown in Table 4, Scheme 4 achieved an OA of 69.31% in Hainan Island and 71.17% in Vietnam, indicating that SAR time series alone lack the spectral discriminability to effectively separate rubber plantations from other forests. Scheme 5 improved the OA to 88.63% and 87.89%, respectively, by integrating optical and SAR time series. However, the complete PARM framework (Scheme 3) still outperformed Scheme 5 by 3.41% and 3.35% in the two regions. McNemar’s test indicated that this improvement was statistically significant in Vietnam (Holm-adjusted p = 0.040) but did not reach significance in Hainan Island (Holm-adjusted p = 0.109), likely owing to the smaller test sample size available for that region (n = 176); this is discussed as a limitation in Section 5.4. Nevertheless, both the consistent numerical advantage across regions and the statistically confirmed improvement in Vietnam demonstrate that simply stacking multi-source time-series data is insufficient to fully address regional phenological heterogeneity. The adaptive phenological node extraction and locally calibrated RPDI in the PARM framework contribute additional, largely stable discriminative power beyond raw multi-source stacking, which is the critical advantage for rapid, large-scale rubber plantation monitoring.
Table 4.
Classification accuracy comparison across two additional comparative schemes for Hainan Island and Vietnam, evaluated on the DBSCAN-based spatial-block test subsets (Section 3.5).
The spatial distribution results are presented in Figure 7. In Hainan Island, rubber plantations are predominantly concentrated in the northern and central regions, forming large contiguous areas with high plantation density. In Vietnam, rubber plantations are primarily distributed in the northern highland regions (c) and the southeastern lowlands (d), with comparatively sparse coverage along the central coastal zone. The zoomed-in panels further demonstrate that the proposed method accurately delineates large-scale industrial plantations across diverse terrain conditions; for fragmented smallholder plots, delineation remains feasible but is comparatively less reliable, with residual errors concentrated at plot edges and in mixed pixels (Section 4.4).
Figure 7.
Spatial distribution of rubber plantations mapped using the proposed RPDI-based method in (a,b) Hainan Island and (c,d) Vietnam. The values shown in the color scale represent the percentage of rubber plantation area within each 1 km2 pixel, with higher values indicating greater rubber plantation density. Zoomed-in panels (a1,a2,b1,b2) illustrate representative plantation areas in the northern and central regions of Hainan Island, respectively, while panels (c1,c2,d1,d2) show rubber plantations in the northern highland regions and southeastern lowlands of Vietnam, respectively. For each zoomed-in panel, the true-color imagery (left) and the corresponding classification result (right) are displayed for comparison.
While detailed confusion matrices and spatial error maps are not exhaustively tabulated here, the fundamental design of the RPDI specifically targets the primary confusion between rubber plantations and natural evergreen forests by amplifying their distinct phenological differences. Residual classification errors predominantly occur in highly fragmented smallholder plots or edge pixels where mixed land-cover signals compromise the purity of the temporal phenological signatures.
4.4. Error Structure and Failure Case Analysis
While the PARM framework achieved high overall accuracies, a detailed examination of the confusion matrix reveals specific structural characteristics in the classification errors. For the rubber class, the asymmetries between producer’s and user’s accuracy are modest (≤4.3 percentage points) and their direction differs among the four test subsets: omission of rubber slightly exceeds commission in the Vietnam spatial-block test and the Qionghai City held-out subregion, whereas commission slightly exceeds omission in the Hainan Island spatial-block test and the Gia Lai held-out subregion (Table A4). These small, mixed asymmetries indicate that the model both occasionally fails to identify actual rubber areas and occasionally labels other forest types as rubber—challenges fundamentally tied to the pronounced landscape heterogeneity across the study regions. To elucidate the error structures and evaluate the model’s generalizability boundaries in complex scenarios, we conducted a detailed analysis of several typical failure cases associated with landscape fragmentation and data anomalies (Figure 8).
Figure 8.
Typical failure cases and error structure analysis of the PARM framework in heterogeneous landscapes. For each scenario, the columns display: (a1,b1,c1) high-resolution Google Earth imagery, (a2,b2,c2) Sentinel-1 VH polarization backscatter time series, and (a3,b3,c3) the corresponding classification result. In the VH time series plots, vertical dashed lines mark the extracted phenological nodes: leaf-off start (LOS), fastest greening point (FGP), and full canopy point (FCP). “Min” and “Max” denote the annual minimum and maximum VH backscatter coefficients, respectively.
The first representative failure case involves the complete omission of a rubber plot, accompanied by a severely anomalous VH backscatter time series. In this scenario, the annual extrema of the VH time series exhibit a significant temporal mismatch relative to the standard defoliation and leaf-flushing rhythm of typical rubber plantations. This failure is primarily driven by two factors. First, these plots may consist of immature stands that have not yet developed a stable, mature canopy structure capable of producing the consistent seasonal defoliation dynamics required for SAR detection. Second, localized microclimate variations or severe terrain-induced geometric distortions (e.g., SAR shadowing) can significantly alter the microwave backscatter characteristics, obscuring the expected seasonal amplitude variations. Consequently, the phenological extraction module fails to establish reliable temporal anchors, leading to a breakdown in the subsequent RPDI construction and a complete omission of the target plot.
A second category of failure presents as patchy, localized omission, despite the aggregated VH time series conforming to the normal phenological dynamics of rubber trees. Here, while the overall temporal trajectory successfully captures the typical dry-season defoliation and wet-season leaf flushing, specific pixels within the plot remain misclassified. This spatial inconsistency is predominantly a direct consequence of the spatial fragmentation characteristic of smallholder plantations. In these highly fragmented landscapes, the edge mixed-pixel effect is prevalent. Mixed pixels integrate the phenological signals of rubber trees with those of adjacent non-forest features (e.g., croplands, water bodies, or bare soil), thereby diluting the distinct backscatter signature of rubber plantations. Furthermore, micro-topographic relief introduces localized variations in soil moisture and incidence angles, which further weakens the discriminative features at the pixel level, preventing the classifier from maintaining spatial consistency across the heterogeneous plot.
The third scenario illustrates a more complex structural error, where a plot was partially identified even though its VH time series completely contradicts the logical growth cycle of rubber trees—such as a severely advanced or anomalously timed canopy peak. This paradox highlights the vulnerabilities associated with coupling optical and SAR features. The root cause of this misclassification lies in residual cloud contamination within the optical imagery. Severe cloud cover can cause distortions in the reconstructed spectral indices (e.g., abnormal spikes in NDVI or MSI) during the Savitzky–Golay filtering process. When these distorted optical signals are integrated into the RPDI formulation, they can artificially inflate the discrimination index. During the multi-source feature joint decision-making process within the Random Forest classifier, these spurious optical signals may dominate and mask the anomalous microwave backscatter, misleading the model into generating false positives. This case underscores the inherent challenge in multi-source data fusion: while SAR provides robust phenological anchors, the reliance on optical indices for fine-scaled physiological characterization remains susceptible to atmospheric interference.
Collectively, these error structures and failure cases demonstrate that the PARM framework’s accuracy is fundamentally constrained by the purity of input data and the consistency of the environmental context. Although the model exhibits robust performance in structurally intact, mature, and spatially continuous commercial plantations, its generalizability is challenged in highly heterogeneous scenarios. Spatial fragmentation, stand immaturity, and multi-source data distortions collectively compromise the integrity of the temporal phenological signatures. Future enhancements of the framework should focus on implementing stricter quality control for optical index reconstruction, incorporating texture or object-based features to mitigate mixed-pixel effects in smallholder landscapes, and exploring the integration of L-band SAR to improve structural sensitivity under weak phenological contrasts.
4.5. Direct Cross-Region Transfer Experiment
To explicitly distinguish the procedural adaptability of the PARM workflow from the direct transferability of its calibrated parameters, a direct cross-region transfer experiment was conducted following the protocol described in Section 3.5. In this experiment, the complete RPDI formulation calibrated in one region—including its SAR-derived phenological nodes (LOS, FGP, FCP), Jeffries–Matusita-selected optimal vegetation and water indices, and time-weighting parameters—was transplanted without modification to the other region; only the Random Forest classifier was retrained on the target region’s own training samples, and classification performance was evaluated on the same DBSCAN-based spatial-block and fully held-out subregion test subsets used in Section 4.3.
Applying the Hainan-calibrated RPDI to Vietnam yielded an overall accuracy of 86.46% (Kappa = 0.7292) on the spatial-block test subset and 85.12% (Kappa = 0.6997) on the fully held-out Gia Lai subregion. Applying the Vietnam-calibrated RPDI to Hainan yielded an overall accuracy of 84.65% (Kappa = 0.6927) on the spatial-block test subset and 82.56% (Kappa = 0.6511) on the fully held-out Qionghai subregion. Relative to the region-specific, recalibrated results reported in Table 3 (Scheme 3), direct parameter transfer in both directions produced a reduction of approximately 5 to 11 percentage points in OA and approximately 0.10 to 0.22 in Kappa (Table 5).
Table 5.
Classification accuracy of the direct cross-region transfer experiment, in which the complete RPDI formulation (phenological anchors, optimal VI/WI, and time-weighting parameters) calibrated in the source region was applied without recalibration to the target region; only the Random Forest classifier was retrained on the target region’s own training samples. ΔOA and ΔKappa denote the reduction relative to the corresponding region-specific, recalibrated results in Table 3 (Scheme 3).
These results indicate that, although the direct-transfer models still achieve moderate classification accuracy—reflecting the fact that LOS, FGP, and FCP retain broadly similar physical meaning across regions and that MSI remains a discriminative water index in both study areas (Section 4.2)—the fixed RPDI parameters and phenological anchors are not directly transferable across regions without a non-trivial accuracy cost. This finding confirms that the high accuracies reported in Section 4.3 depend specifically on region-specific recalibration of the phenological anchors, the optimal spectral indices, and the RPDI time-weighting function, rather than on the existence of a single, universally transferable RPDI. This is precisely the motivation underlying the adaptive, cascading-constraint design of the PARM framework: the procedure itself—SAR-based phenological node extraction, JM-guided index selection, and locally anchored RPDI construction—generalizes across heterogeneous phenological regimes, whereas the resulting numerical parameters do not.
5. Discussion
5.1. Topographic and Climatic Distribution of Mapped Rubber Plantations
The topographic and climatic distribution characteristics of mapped rubber plantations were analyzed for both study regions (Figure 9). It should be noted that these patterns represent mapped distributions derived from classification results and may be subject to classification uncertainties, particularly in steep terrain or fragmented smallholder landscapes. However, the overall spatial consistency between the mapped patterns and official agricultural statistics validates the observed topographic and climatic preferences of rubber plantations.
Figure 9.
Topographic and climatic distribution characteristics of mapped rubber plantations in (a) Hainan Island and (b) Vietnam. For each region, the left panel illustrates the bivariate distribution of rubber plantation density across gradients of annual minimum temperature and annual total precipitation. The upper-right panel shows the dominance and cumulative percentage of rubber plantation area across elevation ranges, while the lower-right panel presents the corresponding distributions across slope ranges. Dominance is defined as the ratio of the proportion of rubber plantation area within a given interval to the overall proportion of rubber plantation area. Percentage represents the share of rubber plantation area within each interval relative to the total land area in that interval. Dashed red boxes indicate the principal elevation and slope ranges in which rubber plantations are predominantly distributed. Dashed ellipses in the left panels denote distinct cultivation zones identified within climate space.
In Hainan Island, rubber plantations occupy a single, well-defined climatic zone characterized by annual minimum temperatures of 13–14 °C and annual total precipitation of 1800–2200 mm. This cluster corresponds to the warm and moderately humid conditions typical of traditional tropical cultivation regions. Elevation analysis indicates that rubber plantations are predominantly distributed between 30 and 210 m above sea level. Slope analysis further shows that plantations are mainly concentrated on gentle to moderate terrain with slopes ranging from 2° to 12°. These distribution patterns are consistent with the topographic characteristics of Hainan Island, where the mountainous central region restricts rubber cultivation primarily to the surrounding plains and foothill areas.
In Vietnam, two distinct cultivation zones are identified within climate space. The first is a cool–wet zone associated with high-elevation cultivation in northern Vietnam, characterized by lower annual minimum temperatures (approximately 4–10 °C) and high annual precipitation (2800–3500 mm). The second is a warm–moderate precipitation zone corresponding to traditional tropical cultivation in the lowland and southeastern regions, with annual minimum temperatures of approximately 16–22 °C and annual precipitation ranging from 2000 to 3000 mm. This bimodal pattern in climate space is also reflected in the elevation distribution. Rubber plantations in Vietnam are concentrated within two distinct elevation ranges: 0–700 m and 1700–2700 m, corresponding to traditional lowland cultivation and highland expansion in northern Vietnam, respectively. Slope analysis indicates that rubber plantations are similarly concentrated on gentle to moderate terrain with slopes ranging from 2° to 12°, which is consistent with the agronomic requirements of rubber cultivation.
The cross-regional consistency in slope preference (2–12° in both regions) suggests that terrain gradient constraints on rubber cultivation are broadly similar across the two study areas. In contrast, elevation thresholds and climatic conditions differ substantially between regions, with Hainan Island being confined to a single warm-moderate cultivation zone, whereas Vietnam supports two climatically distinct cultivation systems. These distribution patterns are physically plausible and consistent with known rubber cultivation practices in both regions.
5.2. Regional Phenological Heterogeneity and Implications for the Adaptive Framework
The phenological analysis results from the two study regions reveal fundamental differences in the seasonal dynamics of rubber plantations, which directly motivate and validate the adaptive design of the proposed framework.
In Hainan Island, the pronounced seasonal cycle reflects the strong monsoon forcing associated with the island’s location along the northern tropical margin, where distinct dry-season moisture deficits drive synchronized and near-complete defoliation across rubber plantations (Section 4.1). In Vietnam, the considerably attenuated cycle—roughly half the amplitude observed in Hainan Island—instead reflects the spatial averaging of contrasting phenological regimes across the country’s broad latitudinal extent, particularly the dampening influence of southern equatorial regions, where year-round favorable temperature and moisture conditions reduce the intensity and synchronization of seasonal defoliation. Although Vietnam exhibits substantial north–south climatic and phenological heterogeneity, the proposed framework successfully applied a unified regional extraction process across the entire country. The robust classification accuracy achieved on both independent test subsets without complex sub-regional parameterization (Section 4.3, Table 3) demonstrates the framework’s resilience to macro-climatic variations. This stability and computational efficiency are key advantages for rapid, large-scale operational mapping, avoiding the over-parameterization often required by pixel-level or zone-level phenological inversion.
This choice of a single, country/island-level calibration unit, rather than a finer agro-climatic or administrative stratification, reflects two considerations. First, reliable extraction of the SAR-derived phenological anchors and JM-distance-based index selection requires an adequately sized and spatially distributed training sample within each calibration unit; several of the sub-regions examined above (e.g., Qionghai City, individual Vietnamese provinces) contain too few field-verified samples to support independent phenological node extraction and index selection without a substantial expansion of the sampling effort. Second, a primary design goal of PARM is rapid, large-scale operational mapping (Section 4.2), which favors a small number of well-supported calibration units over a larger number of thinly supported ones. Two lines of evidence in the present results speak to whether finer stratification would nonetheless enhance robustness. On one hand, the fully held-out Qionghai City and Gia Lai province subregions, evaluated using phenological anchors, indices, and RPDI weights calibrated at the country/island level, achieved accuracies (93.57% and 91.00%) comparable to, or exceeding, the corresponding spatial-block test accuracies (92.04% and 91.24%; Table 3), indicating that country-level calibration already generalizes well to these particular sub-regions without further recalibration. On the other hand, the local-scale analysis above also shows that phenological amplitude is not spatially uniform within Vietnam, with northern provinces (e.g., Son La) exhibiting distinctly clearer signals than southern ones (e.g., Binh Phuoc); because the aggregate Vietnam-wide RPDI is calibrated on the spatially averaged signal, it may under-weight the sharper contrasts available in the northern sub-region and over-weight the more attenuated southern one, so an agro-climatic stratification tailored to this north–south gradient could plausibly sharpen JM-distance-based index selection and RPDI weighting specifically where the aggregate phenological signal is weakest. We therefore regard sub-national, agro-climatic calibration not as a correction to the present results but as a complementary refinement—most promising in exactly the equatorial, low-amplitude zones identified in Section 5.4 as the framework’s principal current limitation—and a natural extension of the phenological parameter database proposed there.
These regional phenological differences directly propagated through all subsequent steps of the framework, producing region-specific outcomes at each step (Section 4.2). The optimal vegetation index differed between regions—NDVI in Hainan Island, where pronounced defoliation generates strong greenness contrasts between rubber and other forest types, and the chlorophyll-sensitive CIgreen in Vietnam, whose attenuated phenological amplitude favors a more subtle discriminator—whereas MSI was selected as the optimal water index in both regions, and the locally extracted phenological nodes anchored the RPDI time-weighting to each region’s own leaf-flushing transition period, during which rubber plantations differ most distinctly from natural forests.
These results illustrate a key principle of the proposed framework: the performance improvement over fixed-parameter approaches arises not from the use of a single universally optimal index, but from the adaptive calibration of the entire processing pipeline to local phenological conditions. Because phenological timing, amplitude, and the most discriminative spectral indices all vary across regions, no single RPDI formulation can be directly transferred without recalibration. This expectation is directly confirmed by the cross-region transfer experiment reported in Section 4.5, which demonstrates that the fixed RPDI parameters themselves are not transferable, even though the underlying procedure is. The proposed framework addresses this limitation by establishing a repeatable, data-driven procedure consisting of SAR-based phenological node extraction, JM-guided index selection, and locally anchored RPDI construction, thereby generating region-specific outputs tailored to local phenological regimes. The consistent stepwise improvement from Scheme 1 to Scheme 3 observed in both study regions further confirms the effectiveness of this adaptive design across contrasting phenological conditions, ranging from the pronounced monsoon-driven defoliation cycle of Hainan Island to the more attenuated and spatially heterogeneous phenology observed in Vietnam.
5.3. Comparison with Existing Rubber Plantation Mapping Methods
The proposed PARM framework addresses several well-documented limitations of existing rubber plantation mapping methods.
Early phenology-based approaches relied on MODIS time-series data, which enabled continental-scale mapping but were constrained by their coarse spatial resolution (250 m), limiting the ability to delineate plantation boundaries and detect fragmented smallholder plots. The subsequent transition to Landsat-based methods improved spatial detail to 30 m; however, optical time-series approaches remain fundamentally constrained by persistent cloud cover in tropical regions. This limitation creates temporal gaps in the phenological record and introduces uncertainties in parameter extraction, particularly during the wet season. By employing Sentinel-1 SAR data as the primary source for phenological characterization, the proposed framework directly addresses these limitations. The all-weather, day-and-night observation capability of SAR ensures continuous temporal coverage regardless of cloud conditions, while the 10-m spatial resolution of Sentinel-1 enables precise delineation of both large-scale industrial plantations and small fragmented smallholder plots, as demonstrated by the zoomed-in mapping panels in Figure 7.
Broader comparisons with rubber mapping studies in other countries further contextualize our framework’s performance. For example, studies in Thailand and Myanmar using Landsat or multi-source fusion have typically achieved accuracies between 85% and 92%, often relying on fixed phenological windows. Our framework’s adaptive calibration allows it to maintain accuracies of 91–94% across complex climatic gradients under a spatially independent evaluation protocol that explicitly guards against spatial autocorrelation-driven inflation. These figures are not, however, directly comparable with those of the aforementioned studies, given the differences in study areas and sampling designs; they are cited here solely as contextual reference points.
Previous SAR-based studies have reported classification accuracies of up to 89% when SAR data were combined with phenological features. In comparison, the proposed framework achieved overall accuracies of 92.04% and 91.24% in Hainan Island and Vietnam, respectively; as above, this difference reflects different study areas, reference samples, and validation protocols rather than a controlled, like-for-like comparison. More importantly, most previous SAR applications in this field have used SAR primarily as a supplementary data source for tasks such as boundary delineation or forest/non-forest stratification, rather than the primary basis for phenological characterization. This study demonstrates that Sentinel-1 VH backscatter time series can independently support reliable extraction of key phenological nodes, thereby enabling the construction of a phenologically informed discrimination index without relying on optical phenological metrics. These findings illustrate a more central role for SAR in tropical plantation mapping than the auxiliary or structural roles it has typically occupied in previous applications.
Compared to multi-source fusion approaches that integrate optical and SAR data using pre-selected spectral indices, the PARM framework introduces two additional components: a data-driven index selection step based on JM distance and an adaptive time-weighting function anchored to locally extracted phenological nodes. Together, these components enable the framework to respond dynamically to regional phenological variability rather than relying on a fixed spectral–temporal signature for rubber plantations. Importantly, the framework does not prescribe a single universally transferable index. Instead, it establishes a replicable procedural workflow that generates region-specific outputs calibrated to local phenological conditions. The parallel regional validation results, which demonstrate robust performance across two regions with substantially different phenological amplitudes and climatic regimes, support the procedural adaptability of the framework’s underlying logic even when the specific index formulations differ between regions; the direct cross-region transfer experiment reported in Section 4.5 further shows that this adaptability resides in the procedure itself rather than in the resulting numerical parameters, which incur a substantial accuracy penalty when transferred directly.
We note that a direct quantitative comparison between PARM and deep learning-based classifiers was outside the scope of the present study, since such a comparison would require a standardized benchmark across both frameworks’ respective sample requirements and computational budgets; we identify this as a valuable direction for future work.
5.4. Limitations and Directions for Future Research
The most significant limitation of the present study is the absence of direct validation of the SAR-derived phenological proxy nodes (LOS, FGP, FCP) against ground-based phenological observations or an independent phenology product (e.g., MCD12Q2). Because the current validation relies on a single year (2025) of data and no repeated ground phenological survey was conducted at the study sites, it was not possible to quantitatively verify whether the SAR-derived extrema and derivative-based dates correspond precisely to the discrete onset of leaf shedding or canopy closure that direct field monitoring would measure. The literature-based cross-check presented in Table A1 and discussed in Section 4.1 offers qualitative support for the physical plausibility of the extracted nodes but does not substitute for such validation, and it does not resolve the circular-reasoning concern that classification accuracy alone cannot serve as evidence for node validity. Users of the PARM framework should therefore treat LOS, FGP, and FCP as SAR-derived phenological proxies whose temporal precision relative to true biological transition events has not been independently confirmed. Future work should validate the extracted nodes against field phenological diaries, camera-trap phenological records, or established phenology products across multiple years and sites, allowing both the accuracy of the nodes and their interannual stability to be assessed.
This proxy interpretation is reinforced, rather than undermined, by the environmental cross-check reported in Section 4.1. While VH backscatter is jointly sensitive to canopy structure and rainfall- or soil-moisture-driven dielectric conditions, the standardized preprocessing (radiometric terrain correction and speckle filtering) mitigates much of this environmental noise, and the independent GLDAS/CHIRPS comparison shows that the extracted LOS and FCP dates track sustained seasonal moisture forcing—in the case of FCP, a lagged, growth-mediated response to the monsoon rainy season rather than an instantaneous rainfall artifact. Because the framework extracts relative temporal dynamics and macroscopic temporal anchors for classification purposes rather than absolute biophysical parameters, this residual sensitivity to environmental conditions does not compromise the stability of large-scale mapping. Nevertheless, single-polarization VH backscatter cannot fully separate structural from moisture-related contributions, which is precisely why the extracted nodes are treated throughout as phenological proxies rather than literal biophysical measurements.
A second, practical limitation concerns the region-specific nature of the PARM pipeline. The complete workflow—SAR-based phenological node extraction, JM distance-based index selection, and RPDI construction—must be executed independently for each new study region, so the resulting RPDI is not a fixed, universally applicable index; its formulation varies with the selected spectral indices and the locally extracted phenological timing. The direct cross-region transfer experiment in Section 4.5 quantifies this limitation directly: applying a region-specific RPDI without recalibration to the other region reduced OA by approximately 5–11 percentage points and Kappa by approximately 0.10–0.22 relative to the recalibrated, region-specific results, confirming that region-specific recalibration is a substantive requirement rather than a procedural formality. This recalibration burden, however, is not evenly distributed across the RPDI’s components: a grid-search sensitivity analysis of the time-weighting parameters (; ; 35 combinations in total) showed that overall accuracy fluctuated by no more than 1 percentage point in either region, indicating that it is the phenological anchors and the selected spectral indices—not the time-weighting parameters—that actually require region-specific calibration. This grid search, however, holds both the Savitzky–Golay smoothing parameters and the phenological anchors themselves fixed, and therefore does not address two related questions. The first is whether the extracted LOS, FGP, and FCP dates, and the resulting classification accuracy, are sensitive to the choice of smoothing window and polynomial order; while Section 3.2 explains why a 5-point, second-order filter was chosen on smoothing-span and curvature-tracking grounds, a systematic sensitivity analysis varying these parameters (e.g., window sizes of 3, 5, 7, and 9 points and polynomial orders of 1 to 3) has not been conducted. The second is whether the RPDI and classification accuracy are sensitive to uncertainty in the node positions themselves: because LOS, FGP, and FCP are derived from empirical extrema and a first-derivative maximum of a smoothed but still noisy backscatter series, their estimated dates carry some uncertainty, and a perturbation analysis—recomputing the RPDI and re-evaluating classification accuracy after shifting each node by a range of fixed offsets (e.g., ±5, ±10, and ±15 days), individually and in combination—would help establish how much this uncertainty propagates to the final mapping accuracy. Neither the smoothing-parameter sensitivity analysis nor the node-position perturbation analysis was conducted in the present study; we identify both explicitly here as further, closely related directions for future work, complementary to the weighting-parameter sensitivity analysis reported above. Future research could reduce this remaining recalibration burden by developing a phenological parameter database for major rubber-growing regions across Southeast Asia, pre-characterizing typical LOS, FGP, and FCP ranges by climatic zone.
A third limitation concerns the statistical power of the significance testing under the spatial-block evaluation protocol. Although the complete RPDI (Scheme 3) numerically outperformed all ablated variants and comparative schemes in both regions, its improvement over Scheme 5 (stacked Sentinel-1 and Sentinel-2 time series without the RPDI formulation) did not reach statistical significance in Hainan Island after Holm–Bonferroni correction (adjusted p = 0.109; n = 176), in contrast to the significant improvement observed in Vietnam (adjusted p = 0.040; n = 628). This discrepancy most likely reflects the smaller test sample available in Hainan Island rather than a genuine absence of benefit from the RPDI formulation; larger, independently collected validation samples would help confirm the RPDI’s advantage over simple multi-source stacking in regions with limited sample availability.
A fourth limitation concerns the framework’s dependence on a detectable SAR phenological signal. In areas where rubber plantations exhibit minimal seasonal defoliation—particularly equatorial regions where year-round favorable temperature and moisture suppress the leaf-renewal cycle—the amplitude of VH backscatter variation may be too small for reliable identification of the three phenological nodes, which in turn reduces the discriminative capability of the resulting RPDI. This constraint is reflected in the lower overall accuracy observed in Vietnam (91.24%) relative to Hainan Island (92.04%) and in the sparser rubber detection in Vietnam’s southern coastal regions. Integrating L-band SAR, which penetrates deeper into the canopy, is a promising direction for supplying complementary structural information where phenological contrast is weak.
A fifth set of limitations relates to residual data-quality and sampling constraints. The framework’s reliance on Sentinel-1 VH backscatter leaves it susceptible to residual speckle noise and terrain-induced geometric distortion, and although Sentinel-2 cloud masking was stringent, residual cloud contamination can still bias the reconstructed spectral indices. On the sample side, the field-survey-and-visual-interpretation strategy is labor-intensive, may retain some subjectivity in ambiguous cases, and may carry small geolocation errors in fragmented smallholder plots; and while the total sample size of 3065 points was adequate for the present analysis, it may limit generalizability when the framework is applied to more fragmented or mixed-species plantation landscapes [48]. Relatedly, although stand age was recorded for each sample point and the sampling design sought to include a range of ages where present in the field (Section 2.2.2), the survey was not explicitly stratified by stand age, and young, structurally immature plantations are consequently likely underrepresented relative to mature commercial stands; this is consistent with the observation in Section 4.4 that immature stands are disproportionately associated with node-extraction failures and, by extension, with omission errors. A deliberately age-stratified sampling design, oversampling young and structurally heterogeneous stands, would allow the framework’s performance on this specific sub-population to be evaluated directly rather than inferred from failure-case analysis alone, and is a natural companion to the automated sample-generation strategies noted below. Future work could incorporate volunteered geographic information and automated sample generation from existing plantation databases to improve sample representativeness while reducing collection costs.
Finally, the use of the Dynamic World “trees” category as a forest mask, while appropriate for isolating the rubber-versus-other-forest discrimination task, has an important consequence for interpreting the reported accuracy metrics. As noted in Section 2.2.1, this mask may exclude young rubber plantations (<3 years old) or highly fragmented smallholder plots that Dynamic World misclassifies as shrubland or cropland, likely leading to an underestimate of the total mapped rubber area. All overall accuracy, Kappa, and F1-score values reported in this study are therefore conditional on the forest mask—they quantify the model’s ability to discriminate rubber plantations from other forest types within the masked area, not unconditional mapping accuracy for the entire study region—which limits direct comparability with methods that perform full land-cover classification without a pre-applied mask. A comprehensive accuracy assessment that incorporates non-forest classes directly into the classification scheme, without relying on a pre-existing forest mask, remains an important direction for future work; such a re-classification was not feasible within the current revision cycle. A more immediately tractable step toward quantifying the resulting omission error would be to compute the proportion of the 3065 field-verified samples, and, where feasible, the proportion of mapped rubber area in trial unmasked classifications, that fall outside the Dynamic World “trees” class; we identify this sample- and area-based quantification as a specific, near-term extension of the future work noted above.
6. Conclusions
This study proposed a Phenology-Adaptive Rubber Plantation Mapping (PARM) framework for rubber plantation mapping across heterogeneous tropical regions. The framework integrates Sentinel-1 SAR time series with optimally selected spectral indices through a three-step adaptive pipeline, thereby addressing the persistent cloud cover and regional phenological variability that constrain existing approaches.
The framework extracts three phenological nodes—leaf-off start (LOS), fastest greening point (FGP), and full canopy point (FCP)—directly from SAR backscatter time series, enabling reliable phenological characterization without relying on optical data. A data-driven index selection procedure based on the Jeffries–Matusita distance is then used to identify the optimal combination of vegetation and water indices for each study region. Based on the selected indices and locally extracted phenological nodes, a time-weighted Rubber Plantation Discrimination Index (RPDI) is subsequently constructed for each region. The RPDI emphasizes critical phenological transition periods and amplifies the coupled signals of canopy greenness and moisture dynamics. Because both the index selection and temporal anchoring are calibrated to local phenological conditions, the RPDI represents a region-specific process output generated by the adaptive framework rather than a fixed universal index.
Independent, region-specific validation in Hainan Island and Vietnam, conducted under a spatial-block partitioning protocol designed to prevent samples from the same plantation from occurring in both training and test subsets, demonstrated robust within-mask classification performance, with overall accuracies of 92.04% and 91.24% on the spatial-block test subsets (93.57% and 91.00% on the fully held-out Qionghai City and Gia Lai province subregions), respectively, and Kappa coefficients exceeding 0.82 on the spatial-block test subsets in both regions. A complementary direct cross-region transfer experiment showed that applying the RPDI parameters calibrated in one region to the other without recalibration reduced OA by approximately 5–11 percentage points, confirming that this performance depends on region-specific recalibration rather than on directly transferable parameters. The PARM framework consistently outperformed classification schemes based on raw spectral bands or individual spectral indices and reliably mapped large-scale industrial plantations across diverse terrain and climate conditions; performance on highly fragmented smallholder plots was comparatively weaker, with residual omission errors concentrated in mixed edge pixels (Section 4.4). We emphasize that all reported accuracies are conditional on the Dynamic World forest mask and reflect a single year (2025) of satellite observations and field samples; the mapped rubber area therefore likely represents a conservative estimate that may exclude young or highly fragmented plantations (Section 2.2.1 and Section 5.4).
Phenological analysis revealed substantial regional differences in the seasonal dynamics of rubber plantations. Hainan Island exhibited pronounced defoliation cycles, with VH backscatter amplitudes exceeding 2.0 dB, reflecting strong monsoon forcing along the northern tropical margin. In contrast, Vietnam exhibited more attenuated phenological signals, with amplitude variations of approximately 1.0 dB, consistent with the spatial averaging of contrasting climate regimes across its broad latitudinal extent. These differences further validate the necessity of adaptive approaches for rubber plantation monitoring across Southeast Asia.
The modular design of the framework enables systematic adaptation to new regions through a repeatable procedural workflow, although each deployment still requires independent execution of the phenological extraction and index selection pipeline, and the SAR-derived phenological nodes remain empirical proxies whose temporal precision has not been validated against ground-based phenological observations—together, these constitute the prime constraints of the present framework (Section 5.4). Future research should focus on developing phenological parameter databases for major rubber-growing regions, integrating L-band SAR data to improve performance in equatorial zones, and exploring automated sample generation strategies to enhance model generalizability. Overall, this study demonstrates that SAR-based phenological characterization can serve as the primary foundation for rubber plantation mapping in cloud-prone tropical regions, thereby providing a methodological basis for procedurally portable, region-adaptive monitoring systems that support sustainable land management and forest conservation.
Author Contributions
Conceptualization, Z.C. and C.W.; methodology, Z.C. and P.X.; software, Z.C. and P.X.; validation, C.W. and S.H.; formal analysis, W.W.; investigation, P.L. and P.X.; resources, C.W.; data curation, Z.C.; writing—original draft preparation, Z.C. and P.X.; writing—review and editing, C.W. and S.H.; visualization, Z.C.; supervision, C.W.; project administration, C.W.; funding acquisition, C.W. All authors have read and agreed to the published version of the manuscript.
Funding
This work is supported by the National Key Research and Development Program of China [2024YFC3811004], the Natural Science Foundation of Hubei Province [grant number 2024AFB551], the Major Science and Technology Special Projects and Key R & D Projects in Yunnan Province in 2024 (No. 202403ZC380001).
Data Availability Statement
The raw data supporting the conclusions of this article will be made available by the authors on request.
Acknowledgments
During the preparation of this manuscript/study, the authors used ChatGPT (OpenAI, GPT-5) for the purpose of text polishing and language refinement. The authors have reviewed and edited the output and take full responsibility for the content of this publication. The numerical calculations in this paper have been done on the supercomputing system in the Supercomputing Center of Wuhan University.
Conflicts of Interest
The authors declare no conflicts of interest.
Appendix A
Figure A1.
Daily Sentinel-1 VH backscatter (smoothed; blue), CHIRPS daily precipitation (red), and GLDAS soil moisture (green) time series for 2025 in (a) Hainan Island and (b) Vietnam. Vertical dashed lines mark the extracted phenological proxy nodes: leaf-off (LOS, red), fastest-greening (FGP, orange), and full-canopy (FCP, green). “Min” and “Max” denote the annual minimum and maximum VH backscatter coefficients used to define LOS and FCP, respectively.
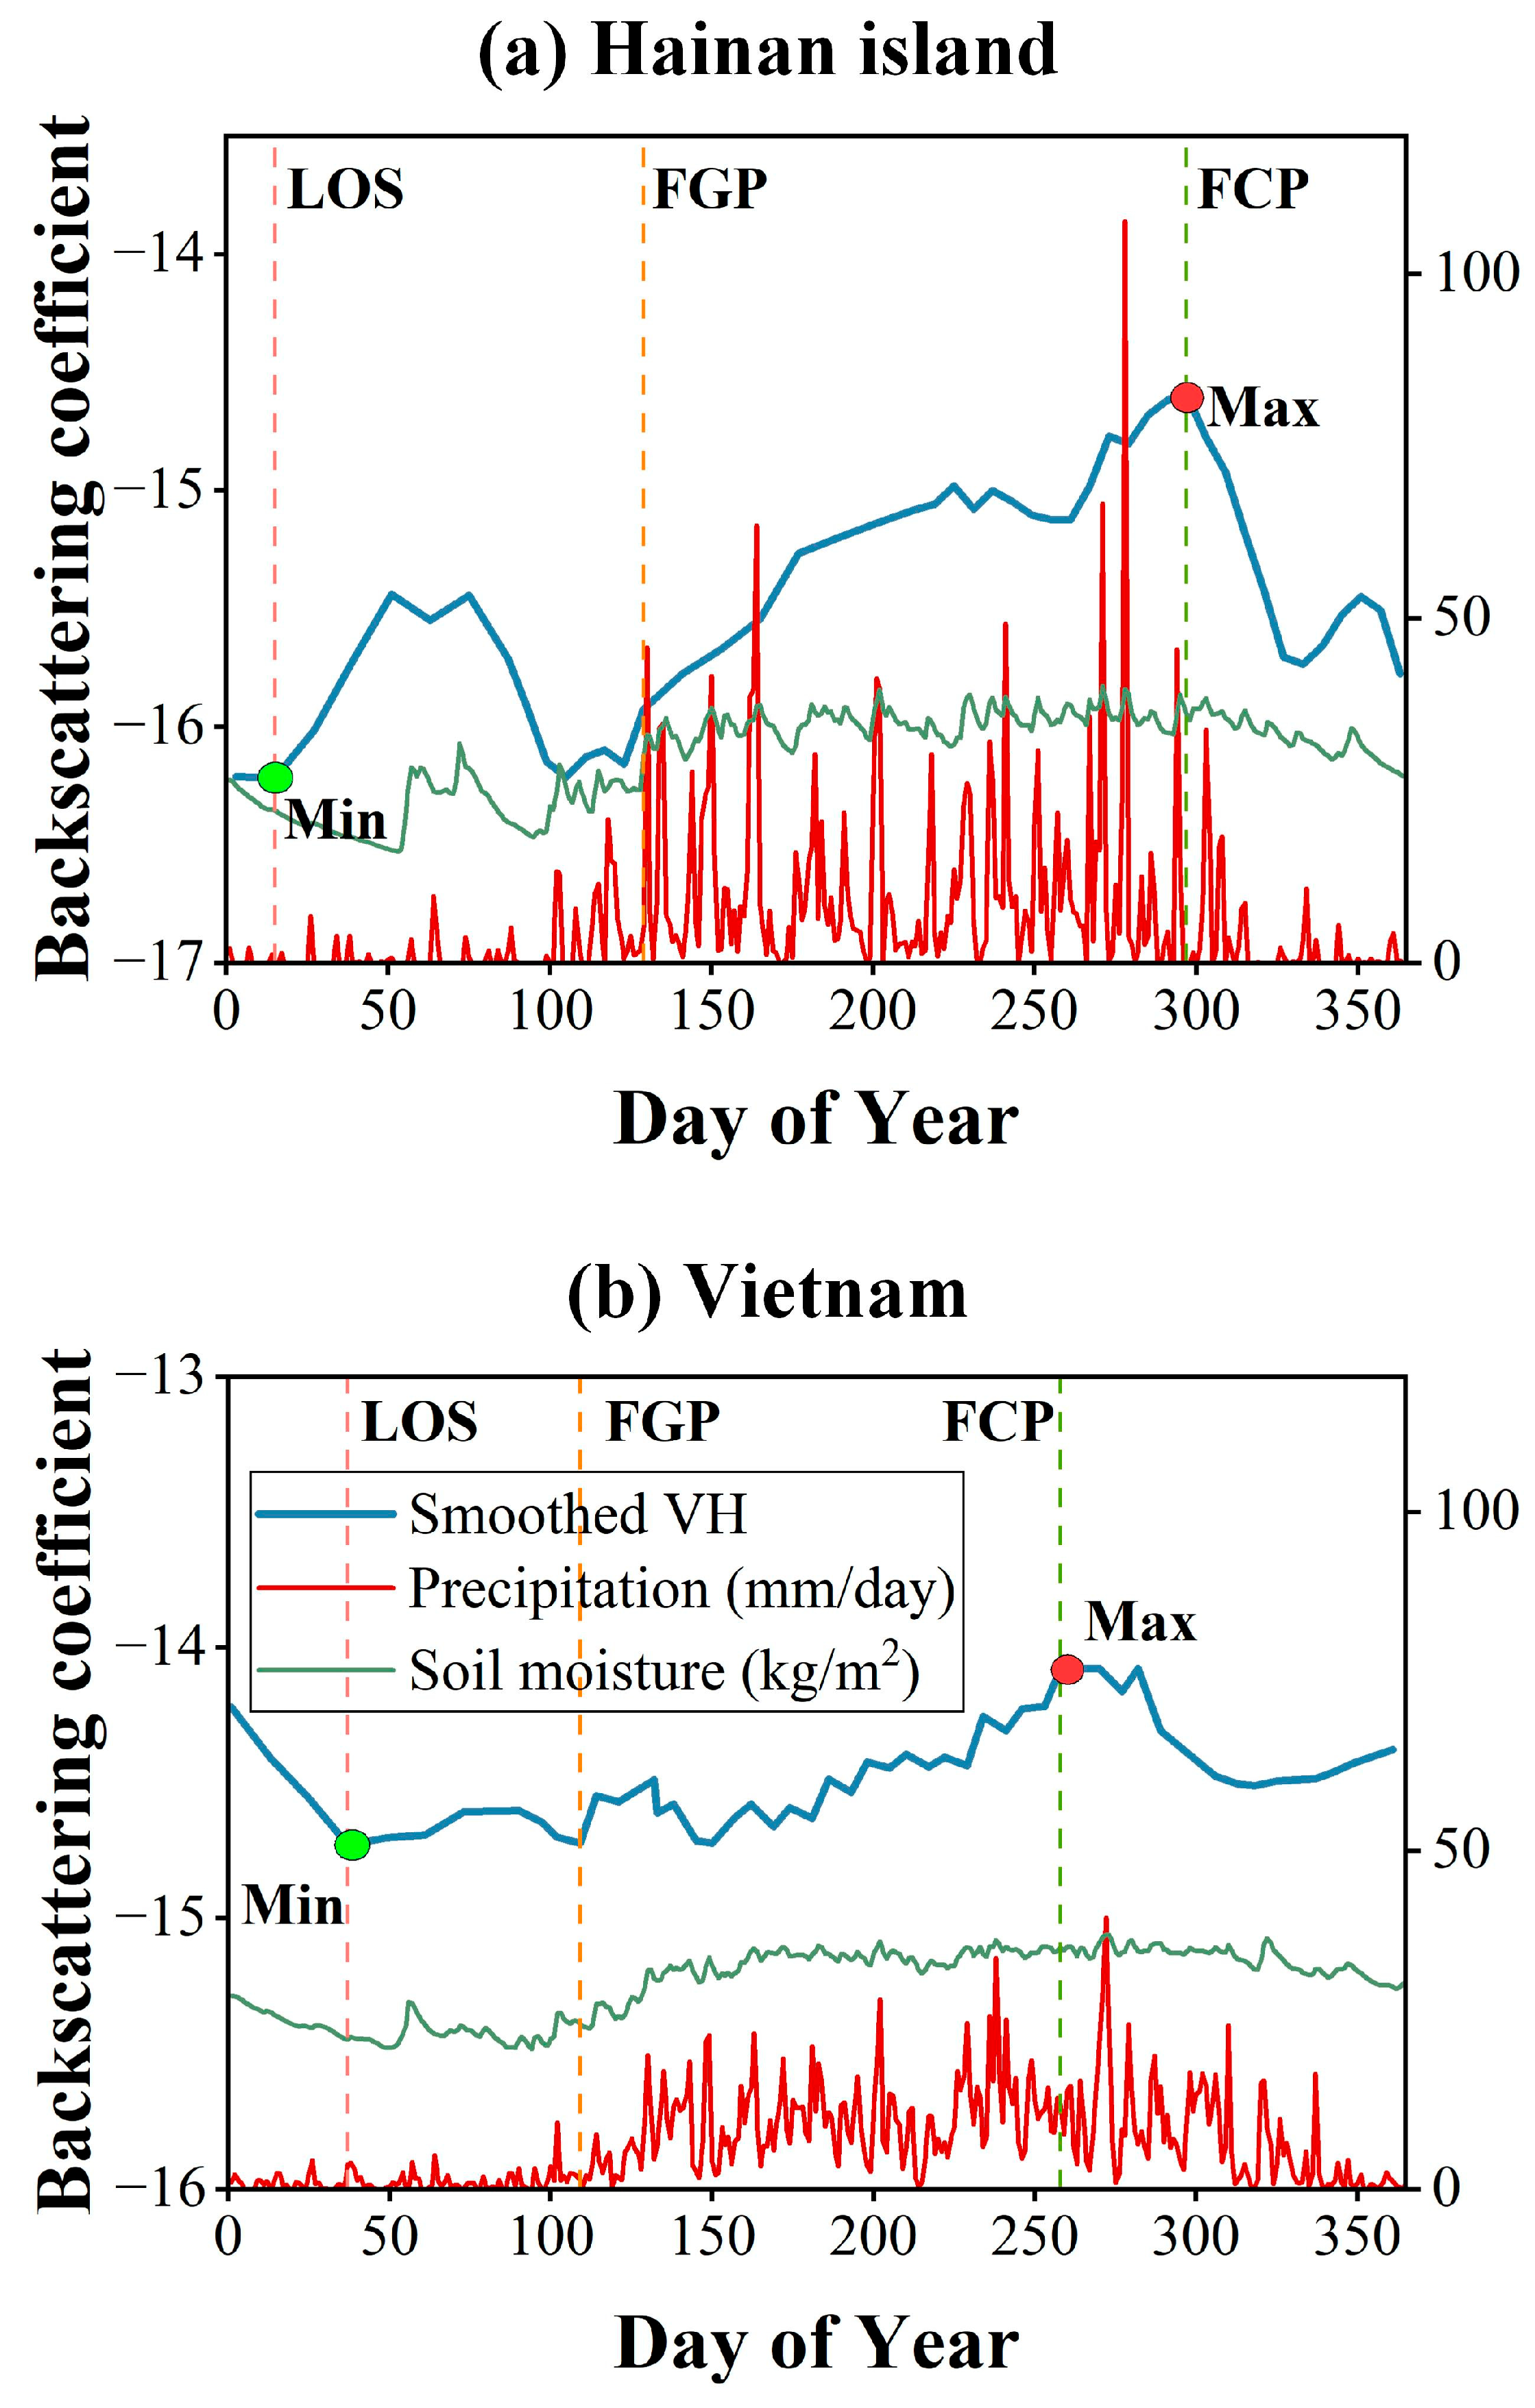
Table A1.
Literature-based cross-check of SAR-derived phenological proxy nodes (LOS, FGP, FCP) against independently reported phenological timing windows for rubber plantations in Hainan Island and Vietnam/mainland Southeast Asia. All reference studies are independent of the Sentinel-1 VH backscatter signal and the classification results reported in this study.
Figure A2.
Spatial distribution of the number of valid (cloud-free) Sentinel-2 observations and the maximum single cloud-gap length (days) between consecutive valid observations in 2025: (a) valid observation count for Hainan Island, (b) maximum cloud-gap length for Hainan Island, (c) valid observation count for Vietnam, and (d) maximum cloud-gap length for Vietnam.
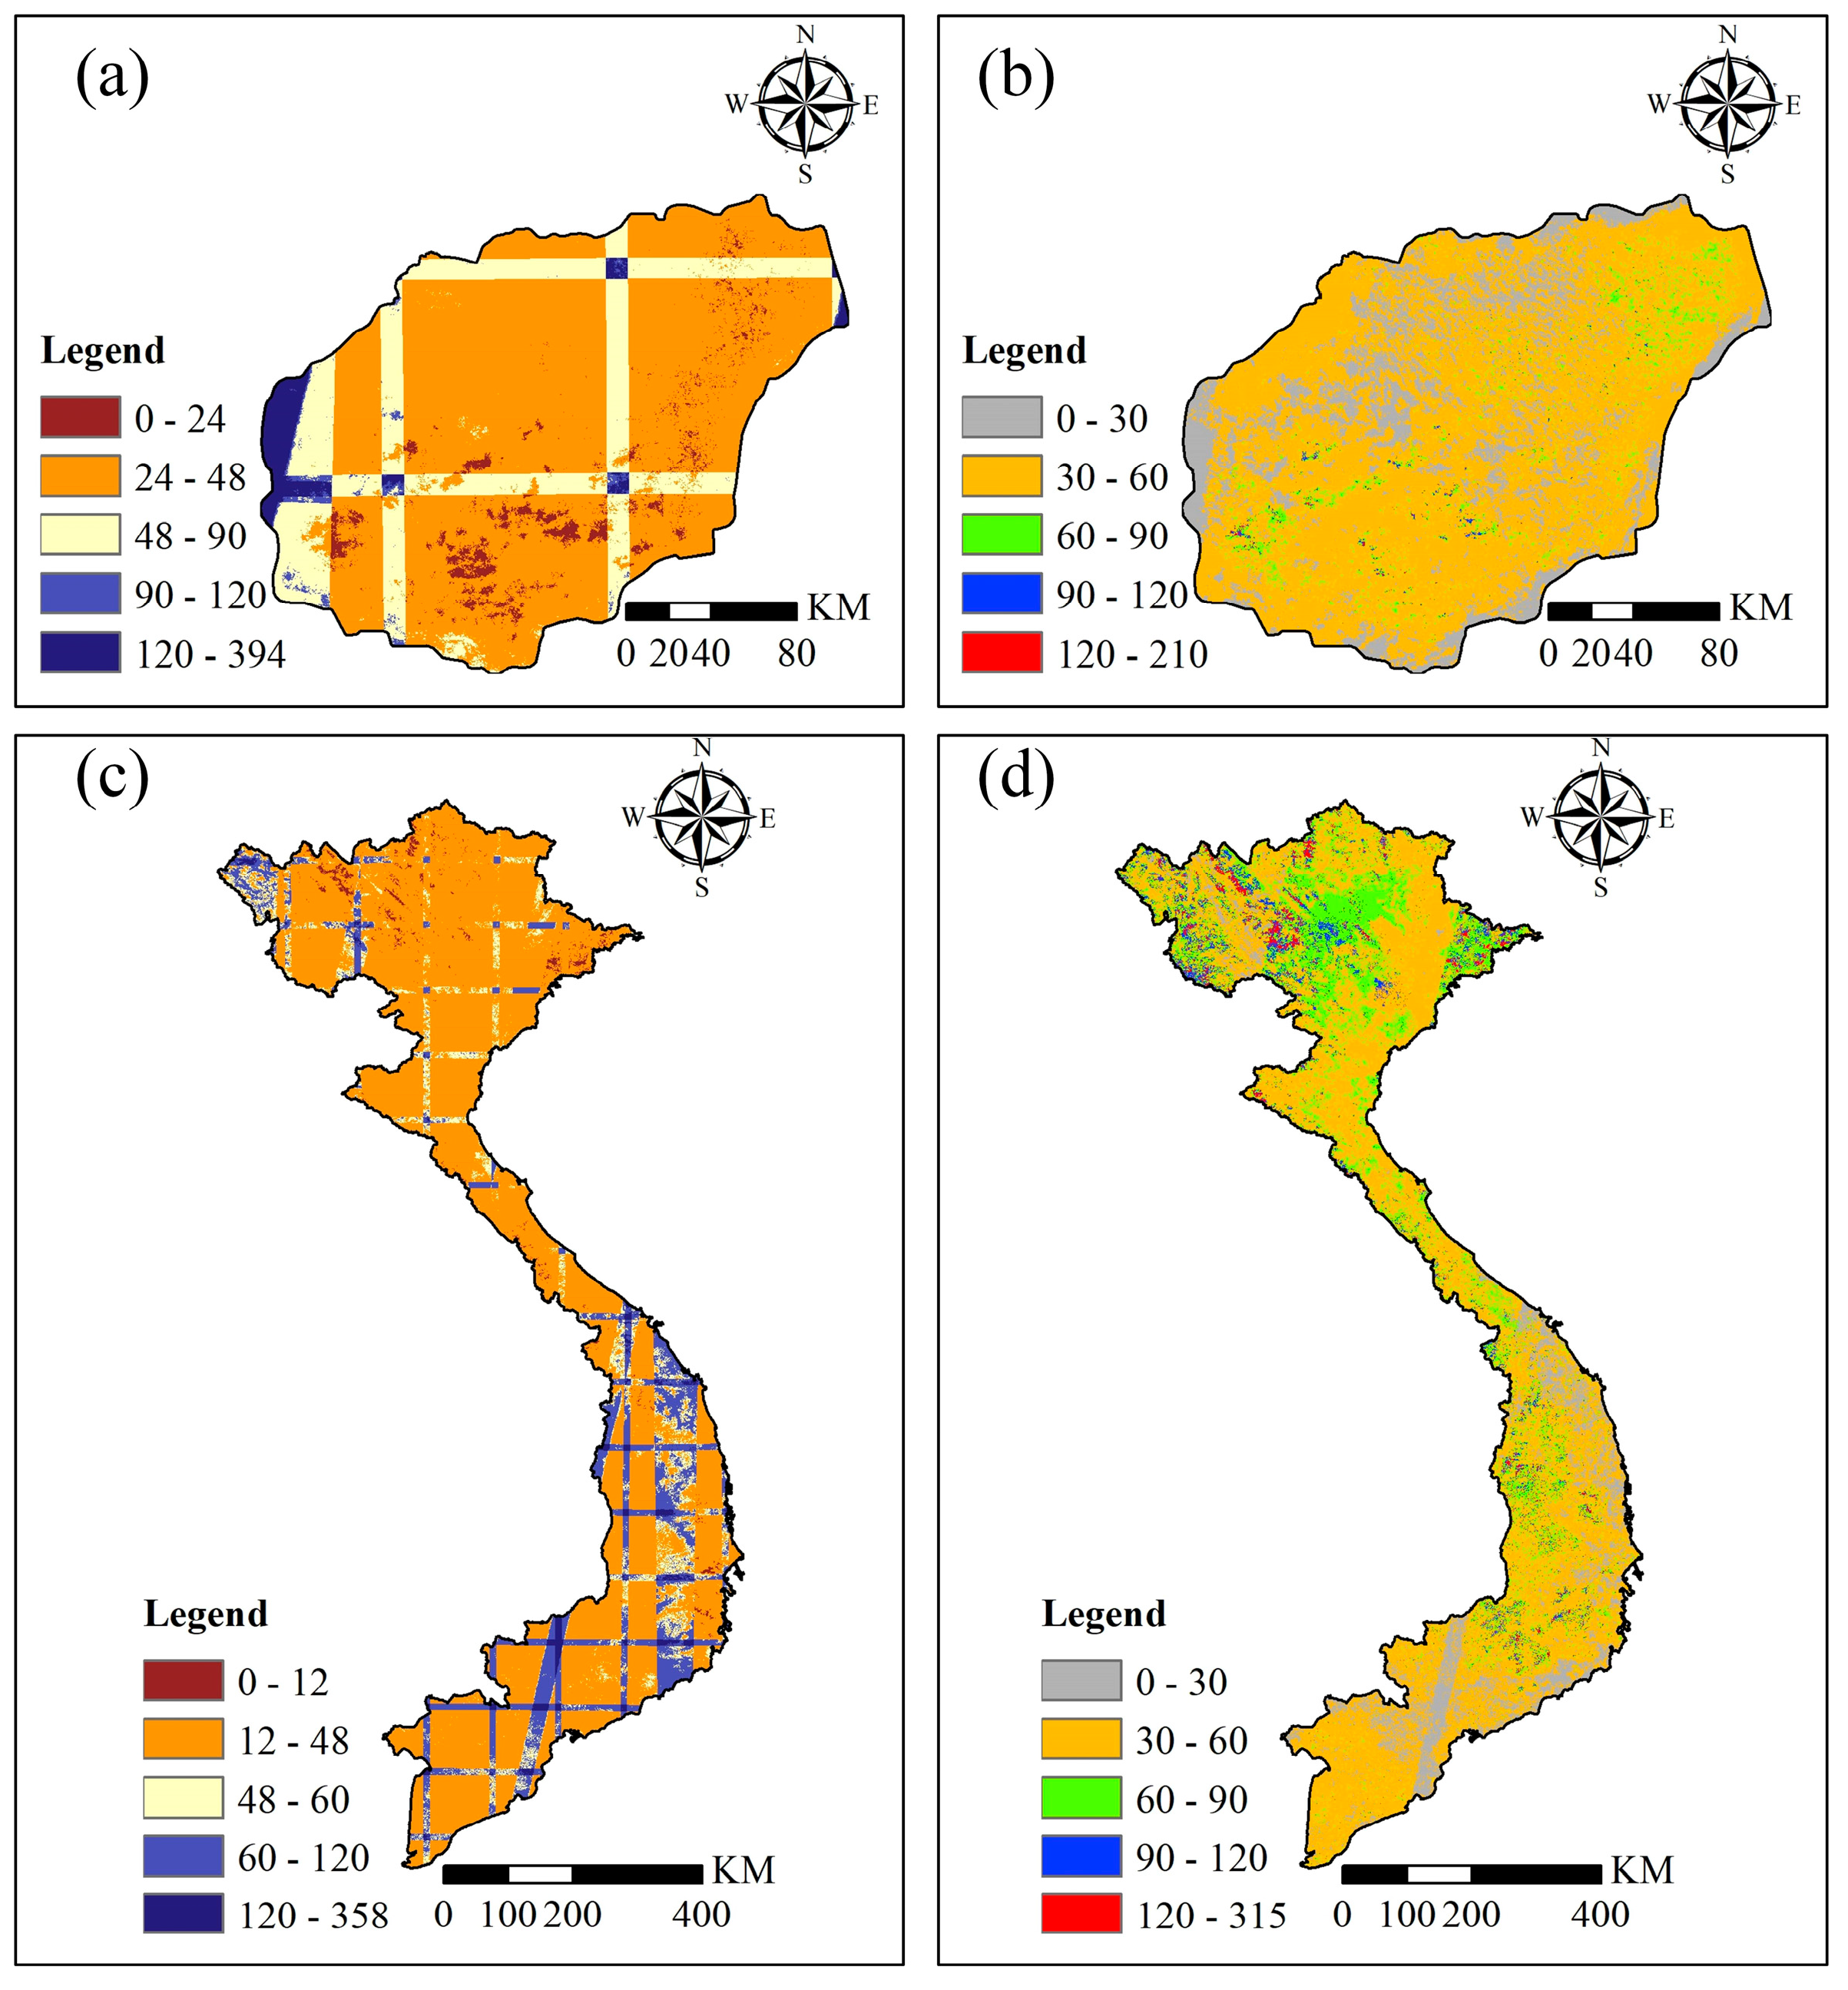
Figure A3.
Frequency distributions of the number of valid Sentinel-2 observations in 2025 for (a) Hainan Island and (b) Vietnam, and of the maximum single cloud-gap length (days) for (c) Hainan Island and (d) Vietnam. The dashed red line and adjacent label mark the 90th-percentile value of each distribution.
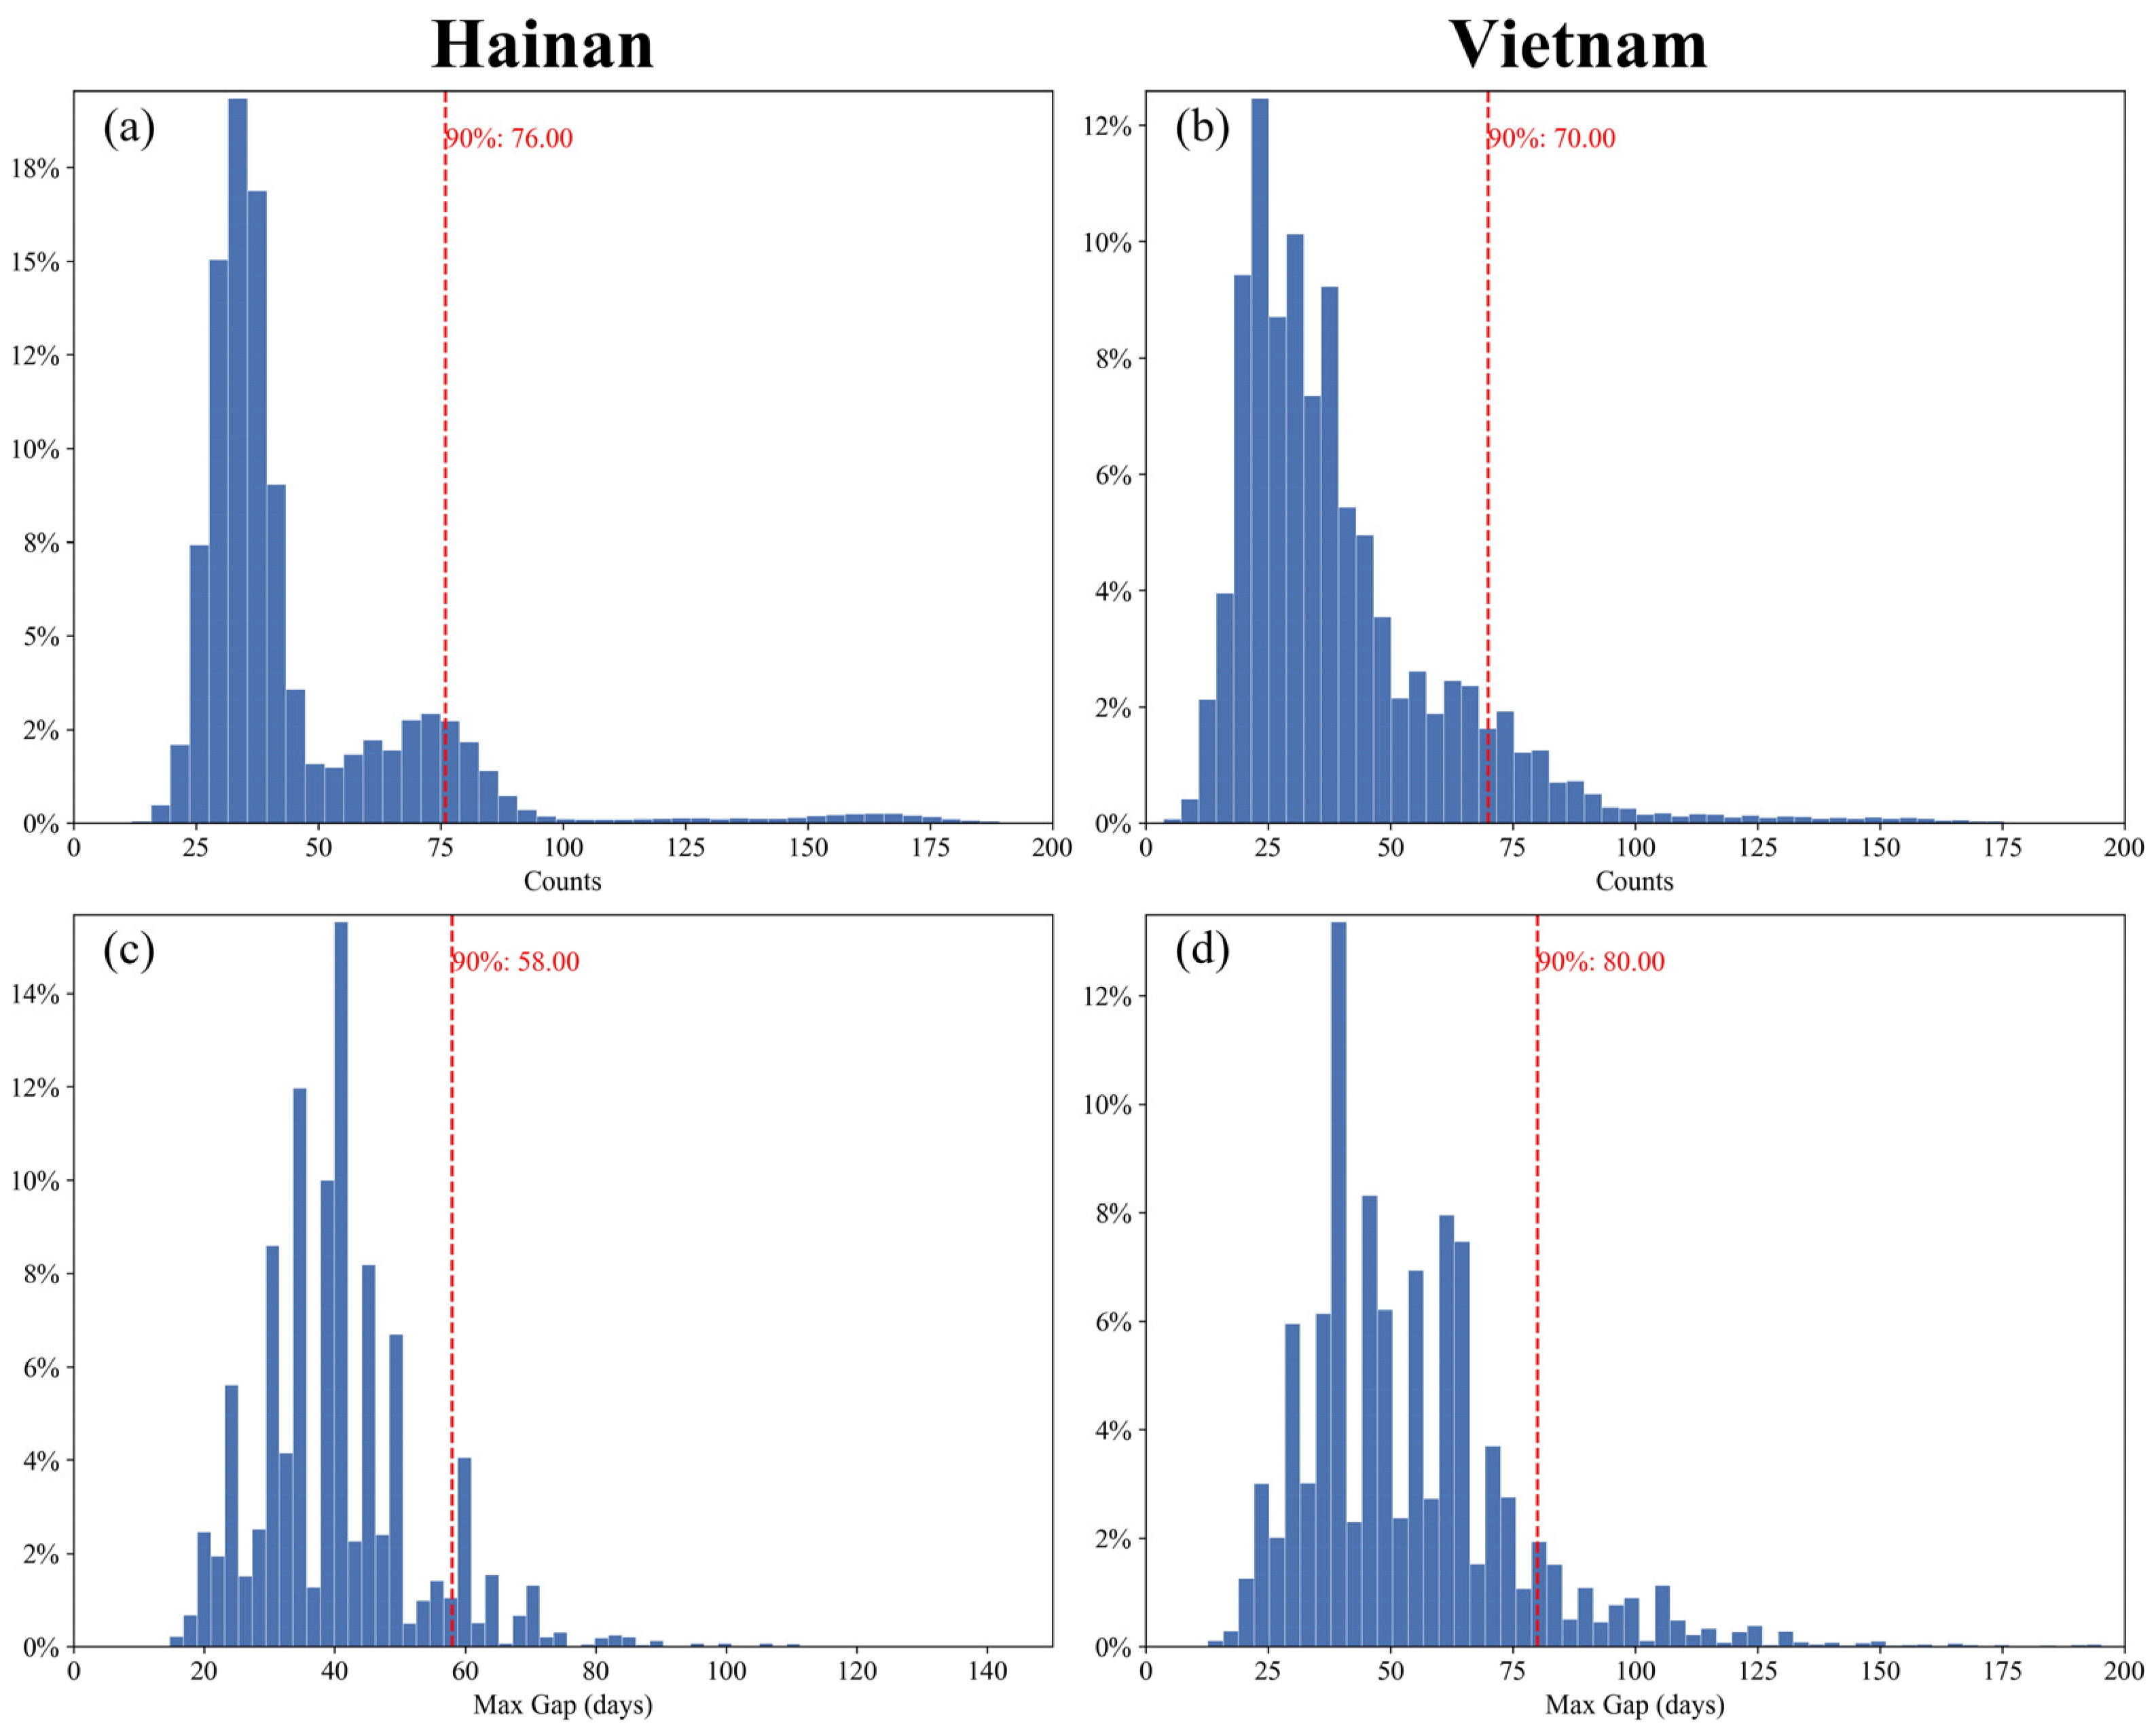
Table A2.
Confusion matrices for Hainan Island on the spatial-block test subset and the fully held-out Qionghai City subregion (Section 3.5). Predicted/Actual classes are Rubber and Other Forest.
Table A3.
Confusion matrices for Vietnam on the spatial-block test subset and the fully held-out Gia Lai province subregion (Section 3.5). Predicted/Actual classes are Rubber and Other Forest.
References
- Fox, J.; Castella, J.-C.; Ziegler, A.D. Swidden, rubber and carbon: Can REDD+ work for people and the environment in Montane Mainland Southeast Asia? Glob. Environ. Change 2014, 29, 318–326. [Google Scholar] [CrossRef] [Scilit]
- Tang, C.; Yang, M.; Fang, Y.; Luo, Y.; Gao, S.; Xiao, X.; An, Z.; Zhou, B.; Zhang, B.; Tan, X.; et al. The rubber tree genome reveals new insights into rubber production and species adaptation. Nat. Plants 2016, 2, 16073. [Google Scholar] [CrossRef] [Scilit] [PubMed]
- Warren-Thomas, E.M.; Edwards, D.P.; Bebber, D.P.; Chhang, P.; Diment, A.N.; Evans, T.D.; Lambrick, F.H.; Maxwell, J.F.; Nut, M.; O’Kelly, H.J.; et al. Protecting tropical forests from the rapid expansion of rubber using carbon payments. Nat. Commun. 2018, 9, 911. [Google Scholar] [CrossRef] [Scilit] [PubMed]
- Stibig, H.J.; Achard, F.; Carboni, S.; Raši, R.; Miettinen, J. Change in tropical forest cover of Southeast Asia from 1990 to 2010. Biogeosciences 2014, 11, 247–258. [Google Scholar] [CrossRef] [Scilit]
- Myers, N.; Mittermeier, R.A.; Mittermeier, C.G.; da Fonseca, G.A.B.; Kent, J. Biodiversity hotspots for conservation priorities. Nature 2000, 403, 853–858. [Google Scholar] [CrossRef] [Scilit] [PubMed]
- Wang, Y.; Hollingsworth, P.M.; Zhai, D.; West, C.D.; Green, J.M.H.; Chen, H.; Hurni, K.; Su, Y.; Warren-Thomas, E.; Xu, J.; et al. High-resolution maps show that rubber causes substantial deforestation. Nature 2023, 623, 340–346. [Google Scholar] [CrossRef] [Scilit] [PubMed]
- Wang, Y.; Sun, Y.; Cao, X.; Wang, Y.; Zhang, W.; Cheng, X. A review of regional and Global scale Land Use/Land Cover (LULC) mapping products generated from satellite remote sensing. ISPRS J. Photogramm. Remote Sens. 2023, 206, 311–334. [Google Scholar] [CrossRef] [Scilit]
- Hansen, M.C.; Potapov, P.V.; Moore, R.; Hancher, M.; Turubanova, S.A.; Tyukavina, A.; Thau, D.; Stehman, S.V.; Goetz, S.J.; Loveland, T.R.; et al. High-resolution global maps of 21st-century forest cover change. Science 2013, 342, 850–853. [Google Scholar] [CrossRef] [Scilit] [PubMed]
- Grogan, K.; Pflugmacher, D.; Hostert, P.; Mertz, O.; Fensholt, R. Unravelling the link between global rubber price and tropical deforestation in Cambodia. Nat. Plants 2019, 5, 47–53. [Google Scholar] [CrossRef] [Scilit] [PubMed]
- Mitchard, E.T.A. The tropical forest carbon cycle and climate change. Nature 2018, 559, 527–534. [Google Scholar] [CrossRef] [Scilit] [PubMed]
- Singh, A.K.; Liu, W.; Zakari, S.; Wu, J.; Yang, B.; Jiang, X.J.; Zhu, X.; Zou, X.; Zhang, W.; Chen, C.; et al. A global review of rubber plantations: Impacts on ecosystem functions, mitigations, future directions, and policies for sustainable cultivation. Sci. Total Environ. 2021, 796, 148948. [Google Scholar] [CrossRef] [Scilit] [PubMed]
- Yue, Z.; Xiao, C.; Feng, Z.; Wang, Y.; Yan, H. Accelerating decline of habitat quality in Chinese border areas. Resour. Conserv. Recycl. 2024, 206, 107665. [Google Scholar] [CrossRef] [Scilit]
- Fischer, J.; Riechers, M.; Loos, J.; Martin-Lopez, B.; Temperton, V.M. Making the UN Decade on Ecosystem Restoration a Social-Ecological Endeavour. Trends Ecol. Evol. 2021, 36, 20–28. [Google Scholar] [CrossRef] [Scilit] [PubMed]
- Miles, L.; Kapos, V. Reducing Greenhouse Gas Emissions from Deforestation and Forest Degradation: Global Land-Use Implications. Science 2008, 320, 1454–1455. [Google Scholar] [CrossRef] [Scilit] [PubMed]
- Oliveira, G.M.; Ziegert, R.F.; Pacheco, A.; Berning, L.; Sotirov, M.; Dürr, J.; Braun, D.; Nunes, F.S.M.; Soares-Filho, B.S.; Börner, J. Blind spots in the EU’s Regulation on Deforestation-free products. Nat. Ecol. Evol. 2024, 8, 1382–1383. [Google Scholar] [CrossRef] [Scilit] [PubMed]
- Baban, S.M.J.; Wan Yusof, K. Mapping land use/cover distribution on a mountainous tropical island using remote sensing and GIS. Int. J. Remote Sens. 2001, 22, 1909–1918. [Google Scholar] [CrossRef]
- Jusoff, K.; Senthavy, S. Land use change detection using remote sensing and geographical information system (GIS) in Gua Musang district, Kelantan, Malaysia. J. Trop. For. Sci. 2003, 15, 303–312. [Google Scholar]
- Chen, B.; Xiao, X.; Wu, Z.; Yun, T.; Kou, W.; Ye, H.; Lin, Q.; Doughty, R.; Dong, J.; Ma, J.; et al. Identifying Establishment Year and Pre-Conversion Land Cover of Rubber Plantations on Hainan Island, China Using Landsat Data during 1987–2015. Remote Sens. 2018, 10, 1240. [Google Scholar] [CrossRef] [Scilit]
- Li, Z.; Fox, J.M. Mapping rubber tree growth in mainland Southeast Asia using time-series MODIS 250 m NDVI and statistical data. Appl. Geogr. 2012, 32, 420–432. [Google Scholar] [CrossRef] [Scilit]
- Xiao, C.; Li, P.; Feng, Z. Monitoring annual dynamics of mature rubber plantations in Xishuangbanna during 1987–2018 using Landsat time series data: A multiple normalization approach. Int. J. Appl. Earth Obs. Geoinf. 2019, 77, 30–41. [Google Scholar] [CrossRef] [Scilit]
- Chen, G.; Liu, Z.; Wen, Q.; Tan, R.; Wang, Y.; Zhao, J.; Feng, J. Identification of Rubber Plantations in Southwestern China Based on Multi-Source Remote Sensing Data and Phenology Windows. Remote Sens. 2023, 15, 1228. [Google Scholar] [CrossRef] [Scilit]
- Xiao, C.; Li, P.; Feng, Z.; Yang, Y.; You, Z.; Lin, Y.; Zhang, X. Latest 30-m map of mature rubber plantations in Mainland Southeast Asia and Yunnan province of China: Spatial patterns and geographical characteristics. Prog. Phys. Geogr. Earth Environ. 2021, 45, 736–756. [Google Scholar] [CrossRef] [Scilit]
- Chen, B.; Dong, J.; Thi Thu Hien, T.; Yun, T.; Kou, W.; Wu, Z.; Yang, C.; Wang, G.; Lai, H.; Liu, R.; et al. A full time series imagery and full cycle monitoring (FTSI-FCM) algorithm for tracking rubber plantation dynamics in the Vietnam from 1986 to 2022. ISPRS J. Photogramm. Remote Sens. 2025, 220, 377–394. [Google Scholar] [CrossRef] [Scilit]
- Poortinga, A.; Tenneson, K.; Shapiro, A.; Nquyen, Q.; San Aung, K.; Chishtie, F.; Saah, D. Mapping Plantations in Myanmar by Fusing Landsat-8, Sentinel-2 and Sentinel-1 Data along with Systematic Error Quantification. Remote Sens. 2019, 11, 831. [Google Scholar] [CrossRef] [Scilit]
- Ye, S.; Rogan, J.; Sangermano, F. Monitoring rubber plantation expansion using Landsat data time series and a Shapelet-based approach. ISPRS J. Photogramm. Remote Sens. 2018, 136, 134–143. [Google Scholar] [CrossRef] [Scilit]
- Azizan, F.A.; Astuti, I.S.; Aditya, M.I.; Febbiyanti, T.R.; Williams, A.; Young, A.; Abdul Aziz, A. Using Multi-Temporal Satellite Data to Analyse Phenological Responses of Rubber (Hevea brasiliensis) to Climatic Variations in South Sumatra, Indonesia. Remote Sens. 2021, 13, 2932. [Google Scholar] [CrossRef] [Scilit]
- Wang, H.; Li, J.; Wang, J.; Deng, Y.; Gao, S.; Zou, J.; Chen, A.; Xu, H. A double-layer ensemble framework for rubber plantation mapping using multi-source data in the google earth engine: A case study of the southwestern border region of China. Int. J. Digit. Earth 2025, 18, 2520472. [Google Scholar] [CrossRef] [Scilit]
- Dong, J.; Xiao, X.; Chen, B.; Torbick, N.; Jin, C.; Zhang, G.; Biradar, C. Mapping deciduous rubber plantations through integration of PALSAR and multi-temporal Landsat imagery. Remote Sens. Environ. 2013, 134, 392–402. [Google Scholar] [CrossRef] [Scilit]
- Spracklen, B.; Spracklen, D.V. Synergistic Use of Sentinel-1 and Sentinel-2 to Map Natural Forest and Acacia Plantation and Stand Ages in North-Central Vietnam. Remote Sens. 2021, 13, 185. [Google Scholar] [CrossRef] [Scilit]
- Saatchi, S.S.; Harris, N.L.; Brown, S.; Lefsky, M.; Mitchard, E.T.; Salas, W.; Zutta, B.R.; Buermann, W.; Lewis, S.L.; Hagen, S. Benchmark map of forest carbon stocks in tropical regions across three continents. Proc. Natl. Acad. Sci. USA 2011, 108, 9899–9904. [Google Scholar] [CrossRef] [Scilit] [PubMed]
- Trisasongko, B.H. Mapping stand age of rubber plantation using ALOS-2 polarimetric SAR data. Eur. J. Remote Sens. 2017, 50, 64–76. [Google Scholar] [CrossRef] [Scilit]
- Yue, Z.; Xiao, C. A meta-review of remote sensing for rubber plantations. Int. J. Appl. Earth Obs. Geoinf. 2025, 141, 104625. [Google Scholar] [CrossRef] [Scilit]
- Richards, J.A.; Jia, X. Remote Sensing Digital Image Analysis: An Introduction; Springer: Berlin/Heidelberg, Germany, 2006. [Google Scholar]
- Gorelick, N.; Hancher, M.; Dixon, M.; Ilyushchenko, S.; Thau, D.; Moore, R. Google Earth Engine: Planetary-scale geospatial analysis for everyone. Remote Sens. Environ. 2017, 202, 18–27. [Google Scholar] [CrossRef] [Scilit]
- Torres, R.; Snoeij, P.; Geudtner, D.; Bibby, D.; Davidson, M.; Attema, E.; Potin, P.; Rommen, B.; Floury, N.; Brown, M.; et al. GMES Sentinel-1 mission. Remote Sens. Environ. 2012, 120, 9–24. [Google Scholar] [CrossRef] [Scilit]
- Drusch, M.; Del Bello, U.; Carlier, S.; Colin, O.; Fernandez, V.; Gascon, F.; Hoersch, B.; Isola, C.; Laberinti, P.; Martimort, P.; et al. Sentinel-2: ESA’s Optical High-Resolution Mission for GMES Operational Services. Remote Sens. Environ. 2012, 120, 25–36. [Google Scholar] [CrossRef] [Scilit]
- Brown, C.F.; Brumby, S.P.; Guzder-Williams, B.; Birch, T.; Hyde, S.B.; Mazzariello, J.; Czerwinski, W.; Pasquarella, V.J.; Haertel, R.; Ilyushchenko, S. Dynamic World, Near real-time global 10 m land use land cover mapping. Sci. Data 2022, 9, 251. [Google Scholar] [CrossRef] [Scilit]
- Funk, C.; Peterson, P.; Landsfeld, M.; Pedreros, D.; Verdin, J.; Shukla, S.; Husak, G.; Rowland, J.; Harrison, L.; Hoell, A.; et al. The climate hazards infrared precipitation with stations—A new environmental record for monitoring extremes. Sci. Data 2015, 2, 150066. [Google Scholar] [CrossRef] [Scilit] [PubMed]
- Rodell, M.; Houser, P.R.; Jambor, U.; Gottschalck, J.; Mitchell, K.; Meng, C.J.; Arsenault, K.; Cosgrove, B.; Radakovich, J.; Bosilovich, M.; et al. The Global Land Data Assimilation System. Bull. Am. Meteorol. Soc. 2004, 85, 381–394. [Google Scholar] [CrossRef] [Scilit]
- Tucker, C.J. Red and photographic infrared linear combinations for monitoring vegetation. Remote Sens. Environ. 1979, 8, 127–150. [Google Scholar] [CrossRef] [Scilit]
- Jiang, Z.; Huete, A.R.; Didan, K.; Miura, T. Development of a two-band enhanced vegetation index without a blue band. Remote Sens. Environ. 2008, 112, 3833–3845. [Google Scholar] [CrossRef] [Scilit]
- Gao, B.-c. NDWI—A normalized difference water index for remote sensing of vegetation liquid water from space. Remote Sens. Environ. 1996, 58, 257–266. [Google Scholar] [CrossRef] [Scilit]
- Savitzky, A.; Golay, M.J. Smoothing and differentiation of data by simplified least squares procedures. Anal. Chem. 1964, 36, 1627–1639. [Google Scholar] [CrossRef] [Scilit]
- Breiman, L. Random forests. Mach. Learn. 2001, 45, 5–32. [Google Scholar] [CrossRef] [Scilit]
- Belgiu, M.; Drăguţ, L. Random forest in remote sensing: A review of applications and future directions. ISPRS J. Photogramm. Remote Sens. 2016, 114, 24–31. [Google Scholar] [CrossRef] [Scilit]
- Olofsson, P.; Foody, G.M.; Herold, M.; Stehman, S.V.; Woodcock, C.E.; Wulder, M.A. Good practices for estimating area and assessing accuracy of land change. Remote Sens. Environ. 2014, 148, 42–57. [Google Scholar] [CrossRef] [Scilit]
- Guardiola-Claramonte, M.; Troch, P.A.; Ziegler, A.D.; Giambelluca, T.W.; Durcik, M.; Vogler, J.B.; Nullet, M.A. Hydrologic effects of the expansion of rubber (Hevea brasiliensis) in a tropical catchment. Ecohydrology 2010, 3, 306–314. [Google Scholar] [CrossRef] [Scilit]
- Wang, X.; Chen, B.; Dong, J.; Gao, Y.; Wang, G.; Lai, H.; Wu, Z.; Yang, C.; Kou, W.; Yun, T. Early identification of immature rubber plantations using Landsat and Sentinel satellite images. Int. J. Appl. Earth Obs. Geoinf. 2024, 133, 104097. [Google Scholar] [CrossRef] [Scilit]
- Fan, H.; Fu, X.; Zhang, Z.; Wu, Q. Phenology-Based Vegetation Index Differencing for Mapping of Rubber Plantations Using Landsat OLI Data. Remote Sens. 2015, 7, 6041–6058. [Google Scholar] [CrossRef] [Scilit]
- Dai, S.; Luo, H.; Hu, Y.; Zheng, Q.; Li, H.; Li, M.; Yu, X.; Chen, B. Retrieving leaf area index of rubber plantation in Hainan Island using empirical and neural network models with Landsat images. J. Appl. Remote Sens. 2023, 17, 014503. [Google Scholar] [CrossRef] [Scilit]
- Li, H.; Zhao, L.; Sun, L.; Li, X.; Wang, J.; Han, Y.; Liang, S.; Chen, J. Capability of Phenology-Based Sentinel-2 Composites for Rubber Plantation Mapping in a Large Area with Complex Vegetation Landscapes. Remote Sens. 2022, 14, 5338. [Google Scholar] [CrossRef] [Scilit]
- Chen, B.; Wu, Z.; Wang, J.; Dong, J.; Guan, L.; Chen, J.; Yang, K.; Xie, G. Spatio-temporal prediction of leaf area index of rubber plantation using HJ-1A/1B CCD images and recurrent neural network. ISPRS J. Photogramm. Remote Sens. 2015, 102, 148–160. [Google Scholar] [CrossRef] [Scilit]
- Phompila, C.; Lewis, M.; Ostendorf, B.; Clarke, K. MODIS EVI and LST Temporal Response for Discrimination of Tropical Land Covers. Remote Sens. 2015, 7, 6026–6040. [Google Scholar] [CrossRef] [Scilit]
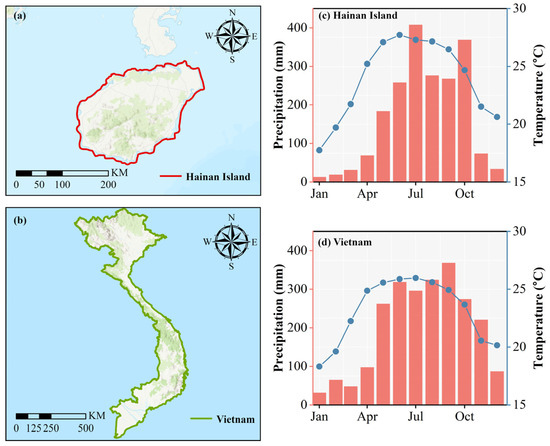
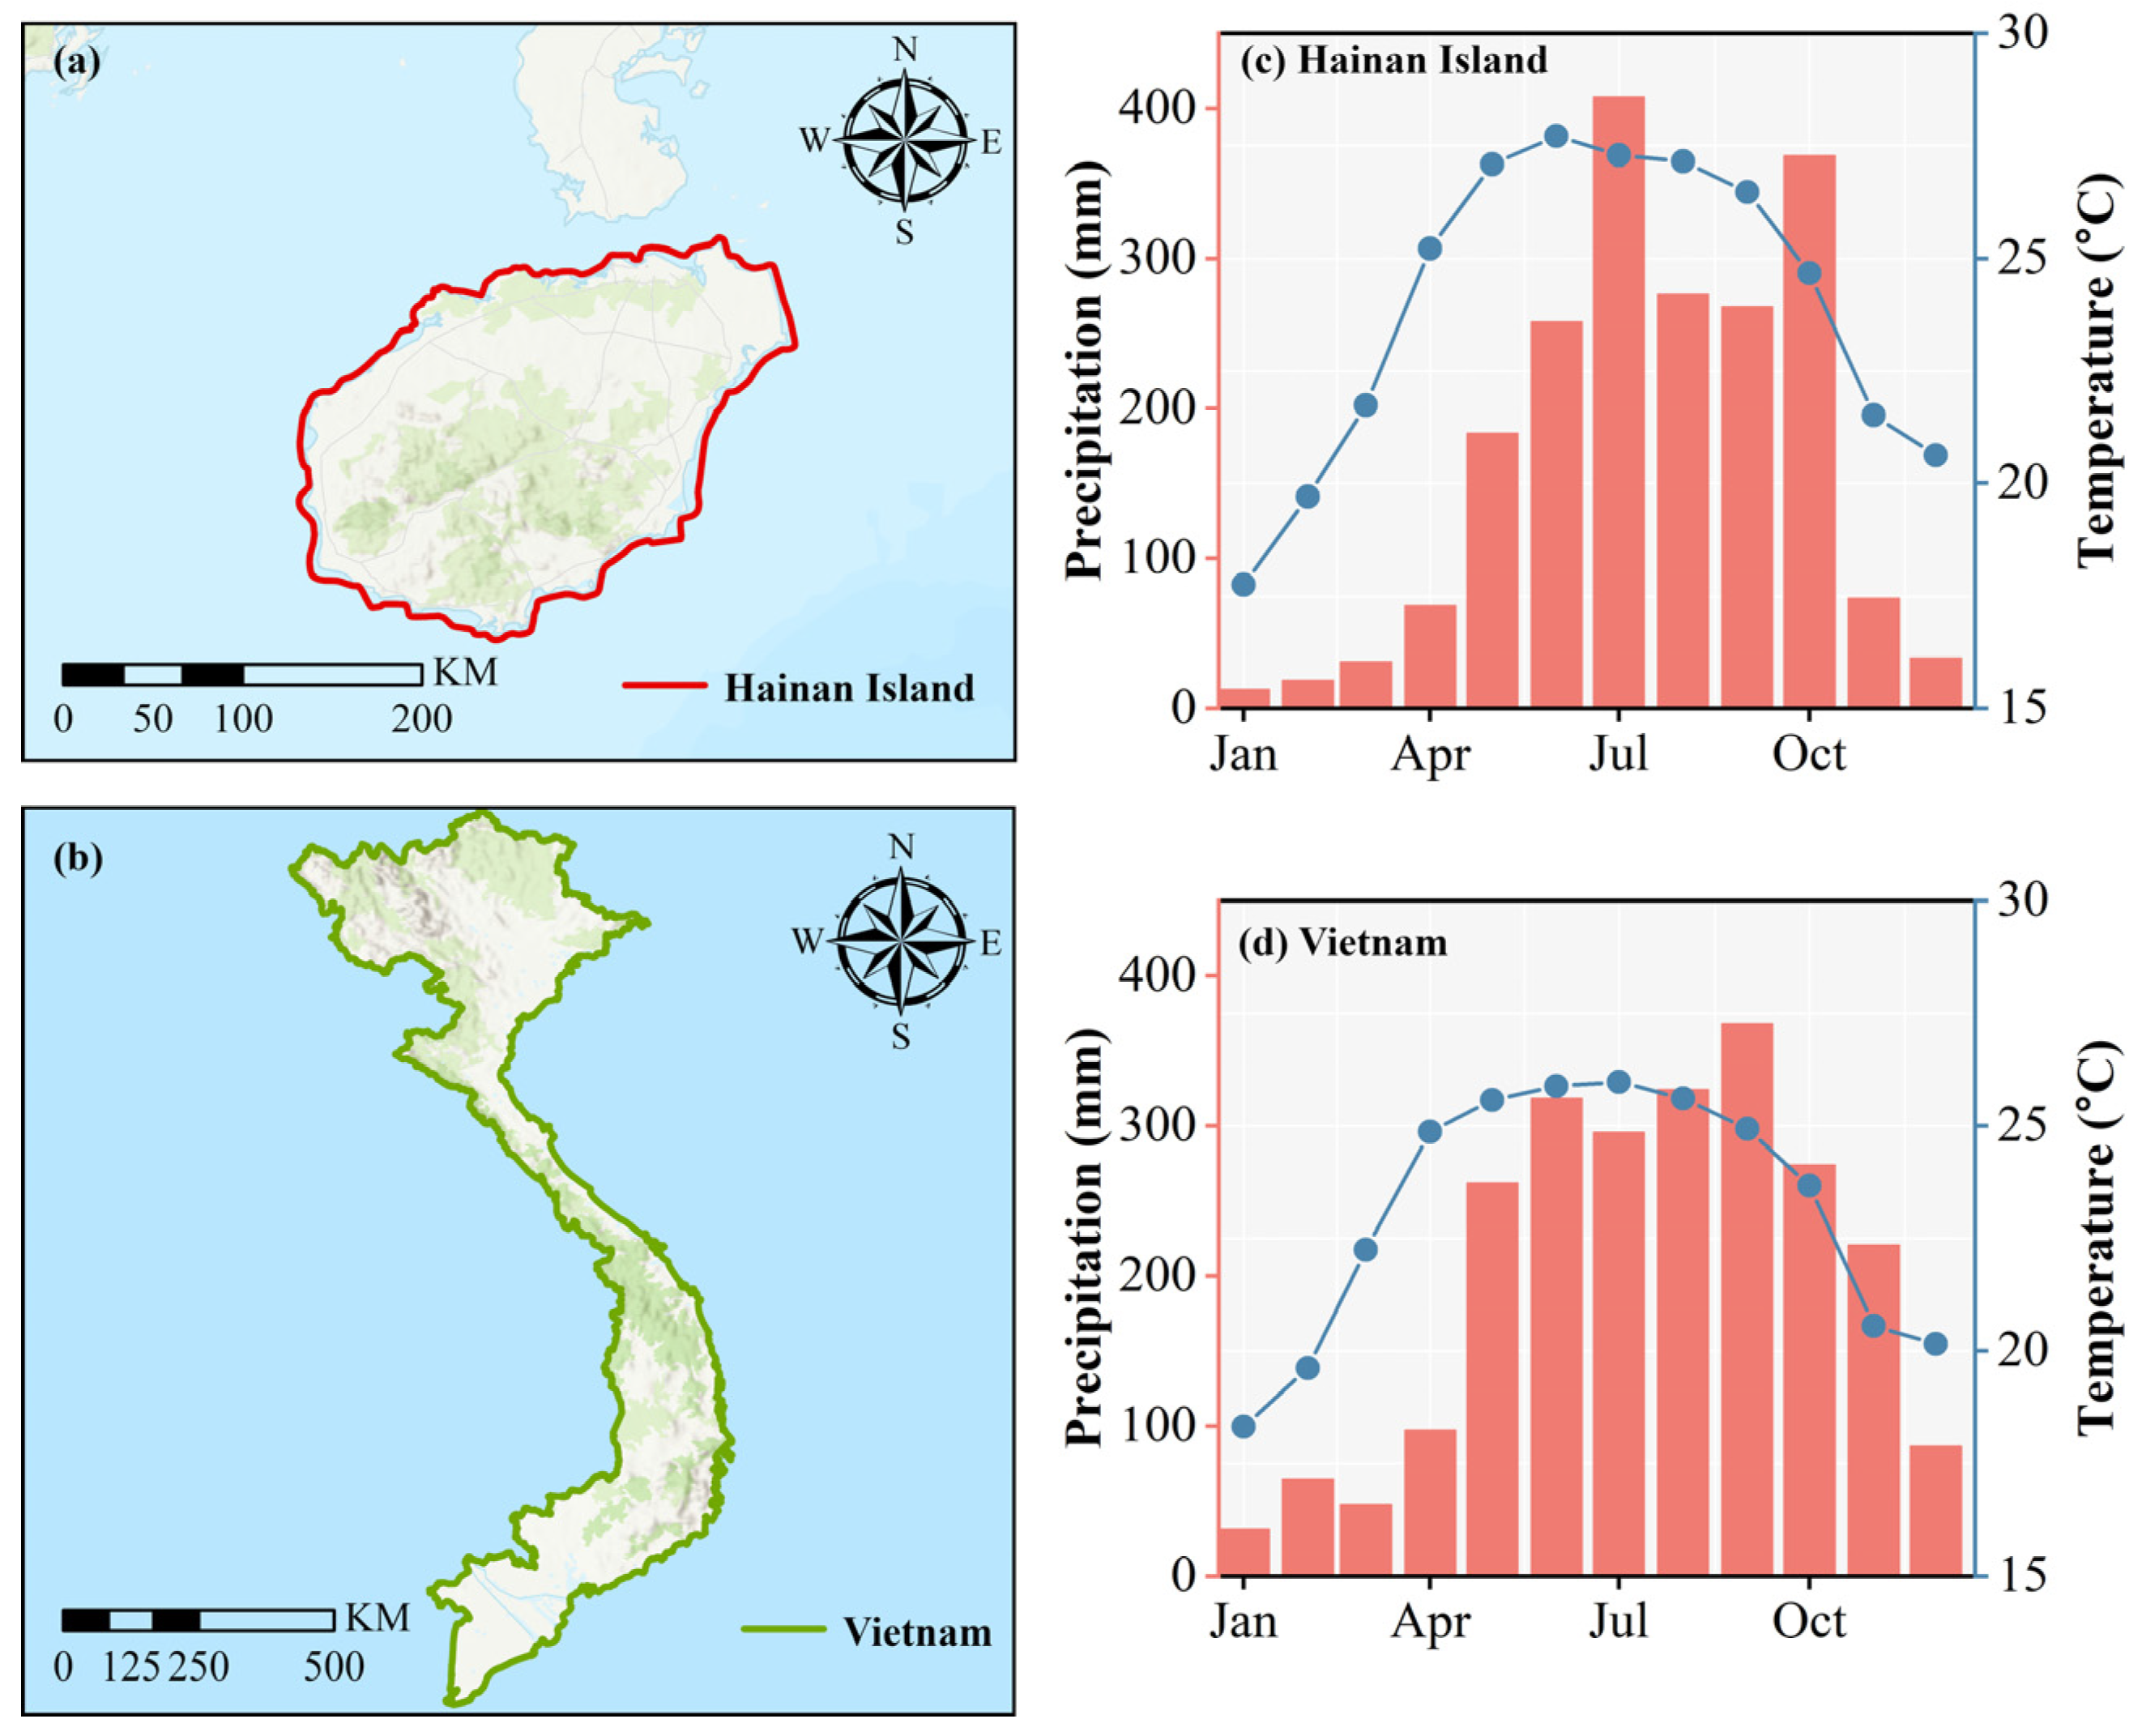
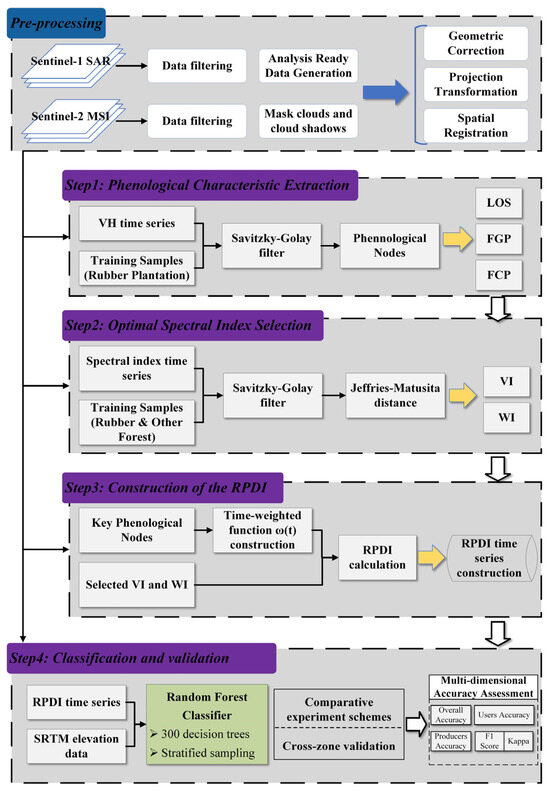
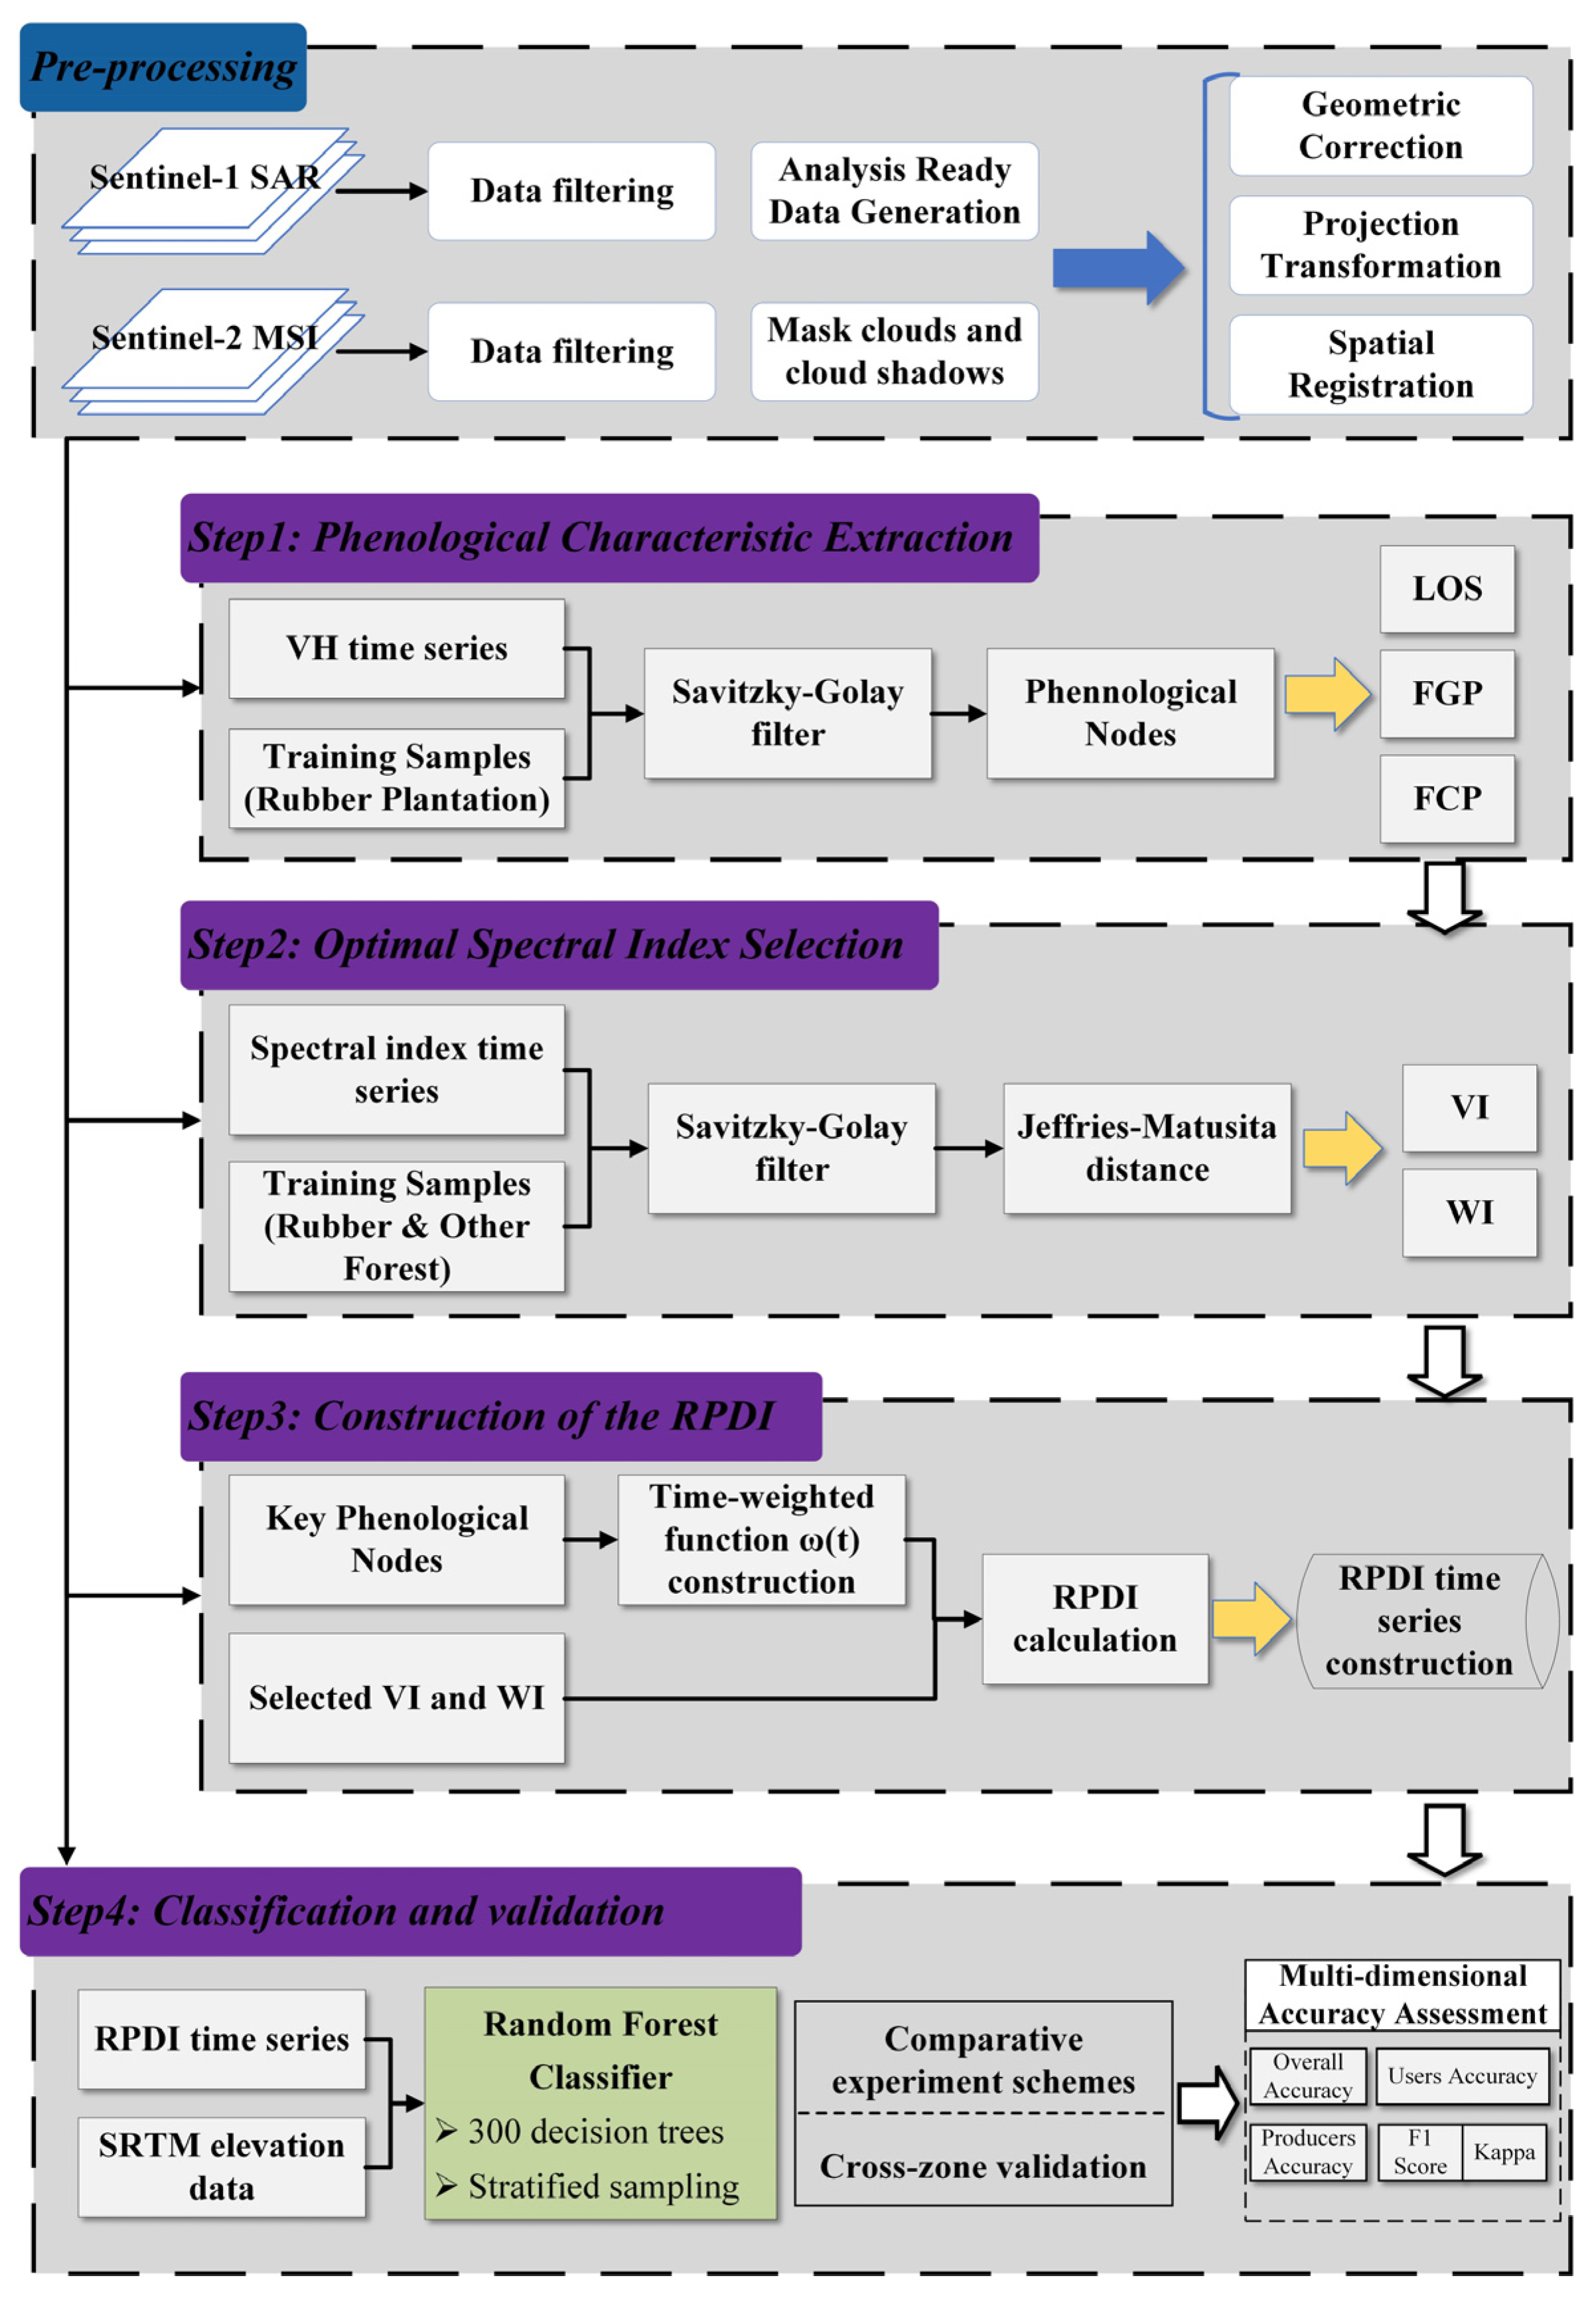
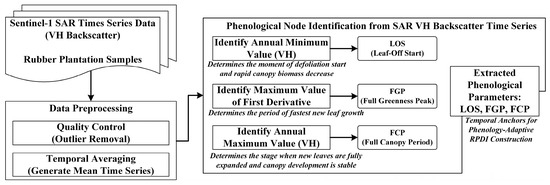
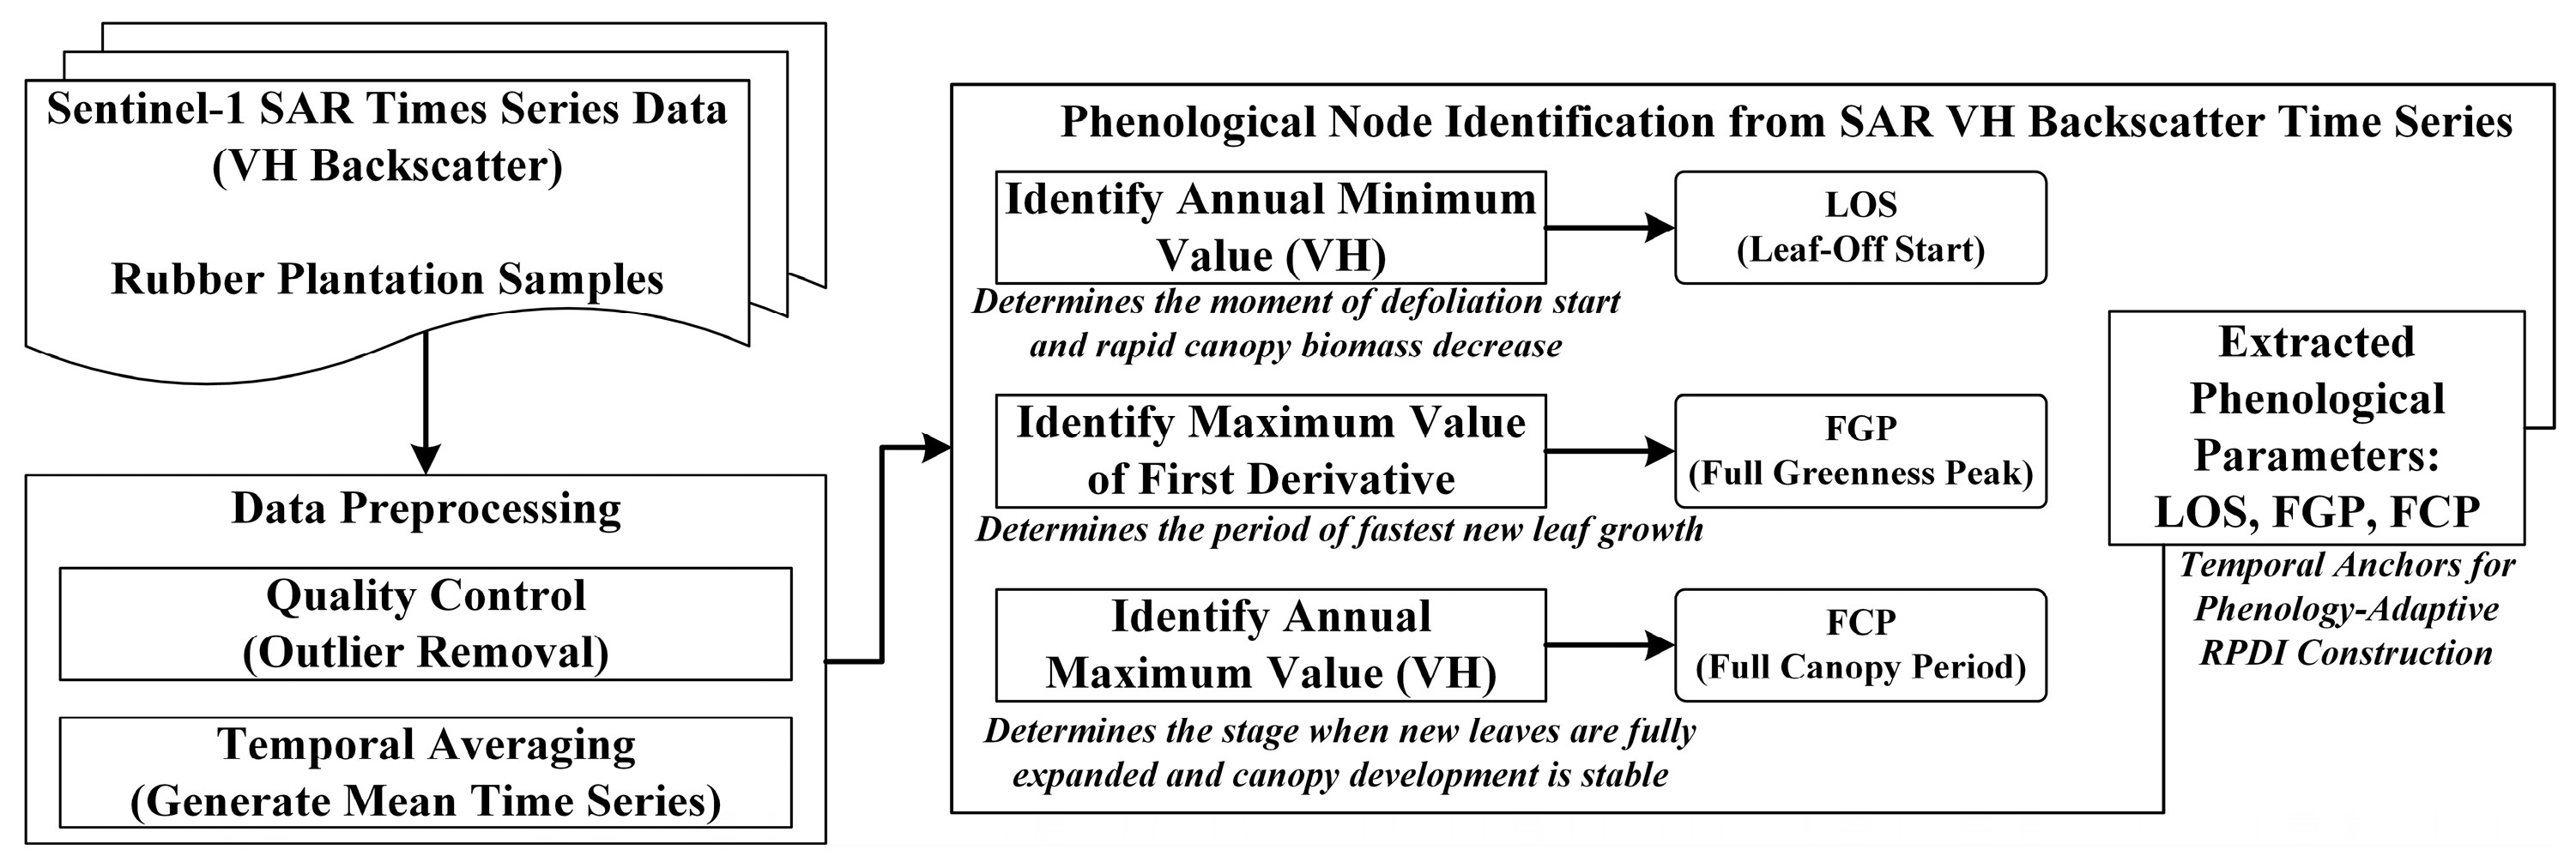
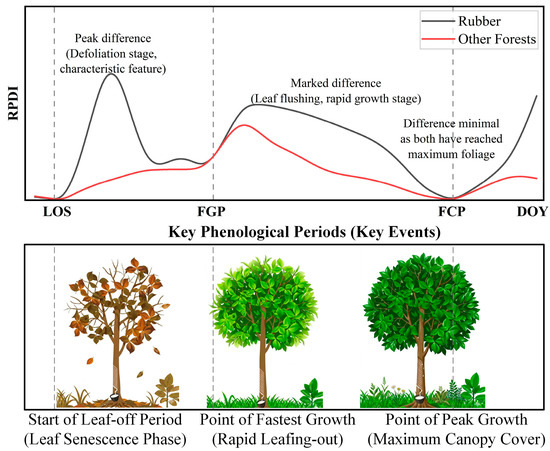
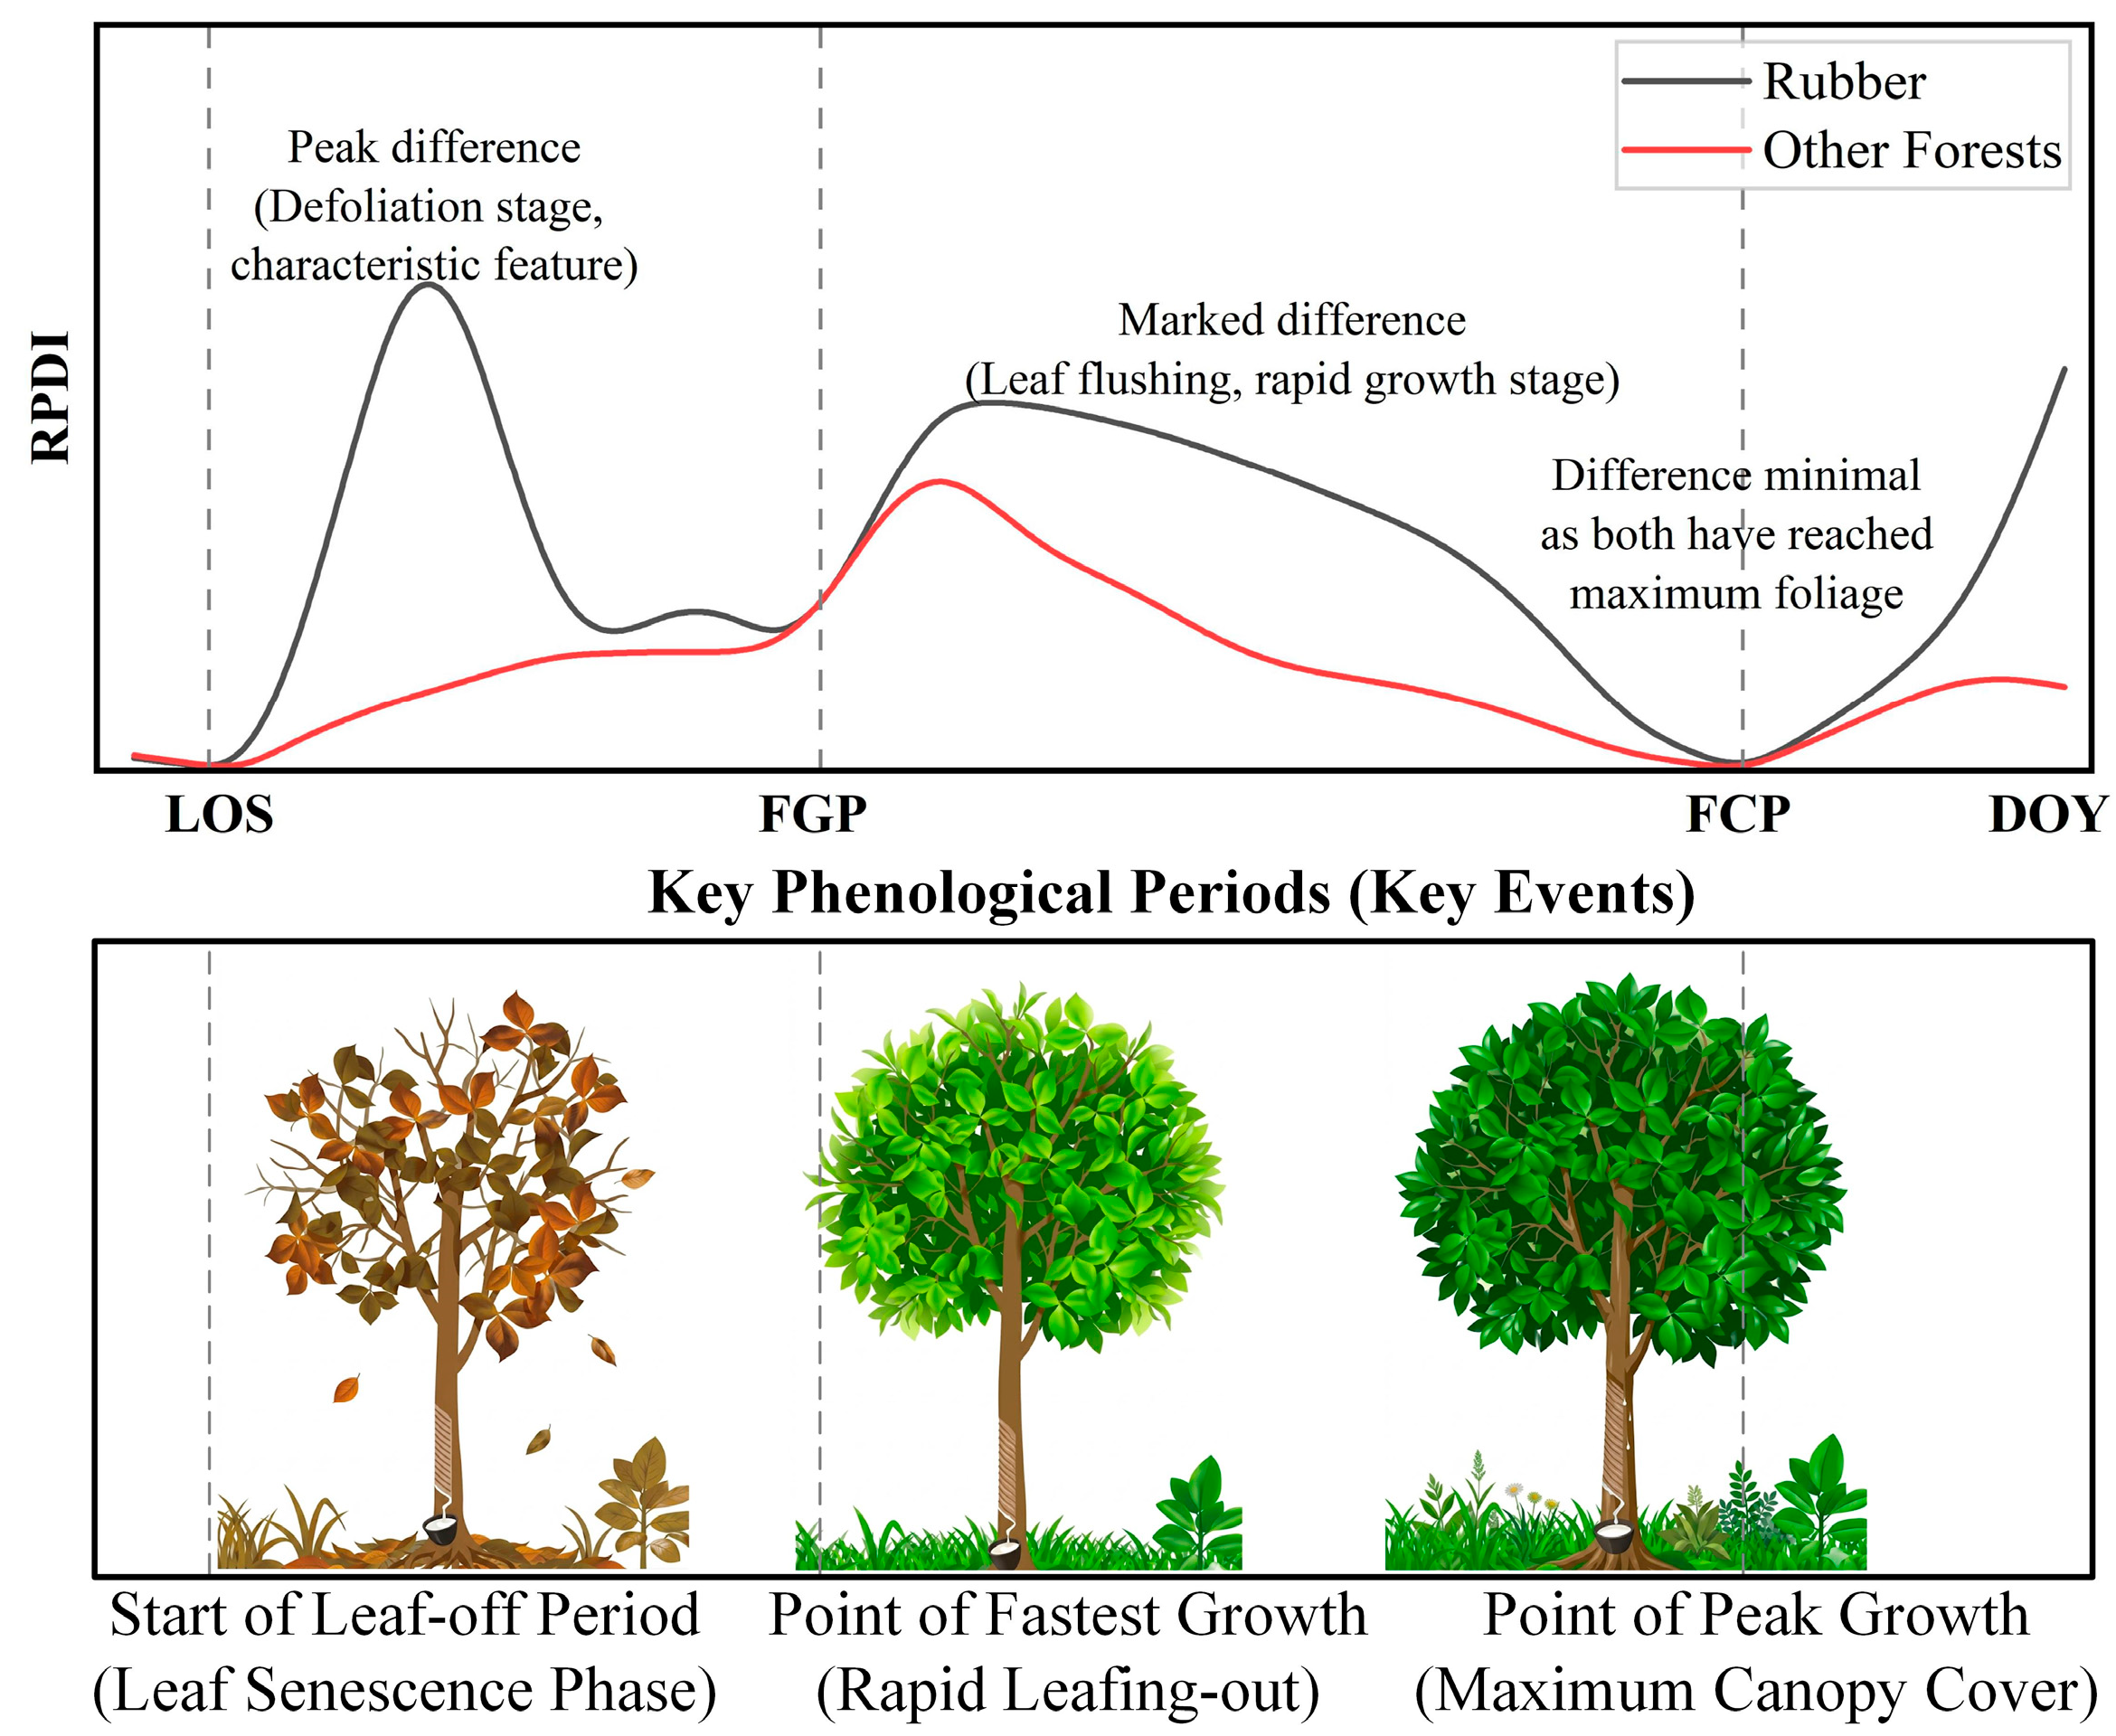
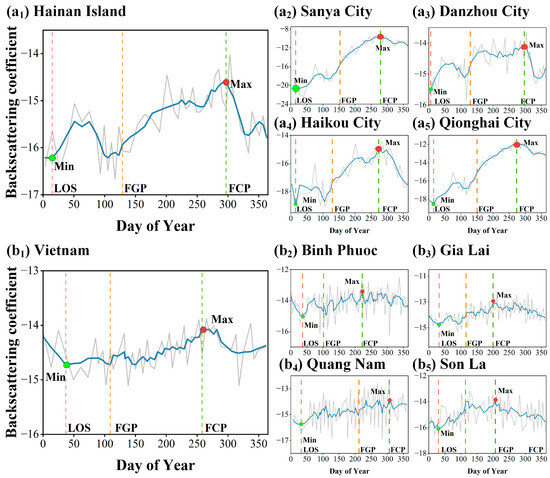
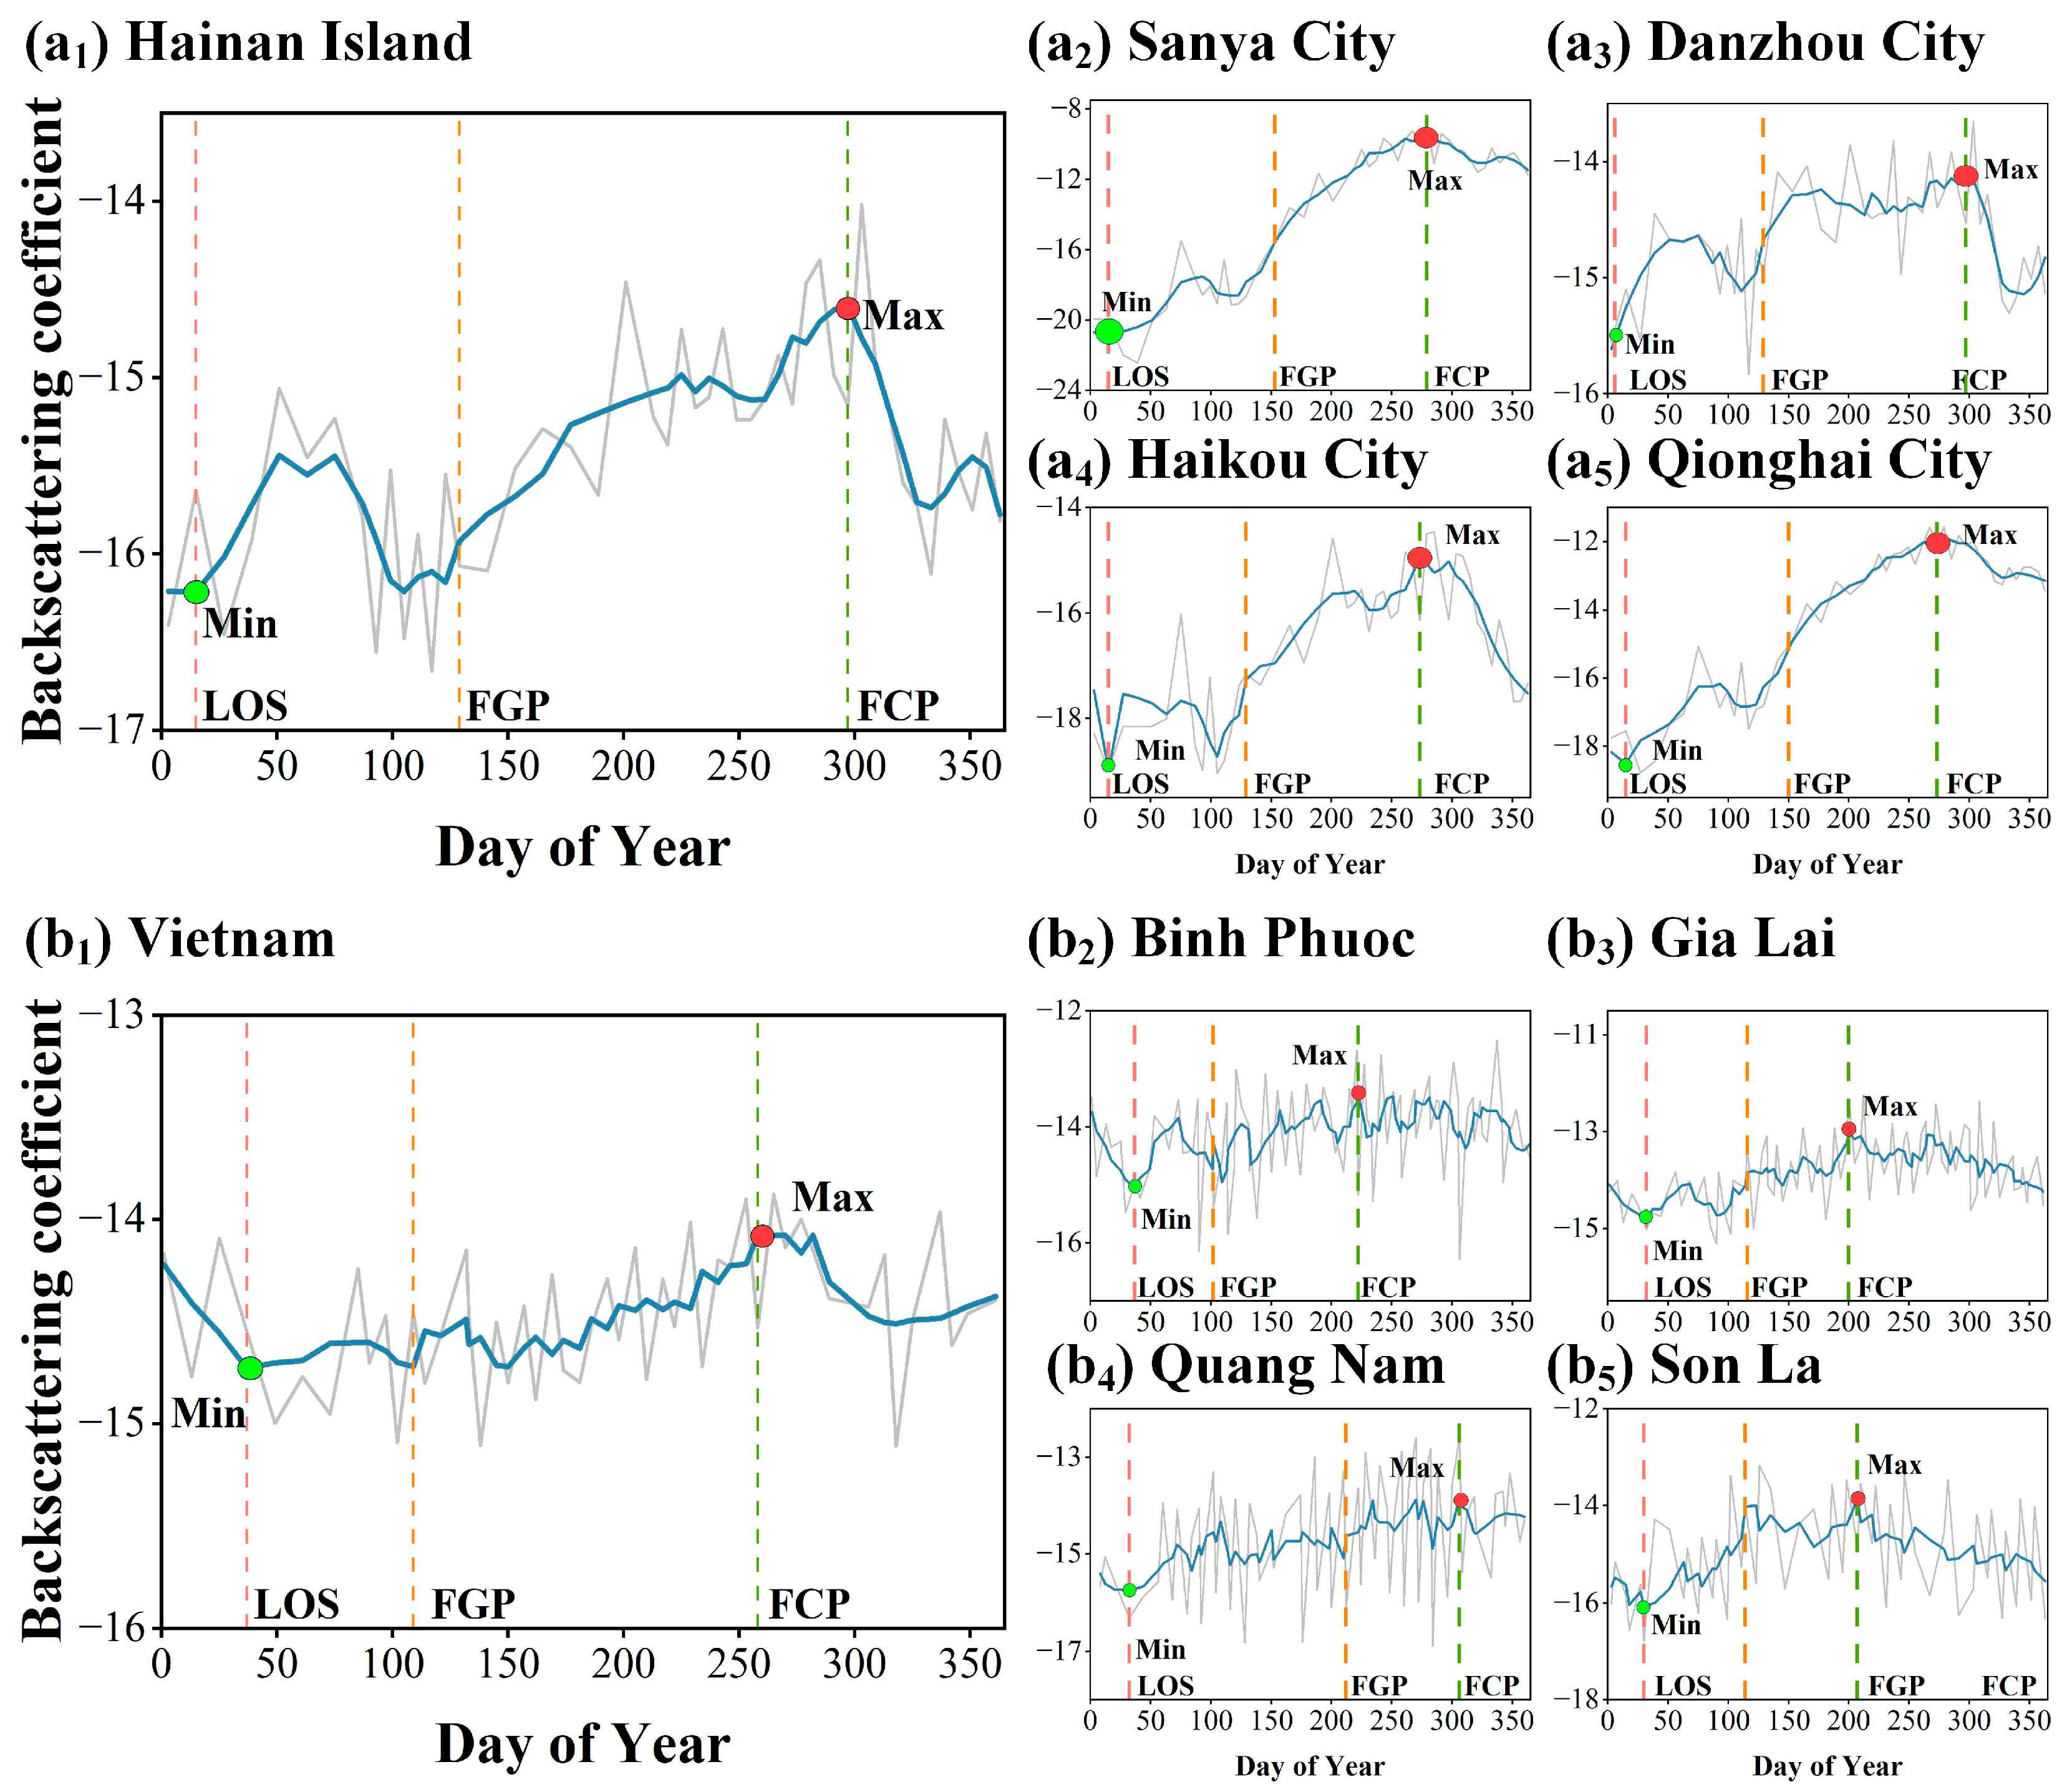
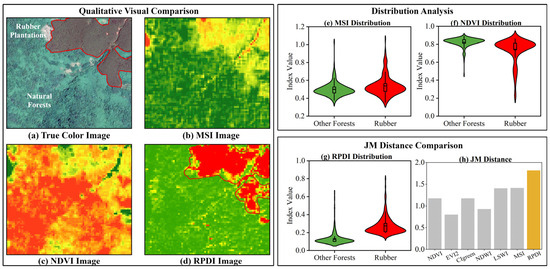
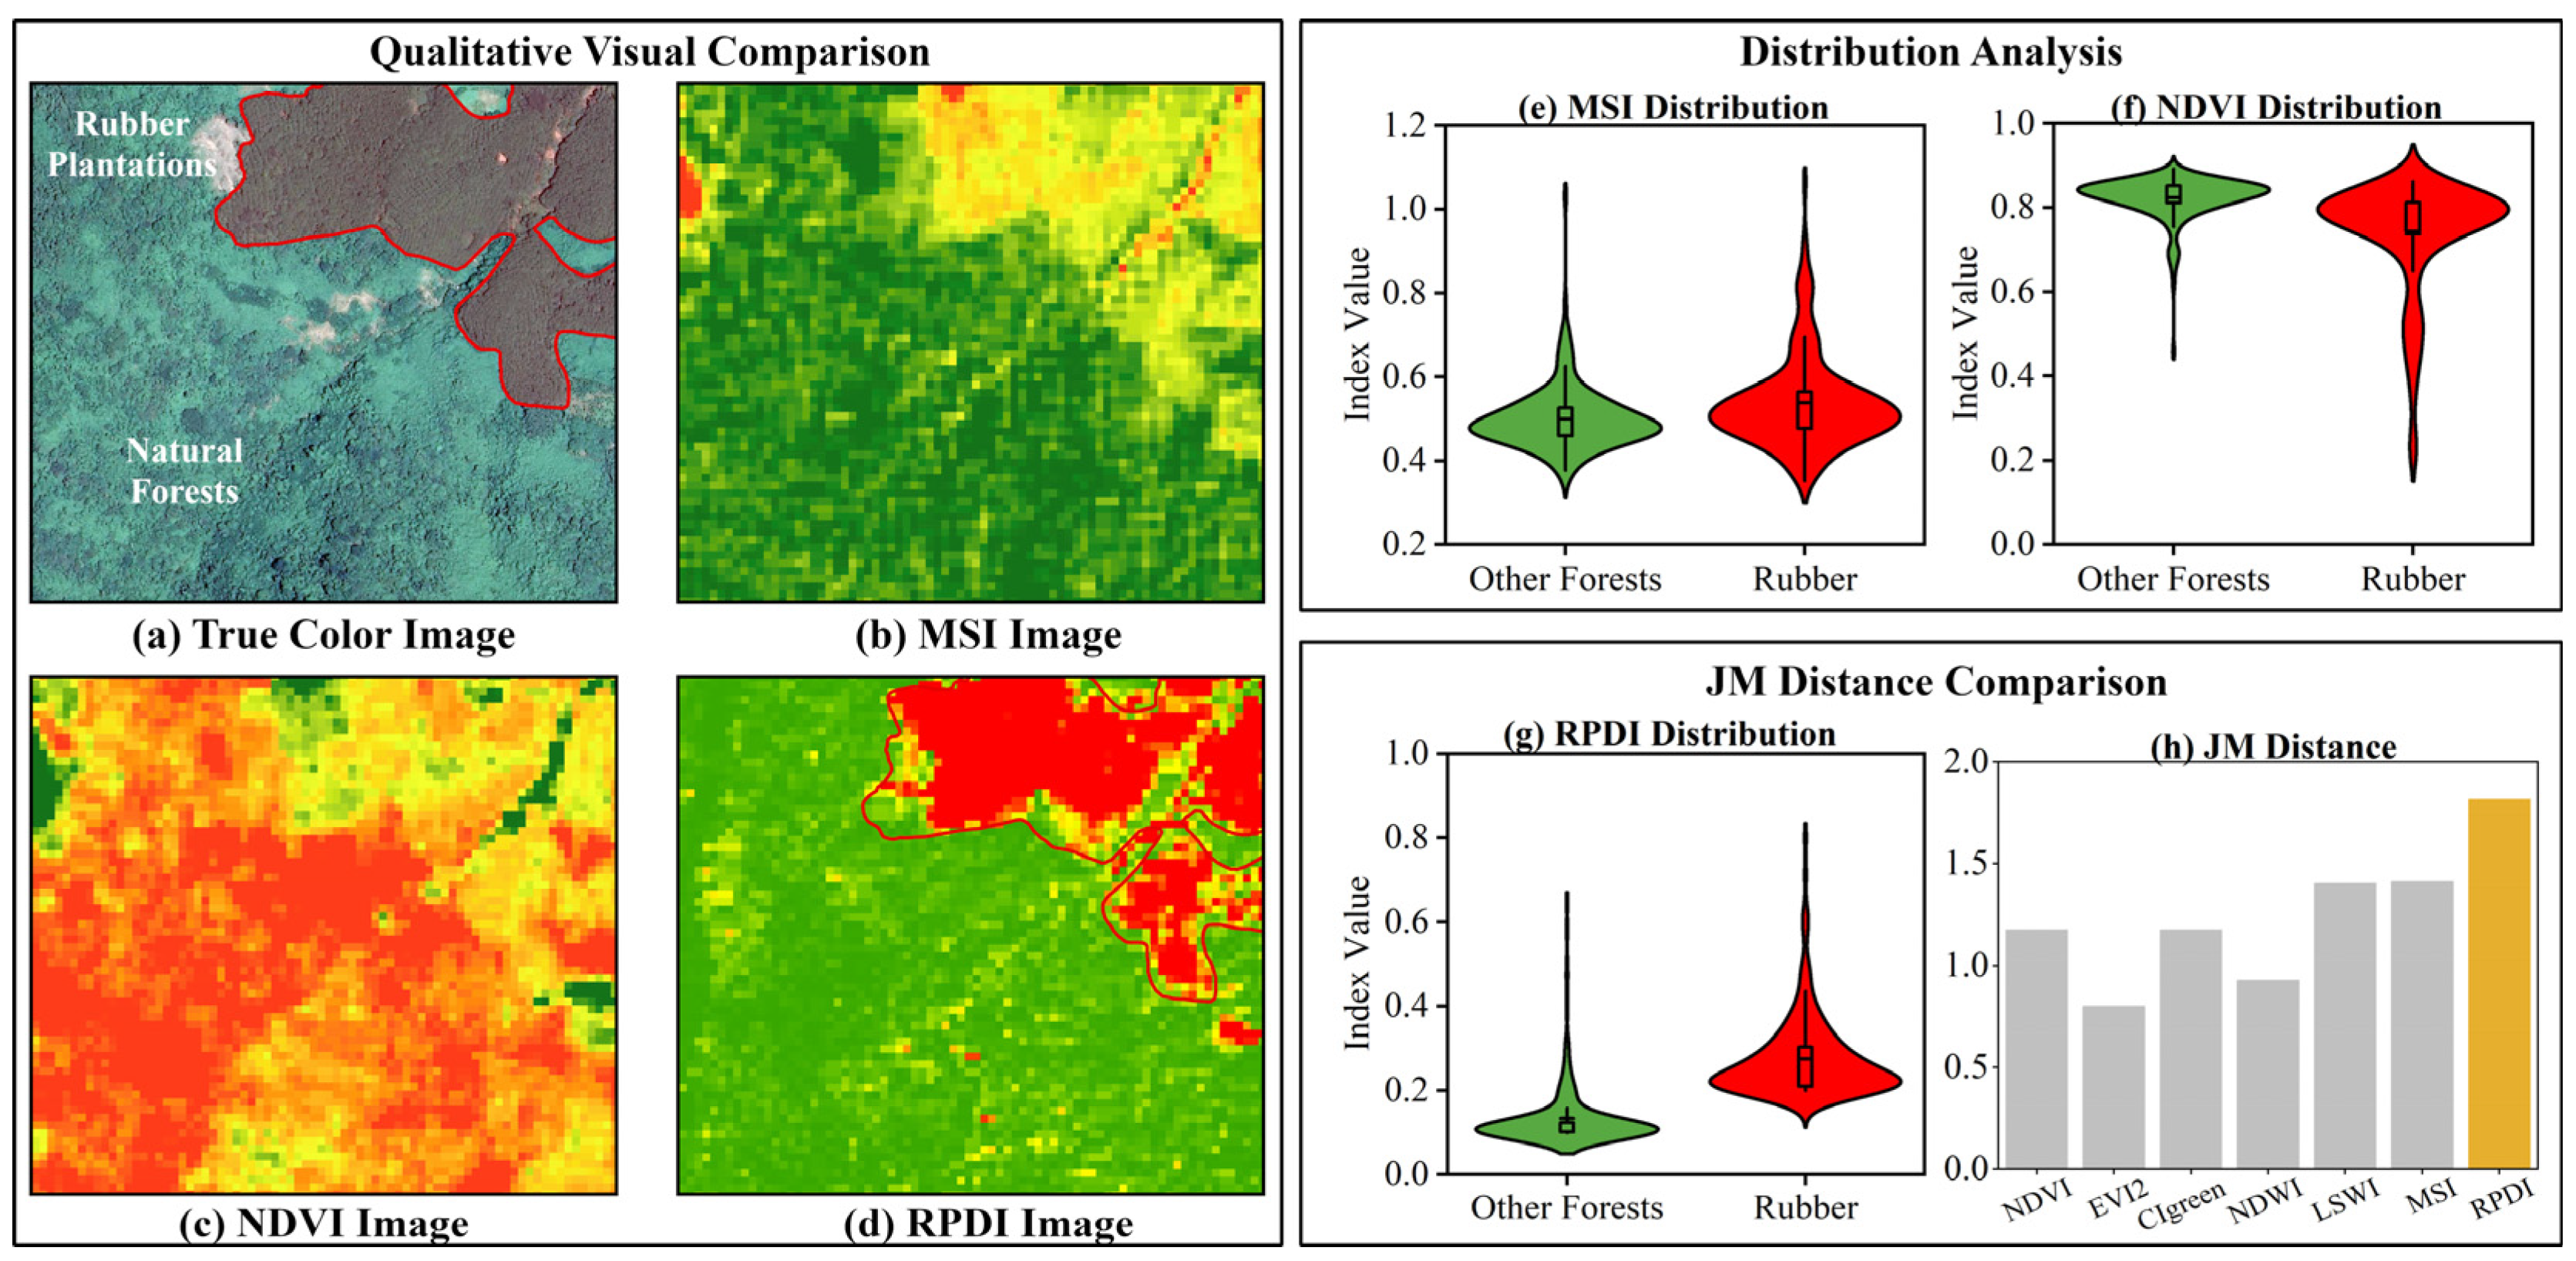
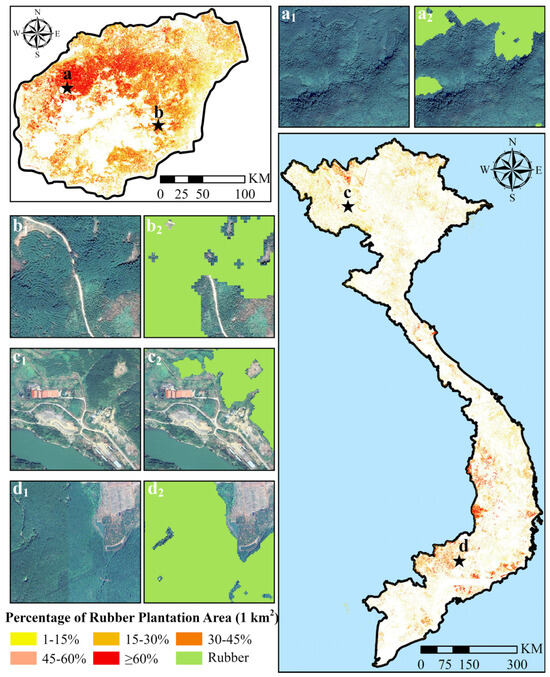
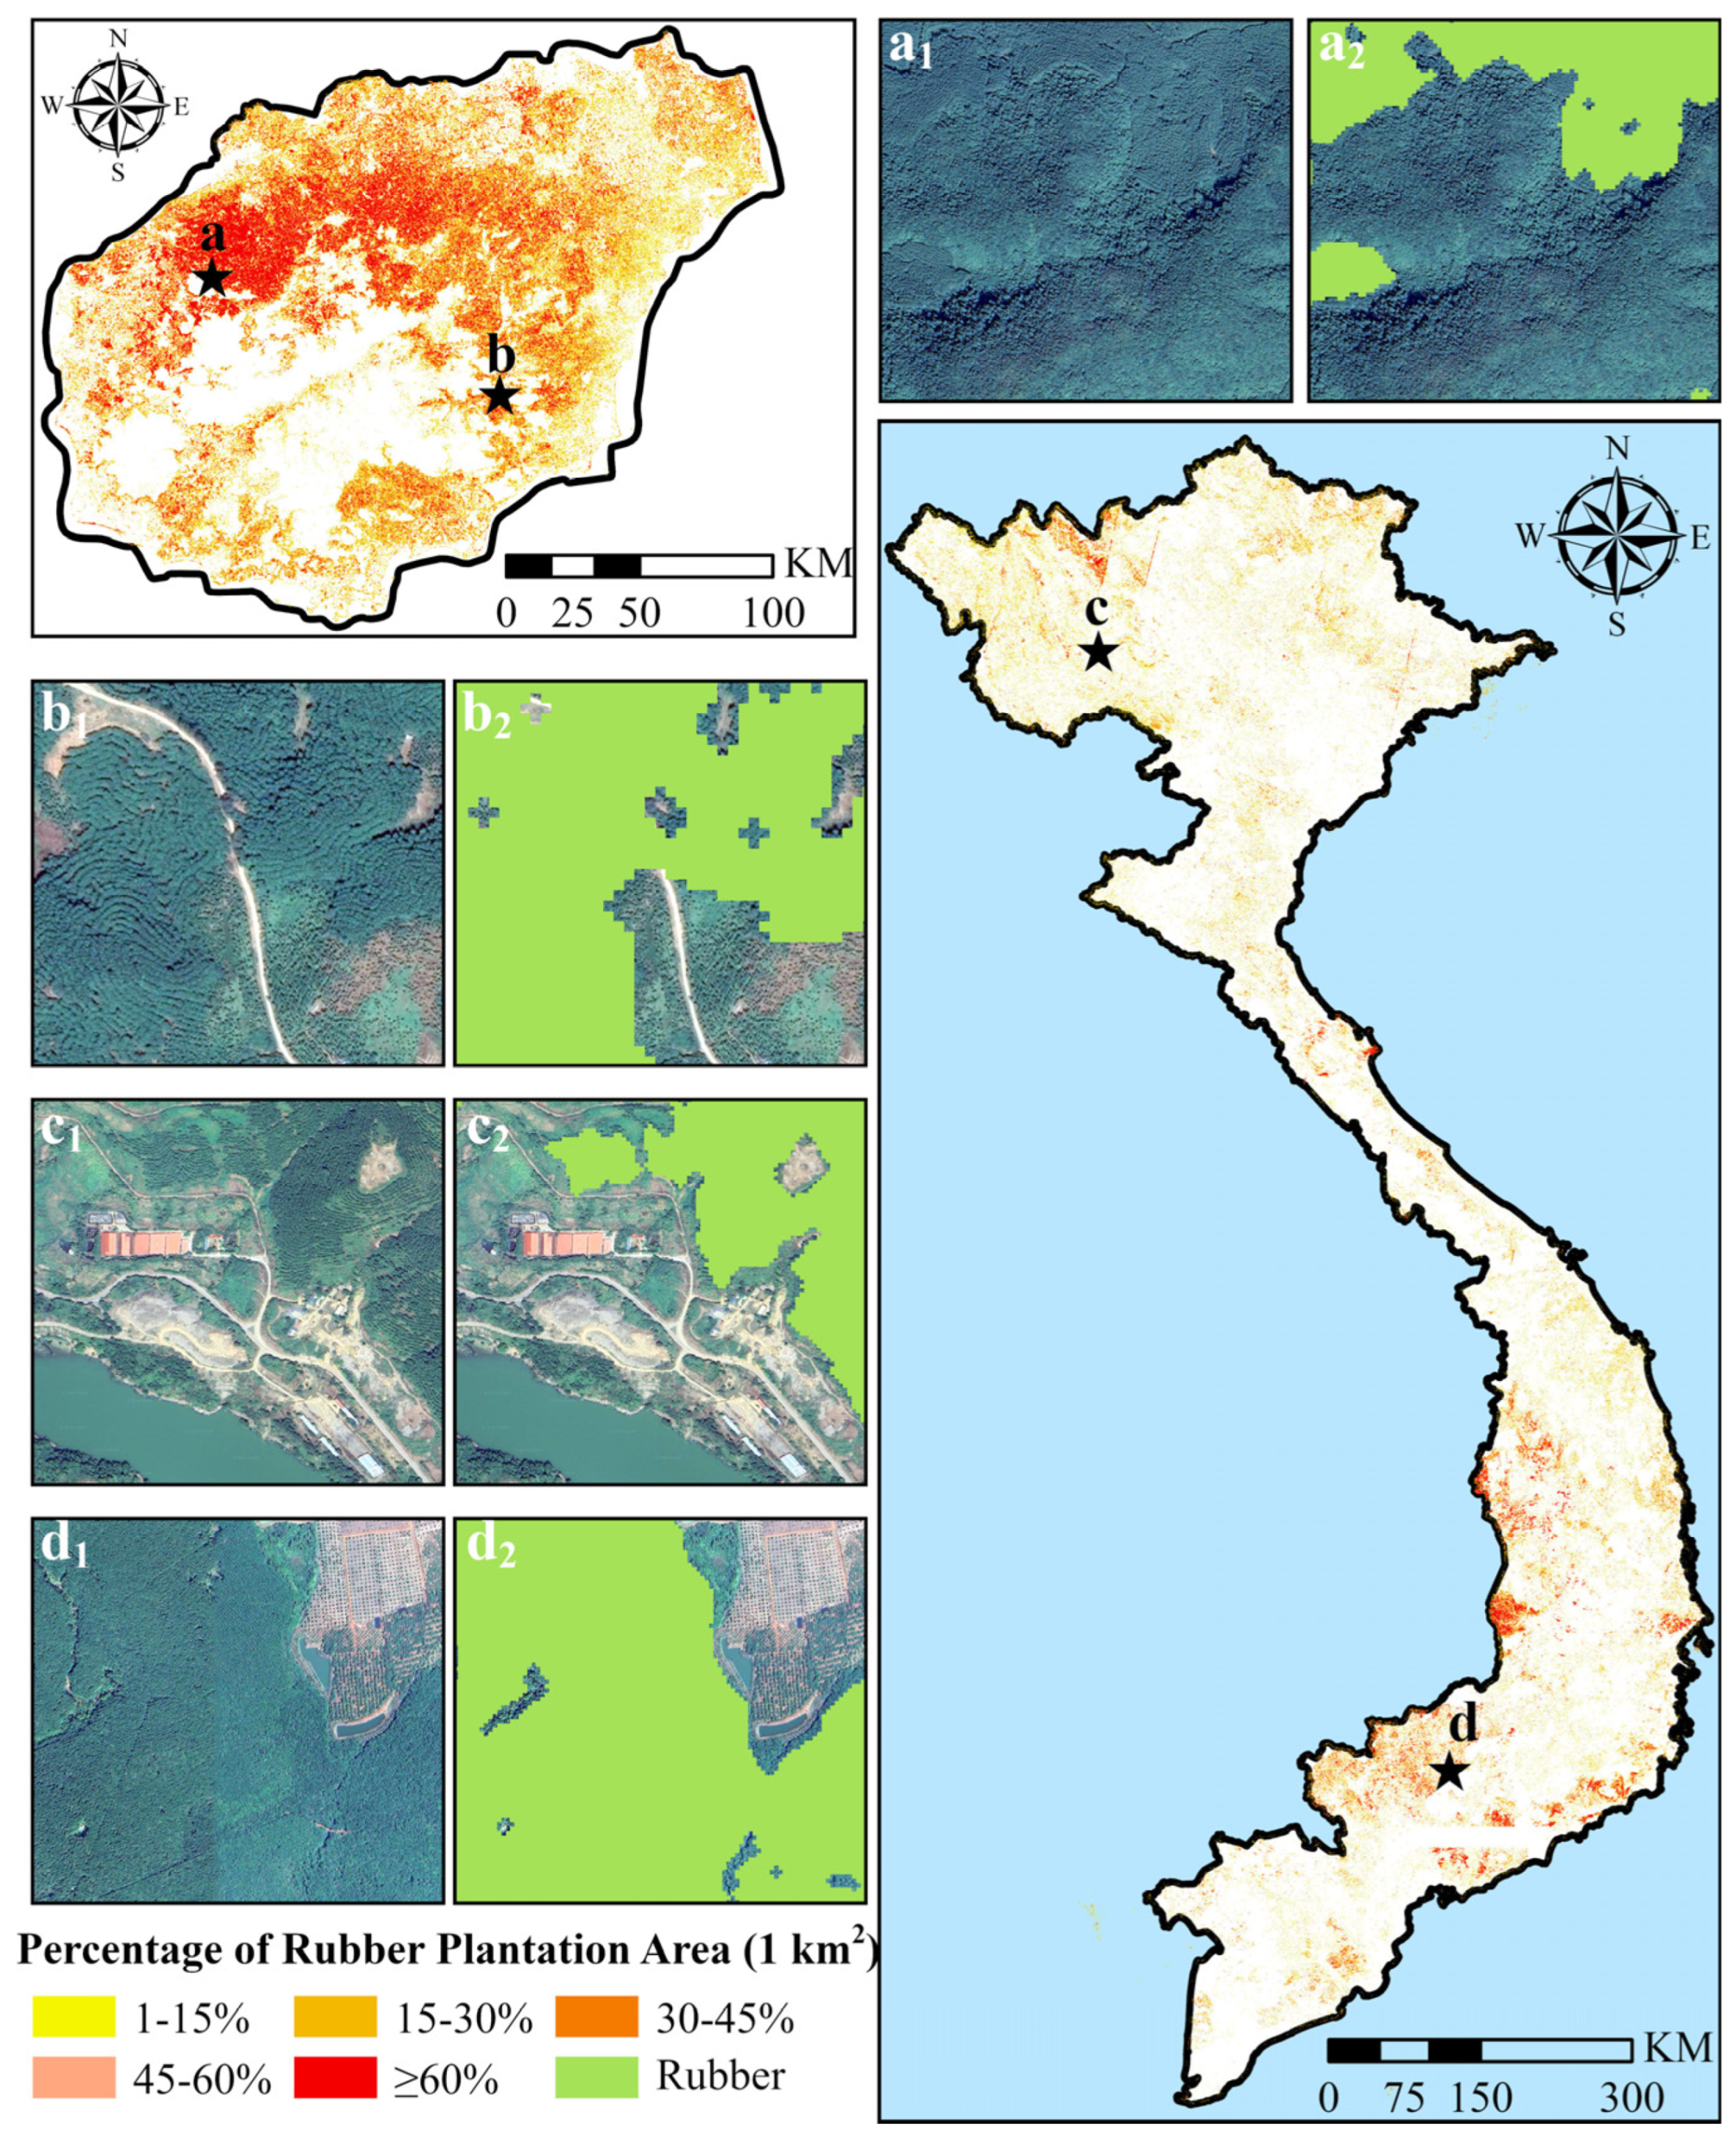
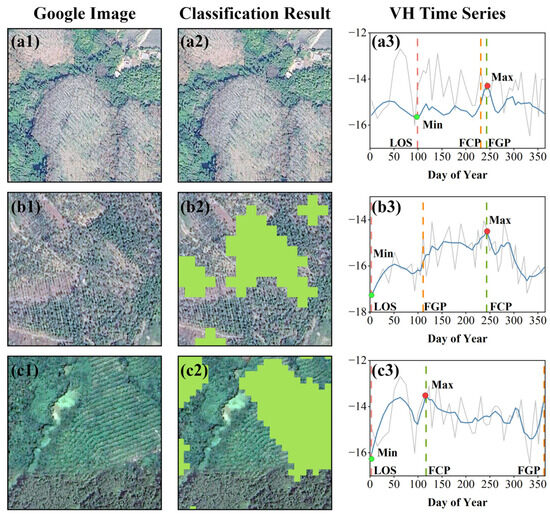
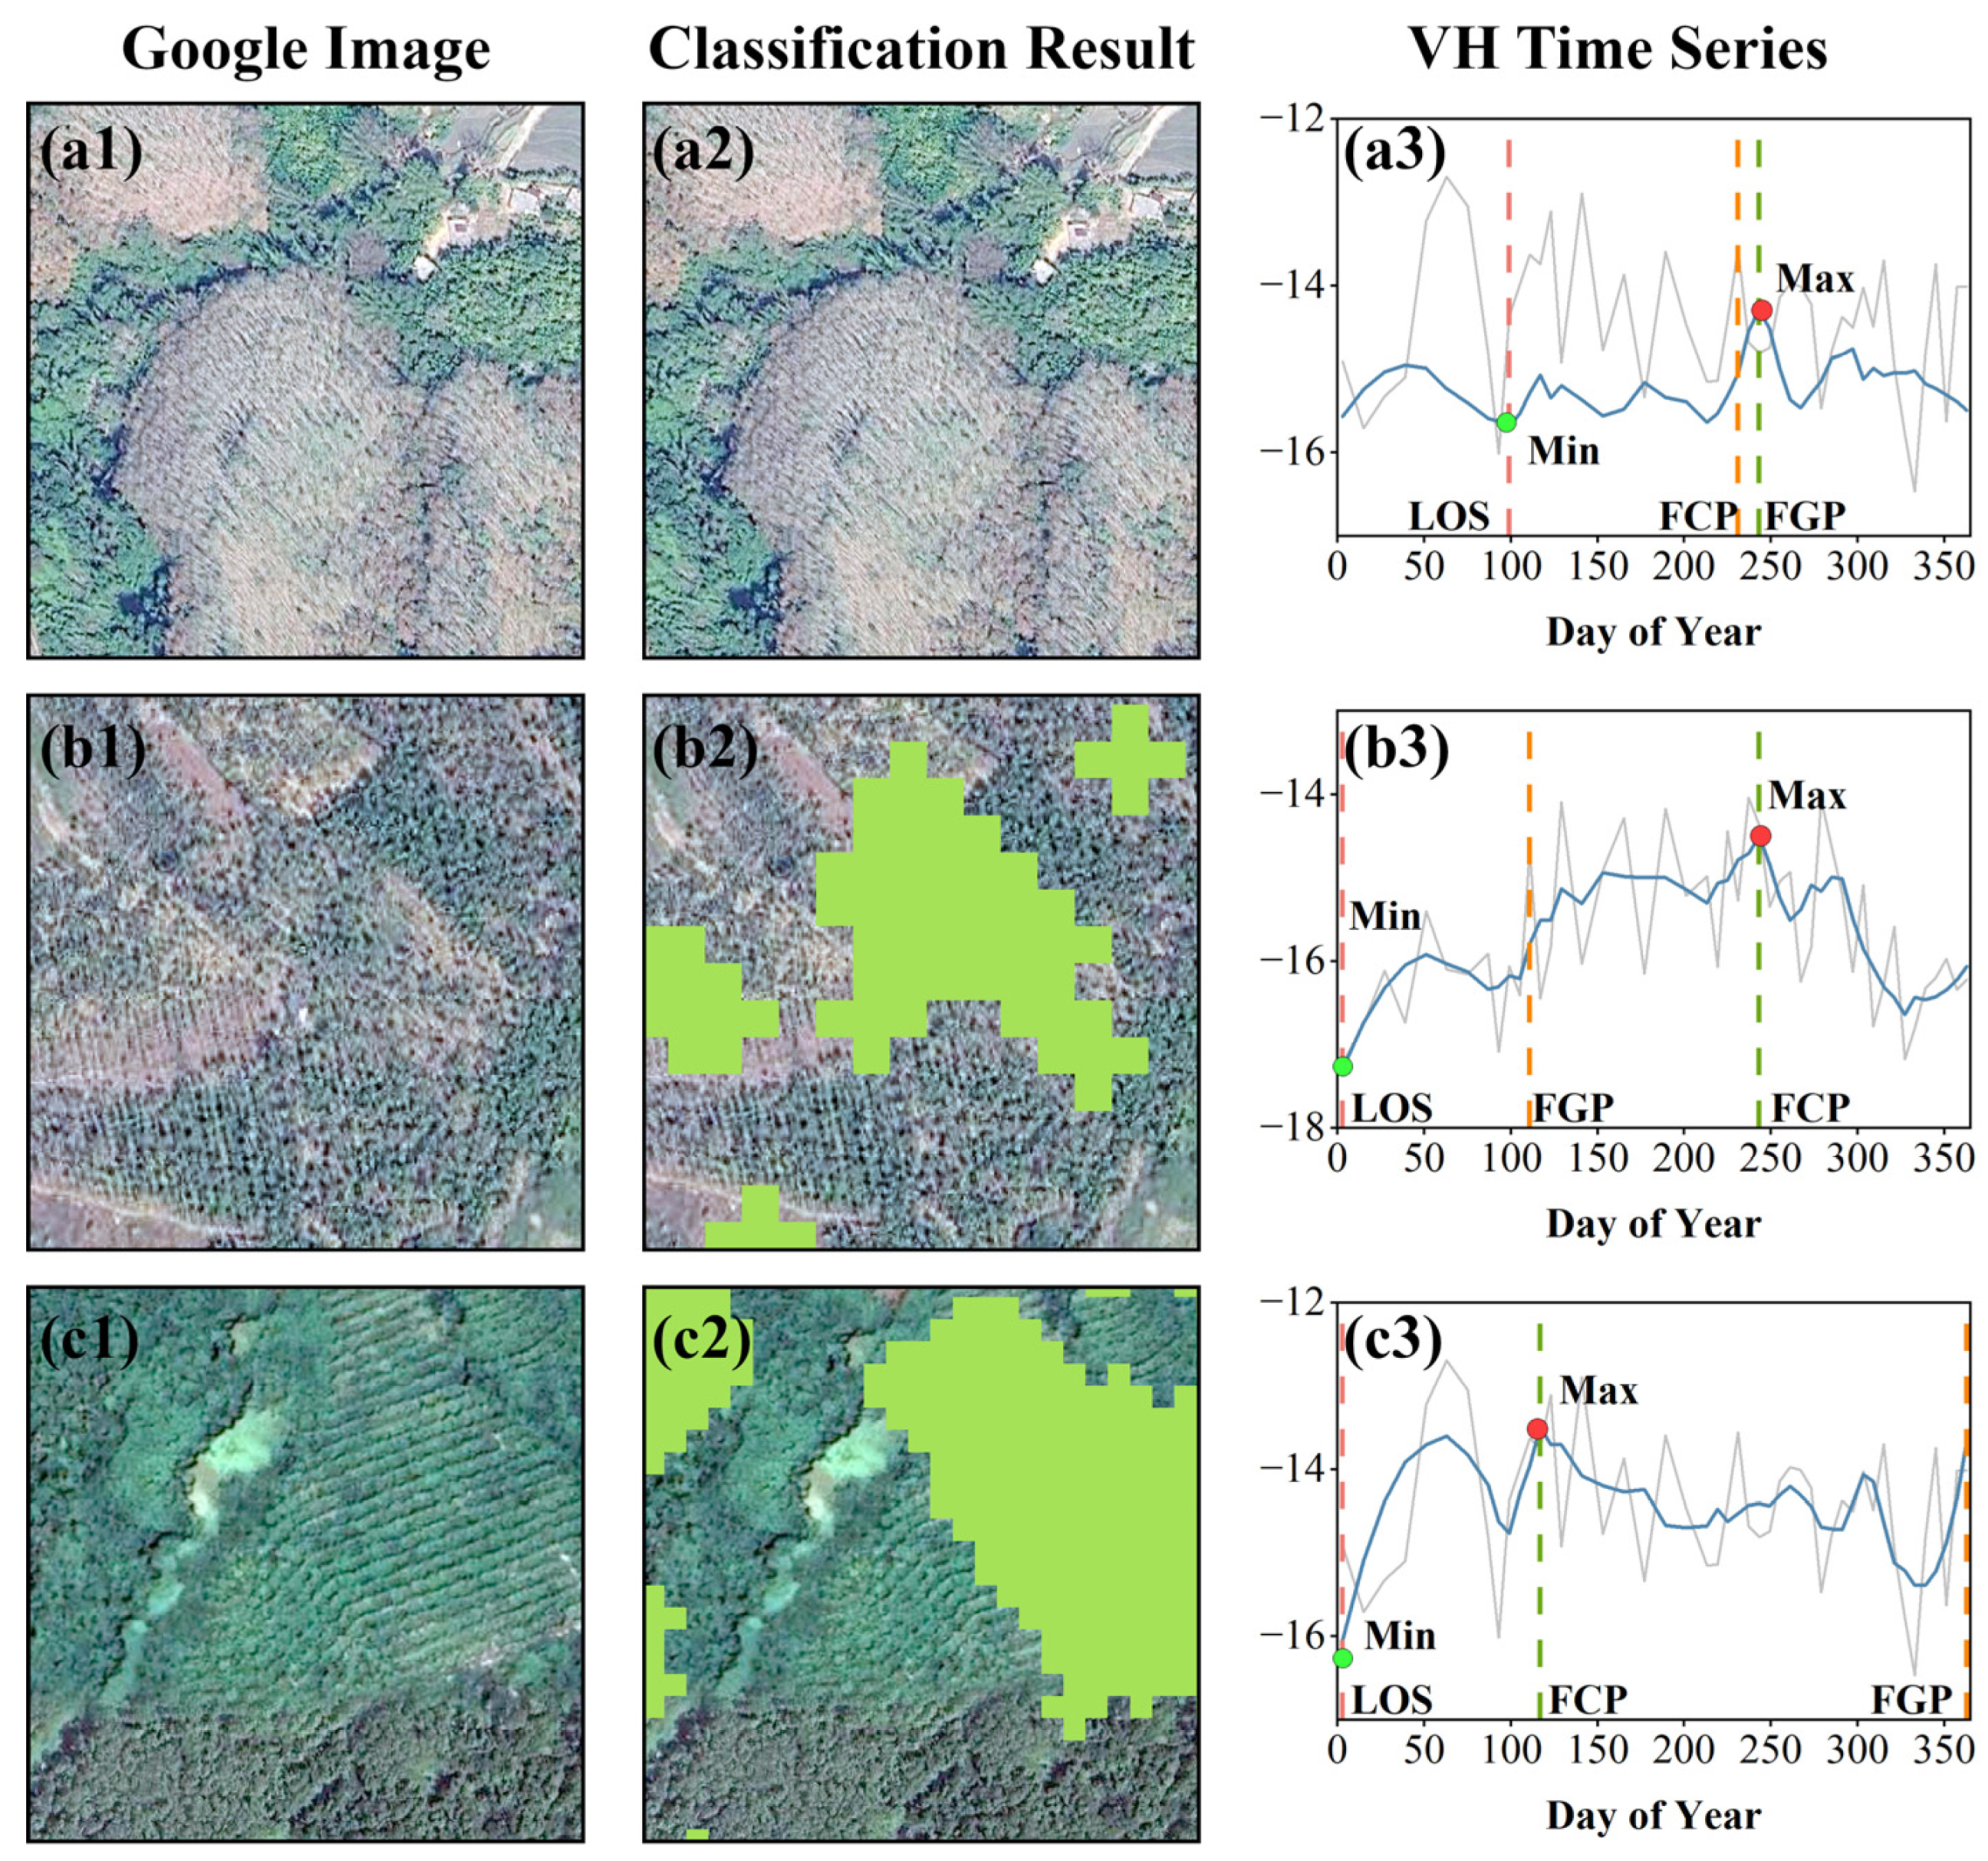
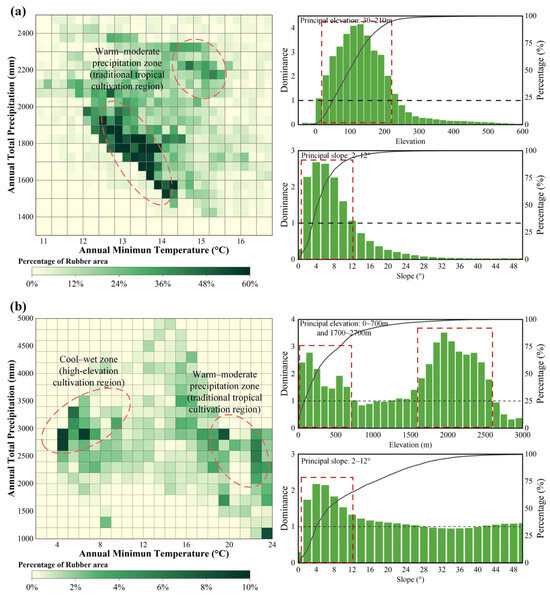
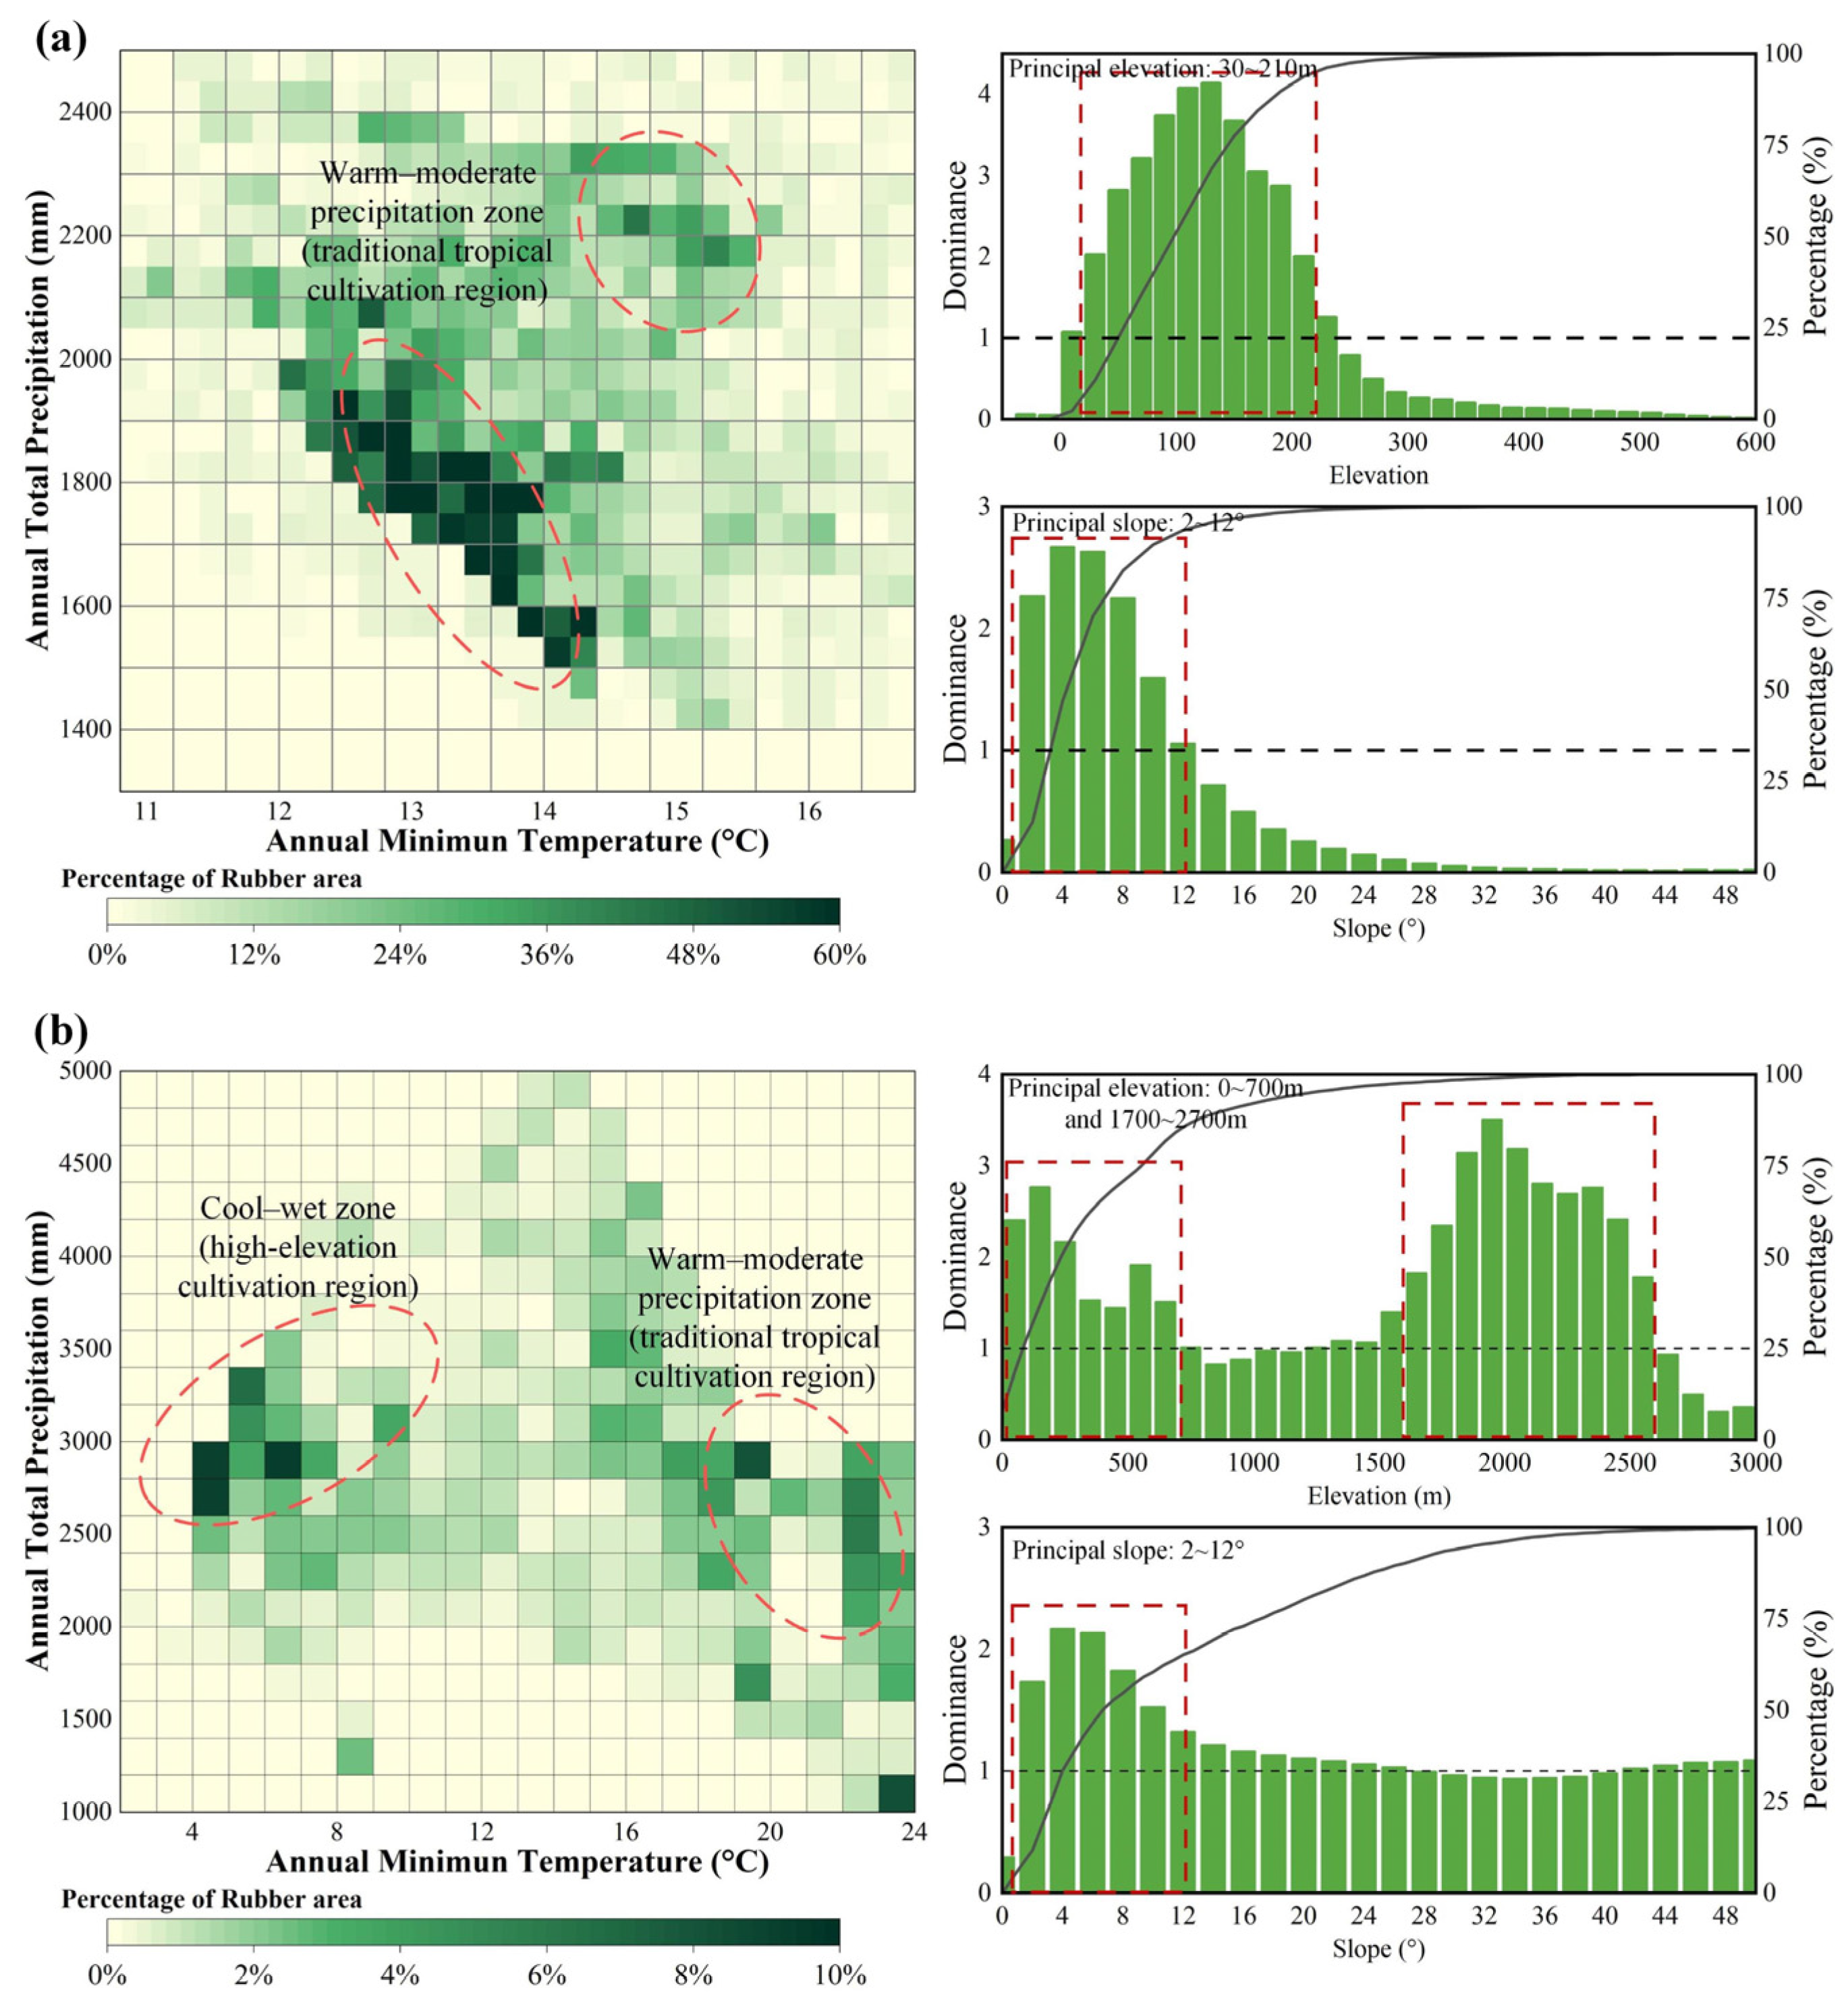

Disclaimer/Publisher’s Note: The statements, opinions and data contained in all publications are solely those of the individual author(s) and contributor(s) and not of MDPI and/or the editor(s). MDPI and/or the editor(s) disclaim responsibility for any injury to people or property resulting from any ideas, methods, instructions or products referred to in the content. |
© 2026 by the authors. Licensee MDPI, Basel, Switzerland. This article is an open access article distributed under the terms and conditions of the Creative Commons Attribution (CC BY) license.