


Highlights
What are the main findings?
- The first comprehensive 18-month ground-based cloud observational record for the Eastern Mediterranean reveals intense seasonal variability, with pure ice clouds (38.4%) and mixed-phase clouds (36.2%, 41.0% combined with mixed-phase precipitating) being the two most frequent phase categories.
- Cyprus exhibits unique cloud characteristics compared to other Cloudnet sites: stronger seasonality than Arctic regions, higher mixed-phase frequency than Central Europe, and a distinct bimodal vertical distribution reflecting both boundary layer processes and large-scale seasonal atmospheric shifts.
What are the implications of the main findings?
- The high occurrence of mixed-phase layers under diverse regional aerosol conditions establishes Cyprus as an ideal natural laboratory for future targeted aerosol–ice nucleation studies.
- The dataset provides an essential baseline for validating satellite cloud products and evaluating climate model performance in the understudied subtropical Eastern Mediterranean, a recognized climate change hotspot.
Abstract
This study presents a comprehensive statistical characterization of cloud vertical structure and phase occurrence over Limassol, Cyprus, using 18 months of continuous ground-based remote sensing observations from the Cyprus Cloud Aerosol and Radiation Experiment (CyCARE) campaign (October 2016–March 2018). The Eastern Mediterranean represents a climatologically complex, understudied subtropical region characterized by strong seasonal variability and frequent exposure to diverse aerosol mixtures, including mineral dust, biomass-burning smoke, marine particles, and anthropogenic pollution. Utilizing the standardized Cloudnet target classification framework, synergistically combining lidar and cloud radar observations, 1,393,659 vertical profiles are analysed, finding that 35% contained hydrometeors. Within these profiles, ice-phase targets occurred in 83.8% of cloud-containing profiles, followed by mixed-phase (33.5%) and liquid-phase (29.2%) targets, with precipitation detected in 32% of cases (these percentages are not mutually exclusive). Cloud occurrence exhibited pronounced seasonality: 57.7% in winter, 23.9% in spring, 17.8% in autumn, and virtually absent in summer (0.6%). Among five mutually exclusive cloud-layer classifications, pure ice clouds were the most frequent (38.4%), narrowly ahead of mixed-phase clouds (36.2%); combined, mixed-phase and mixed-phase precipitating layers together (41.0%) constituted the most frequent phase family overall. These results establish an 18-month observational baseline for evaluating climate model parameterizations, validating satellite-derived cloud products, and guiding future aerosol–cloud interaction studies in this climate-sensitive region.
1. Introduction
Clouds play a fundamental role in the Earth’s climate system, driving both the global hydrologic cycle and the planetary radiation budget. Their climatic impact depends critically on their geometrical, microphysical, and macrophysical properties, such as phase composition, particle size distribution, altitude, and thickness, making them an essential yet highly uncertain component in numerical weather prediction and climate modelling [1,2,3]. To reduce these uncertainties, ground-based remote sensing networks have become indispensable. By combining cloud radar, lidar, and microwave radiometers, these networks provide high-resolution, continuous vertical profiles of cloud structures that are crucial for evaluating model performance and understanding cloud microphysical processes [4,5,6,7,8].
A premier framework for these synergistic observations is Cloudnet, coordinated via the Aerosols, Clouds, and Trace Gases Research Infrastructure (ACTRIS) programme [9,10,11]. By combining instrumental measurements with thermodynamic profiles from atmospheric models, the Cloudnet algorithm suite uniformly derives key parameters such as liquid and ice water content, drizzle microphysics, and target classification types [9,12,13]. Operating across more than 20 stations worldwide, this standardized framework [14] has been successfully leveraged across diverse climatic regimes. Previous applications include the characterization of mixed-phase and supercooled stratiform layers over Leipzig, Germany [5,15], small-scale dynamics and cloud evolution in the Arctic [16,17,18,19], regional cloud climatologies over Southeastern Europe [20], and seasonal aerosol–cloud interactions across the Mediterranean basin [21,22].
Despite these advancements, long-term, high-resolution cloud statistics for subtropical, marine-influenced regions remain scarce. The Eastern Mediterranean—and Cyprus in particular—represents a climatologically complex and meteorologically active hotspot at the crossroads of European, Asian, and African air masses. The region features an extreme seasonal contrast in cloud occurrence. During the cool season, cyclogenesis is frequently dominated by the “Cyprus Low”—a regional depression driven by land–sea temperature contrasts that forces large-scale ascent and cloud formation across multiple atmospheric layers [23,24]. Conversely, during summer, the subtropical high-pressure system suppresses these cyclonic regimes, creating atmospheric conditions highly unfavourable for cloud development.
In addition to these dynamic meteorological factors, Cyprus acts as an ideal natural laboratory for studying aerosol–cloud interactions due to its frequent exposure to diverse aerosol types. The island experiences rapid, year-round transport of marine aerosols, regional biomass burning smoke, anthropogenic pollution, and intense layers of mineral dust from the neighbouring Sahara and Arabian deserts [25,26]. The mineral dust arriving over the Levantine Basin is often relatively fresh compared to the highly aged, polluted dust layers observed over industrialized downwind regions. Retaining a high potential ice nucleation efficiency, these pristine mineral dust layers regularly intersect the moisture reservoirs brought in by winter synoptic depressions (e.g., the Cyprus Low), creating unique conditions for ice formation and mixed-phase cloud evolution.
This study presents the first comprehensive statistical characterization of cloud vertical structures and phase occurrences over Limassol, Cyprus, using 18 months of continuous ground-based observations from the Cyprus Cloud Aerosol and Radiation Experiment (CyCARE) campaign (October 2016–March 2018). Utilizing the Cloudnet target classification scheme, a detailed analysis of cloud occurrence frequencies, geometrical properties (base height, top height, and thickness), phase distributions, and seasonal variability is performed. Finally, these findings are contextualized against other global Cloudnet stations. This work provides a novel baseline dataset essential for climate model validation and satellite product evaluation and establishes the foundation for future detailed aerosol–cloud interaction studies in this climate-sensitive region.
2. Materials and Methods
2.1. The CyCARE Campaign and LACROS Instrumentation
The data analysed in this study were acquired during the CyCARE campaign, a collaborative initiative between Cyprus University of Technology (CUT) and the Leibniz Institute for Tropospheric Research (TROPOS) aimed at advancing understanding of aerosol–cloud interactions in the Eastern Mediterranean. CyCARE served as the ground reference for the A-LIFE (Absorbing aerosol layers in a changing climate: aging, LIFEtime and dynamics) aircraft field experiment conducted in spring 2017, which investigated the atmospheric properties and ageing processes of mixed absorbing aerosols (mineral dust and black carbon) [27].
In the framework of the CyCARE campaign, the Leipzig Aerosol and Cloud Remote Observations System (LACROS) [5] operated continuously in Limassol, Cyprus (34.675°N, 33.043°E, 11 m above sea level) from 19 October 2016 to 25 March 2018. LACROS comprises a comprehensive suite of state-of-the-art remote sensing instruments: (i) a PollyXT Raman polarization lidar [28,29] for aerosol and cloud optical properties; (ii) a Lufft CHM15Kx ceilometer [30,31], providing redundant cloud and aerosol profiling; (iii) a MIRA-35 cloud radar [32,33] for cloud microphysical properties and hydrometeor detection; (iv) a HATPRO-G2 microwave radiometer [34] for atmospheric water vapour and liquid water path retrievals; (v) a Halo Photonics StreamLine XR Doppler wind lidar [35] for atmospheric dynamics; and (vi) a Parsivel2 optical disdrometer [36] for surface precipitation characterization. Figure 1 shows the geographic location of the LACROS station in Limassol and the deployed instrumentation suite.
Figure 1.
The location of the LACROS station (left) and the instruments installed (right). The ceilometer (4) is located between the two containers. The image on the left was created using Google Earth Engine.
2.1.1. PollyXT Raman Lidar
The PollyXT lidar is a 13-channel multi-wavelength Raman polarization lidar system manufactured by TROPOS (Leipzig, Germany), featuring both near-field (355 nm, 387 nm, 532 nm, 532 nm cross-polarized, and 607 nm) and far-field telescopes (355 nm, 355 nm cross-polarized, 387 nm, 407 nm, 532 nm, 532 nm cross-polarized, 607 nm, and 1064 nm). The system provides high-resolution vertical profiles of aerosol and cloud optical and microphysical properties up to 20 km above ground level with 30 s temporal resolution. Key retrieved parameters include particle backscatter coefficient, extinction coefficient, lidar ratio, Ångström exponents, and volume and particle linear depolarization ratios. Detailed technical specifications and calibration procedures are described in Baars et al. [28] and Engelmann et al. [29]. When the PollyXT lidar was not operational (e.g., during maintenance or adverse weather conditions), measurements from the CHM15Kx ceilometer were used to maintain continuity of the observational dataset.
2.1.2. MIRA-35 Cloud Radar
MIRA-35 is a Ka-Band Doppler cloud radar, developed by METEK (Meteorologische Messtechnik GmbH, Elmshorn, Germany), that emits pulses of 35.5 GHz frequency with a repetition rate of 5000 Hz [32]. It has a range resolution of 30.2 m (pulse length of 208 ns), covering a height range between 150 m and 15 km above ground. Averaged profiles of Doppler spectra are stored with a temporal resolution of 1 s to 10 s, depending on the number of coherent and incoherent averages. Thanks to its very high sensitivity at higher altitudes (−53 dBZ at 5 km), it can even detect very thin ice clouds [37]. It provides target classification of cloud droplets, rain drops, ice particles, snowflakes, and atmospheric plankton. The MIRA-35 cloud radar can be used for the determination of: (i) calibrated reflectivity factor, giving information on the concentration and size of particles in the cloud; (ii) Doppler velocity, providing insights into the movement and dynamics of the clouds and precipitation; (iii) spectral width, which is a measure of the turbulence and variability of particle velocities; and (iv) linear depolarization ratio, which is used for distinguishing between different types of particles such as water droplets and ice crystals.
In Figure 2, Contoured Frequency by Altitude Diagrams (CFADs, [38]) of Doppler velocity and radar reflectivity for the time-period under study are presented. Based on a cloud-radar intercomparison experiment during past joint deployments of the LACROS MIRA-35 radar and a 94 GHz cloud radar at Punta Arenas [5] and Leipzig, a bias of around −6 dB in reflectivity was identified. This bias was accounted for throughout the whole processing chain applied in this study. Concerning the frequency density of Doppler velocity (Figure 2a), it can be seen that it is mostly negative across all heights, meaning the distribution is dominated by movements towards the radar (i.e., falling particles). The absence of large positive Doppler velocity values and the high spread of negative values indicate weak updrafts and common stratiform clouds and precipitation conditions [39]. The high negative values (<−4 m/s) at lower levels are characteristic for large precipitating hydrometeors [40]. The reflectivity density plot (Figure 2b) reveals two distinct operational regimes: a low-level maximum concentrated between −30 and −50 dBZ below 2 km representing boundary-layer liquid and mixed-phase stratiform layers, and an upper-tropospheric maximum localized between −15 and −25 dBZ in the 8–10 km altitude zone, corresponding to cirrus and ice cloud structures.
Figure 2.
Contoured frequency by altitude diagrams (CFADs) of (a) Doppler velocity (m/s) and (b) reflectivity (Ze, dBZ) for the time-period October 2016–March 2018.
2.1.3. HATPRO Microwave Radiometer
HATPRO-G2 [34] is a 14-channel ground-based passive microwave radiometer manufactured by Radiometer Physics GmbH—RPG, Meckenheim, Germany. It operates in two frequency bands: the 20–30 GHz range, where the absorption line of water vapour is found, and the 50–60 GHz range, where the oxygen absorption line appears. Operating at a temporal resolution of up to 1 s, the radiometer yields continuous column-integrated liquid water path and integrated water vapour values, alongside retrieved temperature and humidity profiles. More details can be found in the work of Massaro et al. 2015 [41].
2.1.4. CHM15Kx Ceilometer
The CHM15kx [42] is a compact, eye-safe (laser Class 1M) infrared backscatter lidar (ceilometer) built for unattended 24/7 profiling, manufactured by Lufft (Fellbach, Germany). It uses a diode-pumped Nd:YAG microchip laser (1064 nm wavelength) that emits very short (~1 ns) pulses of only ~7–9 µJ at a high pulse rate (5–7 kHz) and very small divergence (<0.5 mrad). The photon-counting APD receiver has a 0.45 mrad field of view and yields an excellent signal-to-noise ratio. In practice, the CHM15k detects clouds and aerosols up to ~15 km altitude, with a native range resolution on the order of 5–15 m and flexible time integration (typically a few seconds to minutes). From the backscatter profiles, it automatically reports cloud-base heights, aerosol backscatter profiles/layer heights and derived parameters (e.g., mixing layer height, cloud penetration depth, and sky condition).
2.1.5. StreamLine XR Doppler Wind Lidar
The StreamLine XR Doppler wind lidar is a high-power, eye-safe 1.5 µm (1565 nm) pulsed heterodyne system [43] developed by Halo Photonics (Lannion, France). It employs an all-sky scanning mirror to cover the full hemispheric field of view (from horizon to zenith), and its enhanced transmitter (higher pulse energy and lower repetition rate) enables aerosol backscatter returns up to ~12 km above ground. Using ~310 ns pulses, the XR achieves a fine range resolution of about 1.5 m along the line-of-sight. It is mainly used to obtain high-resolution vertical profiles of the horizontal wind speed and direction (via standard scan modes like velocity-azimuth-display or Doppler-beam-swing) as well as aerosol backscatter. Detailed technical specifications and performance evaluations of the Halo StreamLine XR are documented in Le et al. [43] and Tzadok et al. [44].
2.1.6. Parsivel2 Optical Disdrometer
The Parsivel2 is a laser-optical disdrometer, manufactured by OTT Hydromet (Kempten, Germany), that measures the size and fall velocity of individual hydrometeors by detecting the extinction (shadowing) they produce as they pass through a thin 780 nm laser sheet (nominal beam ≈ 180 mm × 30 mm × 1 mm, sampling area ≈ 54 cm2). It classifies each particle into 32 size and velocity bins to produce high-resolution drop-size distributions (DSDs) and derives variables such as rain rate, accumulated precipitation, equivalent radar reflectivity, kinetic energy and visibility. It operates at high sampling rates (tens of kHz), is widely used for network and research deployments, and has been extensively evaluated against collocated disdrometers and rain gauges (noting known biases for large drops under intense rain) in several peer-reviewed intercomparison studies [36,45].
2.2. Cloudnet Processing and Target Classification
The Cloudnet target classification followed in this work is extensively described in Illingworth et al. [12] and Tukiainen et al. [14]. The algorithm synergistically combines all data from the various remote-sensing instruments (lidar, radar and microwave radiometer), along with model forecast data, and provides a classification of the various targets in the atmosphere, distinguishing between aerosols, liquid, ice, mixed-phase targets, etc. For the CyCARE dataset, the thermodynamic profiles from two models were used. For the period 19 October 2016–21 January 2018, the fifth-generation European Centre for Medium-Range Weather Forecasts (ECMWF) atmospheric reanalysis of the global climate (ERA5) [46] was used, while for the period 22 January 2018–25 March 2018, the Integrated Forecasting System (IFS) of the ECMWF was used. The transition from ERA5 to operational IFS forecast fields on 22 January 2018 reflects standard practice within the Cloudnet processing chain, which routinely relies on the most recent operationally available ECMWF product where full ERA5 reanalysis coverage is not yet released [14]. Because ERA5 and the operational IFS share the same underlying ECMWF data-assimilation and forecast system, any resulting discontinuity in the derived thermodynamic fields is expected to be small relative to the synoptic and seasonal variability already present in the record. All model forecast data are available in the Cloudnet data portal at https://doi.org/10.60656/69cf4a5e4bb84c98, (accessed on 27 July 2026). These profiles provide temperature, pressure, and humidity fields over Limassol with an hourly temporal resolution, which are temporally interpolated to the measurement time grid. Model profiles are essential for calculating gas attenuation, identifying temperature-dependent cloud phase transitions (supercooled liquid detection), and providing meteorological context for cloud observations.
The Cloudnet target classification vertical profiles are provided at 30 s intervals with a vertical resolution similar to that of the primary cloud radar instrument, which is usually in the range of 30 m. In Figure 3, an example is shown of the various products of the Cloudnet processing suite, including the type of retrievals derived from each instrument and their synergistic use. These include cloud radar data, such as the radar reflectivity factor and Doppler velocity (Figure 3a,b), which refer to the amount of radiation that is backscattered and returned to the radar and the vertical velocity of targets, respectively; lidar data, such as the attenuated backscatter coefficient (Figure 3c), which refers to the amount of radiation backscattered by the atmospheric targets and returned back to the lidar; and Cloudnet algorithm products, such as detection status and target classification (Figure 3d,e).
Figure 3.
Time–height cross-section of (a) radar reflectivity factor, (b) Doppler velocity, (c) attenuated backscatter coefficient, (d) detection status and (e) target classification over Limassol on 10 January 2017 according to the Cloudnet algorithm (v. 2.60.4). All plots were created using the CloudnetPy package (v. 1.86.14) [14].
The Cloudnet target-classification decision tree carries several well-documented sources of uncertainty [9,12]: radar sensitivity limits can cause thin or high cirrus near the noise floor to go undetected; the drizzle/cloud-droplet boundary depends on a reflectivity threshold that can misclassify weak signals near this boundary; and lidar attenuation in optically thick liquid layers can prevent detection of ice phase above the liquid layer, a limitation partially addressed by dedicated post-processing methods [11]. These sources of uncertainty are inherent to the standardized Cloudnet framework and are not specific to the Limassol dataset.
2.3. Cloud Classification Methodology
The Cloudnet target classification scheme [12] assigns each vertical bin to one of ten categories: (1) cloud droplets only, (2) drizzle or rain, (3) drizzle/rain and cloud droplets, (4) ice, (5) ice and supercooled droplets, (6) melting ice, (7) melting ice and cloud droplets, (8) aerosol, (9) insects, or (10) aerosols and insects (Figure 4). This classification is performed using a decision-tree algorithm that considers radar reflectivity, lidar backscatter, Doppler velocity, liquid water path, and atmospheric temperature profiles. The algorithm has been extensively validated and is widely used in the atmospheric science community for cloud research and model evaluation [9,12]. Then, similarly to the work of Pîrloagă et al. [20], a grouping of the hydrometeors was performed. Targets with target classification values (hereafter TCVs) 1–3 are defined as liquid hydrometeors, those with a TCV of 4 are defined as ice hydrometeors, and those with TCVs of 5–7 are defined as mixed-phase hydrometeors (Figure 4, Table 1). The rest of the TCVs correspond to clear sky bins (TCV 0) and to aerosol and/or insects (TCVs 8–10).
Figure 4.
Cloudnet target classification types, hydrometeor classification and cloud classification methodology (Achtert et al. [47]) used in this study. From Pîrloagă et al. [20].
Table 1.
Cloudnet target classification values (TCVs) and hydrometeor grouping criteria used in this study.
For the classification of clouds, the methodology described in Achtert et al. [47] was followed. To define a cloud, at least five consecutive height bins (5 × 30 = 150 m minimum depth) containing hydrometeors, i.e., TCVs 1–7, in a vertical profile are required. In a single profile, multiple clouds can exist if they are separated by at least five height bins with no hydrometeors present, i.e., TCVs 0, 8, 9, and 10. In this case, cloud-base and cloud-top height are defined separately for each cloud. A cloud is defined as liquid if its profile contains only height bins that are classified as cloud droplets only or drizzle/rain and cloud droplets (TCVs 1 and 3). For an ice cloud, all height bins must be classified as ice only (TCV 4). A cloud layer is defined as mixed phase if it contains any possible combination of ice, ice and supercooled droplets, melting ice, melting ice and cloud droplets (TCVs 4–7). A step further is taken for the classification of precipitating clouds. Liquid clouds with drizzle or rain (TCV 2) below cloud base and mixed-phase clouds with drizzle or rain below cloud base are defined as liquid precipitating and mixed-phase precipitating clouds, respectively. So, five cloud classification types were defined: liquid, liquid precipitating, ice, mixed phase and mixed-phase precipitating (Figure 4, Table 2). Statistical analyses were performed on monthly and seasonal time scales to investigate temporal variability and identify characteristic patterns in this 18-month Cyprus cloud dataset. We note that the 18-month record spans a single complete annual cycle (one full summer season and two partial winters), and caution against over-generalizing seasonal statistics—particularly for summer, which is represented by around 1% of profiles—to inter-annual variability beyond this specific period.
Table 2.
Cloud-layer classification criteria (minimum 5 consecutive height bins, 150 m, per Achtert et al. [47]).
To account for the strong temporal autocorrelation among consecutive 30 s profiles belonging to the same physical cloud, the cloud-layer geometry statistics (cloud base, top, and thickness) and the associated five-way cloud-type classification percentages were computed on a per-cloud-event basis rather than per profile. A cloud event was defined as a temporally contiguous sequence of profiles containing a cloud of the same phase type, tolerating gaps of up to 10 consecutive profiles (~5 min) without detection to accommodate brief signal dropouts. Each event contributes one representative value (median base, top, and thickness across its constituent profiles). Profiles containing more than one vertically distinct layer of the same phase type contribute multiple ranked events. Uncertainty estimates (95% confidence intervals) for headline occurrence and phase percentages were derived via block-bootstrap resampling at the level of independent cloud events or observation days rather than individual profiles. For the target-occurrence statistics (Section 3.1), a profile is counted toward a category if at least one height bin of that category is present anywhere in the profile. Since a profile can contain multiple target types, these percentages are not mutually exclusive. The five cloud-layer classification percentages (Section 3.3) are mutually exclusive by construction and sum to 100%.
3. Results
During the CyCARE campaign (19 October 2016–25 March 2018), a total number of 1,393,659 profiles were detected, representing 93% of the maximum number of possible profiles for that time-period. Of these profiles, 35% (488,252 profiles) contained hydrometeors (cloud particles and/or precipitation), while the remaining 65% (905,407 profiles) represented clear-sky conditions or fell below instrument detection limits. The relatively high fraction of clear-sky profiles reflects the characteristic Mediterranean climate of Cyprus, particularly the dominant influence of subtropical high-pressure systems during the warm season.
Data availability varied throughout the campaign (Figure 5), with gaps primarily attributed to instrument maintenance, technical issues and calibration procedures. Most of the missing profiles (green bars in Figure 5) are due to the automated, twice-daily calibration sequence performed on the PollyXT Raman lidar [29]. Despite these interruptions, data coverage exceeded 88% for most months, ensuring a highly robust statistical baseline for seasonal evaluations.
Figure 5.
Data availability for the CyCARE campaign between October 2016 (O16) and March 2018 (M18) (a) as a percentage of the maximum number of possible profiles and (b) as the actual number of profiles. The blue bars represent the profiles containing hydrometeors, the grey bars represent the clear-sky profiles, and the green bars represent the missing profiles.
As already mentioned in the methodology section, to run the Cloudnet processing scheme, weather forecast model data were used from ERA5 and IFS ECMWF. In Figure 6, the monthly means of temperature (Figure 6a) and relative humidity (Figure 6b) are shown over the LACROS station for the period under study. Temperature follows the characteristic annual cycle of mid-latitude areas [48]. At the surface, monthly mean temperatures peaked during July 2017 (28.9 °C) and reached a minimum in January 2017 (8.3 °C). In the mid-troposphere, temperatures ranged from −30 °C during the winter months to −15 °C during the summer months, while in the upper troposphere, temperatures ranged from −60 °C to −45 °C. For relative humidity, the highest values appear during the late autumn and winter months (>70%) close to the surface, when evaporation from the sea is high due to high temperatures (compared to air temperature) and advection is strong [49]. The lowest relative humidity values are seen during the summer months in the upper troposphere (<10%), which is typical for mid-latitude regions [50]. Additionally, a distinct humid layer appears persistently between 7 and 9 km altitude during transitional and winter months (Figure 6b). This feature is associated with the synoptic-scale lofting of mid-to-upper-tropospheric air masses originating over North Africa and the Middle East, which serve as primary pathways for the transport of mineral dust into the Levantine Basin [25,26]. This unpolluted mineral dust functions as a highly efficient reservoir of ice-nucleating particles (INPs). When these elevated dust layers intersect upper-level moisture fields, they may contribute to heterogeneous ice nucleation at temperatures significantly warmer than standard background marine thresholds, which is consistent with the high occurrence of upper-tropospheric ice clouds observed during these months.
Figure 6.
ERA5 and IFS ECMWF monthly means of (a) air temperature (°C) and (b) relative humidity (%) over the LACROS station during the period under study (October 2016–March 2018).
3.1. Cloudnet Target Classification Statistics
As mentioned in the methodology section and shown in Figure 4, the Cloudnet target classification scheme has 10 possible targets, namely cloud droplets, drizzle or rain, drizzle/rain and cloud droplets, ice, ice and supercooled droplets, melting ice, melting ice and cloud droplets, aerosols, insects, and aerosols and insects. Figure 7 shows the frequency distribution of targets as defined by the Cloudnet target classification (a) per profile, (b) per cloudy profile, and (c) per hydrometeor type [21]. (a) For each vertical profile in the dataset, if at least one TCV of a respective target is found, it is counted towards its total. Hence the 100% clear sky target frequency indicates that every profile contains at least one clear-sky bin. (b) The same calculation method as (a) but restricted to profiles that contain any cloud type (bars show the percentage of cloudy profiles in which the target appears at least once). (c) Same rationale as (a) and (b) but focused only on hydrometeor-containing profiles (bars show the frequency percentage of the hydrometeor types present in the relevant profiles). Note that panel (c) uses a logarithmic y-axis to make less frequent hydrometeor types visible.
Figure 7.
Cloudnet target classification frequencies distribution (a) per profile, (b) per cloudy profile, and (c) per hydrometeor target (presented in logarithmic scale) during the CyCARE campaign.
Hydrometeor structures were present in 35% of all vertical profiles recorded during the campaign, while aerosol layers were detected at least once in 93% of all profiles. When evaluating individual target categories independently across the entire dataset (Figure 7a), the cumulative profile-occurrence frequency of all hydrometeor classes reaches approximately 55%, showing the high prevalence of vertically overlapping or multi-layered cloud structures where distinct hydrometeor states coexist within the same column. Within the subset of profiles containing verified cloud layers (Figure 7b), ice-phase targets were present in 83.8% [95% CI: 81.3–86.1%] of cases, mixed-phase targets (TCVs 5–7) were present in 33.5% [30.3–36.5%] of cases, and liquid-phase targets were present in 29.2% [26.5–31.9%] of cases. Precipitation occurred in 32% of all cloudy profiles. It is worth noting that the mixed-phase and liquid target occurrence percentages reported here are the non-overlapping fraction of profiles containing at least one bin of the corresponding TCV group (Table 1) and not the sum of the individual TCV frequencies shown in Figure 7b. Because a single profile may contain more than one TCV belonging to the same hydrometeor group (e.g., both ice and supercooled droplets [TCV 5] and melting ice [TCV 6] within the same column), summing the individual TCV occurrence frequencies would double-count such profiles and yield an inflated value. These statistical allocations naturally sum to greater than 100% because a single vertical column frequently includes multiple cloud types or phase states simultaneously (e.g., an upper-level cirrus layer overlying a lower-level liquid stratiform structure). The high prevalence of ice and mixed-phase clouds indicates frequent formation of clouds extending to altitudes with temperatures below 0 °C, consistent with the synoptic meteorological patterns affecting the Eastern Mediterranean region during the cool season. The frequency distributions of hydrometeor phase per target (Figure 7c) show the absolute domination of the ice phase and drizzle/rain, with percentages of occurrences of 80% and 12%, respectively, followed by mixed phase (5%) and liquid phase (4%) hydrometeors.
Regional and global structural insights emerge when contrasting these statistics with other observational networks. A direct comparison with Cloudnet observations from Finokalia, Crete [21]—a coastal Eastern Mediterranean site with similar climatic conditions—reveals an almost identical aerosol prevalence (92% of profiles), highlighting the spatially homogeneous background of marine, dust, and anthropogenic mixtures across the basin. However, cloud occurrence was slightly higher over Limassol (35%) than over Finokalia (24%), pointing to differing localized thermodynamic or orographic configurations for cloud formation. In terms of hydrometeor phase distribution, both sites are heavily dominated by ice clouds, but Finokalia exhibited a higher proportion of ice-phase occurrences within cloudy profiles (94%) compared to Limassol (83.8%). Conversely, mixed-phase and liquid hydrometeors were more frequently observed in Limassol (33.5% and 29.2%, respectively) than in Finokalia (27% and 8.7%), while drizzle or rain was observed in 32% of cloudy profiles in Limassol versus 12% in Crete. These sub-regional differences reflect localized variability in cloud macrophysics, coastal orography, and boundary layer dynamics between these distinct island settings.
The high abundance of ice-containing clouds at both Mediterranean stations stands out when contrasted with data from global Cloudnet stations situated far from major desert dust sources. Mid-latitude and high-latitude sites such as Leipzig, Germany [15], or Punta Arenas, Chile [5], exhibit structurally constrained mixed-phase layers and a lower overall ice-containing cloud fraction at comparable temperature thresholds. The pronounced overrepresentation of ice and mixed-phase regimes over Cyprus provides an observational fingerprint of the regional aerosol budget. The continuous supply of pristine, unpolluted mineral dust, which is largely isolated from the intensive anthropogenic and hygroscopic chemical coatings that can modify ice nucleation pathways over heavily industrialized regions, may act as an efficient ice-nucleating aerosol source consistent with the regional aerosol climatology reported in previous studies [25,26]. However, ice-cloud formation in this region is governed primarily by humidity and thermodynamic conditions, with aerosol composition a secondary factor that the present dataset cannot isolate.
3.2. Hydrometeor Classification and Statistics
Following the methodology established by Achtert et al. [47] and Pîrloagă et al. [20], as shown in Figure 4, a comprehensive hydrometeor analysis and classification was performed. Figure 8 illustrates the monthly (left panels) and seasonal (right panels) occurrence frequencies as a function of altitude for (a) all types, (b) ice, (c) mixed-phase, and (d) liquid hydrometeors. The highest frequency of all hydrometeor types (Figure 8a) occurred in December 2016 around 2 km altitude (>30%) and in February 2018 around 8 km altitude (>25%), indicating the presence of both low-level maritime boundaries and deep, cold upper-tropospheric cloud systems during the winter season. Conversely, hydrometeors were nearly absent during the summer months, reflecting the strong subsidence and dry conditions typically associated with the subtropical anticyclone over the region (see also Figure 6b).
Figure 8.
Frequency of occurrence for (a) all, (b) ice, (c) mixed phase, and (d) liquid hydrometeors. The values are normalized to the total number of profiles for each month. On the left panels are the monthly frequencies distribution by height, and on the right panels are the seasonal frequencies distribution by height.
Pure ice hydrometeors represented the most prevalent phase state across the campaign (Figure 8b), showing peak frequencies during February 2018 in the upper troposphere and in December 2016 at 2–4 km altitude. The seasonal analysis shows wintertime maxima with 25% frequency during the 2017–2018 season located around 8 km and 20% during 2016–2017 around 2.5 km, illustrating a shift in the dominant altitude of ice occurrence between the two winters within this single observed annual cycle. A direct day-block bootstrap comparison of the two observed winters (Section 2.3) found hydrometeor occurrence percentages of 51.9% [95% CI: 46.1–57.8%] in 2016–2017 versus 54.3% [95% CI: 47.4–60.8%] in 2017–2018. The corresponding difference of 2.4 percentage points [95% CI: −7.0–10.9] was not statistically distinguishable from zero at the 95% level, indicating that the inter-winter difference in overall hydrometeor occurrence is consistent with sampling variability. This result supports the caution noted above against interpreting single-season statistics as representative of inter-annual variability. These occurrences coincide with periods of enhanced upper-level humidity and strong updrafts linked to synoptic scale disturbances. Mixed-phase hydrometeors (Figure 8c) were also most frequent in winter, with a notable occurrence (~10%) around 2 km in December 2016. This vertical arrangement of an ice-producing layer aloft above a supercooled liquid layer is conducive to the seeder–feeder mechanism, whereby falling ice crystals seed and grow in the liquid layer (by vapour deposition and riming), accelerating conversion to precipitating particles. Liquid hydrometeors (Figure 8d) were structurally restricted below 2 km and occurred almost exclusively during winter, representing shallow, warm stratocumulus boundary-layer systems.
These seasonal and vertical distributions are consistent with known thermodynamic and synoptic conditions in the Eastern Mediterranean. Wintertime cyclonic activity enhances convection, transferring humid air masses and promoting cloud formation. Additionally, aerosol availability plays a significant role. The presence of long-range transported dust and maritime aerosols in winter can enhance both cloud condensation nucleus (CCN) and ice-nucleating particle (INP) concentrations, supporting the development of ice and mixed-phase clouds even at mid-altitudes, as was confirmed earlier specifically for stratiform cloud systems [5]. In contrast, summer is characterized by clean, dry and stable conditions, suppressing cloud development entirely.
3.3. Cloud Classification and Statistics
The vertical cloud geometry over Limassol represents a direct manifestation of regional synoptic forcing and cold-cloud microphysics rather than basic localized boundary layer conditions. The cloud geometric characteristics are illustrated in Figure 9, which presents the normalized rate of occurrence of cloud base, top, and thickness.
Figure 9.
Normalized rate of occurrence of cloud (a) base, (b) top and (c) thickness computed per independently identified cloud event at 0.5 km bin resolution. Error bars show 95% bootstrap confidence intervals.
Cloud base heights over Limassol exhibit a bimodal distribution (Figure 9a), resolved in 0.5 km bins with 95% bootstrap confidence intervals, reflecting two distinct cloud-forming mechanisms operating in the Eastern Mediterranean. The dominant peak occurs between 1 and 2.5 km (23.7%), consistent with shallow, boundary-layer maritime stratocumulus clouds. The secondary peak is located between 8 and 10 km (21.9%) and reflects deep, synoptically driven cloud systems that develop in the upper troposphere. This bimodal character is modulated by both the macroscale seasonal dynamics of the Cyprus Low and the microphysical impact of virga.
During the winter season, regional Cyprus Low depressions force intense cyclonic ascent, lifting warm, moist boundary-layer marine air masses into the cold mid- and upper-troposphere, where they interact with elevated desert dust layers. This regional dynamic forcing generates deep, multi-layered cloud systems with cloud tops most commonly concentrated between 8.5 and 11 km (30.7%), suggesting a dominance of high-level cloud layers, followed by a secondary low-level mode between 1 and 3 km (26.4%) corresponding to shallow, warm layers (Figure 9b), mirroring the bimodal pattern of cloud base.
These deep, synoptically forced cloud systems produce significant amounts of frozen precipitation aloft. As these ice crystals descend into drier, sub-cloud atmospheric layers, they form extensive virga structures. The evaporation and sublimation of these falling hydrometeors before reaching the surface is likely to alter ground-based lidar and ceilometer returns, which could skew the apparent cloud base height detection downward and contribute to the observed bimodal distribution. While the impact of virga on apparent cloud base height has been documented at other Cloudnet sites [20,47]—not independently verified here via a dedicated radar–lidar cloud-base comparison—it behaves as a dominant regional trait in Cyprus due to the high frequency of strong ice-producing cloud layers aloft.
This vertically expanded, asymmetrical cloud architecture is structurally distinct from global Cloudnet stations operating in mid-latitude continental or polar climate regimes. In polar regimes, such as Ny-Ålesund [51], mixed-phase clouds are predominantly low-altitude, boundary-layer features trapped below 2–3 km due to persistent low-level radiative cooling. In continental mid-latitudes, such as Bucharest [20] or Leipzig [15], the cloud vertical geometry tracks a more uniform, seasonally symmetric distribution driven primarily by localized thermal convection. Cyprus, by contrast, displays a vertically stretched cloud structure where frequent ice-producing layers aloft regularly interact with lower, abundant supercooled liquid layers. This configuration facilitates a highly effective seeder–feeder mechanism, in which falling ice crystals seed the lower liquid layers, accelerating riming, vapour deposition, and precipitation formation. This highly active cold-rain microphysical pathway explains why nearly one-third (32%) of all cloudy profiles over Limassol register active precipitation echoes.
Cloud thickness (Figure 9c) is heavily concentrated at shallow depths, with 93% of detected clouds being thinner than 2 km and 96.7% thinner than 3 km, with the remaining tail extending to a small number of deeper systems.
Sub-regional comparisons with nearby Finokalia [21] indicate that while shallow clouds (<2 km thick) dominate the statistics at both Eastern Mediterranean sites, clear differences emerge in their vertical cloud placement. In Limassol, low-level clouds with bases below 3 km were observed in over 32.3% of cases, whereas in Finokalia such clouds were less frequent (23%). Conversely, mid-level clouds with bases between 3 and 6 km in height were more prominent in Finokalia (49%) than in Limassol (18.6%). Cloud tops frequently extended into the upper troposphere at both locations: 43.9% of cloud tops were found between 7 and 11 km over Limassol, while 58% reached above 7 km in Finokalia. These sub-regional variations highlight how the local boundary-layer development, coastal orographic influences, and proximity to primary cyclonic paths modulate cloud macrophysics across different coastal sectors of the Eastern Mediterranean basin.
Following the approach of Achtert et al. [47], Figure 10 presents seasonal box-and-whisker distributions of cloud base, top, and thickness. The figure reveals that cloud geometric thickness shows strong seasonal modulation, with the largest geometric depth during winter months when Cyprus Low cyclones are active [24], consistent with the enhanced moisture availability and forced lifting from synoptic systems. Winter clouds show greater vertical extent and more variability than summer clouds (which are extremely rare). This seasonal pattern differs notably from continental sites like Bucharest [20], where the seasonal amplitude is more modest. The extreme winter dominance of deep cloud systems in Cyprus underscores the dominant role of the Cyprus Low in controlling cloud occurrence and properties.
Figure 10.
Box-and-whisker plots of the seasonal distributions of cloud base height (in km, blue colour), cloud top height (in km, brown colour), and cloud thickness (in km, green colour) of (a) ice, (b) mixed phase, (c) mixed-phase precipitating, (d) liquid, and (e) liquid precipitating clouds observed at the LACROS Cloudnet station during the CyCARE campaign (October 2016 to March 2018). The numbers in the parentheses represent the total number of profiles for the type of cloud and for each season.
At first glance, all types of clouds, from deep convective clouds to shallow stratus clouds, are detected over Limassol, confirming the diversity of cloud types in the region. Of the 30,700 independently classified cloud events (Section 2.3), a remarkable minority occurred in summer (1.3% of events), reflecting the strong influence of the summer subtropical anticyclone which promotes stable, dry conditions that inhibit cloud formation. Conversely, most events occurred in winter (53.6%), followed by spring (25.4%) and autumn (19.7%).
Regarding cloud type partition, computed on a per-cloud-event basis (Section 2.3) to avoid overweighting long-lived cloud systems, pure ice clouds were the most frequent single category (38.4% [95% CI: 37.4–39.4%] of events), closely followed by mixed-phase clouds (36.2% [35.2–37.2%]). Liquid clouds comprised 12.5% [11.6–13.5%] of events, liquid precipitating clouds 8.1% [7.0–9.2%] and mixed-phase precipitating clouds 4.8% [4.3–5.4%]. Combined, mixed-phase and mixed-phase precipitating events together (41.0%) constituted the most frequent phase family overall, narrowly exceeding pure ice clouds considered individually. These distributions highlight the regional thermodynamic profile and aerosol influences that favour the formation of mixed-phase and ice clouds, particularly in the colder period of the year, either by enhanced primary ice formation [5] or by an increased frequency of secondary ice formation processes [52].
During the 18-month period of the CyCARE campaign in Limassol, median cloud thickness, computed per independently identified cloud event rather than per profile, ranged from 0.16 to 0.17 km for the shallowest categories up to 0.72 km for mixed-phase precipitating clouds in winter (n = 657), the deepest category observed overall. Cloud base altitude ranged from approximately 1 km (liquid clouds in summer, n = 175) to 8.2 km (mixed-phase clouds in autumn, n = 2027), and cloud-top altitude from approximately 1.2 km (liquid clouds in summer) to 9 km (mixed-phase clouds in spring, n = 2998). Summer sample sizes are small for all categories (n = 23–175) relative to the other seasons (n = 334–6236), and seasonal comparisons involving summer should be interpreted cautiously.
For pure ice clouds (Figure 10a), cloud-top altitude ranged narrowly between 7. 6 km (summer) and 8.9 km (spring), while cloud base was lowest in winter (6.8 km) and highest in autumn (8 km). Median thickness was largest in winter (0.44 km) and smallest in summer (0.25 km, n = 89), a modest but consistent seasonal contrast.
Mixed-phase clouds (Figure 10b) followed a similar pattern, with the greatest median thickness in winter (0.44 km) and the smallest in summer (0.25 km, n = 77). Cloud base ranged from 6.8 km in winter to 8.2 km in autumn, while cloud tops varied between 7.9 km (winter) and 9 km (spring).
For mixed-phase precipitating clouds (Figure 10c), cloud base ranged from 1.7 km in winter to 2.8 km in summer, and cloud top from 2.7 km (winter) to 3 km (summer). This category showed the deepest median thickness of any cloud type in this study, decreasing from winter (0.72 km, n = 657) through spring (0.51 km) and autumn (0.28 km) to a minimum in summer (0.16 km, n = 35). The winter maximum coincides with the season of most frequent and intense Cyprus Low activity [24], consistent with enhanced synoptic-scale moisture convergence and forced ascent during this period.
Liquid clouds (Figure 10d) and liquid precipitating clouds (Figure 10e) showed the shallowest, most stable geometry of any category. Cloud bases ranged 1–2.1 km and cloud tops 1.2–2.3 km across categories and seasons, with median thicknesses consistently between 0.16 and 0.25 km, reflecting their shared formation in shallow boundary-layer conditions with limited vertical development.
The observed seasonal and cloud-type variations over Limassol can be attributed to a combination of thermodynamic profiles, aerosol characteristics and large-scale circulation patterns. During winter and spring, stronger baroclinic activity and frontal systems provide enhanced convection and more humidity, leading to deeper and more extensive clouds, especially ice and mixed-phase types. Aerosol loading during these seasons, comprising both coarse-mode desert dust and transboundary anthropogenic pollution, also affects cloud microphysics, potentially increasing cloud vertical extent and precipitation efficiency. These particles may act as a reservoir of CCN and INPs, which could plausibly contribute to the clouds’ vertical extent and precipitation efficiency via cold-rain processes, consistent with findings at other dust-influenced sites [5,21]. During summer, the persistent subtropical anticyclone induces subsidence and atmospheric stability, reducing cloud occurrence and favouring thinner, higher-altitude ice clouds. While various aerosol species appear over Cyprus year-round, their capacity to initiate droplet activation or ice nucleation is likely to depend strongly on the season. They are vastly more effective during the winter and spring transitional windows, simply because those cooler months provide the necessary thermodynamic forcing, strong updrafts, and moisture fields required to fully exploit the regional aerosol budget.
4. Discussion
The continuous 18-month ground-based remote sensing observations collected over Limassol during the CyCARE campaign provide a standardized, high-resolution baseline for cloud characteristics within the dust-influenced Eastern Mediterranean basin. When contextualized against observations from other global Cloudnet stations across distinct climate regimes, the results reveal unique regional microphysical and macrophysical signatures. However, we note that cross-site comparisons throughout this section should be interpreted with the following caveats: comparator Cloudnet stations differ in observation-period length and season sampled (from short intensive campaigns to multi-year records), in instrument specifications (radar frequency and sensitivity, lidar wavelength), and potentially in the specific version of the target-classification algorithm applied, all of which may contribute to the observed inter-site differences independent of genuine regional climate contrasts.
4.1. Unique Seasonal Dynamics and Cloud Occurrence
A primary distinguishing feature of the cloud regime over Cyprus is its extreme seasonal contrast. Hydrometeors were detected in 35% of the total analysed vertical profiles, exhibiting a pronounced winter maximum of 57.7%, a transitional presence in spring (23.9%) and autumn (17.8%), and dropping down to an almost complete absence in summer (0.6%). This summer minimum contrast distinguishes Cyprus from continental, high-latitude, and even other Southern European stations.
For instance, at the high-latitude Arctic station of Ny-Ålesund, Svalbard, clouds are documented up to 82% of the time annually due to persistent boundary-layer moisture fluxes and low-level radiative cooling [51]. Over continental Southeastern Europe, the Bucharest–Măgurele Cloudnet station displays a far more balanced seasonal distribution, with cloud frequencies reaching 45% in winter, 37% in spring, 14% in autumn, and maintaining a steady background of 4% during the summer months [20].
Even when contrasted against the AGORA ACTRIS station in Granada, Spain—which shares a Mediterranean climate classification—the seasonal suppression over Cyprus is remarkably more severe. Long-term cloud statistics from AGORA indicate that while a distinct summer minimum is present, the station maintains a small but steady background of ice (5.0%) and liquid (1.4%) cloud systems throughout the warmer months [22].
The near-total absence of clouds over Limassol during summer (0.6%) is consistent with the well-documented regional dominance of the descending branch of the Hadley cell during the warm season. This pattern has also been associated in the literature with deep mid-to-upper-tropospheric subsidence linked to the westward amplification of the South Asian High aloft, which interacts with the low-level flow of the Persian Trough over the Levantine Basin [53,54], although verifying these specific dynamical mechanisms directly would require geopotential height, wind, and vertical-velocity fields and is beyond the scope of the current study. Conversely, the wintertime maximum (57.7%) over Cyprus is actively driven by intense baroclinic activity. Regional low-pressure systems, such as the Cyprus Lows, promote deep tropospheric moisture convergence and enhance convective uplift over the warm Mediterranean Sea [24].
4.2. Prevalence and Vertical Architecture of Mixed-Phase and Ice Clouds
Among the profiles containing hydrometeors over Limassol, ice-phase pixels were observed in 83.8% of cases, and mixed-phase clouds were identified in 33.5% of all cloud-containing profiles. This high frequency of mixed-phase structures represents a core characteristic of this dust-influenced region. While Arctic mixed-phase layers are structurally persistent due to localized cloud-top radiative cooling, they are typically trapped at low altitudes, heavily constrained below 2–3 km [51].
Over Cyprus, by contrast, the vertical distribution reveals that mixed-phase environments stretch deeply into the mid-troposphere, frequently spanning altitudes between 3 and 6 km. This vertical expansion is physically linked to the unique aerosol mixing state of the Eastern Mediterranean basin. During the cool and transitional seasons, the region is exposed to intense layers of long-range transported Saharan and Middle Eastern mineral dust [25] that intersect the water vapour reservoirs provided by cyclonic circulation patterns. Coarse-mode mineral dust particles have been shown to act as efficient INPs, capable of triggering heterogeneous ice nucleation via immersion freezing at temperatures significantly warmer (up to −15 °C) than pure marine or background anthropogenic aerosols [5]. If a similar mechanism operates at Limassol, this could plausibly contribute to the elevated vertical boundaries of mixed-phase growth observed here—a hypothesis this dataset’s target-classification framework cannot directly test.
This heavy ice-phase dominance aligns with short-term Cloudnet observations reported for Finokalia, Crete, during the PRE-TECT campaign, where clouds forming directly within elevated dust plumes exhibited a three-fold increase in mixed-phase abundance compared to background marine states [21]. However, the higher overall prevalence of liquid and mixed-phase features observed throughout the longer-term Limassol dataset reveals important sub-regional variations. While both sites lie along primary dust-transport pathways, cloud structures over Limassol may be influenced by interaction between these long-range transported dust and local coastal moisture injection, which could plausibly contribute to the persistence of supercooled liquid layers and the vertical extent of mixed-phase regimes over Cyprus compared to more isolated, open-ocean Mediterranean settings. We emphasize that ice and mixed-phase cloud formation is governed primarily by humidity and thermodynamic structure, with aerosol composition a secondary influence. A rigorous, dust-resolved attribution was beyond the scope of the present target-classification analysis. The dataset presented here nonetheless provides a valuable basis for future studies directly targeting the role of dust in ice and cloud formation over the Eastern Mediterranean, following approaches such as Radenz et al. [5], Seifert et al. [55], Ansmann et al. [56] and He et al. [57].
4.3. Vertical Cloud Geometry and Precipitation Implications
The vertical cloud geometry over Limassol reinforces the central role of cold-cloud microphysics in regulating the regional hydrologic cycle. Pure liquid-phase clouds were found to be vertically shallow across all seasons, maintaining a median thickness of just 0.2–0.3 km. In contrast, mixed-phase precipitating systems displayed the greatest vertical development of any category, with median thickness reaching 0.72 km in winter—modest in absolute terms, but still roughly twice the median thickness of pure ice or non-precipitating mixed-phase clouds in the same season.
This deep geometric structure mirrors long-term patterns documented at the AGORA station in Spain, where single-layer liquid clouds remain thin (≈200–300 m), whereas mixed-phase cloud structures achieve substantially greater vertical depths [22]. This structural expansion directly feeds the cold-rain pathway via the Wegener–Bergeron–Findeisen process, where ice crystals grow rapidly by vapour deposition at the expense of surrounding supercooled droplets.
The extreme vertical thickness characterizing these mixed-phase systems is physically coupled to the presence of extensive ice virga columns. Because these clouds form in highly dynamic environments influenced by the Cyprus Low, strong mid-tropospheric ascent generates large ice water paths aloft. The resulting ice crystals precipitate out of the upper cloud base but encounter drier sub-cloud layers, fine dust aerosol layers, or regional boundary-layer inversions, which delay or entirely inhibit the hydrometeors from reaching the surface as measurable rain.
Rather than indicating a simple extension of the cloud body, this microphysical buffering zone—where precipitation falls and evaporates or sublimates—may be registered by the synergistic radar–lidar suite as a continuous hydrometeor layer. The virga column thus acts as a structural bridge connecting the cold upper-tropospheric ice generation zones with the lower troposphere. This highly efficient macro-microphysical coupling explains why precipitation echoes were registered in nearly one-third (32%) of all hydrometeor-containing profiles over Limassol, highlighting how sensitive the hydrologic cycle of this climate change hotspot is to alterations in regional aerosol loading and sub-cloud thermodynamic structures.
4.4. Limitations and Uncertainties
This study has several limitations. First, the 18-month observational record spans a single annual cycle; summer in particular represents around 1% of profiles, and the reported seasonal statistics should not be assumed to be representative of inter-annual variability beyond this specific period. Second, while the Cloudnet target-classification framework is standardized and widely validated [9,12], it carries inherent uncertainties in cirrus detection, phase boundary classification, and lidar-attenuated retrievals (Section 2.2) that are not independently quantified here. Third, the proposed role of mineral dust in ice and mixed-phase cloud formation is presented as a literature-supported hypothesis rather than a result directly tested by this dataset, since dust-resolved (depolarization-based) aerosol typing was not available for this campaign; a dedicated dust-cloud interaction study is identified as a priority for future work. Fourth, the sub-cloud virga mechanism proposed to explain the bimodal cloud-base distribution (Section 3.3) is likewise consistent with, but not directly quantified by, the present analysis.
5. Conclusions
This study presented a comprehensive cloud observational record for the understudied Eastern Mediterranean, leveraging 18 months of continuous ground-based remote sensing measurements collected during the Cyprus Cloud Aerosol and Radiation Experiment (CyCARE) campaign in Limassol, Cyprus. By implementing the standardized Cloudnet advanced processing framework, this work establishes a robust observational baseline, contextualizing the region’s macrophysical cloud geometries and microphysical phase states against distinct European, continental, and Arctic climate regimes. The main findings of this study are as follows:
- Extreme seasonal asymmetry: Out of 1,393,659 vertical profiles analysed, 35% contained hydrometeors. The cloud regime is dictated by sharp seasonal contrasts, peaking dramatically during the winter months (57.7% of profiles) and being almost completely absent during the summer season (0.6% of profiles), illustrating the overwhelming suppression driven by subtropical anticyclone subsidence.
- Ice-phase prevalence: Within the subset of cloud-containing profiles, the ice phase was highly prevalent, appearing in 83.8% of cases. Mixed-phase hydrometeors were identified in 33.5% of cloudy profiles, while drizzle/rain echoes were recorded in 32% of cases, highlighting the dominance of cold-cloud microphysical transitions over the region.
- Cloud vertical geometry: Cloud geometry reveals a distinct bimodal distribution; cloud-base heights occur most frequently between 1 and 2.5 km (representing marine boundary-layer stratocumulus) and between 8 and 10 km (representing synoptically forced mid-to-upper tropospheric clouds), while cloud tops are concentrated between 8.5 and 11 km (pronounced) and between 1 and 3 km.
- Cloud-phase composition and structure: Pure ice clouds were the most frequent individual cloud-layer classification (38.4%), narrowly ahead of mixed-phase clouds (36.2%); combined, mixed-phase and mixed-phase precipitating layers together (41.0%) represented the most frequent phase family. Mixed-phase precipitating clouds reached a median vertical thickness of up to 0.72 km, modest in absolute terms, but still roughly twice the median thickness of pure ice or non-precipitating mixed-phase clouds, consistent with efficient cold-rain processes contributing to precipitation in roughly one-third (32%) of cloudy profiles.
These unique characteristics confirm that the Eastern Mediterranean behaves as a complex atmospheric crossroad. This vertical architecture is heavily modulated by the interplay between Mediterranean cyclonic dynamics, specifically Cyprus Low depressions, and persistent layers of long-range transported mineral dust that act as highly efficient ice-nucleating particles at temperatures well above standard background activation thresholds.
To the best of the authors’ knowledge, this work represents the first synergistic high-resolution cloud radar–lidar analysis conducted in Cyprus. These datasets establish an essential observational baseline for verifying regional climate models and validating spaceborne cloud-profiling sensors. To build upon these findings and capture multi-annual cloud evolution under changing aerosol regimes, the continuous operation of the newly established Cyprus Atmospheric Remote Sensing Observatory (CARO), operational since June 2024 as a full ACTRIS national facility, will provide the vital, long-term data repository necessary to unravel ongoing aerosol–cloud–climate feedback in this critical climate change hotspot.
Author Contributions
Conceptualization, G.K.; methodology, G.K.; software, G.K.; validation, G.K.; formal analysis, G.K.; investigation, G.K.; resources, G.K.; data curation, G.K.; writing—original draft preparation, G.K.; writing—review and editing, all authors; visualization, G.K.; supervision, R.-E.M.; funding acquisition, R.-E.M. All authors have read and agreed to the published version of the manuscript.
Funding
This research received funding from the EXCELSIOR project (grant Agreement No 857510).
Data Availability Statement
The data used in this study were generated by the Aerosol, Clouds and Trace Gases Research Infrastructure (ACTRIS) and are available from the ACTRIS Cloudnet Data Centre using the following link: https://doi.org/10.60656/4e34bba3cc1e4323, (accessed on 27 July 2026).
Acknowledgments
The authors acknowledge the ‘EXCELSIOR’: ERATOSTHENES: EΧcellence Research Centre for Earth Surveillance and Space-Based Monitoring of the Environment H2020 Widespread Teaming project www.excelsior2020.eu (accessed on 27 July 2026). The ‘EXCELSIOR’ project has received funding from the European Union’s Horizon 2020 research and innovation programme under Grant Agreement No 857510, from the Government of the Republic of Cyprus through the Directorate General for the European Programmes, Coordination and Development and the Cyprus University of Technology. This study was supported by the ATARRI Horizon Europe Widespread Twinning Project. ATARRI receives funding from the European Union’s Horizon Europe Twinning Call (HORIZON-WIDERA-2023-ACCESS-02) under grant agreement No. 101160258. The authors acknowledge ACTRIS and Finnish Meteorological Institute for providing the dataset. The authors acknowledge ECMWF for providing IFS model data and ERA5 model reanalysis data.
Conflicts of Interest
The authors declare no conflicts of interest.
References
- Boucher, O.; Randall, D.; Artaxo, P.; Bretherton, C.; Feingold, G.; Forster, P.; Kerminen, V.-M.; Kondo, Y.; Liao, H.; Lohmann, U.; et al. Clouds and aerosols. In Climate Change 2013: The Physical Science Basis. Contribution of Working Group I to the Fifth Assessment Report of the Intergovernmental Panel on Climate Change; Stocker, T.F., Qin, D., Plattner, G.-K., Tignor, M., Allen, S.K., Boschung, J., Nauels, A., Xia, Y., Bex, V., Midgley, P.M., Eds.; Cambridge University Press: Cambridge, UK, 2013; pp. 571–657. [Google Scholar] [CrossRef] [Scilit]
- Seinfeld, J.H.; Bretherton, C.; Carslaw, K.S.; Coe, H.; DeMott, P.J.; Dunlea, E.J.; Feingold, G.; Ghan, S.; Guenther, A.B.; Kahn, R.; et al. Improving our fundamental understanding of the role of aerosol–cloud interactions in the climate system. Proc. Natl. Acad. Sci. USA 2016, 113, 5781–5790. [Google Scholar] [CrossRef] [Scilit] [PubMed]
- IPCC. Climate Change 2023: Synthesis Report. Contribution of Working Groups I, II and III to the Sixth Assessment Report of the Intergovernmental Panel on Climate Change; Lee, H., Romero, J., Eds.; IPCC: Geneva, Switzerland, 2023; pp. 35–115. [Google Scholar] [CrossRef] [Scilit]
- Kneifel, S.; Moisseev, D. Long-Term Statistics of Riming in Nonconvective Clouds Derived from Ground-Based Doppler Cloud Radar Observations. J. Atmos. Sci. 2020, 77, 3495–3508. [Google Scholar] [CrossRef] [Scilit]
- Radenz, M.; Bühl, J.; Seifert, P.; Baars, H.; Engelmann, R.; Barja González, B.; Mamouri, R.-E.; Zamorano, F.; Ansmann, A. Hemispheric contrasts in ice formation in stratiform mixed-phase clouds: Disentangling the role of aerosol and dynamics with ground-based remote sensing. Atmos. Chem. Phys. 2021, 21, 17969–17994. [Google Scholar] [CrossRef] [Scilit]
- Ohneiser, K.; Ansmann, A.; Chudnovsky, A.; Engelmann, R.; Ritter, C.; Veselovskii, I.; Baars, H.; Gebauer, H.; Griesche, H.; Radenz, M.; et al. The unexpected smoke layer in the High Arctic winter stratosphere during MOSAiC 2019–2020. Atmos. Chem. Phys. 2021, 21, 15783–15808. [Google Scholar] [CrossRef] [Scilit]
- Ansmann, A.; Ohneiser, K.; Engelmann, R.; Radenz, M.; Griesche, H.; Hofer, J.; Althausen, D.; Creamean, J.M.; Boyer, M.C.; Knopf, D.A.; et al. Annual cycle of aerosol properties over the central Arctic during MOSAiC 2019–2020—Light-extinction, CCN, and INP levels from the boundary layer to the tropopause. Atmos. Chem. Phys. 2023, 23, 12821–12849. [Google Scholar] [CrossRef] [Scilit]
- Chellini, G.; Gierens, R.; Ebell, K.; Kiszler, T.; Krobot, P.; Myagkov, A.; Schemann, V.; Kneifel, S. Low-level mixed-phase clouds at the high Arctic site of Ny-Ålesund: A comprehensive long-term dataset of remote sensing observations. Earth Syst. Sci. Data 2023, 15, 5427–5448. [Google Scholar] [CrossRef] [Scilit]
- Hogan, R.J.; Illingworth, A.J.; O’Connor, E.J.; Bouniol, D.; Brooks, M.E.; Delanoë, J.; Donovan, D.P.; Eastment, J.D.; Gaussiat, N.; Goddard, J.W.F.; et al. Cloudnet: Evaluation of model clouds using ground-based observations. In Proceedings of the ECMWF Workshop on Parametrization of Clouds in Large-Scale Models, Reading, UK, 13–15 November 2006. [Google Scholar]
- Morcrette, C.J.; O’Connor, E.J.; Petch, J.C. Evaluation of two cloud parametrization schemes using ARM and Cloud-Net observations. Q. J. R. Meteorol. Soc. 2012, 138, 964–979. [Google Scholar] [CrossRef] [Scilit]
- Schimmel, W.; Kalesse-Los, H.; Maahn, M.; Vogl, T.; Foth, A.; Garfias, P.S.; Seifert, P. Identifying cloud droplets beyond lidar attenuation from vertically pointing cloud radar observations using artificial neural networks. Atmos. Meas. Tech. 2022, 15, 5343–5366. [Google Scholar] [CrossRef] [Scilit]
- Illingworth, A.J.; Hogan, R.J.; O’Connor, E.J.; Bouniol, D.; Brooks, M.E.; Delanoë, J.; Donovan, D.P.; Eastment, J.D.; Gaussiat, N.; Goddard, J.W.F.; et al. Cloudnet: Continuous evaluation of cloud profiles in seven operational models using ground-based observations. Bull. Am. Meteorol. Soc. 2007, 88, 883–898. [Google Scholar] [CrossRef] [Scilit]
- O’Connor, E.J.; Hogan, R.J.; Illingworth, A.J. Retrieving Stratocumulus Drizzle Parameters Using Doppler Radar and Lidar. J. Appl. Meteorol. 2005, 44, 14–27. [Google Scholar] [CrossRef] [Scilit]
- Tukiainen, S.; O’Connor, E.; Korpinen, A. CloudnetPy: A Python package for processing cloud remote sensing data. J. Open Source Softw. 2020, 5, 2123. [Google Scholar] [CrossRef] [Scilit]
- Bühl, J.; Seifert, P.; Myagkov, A.; Ansmann, A. Measuring ice- and liquid-water properties in mixed-phase cloud layers at the Leipzig Cloudnet station. Atmos. Chem. Phys. 2016, 16, 10609–10620. [Google Scholar] [CrossRef] [Scilit]
- Schemann, V.; Ebell, K. Simulation of mixed-phase clouds with the ICON large-eddy model in the complex Arctic environment around Ny-Ålesund. Atmos. Chem. Phys. 2020, 20, 475–485. [Google Scholar] [CrossRef] [Scilit]
- Saavedra Garfias, P.; Kalesse-Los, H.; von Albedyll, L.; Griesche, H.; Spreen, G. Asymmetries in cloud microphysical properties ascribed to sea ice leads via water vapour transport in the central Arctic. Atmos. Chem. Phys. 2023, 23, 14521–14546. [Google Scholar] [CrossRef] [Scilit]
- Jimenez, C.; Ansmann, A.; Ohneiser, K.; Griesche, H.; Engelmann, R.; Radenz, M.; Hofer, J.; Althausen, D.; Knopf, D.A.; Dahlke, S.; et al. Life cycle studies and liquid-phase characterization of Arctic mixed-phase clouds: MOSAiC 2019–2020 results. EGUsphere 2025. [Google Scholar] [CrossRef] [Scilit]
- Griesche, H.J.; Seifert, P.; Engelmann, R.; Radenz, M.; Hofer, J.; Althausen, D.; Walbröl, A.; Barrientos-Velasco, C.; Baars, H.; Dahlke, S.; et al. Cloud micro- and macrophysical properties from ground-based remote sensing during the MOSAiC drift experiment. Sci. Data 2024, 11, 505. [Google Scholar] [CrossRef] [Scilit] [PubMed]
- Pîrloagă, R.; Ene, D.; Boldeanu, M.; Antonescu, B.; O’Connor, E.J.; Ştefan, S. Ground-Based Measurements of Cloud Properties at the Bucharest–Măgurele Cloudnet Station: First Results. Atmosphere 2022, 13, 1445. [Google Scholar] [CrossRef] [Scilit]
- Marinou, E.; Voudouri, K.A.; Tsikoudi, I.; Drakaki, E.; Tsekeri, A.; Rosoldi, M.; Ene, D.; Baars, H.; O’Connor, E.; Amiridis, V.; et al. Geometrical and Microphysical Properties of Clouds Formed in the Presence of Dust above the Eastern Mediterranean. Remote Sens. 2021, 13, 5001. [Google Scholar] [CrossRef] [Scilit]
- Tolentino, M.; Bravo-Aranda, J.A.; Guerrero-Rascado, J.L.; Navas-Guzmán, F.; Pérez-Ramírez, D.; Alados-Arboledas, L.; Granados-Muñoz, M.J. Long-term cloud characterization at the AGORA ACTRIS-CCRES station using a novel classification algorithm. Atmos. Meas. Tech. 2026, 19, 2079–2102. [Google Scholar] [CrossRef] [Scilit]
- Trigo, I.F.; Davies, T.D.; Bigg, G.R. Objective Climatology of Cyclones in the Mediterranean Region. J. Clim. 1999, 12, 1685–1696. [Google Scholar] [CrossRef] [Scilit]
- Kotsias, G.; Lolis, C.; Hatzianastassiou, N.; Bakas, N.; Lionello, P.; Bartzokas, A. Objective climatology and classification of the Mediterranean cyclones based on the ERA5 data set and the use of the results for the definition of seasons. Theor. Appl. Climatol. 2023, 152, 581–597. [Google Scholar] [CrossRef] [Scilit]
- Mamouri, R.E.; Ansmann, A.; Nisantzi, A.; Solomos, S.; Kallos, G.; Hadjimitsis, D.G. Extreme dust storm over the eastern Mediterranean in September 2015: Satellite, lidar, and surface observations in the Cyprus region. Atmos. Chem. Phys. 2016, 16, 13711–13724. [Google Scholar] [CrossRef] [Scilit]
- Nisantzi, A.; Mamouri, R.E.; Ansmann, A.; Hadjimitsis, D. Injection of mineral dust into the free troposphere during fire events observed with polarization lidar at Limassol, Cyprus. Atmos. Chem. Phys. 2014, 14, 12155–12165. [Google Scholar] [CrossRef] [Scilit]
- Groß, S.; Freudenthaler, V.; Haarig, M.; Ansmann, A.; Toledano, C.; Mateos, D.; Seibert, P.; Mamouri, R.-E.; Nisantzi, A.; Gasteiger, J.; et al. Characterization of aerosol over the eastern Mediterranean by polarization-sensitive Raman lidar measurements during A-LIFE—Aerosol type classification and type separation. Atmos. Chem. Phys. 2025, 25, 3191–3211. [Google Scholar] [CrossRef] [Scilit]
- Baars, H.; Kanitz, T.; Engelmann, R.; Althausen, D.; Heese, B.; Komppula, M.; Preißler, J.; Tesche, M.; Ansmann, A.; Wandinger, U.; et al. An overview of the first decade of PollyNET: An emerging network of automated Raman-polarization lidars for continuous aerosol profiling. Atmos. Chem. Phys. 2016, 16, 5111–5137. [Google Scholar] [CrossRef] [Scilit]
- Engelmann, R.; Kanitz, T.; Baars, H.; Heese, B.; Althausen, D.; Skupin, A.; Wandinger, U.; Komppula, M.; Stachlewska, I.S.; Amiridis, V.; et al. The automated multiwavelength Raman polarization and water-vapor lidar PollyXT: The neXT generation. Atmos. Meas. Tech. 2016, 9, 1767–1784. [Google Scholar] [CrossRef] [Scilit]
- Heese, B.; Flentje, H.; Althausen, D.; Ansmann, A.; Frey, S. Ceilometer lidar comparison: Backscatter coefficient retrieval and signal-to-noise ratio determination. Atmos. Meas. Tech. 2010, 3, 1763–1770. [Google Scholar] [CrossRef] [Scilit]
- Brunamonti, S.; Martucci, G.; Romanens, G.; Poltera, Y.; Wienhold, F.G.; Hervo, M.; Haefele, A.; Navas-Guzmán, F. Validation of aerosol backscatter profiles from Raman lidar and ceilometer using balloon-borne measurements. Atmos. Chem. Phys. 2021, 21, 2267–2285. [Google Scholar] [CrossRef] [Scilit]
- Görsdorf, U.; Lehmann, V.; Bauer-Pfundstein, M.; Peters, G.; Vavriv, D.; Vinogradov, V.; Volkov, V. A 35-GHz Polarimetric Doppler Radar for Long-Term Observations of Cloud Parameters—Description of System and Data Processing. J. Atmos. Ocean. Technol. 2015, 32, 675–690. [Google Scholar] [CrossRef] [Scilit]
- Myagkov, A.; Seifert, P.; Bauer-Pfundstein, M.; Wandinger, U. Cloud radar with hybrid mode towards estimation of shape and orientation of ice crystals. Atmos. Meas. Tech. 2016, 9, 469–489. [Google Scholar] [CrossRef] [Scilit]
- Rose, T.; Crewell, S.; Löhnert, U.; Simmer, C. A network suitable microwave radiometer for operational monitoring of the cloudy atmosphere. Atmos. Res. 2005, 75, 183–200. [Google Scholar] [CrossRef] [Scilit]
- Pearson, G.; Davies, F.; Collier, C. An Analysis of the Performance of the UFAM Pulsed Doppler Lidar for Observing the Boundary Layer. J. Atmos. Ocean. Technol. 2009, 26, 240–250. [Google Scholar] [CrossRef] [Scilit]
- Tokay, A.; Wolff, D.B.; Petersen, W.A. Evaluation of the New Version of the Laser-Optical Disdrometer, OTT Parsivel2. J. Atmos. Ocean. Technol. 2014, 31, 1276–1288. [Google Scholar] [CrossRef] [Scilit]
- Melchionna, S.; Bauer, M.; Peters, G. A new algorithm for the extraction of cloud parameters using multipeak analysis of cloud radar data—First application and preliminary results. Meteorol. Z. 2008, 17, 613–620. [Google Scholar] [CrossRef] [Scilit] [PubMed]
- Masunaga, H.; Satoh, M.; Miura, H. A joint satellite and global cloud-resolving model analysis of a Madden-Julian Oscillation event: Model diagnosis. J. Geophys. Res. Atmos. 2008, 113, D17210. [Google Scholar] [CrossRef] [Scilit]
- Rao, T.N.; Kirankumar, N.V.P.; Radhakrishna, B.; Rao, D.N.; Nakamura, K. Classification of Tropical Precipitating Systems Using Wind Profiler Spectral Moments. Part II: Statistical Characteristics of Rainfall Systems and Sensitivity Analysis. J. Atmos. Ocean. Technol. 2008, 25, 898–908. [Google Scholar] [CrossRef] [Scilit]
- Ansmann, A.; Fruntke, J.; Engelmann, R. Updraft and downdraft characterization with Doppler lidar: Cloud-free versus cumuli-topped mixed layer. Atmos. Chem. Phys. 2010, 10, 7845–7858. [Google Scholar] [CrossRef] [Scilit]
- Massaro, G.; Stiperski, I.; Pospichal, B.; Rotach, M.W. Accuracy of retrieving temperature and humidity profiles by ground-based microwave radiometry in truly complex terrain. Atmos. Meas. Tech. 2015, 8, 3355–3367. [Google Scholar] [CrossRef] [Scilit]
- Li, D.; Wu, Y.; Gross, B.; Moshary, F. Capabilities of an Automatic Lidar Ceilometer to Retrieve Aerosol Characteristics within the Planetary Boundary Layer. Remote Sens. 2021, 13, 3626. [Google Scholar] [CrossRef] [Scilit]
- Le, V.; Lobo, H.; O’Connor, E.J.; Vakkari, V. Long-term aerosol particle depolarization ratio measurements with HALO Photonics Doppler lidar. Atmos. Meas. Tech. 2024, 17, 921–941. [Google Scholar] [CrossRef] [Scilit]
- Tzadok, T.; Ronen, A.; Rostkier-Edelstein, D.; Agassi, E.; Avisar, D.; Berkovic, S.; Manor, A. Profiling the Planetary Boundary Layer Wind with a StreamLine XR Doppler LiDAR: Comparison to In-Situ Observations and WRF Model Simulations. Remote Sens. 2022, 14, 4264. [Google Scholar] [CrossRef] [Scilit]
- Angulo-Martínez, M.; Beguería, S.; Latorre, B.; Fernández-Raga, M. Comparison of precipitation measurements by OTT Parsivel2 and Thies LPM optical disdrometers. Hydrol. Earth Syst. Sci. 2018, 22, 2811–2837. [Google Scholar] [CrossRef] [Scilit]
- Hersbach, H.; Bell, B.; Berrisford, P.; Hirahara, S.; Horányi, A.; Muñoz-Sabater, J.; Nicolas, J.; Peubey, C.; Radu, R.; Schepers, D.; et al. The ERA5 global reanalysis. Q. J. R. Meteorol. Soc. 2020, 146, 1999–2049. [Google Scholar] [CrossRef] [Scilit]
- Achtert, P.; O’Connor, E.J.; Brooks, I.M.; Sotiropoulou, G.; Shupe, M.D.; Pospichal, B.; Brooks, B.J.; Tjernström, M. Properties of Arctic liquid and mixed-phase clouds from shipborne Cloudnet observations during ACSE 2014. Atmos. Chem. Phys. 2020, 20, 14983–15002. [Google Scholar] [CrossRef] [Scilit]
- Lembo, V.; Bordi, I.; Speranza, A. Annual and semiannual cycles of midlatitude near-surface temperature and tropospheric baroclinicity: Reanalysis data and AOGCM simulations. Earth Syst. Dyn. 2017, 8, 295–312. [Google Scholar] [CrossRef] [Scilit]
- Schicker, I.; Radanovics, S.; Seibert, P. Origin and transport of Mediterranean moisture and air. Atmos. Chem. Phys. 2010, 10, 5089–5105. [Google Scholar] [CrossRef] [Scilit]
- Gettelman, A.; Collins, W.D.; Fetzer, E.J.; Eldering, A.; Irion, F.W.; Duffy, P.B.; Bala, G. Climatology of Upper-Tropospheric Relative Humidity from the Atmospheric Infrared Sounder and Implications for Climate. J. Clim. 2006, 19, 6104–6121. [Google Scholar] [CrossRef] [Scilit]
- Nomokonova, T.; Ebell, K.; Löhnert, U.; Maturilli, M.; Ritter, C.; O’Connor, E. Statistics on clouds and their relation to thermodynamic conditions at Ny-Ålesund using ground-based sensor synergy. Atmos. Chem. Phys. 2019, 19, 4105–4126. [Google Scholar] [CrossRef] [Scilit]
- Korolev, A.; Leisner, T. Review of experimental studies of secondary ice production. Atmos. Chem. Phys. 2020, 20, 11767–11797. [Google Scholar] [CrossRef] [Scilit]
- Tyrlis, E.; Lelieveld, J.; Steil, B. The summer circulation over the eastern Mediterranean and the Middle East: Influence of the South Asian monsoon. Clim. Dyn. 2013, 40, 1103–1123. [Google Scholar] [CrossRef] [Scilit]
- Kotsias, G.; Lolis, C.J. A study on the total cloud cover variability over the Mediterranean region during the period 1979–2014 with the use of the ERA-Interim database. Theor. Appl. Climatol. 2018, 134, 325–336. [Google Scholar] [CrossRef] [Scilit]
- Seifert, P.; Ansmann, A.; Mattis, I.; Wandinger, U.; Tesche, M.; Engelmann, R.; Müller, D.; Pérez, C.; Haustein, K. Saharan dust and heterogeneous ice formation: Eleven years of cloud observations at a central European EARLINET site. J. Geophys. Res. 2010, 115, D20201. [Google Scholar] [CrossRef] [Scilit]
- Ansmann, A.; Mamouri, R.-E.; Bühl, J.; Seifert, P.; Engelmann, R.; Hofer, J.; Nisantzi, A.; Atkinson, J.D.; Kanji, Z.A.; Sierau, B.; et al. Ice-nucleating particle versus ice crystal number concentration in altocumulus and cirrus layers embedded in Saharan dust: A closure study. Atmos. Chem. Phys. 2019, 19, 15087–15115. [Google Scholar] [CrossRef] [Scilit]
- He, Y.; Seifert, P.; Jimenez, C.; Radenz, M.; Ansmann, A.; Bühl, J.; Mamouri, R.-E.; González, B.B. Response of mixed-phase cloud microphysics to aerosol perturbations at the contrasting sites of Limassol, Cyprus, and Punta Arenas, Chile. J. Geophys. Res. Atmos. 2025, 130, e2024JD043157. [Google Scholar] [CrossRef] [Scilit]
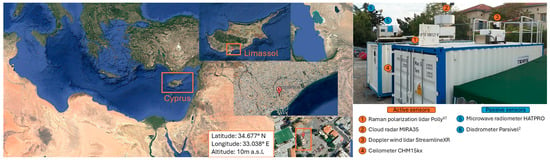
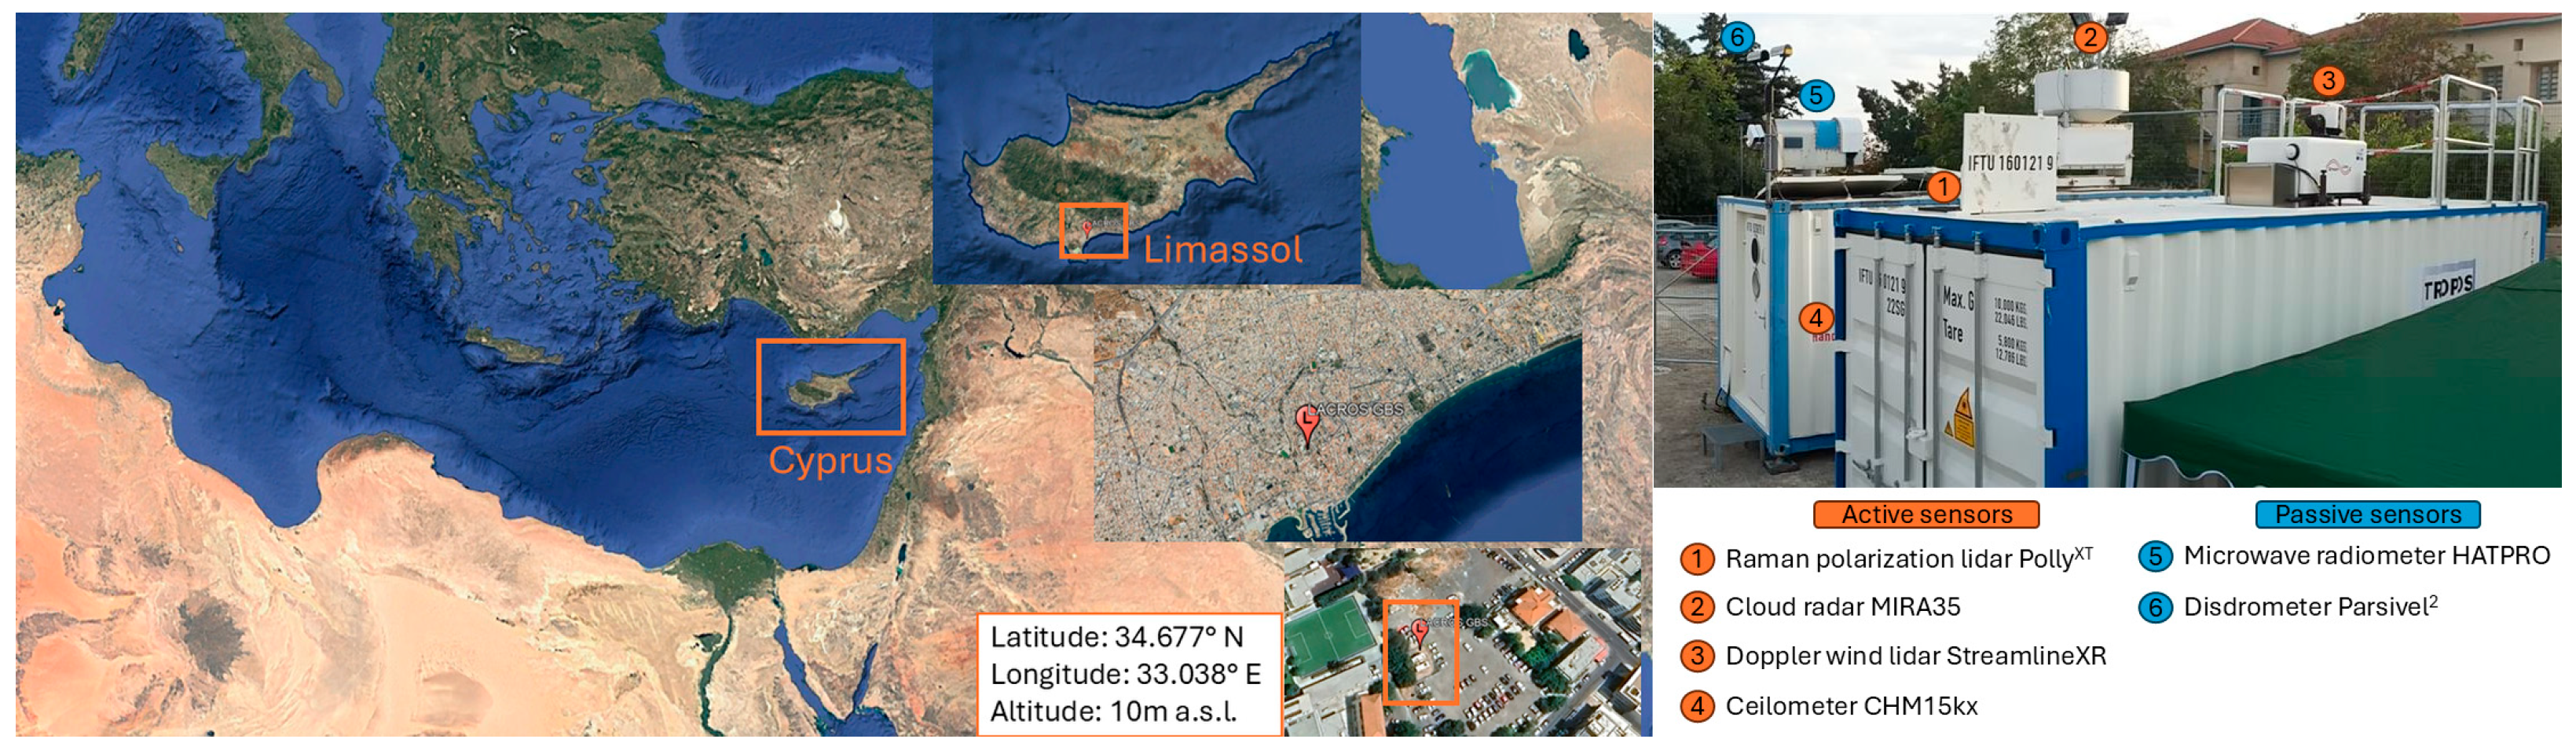
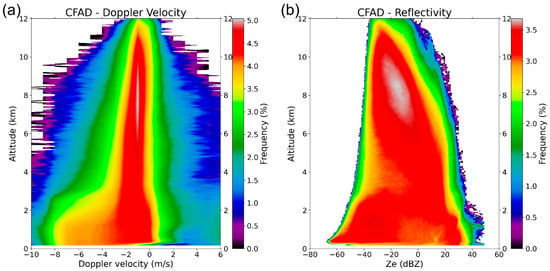
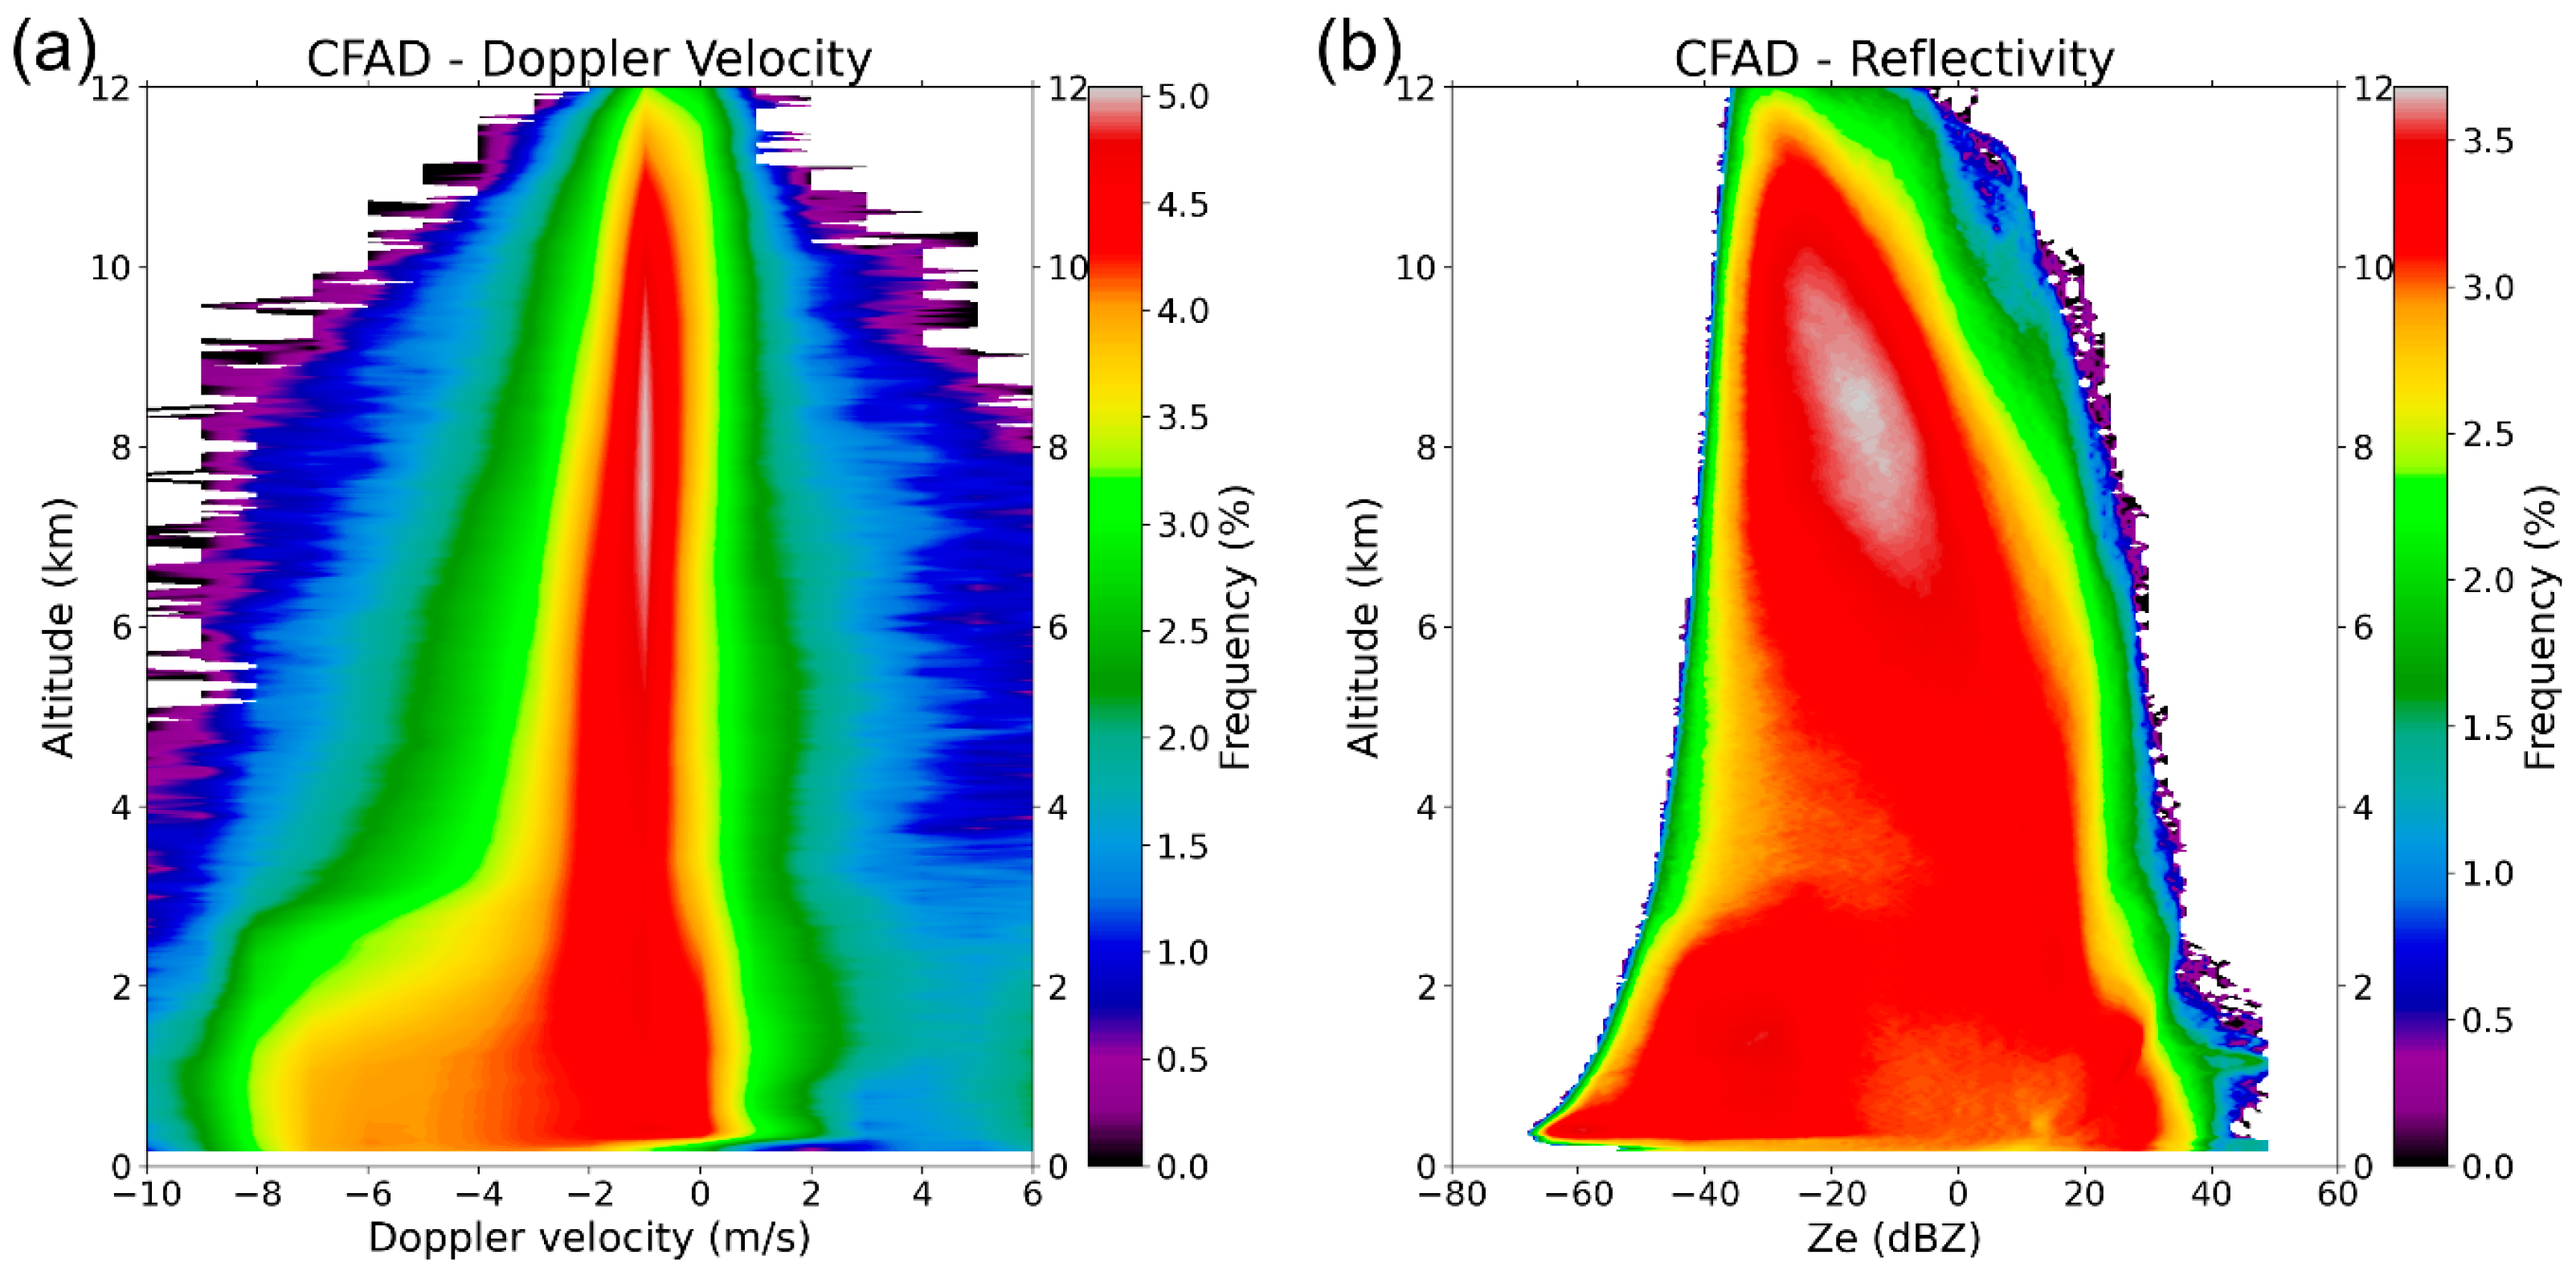
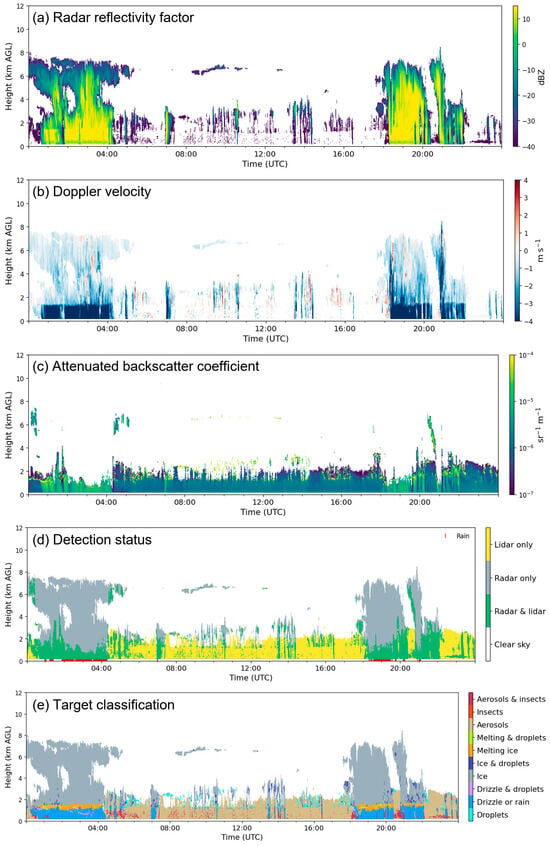
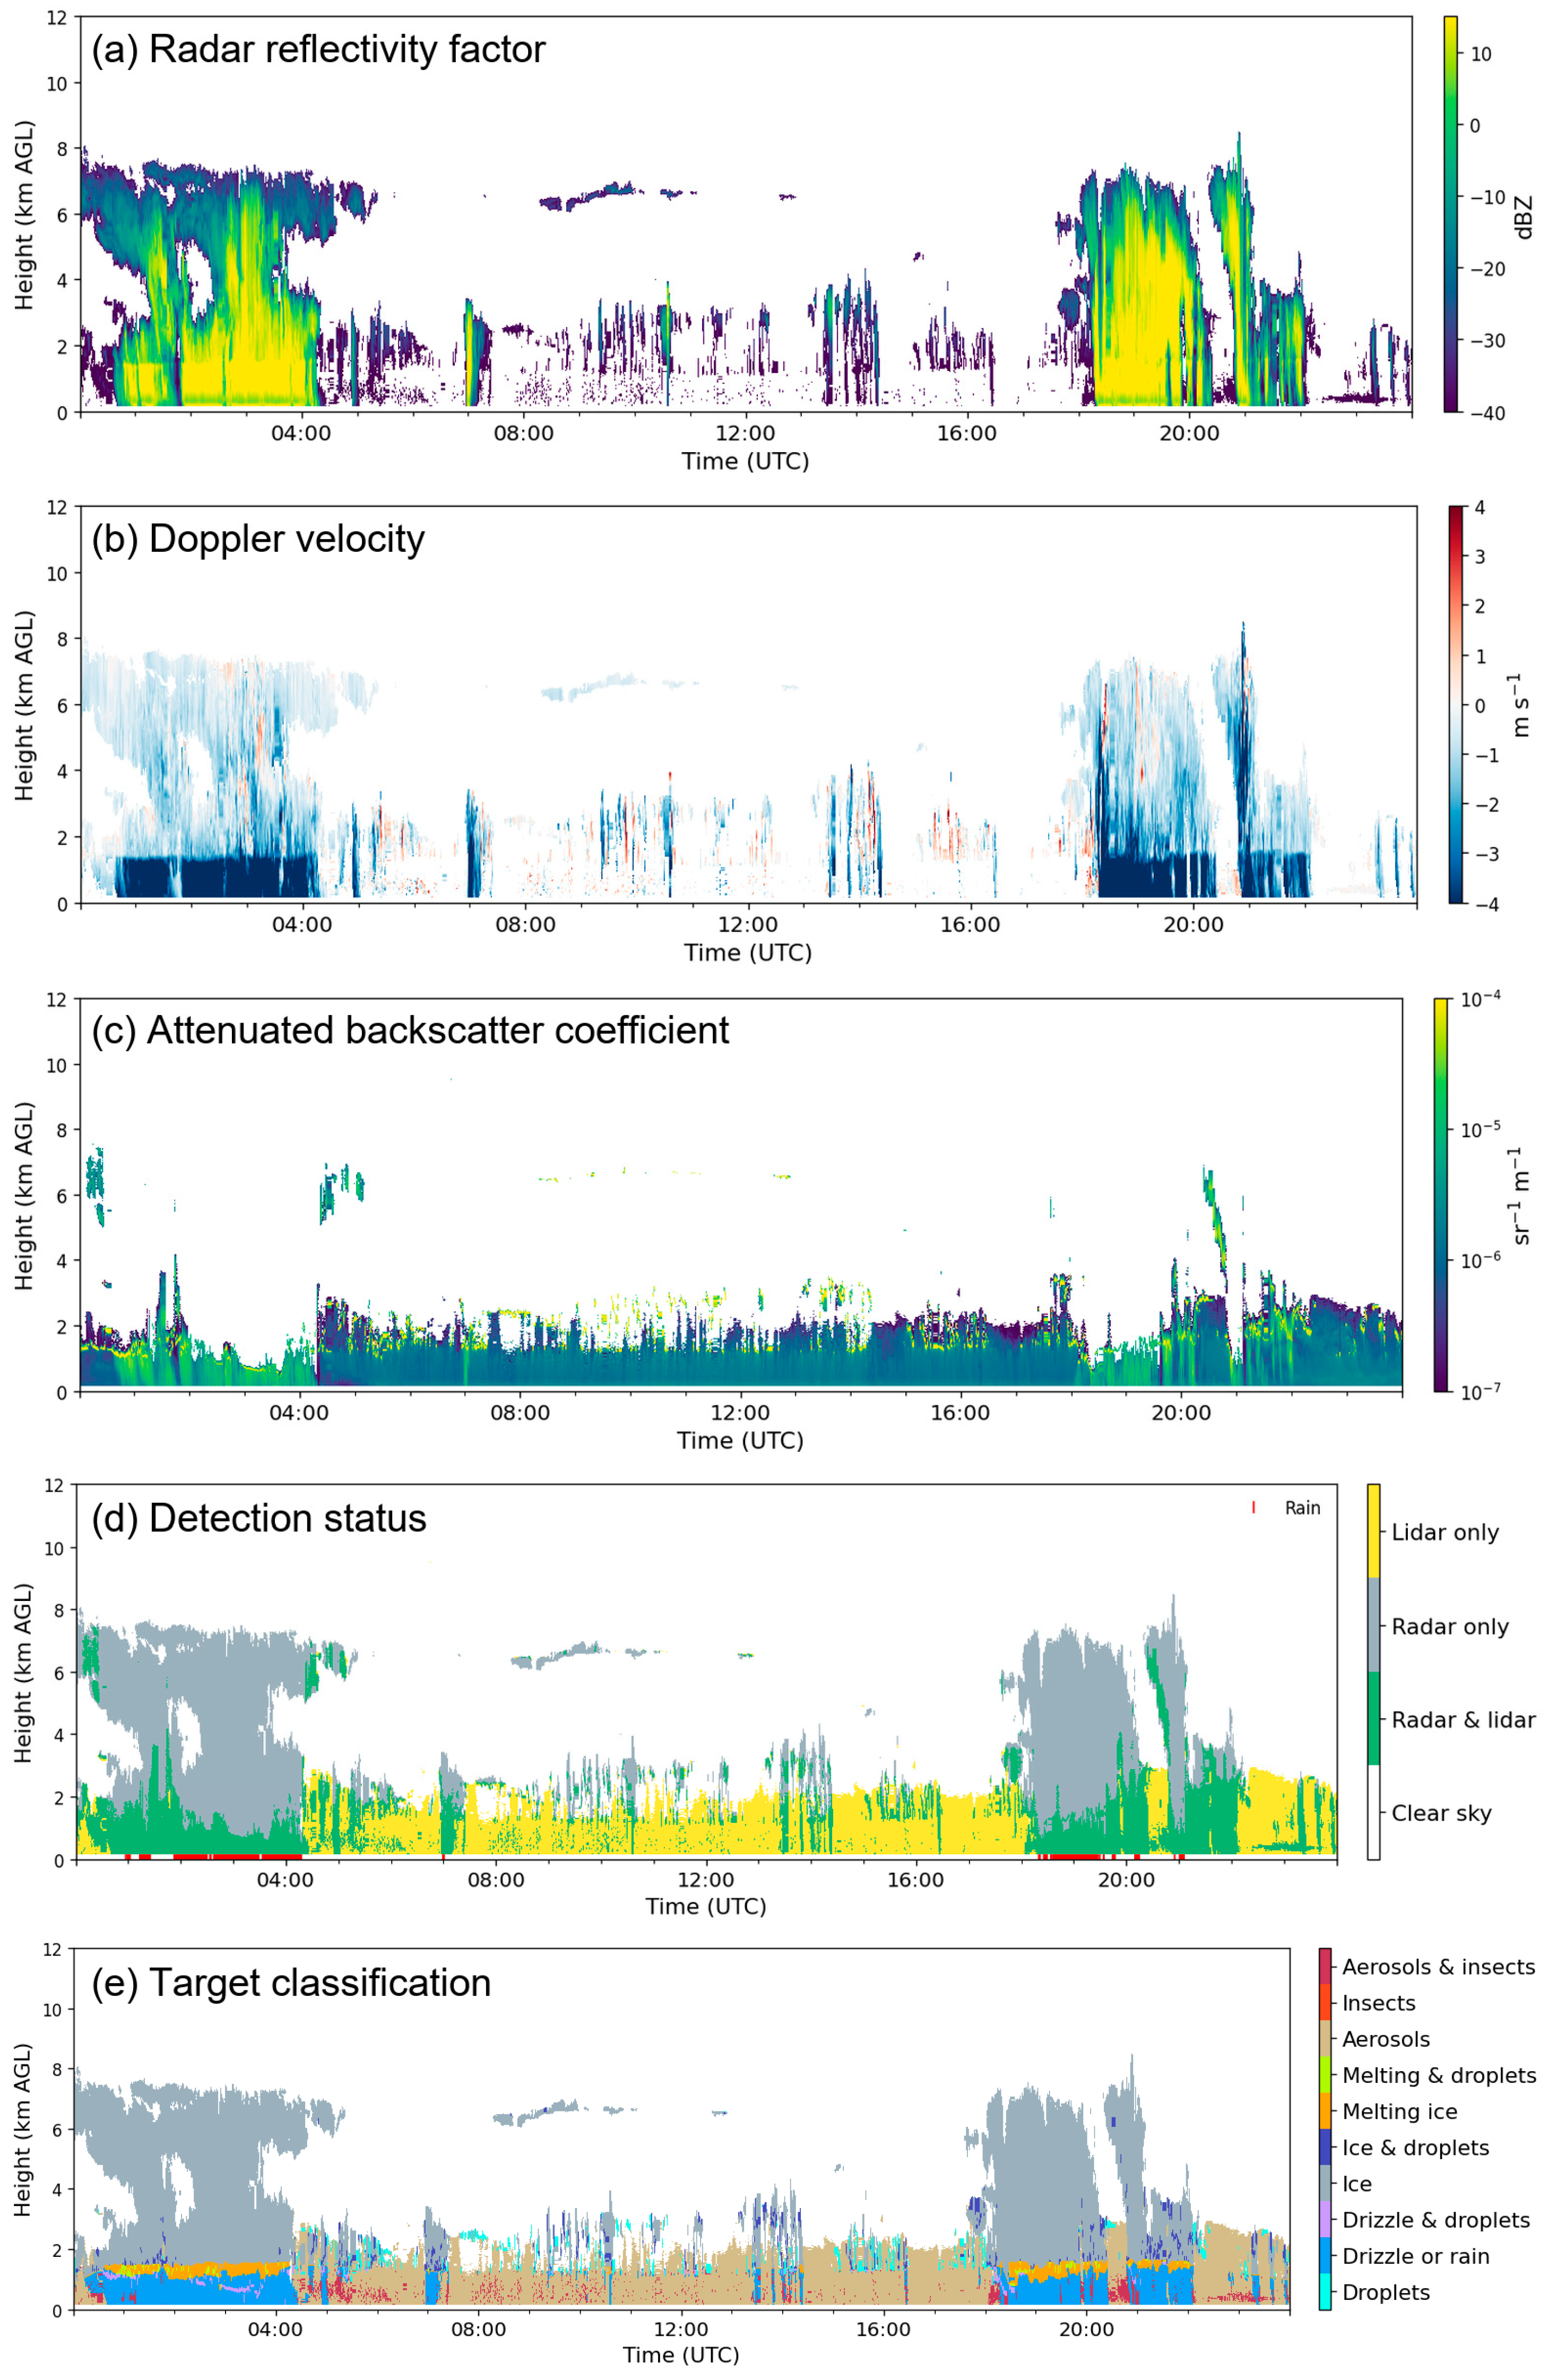
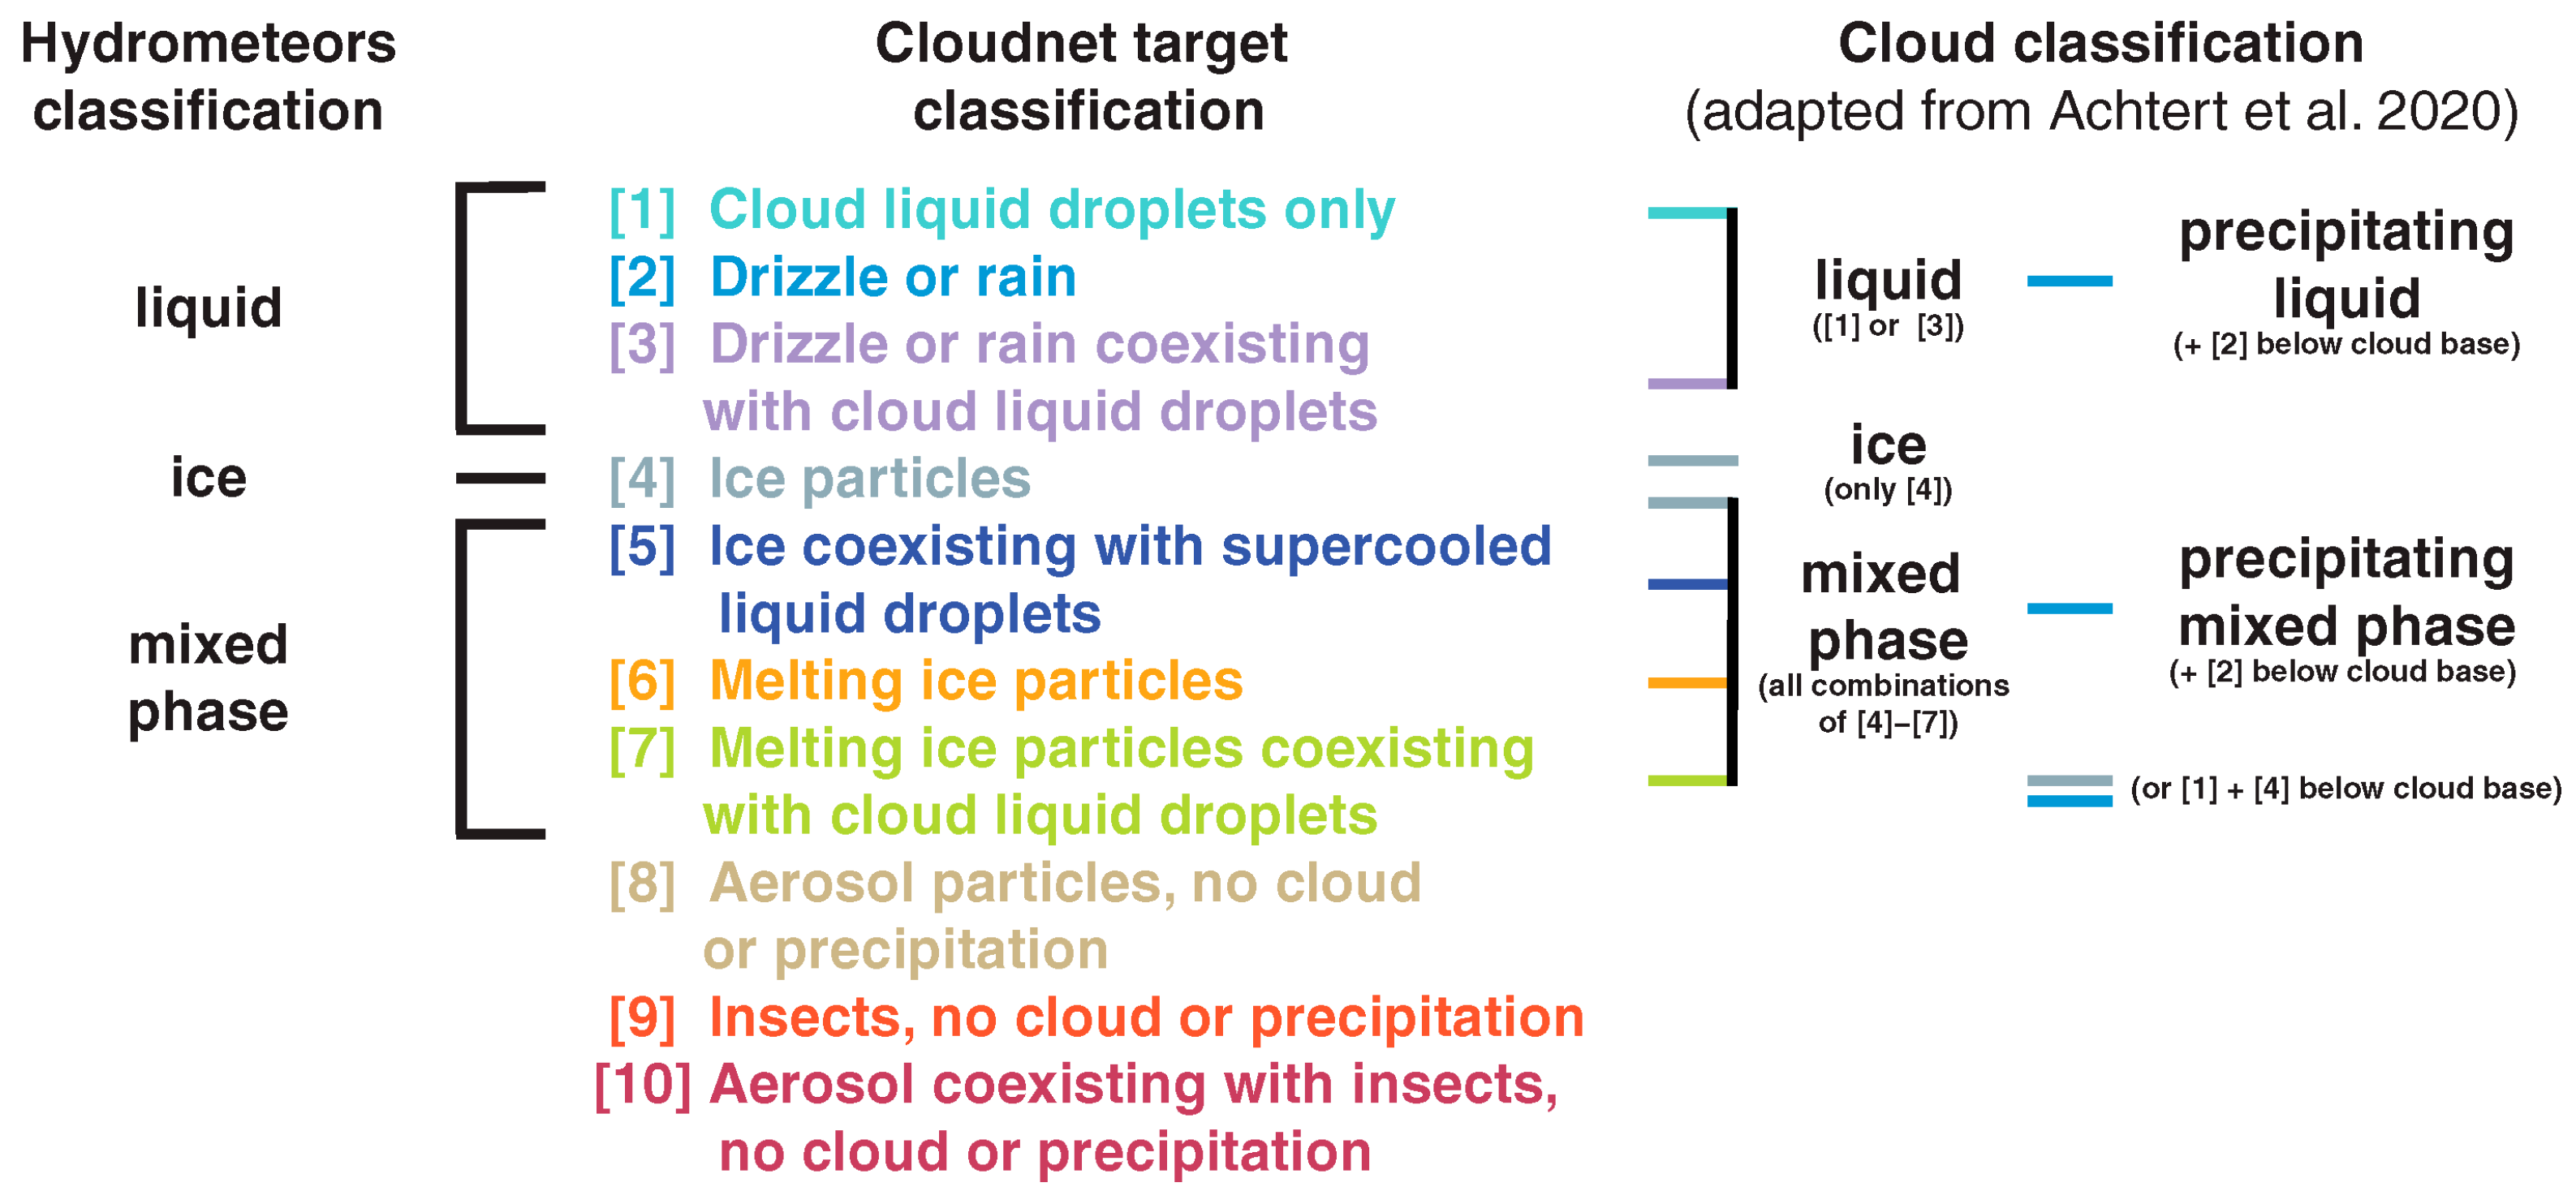
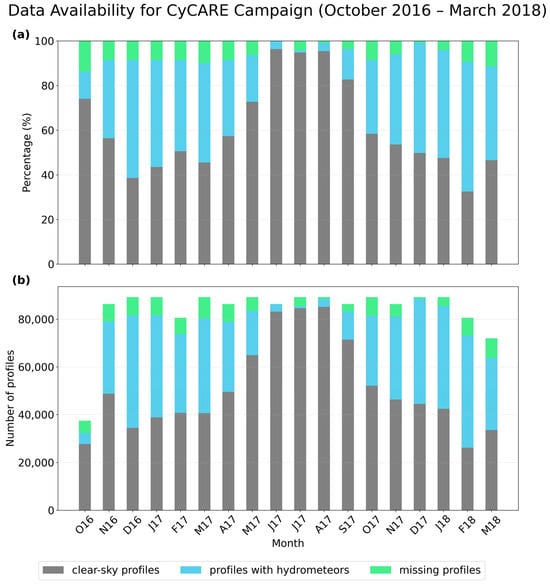
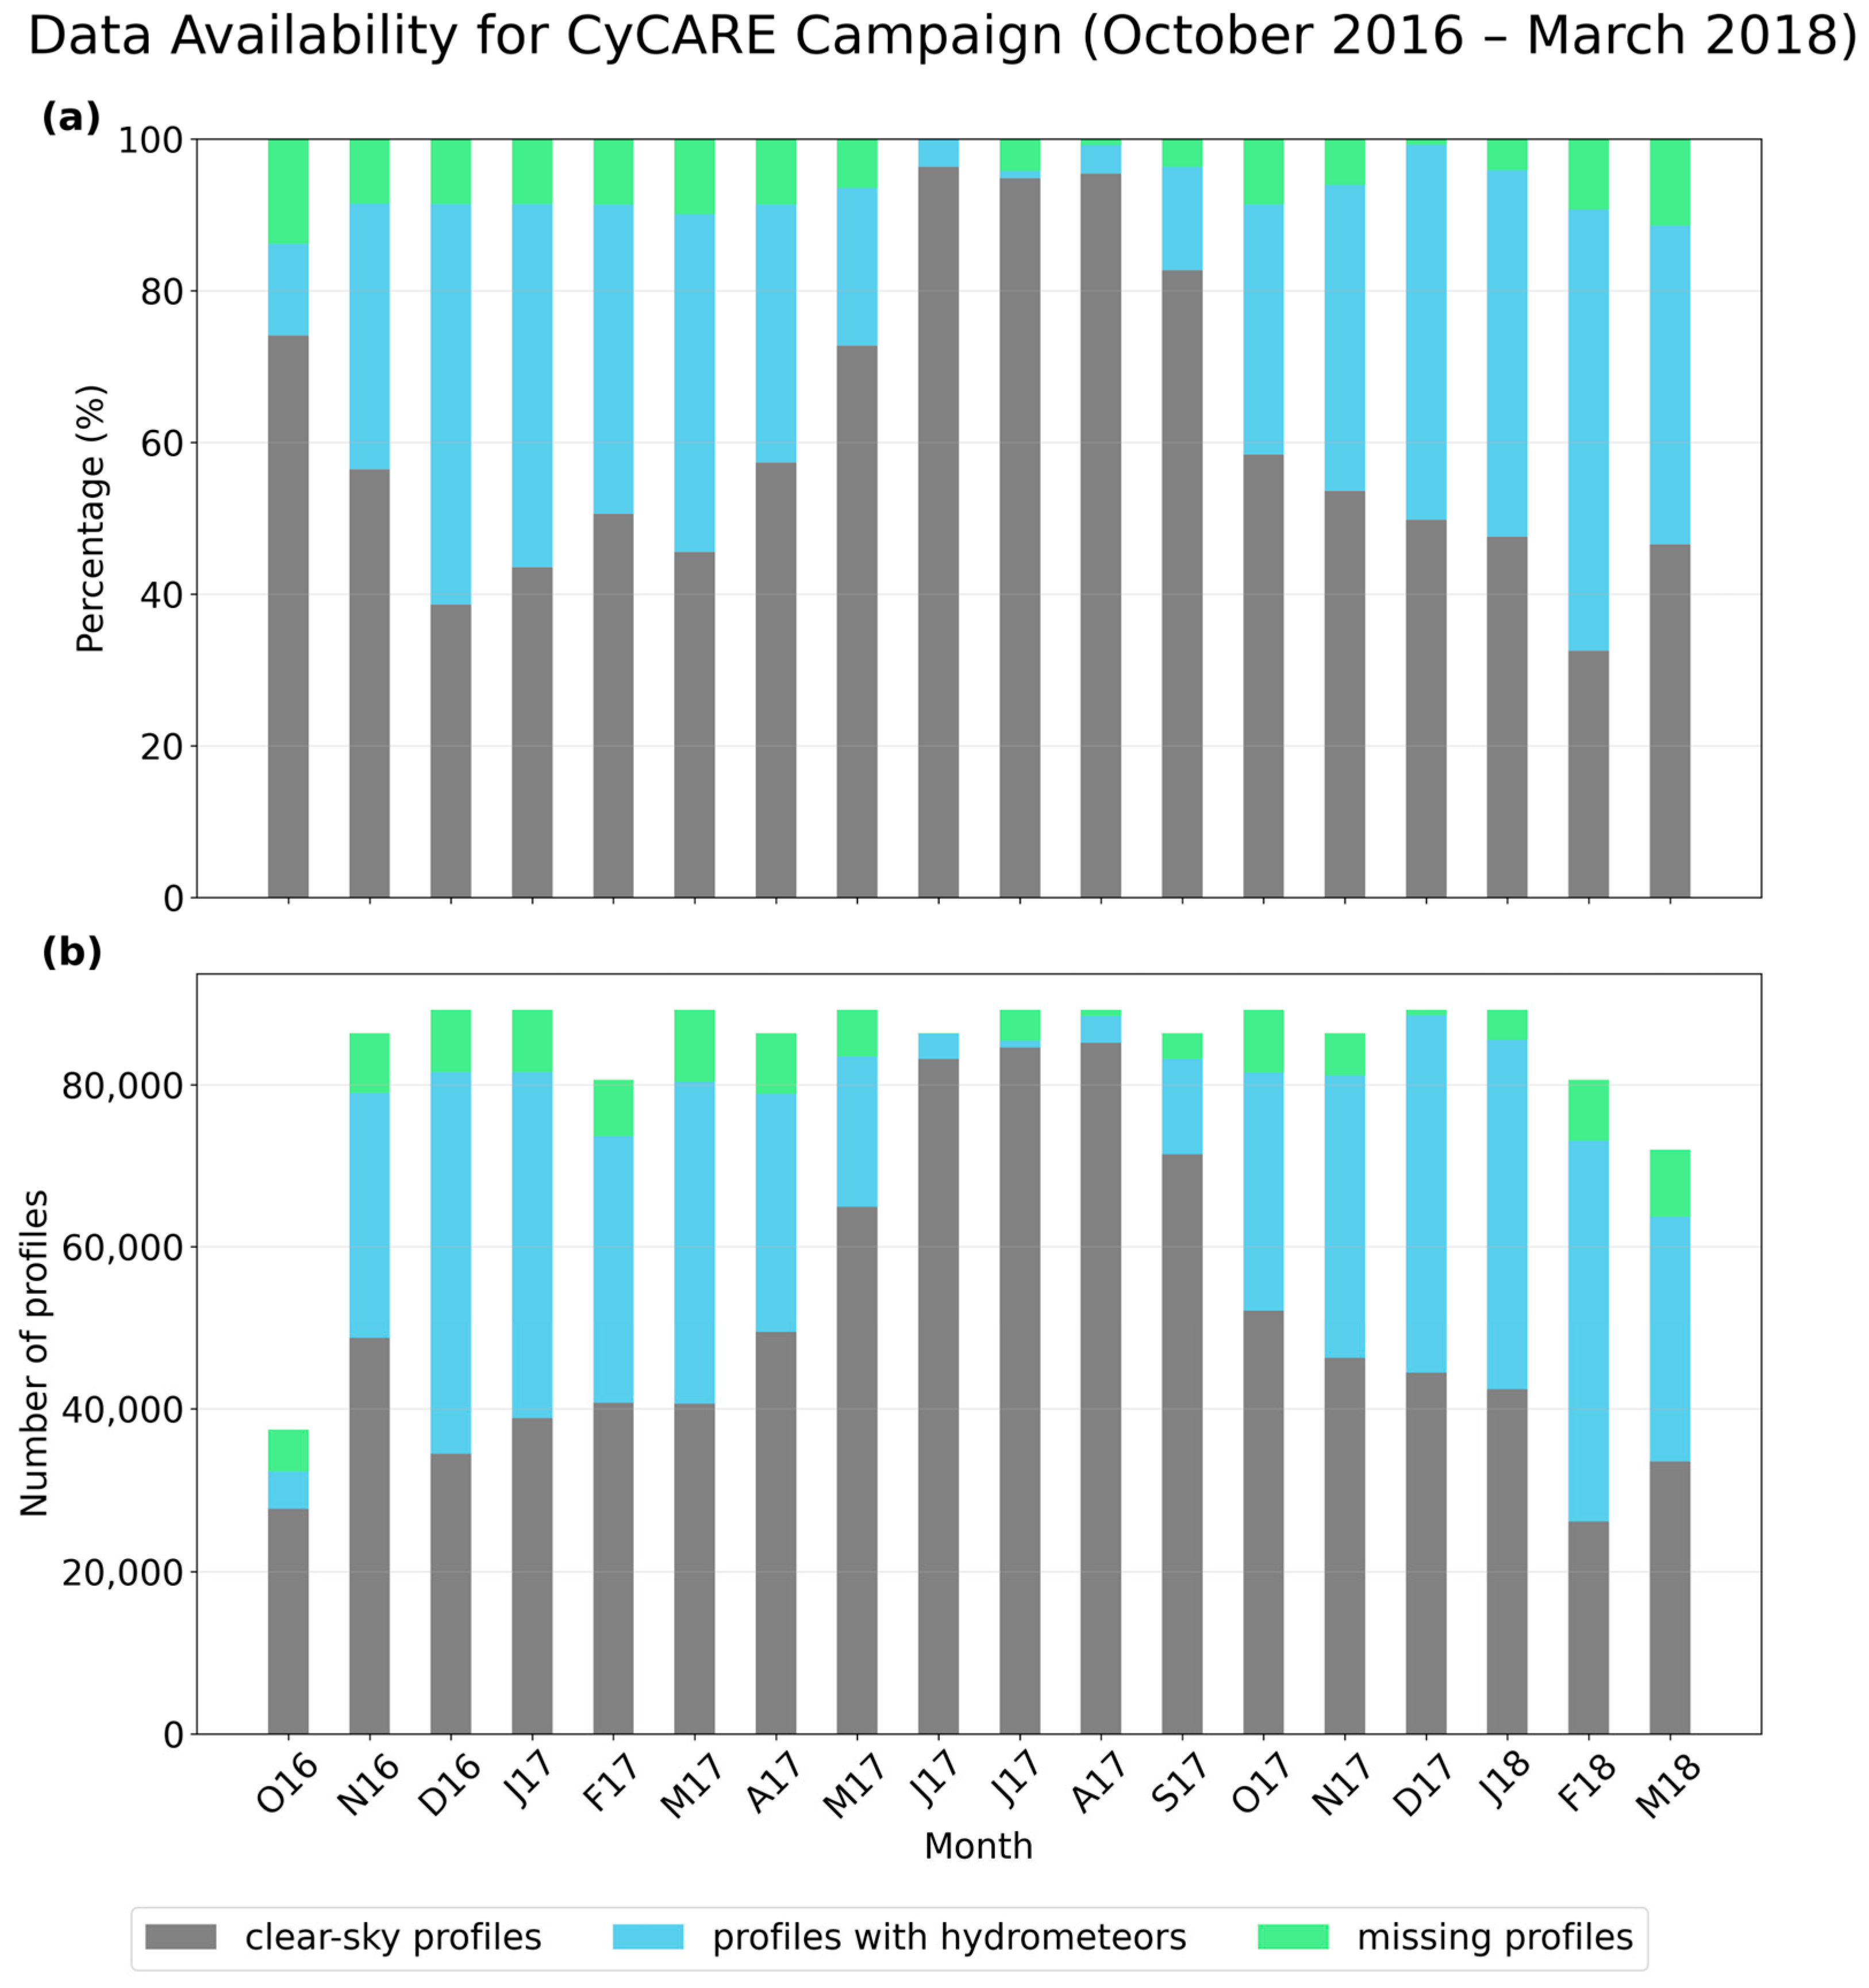
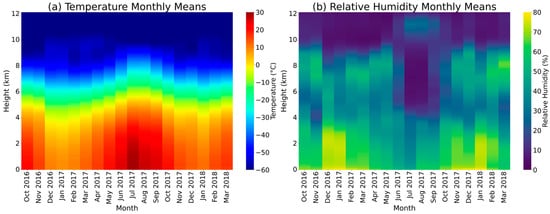
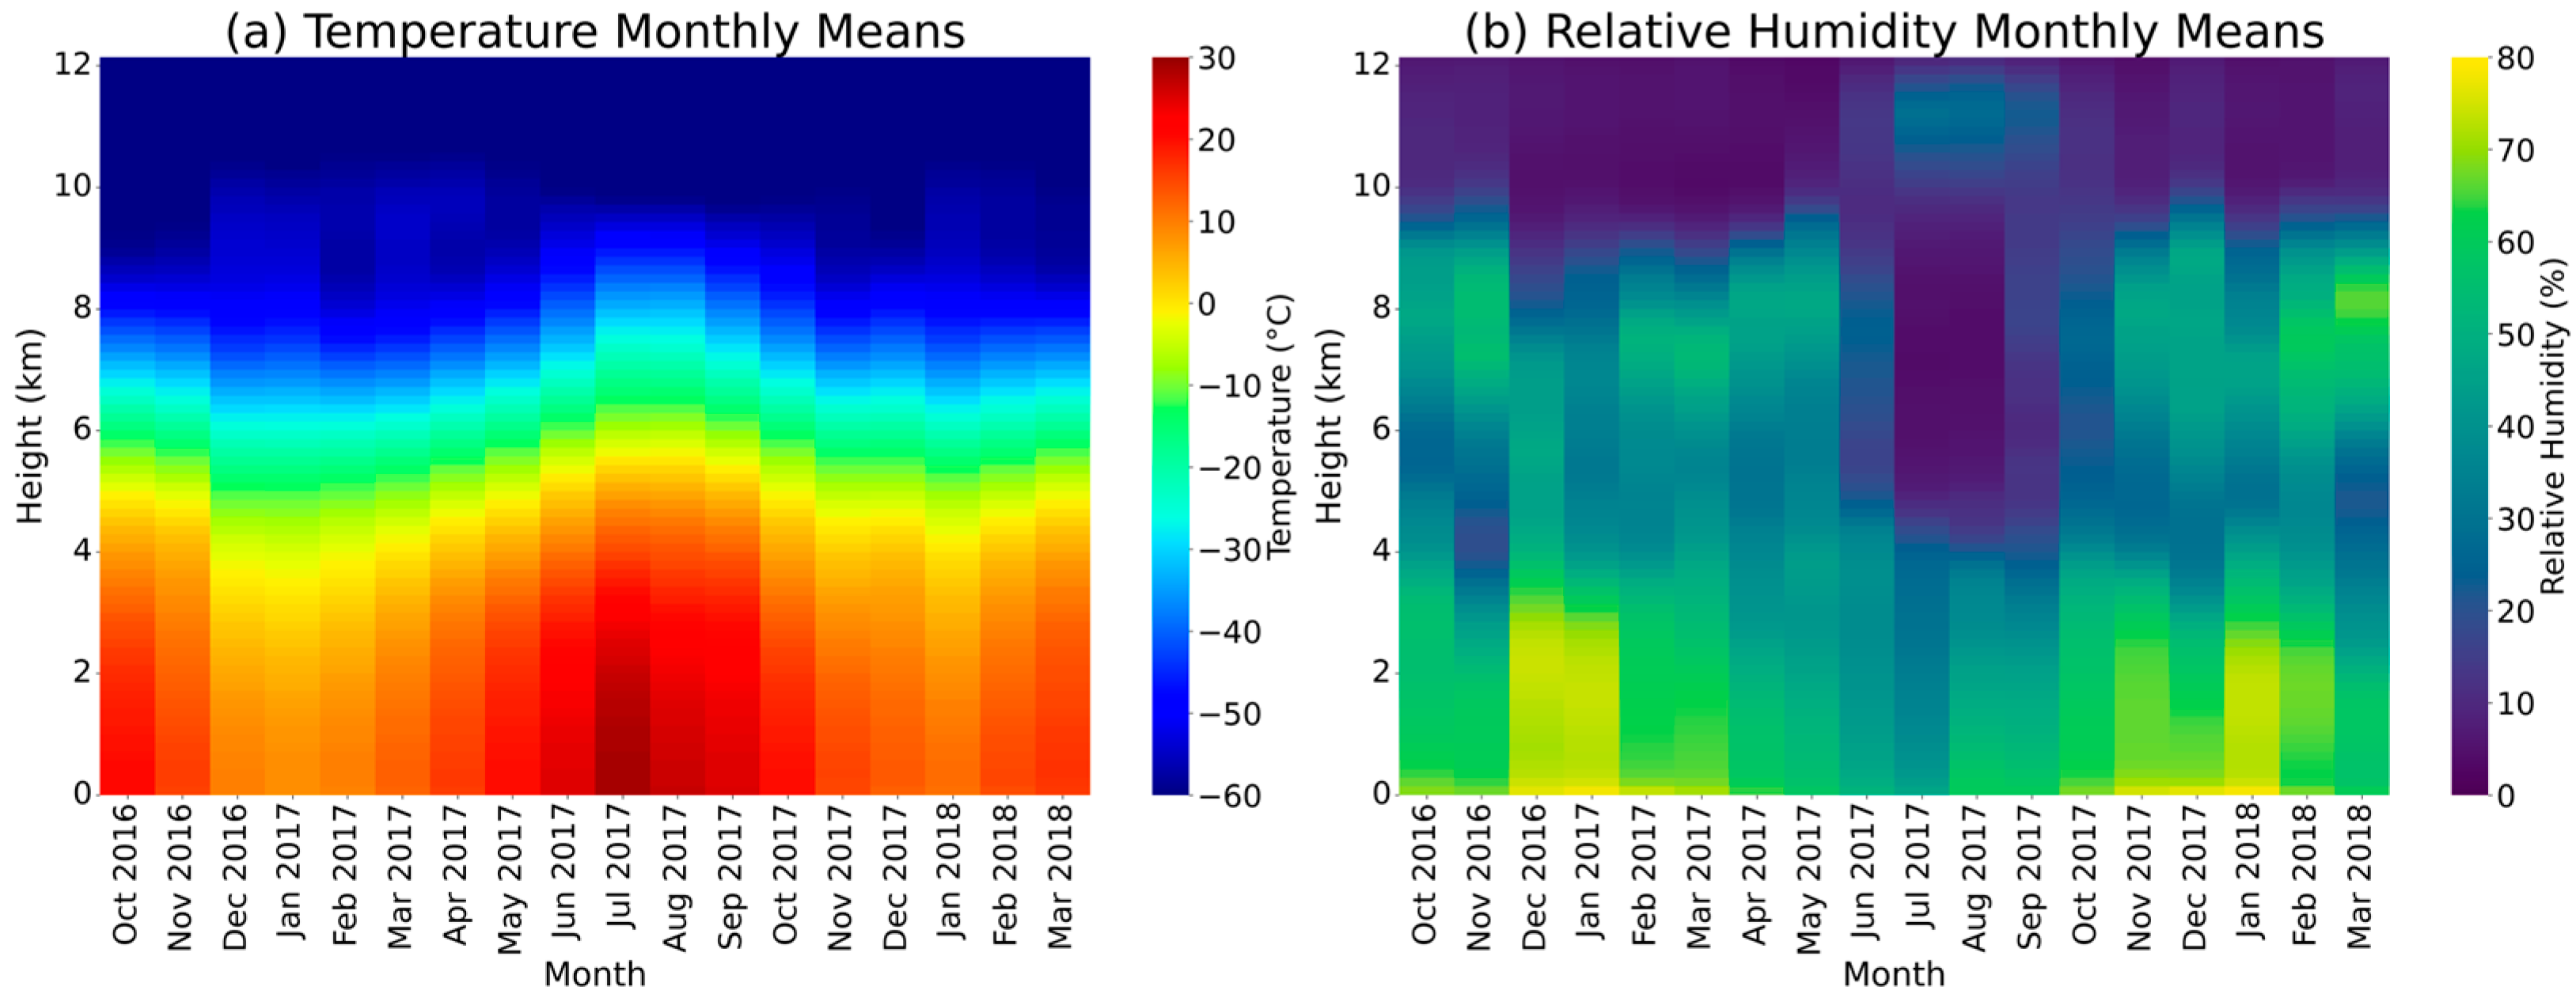
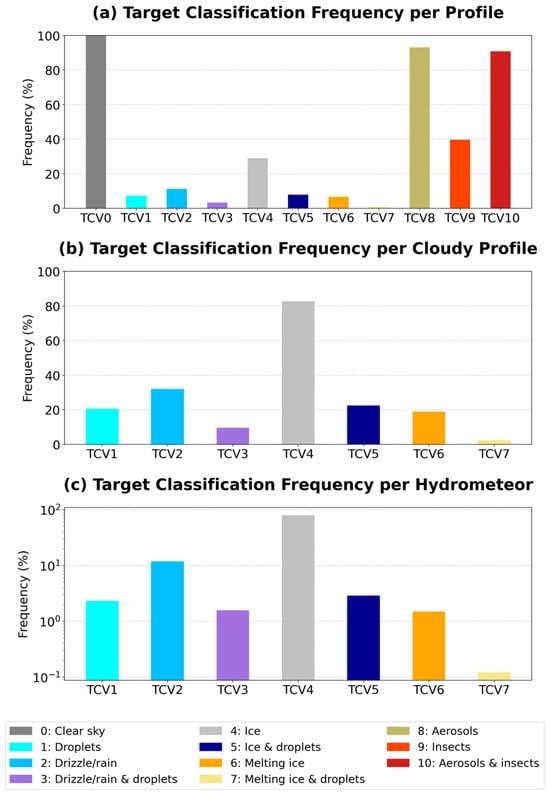
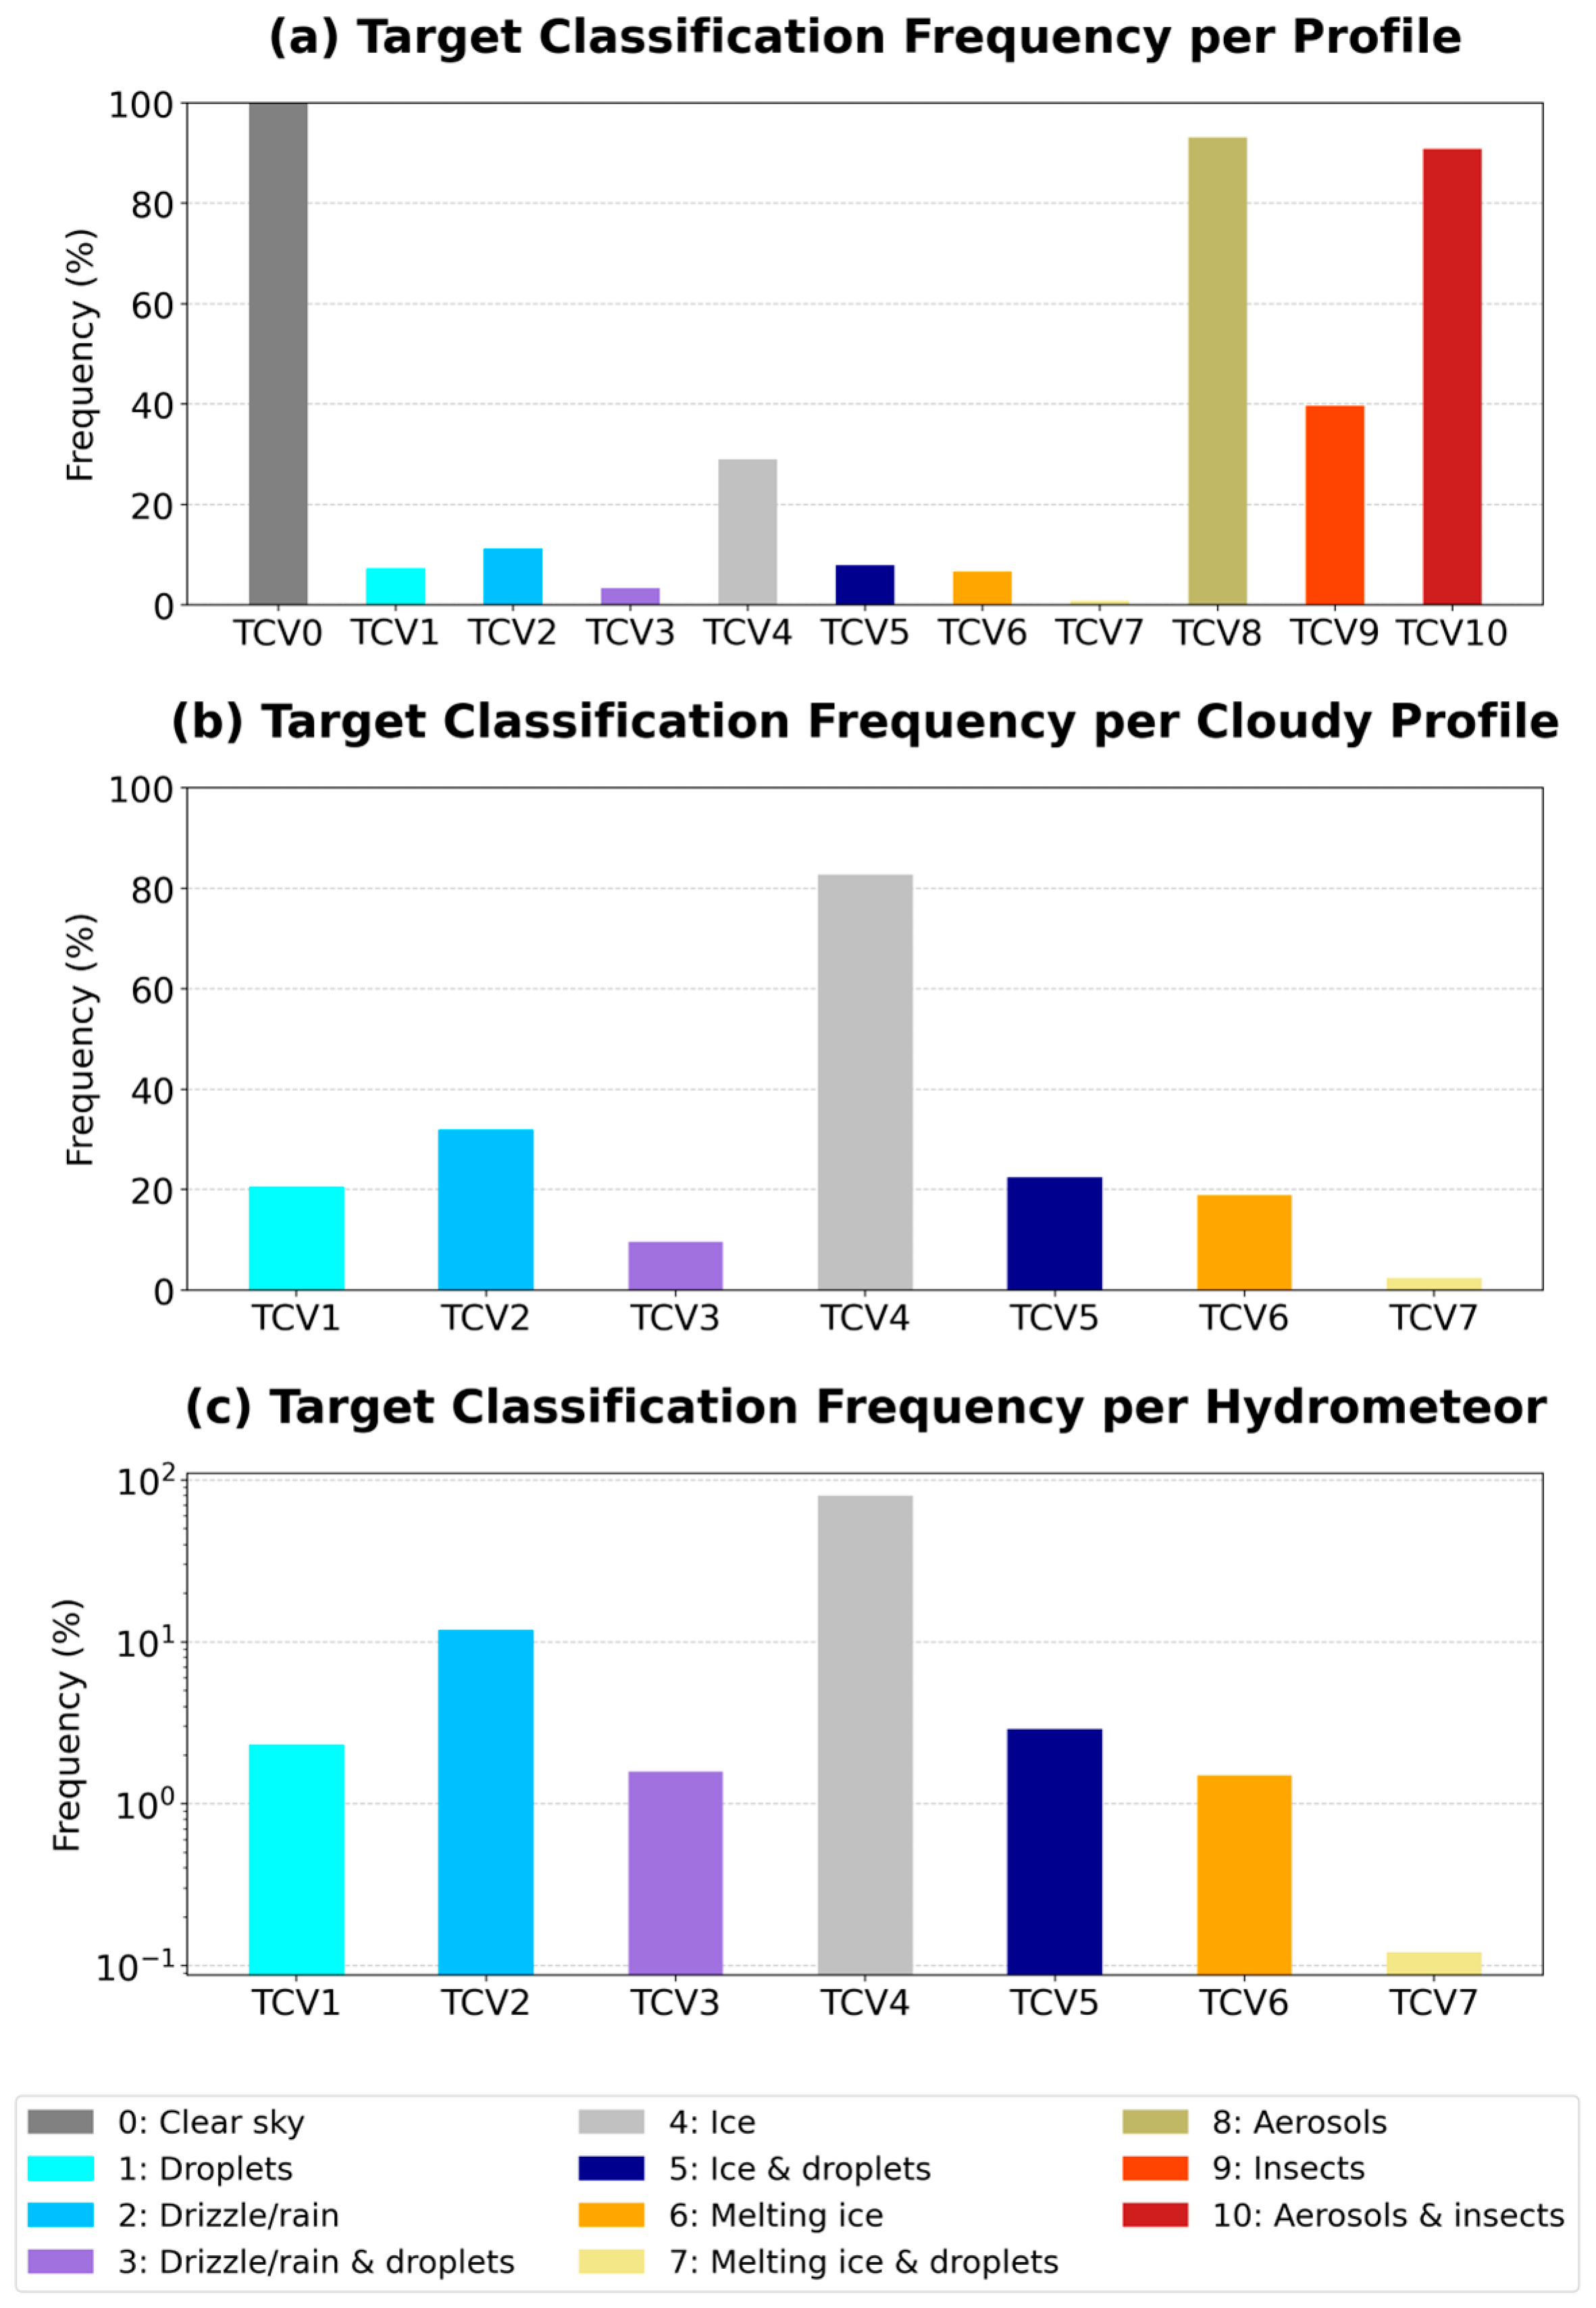
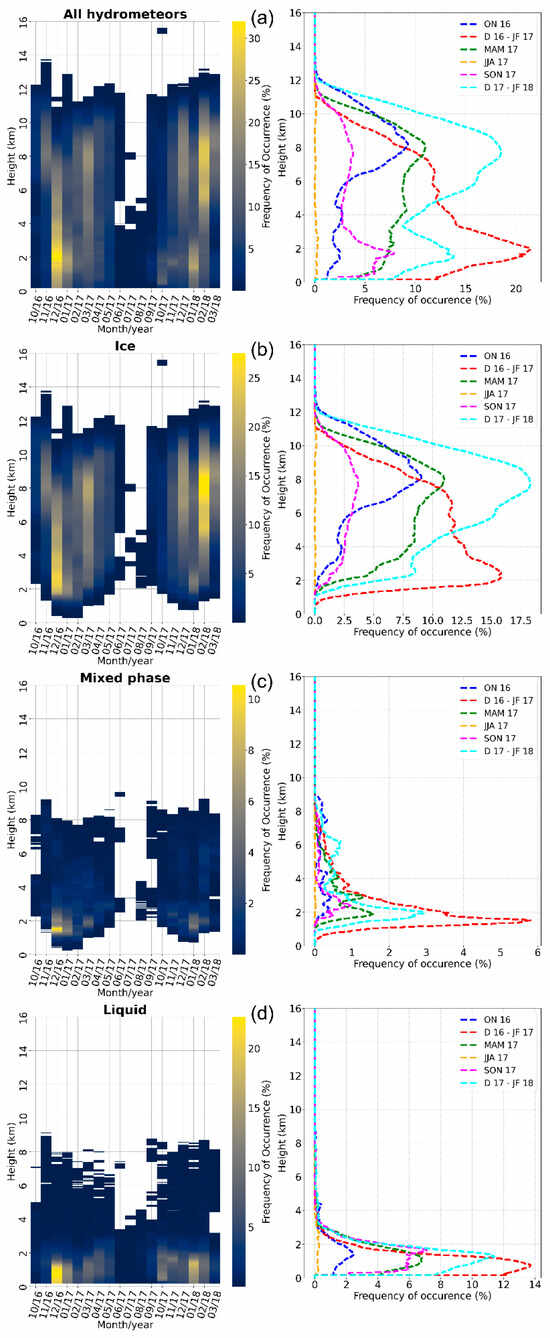
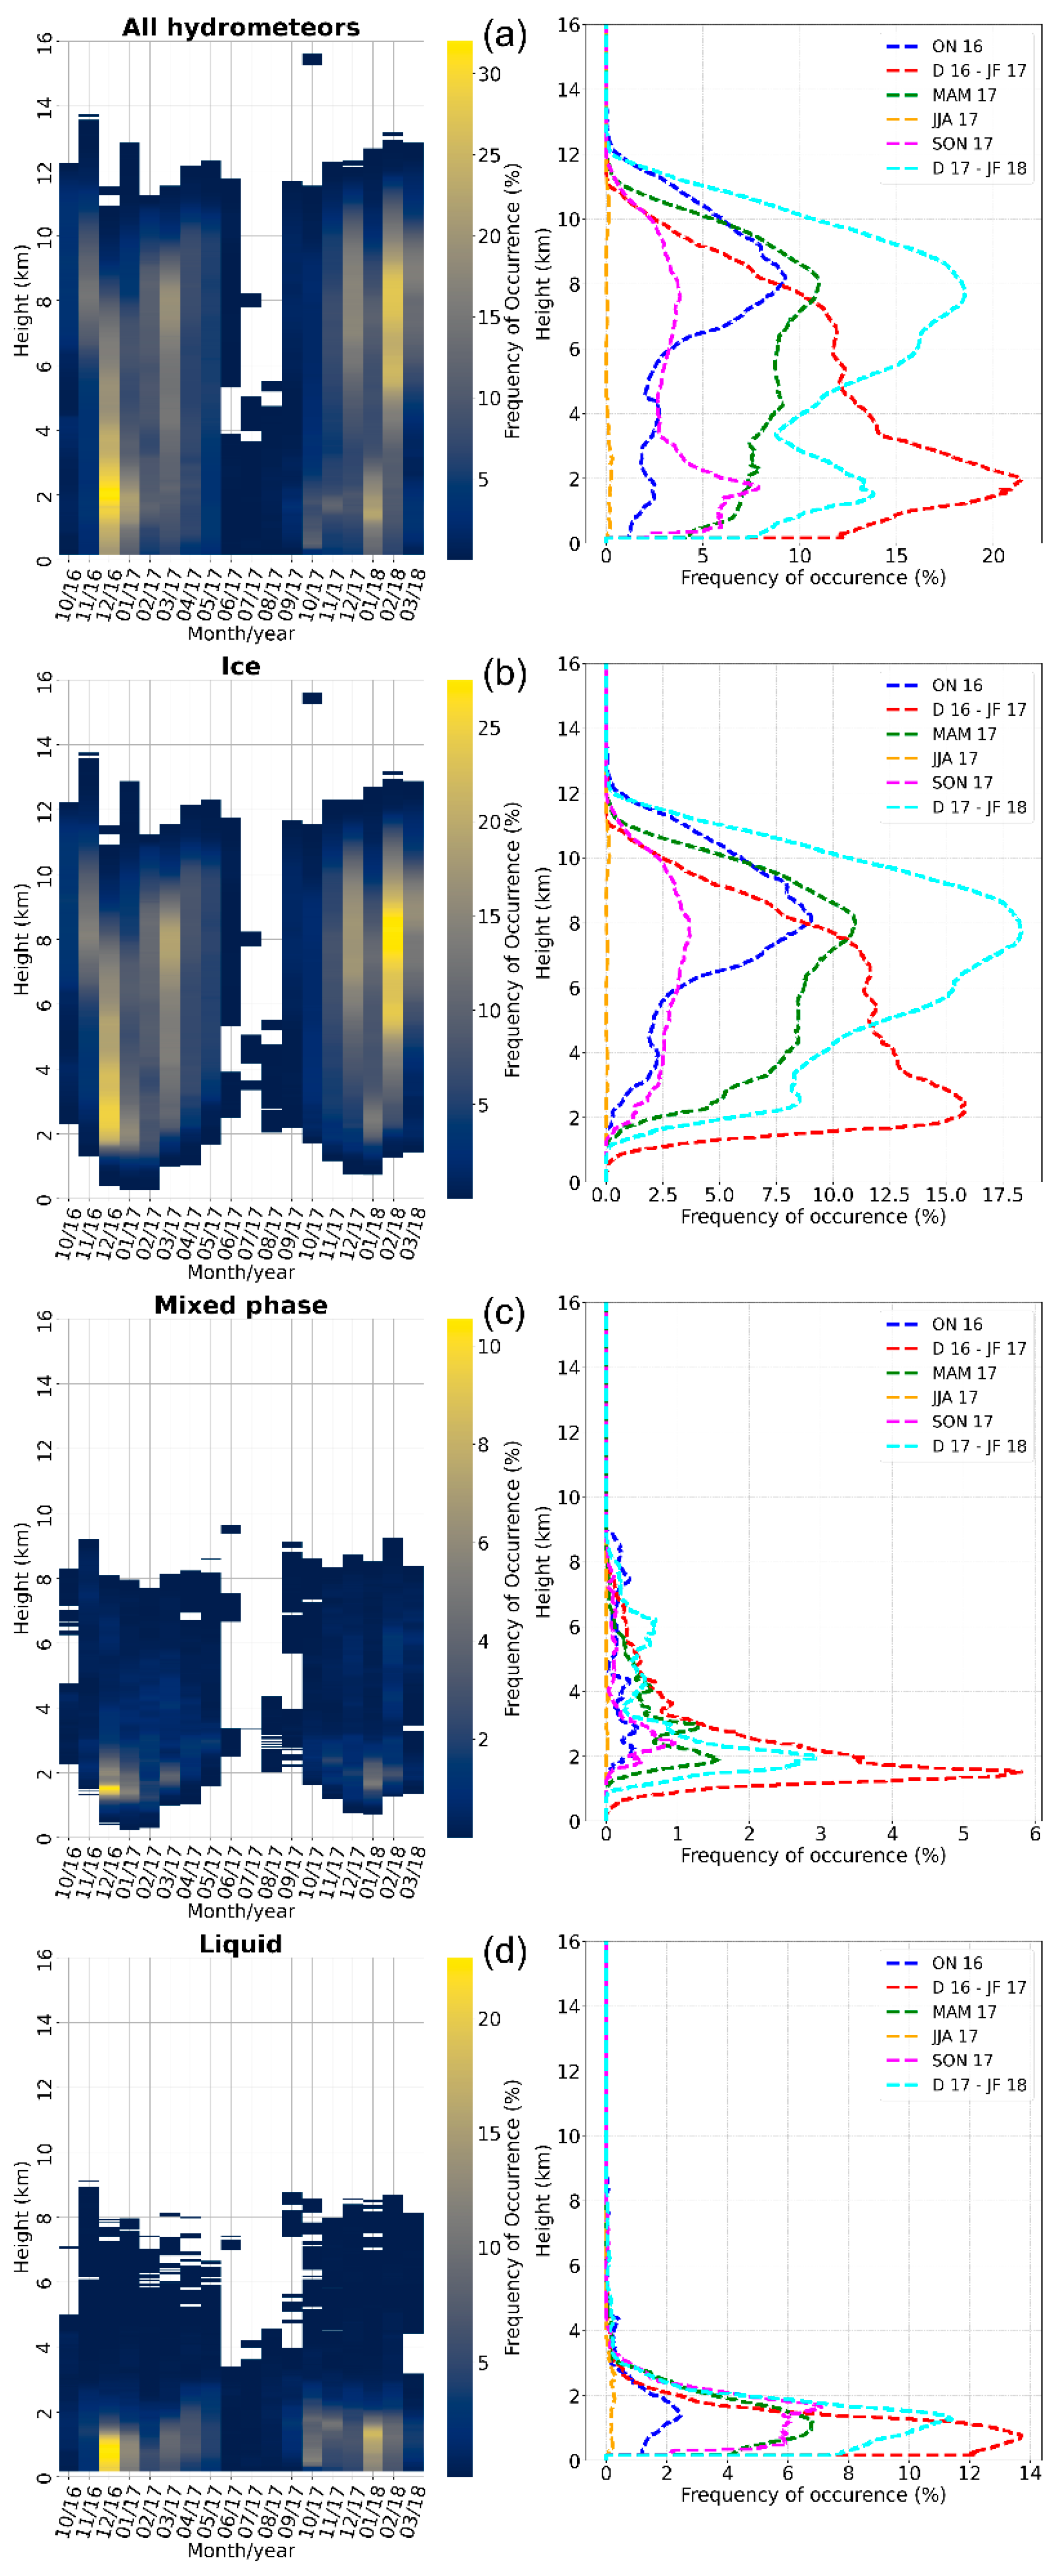
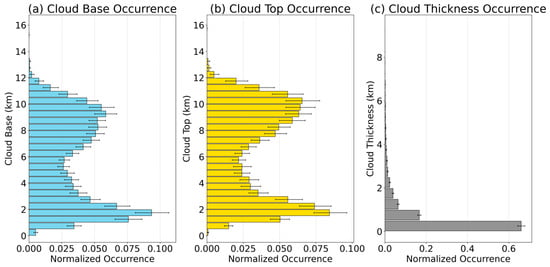
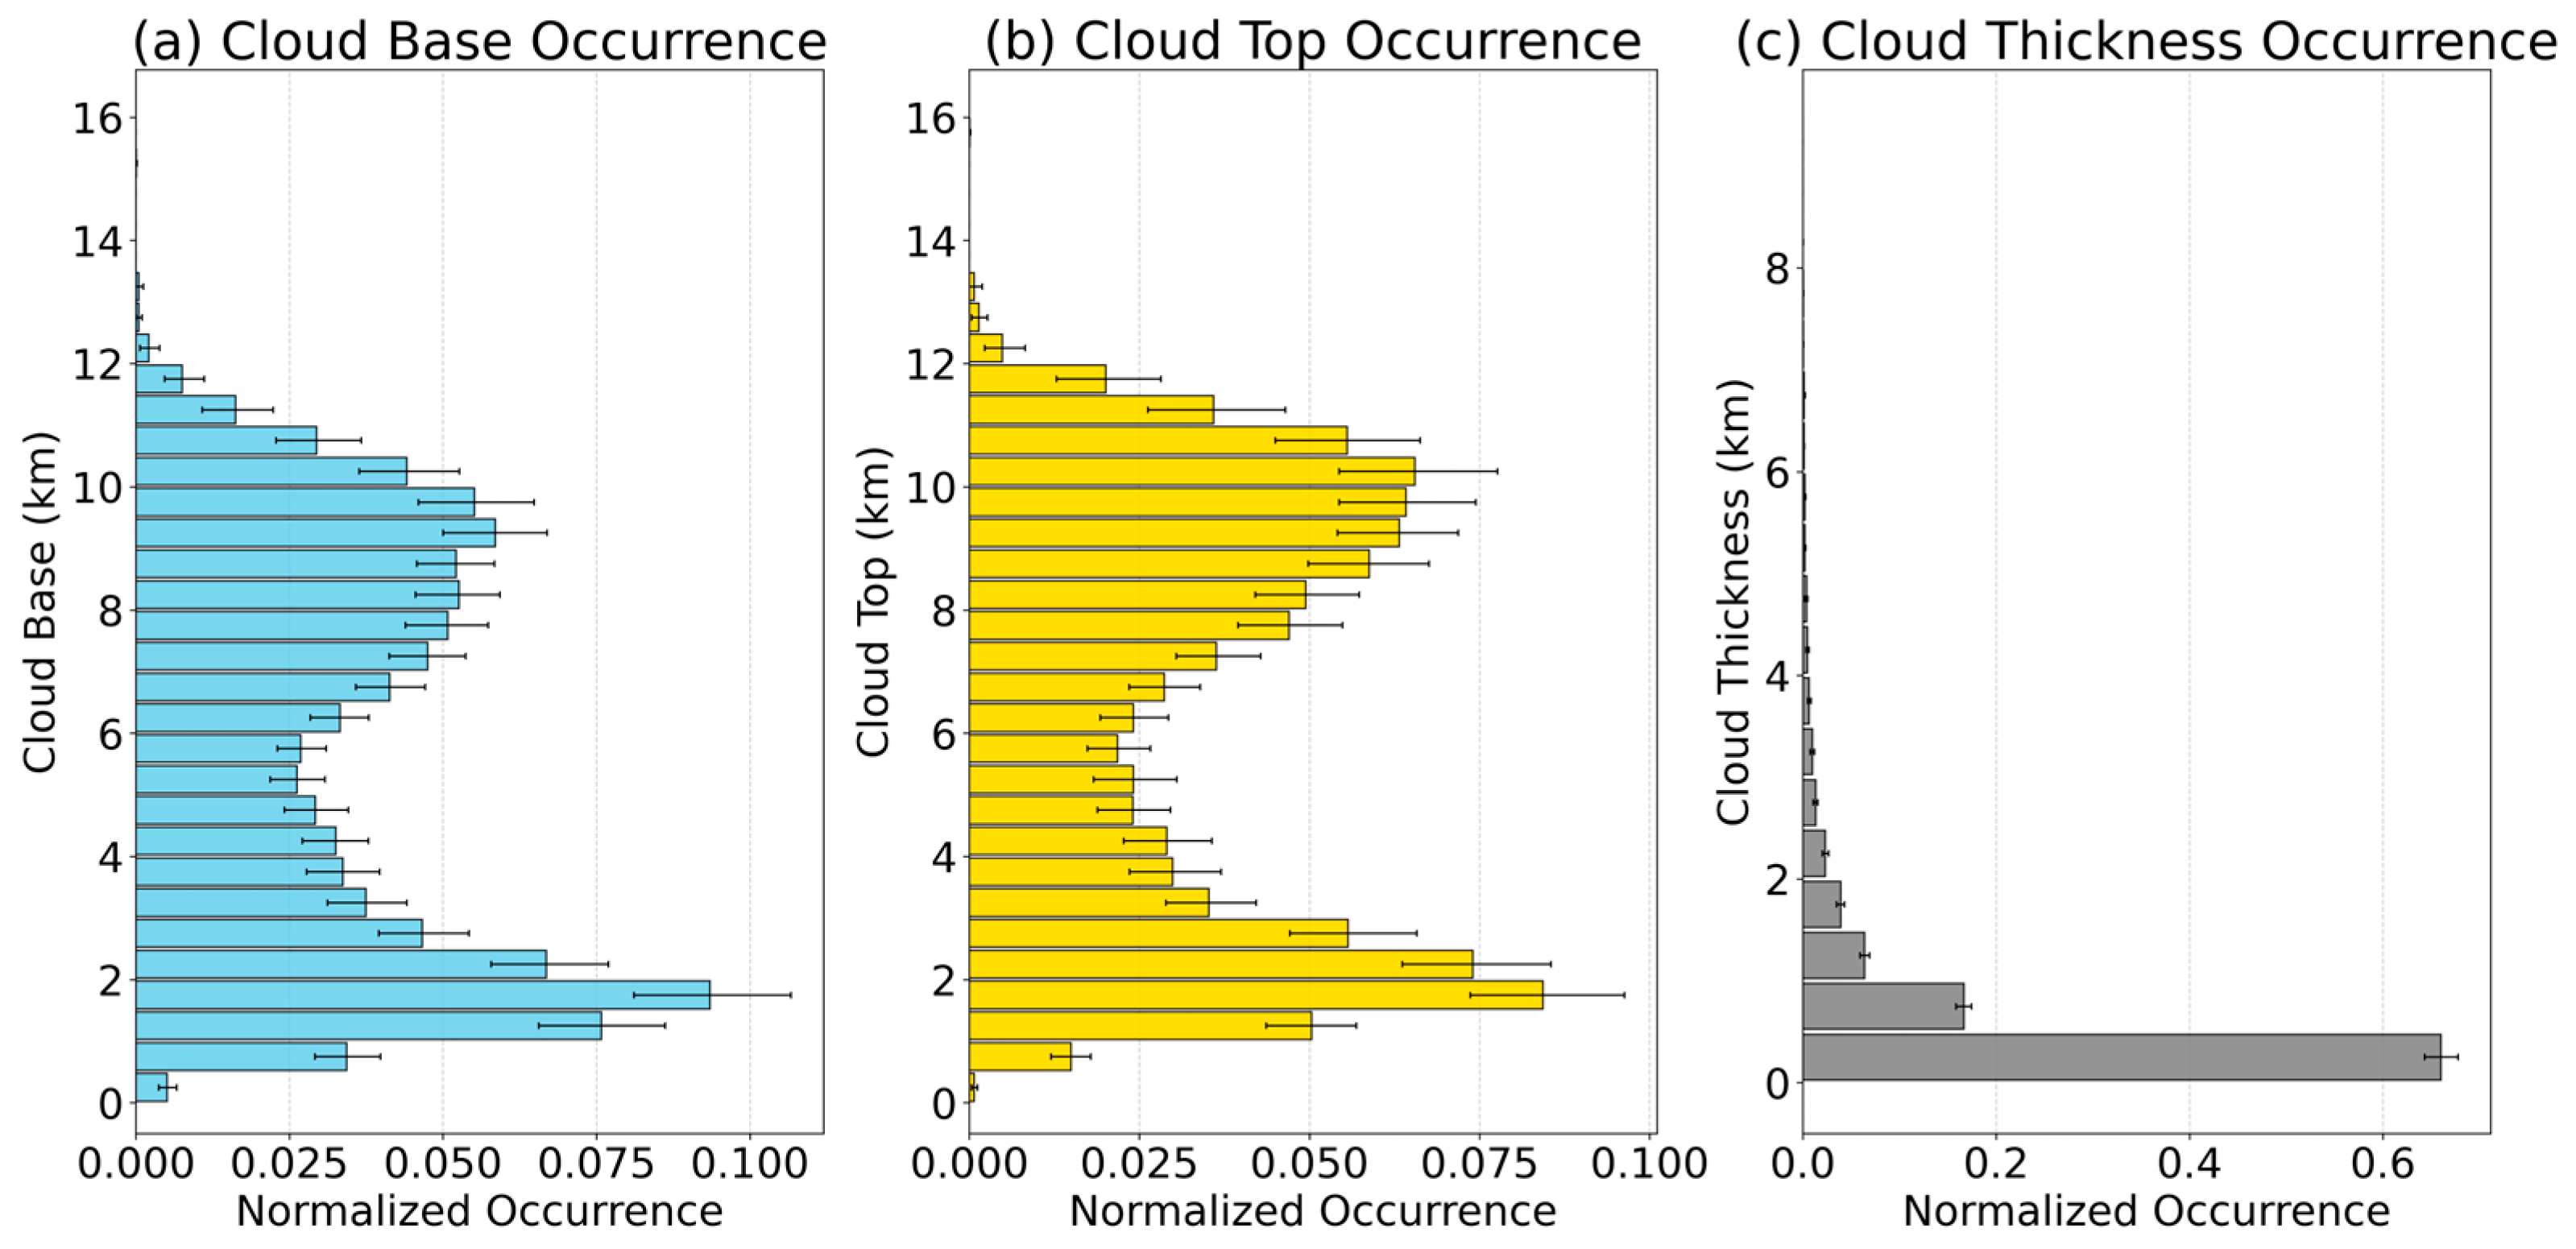
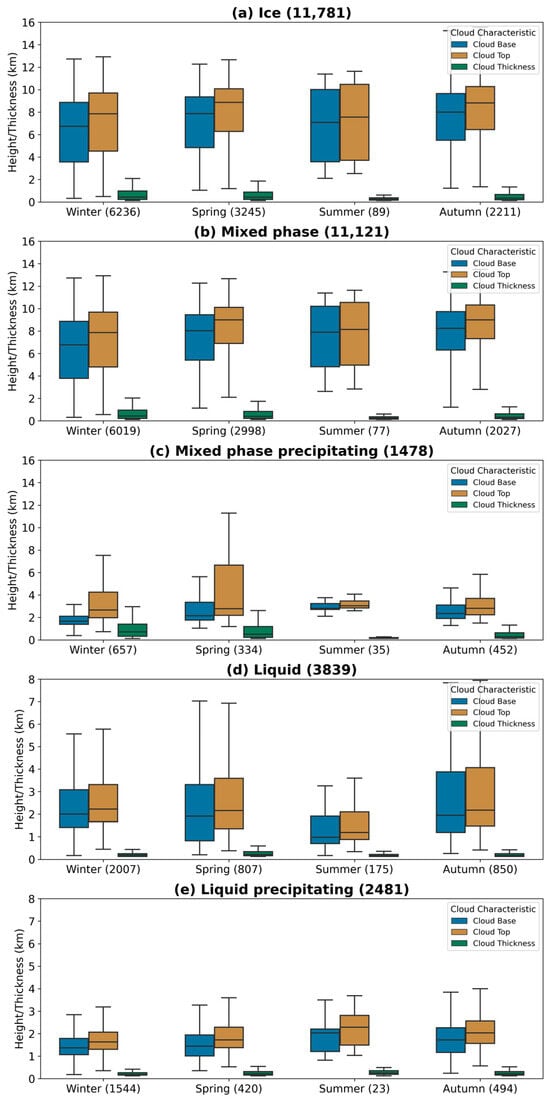
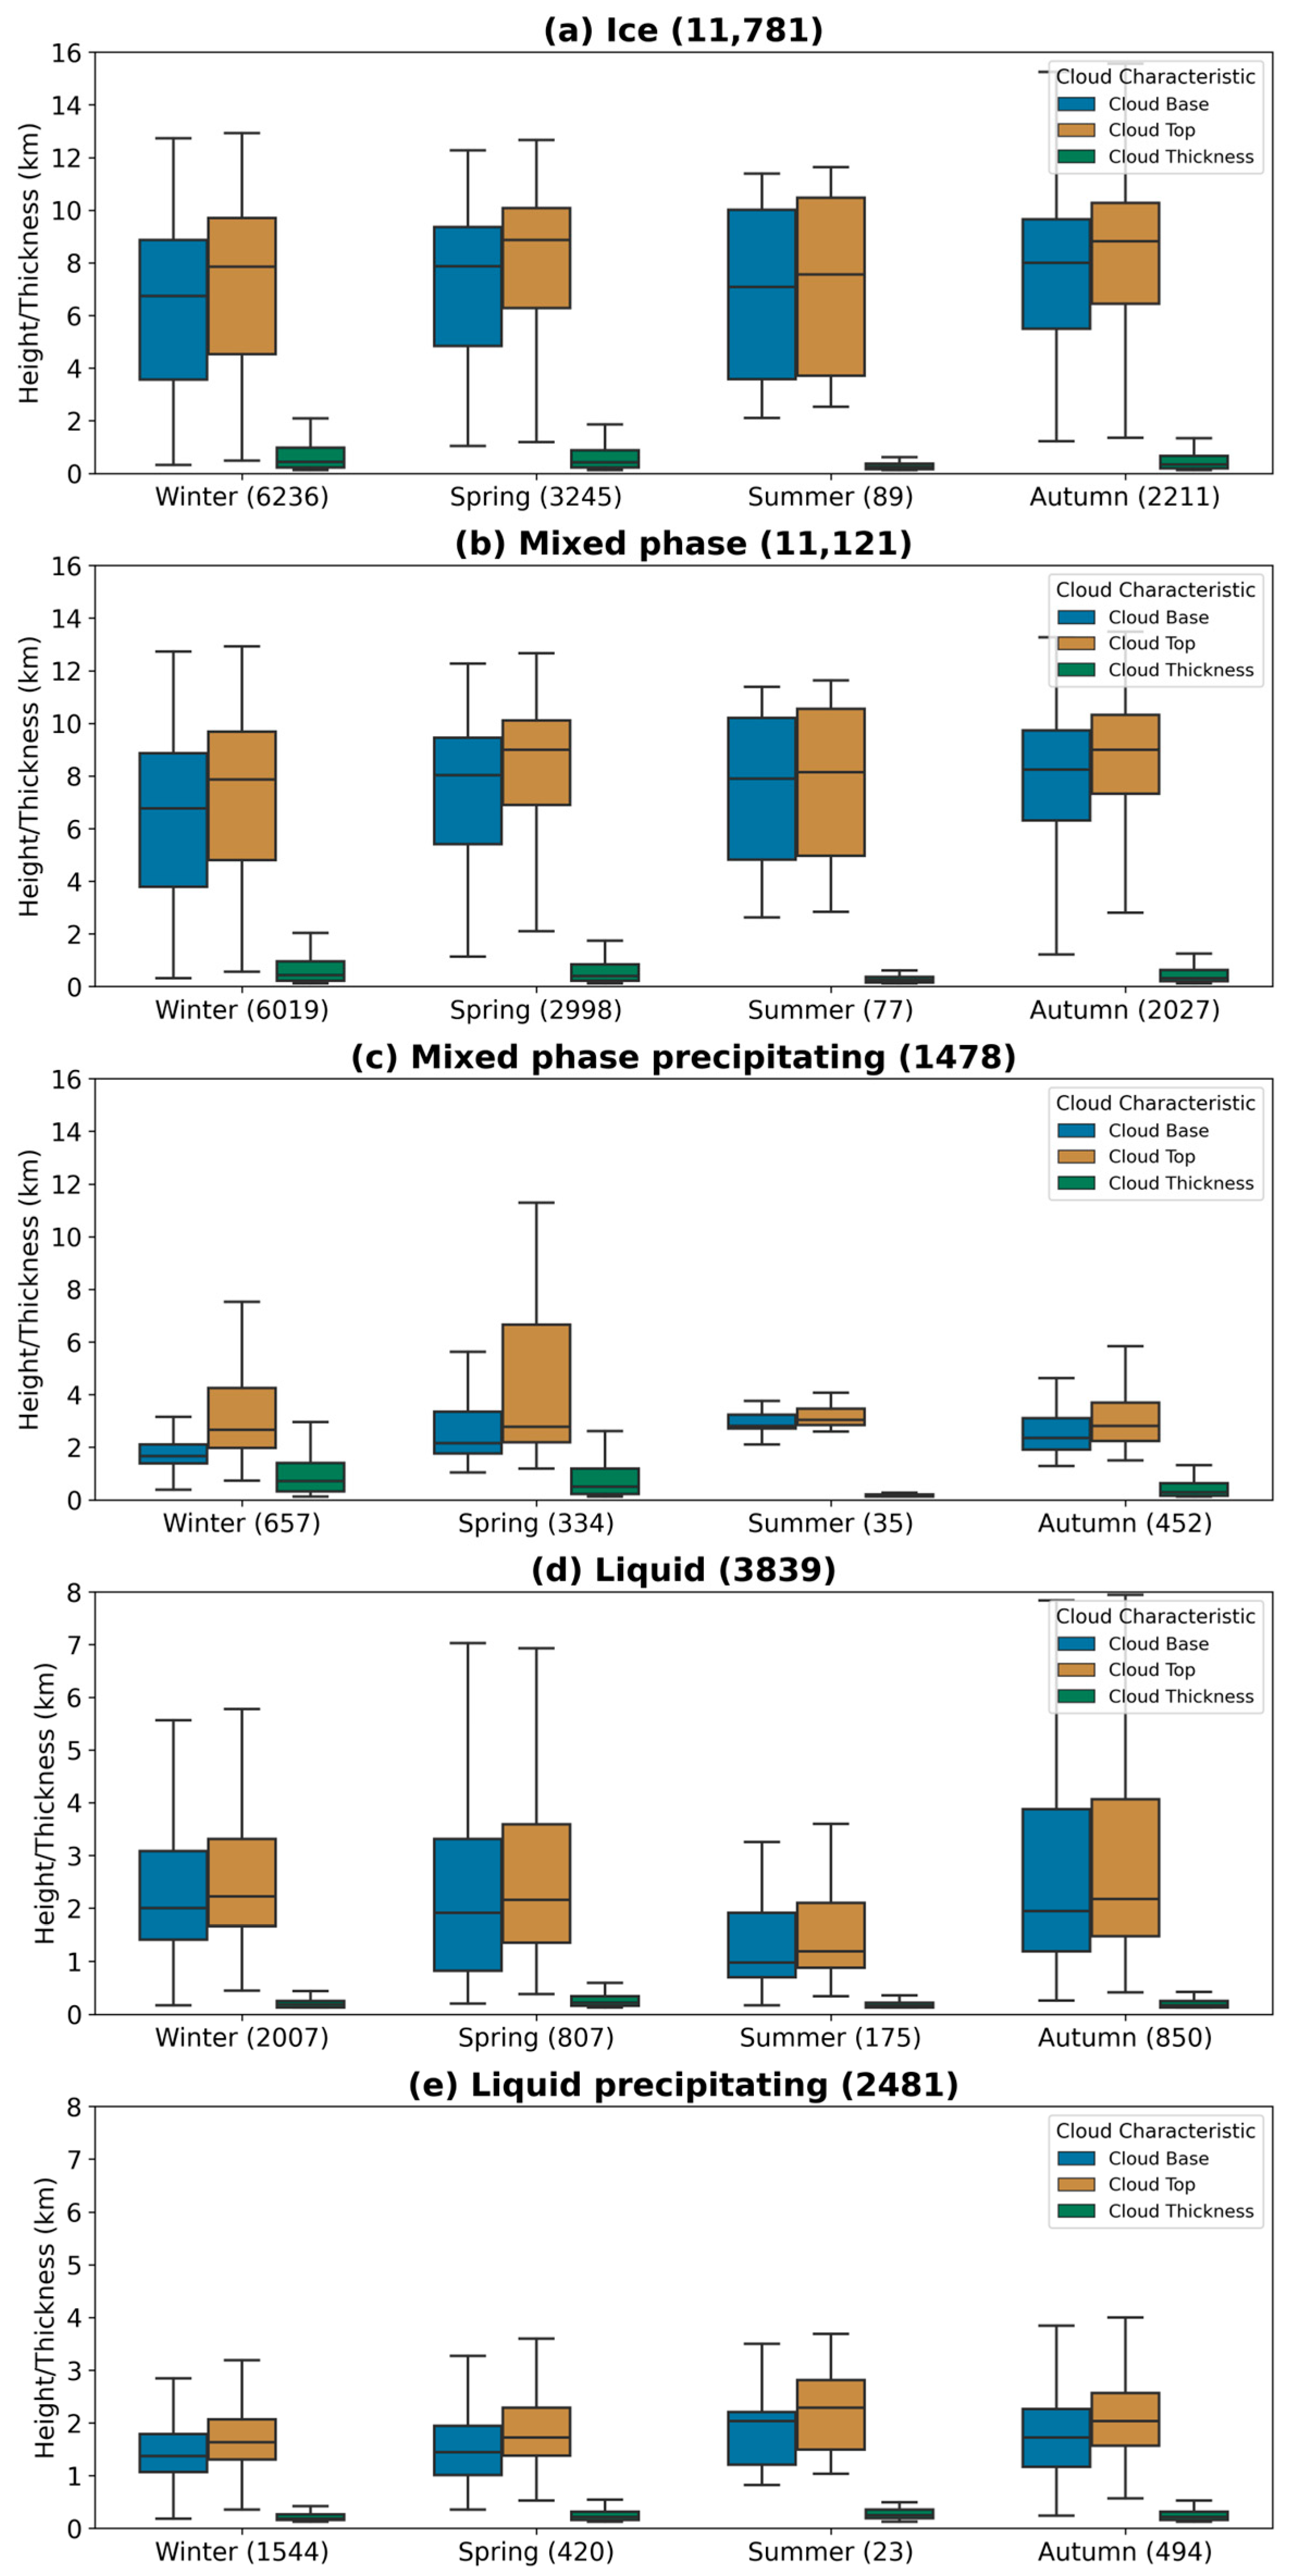

Disclaimer/Publisher’s Note: The statements, opinions and data contained in all publications are solely those of the individual author(s) and contributor(s) and not of MDPI and/or the editor(s). MDPI and/or the editor(s) disclaim responsibility for any injury to people or property resulting from any ideas, methods, instructions or products referred to in the content. |
© 2026 by the authors. Licensee MDPI, Basel, Switzerland. This article is an open access article distributed under the terms and conditions of the Creative Commons Attribution (CC BY) license.